
Abstract
The effect of two thermal barrier coatings and their surface roughness on heat transfer, combustion, and emissions has been investigated in a single-cylinder light-duty diesel engine. The evaluated thermal barrier coating materials were plasma-sprayed yttria-stabilized zirconia and hard anodized aluminum, which were applied on the piston top surface. The main tool for the investigation was cylinder pressure analysis of the high-pressure cycle, from which the apparent rate of heat release, indicated efficiency, and heat losses were derived. For verification of the calculated wall heat transfer, the heat flow to the piston cooling oil was measured as well. Application of thermal barrier coatings can influence engine operating conditions like charge temperature and ignition delay. Therefore, extra attention was paid to choosing stable and repeatable engine operating points. The experimental data were modeled using multiple linear regression to isolate the effects of the coatings and of the surface roughness. The results from this study show that high surface roughness leads to increased wall heat losses and a delayed combustion. However, these effects are less pronounced at lower engine loads and in the presence of soot deposits. Both thermal barrier coatings show a reduction of cycle-averaged wall heat losses, but no improvement in indicated efficiency. The surface roughness and thermal barrier coatings had a significant impact on the hydrocarbon emissions, especially for low-load engine operation, while their effect on the other exhaust emissions was relatively small.
Introduction
The continuous need for reduction of fuel consumption and CO2 emissions from road transportation has lead to a renewed interest in thermal insulation of the combustion chamber in the internal combustion engine. The heat loss to the combustion chamber walls is one of the major energy losses in an engine. One way to reduce this heat loss is the application of a thermal barrier coating (TBC).
In theory, thermal insulation of the combustion chamber has a range of benefits: increased indicated efficiency, lower heat load on critical engine components, and a smaller and cheaper cooling system. Effective insulation would also increase the exhaust gas temperature, which is useful in two ways: (1) the increase in enthalpy can reduce pumping losses when using a modern turbocharging system or it can be used in a waste heat recovery system. (2) The higher exhaust temperature improves the conversion efficiency in a catalytic exhaust gas aftertreatment system, especially for light engine loads (city driving) and cold ambient conditions.
Thermal insulation of the combustion chamber with TBCs has been investigated since the early 1980s by many researchers, with experiments as well as thermodynamic process simulations. Most of the experiments show an increase in exhaust temperature and a reduction in heat losses to the coolant, as expected and predicted by simulations. However, the experimental results for the engine efficiency show a large variation, and there is no general agreement on the benefit of TBCs for indicated efficiency.1–3 Moreover, it seems that, on average, the effect of insulation with TBCs on indicated efficiency is limited.
The variation in the reported benefits from TBCs is partly related to the large range of tested engine hardware, the variation in engine operating conditions, and the engine technology level used in the experiments. Another cause for the varying results from experiments is the increased wall temperature that follows with insulation. This temperature increase results in a higher charge temperature and lower charge density. For compression ignition (CI) engines, this can lead to a lower air–fuel ratio and differences in ignition delay, fuel–air mixing, emission formation, and oxidation. Especially, combustion phasing and the rate of heat release have a significant effect on the indicated efficiency. How these secondary effects change the efficiency is engine-specific and depending on engine load. Kobori et al. 4 published a detailed overview of these secondary effects for an insulated CI engine.
The limited effect of TBCs on indicated efficiency has been addressed by several researchers. One of the proposed explanations is that high surface roughness, which is typical for plasma-sprayed and anodized TBCs, increases heat transfer and slows down combustion. These negative effects from high surface roughness have been reported in publications on spark ignition5,6 as well as CI engines.7,8 To mitigate the negative impact of surface roughness in a CI engine, Kawaguchi et al. 9 limited the application of their new TBC to the piston top surface, excluding the bowl. The typical reported difference in engine efficiency is about 1%–3% between a smooth and rough surface finish. However, in some cases, no effect was shown, or efficiency deteriorated as much as 6%.
The published experimental results, particularly for CI engines, do not show a clear consensus with respect to the effectiveness of TBCs and the negative impact of surface roughness on indicated efficiency.
In this article, a robust and comprehensive method is presented for experimental investigation of TBCs and surface roughness in CI engines. The boundary conditions were accurately controlled, and the method is insensitive for secondary effects of the intake air heating. A complete set of result data is included, comprising energy balance, combustion analysis and emissions for low-, medium-, and high-load engine operating conditions. Variations in emissions can give insight in changes in the combustion process. The method is applied on two representative TBCs with a typically high surface roughness. The location of the coatings and the level of surface roughness are varied to isolate and quantify the effect of surface roughness and the coatings on engine performance.
This article is organized as follows: In the “Method” section, the measurement robustness improvements are presented as well as the equations for the apparent heat release rate and energy balance. A description of the used statistical method ends the “Method” section. The section about the experimental setup describes the test engine and measurement equipment as well as the properties of the tested pistons and the definition of the test sequence. The results of the engine experiments are then presented in three main parts: first, the apparent rate of heat release (aRoHR) is compared and analyzed for the different pistons; in the second part, the energy balance and emissions for fired operation are shown, and finally, the energy balance and impact of soot deposits for motored engine operation are discussed. Before ending with the conclusion, a table is presented that summarizes the effects of the coatings and surface roughness on the indicated efficiency, heat losses, and engine emissions.
Method
Measurement robustness
A number of measures were taken to make the measurements as accurate as possible and to reduce the secondary effects of the application of the TBCs, such as reduced volumetric efficiency and changes of ignition delay. The temperature levels for coolant, engine oil, fuel supply, and intake air were controlled within ±0.1 °C. Intake pressure and exhaust back-pressure were controlled within ±1 kPa. The target setting for the injected fuel quantity was fixed for each engine operating point (EOP). In this way, changes in energy distribution could be investigated, without changing the conditions for combustion such as the air–fuel ratio. Furthermore, the following measures were applied:
A single pilot injection of 2 mg/stroke was used to stabilize the ignition timing of the main combustion.
Each test run was started with clean combustion chamber surfaces; cleaned or first-run engine parts.
An automated test sequence was applied to target identical time and temperature histories for the different pistons.
Motored EOPs were included for thermodynamic assessment of the actual compression ratio and to verify proper functioning of the indicating equipment through the test run.
The intake air mass flow was kept constant by adjusting the intake air temperature.
By controlling the intake temperature to target a constant air mass flow, the in-cylinder conditions at intake valve closing should have been similar for all tested pistons. The impact of TBCs on intake charge heating could still be assessed by the volumetric efficiency, which is related to the temperature in the intake manifold.
Calculation of heat release and energy balance
The analysis of the combustion process and the energy balance in this article is largely based on data from cylinder pressure measurements. This measurement is relatively simple and gives information of time-resolved processes and complete cycle energy flows. The measurement of heat loss to the piston cooling oil was added to complement the thermodynamic calculation of the heat losses with the purpose to validate the calculated heat loss and to see possible variations in heat loss distribution between the whole combustion chamber and the piston only.
To study the combustion and cycle-resolved heat losses, the apparent rate of heat release
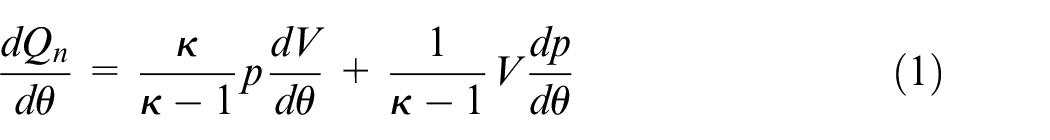
The model from Hohenberg and Killmann
11
was used to calculate
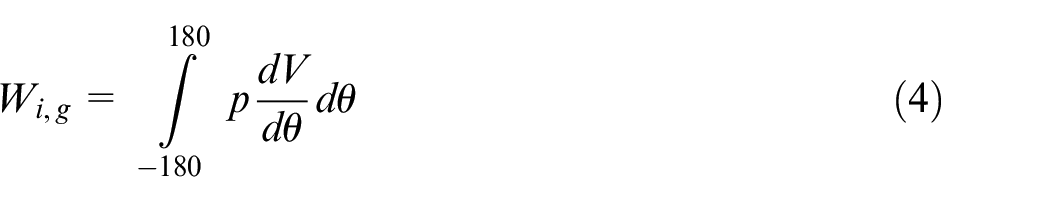
For the calculation of the energy balance, only the high-pressure cycle was considered. According to the fist law of thermodynamics, the amount of work

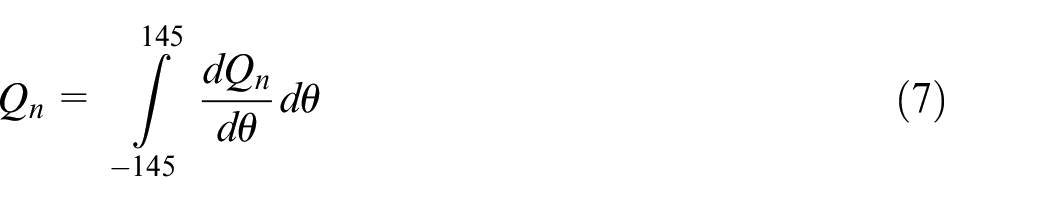
The indicated work for the high-pressure cycle was calculated with equation (4). The wall heat losses were derived from the difference between the fuel heat and the total apparent heat released


The terms in equation (2) for indicated work, heat transfer, and exhaust enthalpy loss were scaled with the input fuel energy

For the motored energy balance, the terms in equation (2) were scaled with the engine swept volume and expressed in terms of mean effective pressure, resulting in equation (9). These terms for indicated work, wall heat transfer, and exhaust loss add-up to zero as there was no input of fuel energy for the motored case

To complement the calculated heat loss from the thermodynamic assessment, the heat flow to the piston cooling oil was calculated from the temperature increase in the oil in the cooling gallery and the piston cooling oil flow, according to equation (10)

Also, this energy loss was scaled and defined as ratQOil for fired operation and QOilMEP for motored operation. More details for the actual measurement are found in section “Experimental setup.”
Statistical analysis—data modeling with multiple linear regression
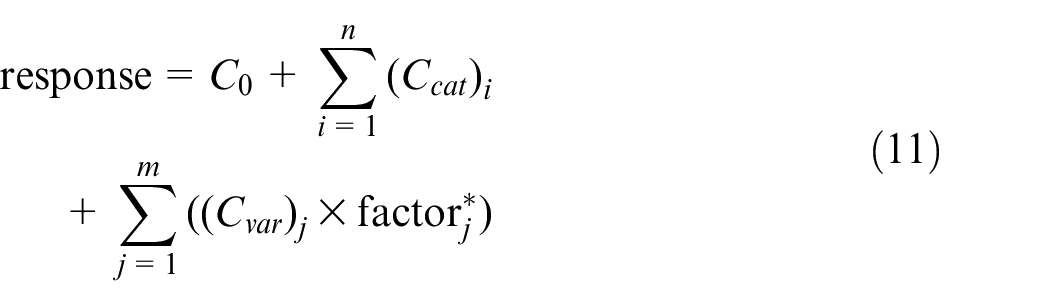
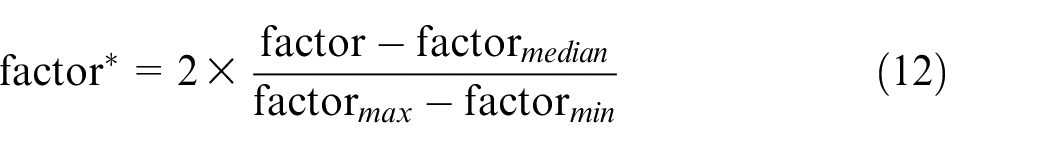
Multiple linear regression (MLR) is a statistical method that fits a linear equation to a result (response) from multiple inputs (factors). The input factors can be continuous or categorical with multiple levels. Equation (11) shows the general model equation. The factors are scaled by their range and centered by their median as in equation (12), to be able to compare the relative contribution of each factor. It is possible to combine factors to capture interactions, but this was not needed in this investigation
A number of benefits come from modeling the measured data:
Combining data from multiple measurements in each EOP makes the estimation of the results more precise.
Fitting a model to the data creates correlation coefficients for the different input factors. With these coefficients, the contribution of each input factor can be studied separately.
With the model, it is possible to make predictions and study new combinations of the input factors.
The model provides 95% confidence intervals for the calculated results and for the model coefficients.
In this study, MLR models were created for the measurement results from the fired and motored energy balance, the combustion delay, and the exhaust emissions. The input factors for the models were piston surface coating, surface roughness, compression ratio, and factors that represent the experimental conditions. More details about the models and the interpretation of the model coefficients are found in the “Experimental results” section and in Appendix 3. The software used for the statistical analysis was MODDE 11 from Umetrics.
Experimental setup
This section describes the test facility and details about the tested pistons with respect to coatings and surface roughness. The chosen EOPs and the test sequence are explained at the end.
Experimental test facility
The engine used in this experimental investigation was a single-cylinder light-duty diesel engine. The specifications of the engine and the combustion system are listed in Table 1. The cylinderhead and fuel injection system were taken from a four-cylinder Volvo production engine and modified for single-cylinder operation.
Engine and fuel specifications.
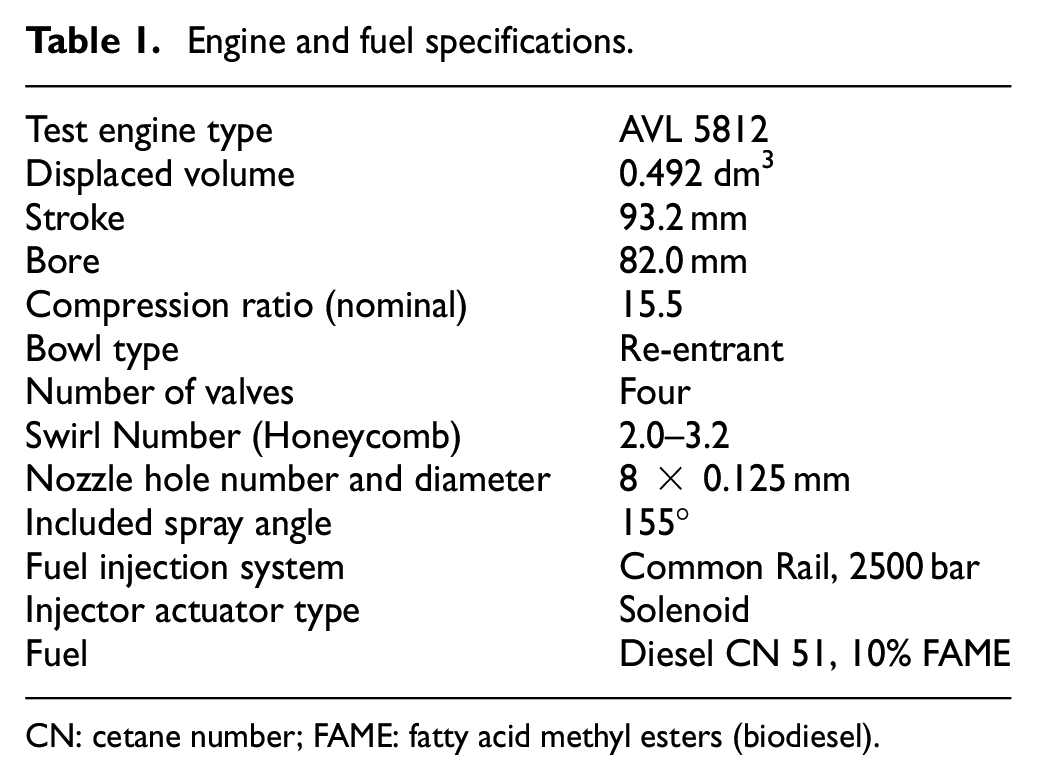
CN: cetane number; FAME: fatty acid methyl esters (biodiesel).
The measurement system consisted of a high-speed and low-speed data acquisition system. The high-speed measurements included crank angle resolved measurements of cylinder pressure, fuel injection pressure, and injector current. ‘The crank angle resolution was 0.1 °CA during fuel injection and combustion (−90 to 120 °CA BTDC) and 1.0 °CA outside of this window. A selection of calculation results from the real-time cylinder pressure analysis was sampled and stored by the low-speed measurement system as well. The high-speed and low-speed data acquisition started at the same trigger. The high-speed data were recorded for 100 engine cycles. The low-speed data were sampled for 2 min with a frequency of 10 Hz.
The heat transfer to the piston cooling oil was calculated from the temperature increase in the oil in the cooling gallery and the oil flow, according to equation (10). To improve the accuracy of the piston exit oil temperature measurement, a short pipe was added to the cooling oil gallery exit of the piston, directing the oil flow to the temperature sensor. The sensor itself was mounted in a funnel that collected the oil below the piston cooling oil exit (adopted from Dahlström et al. 13 ).
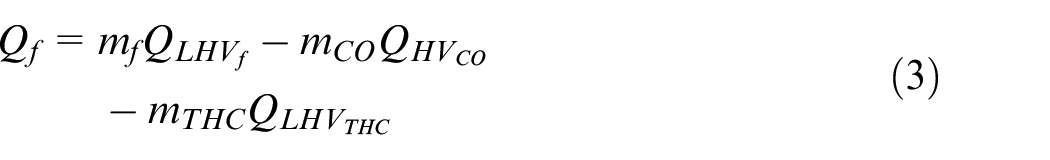
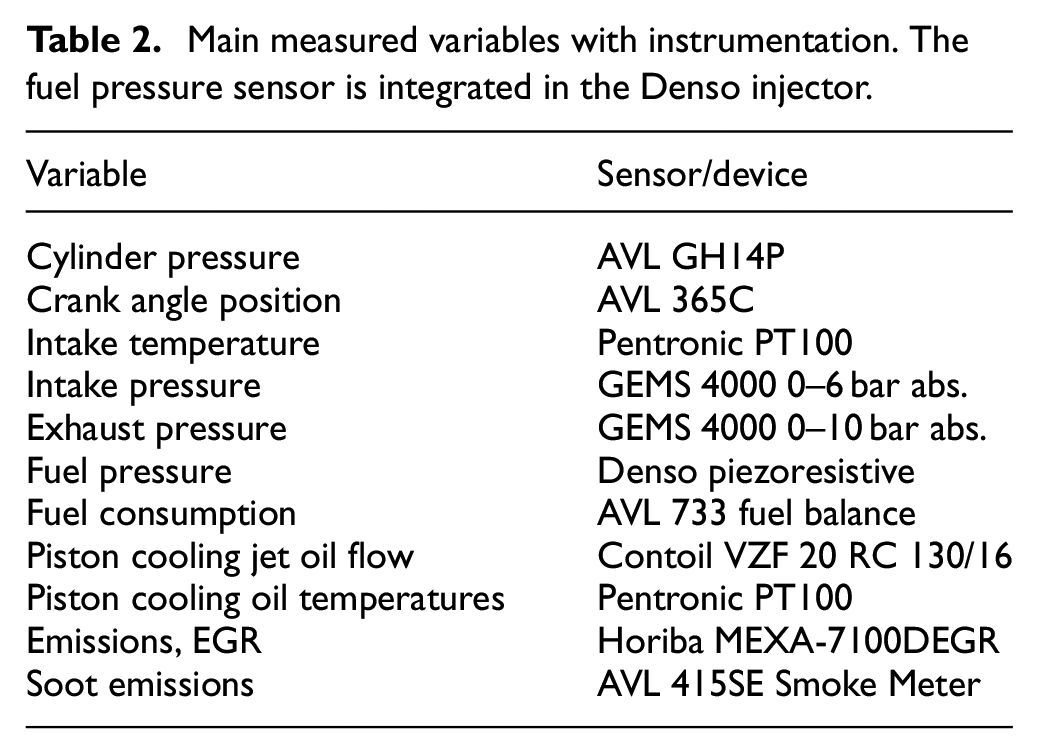
Together with the above, the exhaust emissions of NOx, Soot, CO, and total hydrocarbons (THCs), as well as concentrations of O2 and CO2, were measured. The level of CO2 of the intake charge was measured as well to calculate and control the exhaust gas recirculation (EGR) level. Table 2 shows the most important measured variables and the specification of the sensors used.
Main measured variables with instrumentation. The fuel pressure sensor is integrated in the Denso injector.
Test object details
The two TBC materials selected for this investigation were alumina and zirconia. The alumina TBC was grown from the piston surface by an electrochemical anodizing process, with a target thickness of 200 µm. As the volume of the oxide is twice that of the aluminum, 0.10 mm was machined off the surface where the coating was formed. Typical values for thermal conductivity and heat capacity for this type of coating are 0.7–1.3 W/m K and 860–890 J/kg K. 14
The zirconia TBC with the same target thickness of 200 µm was applied by plasma-spraying after sandblasting the surface and application of a 150-µm-thick metallic bond coat. The bond coat and top coat materials were acquired from Oerlikon, with the specifications Amdry 365-2 and Metco 204b-ns, respectively. Typical values for thermal conductivity and heat capacity for this coating are 0.8–1.3 W/m K and 440–460 J/kg K, respectively. To stay close to the reference piston surface profile, 0.35 mm was machined off where the coating was applied. A typical variation of the coating thickness of ±40 µm was found for both TBCs using scanning electron microscope (SEM) analysis of the cross section of cut pistons.
The six pistons with TBCs were coated on different locations of the piston top surface (Table 3). The pistons labeled “ZrORgh” and “ZrOPol” were spray coated from above, leaving the vertical bowl wall and the ring top land uncoated. However, the vertical bowl wall was sandblasted and had a rough surface. The piston labeled “ZrOTop” was coated only on the squish surface. The pistons with label “AlORgh” and “AlOPol” were coated on the whole piston top surface, including the ring top land. The piston labeled with “AlOTop” was coated on the squish surface and ring top land only.
Specifications for surface treatments of the pistons. The roughness
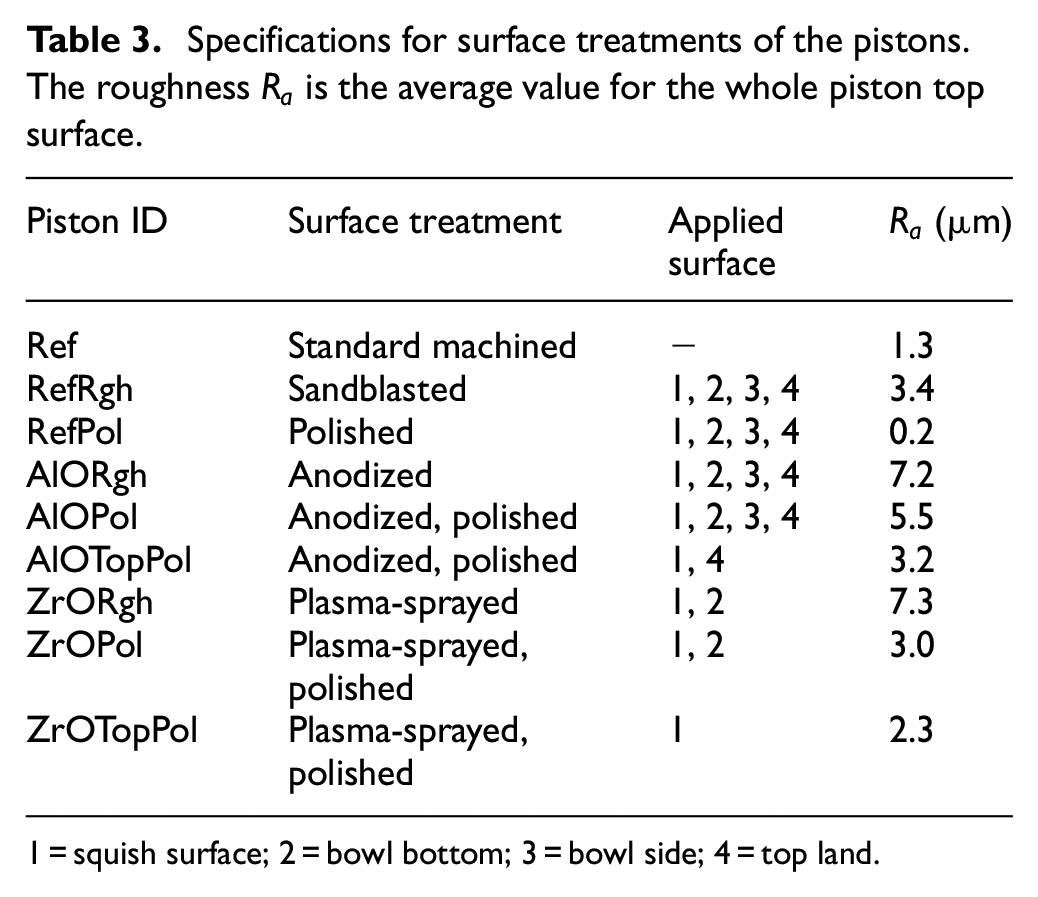
1 = squish surface; 2 = bowl bottom; 3 = bowl side; 4 = top land.
The purpose of the differentiation of the pistons with the top coating was to evaluate the findings of Kawaguchi et al. 9 that the TBC applied in the bowl had an adverse effect on the combustion process, whereas the coating on the top reduced heat losses and improved indicated efficiency. The difference in the coated surface area between the alumina and zirconia coated pistons was related to the limitations in the used plasma-spraying process.
The surface roughness
To investigate the effect of the level of surface roughness, the TBCs on the top-coated pistons and two pistons with coating in the bowl and on the top were polished with fine-grained sandpaper. As can be seen in Figure 1, polishing of the coatings removed the peaks from the surface. However, both TBCs have a porous structure, hence there will remain small holes and cavities in the surface. To be able to assess the effect of surface roughness separately from the TBCs, a mirror polished and a sandblasted uncoated piston were included in the test as well. With the unpolished coated pistons, a total of nine different pistons were tested, as listed in Table 3.
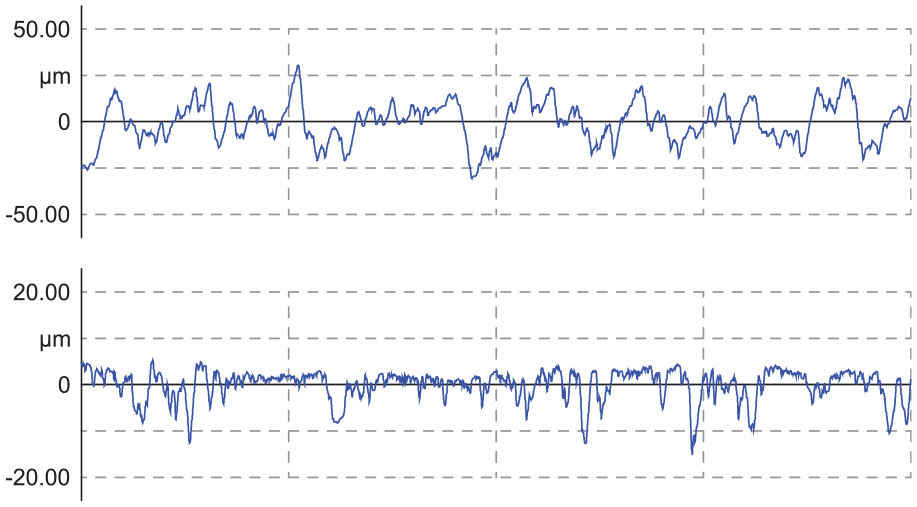
Surface profiles for the rough (top) and the polished (bottom) zirconia surfaces. Measurement length = 4 mm. Note the different scales for the y-axis.
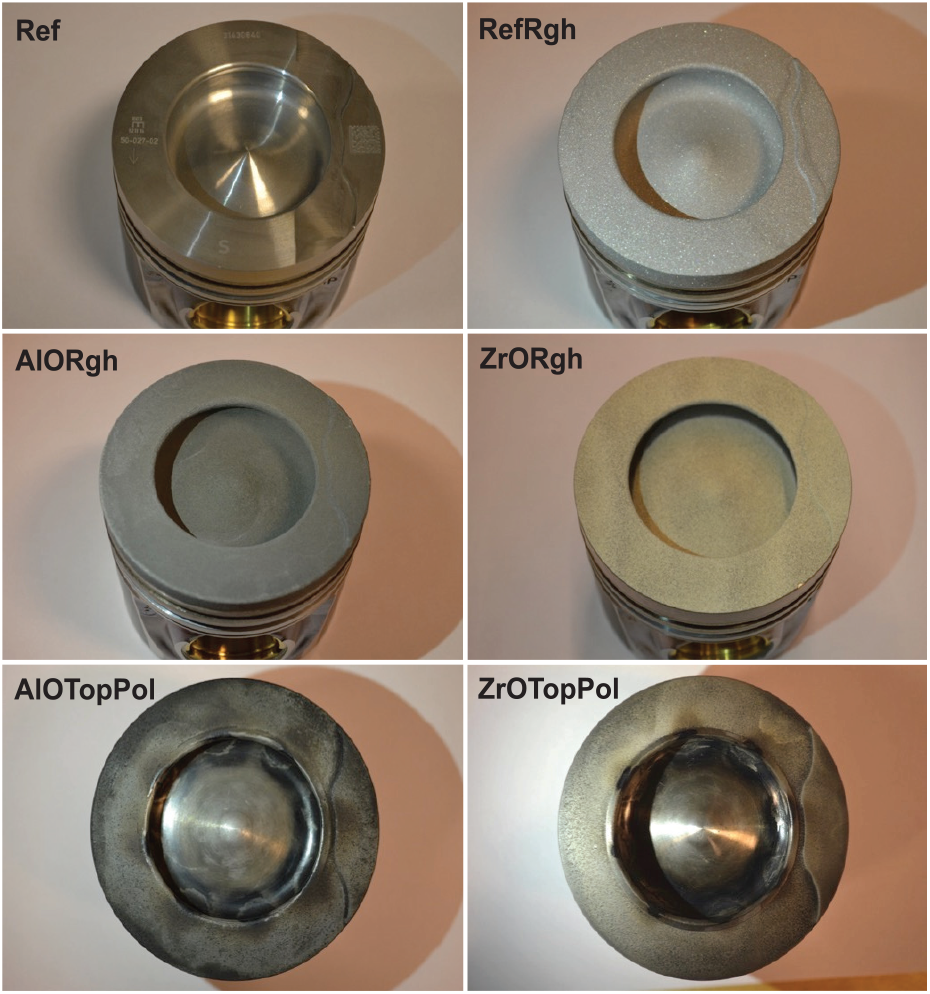
Table 4 lists the piston properties and the order in which the pistons were tested. Figure 2 shows pictures of six of the nine pistons to give an impression of their main features: surface roughness, coating type, and coating location.
Compression ratio and test run order for the different engine builds.
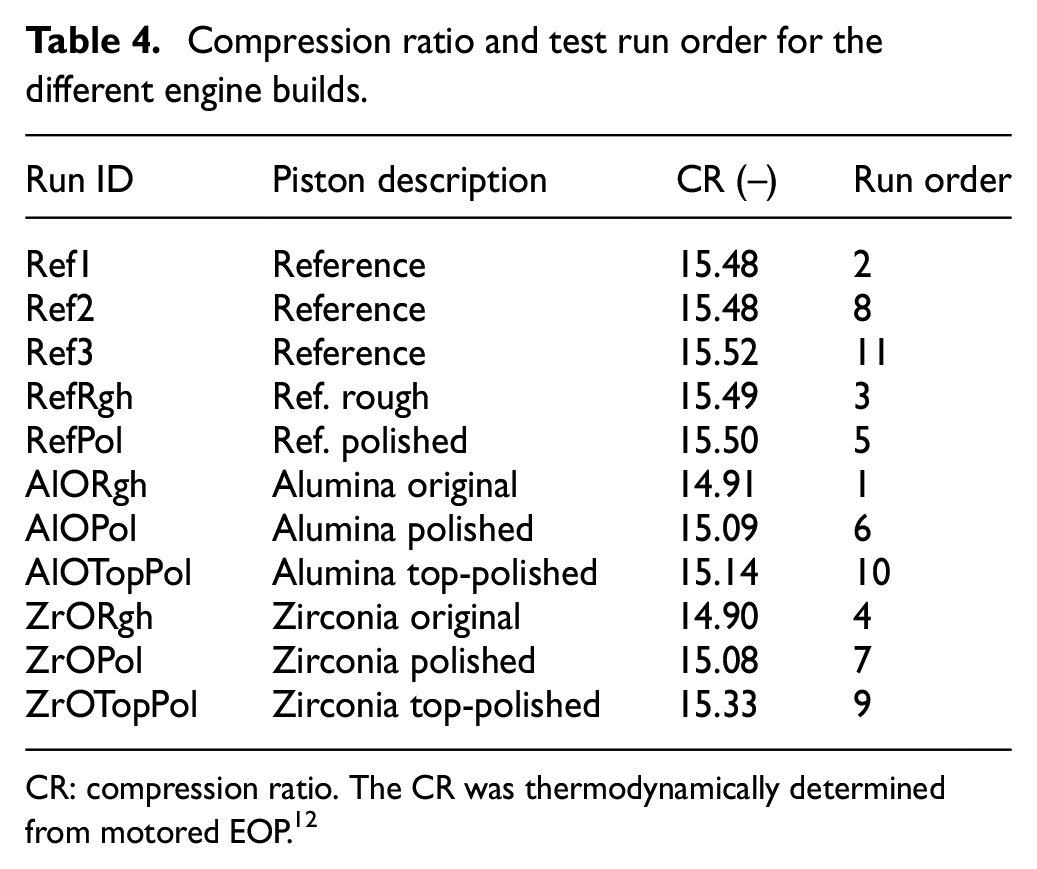
CR: compression ratio. The CR was thermodynamically determined from motored EOP. 12
Engine Operating Points and test run setup
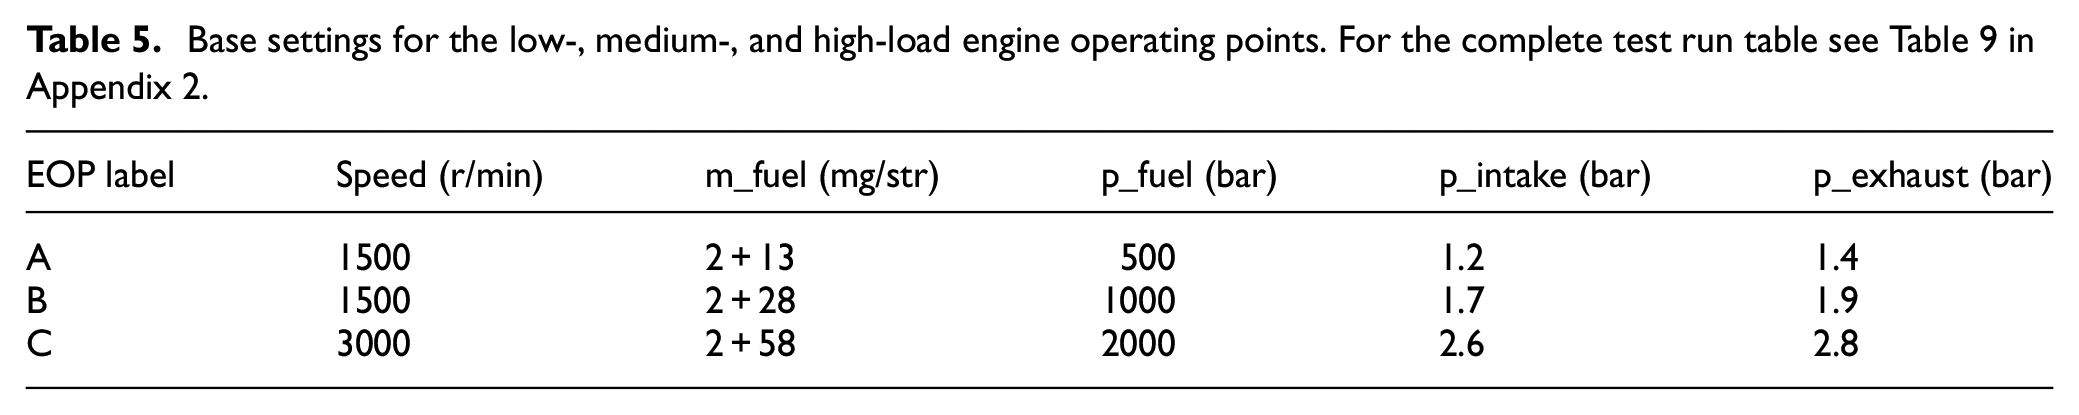
Three EOPs were chosen to represent low-, medium-, and high-load conditions. Table 5 lists the engine speed, fuel mass, fuel pressure, and injection pressure as well as intake and exhaust pressure. All load points were run with one pilot fuel injection of 2 mg.
Base settings for the low-, medium-, and high-load engine operating points. For the complete test run table see Table 9 in Appendix 2.
In each of the three engine load points, a few parameter variations were included. The parameters were swirl level, fuel injection pressure, and EGR level because they have an effect on heat losses. However, in this investigation, the variation of swirl was excluded from the evaluation. A second purpose of using EGR was to create an increasing amount of soot deposits on the combustion chamber walls during a test run. These soot deposits have an insulating effect and this will be compared with the insulating effect of the TBCs.
Each hardware setup was measured in 26 consecutive EOPs. The test run started with motoring conditions for EOP A, B and C. Thereafter the high-load point C was run with a variation of fuel pressure, followed by motoring. The medium-load point B was run with a variation of EGR and swirl, again followed by motoring. Finally, the low-load point was run, also with a variation of EGR and swirl and concluded with motoring. The purpose of the motored operating points was to calculate the compression ratio and to evaluate the motored heat losses with TBCs and different soot deposit levels. The test run was automated with fixed times for the stabilizing of boundary conditions and the recording of measurements. A detailed description of the complete test run setup can be found in Table 9 in Appendix 2.
Experimental results
In this section, results from the measurements and data modeling are presented. The complete data models, represented by their coefficients in bar graphs, can be found in Appendix 3. All modeled results for the energy balance, combustion phasing, and emissions are found in Appendix 4.
Indicated efficiency and piston heat loss
In Figure 3, the heat loss to the piston cooling oil is plotted. All 26 measurement points of the test runs are included here. The data points with the low heat loss are the motored points before, between and after the fired EOP. A rise in fuel pressure increases heat losses (EOP C) and increasing EGR reduces the heat losses in EOP B and C, as expected. The highest heat loss occurs for the uncoated rough piston, and the lowest heat loss is seen for the coated pistons. The polished piston variants have lower heat losses than the rough variants, except for piston AlORgh. The low heat loss for this piston was probably caused by slower combustion.
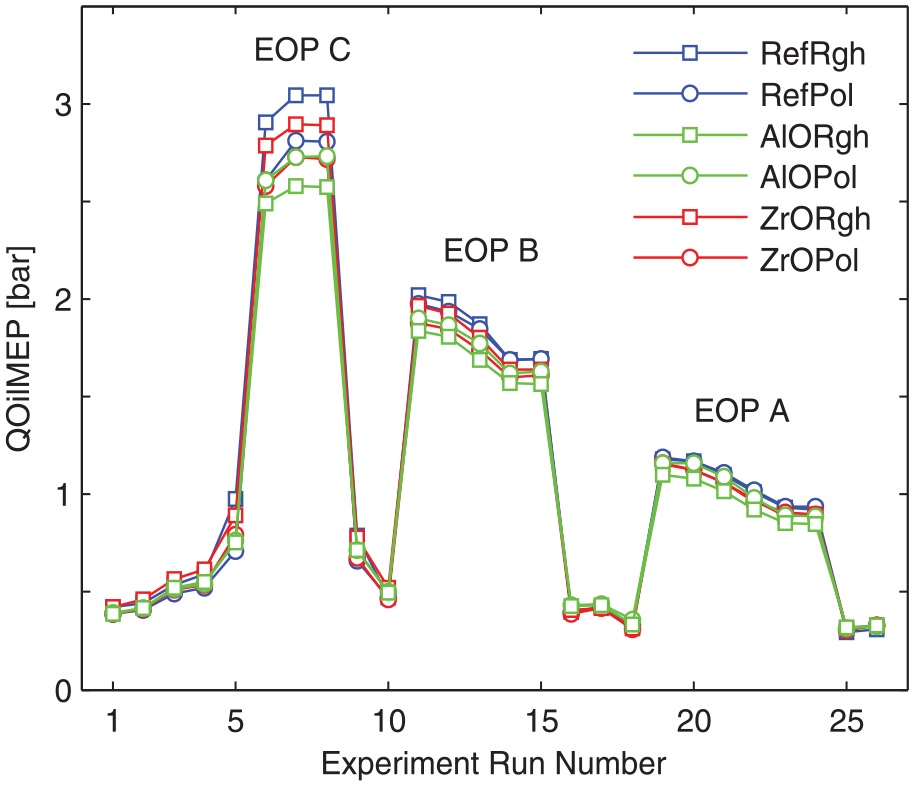
Heat energy to piston cooling oil versus RunNr, according to Table 9 in Appendix 2. The low values for the heat loss to the piston cooling oil are from the motored EOP.
In Figure 4, the measured indicated efficiency is presented for a selection of the fired run numbers in the test sequence: run numbers with swirl variation and fuel cut-off were excluded. The variation of efficiency level is caused by an increase in fuel pressure for EOP C and an increasing EGR rate for EOP B and EOP A. It can be clearly seen that the polished pistons show a higher efficiency than the rough pistons, which is in line with the lower heat losses seen in Figure 3. But the coated pistons exhibit a lower efficiency than the uncoated pistons despite the lower heat losses to the piston cooling oil.
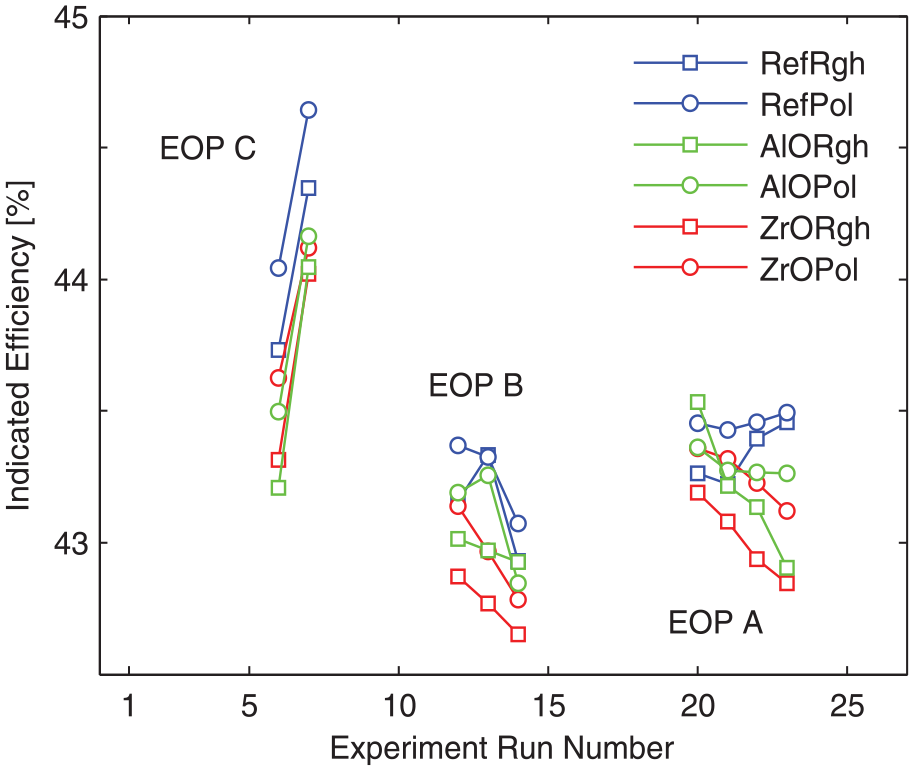
Gross indicated efficiency versus RunNr, according to Table 9 in Appendix 2. EOP C is measured with different fuel pressures, EOP B and A show an increasing EGR level.
The first step for further analysis of this discrepancy and of the effect of surface roughness is to compare the aRoHR for the different pistons and coatings.
Heat release rate and combustion phasing
The aRoHR, calculated from the cylinder pressure, shows any addition or removal of energy to the cylinder charge which is not related to the piston work. It reveals the heat released by combustion and the heat loss to the walls as well as enthalpy loss from blow-by or loss of heat for fuel evaporation. Heat release from combustion and heat losses occur at the same time during combustion, and it is not possible to distinguish between them. This has to be kept in mind when using the aRoHR for investigating the effect of TBC and surface roughness on combustion and heat losses.
In Figure 5, the aRoHR is plotted for the pistons with high surface roughness and the reference piston, for all three load cases. The numbers 1–3 in the figure indicate the following: first wall–jet interaction, end of injection (EOI), and pilot–main interaction, respectively. For the high-load case EOP C, there is an obvious reduction of the peak aRoHR for the rough and coated pistons. Mostly after start of wall–jet interaction, until a few CA degrees after EOI. After 20 °CA, the aRoHR is higher for the rough pistons compared to the reference piston, which indicates late burning or reduced heat losses early in the expansion stroke.
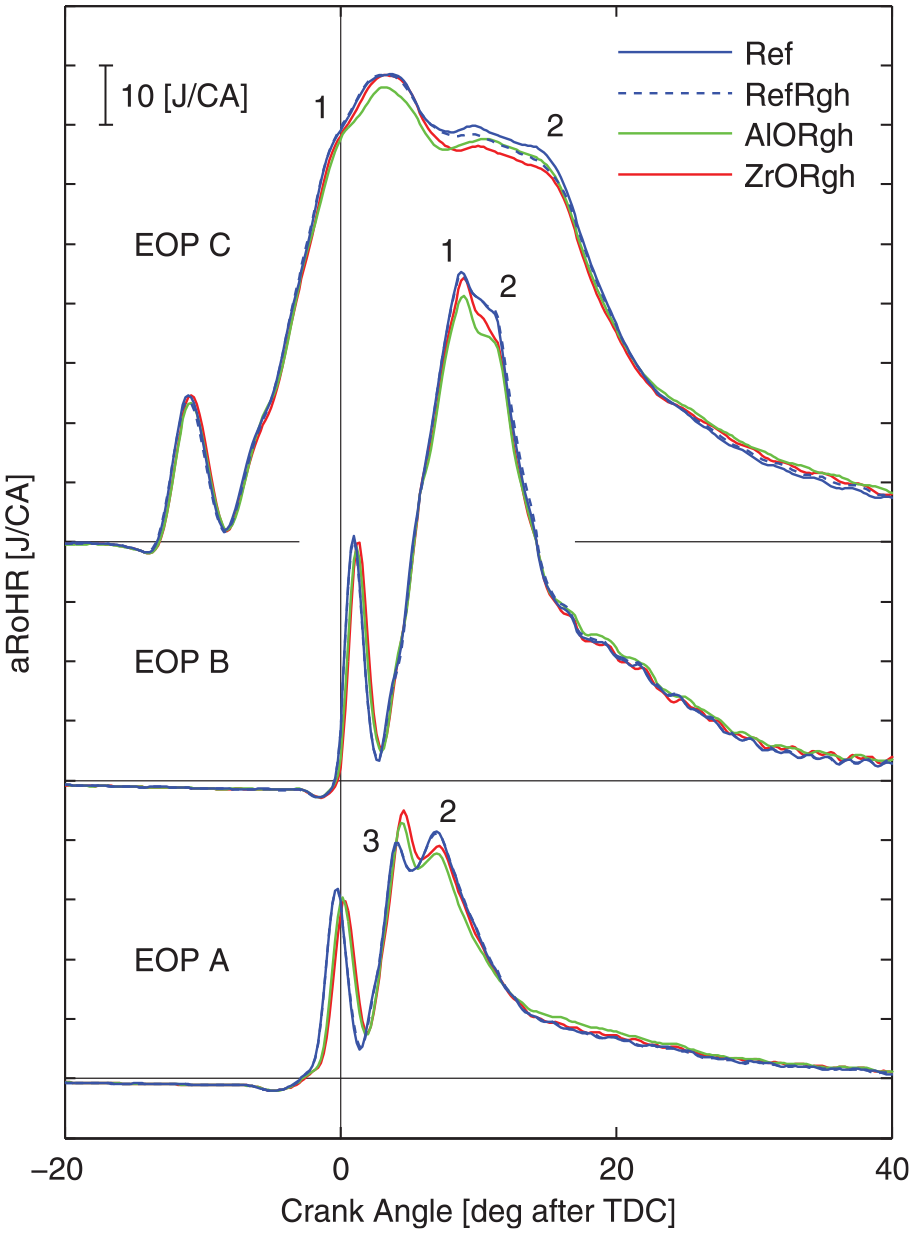
Apparent rate of heat release for the rough pistons for run numbers 7, 12, and 20 in Table 9 in Appendix 2 (1 = start spray–wall interaction; 2 = end of fuel injection; 3 = pilot–main interaction).
The same effect as for EOP C can be seen for the medium-load EOP B for the rough coated pistons during the wall–jet interaction. The aRoHR from the rough uncoated piston remains close to the reference piston in this EOP. In the low-load operation point A, the injection ends before wall–jet interaction occurs. For the low-load case, there seems to be an interaction between the main and the pilot combustion. The heat release from the main fuel injection is shifted earlier when the pilot ignites later. The ignition delay of the pilot fuel seems to be correlated with the compression ratio. It is not obvious if there is an effect from the surface roughness on the aRoHR. However, the aRoHR in the tail of the combustion for the rough AlO piston is slightly raised compared to the other pistons.
For the polished pistons and the reference piston, the curves for the aRoHR are shown in Figure 6. The polished uncoated piston now has the highest aRoHR during wall–jet interaction for EOP C. The polished coated pistons still have an aRoHR lower than the reference piston, but the difference is significantly smaller. Even here, there is a late combustion or reduced heat loss in the tail of the combustion. In EOP B, the difference between the standard and polished piston cannot be distinguished. The coated pistons still show a somewhat lower aRoHR relative to the reference piston. The interaction between pilot and main injection in EOP A is also smaller for the polished pistons, probably because they have a compression ratio (CR) closer to the reference piston and a more similar ignition delay.
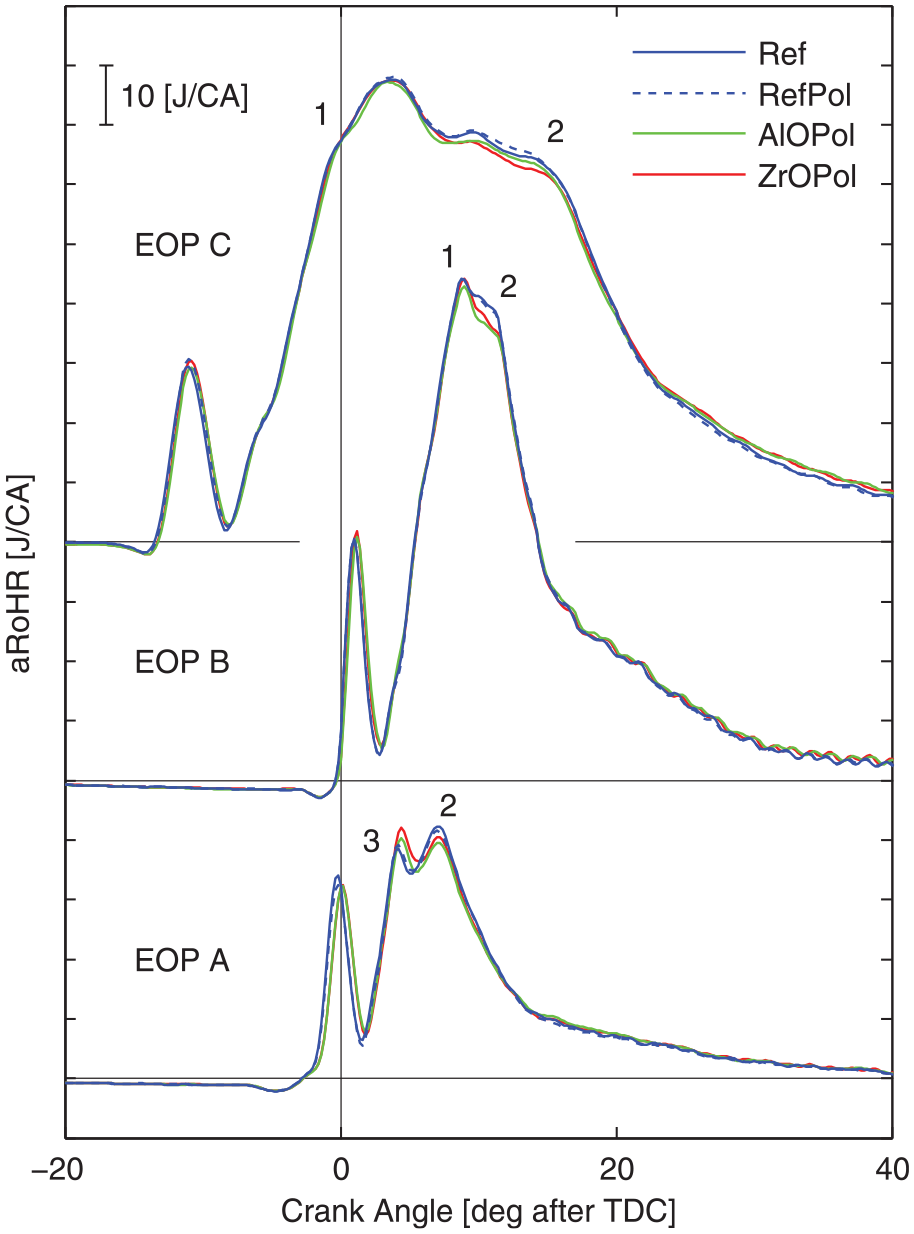
Apparent rate of heat release for the polished pistons for run numbers 7, 12, and 20 in Table 9 in Appendix 2 (1 = start spray–wall interaction; 2 = end of fuel injection; 3 = pilot–main interaction).
When comparing the top-coated polished pistons with the reference piston in Figure 7, an increase in the aRoHR just before EOI becomes evident for EOP C. The piston has traveled downward to a position where the combusting jet targets the top of the piston. An increase in the aRoHR at this point indicates a reduction of heat losses caused by the presence of a coating on the piston top. This effect is not seen for EOP B, probably because the fuel injection ends too early. A small reduction in aRoHR can be noticed here for the top-coated pistons. For the lowest load point, EOP A, the aRoHR curves have become more similar again as the compression ratios for the top-coated pistons are closer to the reference piston.
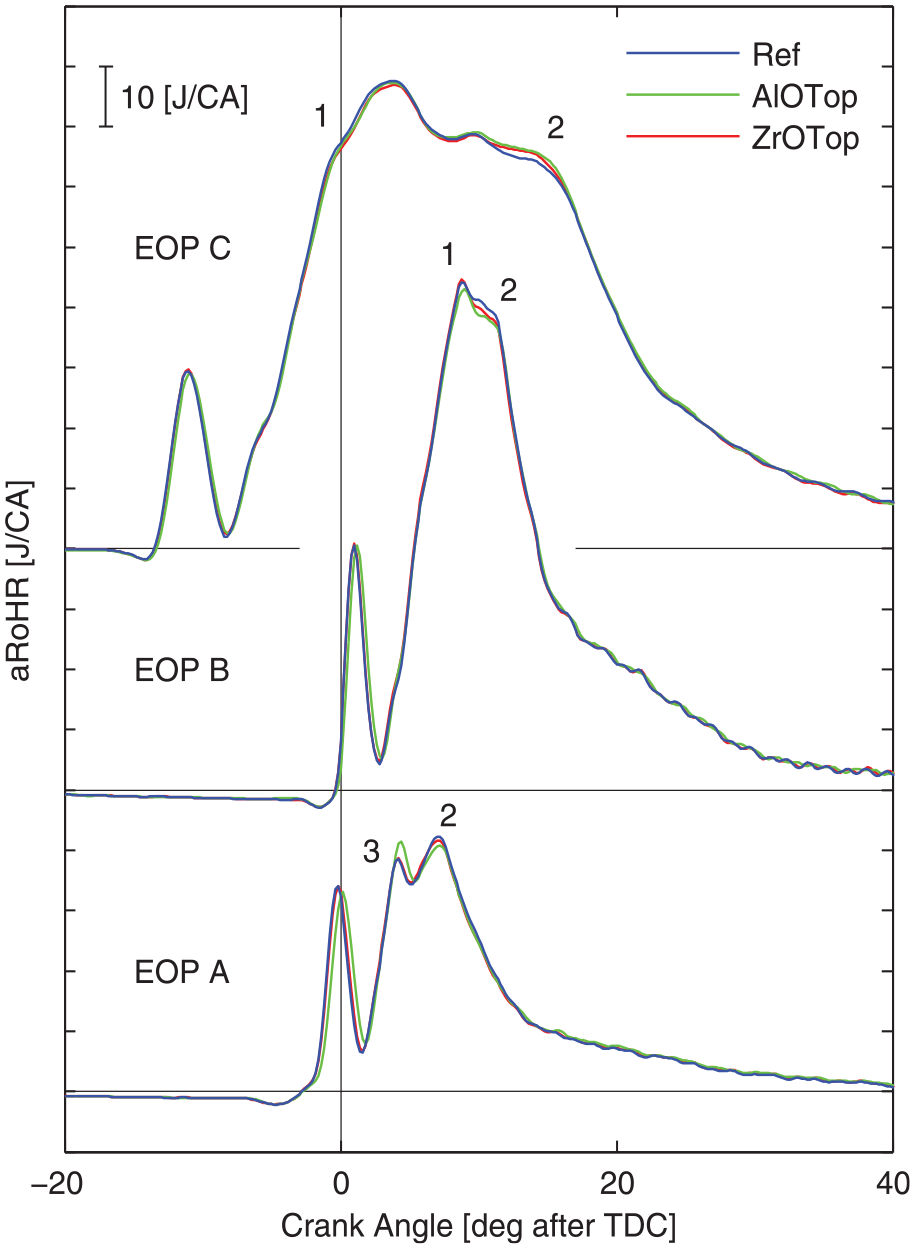
Apparent rate of heat release for the top-coated and polished pistons for run numbers 7, 12, and 20 in Table 9 in Appendix 2 (1 = start spray–wall interaction; 2 = end of fuel injection; 3 = pilot–main interaction).
To summarize, a high surface roughness decreased the peak aRoHR for the medium- and high-load EOPs when there is an interaction between the burning jet and the piston wall. For the high-load point, there is also a significant increase in the aRoHR in the tail of the combustion. There are two mechanisms that can cause these changes: (1) a longer combustion duration and (2) an increased heat loss during wall–jet interaction, followed by a reduced heat loss early in the expansion stroke.
Data modeling results
MLR was used to create models from the measured data as described in the “Method” section. Each response parameter was modeled separately, for each EOP. The number of observations used for the models was 22 for EOP C, 33 for EOP B, and 44 for EOP A.
Model coefficients close to zero were excluded from the models to improve model quality. Coefficients with very low confidence were removed as well as they did not contain useful information. The coefficients for all models can be found in Appendix 3. A selection of the model coefficients and responses will be presented and discussed here.
In Table 7, the input factors for the models are listed with their levels or their variable range. The compression ratio and the surface roughness are continuous, qualitative input factors. The coating type, fuel pressure, EGR level, and soot deposit level are discrete, categorical input factors. The variation of fuel pressure and EGR was included in the models to be able to combine the measurements for each EOP in one model. The compression ratio was included because of the relatively large range and its effect on the energy balance.
Early in the test run of the polished uncoated piston (Run order 5), a leakage of the injector washer was detected. This leakage exposed the injector to high-temperature gas which changed the pilot injection slightly. This change of the injector behavior was modeled by the factor AB: “A” represents the injector before the leakage, “B” after the leakage. The factor AB was significant for the exhaust emission models and the crank angle position for MFB75. The energy balance for fired and motored engine operation was not affected.
The soot deposit level increased during the test run for each fired EOP, especially with the application of EGR. The effect of soot deposits on the energy balance and emissions is effectively integrated in the categorical factor EGR. Consequently, this factor not only shows the effect of the intake CO2 level but also incorporates the effect of increasing soot deposits.
Below, an example is given of the way to calculate a response; in this case, the indicated efficiency (ratWork), for the standard reference piston, run number 12 in Table 9 in Appendix 2, EOP B. The values for the coefficients are taken from Figure 9. Centering and scaling is applied for the compression ratio and surface roughness factors: CR = 15.5 and Ra = 1.3 µm become CR* = 1.0, Ra* = –0.7
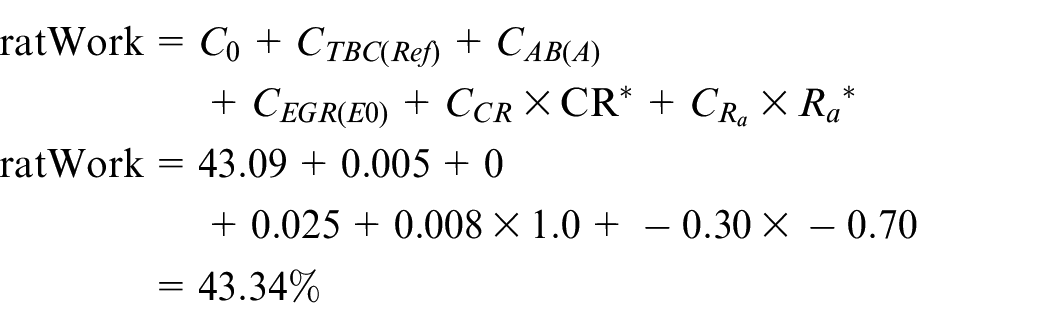
From this example, it can be seen how the factor coefficients express the correlation between the input factors and the responses. These model coefficients illustrate the magnitude and confidence level of the correlations between input (factors) and output (responses) of the experimental data.
Table 6 gives an overview of the modeled correlations between the factors and responses for low- , medium- , and high-load engine operation. Note that a high confidence level of a correlation coefficient does not necessarily mean a large effect of the factor on the response. In Appendix 3, all modeled responses are found for the three EOPs. The figures show results for indicated efficiency, heat losses, exhaust losses, combustion phasing, and emissions as well as the indicated mean effective pressure for the motored cases.
Effect of coating type, coated surface (’ indicates top-coated), surface roughness and compression ratio on the motored and fired energy balance, the combustion speed, and the exhaust emissions, relative to the reference piston. A positive correlation is indicated by an upward arrow. Summary of the figures in Appendix 3.
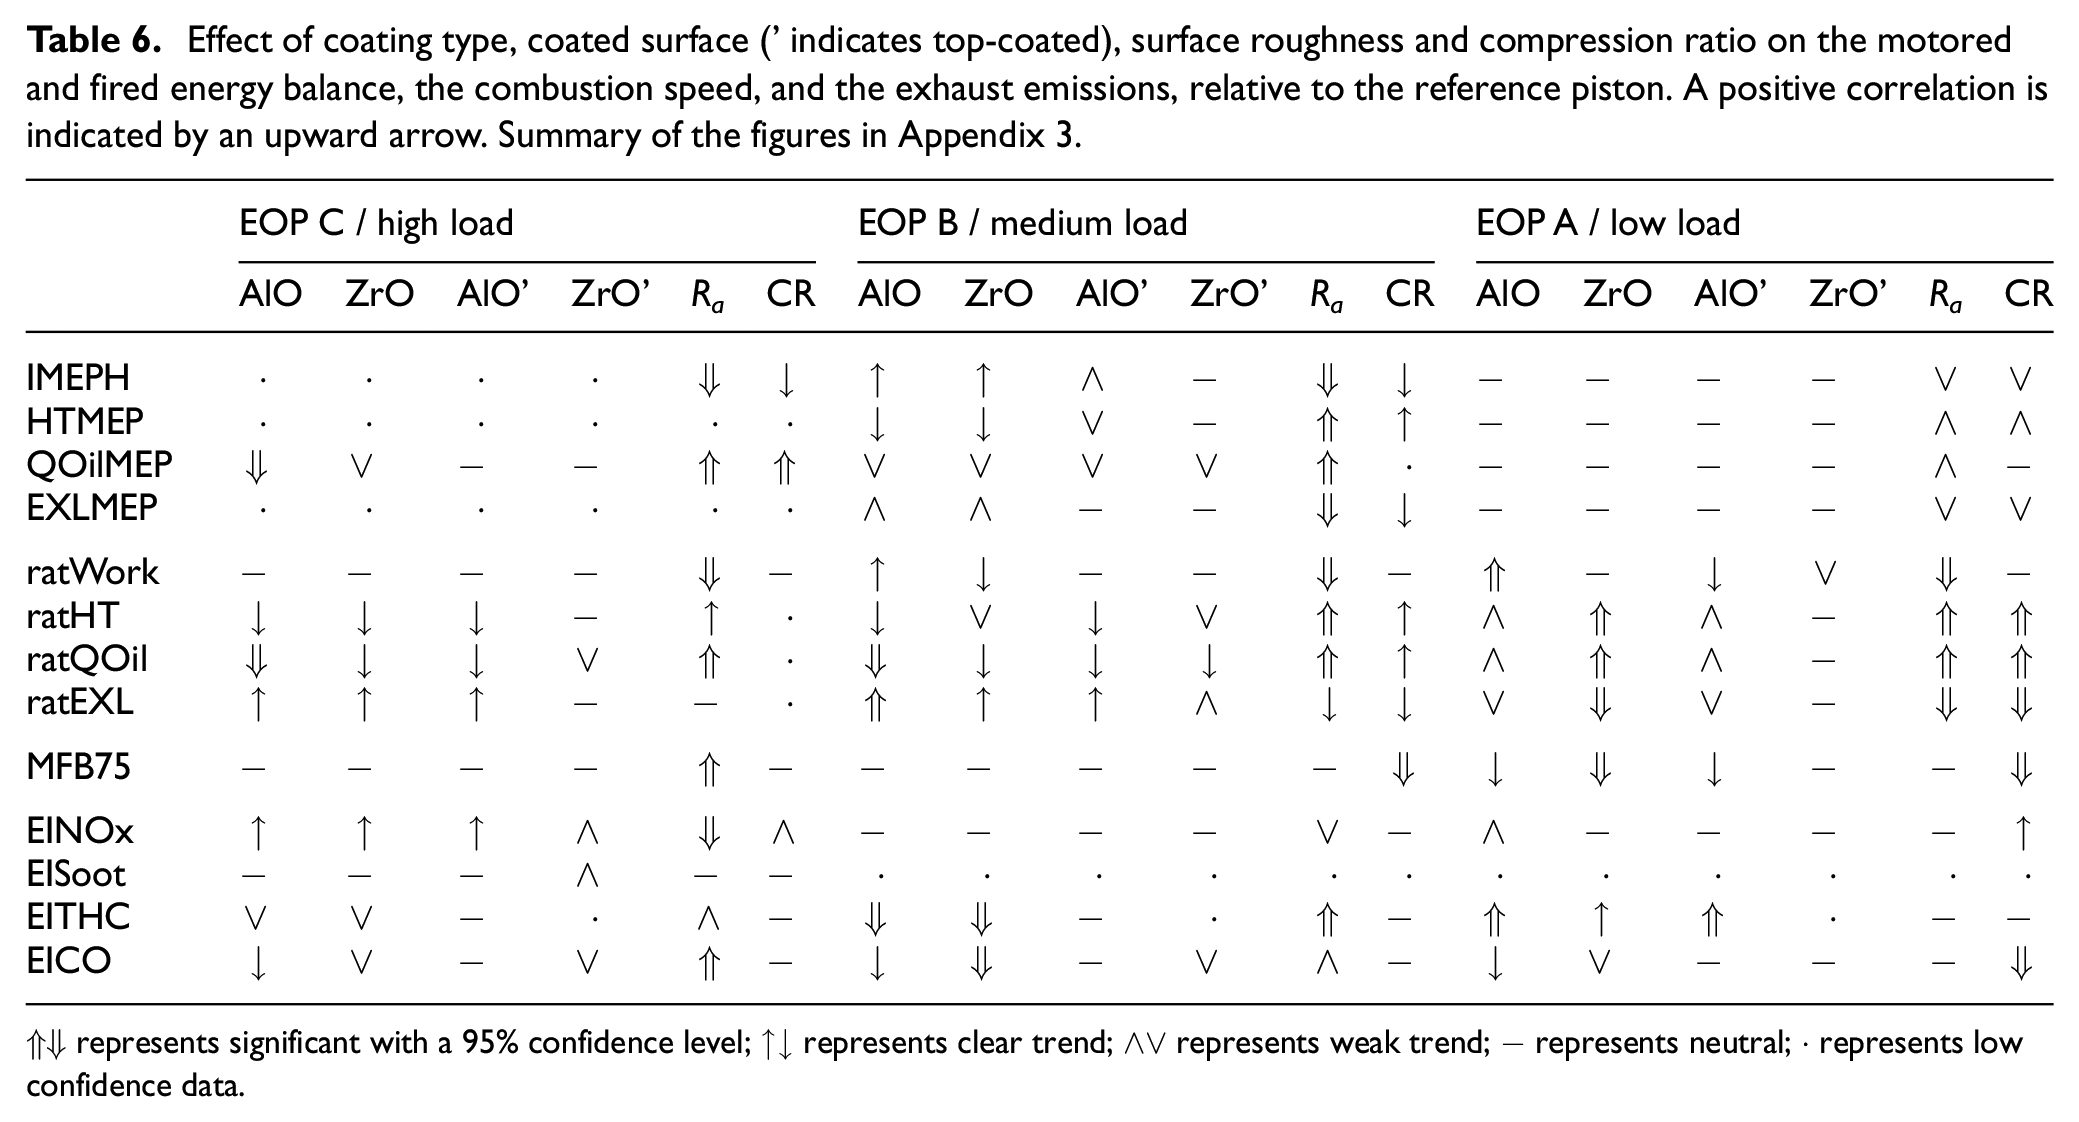
⇑⇓ represents significant with a 95% confidence level; ↑↓ represents clear trend; ∧∨ represents weak trend; − represents neutral; · represents low confidence data.
Indicated work, heat loss, and exhaust loss
Figure 8 shows the measured indicated efficiency for the reference piston, the fully coated rough pistons, and the polished top coated pistons. The estimations for the measured indicated efficiency from the model are very precise. The 95% confidence interval is close to ±0.1 percentage point. This shows that the engine operating conditions and measurements were repeatable and that the model fits the data well. The high precision is valid when comparing the estimation of measured results within this group of experiments.
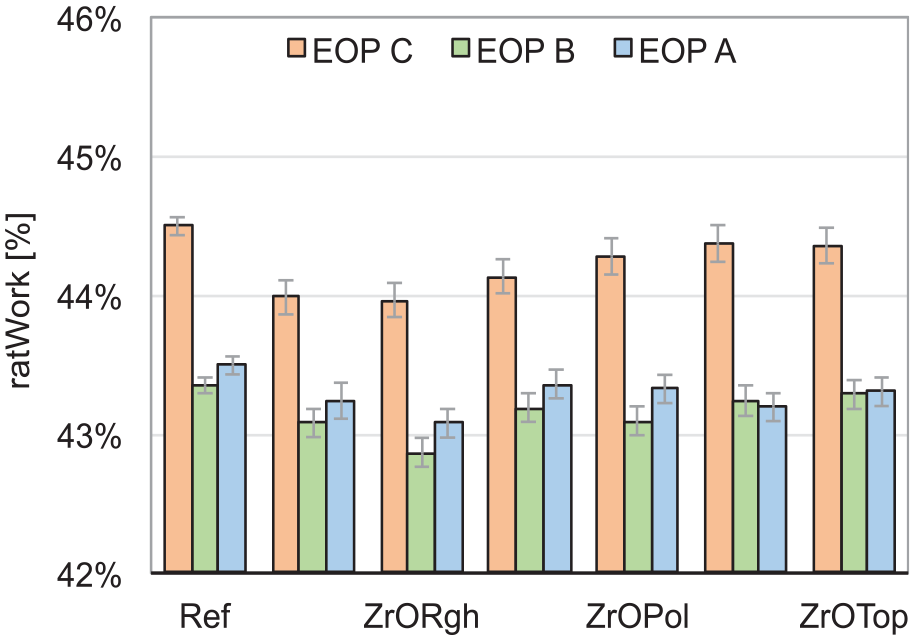
Estimation of the measured indicated efficiency from the modeled data. No EGR, high rail pressure for EOP C, representing run numbers 7, 12, and 20 in Table 9 in Appendix 2. The error-bars represent 95% CI.
The bar graph shows the same trend as Figure 4. The fully coated rough pistons (AlORgh and ZrORgh) have a significantly lower indicated efficiency compared to the reference piston. The top-coated pistons AlOTop and ZrOTop show a tendency to a lower efficiency compared to the reference piston, but the difference is very small. To investigate the cause for the lower efficiency of the fully coated rough pistons, the coefficients of the MLR models for the energy balance can be used.
Figure 9 shows the model coefficients for indicated efficiency, wall heat loss, and heat loss to the piston cooling oil for the medium-load point B. This figure is used as an example, selected from the figures in Appendix 3, where the coefficients for all MLR models can be found. The confidence intervals for the coating type and compression ratio are relatively large because these two factors are correlated. However, the coefficients for coating type and compression ratio show a very consistent behavior in the different models despite their collinearity; therefore, the models are still considered useful for analysis.
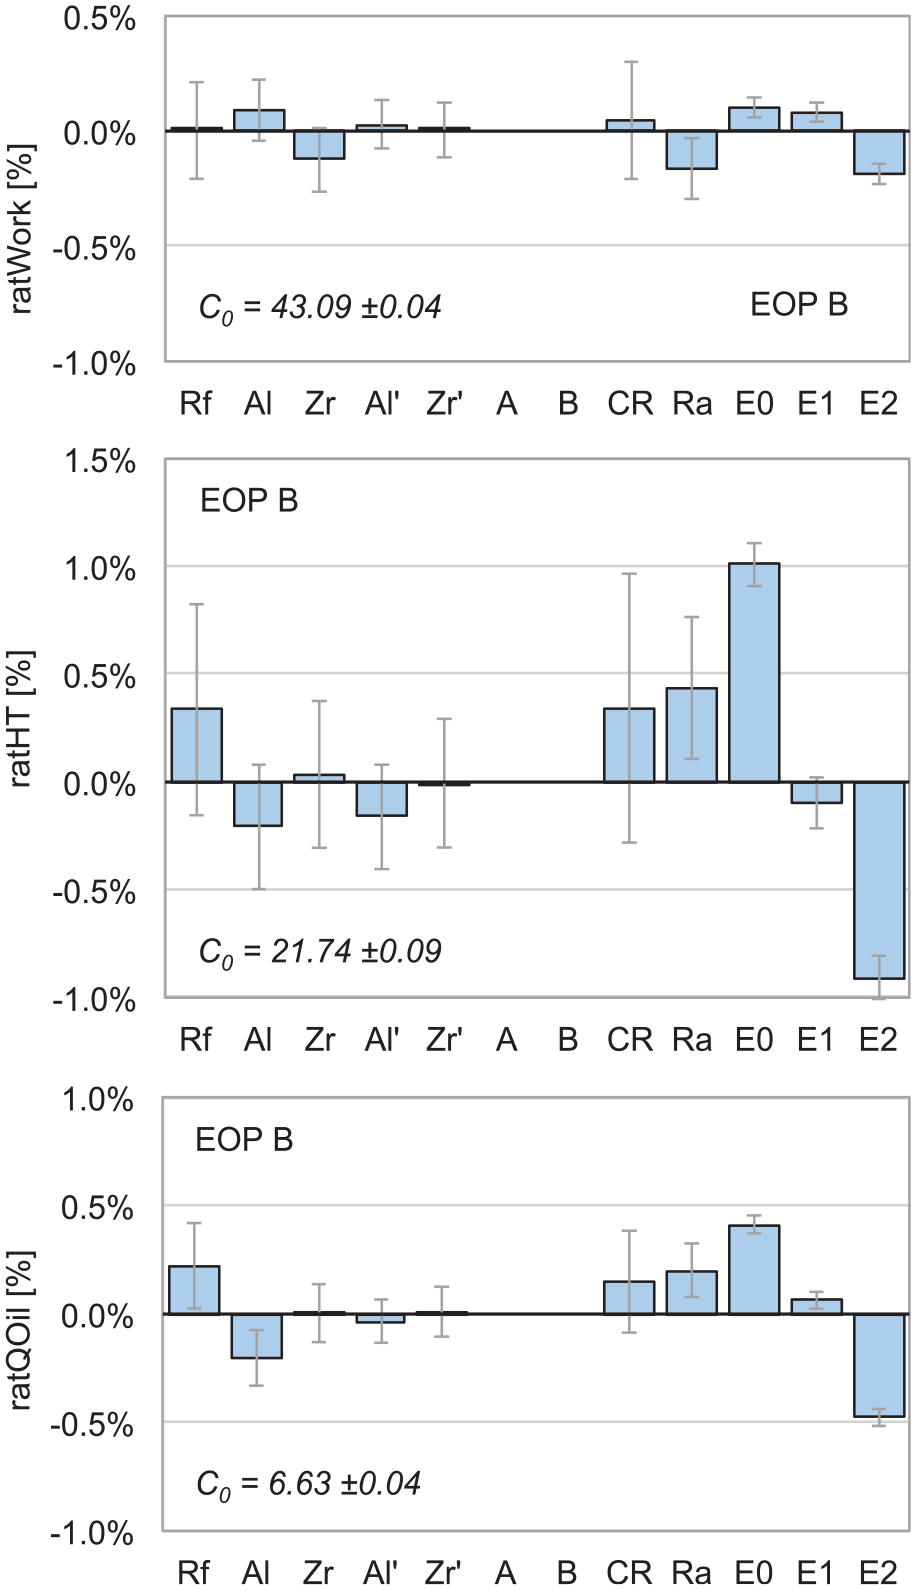
Model coefficients for indicated efficiency, wall heat losses, and heat losses to the piston cooling oil for EOP B. The error-bars show the 95% CI. The legend for the coefficient labels can be found in Table 7.
The input factors for the regression models.
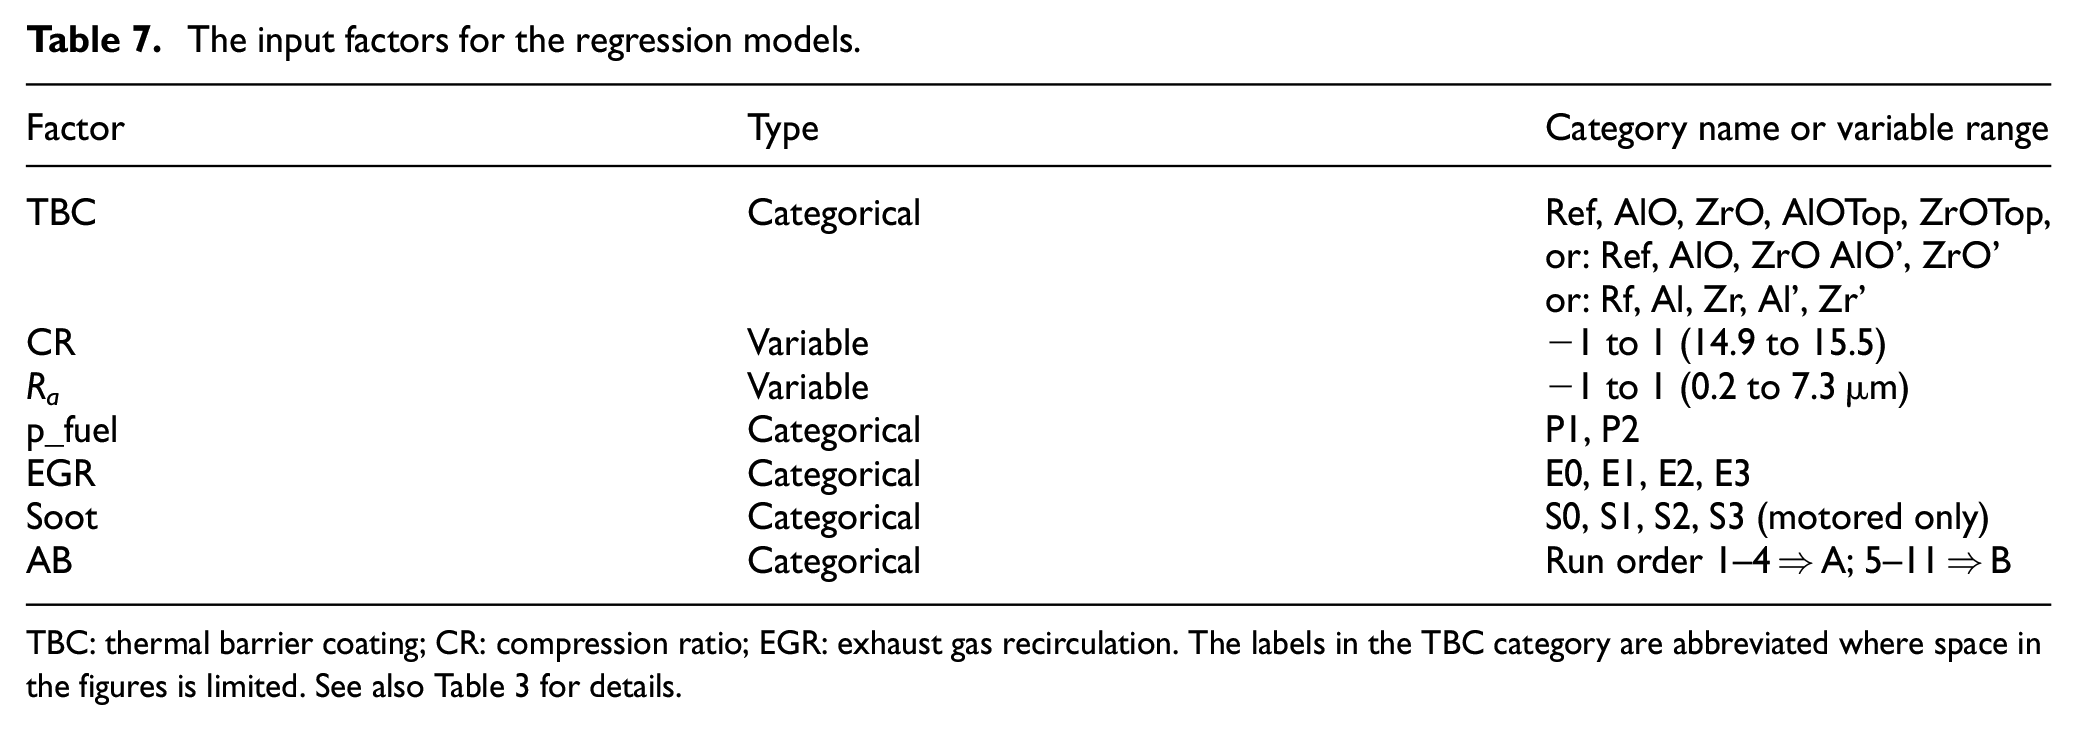
TBC: thermal barrier coating; CR: compression ratio; EGR: exhaust gas recirculation. The labels in the TBC category are abbreviated where space in the figures is limited. See also Table 3 for details.
The coefficients for the coatings indicate a reduction in heat losses of around 0.5 percentage point compared to the reference piston. The pistons with the alumina coating seem the most effective in heat loss reduction. The effect of the coatings on the indicated efficiency is small, in the order of ±0.1 percentage point. An increase in the compression ratio increases the heat losses but has no significant effect on the indicated efficiency. The EGR level is the most significant factor for the heat losses. Increased EGR levels result in lower heat losses. The indicated efficiency does not increase with increased EGR because the combustion is slower, which can be seen in Figure 17, EOP B, chart (e) in Appendix 3.
The surface roughness shows a rather strong and significant correlation with all three responses of the energy balance. Higher surface roughness increases heat losses and reduces indicated efficiency. The model coefficients for the heat loss to the piston cooling oil and the calculated heat loss from the cylinder pressure data show a remarkable agreement, keeping in mind that these measurements are completely independent. The difference in coefficient magnitude can be explained by the fact that the heat loss to the piston cooling oil is just a part of the total heat loss.
To give an overview of the effect of surface roughness on the energy balance for all three EOP, Table 8 shows how a reduction of surface roughness Ra from 7.3 to 0.2 µm changes the indicated efficiency, heat losses, and exhaust losses. The indicated efficiency is increased with 0.9% for EOP B and C, and 0.7% for EOP A. Reduced heat losses are the main cause for the efficiency improvement. For the high-load EOP C, MFB75 was reduced as well. Exhaust losses increased as expected when there is a reduction of heat losses. The emission loss (ratEML) was very small and not shown in the table. This loss can be found implicitly as the remaining term to get 100% when adding up the terms for ratWork, ratHT, and ratEXL.
Predicted effect of a roughness
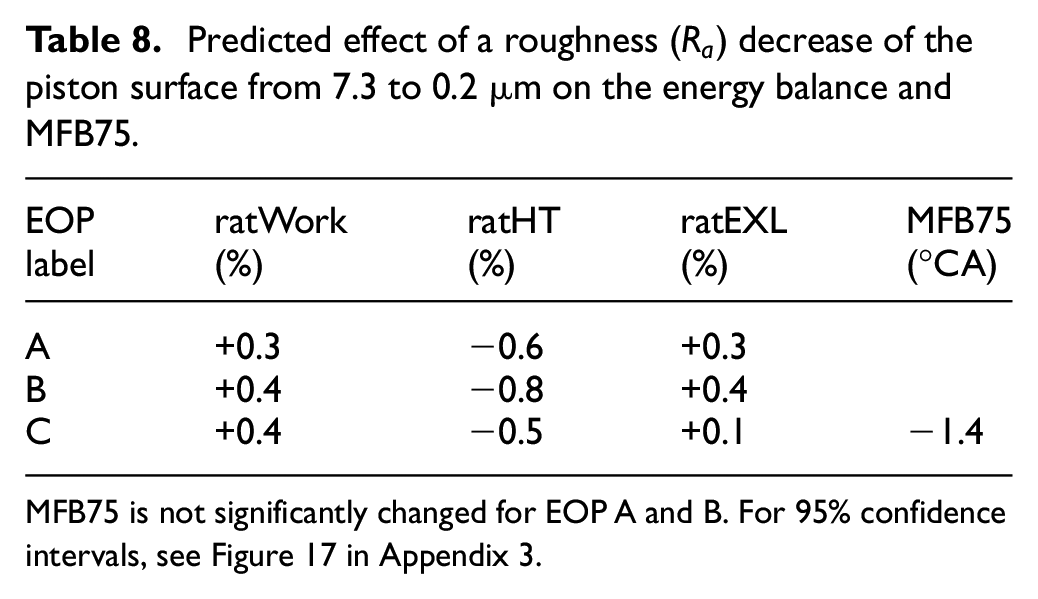
MFB75 is not significantly changed for EOP A and B. For 95% confidence intervals, see Figure 17 in Appendix 3.
To visualize the effect of smooth coatings with the same surface roughness and compression ratio as the reference piston, the model was used to predict the indicated efficiency for all three load points, shown in Figure 10. The (*) with the coating category labels indicates that the coating properties are predicted. There is no significant difference between the coatings and the reference piston anymore. Predictions for all terms in the energy balance are found in Appendix 4.
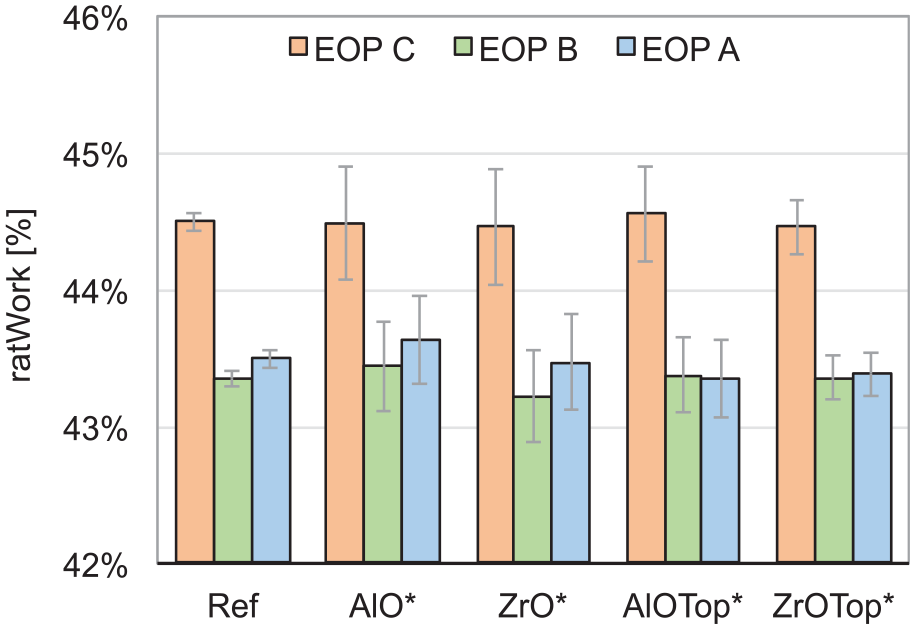
Predicted indicated efficiency (ratWork) with
To summarize, the low indicated efficiency for the unpolished coated pistons is caused by their high surface roughness. High surface roughness increases heat losses to the combustion chamber walls and delays MFB75 for the high engine load point C. The effect of the coatings on the indicated efficiency is small, in the order of ±0.1 percentage point.
Exhaust gas emissions
The effects of the TBCs and surface roughness on the exhaust emissions are relatively small but significant. Figure 11, selected from Appendix 3, shows the correlation coefficients in the model for the high-load point for the fuel-specific NOx, Soot, and CO emissions.
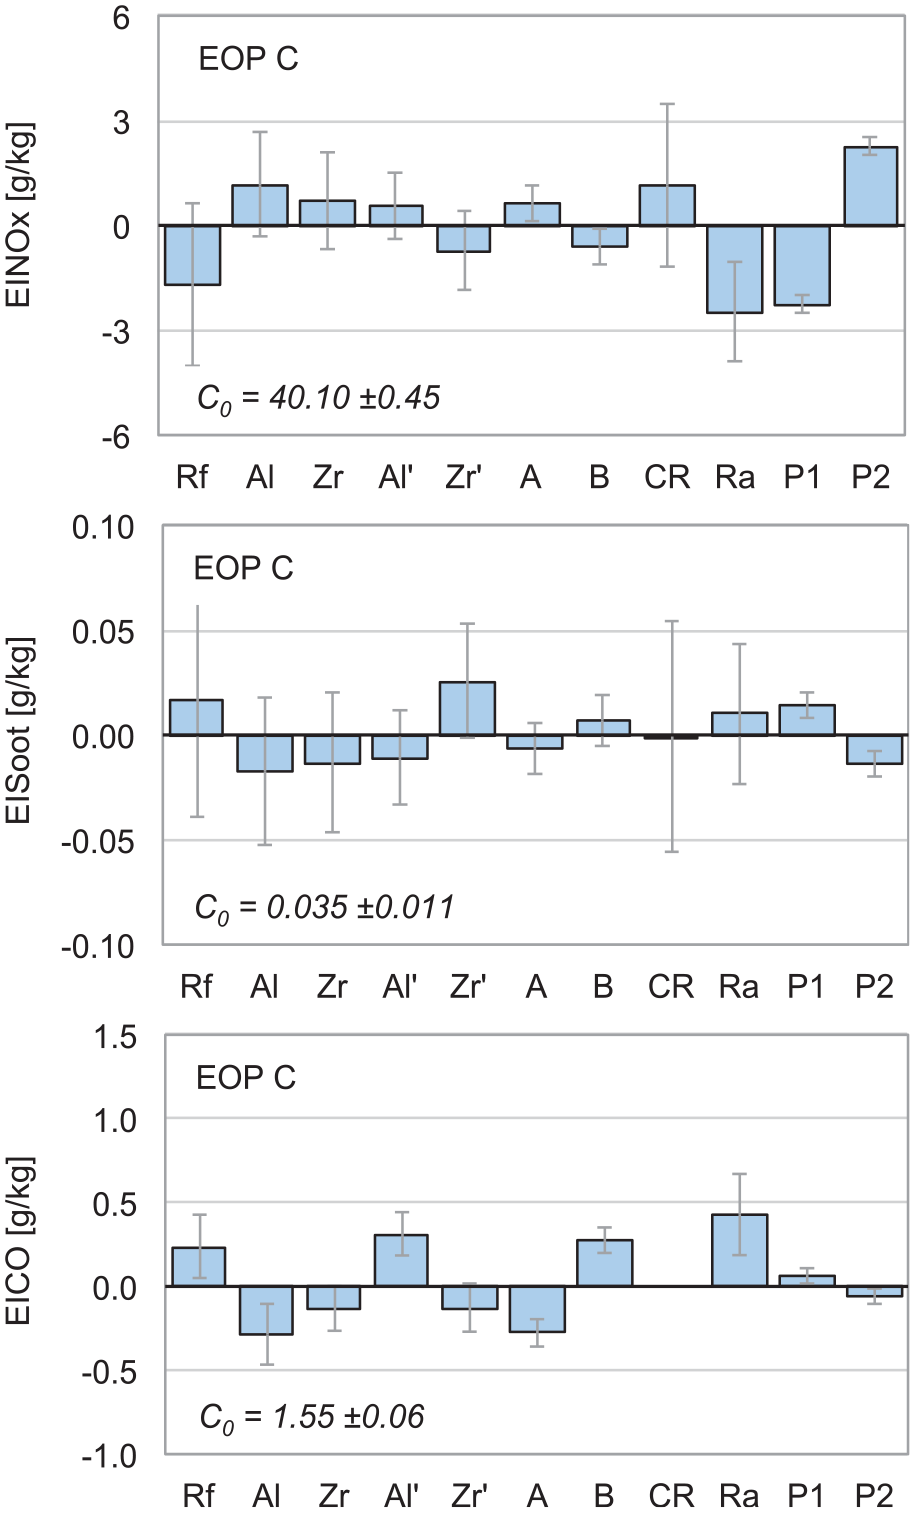
Model coefficients (correlations) for EINOx, EISoot, and EICO, for EOP C. The error-bars represent 95% CI. The legend for the coefficient labels can be found in Table 7.
The formation of NOx emissions is sensitive for the maximum local temperatures in the combustion chamber. A rise in NOx emission indicates an increase in the maximum local temperatures. It is, therefore, expected that NOx emissions increase when TBCs are applied, see Figure 11. That a higher surface roughness reduces NOx emissions is logical due to the higher heat losses and due to the slower combustion for the high-load point. The presence of an alumina coating with a median Ra level on the whole piston top increases NOx about 8%. A surface roughness
The soot emissions are less predictable compared to NOx. This is because both soot formation and soot oxidation are temperature dependant. The soot levels in the high-load point are generally very low and the effect of the coatings and surface roughness seem to be small as well. The large error-bars indicate that there is no significant trend from the coatings and surface roughness.
The oxidation and reduction of CO is enhanced by high temperature and mixing. It is, therefore, expected that this emission is reduced by the presence of the full coatings and increased by a high surface roughness as shown in Figure 11. There is also a significant effect from the different pilot injection quantities represented by the factors A and B. The smaller pilot quantity (A) shows less CO emissions. The levels of CO emissions in this high-load point are low, and the changes from the presence of the coatings and surface roughness are very small.
For the low-load points, where EGR is used, the relative impact of the coatings and surface roughness becomes very small, even though the trends are the same as for the high-load point as illustrated in Figure 11.
The THC emissions show an interesting difference in behavior for the low-load point compared to the medium- and high-load points, see Figure 12. As for CO, the oxidation and reduction of THC is supported by high temperature and mixing. The level of THC is reduced significantly by the fully coated pistons and increased considerably with high surface roughness. However, the low-load point shows the opposite effect. The presence of a coating increases the THC emissions while the surface roughness influence is insignificant.
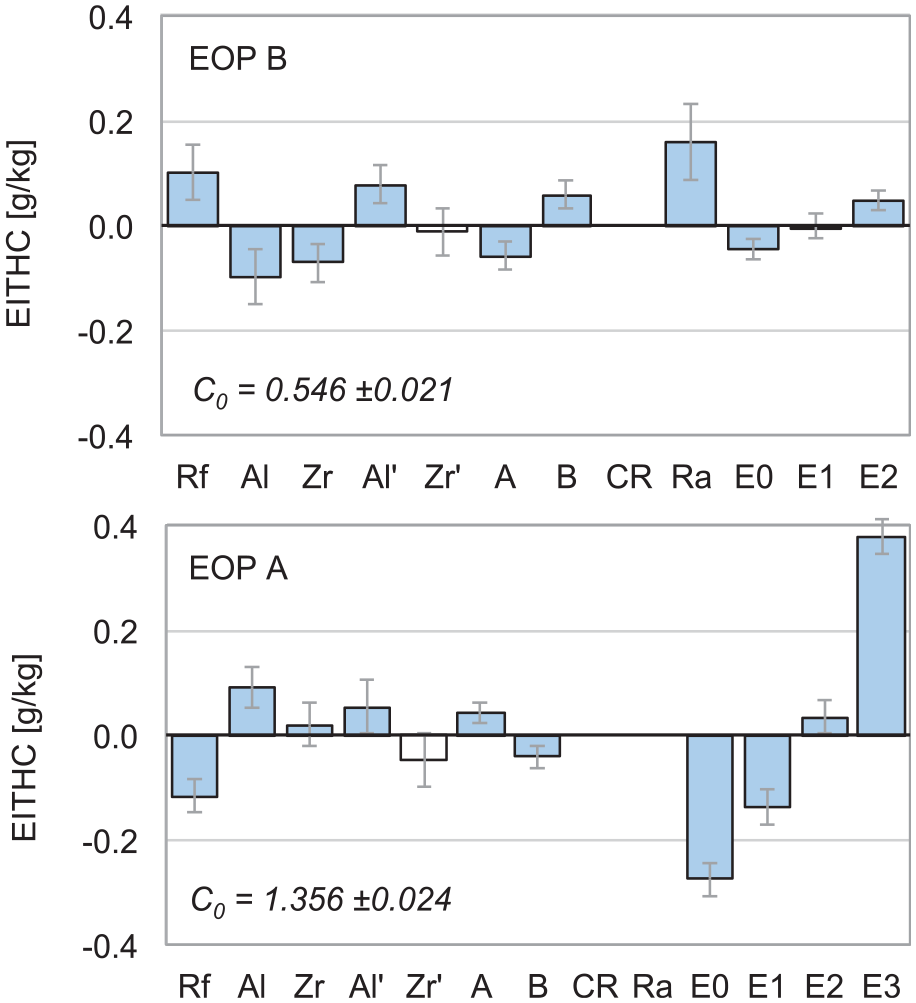
Model coefficients (correlations) for EITHC for EOP A and B. The error-bars represent the 95% CI. The bar for Zr’ coefficient is white because there was a negative offset for the THC emissions with the zirconia top-coated piston. The legend for the coefficient labels can be found in Table 7.
There might be two competing mechanisms that could explain this observation. A high charge temperature will promote oxidation of unburned fuel. However, a TBC with open porosity might absorb part of the near wall fuel which would prevent the oxidation of this fuel. At a lower engine load and lower charge temperature, the effect of the porosity might dominate, resulting in increased levels of THC emissions. Finally, the effect of the change in injector behavior, modeled by the factor AB can be seen for all emissions. Most likely, this is related to small changes in the pilot fuel quantity.
To summarize, the effect of the coatings and surface roughness on emissions is as expected, with the exception of the THC emissions in the low-load point, where the presence of the TBCs increased THC emissions.
Motored losses
The motored energy balance does not have the complex contribution of combustion on the heat transfer. Analysis of the motored energy balance can complete and confirm the findings from the fired energy balance, or shed new light on motored phenomena. Without combustion, the split between indicated work, heat loss, and exhaust loss is fairly constant. Therefore, only the motored losses (IMEPH) will be discussed here. The effect of soot deposits is studied by comparing the motored losses before and after high-, medium-, and low-load engine operations.
The indicated work (IMEPH) for the different pistons and all three EOPs is shown in a bar graph in Figure 13. The major cause for the motored losses in the high-pressure cycle is heat transfer. It is, therefore, expected to see lower motoring losses (a higher IMEPH) for the coated pistons. But this is not the case for the highest load point, where the losses seem to increase for the AlORgh and ZrORgh pistons.
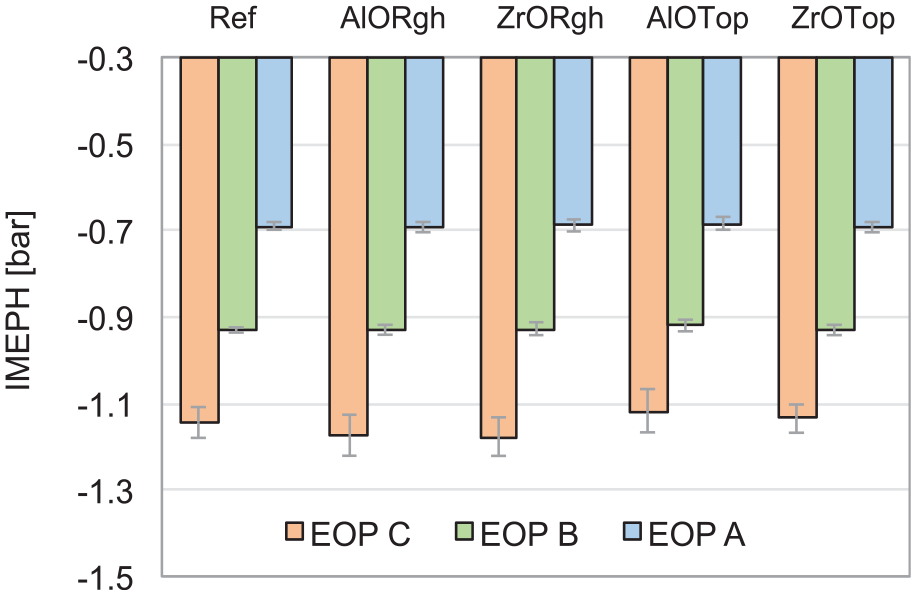
Measured motored losses, unsooted (S0), representing run numbers 1, 3, and 5 in Table 9 in Appendix 2. The error-bars show the 95% CI.
To explain this result, Figure 14 is presented with the model coefficients for EOP B, the medium-load point. The figure shows that the fully coated pistons have a lower motored loss, as expected. Also, the lower compression ratio for these pistons reduces the motored losses. But the high surface roughness increases heat losses and counteracts the effect of insulation and compression ratio. The principle effect is the same for all three load cases, which can be seen in Appendix 3. The negative impact of the surface roughness is most significant for the medium and high loads.
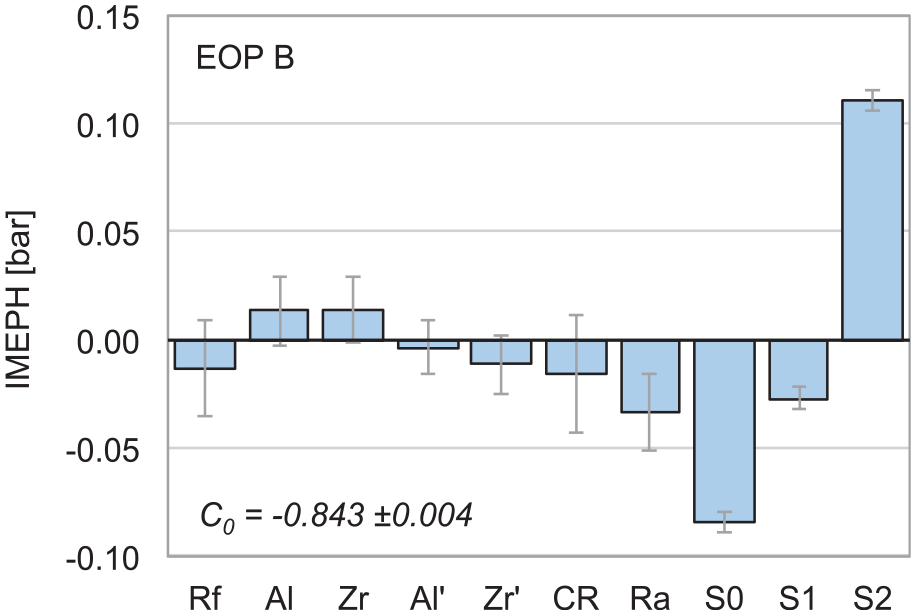
Model coefficients for IMEPH in EOP B. The error-bars represent the 95% CI. The legend for the coefficient labels can be found in Table 7.
Figure 14 also shows the correlation between soot deposits and indicated work, which is much larger than the correlation for the TBCs. Soot appears to be a very good insulator, at least for the motoring conditions.
In Figure 15, a comparison is made between the indicated work for clean conditions and the soot deposit level after motored operation for each load case. The figure shows the results for the reference piston, but the modeled effects of soot deposits are the same for all pistons. The soot deposits reduce the indicated mean effective pressure with about 0.2 bar. This is a significant reduction; typical motored friction losses for a modern LD CI engine, running at 1500–3000 r/min, range from 0.5 to 0.9 bar. 15
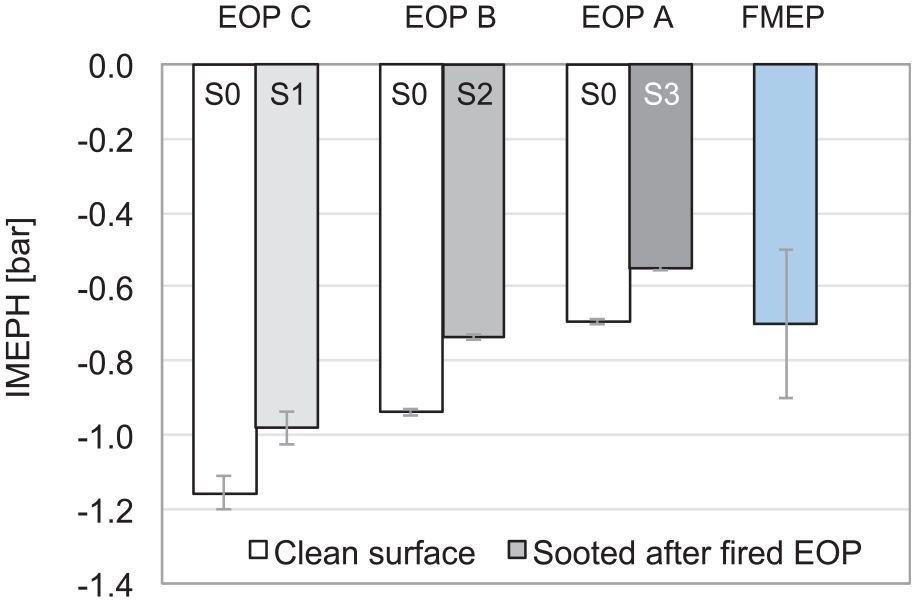
Effect of soot deposits on IMEPH shown for the reference piston. Typical friction losses (FMEP) are included for comparison. The error-bars represent the 95% CI, and the range for FMEP is from 1500 to 3000 r/min.
To summarize, a high surface roughness counteracts the positive effect of the TBCs on the motored losses. Soot deposits appear to be an effective insulator, which has been shown in the literature,16,17 but has not been quantified and presented in this way before. This result also shows the importance of taking into account the effect of soot deposits when investigating TBCs.
Volumetric efficiency
Although the mass flow through the engine was kept constant, small variations were observed for the volumetric efficiency (0.88–0.90). From the MLR model, it could be seen that a high surface roughness reduced volumetric efficiency more than the presence of a TBC. An explanation for this could be that the high surface roughness increased the heat transfer coefficient. The higher heat transfer would result in an increased surface temperature at the end of the exhaust stroke. During gas exchange, the high heat transfer coefficient combined with the high surface temperature would increase the heat transfer to the fresh charge more than a smooth TBC, resulting in the observed lower volumetric efficiency.
Conclusion
A robust experimental method was designed and applied for the evaluation of two types of TBCs including a variation of surface roughness and coating location. Measurements were made for low-, medium-, and high-load engine operating conditions. Models were fitted to the resulting data using MLR. The use of these models together with robust measurement data made it possible to distinguish small differences in results between the different hardware setups and to make well-supported conclusions regarding the effects of TBC and surface roughness on engine efficiency and heat losses. The key findings from this study are as follows:
The applied method for the experimental setup and the statistical modeling with MLR resulted in a 95% confidence interval of ±0.1 percentage point for the indicated efficiency.
The indicated fuel consumption for the fully coated unpolished zirconia and alumina pistons was up to 1% higher compared to the indicated fuel consumption for the uncoated reference piston.
Factor analysis revealed that the main cause for the higher fuel consumption of the unpolished coated pistons was their high surface roughness. The high surface roughness increased heat transfer to the walls for all three investigated load points and delayed the combustion in the high-load EOP.
The pistons with a coating of polished zirconia or alumina, limited to the squish surface, showed no significant difference in fuel consumption compared to the reference piston.
Analysis of the aRoHR for the different pistons also showed a consistent negative effect of high surface roughness for the medium- and high-load cases. This effect was most visible when the burning jet interacted with the piston surface and in the burn out phase during the expansion stroke.
The effects of the TBCs and surface roughness on the exhaust emissions were as expected and related to changes in charge temperature. The only unexpected observation was the increase in the THC emissions in the presence of the tested TBCs, for the low-load EOP. This increase might be related to the porosity of the two coatings tested in this investigation.
Experimental data from motored engine operation showed that soot deposits reduced heat losses more than the TBCs. The effect of soot deposits should be accounted for when performing experiments with TBCs.
The study was applied on two types of TBC. Other coating types may give different results with respect to engine efficiency and heat losses. However, the robust experimental method and the data modeling using MLR as described in this article should be applicable for many investigations of thermal insulation and TBCs.
Footnotes
Appendix 1
Appendix 2
Appendix 3
Appendix 4
Declaration of conflicting interests
The author(s) declare no potential conflicts of interest with respect to the research, authorship, and/or publication of this article.
Funding
The author(s) disclosed receipt of the following financial support for the research, authorship, and/or publication of this article: This work was funded by the Swedish Energy Agency and the Combustion Engine Research Center (CERC) at Chalmers University of Technology in Gothenburg, Sweden.