
Abstract
The two-stroke engine has the great potential for aggressive engine downsizing and downspeeding because of its double firing frequency. For a given torque, it is characterized with a lower mean effective pressure and lower peak in-cylinder pressure than a four-stroke counterpart. In order to explore the potential of two-stroke cycle while avoiding the drawbacks of conventional ported two-stroke engines, a novel two-stroke boosted uniflow scavenged direct injection gasoline engine was proposed and designed. In order to achieve the stable lean-burn combustion in the boosted uniflow scavenged direct injection gasoline engine, the mixture preparation, especially the fuel stratification around the spark plug, should be accurately controlled. As the angled intake scavenge ports produce strong swirl flow motion and complex transfer between the swirl and tumble flows in the two-stroke boosted uniflow scavenged direct injection gasoline engine, the interaction between the in-cylinder flow motions and the direct injection and its impact on the charge preparation in the boosted uniflow scavenged direct injection gasoline engine are investigated in this study by three-dimensional computational fluid dynamics simulations. Both the single injection and split injections are applied and their impact on the mixture formation process is investigated. The start of injection timing and split injection ratio are adjusted accordingly to optimize the charge preparation for each injection strategy. The results show that the strong interaction between the fuel injection and in-cylinder flow motions dominates the mixture preparation in the boosted uniflow scavenged direct injection gasoline engine. Compared to the single injection, the split injection shows less impact on the large-scale flow motions. Good fuel stratification around the spark plug was obtained by the late start of injection timings at 300 °CA/320 °CA with an equal amount in each injection. However, when a higher tumble flow motion is produced by the eight scavenge ports’ design, a better fuel charge stratification can be achieved with the later single injection at start of injection of 320 °CA.
Introduction
The engine downsizing and downspeeding technologies have been developed in automotive industry to reduce CO2 emissions and achieve higher engine efficiency. However, the application of the engine downsizing and downspeeding by increasing boost in the four-stroke gasoline engine is hampered by the increased peak cylinder pressure, knocking combustion and associated higher thermal and mechanical load. Alternatively, the two-stroke engine has great potential to achieve both downsizing and downspeeding because of its doubled firing frequency. At the same output torque, the two-stroke cycle engine is characterized by a lower indicated mean effective pressure (IMEP) and lower peak in-cylinder pressure than a four-stroke counterpart. The additional advantages, including the higher power-to-weight ratio and compact engine dimension, make the two-stroke engine naturally suitable for aggressive engine downsizing and downspeeding.
In order to take full advantage of the two-stroke cycle operation, a novel two-stroke boosted uniflow scavenged direct injection gasoline (BUSDIG) engine 1 was proposed and designed to achieve aggressive engine downsizing and downspeeding. The uniflow scavenge method, which has been proved to be most effective in the scavenging performance of the two-stroke operation,2,3 is adopted in the BUSDIG engine. The intake ports are integrated into the cylinder liner and their opening and closure are controlled by the movement of the piston top while exhaust valves are placed in the cylinder head. The variable valve actuation (VVA) technology is applied to the exhaust valves to control the scavenging process under different boost pressures at various engine speeds. The direct injection (DI) after the exhaust valve closing from a centrally mounted outward opening piezo injector will be used to avoid fuel short-circuiting in the BUSDIG engine, which, in turn, lowers the fuel consumption and pollutant emissions. In addition, the fuel consumption of the two-stroke engine can be further improved with lean/stratified charge achieved by the DI4–7 and advanced combustion concept, for example, controlled auto-ignition (CAI)/homogeneous charge compression ignition (HCCI)/gasoline compression ignition (GCI) combustion 8 and stratified flame ignited (SFI) hybrid combustion, 9 under different engine load operations.
In order to achieve optimal combustion during the spark ignition operation in the BUSDIG engine, the fuel injection and local fuel–air equivalence ratio (ER) around the spark plug should be controlled to near stoichiometry for stable ignition and faster flame propagation.10–13 It has been shown that the fuel stratification can be achieved by a suitable bowl piston shape14,15 and organized in-cylinder flow motions16,17 in combination with an appropriate DI strategy. Both the start of injection (SOI) timing18–21 and the split DI ratio10,19,22 play important roles on controlling in-cylinder fuel stratification patterns and the subsequent combustion process. The earlier injection timing leads to over-mixed lean mixture in the spark plug region and also increases fuel surface wetting, resulting in excessive engine-out smoke.18,23 The later injection decreases the available time for air–fuel mixing prior to the time of ignition, leading to poor combustion and emissions. 23 In addition to the split DI, a combined injection strategy with both port fuel injection and DI can be applied to effectively form overall homogeneous mixture with appropriate fuel stratification around the spark plug.9,10,15,22
In contrast to the wall-guided combustion engine, the stratified mixture in a spray-guided combustion engine relies more on the interaction between the direct injected fuel and the in-cylinder flow motions. It is found that the injected spray influences the in-cylinder large-scale flow structures and turbulence intensity, and the gas flow also shows impacts on the spray structures. 16 The three-dimensional (3D) computational fluid dynamics (CFD) simulations show that the charge stratification at the time of the spark in a direct injected two-stroke gasoline engine is strongly influenced by the in-cylinder flow motions, 24 and an earlier injection timing leads to a slower ignition process with a weaker ignition kernel due to the over-mixed leaner mixture near the spark plug. 25 A strong tumble or swirl motion was found to be helpful to spread out both the liquid fuel and vapor distributions, which enhanced the subsequent air–fuel mixing.26–28 The reverse tumble generated by the upright straight intake ports plays a significant role on the control of the charge stratification and the turbulent kinetic energy (TKE) in a DI gasoline engine. 29 The study on the effect of split injections in a direct injected two-stroke gasoline engine shows that the late injected fuel of the second pulse is affected more by the in-cylinder flow motion and results in a sufficiently rich mixture at the spark plug which ensures a stable initiation of combustion. 17
The above studies have indicated significant interactions between the in-cylinder flow motions and fuel injections and demonstrated their impacts on the fuel stratifications and subsequent combustion process. In the BUSDIG engine, the angled intake scavenge ports produce strong swirl flow motions and complex transfer between the swirl and tumble flows.30,31 In order to clarify the interaction between the complex flow motions and DI in the proposed BUSDIG engine, the 3D CFD engine simulations of the DI and mixing process are performed with the validated fuel injection and spray models. Both the single injection and split injections are applied in this study to understand their impacts on the mixing process and final charge stratification. The SOI timing and split injection ratio are adjusted accordingly to optimize the charge preparation for each injection strategy. In order to demonstrate the impact of the initial in-cylinder flow motions on the mixing process and charge stratification, the simulation results with different scavenge port layout designs are analyzed as well.
Specification of the BUSDIG engine
Figure 1 shows schematically the design of the cylinder head, piston shape and scavenge ports. Based on the initial design of bore/stroke for maximum performance, 30 a pent roof cylinder head was incorporated in the current design to accommodate two exhaust valves, a centrally mounted outward opening piezo injector and a spark plug. The spray cone angle of the injector is 100° and the injector is vertically mounted at the geometric center of the engine cylinder head. A shallow bowl was included in the center of piston top to guide the fuel jets from the injector and also to avoid the interference with the spark plug. It should be noted that the piston top edge at the exhaust side is slightly lower due to the bias piston ridge in order to match the cylinder head geometry, which leads to slightly earlier intake flow at the exhaust side.
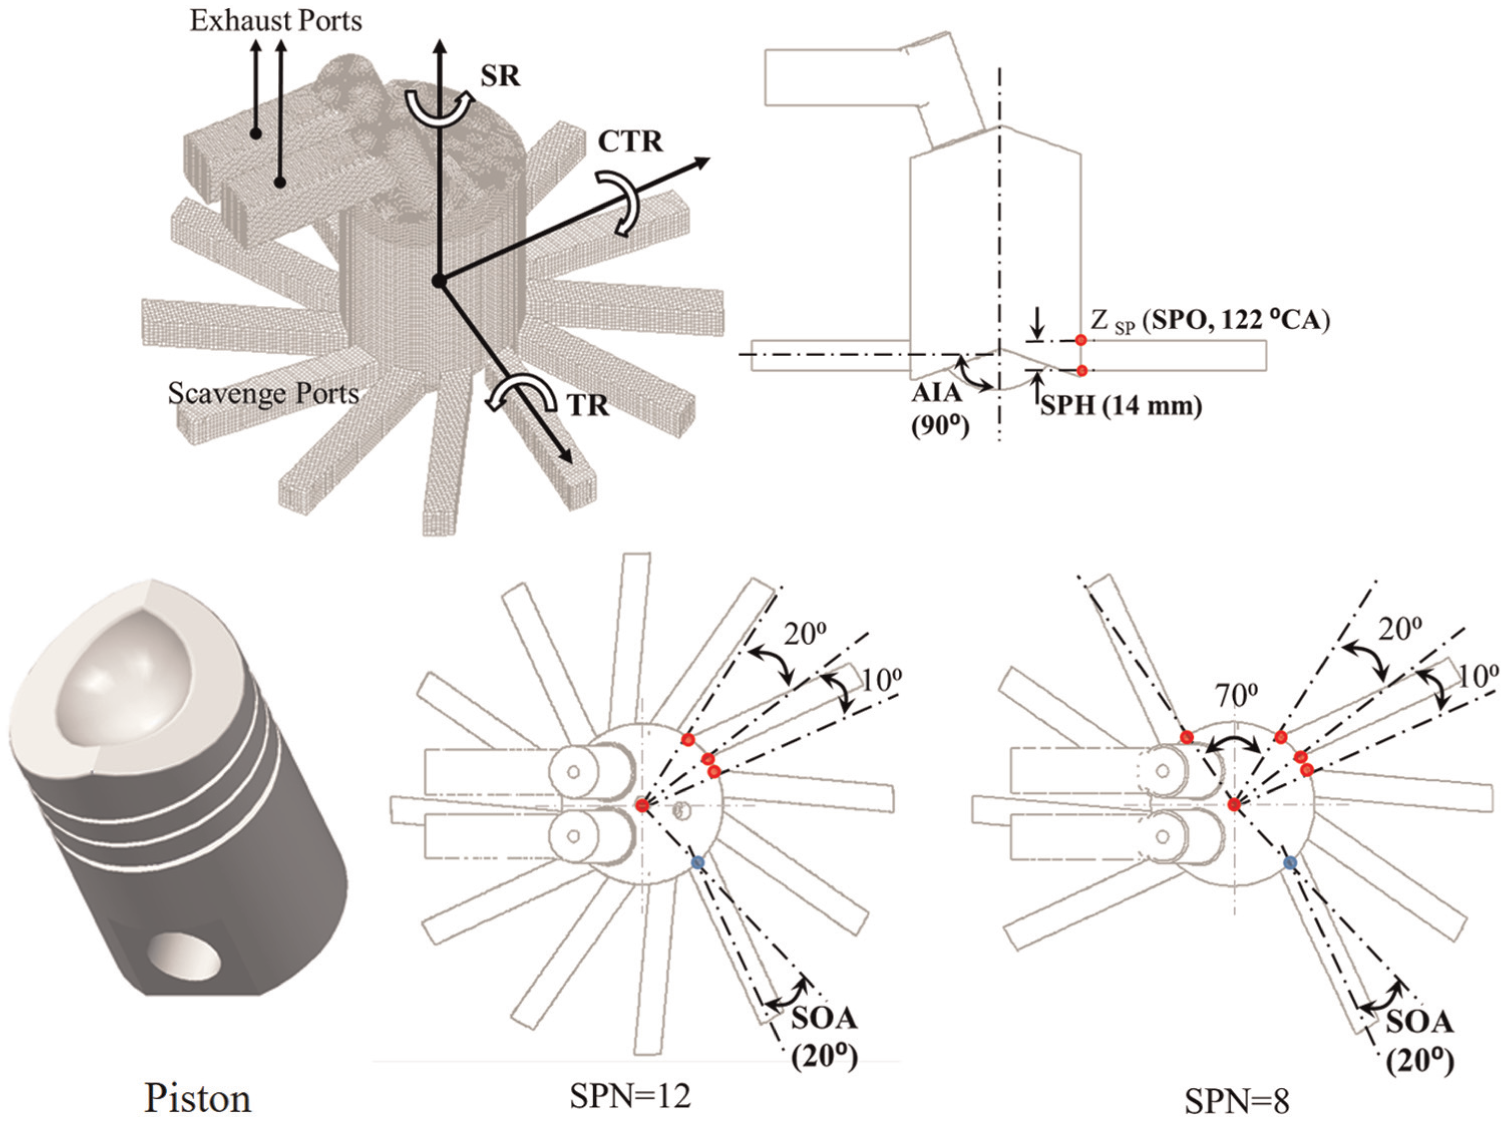
Schematic diagram of the BUSDIG engine design.
In total, 12 evenly distributed scavenge ports were integrated to the cylinder block to introduce the fresh charge and scavenge out the residual burnt gas. Each scavenge port occupies a 20° segment on the cylinder circumference, and the interval between two adjacent scavenge ports is fixed at 10°. An alternative design with the scavenge port number (SPN) reduced from 12 to 8 was also considered by removing the two scavenge ports on each side to avoid the interference of the scavenge ports on the adjacent cylinders, which maybe better suited for multi-cylinder engines.
Figure 1 also shows the design parameters of the scavenge port, including the axis inclination angle (AIA), swirl orientation angle (SOA), scavenge port opening (SPO) timing and scavenge port height (SPH). In this study, the AIA and SOA are fixed at 90° and 20°, respectively, the SPH at 14 mm and the SPO at 122 °CA, based on a previous study. 30 The exhaust valve duration (ED) and opening timing (EVO) are fixed at 126 °CA and 117 °CA after top dead center (ATDC), respectively. Figure 2 shows the normalized SPO area (SA′) profiles and normalized exhaust valve lift (EL′) profiles. The other engine specifications are shown in Table 1.
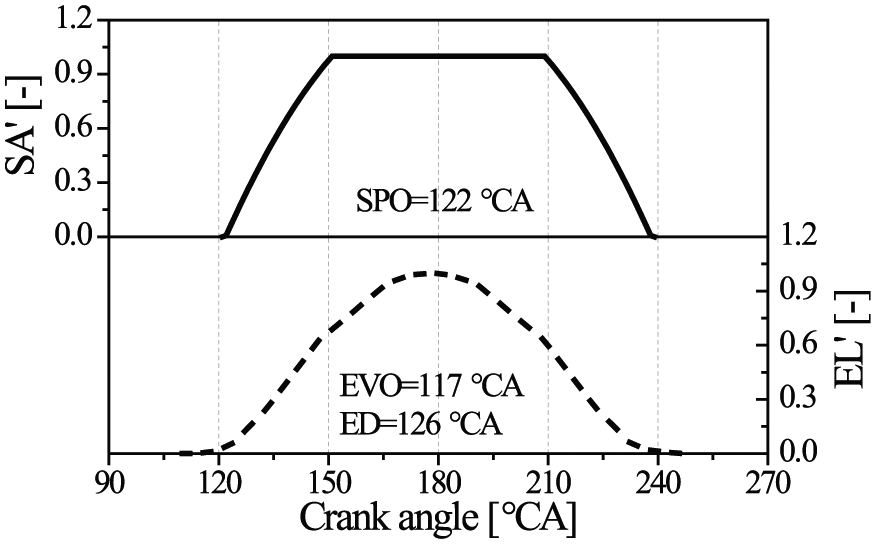
Schematic diagram of the normalized exhaust valve lift profiles (EL′) and scavenge port opening area (SA′) profiles.
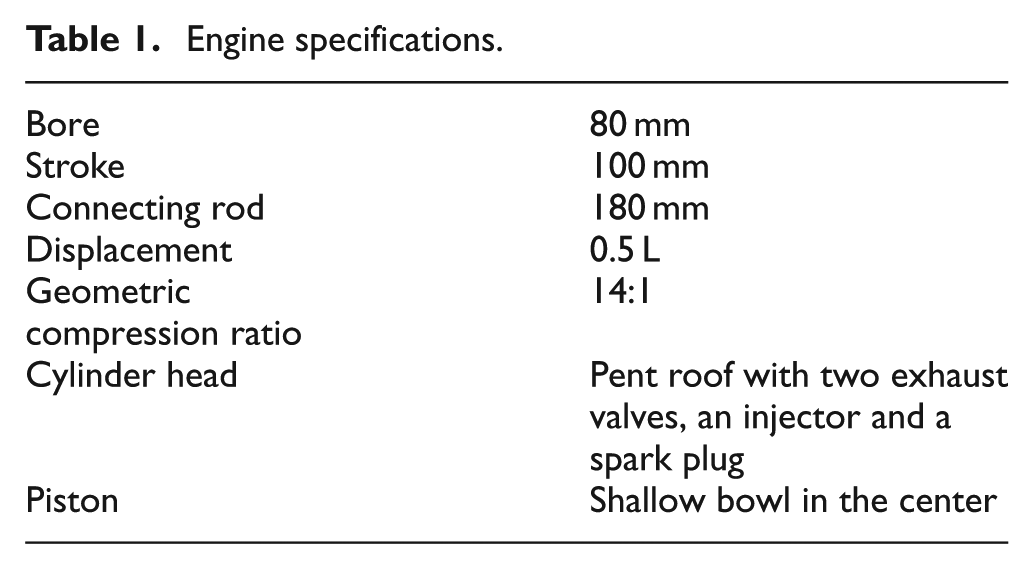
Engine specifications.
Numerical models and validation
In this study, the simulations were performed with the CFD software STAR-CD. 32 The Reynolds-averaged Navier–Stokes (RANS) approach was applied with renormalization group (RNG) k-ε turbulence model. The heat transfer was implemented through the general form of the enthalpy conservation equation for the fluid mixture. 33 Angelberger et al.’s 34 wall function was used for the simulation of the wall heat transfer. In order to depict the fuel spray process from the outward opening piezo injector, the nozzle was defined explicitly by setting the nozzle hole diameter, inner and outer cone angles. The initial droplet size distribution was determined by Rosin–Rammler equations, 35 and the model constants X and q are fixed at 0.18 mm and 3.5, respectively. The droplet break-up process was depicted by the Reitz–Diwakar break-up model. 36 The empirical coefficient and the associated characteristic time for bag break-up are 8.4 and π, respectively. The empirical coefficient and the associated characteristic time for stripping break-up are 0.5 and 15, respectively. O’Rourke’s model 32 and Bai and Gosman’s 37 model were adopted to consider the inter-droplet collision and wall impingement, respectively. The above numerical models are summarized in Table 2.
Numerical models.
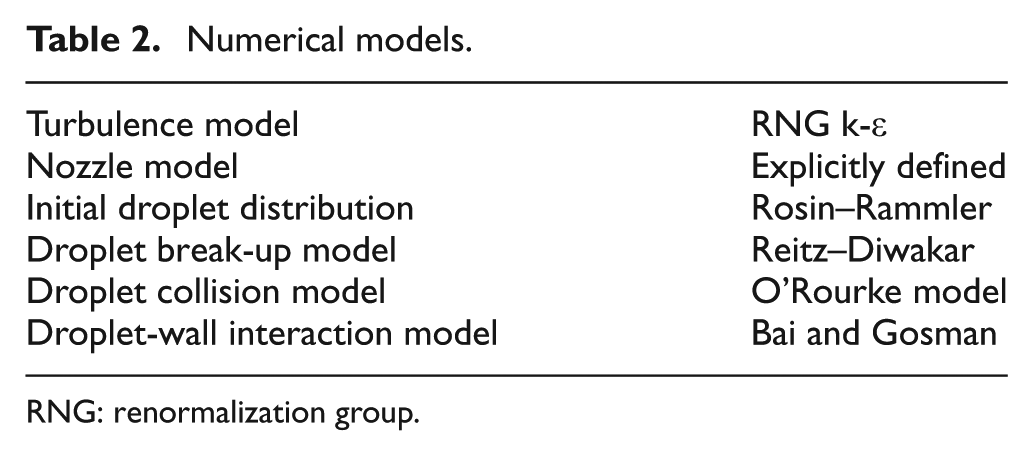
RNG: renormalization group.
The pressure-implicit with splitting of operators (PISO) algorithm was used to solve the equations. The equations of momentum, TKE and turbulence dissipation were discretized with the monotone advection and reconstruction scheme (MARS). The upwind differencing (UD) scheme and central differencing (CD) scheme were applied to discretize the temperature and density equations, respectively. The residual tolerance for the momentum, TKE and turbulence dissipation was set at 0.001 while the residual tolerance for pressure and temperature was set at 0.0001 to achieve good compromise between convergence and computational time.
The gasoline fuel injection and spray formation model was checked and validated by the spray measurement in a constant volume vessel. The injection pressure and fuel temperature were 180 bar and 293 K, respectively. The background temperature was fixed at 293 K, and two background pressures (i.e. 1 and 10 bar) were measured and validated. A fine mesh of the constant volume vessel with the average grid size of 1 mm was used according to the mesh sensitivity study. The time step in the simulation was fixed at 0.0025 ms. The constants of the spray models were adjusted to fit with the experimental results and then kept at the same values in the simulations. Figures 3 and 4 compare the spray plume from optical measurements and simulation results with both droplets and fuel vapor distributions at background pressures of 1 and 10 bar, respectively. For the CFD simulation results in Figures 3 and 4, the diameter of the droplets displayed in the figures ranges from 0 to 0.3 mm, and the fuel vapor concentration ranges from 0% to 5%. The global Sauter mean diameter (SMD) calculated from the CFD results is provided accordingly in Figures 3 and 4. As shown in Figure 5, a good agreement was achieved between the measured and calculated spray tip penetrations under both background pressures.
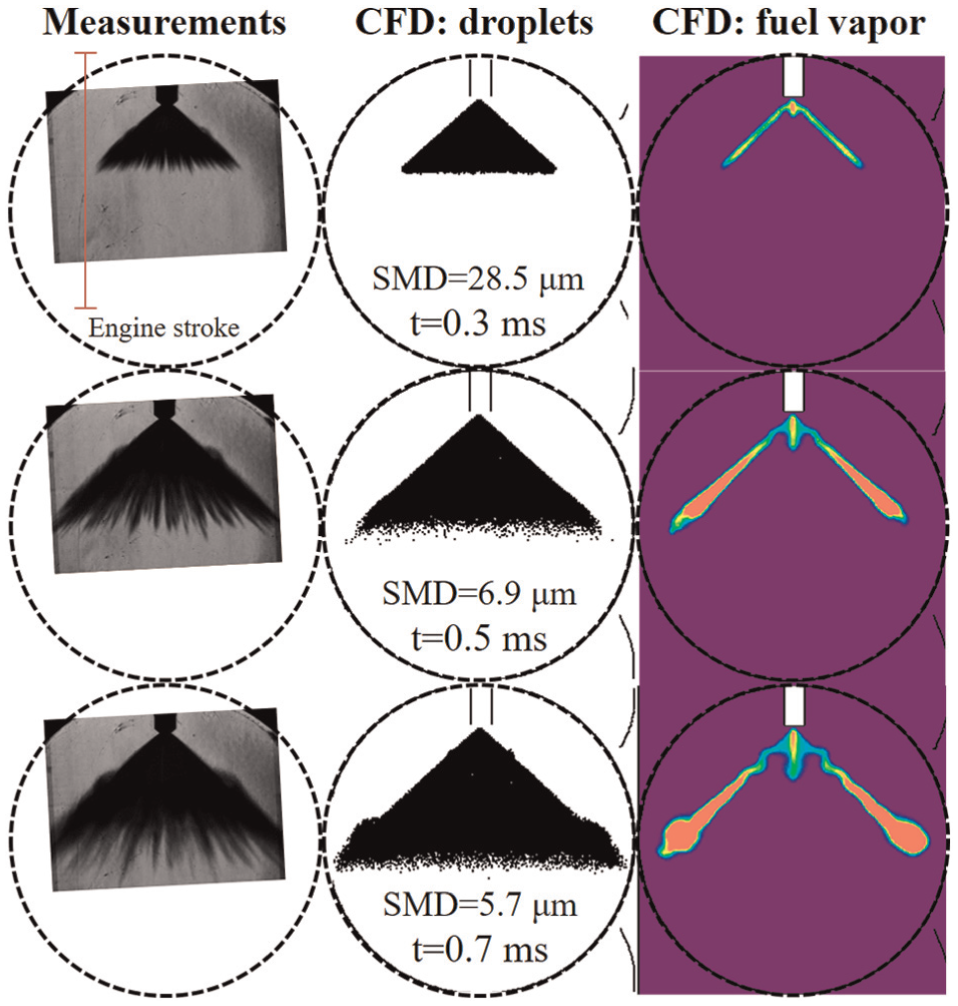
Comparison of injection plume from the Schlieren measurements and simulation results with both droplets and fuel vapor distributions at the background pressure of 1 bar.
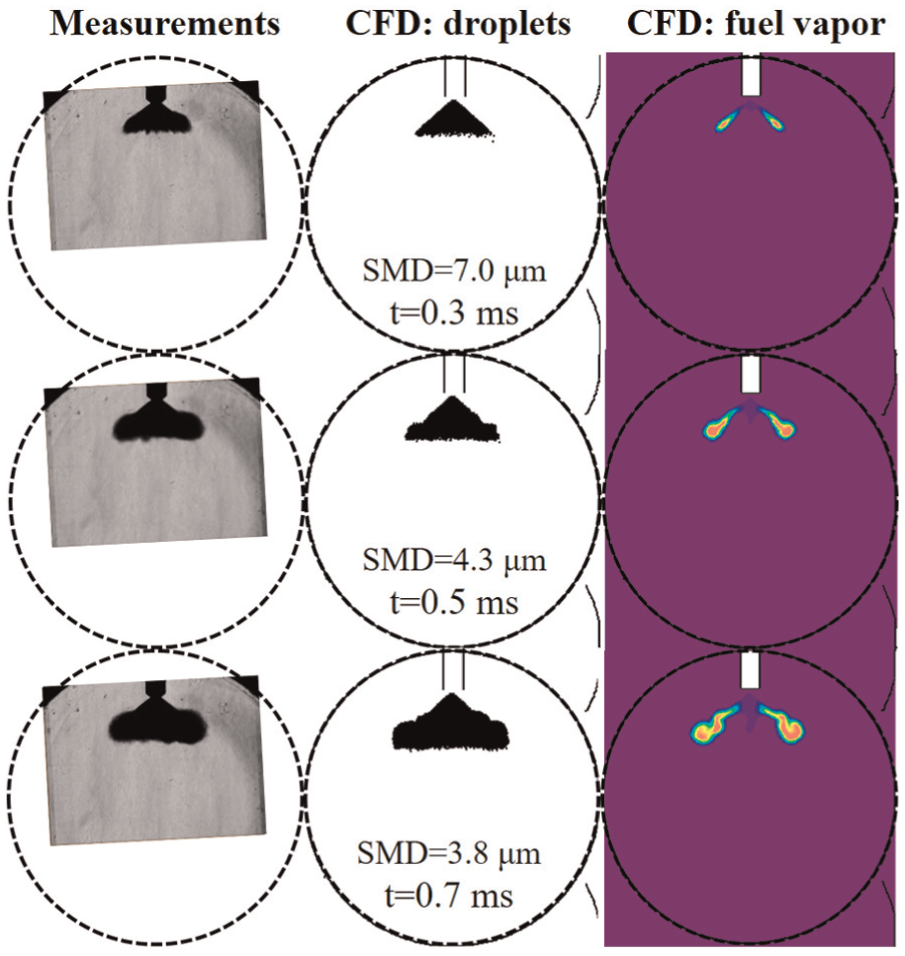
Comparison of injection plume from the Schlieren measurements and simulation results with both droplets and fuel vapor distributions at the background pressure of 10 bar.
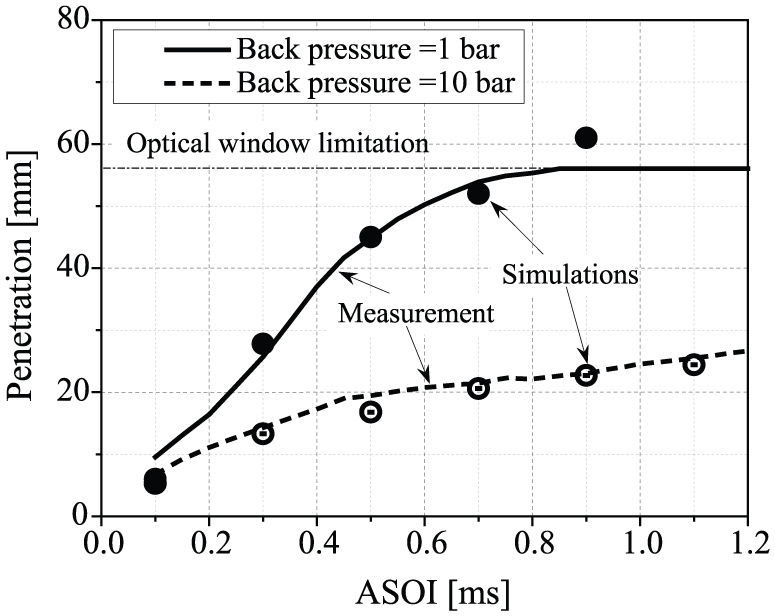
Comparison of the tip penetration from the Schlieren measurements and simulations at background pressures of 1 and 10 bar.
Simulation conditions
The one-dimensional (1D) simulations were performed using 1D engine simulation program WAVE to obtain the realistic fired engine conditions for the CFD simulations of the scavenging process in the BUSDIG engine. The initial and boundary conditions in CFD simulations are shown in Table 3. The initial mixture components in the cylinder and exhaust ports at 100 °CA ATDC are burned gases comprising CO2, H2O and N2. The mixture components in the scavenge ports and inlet boundary are air (O2 and N2). The CFD simulations were performed from 100 ° to 360 °CA ATDC, which covers the whole period of the scavenging, injection and mixing process. The combustion process was not modeled in this work. The intake pressure was adjusted for different SPN designs to ensure the same in-cylinder fresh charge mass, as well as the same overall fuel–air ER with the fixed fueling mass.
Simulation conditions.
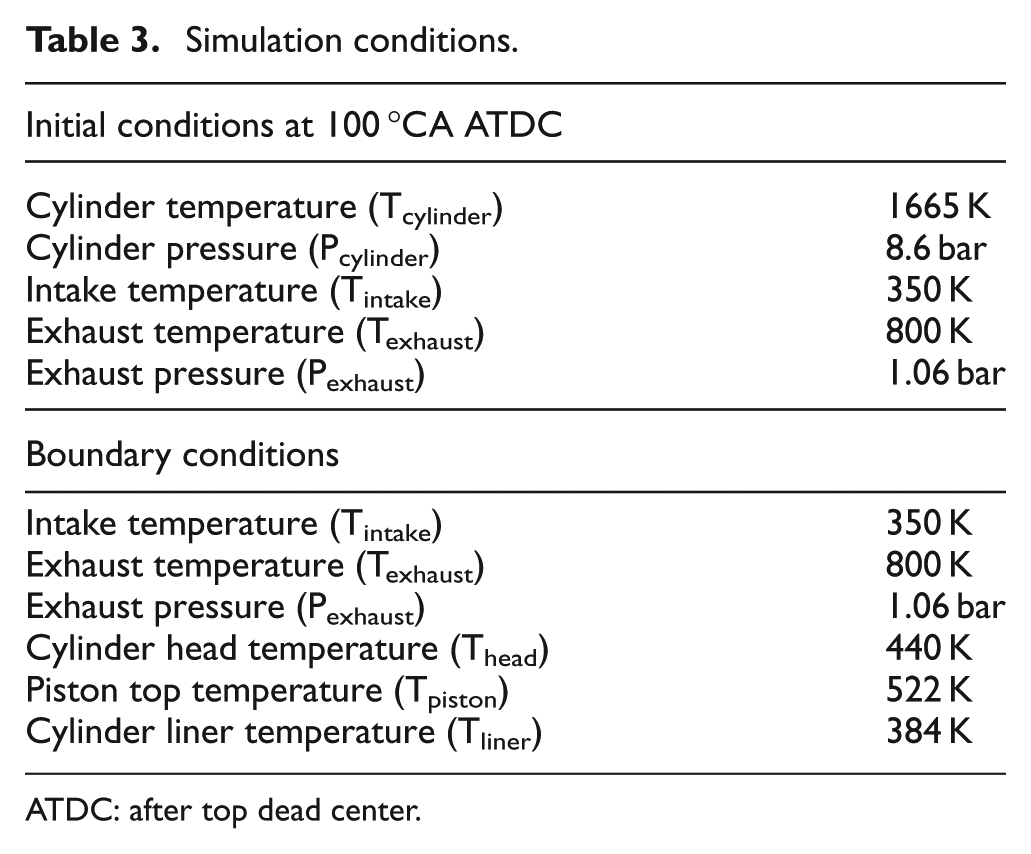
ATDC: after top dead center.
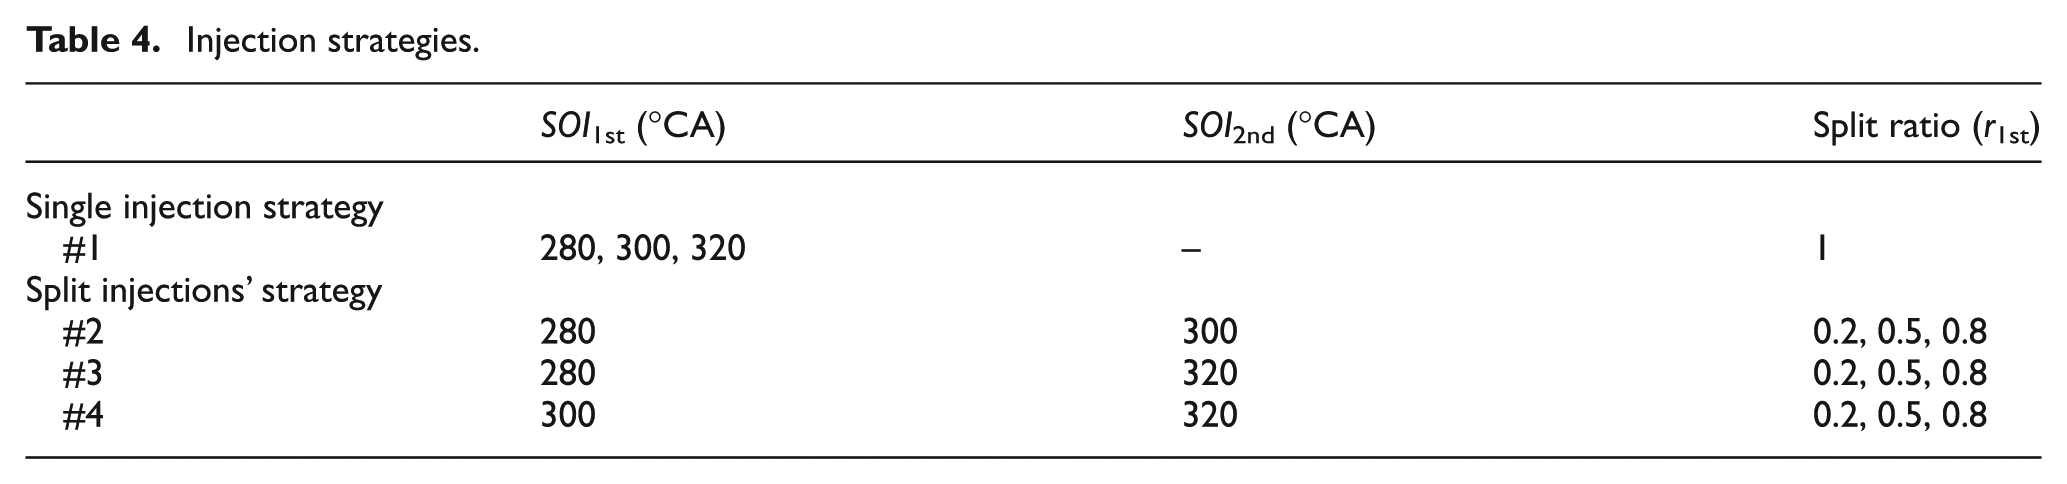
In this study, two injection strategies, that is, the single injection and split injections, were investigated in the BUSDIG engine with both 8 scavenge ports and 12 evenly distributed scavenge ports. Three SOI timings, which have been marked as the first SOI timing (SOI1st) in Table 4, were applied for the single injection strategy. For the split injections’ strategy, three combinations of the first SOI timing (SOI1st) and second SOI timing (SOI2nd) were applied with different split ratios, as shown in Table 4. The split ratio (r1st) in this study is defined as the ratio of the fuel mass from the first injection to the total injected fuel mass. The total fueling mass in each simulation is fixed at 32.8 mg/cycle. The engine speed was fixed at 2000 r/min for all the simulations. The duration of each injection was fixed at 17.4 °CA and the peak mass flow rate of the injected fuel was proportionally adjusted according to the total fuel mass of each injection. The intake pressure is slightly adjusted around 2 bar (absolute) to ensure the same overall fuel–air ER of 0.6. The in-cylinder backpressures at SOI timings of 280 °CA, 300 °CA and 320 °CA are around 4.2, 7.1 and 14.7 bar, respectively, for the baseline cases without injection.
Injection strategies.
The engine mesh was generated in ES-ICE software, and several cylinder cell layers of the moving mesh were automatically deleted/added during the compression/expansion stroke. The arbitrary sliding interface (ASI) was applied between the scavenge ports and the cylinder liner to control the attachment and detachment with the piston movement. ASI was also applied to control the connectivity between exhaust domains and cylinder domain with the movement of exhaust valves. The sensitivity study on the mesh quality showed that an average grid size of 1.6 mm was sufficient to achieve a convergent result regarding in-cylinder pressure, temperature profiles and flow motions. 30 However, in order to ensure the accurate prediction of the spray process, a finer engine mesh with 1 mm average grid was finally used in this study. The angular time step in the simulations was fixed at 0.1 °CA before the injection and reduced to 0.05 °CA afterward to ensure the accuracy.
Results and discussion
In sections “Effect of SOI timing with the single injection strategy” and “Effect of SOI timing and split ratio with the split injection,” the effects of different injection strategies on the in-cylinder charge preparation with 12 evenly distributed ports’ design are presented and discussed. Then, the impacts of the initial in-cylinder flow motions, enabled by an eight scavenge ports’ design, on the charge preparation are reported in section “Effect of initial in-cylinder flow motion.”
Effect of SOI timing with the single injection strategy
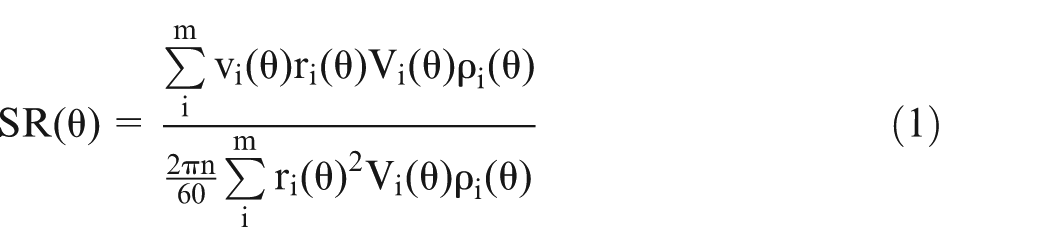
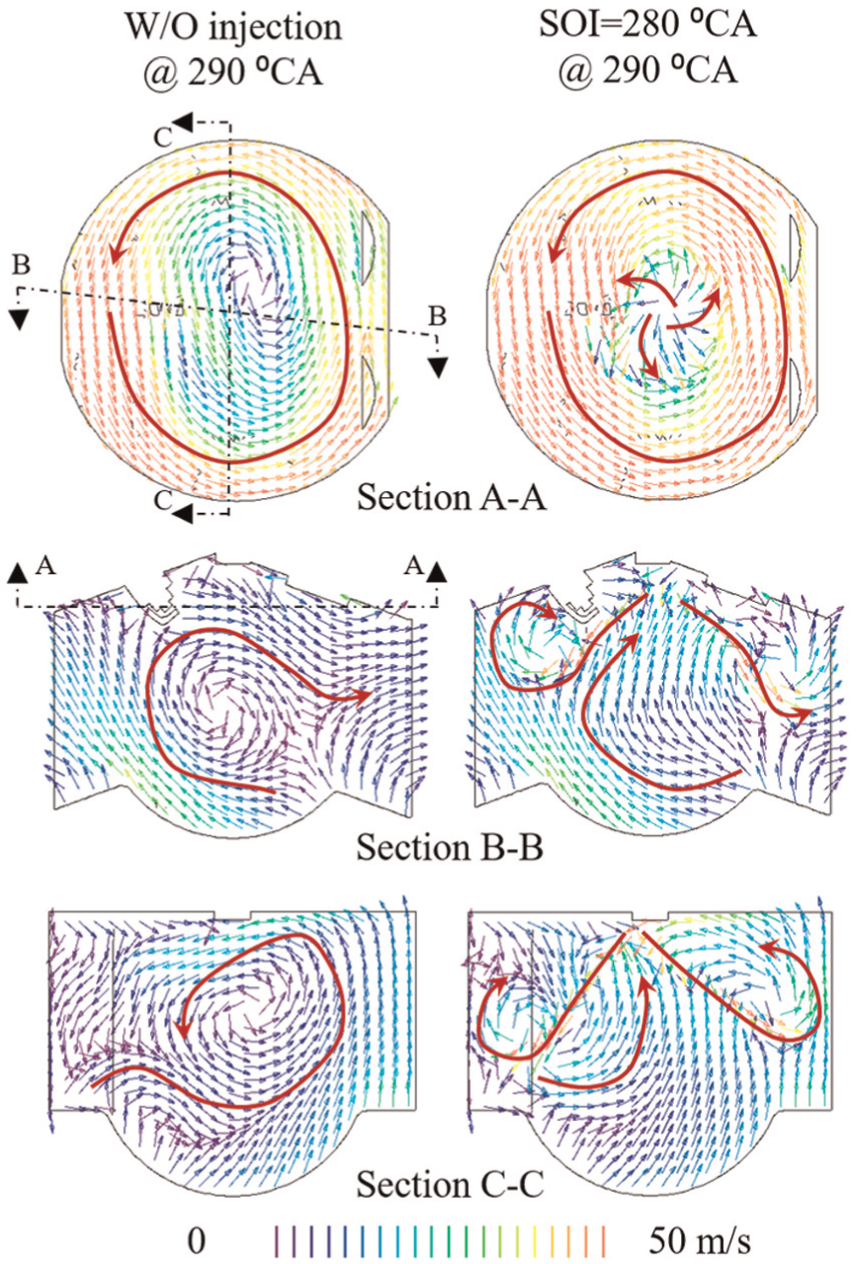
The in-cylinder large-scale flow motions are analyzed at first in order to understand the interaction between the injection and in-cylinder flow motions in the BUSDIG engine with 12 ports’ design. The swirl ratio (SR) is defined by the following equation 38
where n is the engine speed (r/min),
Similarly, the tumble ratio (TR) and cross tumble ratio (CTR) are calculated by replacing the Z-axis in equation (1) by the X- and Y-axis, respectively, as illustrated in Figure 1.
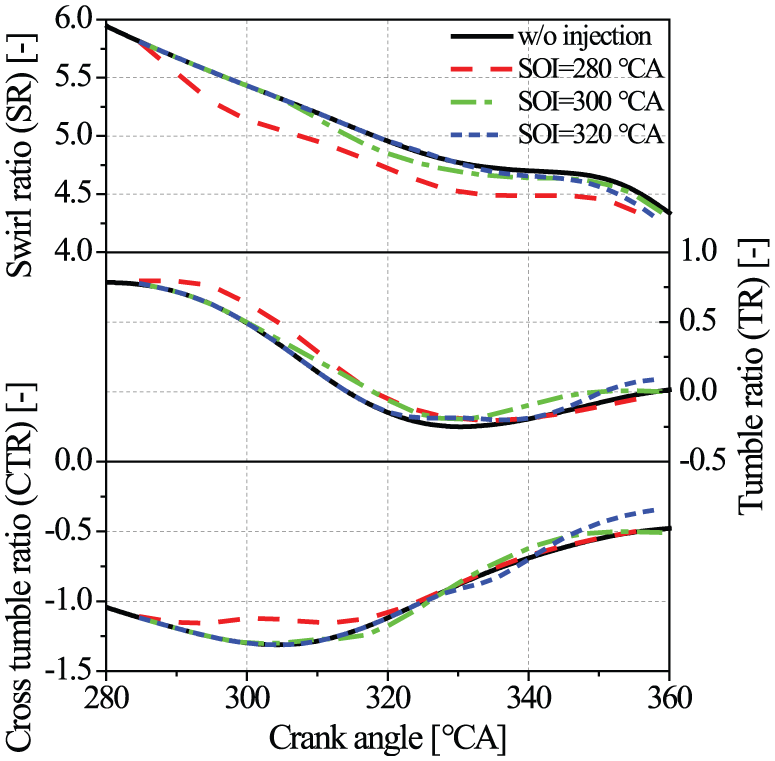
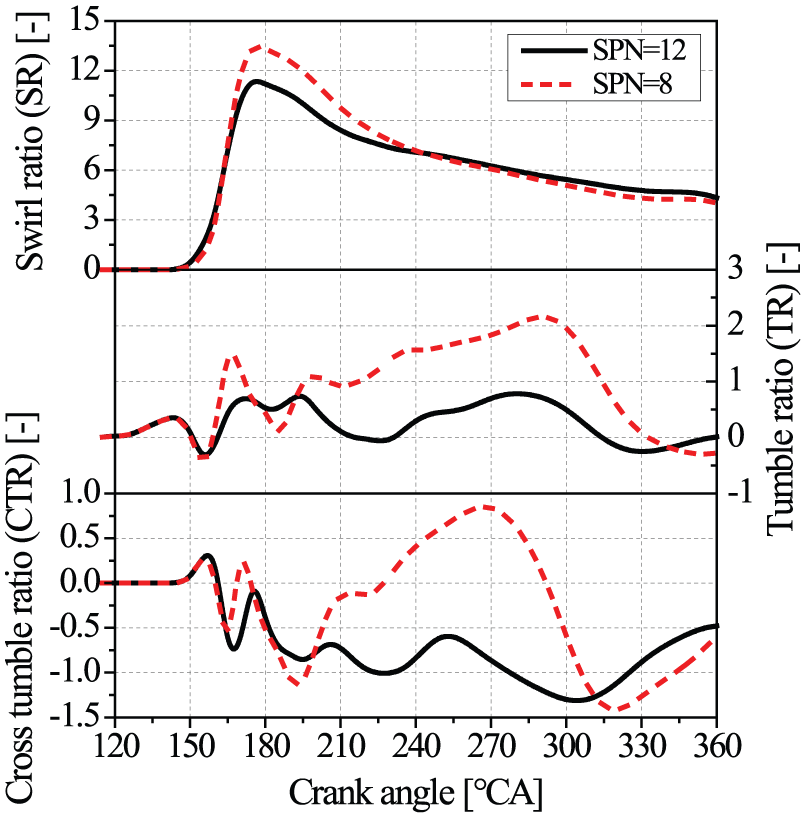
Figure 6 shows the evolutions of the SR, TR and CTR with different SOI timings of the single injection. The angled scavenge ports in BUSDIG engine produce strong swirl flow motions, as shown in Figure 6. The lower piston top edge at the exhaust side leads to slightly earlier intake flow at the exhaust side and drives the in-cylinder tumble flow motion. The position of the two exhaust valves at one side of the cylinder head would also contribute to the formation of the tumble flow motion. The evolution of the cross tumble flow motion is mainly driven by the evolution of both swirl flow motion and tumble flow motions. It is noted that the deviations from the baseline case (w/o injection) are observed after the injections, which indicate the impact of injections on the in-cylinder flow motions. Compared to the flow without injection, the high-pressure fuel injection reduces the SR but slightly enhances the vertical flow field in the central region just below the spray umbrella, as indicated by the section B-B in Figure 7, resulting in slightly higher TR. However, the enhanced vertical flow in the central region minimizes the cross tumble flow motion in section C-C and leads to a slight decrease in CTR. As the SOI timing is delayed, the impacts on the in-cylinder flow motions become weaker, as shown in Figure 6.
Evolutions of SR, TR and CTR with different SOI timings of the single injection.
In-cylinder flow fields at 290 °CA without injection and SOI timing of 280 °CA.
Figure 8 compares the in-cylinder fuel–air ER and injected fuel droplets’ distributions with different SOI timings. The earliest SOI timing of 280 °CA shows longer fuel penetration, as shown in Figure 8, due to the lower in-cylinder back pressure during the injection. As a result, the fuel is directly sprayed to the outer region and the recirculation region missed the spark plug. Meanwhile, the piston bowl shows no impact on guiding the fuel to the spark plug. As the SOI timing is retarded to 300 °CA, the recirculation region is just located around the spark plug due to the reduced penetration, resulting in the desired enrichment of the charge around the spark plug. The fuel stratification is also facilitated by the piston bowl shape when the SOI timing is set to 320 °CA, as shown in Figure 8.
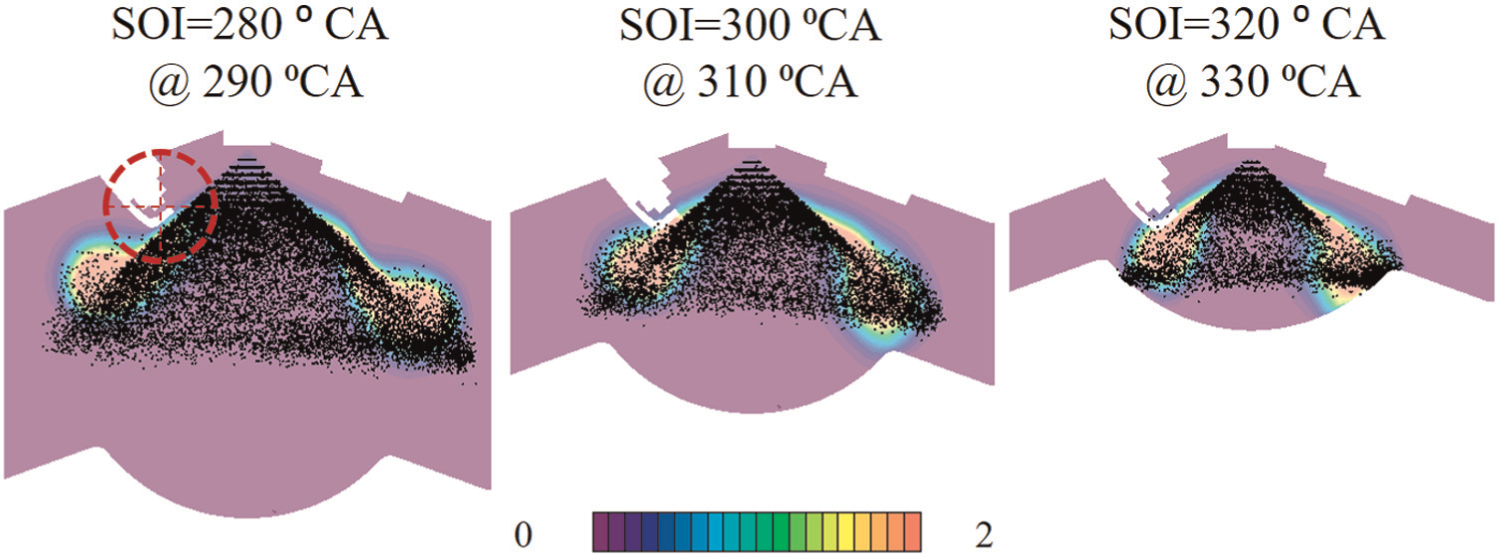
In-cylinder fuel–air equivalence ratio (ER) and fuel droplets’ distributions with different SOI timings at 10 °CA after SOI.
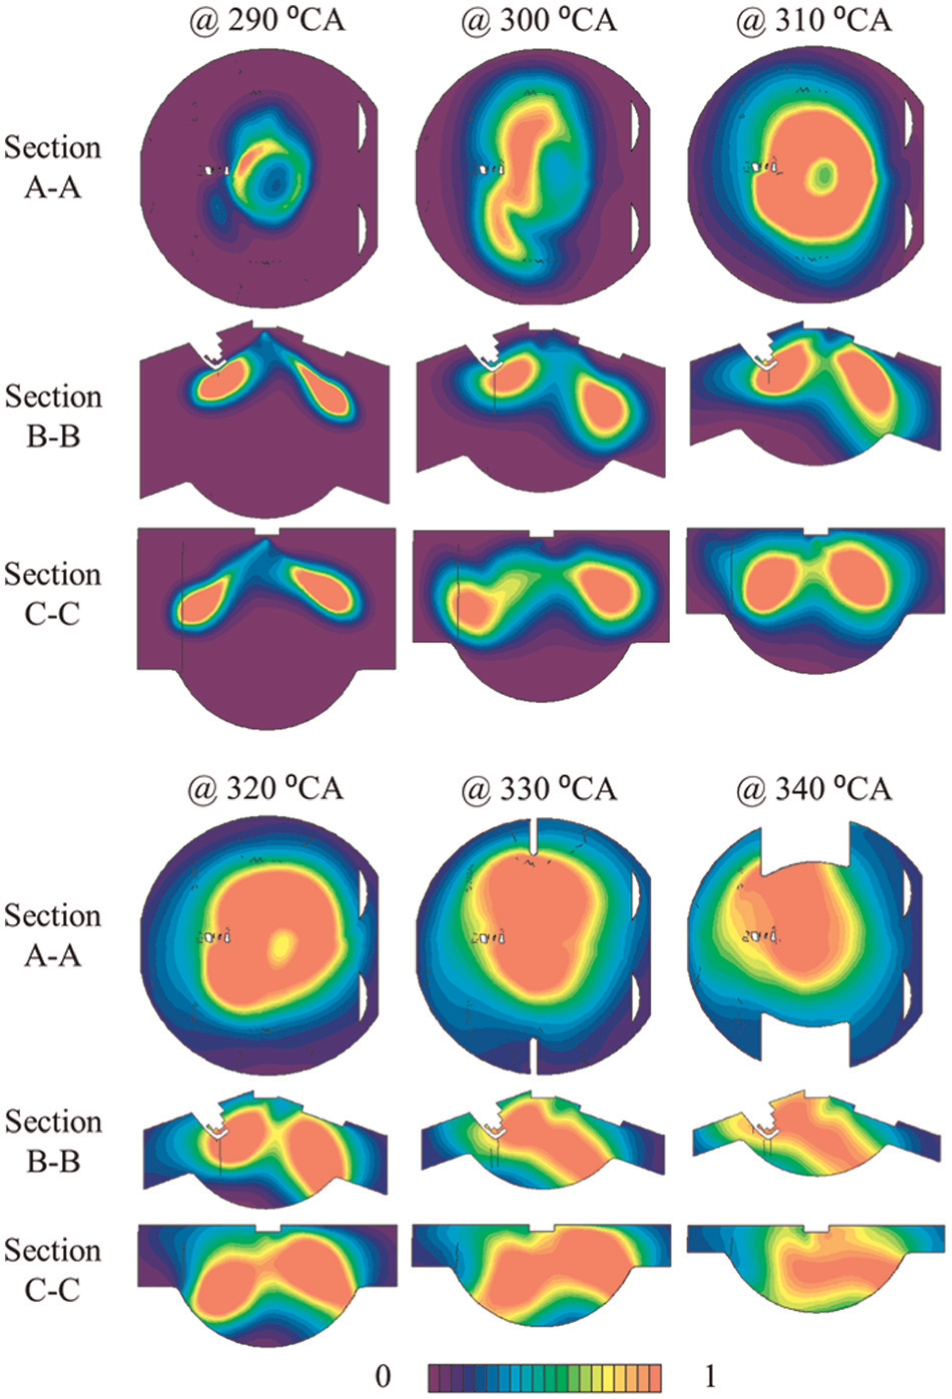
Figure 9 shows the evolutions of the in-cylinder fuel–air ER distributions to demonstrate the fuel stratification in the BUSDIG engine with SOI timing of 300 °CA. At 10 °CA after the injection, the fuel distribution is characterized with a uniform torus shape in the A-A section. The fuel-rich region gradually moves upward in A-A section at the end of the injection (320 °CA) and form a fuel-rich region due to the strong cross tumble flow motion shown in C-C section. This fuel-rich region is then transported anticlockwise under the impact of the swirl flow motion, as shown in A-A section views. The evolutions of the fuel–air ER distributions, as shown in the section views in Figure 9, demonstrate the strong impacts of in-cylinder swirl, tumble and cross tumble flow motions on controlling the transportation of the fuel-rich mixture.
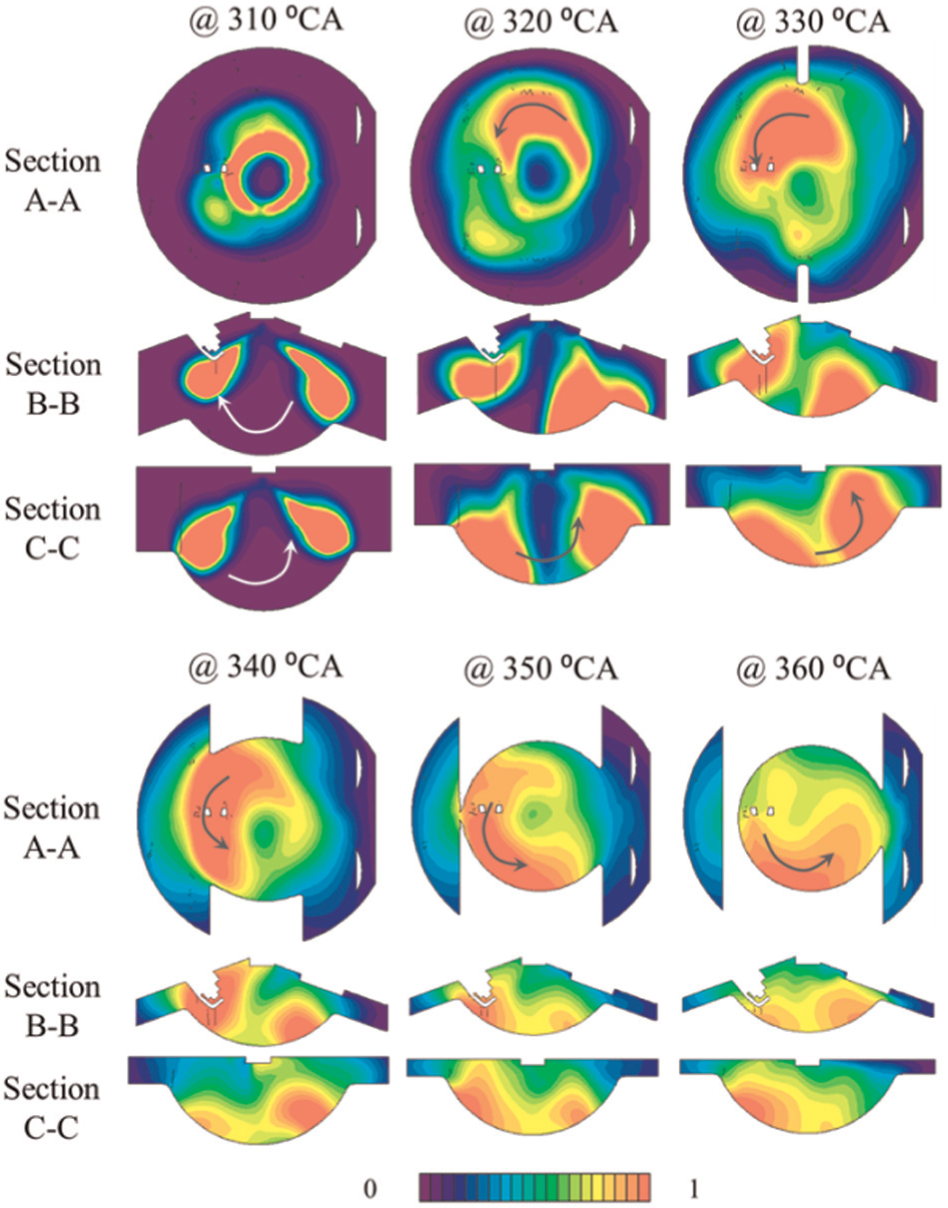
Evolutions of the in-cylinder fuel–air equivalence ratio (ER) distributions with SOI timing of 300 °CA.
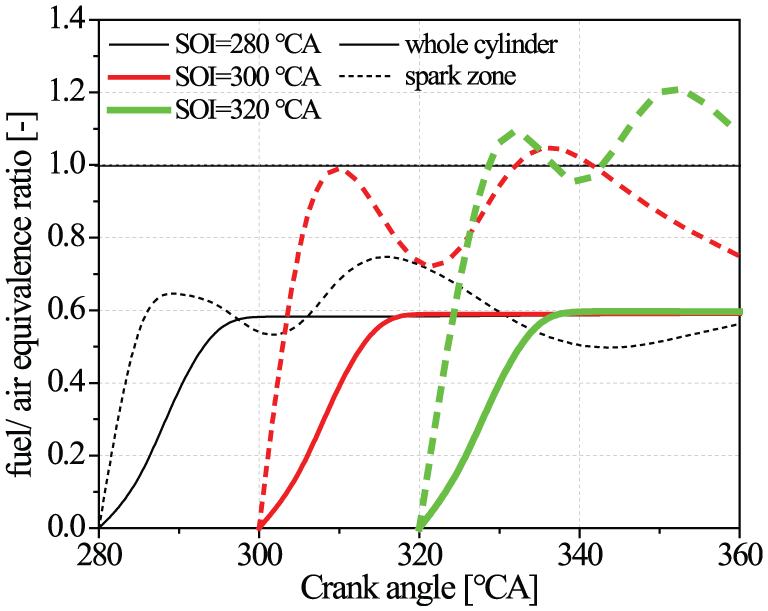
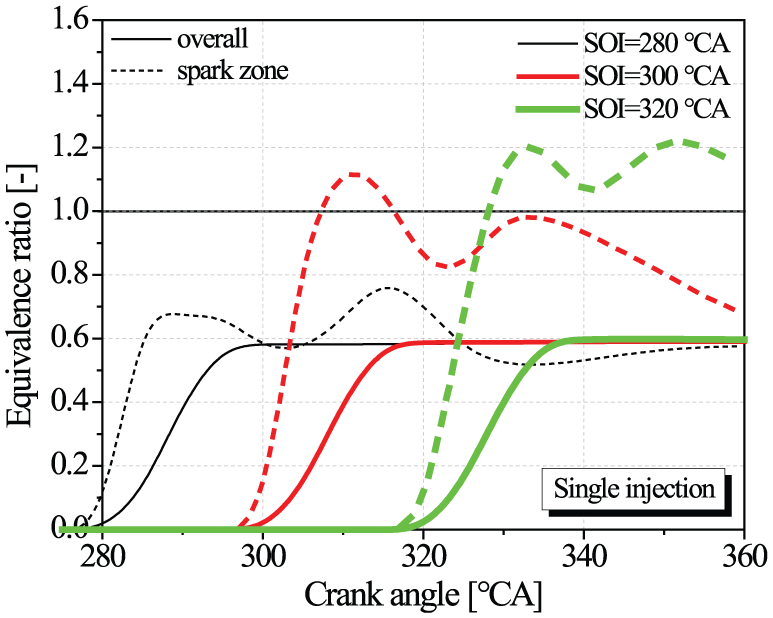
Figure 10 shows the temporal changes in the averaged fuel–air ER in the whole cylinder and spark zone for different SOI timings. The spark zone is defined as a sphere with the center at the spark plug gap and 20 mm in diameter, as marked by the red circle in Figure 8. The earliest SOI timing at 280 °CA leads to the leanest mixture around the spark plug with the peak ER value around 0.75. As the SOI timing is delayed to 300 °CA, the peak ER value in the spark zone increases to 1.05. The latest SOI timing of 320 °CA produces the highest peak average ER in the spark zone around 1.2.
The average fuel–air equivalence ratio (ER) of the mixture in the whole cylinder and spark zone with different SOI timings of single injection.
It is noted in Figure 10 that there are two peak values of the average ER in the spark zone for all three SOI timings. The first peak is produced just after the injection when the fuel jet passes the spark plug. At the delayed SOI timing, the first ER peak value is higher and it is caused by the fuel recirculation region near the spark plug, as shown in Figure 8. The second peak in the ER is mainly caused by the transportation of the fuel-rich region by the swirling flow, as shown in Figure 9. The above results demonstrate that the in-cylinder flow motions have significant impacts on the ER distributions.
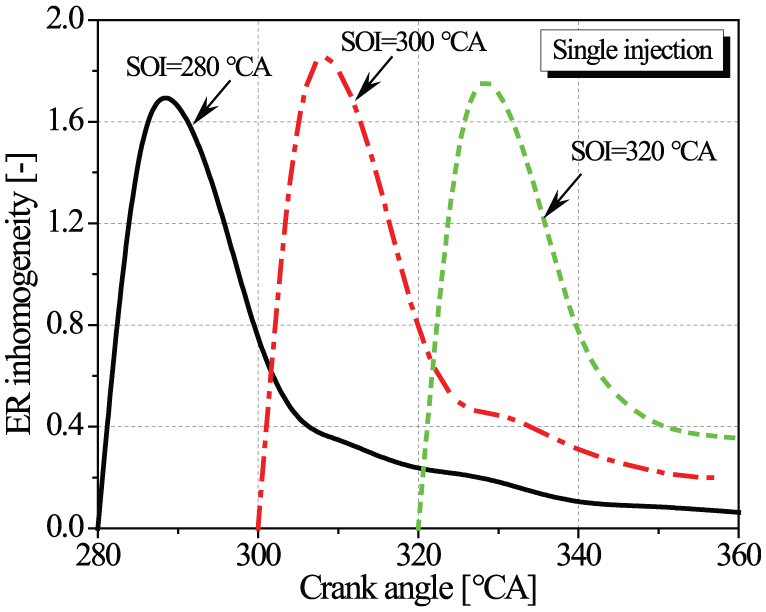
The inhomogeneity of fuel–air ER in the spark zone, which is defined as the standard deviation of ER for the cells in the spark zone, increases to its peak value right after the injection and gradually reduces afterward as shown in Figure 11. Overall, the delayed SOI timing leads to slightly higher inhomogeneity of ER around TDC. Figure 12 compares the average TKE of the mixture in the spark zone with different SOI timings. The TKE in the spark zone is significantly increased when the fuel spray travels across the spark zone and gradually decreases afterward. As the SOI timing delays, the peak TKE value in the spark zone gradually decreases, but the TKE decays more slowly after the peak value, which, in turn, results in higher TKE around TDC. A higher TKE in the spark zone caused by the late injection would stabilize the spark ignition and enhance the subsequent flame propagation. 15
The inhomogeneity of the fuel–air equivalence ratio (ER) of the mixture in the spark zone with different SOI timings of single injection.
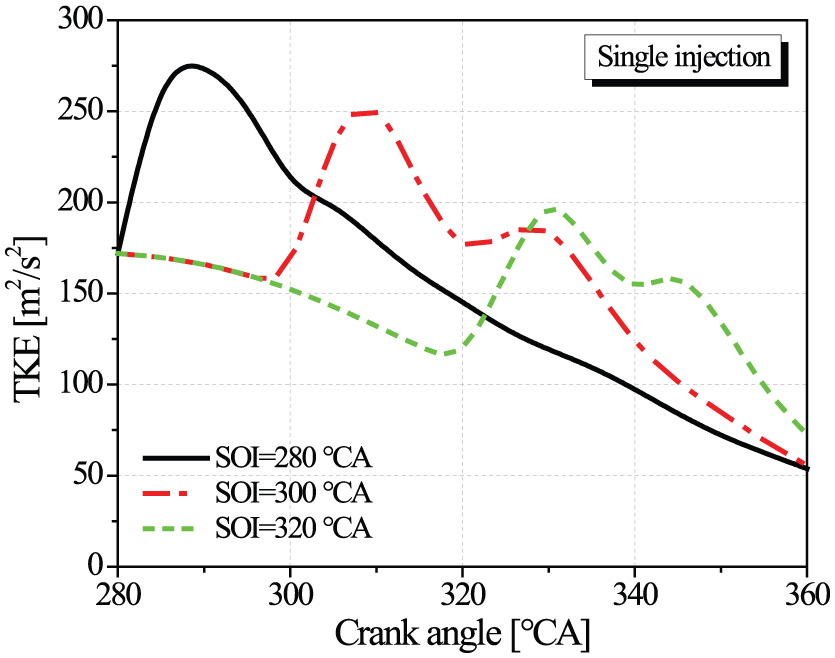
Effect of the SOI timing on the average turbulent kinetic energy (TKE) of the mixture in the spark zone with single injection.
Effect of SOI timing and split ratio with the split injection
Compared to the single injection, the impact of split injections on the in-cylinder flow motions is much less and hence it is not shown here. But the split injection strategy has greater effect on the fuel stratification as shown in Figure 13. The split ratio (r1st) is fixed at 0.5. The reduced penetration due to less fueling mass for the first injection at 280 °CA of the split injection places the recirculation region around the spark plug and, in turn, leads to better fuel enrichment just after the injection than that in the single injection at 280 °CA. With the help of the first injection at 280 °CA, the second injection at 300 °CA leads to significant enrichment of the charge around the spark plug. As the second injection delays to 320 °CA, the reduced penetration leads to less enrichment.
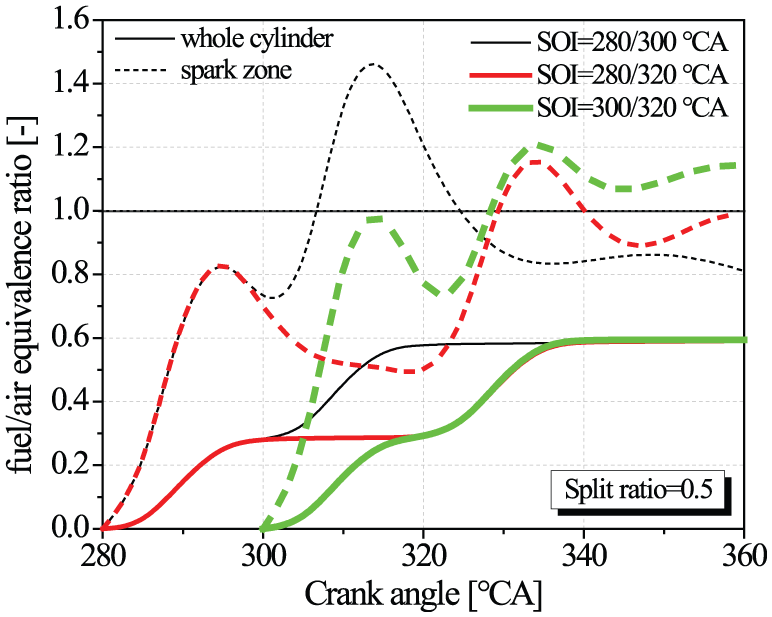
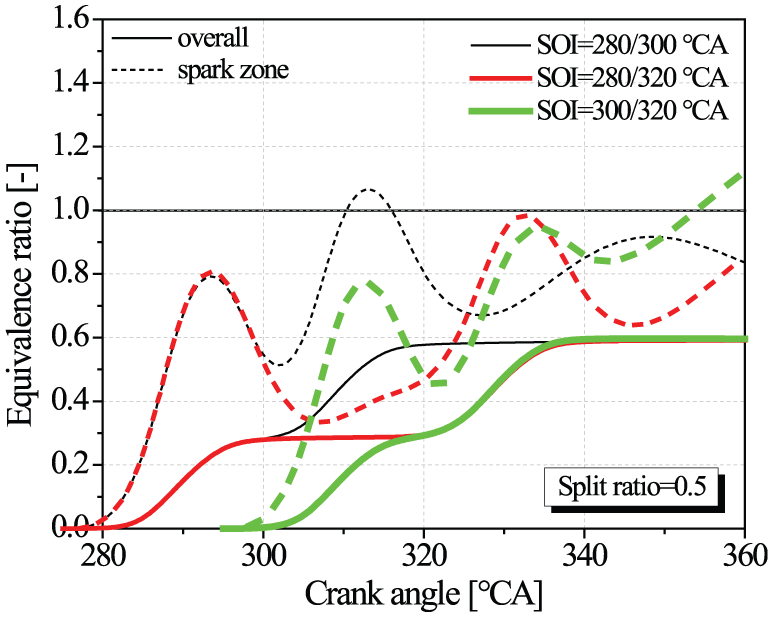
The average fuel–air equivalence ratio (ER) of the mixture in the whole cylinder and spark zone with different SOI timings (r1st = 0.5).
As the first injection moves from 280 °CA to 300 °CA, it leads to more mixture enrichment in the spark zone. With the most retarded split injections of 300 °CA/320 °CA, the fuel–air ER around the spark plug can be maintained around 1.1 until after TDC.
In order to explain the improved enrichment by the split injection, the in-cylinder fuel–air ER distributions with SOI timings at 280 °CA/300 °CA are shown in Figure 14. It is noted that the enriched mixture from the first injection is significantly stretched by in-cylinder flow motions at 300 °CA. In comparison, the enriched mixture from the second injection is much more stable in the cylinder center and gradually expands outward, which, in turn, leads to better enrichment of the charge around the spark plug.
The fuel–air equivalence ratio distributions with split injection (r1st = 0.5, SOI = 280 °CA/300 °CA).
In order to understand the interaction between fuel injections and in-cylinder flow motions and its impact on controlling the fuel–air ER distributions, Figure 15 shows the cross-sectional views of the flow fields with the split injections and single injection, respectively. For the split injections, the first injection at 280 °CA interacts with the initial in-cylinder large-scale flow motions, and the fuel distributions after the first injection are significantly affected by the initial in-cylinder flow motions, as shown in Figure 14. Meanwhile, it is noted that the first injection also creates a chaotic flow fields in the cylinder center, as shown by the section views at 290 °CA and 300 °CA in Figure 15. The interaction of the first injection and the in-cylinder large-scale tumble flow motion produce an upward flow just beneath the injector, as shown in B-B and C-C sections. This upward flow motion counteracts with the downward flow induced by the subsequent second injection and produces relatively weaker flow fields after the second injection, which stabilize the fuel distribution in the cylinder center and enrich the mixture around the spark plug.
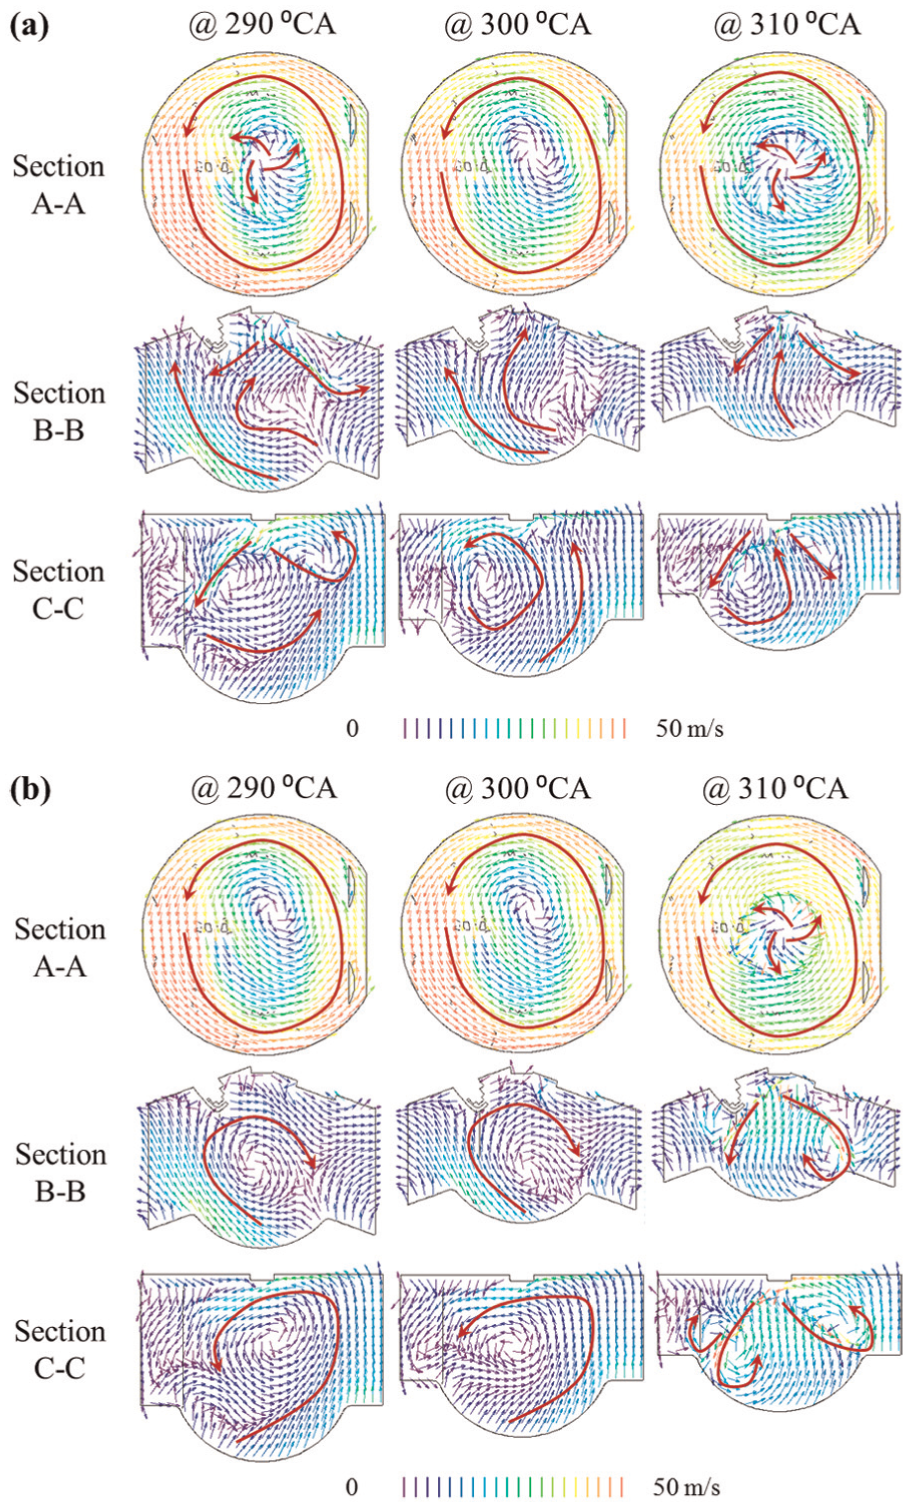
The in-cylinder flow fields with (a) split injections (r1st = 0.5, SOI = 280 °CA/300 °CA) and (b) single injection (SOI = 300 °CA).
In comparison, for the single injection, the in-cylinder flow structures are well organized before the injection and show significant impact on the transportation of the fuel droplets and vapor after the injection. Most importantly, the comparison of the flow fields at 310 °CA between single injection and split injection indicates that the single injection itself produces stronger flow motions in the cylinder center due to more fuel mass and affects the subsequent transportation of the fuel–air mixture.
Figure 16 shows the inhomogeneity of fuel–air ER in the spark zone with different injection timings. The ER inhomogeneity increases after each pulse of injection, and a later second injection leads to a higher ER inhomogeneity. The latest split injection with SOI timings at 300 °CA/320 °CA shows relatively better charge stratification with ER inhomogeneity below 0.8 and average ER in the spark zone around 1.1 after 340 °CA.
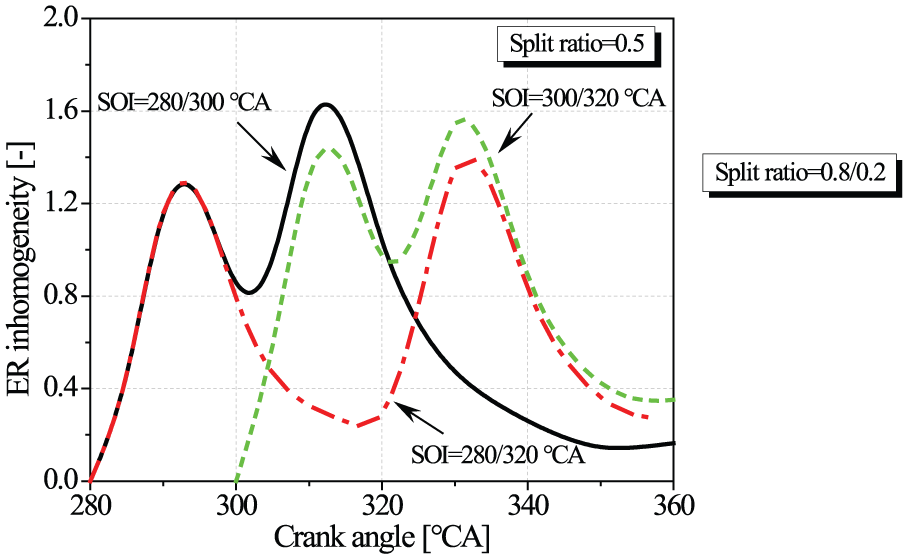
Effect of SOI timings on the inhomogeneity of the fuel–air equivalence ratio (ER) of the mixture in the spark zone with split injection (r1st = 0.5).
Compared to the single injection, the split injection shows less impact on the TKE around the spark plug, as shown in Figure 17. The TKE level around the TDC is slightly higher for the later second injection timing at 320 °CA but still lower than that with single injections.
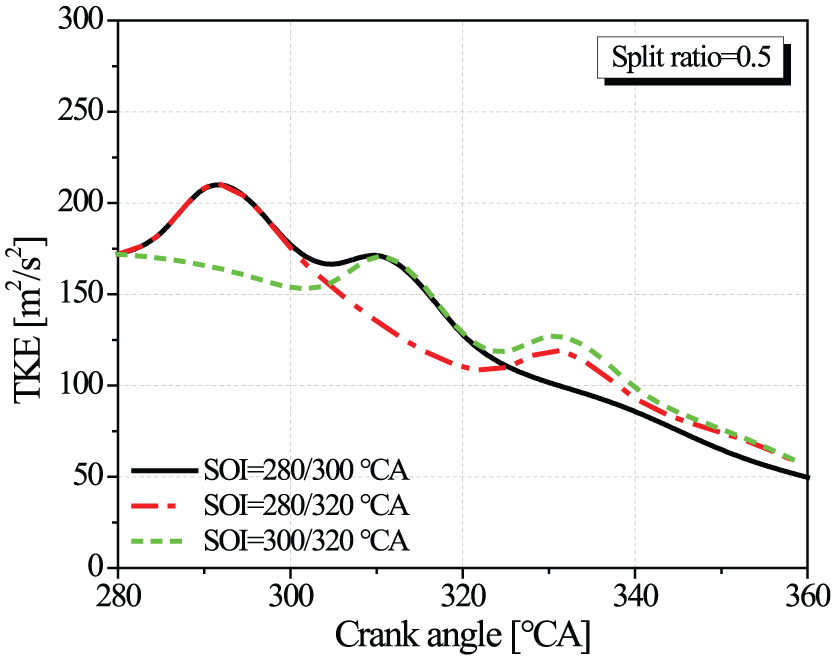
Effect of the SOI timing on the average turbulent kinetic energy (TKE) of the mixture in the spark zone with split injection (r1st = 0.5).
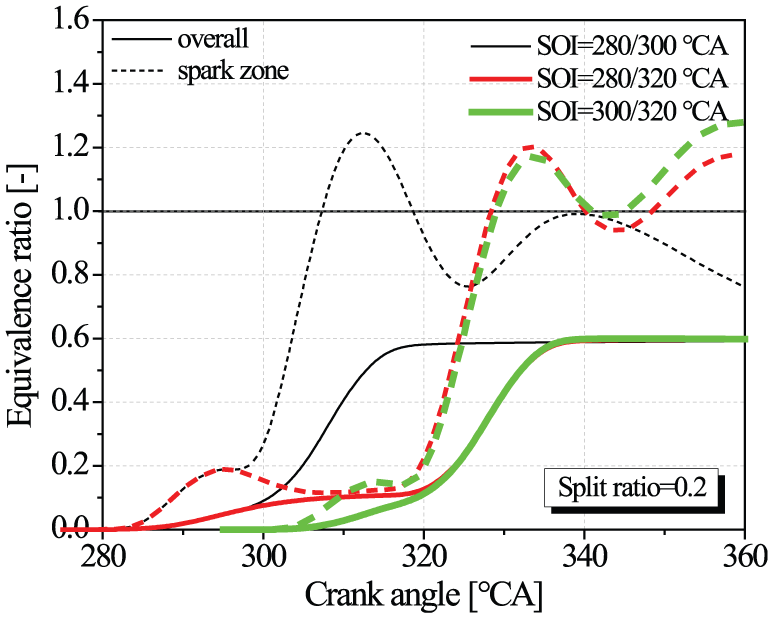
Figures 18 and 19 show the impact of the SOI timings on the average fuel–air ER in the whole cylinder and spark zone with split ratios (r1st) of 0.2 and 0.8, respectively. As the split ratio decreases to 0.2, the reduced fuel mass in the first injection shows weaker fuel enrichment of the charge in the spark zone and less impact on the flow fields in the cylinder center. This, in turn, leads to a lower peak fuel–air ER value around TDC with SOI at 280 °CA/300 °CA and more unstable ER values with a later SOI at 320 °CA than that with the split ratio of 0.5. As the split ratio increases to 0.8, the first injection shows good enrichment of the charge around the spark plug while the second injection with less fueling mass shows little enhancement of the enrichment.
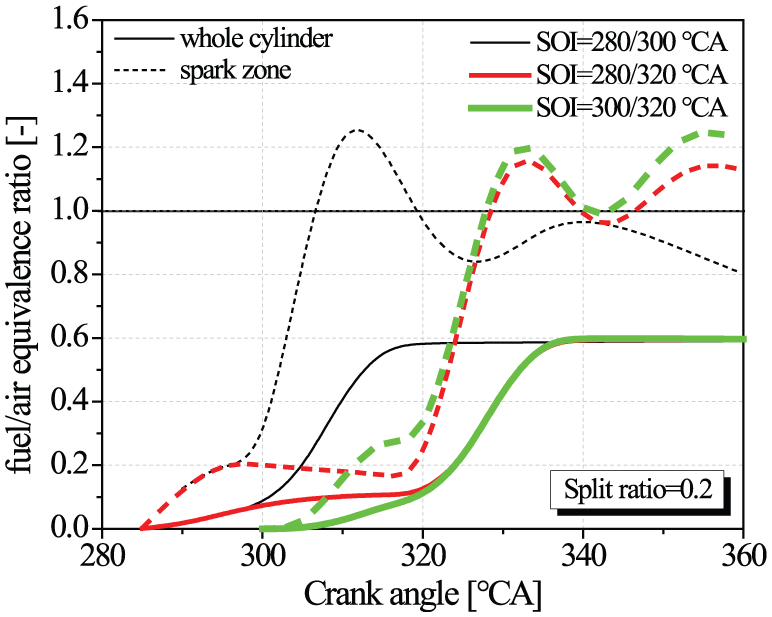
The average fuel–air equivalence ratio (ER) of the mixture in the whole cylinder and spark zone with different SOI timings (r1st = 0.2).
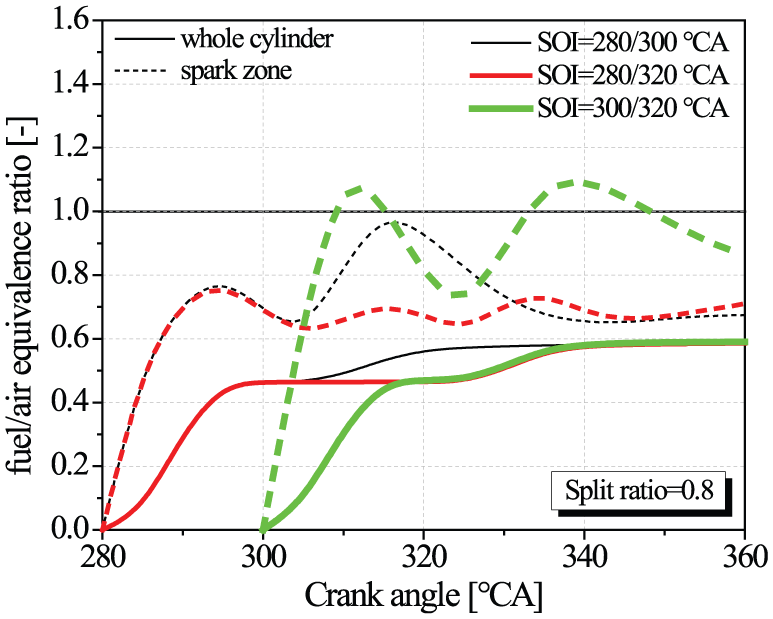
The average fuel–air equivalence ratio (ER) of the mixture in the whole cylinder and spark zone with different SOI timings (r1st = 0.8).
Effect of initial in-cylinder flow motion
In order to understand the effect of initial in-cylinder flow motions on the charge preparation, the number of intake ports was reduced from 12 to 8. Figure 20 shows the differences of SR, TR and CTR with 8 and 12 scavenge ports. As the SPN reduces from 12 to 8, the increased flow velocity through the scavenge ports and less interactions among the intake flow jets in the cylinder lead to higher peak SR at bottom dead center (BDC). As the piston moves upward, the swirl flow motion with eight scavenge ports transfers more to tumble and cross tumble flow with the help of the guidance of piston top, leading to faster decay of SR. This eventually produces slightly weaker swirl flow but stronger tumble and cross tumble flow at TDC, as shown in Figure 20.
Evolutions of SR, TR and CTR with 8 and 12 scavenge ports.
Figure 21 shows the impact of SOI timings of single injection on the average ER of the mixture in the whole cylinder and spark zone with SPN of 8. Compared to the design with SPN of 12 (as shown in Figure 10), the enrichment of the charge in the spark zone just after the injection is stronger for the design with SPN of 8, especially for the later SOI timing of 320 °CA. The comparison of the ER distributions at 335 °CA in Figure 22 demonstrates the impact of in-cylinder flow motions on controlling the ER distributions with SOI timing at 320 °CA. The fuel is injected into the piston bowl for both cases due to larger droplet momentum with single injection. Because of the stronger tumble flow motion with eight intake ports, the fuel vapor under the spark plug is transported upward to the spark plug gap along the piston bowl by the tumble flow motion, which produces a stratified richer mixture around the spark plug.
The average fuel–air equivalence ratio (ER) of the mixture in the whole cylinder and spark zone with different SOI timings (SPN = 8).
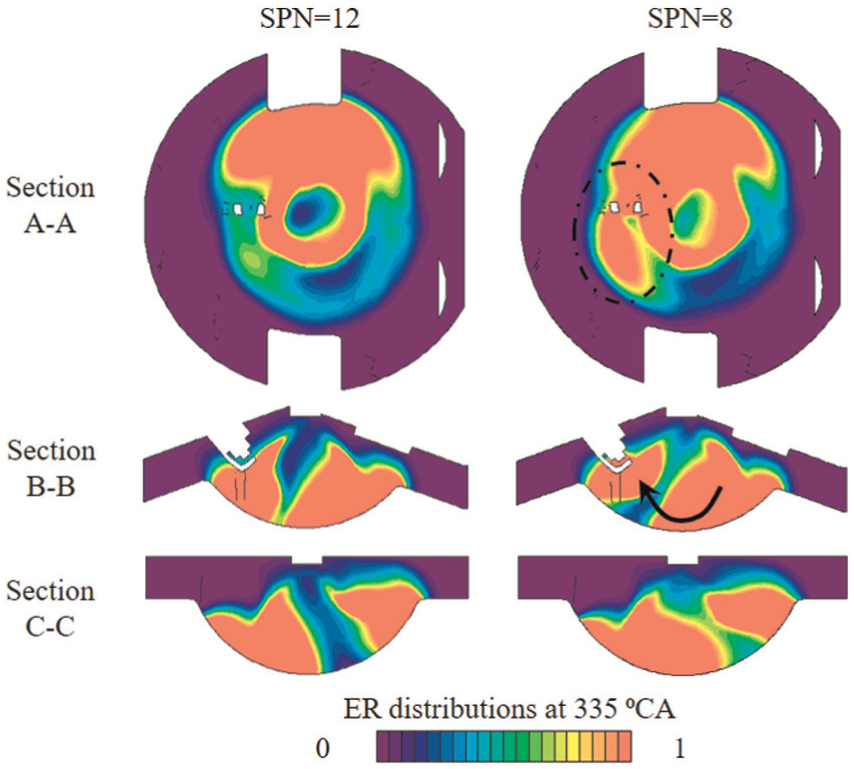
Comparison of the in-cylinder fuel–air equivalence ratio (ER) distributions at 335 °CA with different SPNs (SOI = 320 °CA).
Figure 23 shows the average fuel–air ER of the mixture in the whole cylinder and spark zone with split ratio of 0.2 and SPN of 8. As the split injection leads to less fueling mass as well as momentum for the first injection, it is found that the enrichment from the first injection becomes weaker by decreasing SPN from 12 to 8 due to the enhanced in-cylinder tumble flow which blows the fuel vapor away from the spark plug. Eventually, the fuel–air ER profiles after the second injection become similar for SPN of 8 and 12. The late SOI timings of 300 °CA/320 °CA show best enrichment of the charge around the spark plug although big fluctuation of ER can be observed after the peak value due to the swirling effect.
The average fuel–air equivalence ratio (ER) of the mixture in the whole cylinder and spark zone with different SOI timings (r1st = 0.2, SPN = 8).
As the split ratio increases to 0.5, the charge stratification around the spark plug is obviously improved after the first injection while significantly weakened after the second injection, as shown in Figure 24, due to less fueling mass as well as spray momentum.
The average fuel–air equivalence ratio (ER) of the mixture in the whole cylinder and spark zone with different SOI timings (r1st = 0.5, SPN = 8).
Figure 25 compares the in-cylinder fuel–air ER distributions to understand the impact of flow motions on the charge preparations with injection timings at 300 °CA/320 °CA. As the decreased fueling mass decreases the droplet momentum at each injection, the fuel vapor cannot travel to the lower edge of the spark plug under the impact of the strong tumble flow motion formed by eight scavenge ports. Instead, the fuel vapor is directly driven away from the spark plug to the cylinder center, leading to less charge stratification around the spark plug at 320 °CA and 340 °CA just after injections for the design with SPN of 8. The further increase in split ratio to 0.8 leads to leaner mixture around the spark plug due to weaker enrichment from the second injection.
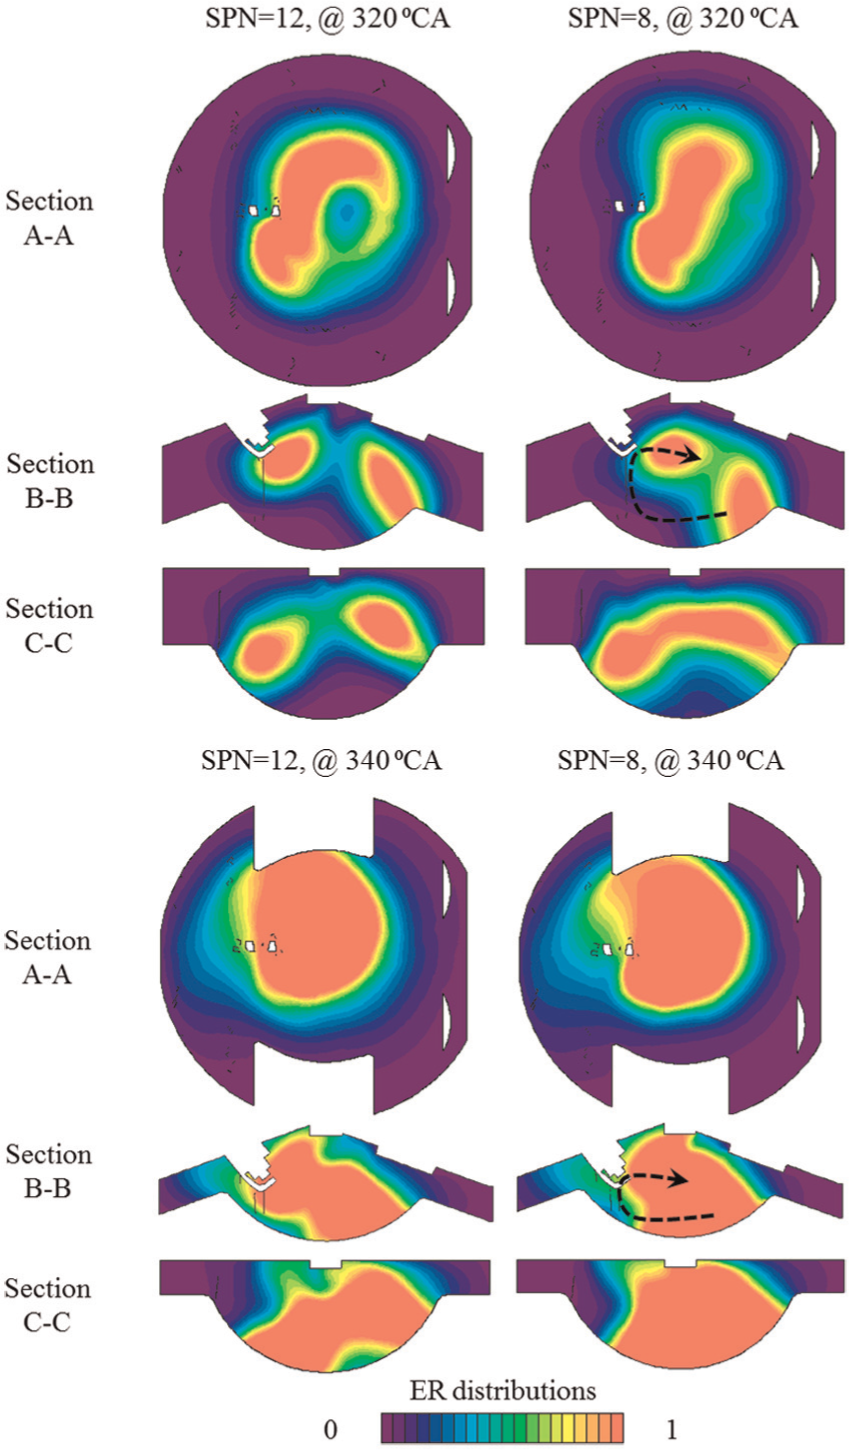
Comparison of the in-cylinder fuel–air equivalence ratio (ER) distributions at 320 °CA and 340 °CA with different SPNs (r1st = 0.5, SPN = 8).
Summary and conclusion
In this study, the interaction between the DI and in-cylinder flow motions and its impact on the charge preparation in the BUSDIG engine are investigated by 3D CFD simulations. Both the single injection and split injections are applied to understand their impacts on the mixing process and final charge stratification. The SOI timing and split injection ratio are adjusted accordingly to optimize the charge preparation for each injection strategy. The results confirm that the mixture preparation is significantly affected by the interaction between fuel injection and in-cylinder flow motions in the BUSDIG engine. In order to demonstrate the impact of the initial in-cylinder flow motions on the charge preparation, the simulation results with different scavenge port layout are compared. The main conclusions are summarized as follows:
The injection lowers the SR and CTR but increases TR slightly. The high-pressure fuel injection enhances TKE. As the SOI timing is retarded, the shortened penetration and enhanced interaction with piston bowl lead to better charge stratification around the spark plug. The in-cylinder flow motions directly affect the transportation of the fuel vapor and the formation of the charge stratification in the spark zone.
Compared to the single injection, the split injections show less impact on the in-cylinder large-scale flow motions and the TKE. The upward flow caused by the first injection and in-cylinder large-scale tumble flow motion counteracts with the downward flow induced by the subsequent second injection, which produces weaker flow fields and facilitates the stabilization of the charge stratification after the second injection.
During the split injections’ operation, the desired charge stratification is sensitive to the split ratio. A small split ratio shows less impact on in-cylinder flow motion and less stabilization of the enrichment from second injection, while a larger split ratio leads to less enrichment from second injection due to less fueling mass. At the given engine speed and total fuel mass, the split injections of equal amount in each injection are found to generate the most stable stratified charge around the spark plug with SOI at 300 °CA/320 °CA in the BUSDIG engine with 12 scavenge ports.
Because of the presence of stronger tumble flow produced by eight scavenge ports, the best charge stratification can be achieved with the later single injection at SOI of 320 °CA as the fuel vapor is transported to the spark plug along the piston bowl by the tumble flow. In the case of the split injections, the percentage of the second injection needs to be increased to 80% to counteract the presence of the stronger tumble flow with the reduced number of scavenge ports, in order to achieve a better charge stratification.
Footnotes
Acknowledgements
Declaration of conflicting interests
The author(s) declared no potential conflicts of interest with respect to the research, authorship and/or publication of this article.
Funding
The author(s) disclosed receipt of the following financial support for the research, authorship, and/or publication of this article: The authors gratefully acknowledge the financial support by the Engineering and Physical Sciences Research Council (EPSRC).