
Abstract
In this study, a two-stroke boosted uniflow scavenged direct injection gasoline (BUSDIG) engine was proposed and researched to achieve aggressive engine downsizing and downspeeding. Compared to loop or cross scavenged two-stroke engines, the BUSDIG engine can achieve excellent scavenging performance and be operated with higher boost pressure as well as the absence of air and fuel short-circuiting. As a fundamental engine geometric parameter, the bore/stroke (B/S) ratio would directly affect the scavenging process in the uniflow scavenged two-stroke engine. Three-dimensional computational fluid dynamics simulations were used to investigate the scavenging process in the BUSDIG engine with different B/S ratios. Four B/S ratios of 0.66, 0.8, 1, and 1.3 were analyzed. The results indicate that a bigger B/S ratio leads to deteriorated swirl flow motion but better delivery ratio, scavenging efficiency, and charging efficiency. In order to fulfil the potential of the BUSDIG engine with different B/S ratios, two key scavenge port angles, i.e. axis inclination angle (AIA) and swirl orientation angle (SOA), were varied from the baseline design (AIA = 90°, SOA = 20°) to study their effects on the scavenging process for each B/S ratio design. Overall, a larger AIA leads to lower swirl ratio (SR) but achieves better scavenge performance, which is crucial for a large B/S ratio design. A small SOA design leads to noticeably lower SR but superior scavenging performances for a small B/S ratio design. An intermediate SOA, e.g. 10 and 20°, is preferred to improve the scavenging for a large B/S ratio design.
Introduction
In order to reduce CO2 emissions and achieve higher engine efficiency requirements, engine downsizing and downspeeding technologies have been developed in the automotive industry. However, as the heavily downsized engine significantly increases the peak cylinder pressure, knocking combustion, and associated higher thermal and mechanical load, it is difficult to achieve further engine downsizing as well as downspeeding through increasing boost in the four-stroke gasoline engine. Alternatively, the combined downsizing and downspeeding can be obtained through the two-stroke operation by doubling the firing frequency, which thus allows lower indicated mean effective pressure and peak in-cylinder pressure with the same output torque as a four-stroke counterpart. Additional advantages, including the higher power-to-weight ratio and compact engine dimensions, make the two-stroke engine naturally suitable for aggressive engine downsizing and downspeeding to increase the power density and improve fuel economy.
In order to take full advantage of the two-stroke engine, a novel two-stroke boosted uniflow scavenged direct injection gasoline (BUSDIG) engine was proposed to achieve aggressive engine downsizing and downspeeding. 1 The scavenging process, during which the fresh intake charge displaces the burned gas from the previous cycle and fills the cylinder for the next cycle, is essential for a two-stroke engine. Because of the long overlapping period of intake and exhaust process in the two-stroke engine, the intake fresh mixture can flow directly into the exhaust port during the scavenging process, i.e. charge short-circuiting phenomenon. Amongst all types of two-stroke operations, the uniflow scavenge process is shown to be most effective in terms of scavenging performance.2–4 The intake ports in the uniflow engine are integrated into the cylinder liner and controlled by the movement of the piston top while exhaust valves are placed in the cylinder head. This engine layout enables the application of variable valve timing (VVT) technology to control the hot residual gas and scavenging process under different boost pressures at various engine speeds by adjusting the exhaust valve timing. Meanwhile, the uniflow engine can also minimize the bore distortion caused by uneven thermal loading in the conventional ported two-stroke engine with cold intake port on one side and hot exhaust port on the other, thus improving the engine durability. The fuel consumption of a BUSDIG engine is expected to be improved with lean/stratified charge and advanced combustion concept, e.g. homogeneous charge compression ignition (HCCI) and controlled auto-ignition (CAI).5–7
The bore/stroke (B/S) ratio determines the overall dimensions of the engine for a given displacement. The engine with a large B/S ratio is more compact and can be operated at a higher engine speed without deteriorating the mechanical efficiency.8,9 The cylinder head of a bigger bore engine has more space to accommodate the spark plug, injector, and intake/exhaust valves. Overall, engine B/S ratios have changed little over the past decade. 10 A general summary of the impact of B/S ratio on combustion system design is that a small B/S ratio is favored for higher engine efficiency, while a larger B/S ratio favors power density. 11 For those engines that require the high power density, e.g. race car engines,12,13 a large B/S ratio is adopted due to slower piston speed and lower friction loss, adapting to the higher loads and engine speeds.11,14 The larger bore can also accommodate larger intake/exhaust valves to improve the gas exchange for higher loads and engine speeds. 11
For those engines that require high fuel efficiency, e.g. heavy-duty engines and marine engines, 15 a small B/S ratio is adopted. The long stroke enables higher in-cylinder turbulence level, which is beneficial for faster combustion process. Meanwhile, the small B/S ratio leads to a small surface/volume ratio around top dead center, decreasing the flame contact area with cylinder wall and the corresponding heat transfer loss. As a result, a small B/S ratio design usually shows higher combustion efficiency and thermal efficiency.8,9,11,16–20 However, as the engine speed increases, the advantage of long stroke would be gradually lost as the friction loss significantly increases. 8 It is also reported that the reduced convection heat losses at part load could compensate the unfavorable surface/volume ratio for a “square” design with B/S ratio of 1, resulting in fuel consumption benefits by improving the reciprocating and rotating components stress and friction at high speed. 21 In addition to the fuel conversion efficiency, the variation in the B/S ratio also shows impacts on exhaust emissions. As the B/S ratio increases, the increased crevice volume could lead to increased carbon monoxide (CO) and hydrocarbon (HC) emissions,17,18 but lower nitrogen oxide (NOx) emissions. 17
Compared to the four-stroke engines, the performance of two-stroke engines is more affected by the B/S ratio because of its direct impact on the scavenging process of the two-stroke cycle operation. Yang et al. performed a numerical study on the effect of B/S ratio on the scavenging process in a poppet-valve two-stroke engine. 22 They found that a larger B/S ratio can reduce the short-circuiting due to the longer distance between intake valves and exhaust valves. As a result, the scavenging efficiency (SE) and trapping efficiency (TE) were significantly improved with increased B/S ratio. Thornhill et al. compared the scavenge performance with different B/S ratios in a loop scavenged two-stroke engine through a single-cycle scavenge test rig. 9 The results indicate that an “under-square” cylinder with B/S ratio of 0.8 is deficient in both scavenging and trapping efficiencies, throughout most of its range, by the order of 8–9% compared to “square” and “over-square” cylinders. They found that the delivery ratio (DR), and hence charging efficiency (CE), are the lowest for the longest and shortest stroke loop scavenged two-stroke engine. The comparison of the scavenge performances in loop and cross scavenged two-stroke engines, performed by Kee et al., 23 indicates that a reduction of the B/S ratio from “over-square” values for the QUB cross scavenged two-stroke engine gave improved scavenging characteristics and approximately “square,” or slightly “under-square” values of B/S ratio have been found to be appropriate. Zhu et al. performed three-dimensional (3D) computations of the scavenging process in an opposed-piston uniflow scavenged two-stroke engine and found the SE is most sensitive to the B/S ratio. 24 With a small B/S ratio (less than 0.5), the scavenging flow structure is improved considerably, and the scavenging is close to ideal.
Although these studies have revealed some understanding of the effects of B/S ratio on the scavenging process in poppet valve, 22 loop, 9 and cross scavenged engines, 23 and opposite-piston engines, 24 the impacts of B/S ratio on uniflow scavenged two-stroke engines have not been fully analyzed. In this study, 3D computational fluid dynamics (CFD) simulations were performed to evaluate the scavenging process of the proposed BUSDIG engine with different B/S ratios. In order to achieve the optimal scavenge performance for each B/S ratio, the two most important scavenge port angles, i.e. axis inclination angle (AIA) and swirl orientation angle (SOA), were varied and analyzed in detail. This study would provide fundamental understanding of the scavenging process and valuable guidelines on designing scavenge ports for BUSDIG engines.
Design of the BUSDIG engine
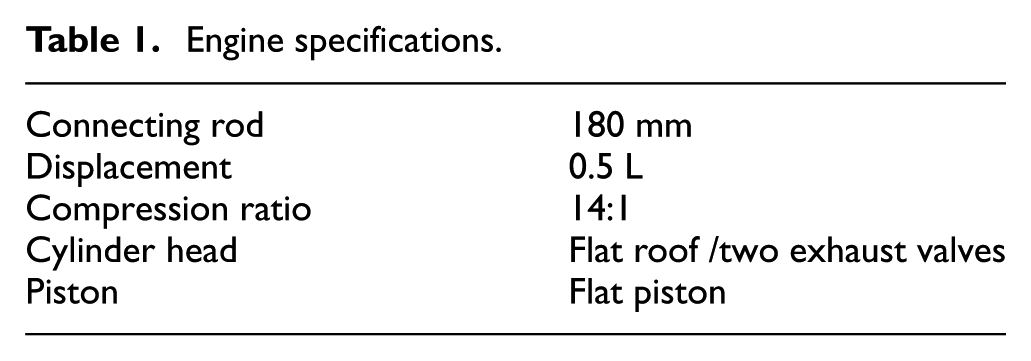
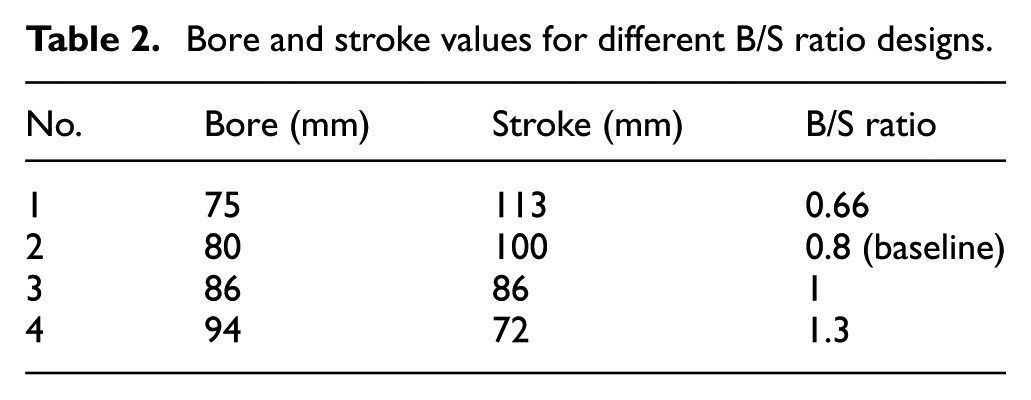
In this study, a uniflow engine with a flat cylinder head and piston top was selected as the baseline design of the BUSDIG engine. The engine specifications are shown in Table 1. Four combinations with different bores and strokes were examined on the effects of B/S ratio on the scavenging process in the BUSDIG engine. As shown in Table 2, the B/S ratio adopted in this study increases from 0.66 to 1.3. The engine displacement volume and the geometric compression ratio are fixed at 0.5 L and 14:1, respectively.
Engine specifications.
Bore and stroke values for different B/S ratio designs.
In order to accommodate the scavenge ports for future application to multi-cylinder engines, two groups of scavenge ports (four on each side) were placed on the two sides of the cylinder to avoid the interference of the scavenge ports on the adjacent cylinders. Figure 1 illustrates the design of the BUSDIG engine with 8 scavenge ports. A single scavenge port occupies a 20° segment on the cylinder circumference and the interval between two adjacent scavenge ports in each group is fixed at 10°. The interval between the two groups of scavenge ports is set at 70°.
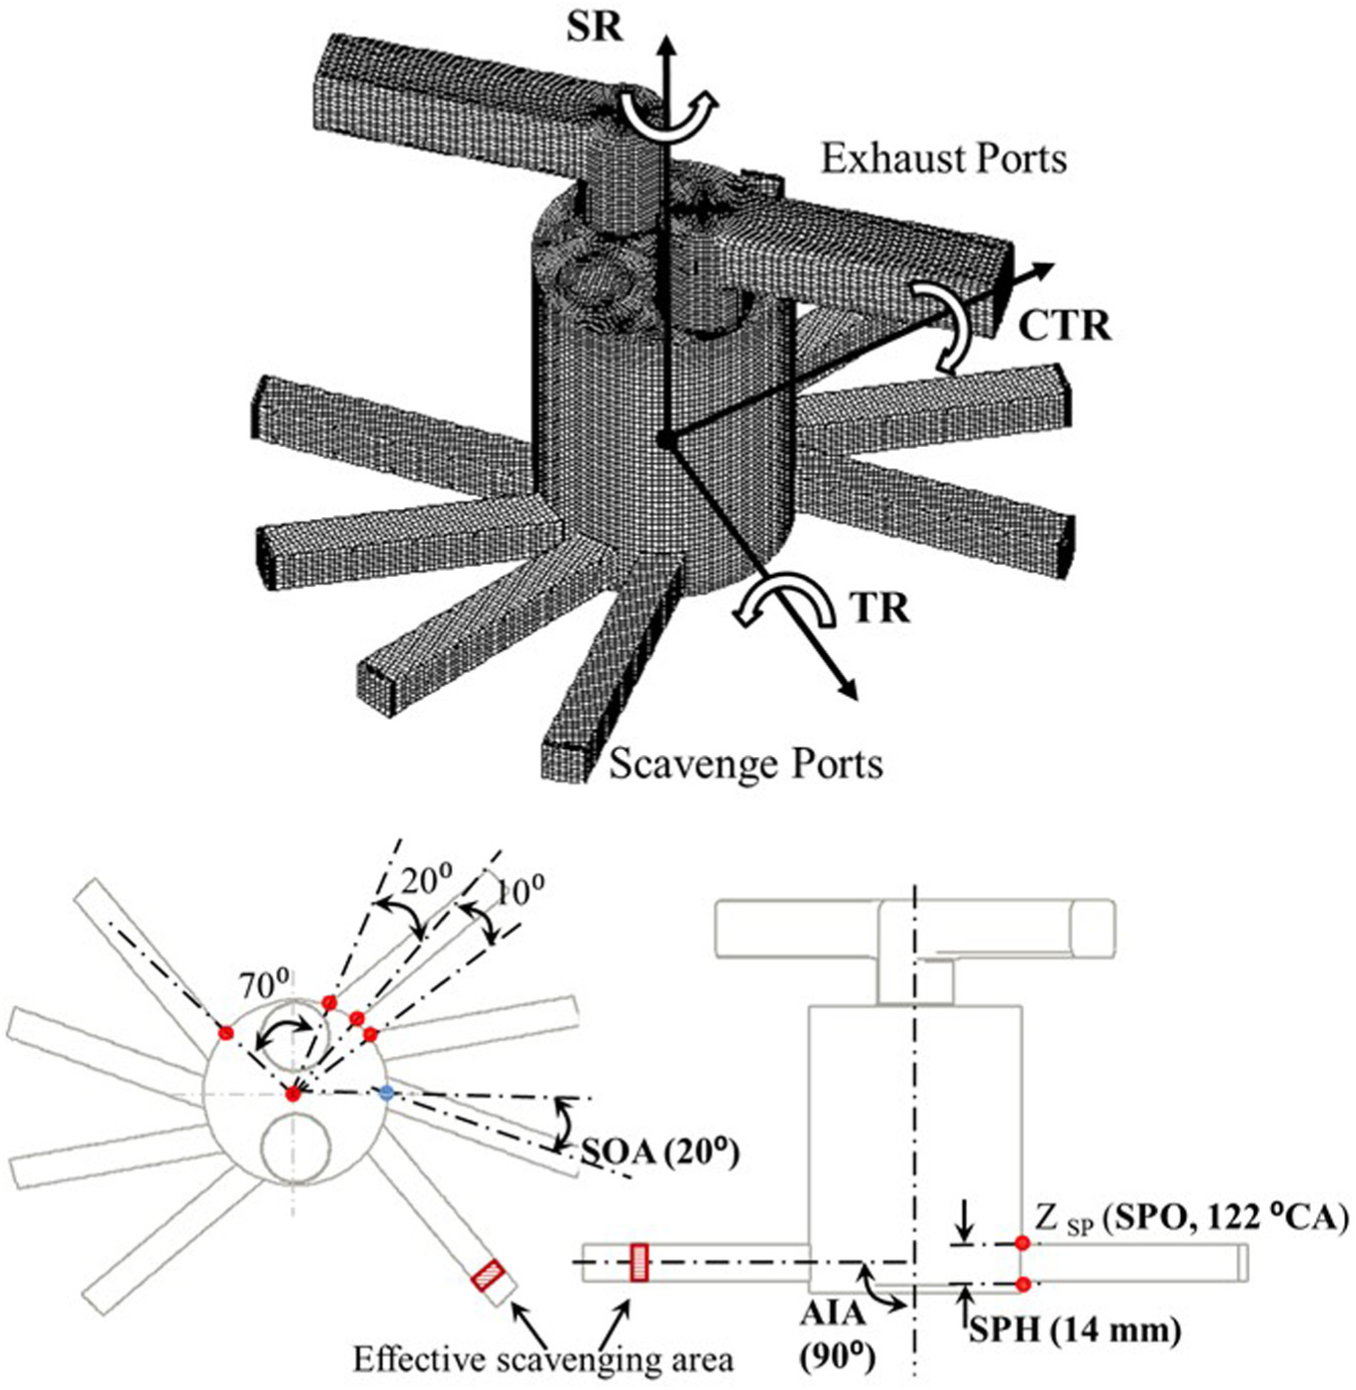
Layout of the BUSDIG engine, the definitions of design parameters of scavenge ports, and their baseline values.
The scavenge ports design would affect the in-cylinder flow motion and scavenge process in the two-stroke BUSDIG engine. Figure 1 shows the design parameters of the scavenge port, including the AIA, SOA, scavenge port opening (SPO) timing, and scavenge port height (SPH). In this study, the SPH was fixed at 14 mm and the SPO at 122°CA by adjusting the vertical position of scavenge ports, based on the previous study. 25 In addition to the baseline design of AIA (90°) and SOA (20°), which has been verified as one of the optimal designs for B/S ratio of 0.8, 25 different AIA and SOA designs are examined for each B/S ratio to understand the effect of B/S ratio on the optimal design of scavenge ports in a BUSDIG engine. As seen in Figure 1, the scavenge port with a bigger AIA and smaller SOA would result in a larger effective flow area.
In this study, the intake pressure and engine speed are fixed at 2 bar (absolute) and 2000 r/min, respectively. The exhaust valve duration and opening timing are fixed at 126° crank angle (CA) and 117°CA, respectively. Figure 2 shows a schematic diagram of the exhaust valve lift and normalized scavenging area profiles of scavenge ports. It should be noted that a larger bore would lead to a larger maximum scavenging area of the scavenge ports because the proportion of each scavenge port to cylinder bore is fixed at 20° for each B/S ratio. The scavenging area profile for different B/S ratios is normalized to the maximum scavenging area achieved with the B/S ratio of 1.3. As shown in the figure, although a smaller B/S ratio reduces the peak of the instantaneous scavenging area, the faster piston movement across the scavenge ports produces a slightly higher initial scavenging area before achieving the maximum scavenging area.
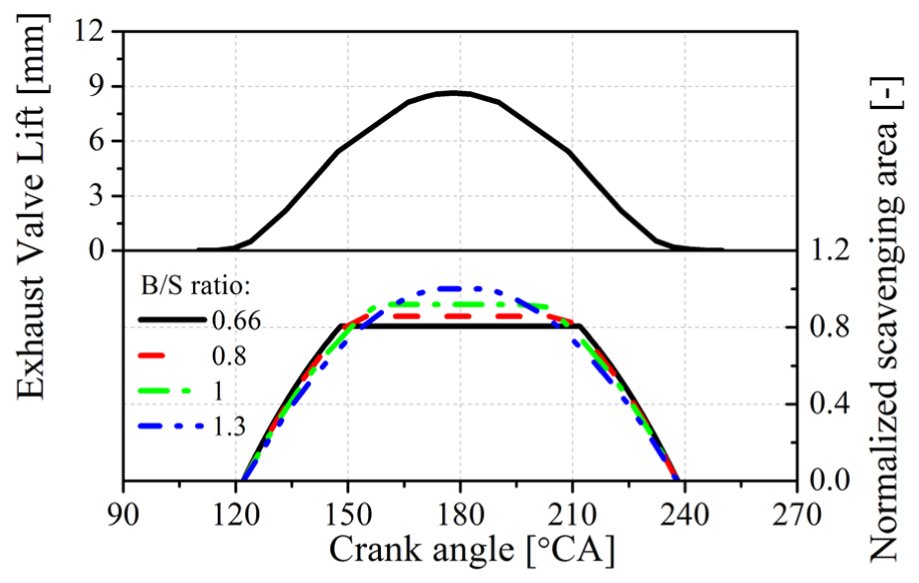
Schematic diagram of the exhaust valve lift and normalized scavenging area profiles of scavenge ports.
Simulation setup
Numerical models
In this study, the commercial CFD software STAR-CD was adopted to perform the simulations. A Reynolds-averaged Navier–Stokes (RANS) approach was applied with a renormalization group (RNG) k–ε turbulence model in the simulations. The heat transfer was implemented through the general form of the enthalpy conservation equation for the fluid mixture. The Angelberger wall function was used for the simulation of the wall heat transfer. The detailed description of these models can be found elsewhere. 26
The angular time-step in the simulations was fixed at 0.1°CA. The pressure-implicit with splitting of operators (PISO) algorithm was used to solve the equations. The equations of momentum, turbulence kinetic energy, and turbulence dissipation were discretized with the monotone advection and reconstruction scheme (MARS). The upwind differencing scheme (UD) and central differencing scheme (CD) were applied to discretize the temperature and density equations, respectively. The residual tolerance for the momentum, turbulence kinetic energy, and turbulence dissipation was set at 0.001 while the residual tolerance for pressure and temperature was set at 0.0001 to achieve good compromise between convergence and computational time.
Simulation conditions
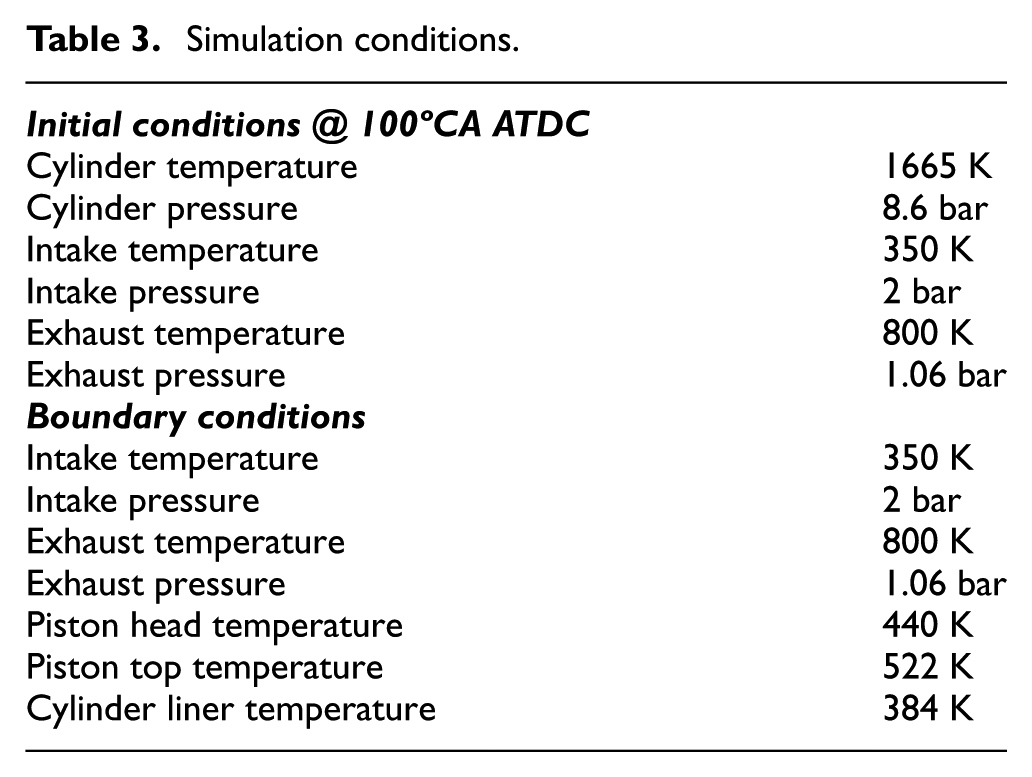
In order to obtain more realistic fired in-cylinder conditions for the CFD simulations of the scavenging process in the BUSDIG engine, one-dimensional (1D) simulations were performed using the 1D engine simulation program WAVE. The 1D simulation results were then used to provide the initial and boundary conditions, as shown in Table 3, for CFD simulations. The initial mixture components in the cylinder are pure burned gas, i.e. CO2, H2O, and N2. The mixture components in the scavenge ports are pure air, i.e. O2 and N2. The CFD simulations were performed from 100°CA after top dead center (ATDC) to 280°CA (i.e. 80°CA before TDC), which covers the whole period of the scavenging process.
Simulation conditions.
The ES-ICE software was used to generate the moving mesh for simulations. Several cylinder cell layers of the moving mesh were automatically deleted/added during the compression/expansion. The arbitrary sliding interface (ASI) was applied between the scavenge ports and the cylinder liner to control the attachment and detachment with the piston movement. ASI was also applied to control the connectivity between exhaust domains and cylinder domain with the movement of exhaust valves.
Three different meshes with an average grid size of 2 mm, 1.6 mm, and 1 mm were generated for the baseline engine design to investigate the sensitivity of simulation results to the mesh quality. 25 The results indicated that an intermediate grid size of 1.6 mm was sufficient to achieve a convergent result regarding in-cylinder pressure, temperature profiles, flow motions and scavenging performance. Thus, the engine mesh with an average grid size of 1.6 mm, as shown in Figure 1, has been used in the current study. In addition, two layers of fine mesh with the grid size of 0.5 mm were generated at the near-wall region (e.g. piston top, cylinder head, and cylinder wall).
Results and discussions
Effect of the B/S ratio on scavenging process with baseline scavenge port design
In the first part of the study, the effect of B/S ratio on the in-cylinder flow motions and scavenging process was investigated with the baseline scavenge port design (AIA = 90°, SOA = 20°). In order to understand the scavenging process in the BUSDIG engine, Figure 3 compares the mass flow rates at the outlets of scavenge ports of different B/S ratios. The scavenging process is characterized with an earlier exhaust valve opening (EVO) timing than the SPO timing. Because of the insufficient blowdown process the in-cylinder pressure is higher than the boost pressure at SPO, leading to a strong early backflow phenomenon. The positive scavenging does not take place until the in-cylinder pressure drops below that in the scavenge ports.
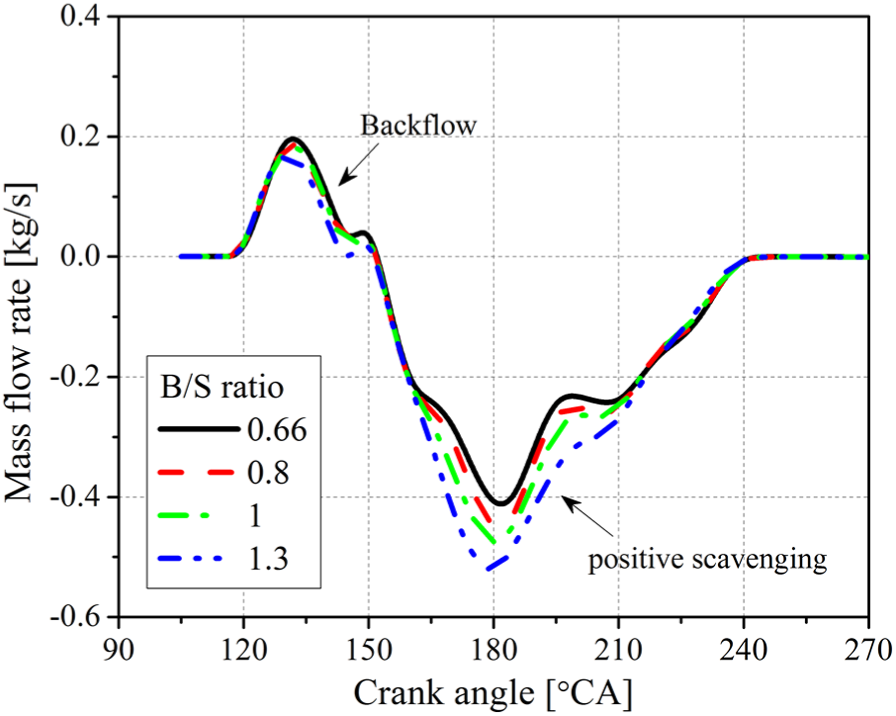
Mass flow rates at the outlets of scavenge ports for different B/S ratios.
The peak mass flow rate during the backflow period shows a slightly decreasing trend with a larger B/S ratio because of the initial smaller effective scavenging area, as shown in Figure 2. During the positive scavenging period, a larger B/S ratio leads to a higher peak mass flow rate. One reason is the increased scavenging area of a larger bore and the other cause is the greater charge short circuiting phenomenon in a shorter stroke.
Figure 4 shows the relationship between the residual gas fraction (RGF) values in the exhaust ports and in the cylinder during the scavenging process for two B/S ratios of 0.66 and 1.3. The scavenge process begins from the top right where the RGFs in both cylinder (RGFCylinder) and exhaust ports (RGFExhaust) are 100%. RGF in the cylinder gradually decreases as the fresh charge enters into the cylinder from scavenge ports. The decrease of RGF in the exhaust ports indicates the occurrence of the charge short-circuiting. The RGF curve of the large B/S ratio is beneath that of the small B/S ratio, indicating a stronger charge short circuiting phenomenon for a short stroke design. For the long stroke design with a smaller B/S ratio of 0.66, the early scavenging process mainly locates at the lower part of the cylinder far away from the exhaust ports, as shown by the RGF distributions at 175°CA in the left two images of Figure 5. The residual gas is pushed upwards by the fresh intake charge and delays the occurrence of the charge short circuiting. In comparison, for the short stroke design with a bigger B/S ratio of 1.3, the closer distance between the scavenge ports and exhaust valves leads to less scavenging resistance so that the intake fresh charge can get to the exhaust ports quicker, as indicated by the presence of intake air in the exhaust ports at 170°CA in the left two images of Figure 5.
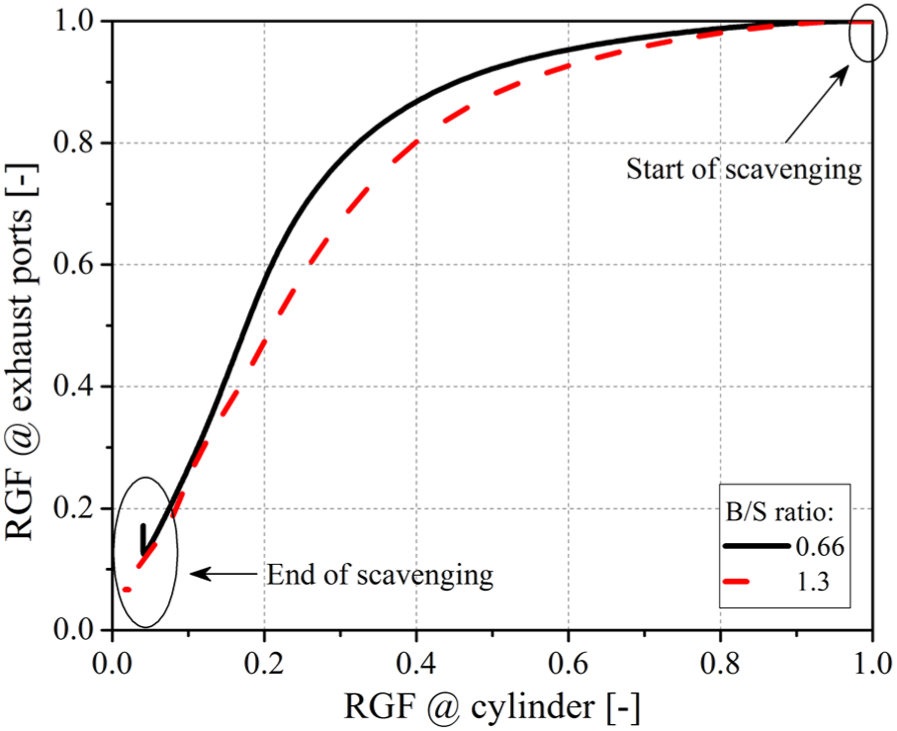
Comparison of RGF in the cylinder and exhaust ports with B/S ratios of 0.66 and 1.3.
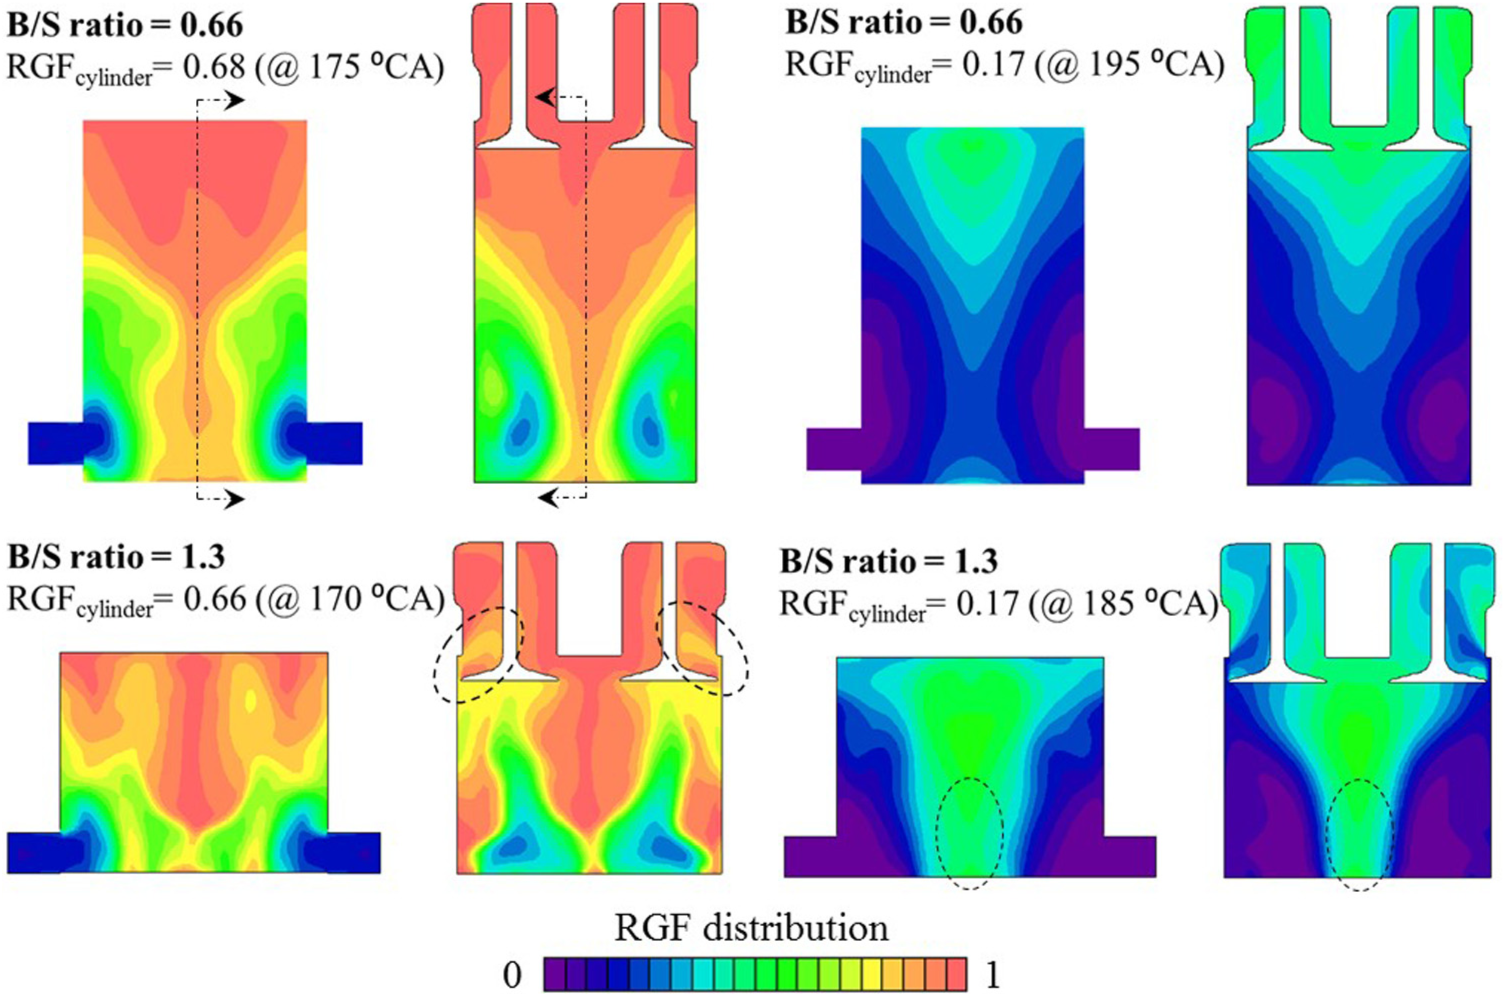
Section views of RGF distributions with B/S ratios of 0.66 and 1.3.
With the scavenging process proceeding, the fresh charge would gradually fill the cylinder volume and the short circuiting of the bulk fresh charge would be gradually enhanced, reflected by the sharp decreases of the RGF in the exhaust ports with RGFCylinder less than around 0.4, as shown in Figure 4. The RGF profiles with different B/S ratios would eventually converge towards the end of the scavenging process. As shown by the right four images in Figure 5 with RGFCylinder around 0.17, the fresh intake charge has reached to the top of the cylinder near the exhaust valves, leaving the majority of residual gas in the upper-middle region. However, it is noted that there is a considerable amount of residual gas left at the bottom of the cylinder of the larger B/S ratio (short stroke), leading to incomplete scavenging.
In order to quantify the overall flow motions in the cylinder, the swirl ratio (SR) is calculated by the following equation:
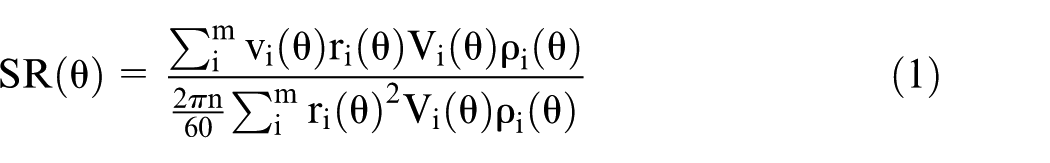
where
Similarly, the tumble ratio (TR) and cross tumble ratio (CTR) are determined by replacing the swirl axis along with the cylindrical coordinate system in equation (1) with the tumble/cross tumble axis. The tumble/cross tumble axis is parallel to y/x axis and crosses the central point between maximum and minimum z value of the cylinder. 27 The direction of each flow motion has been marked in Figure 1.
Figure 6 compares the SR, TR, and CTR at 280°CA for different B/S ratios. As indicated in the figure, the in-cylinder flow is dominated by the swirl flow with very weak tumble and cross tumble. The increase in the B/S ratio leads to lower SR and has little impact on TR and CTR. As show in Figure 7, the swirl flow motion is not formed until after 150°CA when the backflow stops. The SR suddenly increases with the positive scavenging process and peaks before BDC. The comparison of the SR profiles among different B/S ratios indicates that the larger B/S ratio tends to have a lower peak SR although the peak mass flow rate, as shown in Figure 3, is higher. On the one hand, as noted by the definition of SR in equation (1), a large bore would naturally lead to a lower SR due to a larger
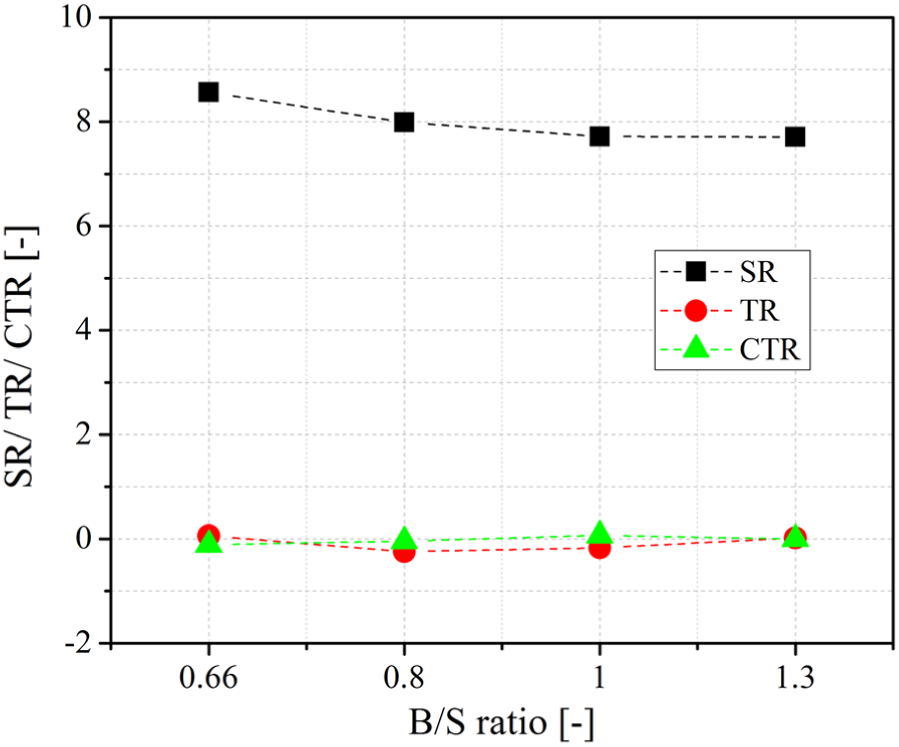
Effect of B/S ratios on SR, TR and CTR at 280°CA.
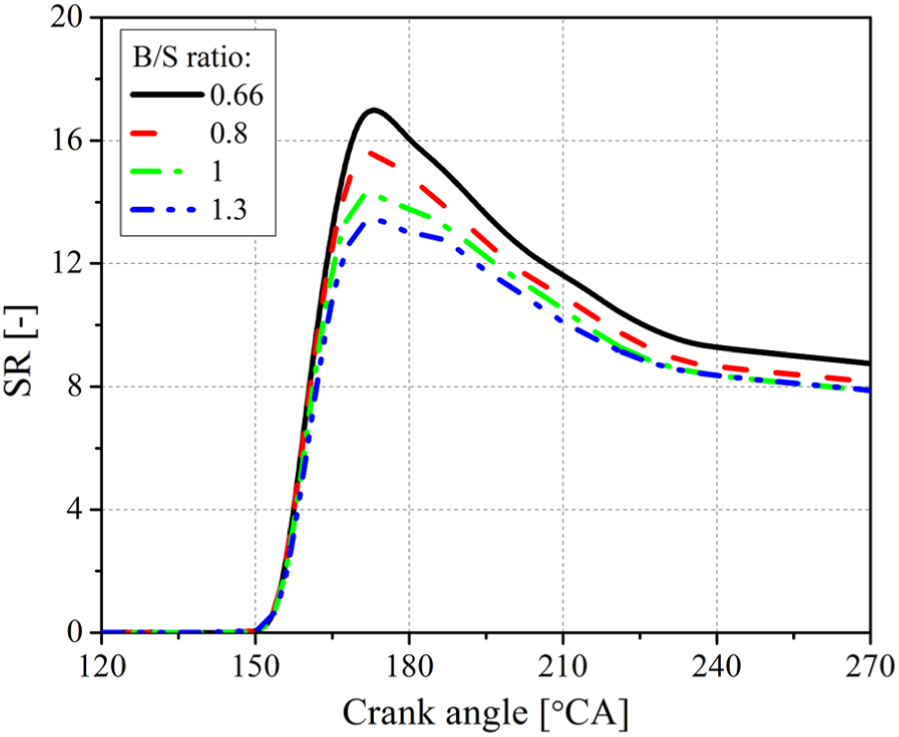
Evolutions of SR with crank angle for different B/S ratios.
In order to characterize the scavenging performance of the BUSDIG engine, the four scavenge parameters, i.e. DR, TE, SE, and CE, are: 28


The reference mass in above equations is calculated by the displaced volume multiplied by the ambient air density.
As shown in Figure 8, the DRs become higher with a larger B/S ratio due to less scavenging resistance. In comparison, the B/S ratio has less effect on the SE and CE, as shown in Figures 9 and 10. The TE is reduced with B/S ratio increasing due to significantly increased DR. Overall, the increased B/S ratio leads to significantly higher DR, which in turn contributes to the slightly higher SE. Meanwhile, the largest B/S ratio of 1.3 produces the highest CE thanks to the higher DR but at the expense of a lower TE.
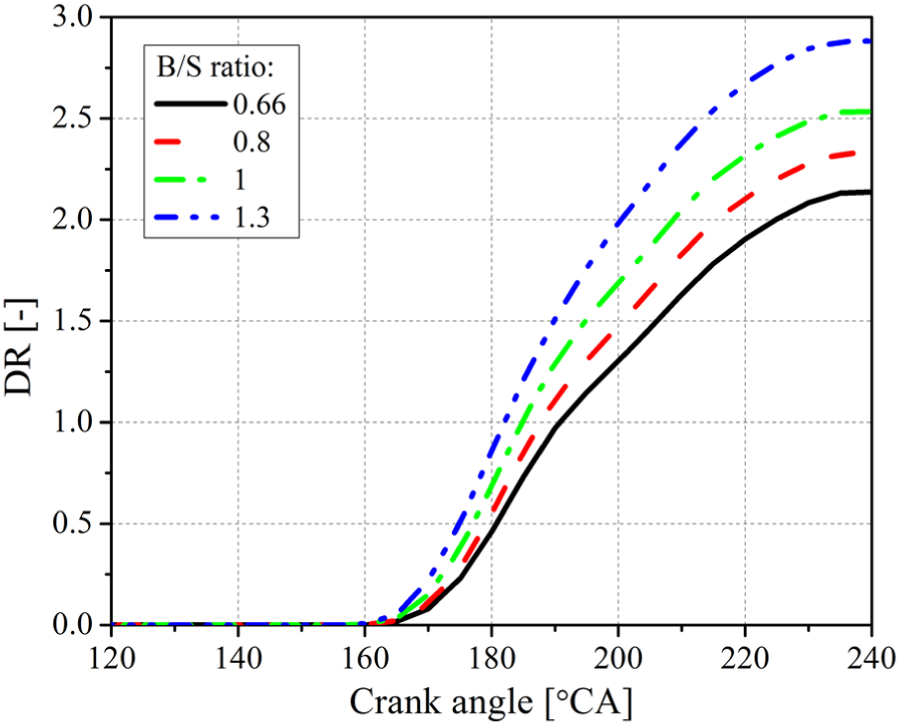
Evolutions of DR with crank angle for different B/S ratios.
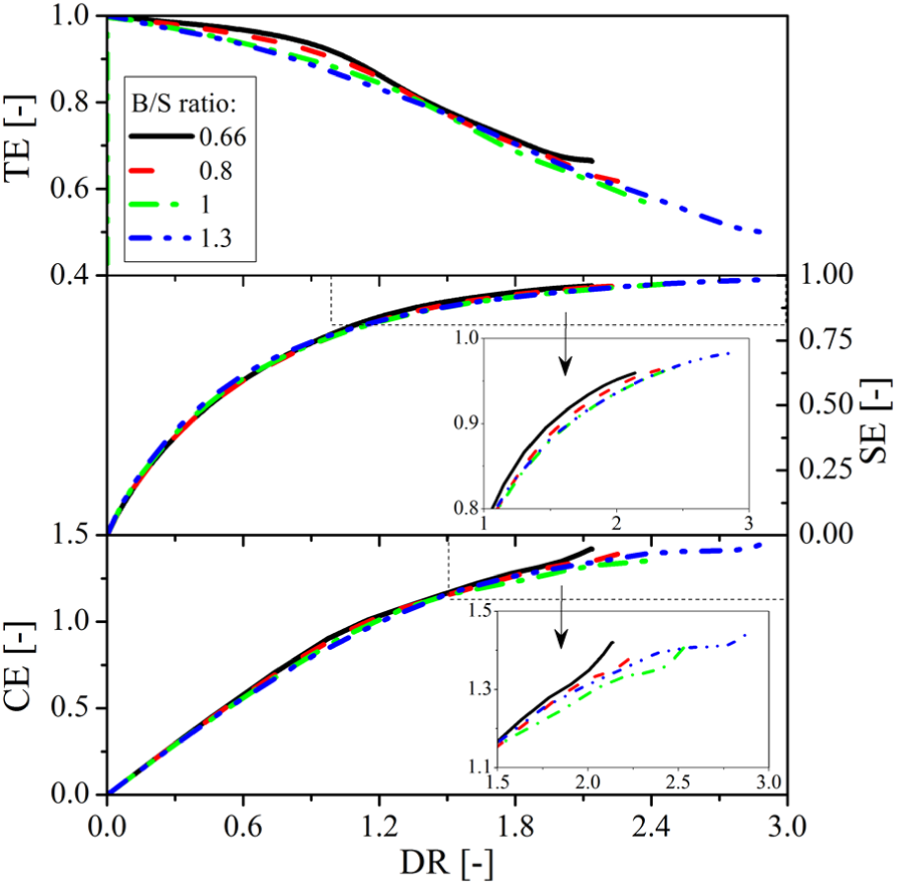
Evolutions of TE, SE, and CE with DR for different B/S ratios.
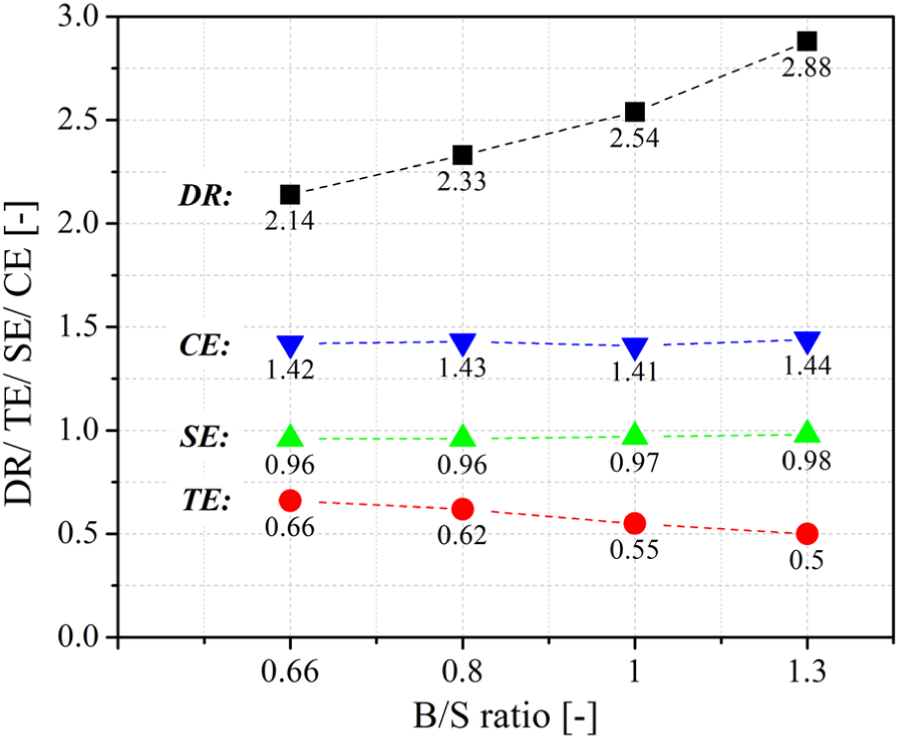
DR, TE, SE, and CE at the end of scavenging with different B/S ratios.
Effect of the AIA on scavenging process with different B/S ratios
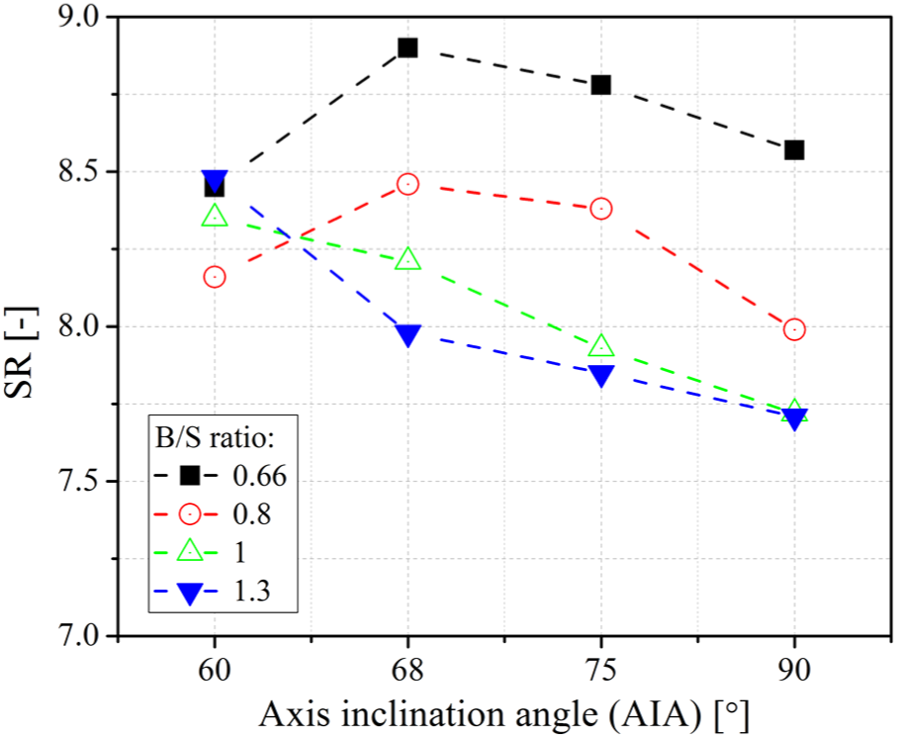
Figure 11 shows the effect of AIA on the SR at 280°CA for different B/S ratios. The SOA angle was fixed at the baseline value (20°) for each case. The SR peaks at AIA of 68° for the small B/S ratios of 0.66 and 0.8, while the SR decreases monotonously with AIA for the larger B/S ratios of 1 and 1.3. As discussed in the previous section, a larger B/S ratio would reduce the SR for the AIAs larger than 60°. As shown by the SR variations with crank angle in Figure 12, a bigger AIA leads to significantly higher peak SR values for a smaller B/S ratio of 0.66. However, the peak SR is hardly affected by the AIA for a larger B/S ratio of 1.3. Figure 13 shows the horizontal section views (H1, H2, and H3) and the vertical section view (V1) of the flow fields. As expected, the flow velocity near the outlets of scavenge ports in the section H1 and V1, is significantly higher than the other region. The swirl motion in the lower part of the cylinder in section H1 is significantly higher for AIA of 90° for both B/S ratios due to the bigger horizontal velocity component. In the case of a smaller AIA port design, the swirl flow motion in the middle part of the cylinder is more affected, as shown in the section H2, thanks to the vertical velocity component. However, for a long stroke design (small B/S ratio), the decay of the vertical and swirl flow motion is more significant due to a longer travel distance, leading to almost similar strength of swirl flow motion in the upper part of cylinder for different AIAs, as shown in section H3. As a result, the overall swirl motion is significantly higher for a bigger AIA with the small B/S ratio. On the contrary, a short stroke (big B/S ratio) would help to maintain the swirl flow motion at different parts of the cylinder due to less decay in flow motion. Specially, for a smaller AIA, the swirl flow motion at upper part of cylinder is even stronger, as shown in section H3, because of the conversion from vertical flow to horizontal flow with the guidance of the cylinder head. As a result, the peak swirl flow motion is almost the same for different AIAs with the large B/S ratio.
Effect of AIA on SR at 280°CA with different B/S ratios.
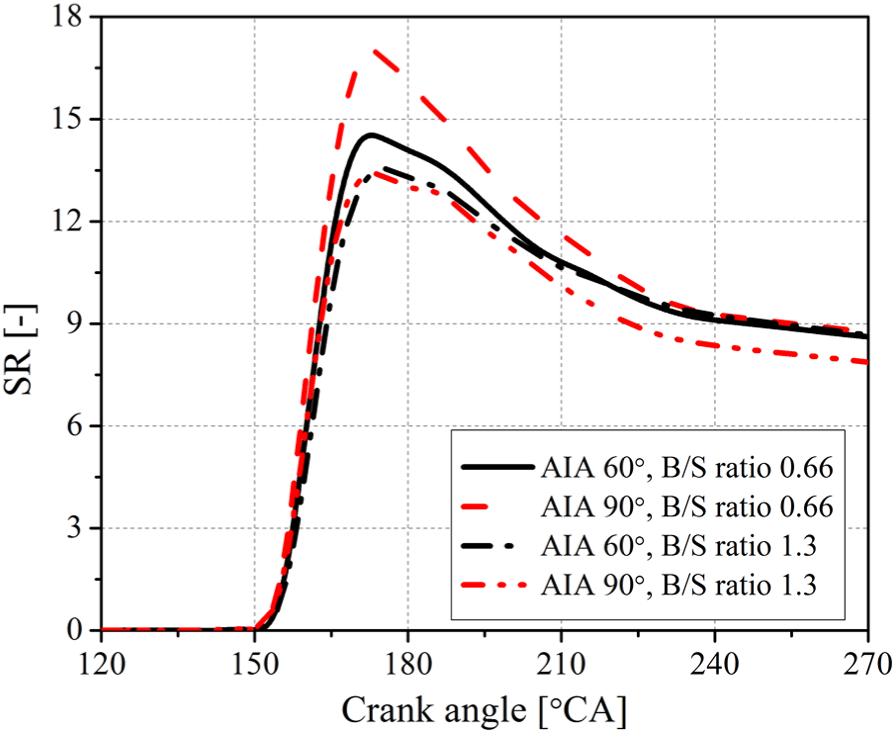
Evolutions of SR with AIA of 60° and 90°, and B/S ratio of 0.66 and 1.3.
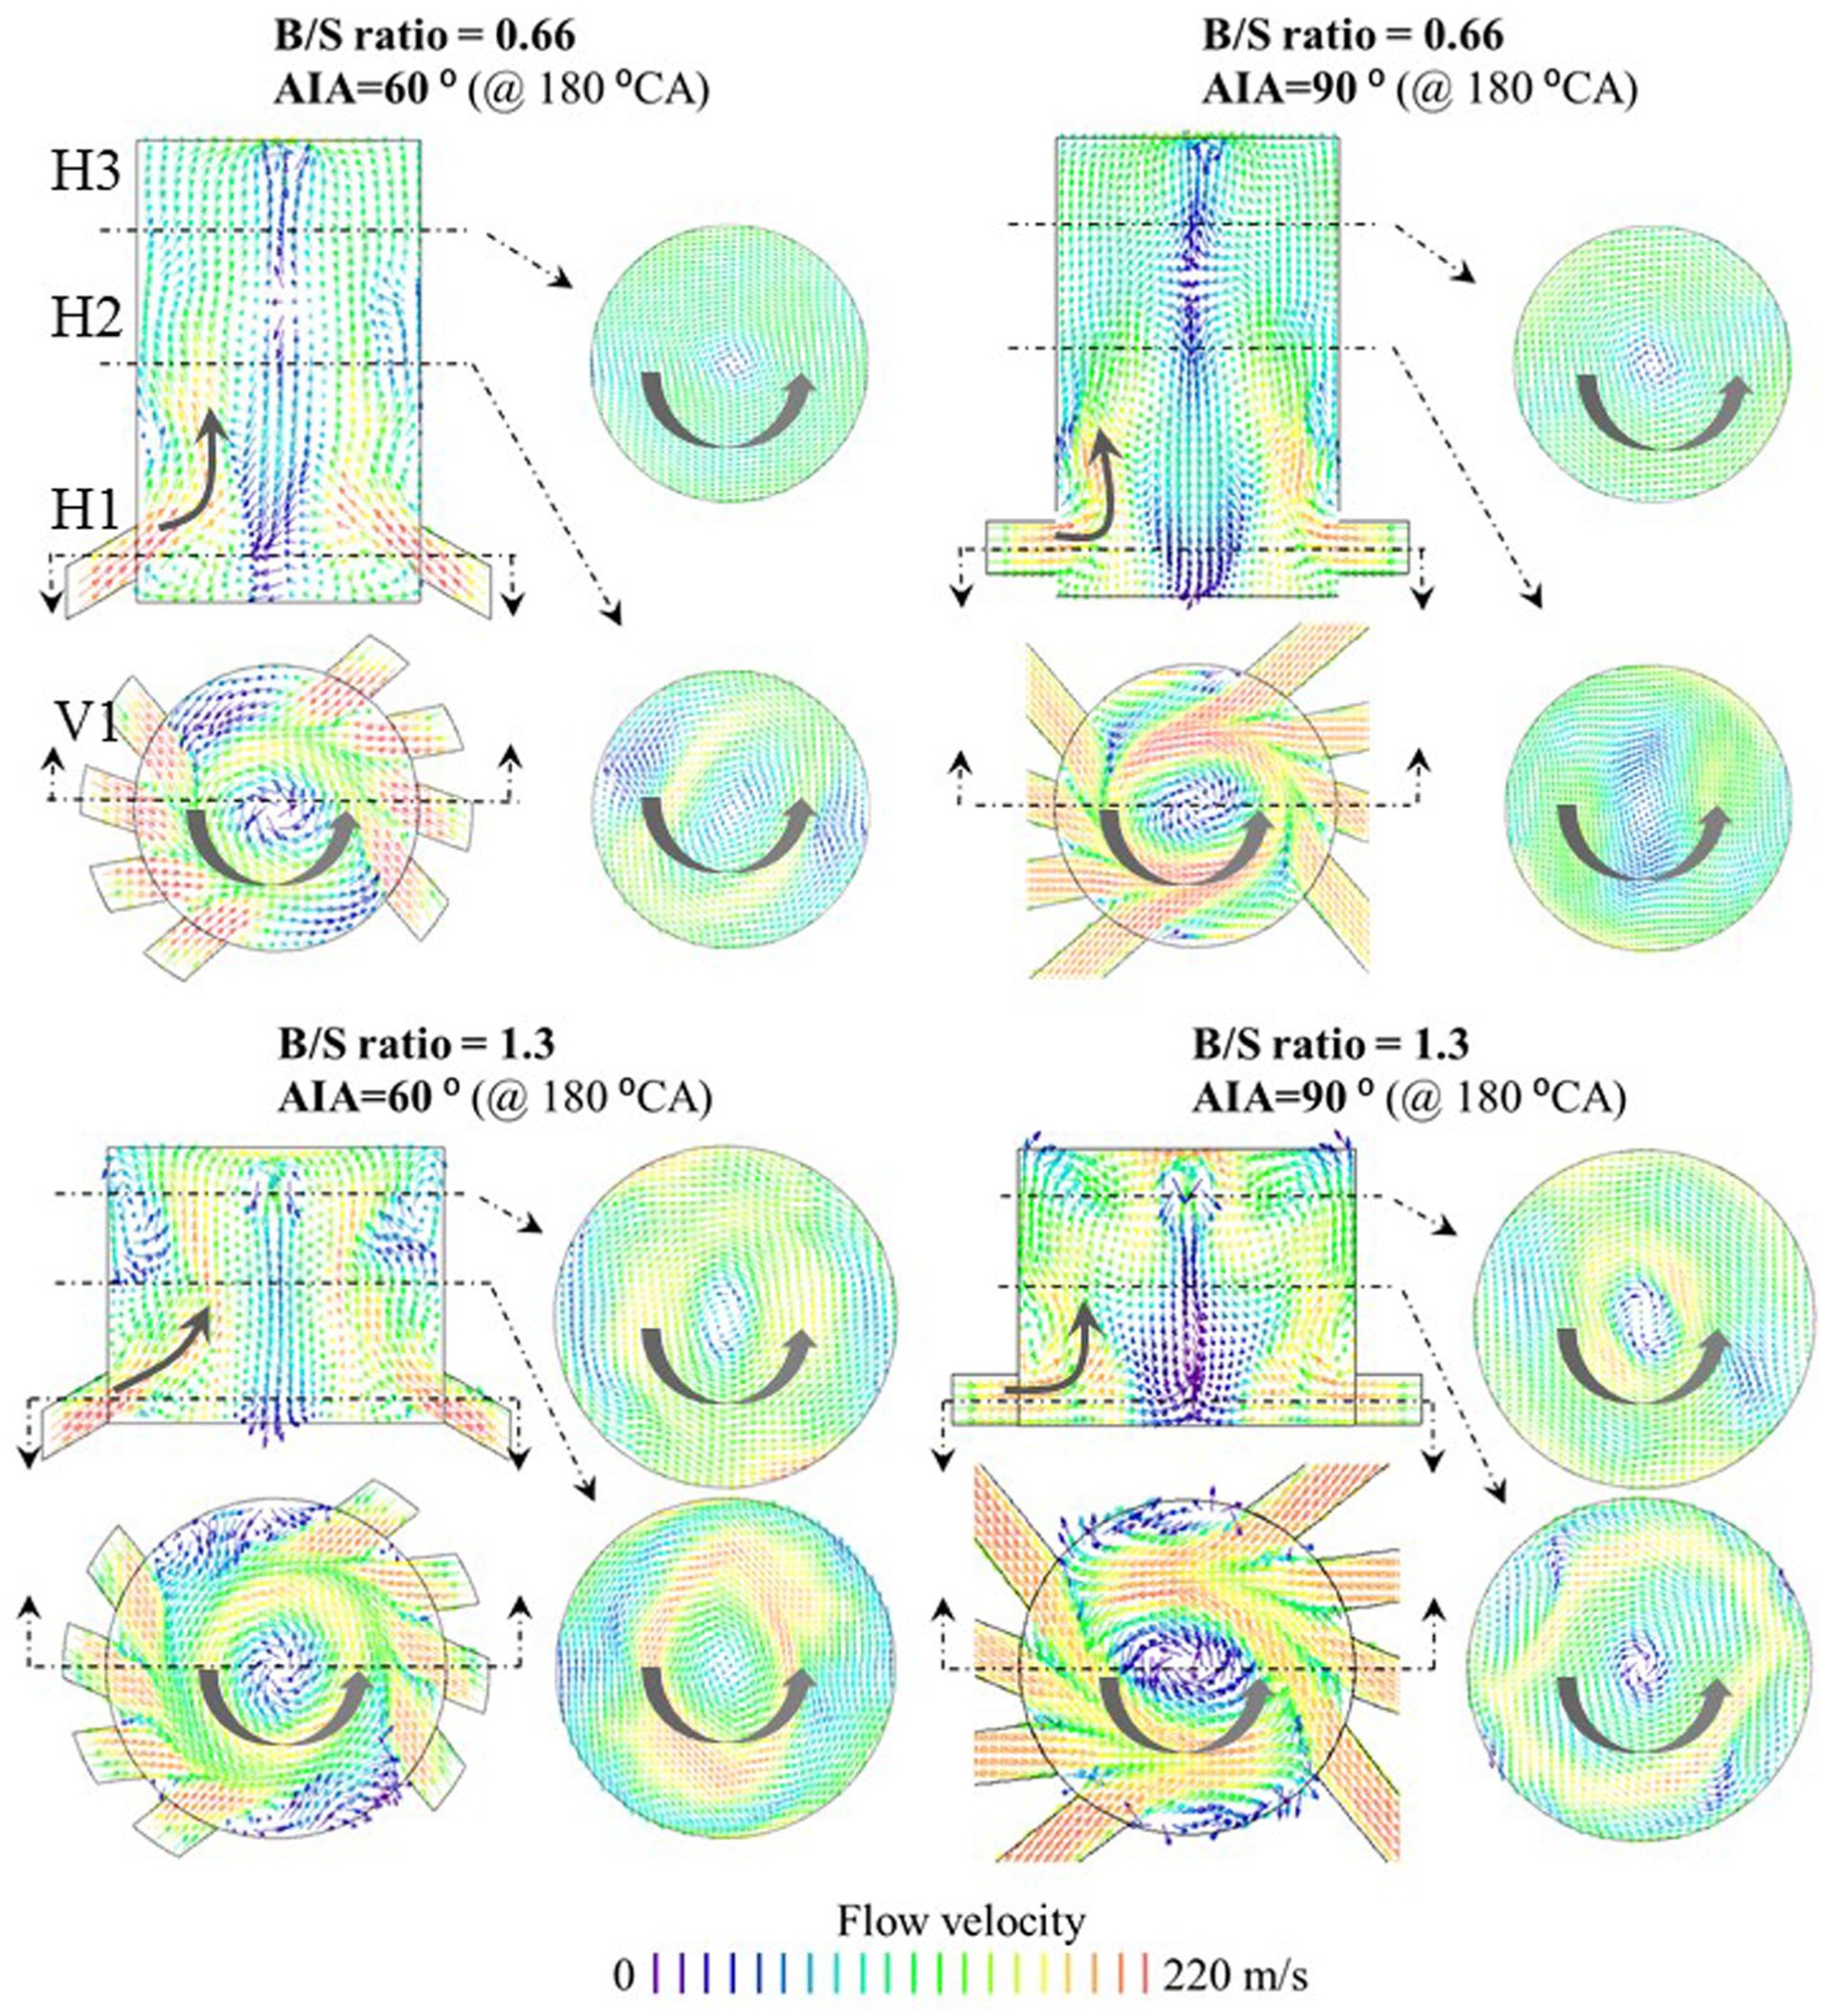
Comparison between the flow fields with AIA of 60° and 90°, and B/S ratio of 0.66 and 1.3.
However, it is also noted in Figure 12 that a larger AIA always leads to a faster decay of SR after the peak value due to the stronger interaction between the horizontal intake flow motion and the ascending piston during the compression stroke. The decay of SR becomes even slower and the corresponding slope of the SR profile is similar after the exhaust valve closing (EVC)/scavenge port closing (SPC) (around 240°CA) for different cases.
The above results demonstrate that the SR at the end of the scavenging process is mainly controlled by the peak SR value and the subsequent decay before the EVC/SPC. For a larger B/S ratio, the peak SR is similar for different AIA designs while the decay of SR is stronger for a large AIA, leading to monotonous decreasing trend with increasing AIA. For a small B/S ratio, a large AIA leads to a larger peak SR and the subsequent decay is also significant. The final SR is mainly determined by the peak SR when AIA is in the range 60–68°, but it becomes more affected by the decay of SR with larger AIA of 68–90°. In the case of AIA of 60°, as the B/S ratio increases from 0.66 to 1.3, the lower SR due to the larger bore and increased SR due to enhanced conversion of vertical flow to swirl flow finally leads to an early increase but later decrease of SR.
A larger AIA results in greater effective scavenging flow area and hence is expected to lead an improvement on the scavenging performances. However, the results in Figures 14 and 15 show that the AIA has less impact on the scavenging performance on an engine with a smaller B/S ratio of 0.66 than that with the B/S ratio of 1.3. The most affected is the DR and then the CE. The SE, and TE are insensitive to the AIA of the scavenge ports. The results of the effect of AIA on the DR, TE, SE, and CE with B/S ratio of 0.8 and 1 are provided in the Appendix for simplicity.
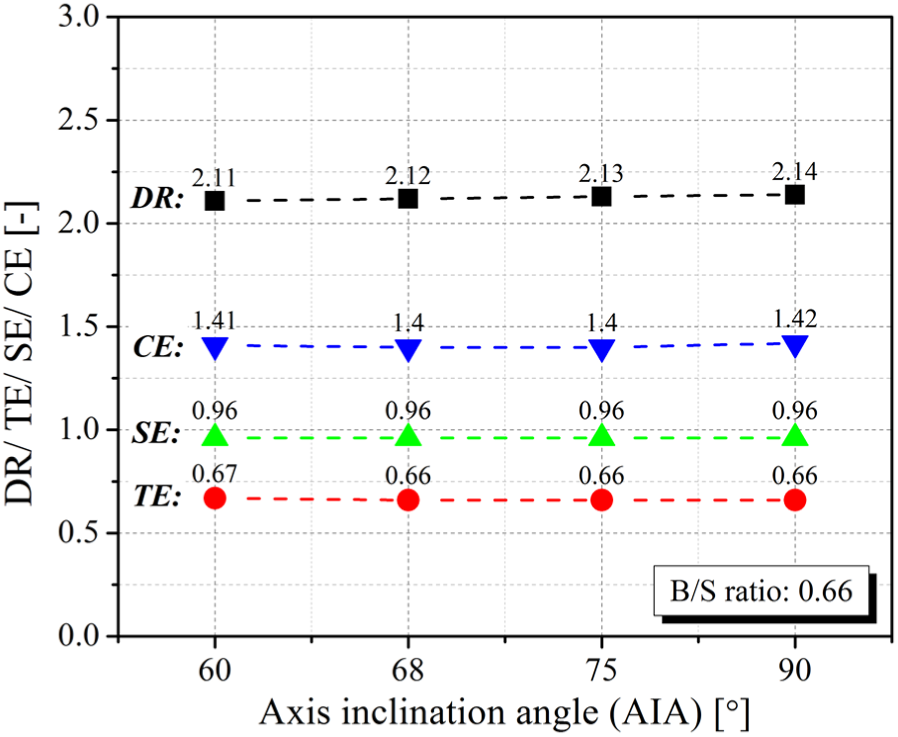
Effect of AIA on DR, TE, SE and CE with B/S ratio of 0.66.
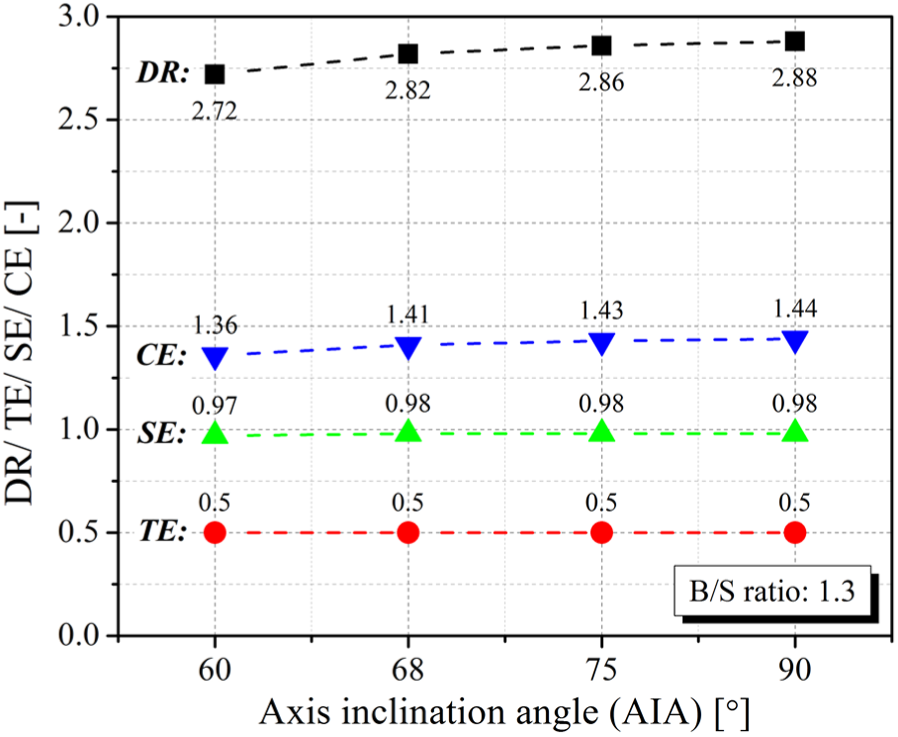
Effect of AIA on DR, TE, SE and CE with B/S ratio of 1.3.
The impact of the AIA on the scavenging process is further illustrated in Figure 16. It can be seen that a smaller AIA would lead to earlier charge short circuiting phenomenon but at a slower speed with the proceeding of the scavenging process, resulting in similar in-cylinder RGF at the end of the scavenging. This is the main reason of the similar SE values for different AIAs. In particular, the difference of the charge short circuiting, as indicated by the shadows between the profiles with different AIAs, is more pronounced for a large B/S ratio. This can be explained by the in-cylinder RGF distributions in Figure 17. A small AIA leads to a deeper penetration of fresh charge into the center of the cylinder, while a large AIA renders the fresh charge concentrating at the periphery of the cylinder. In addition, the fresh charge is able to reach the upper part of the cylinder with a small AIA design due to the higher vertical velocity components. However, it is noted that, for a long stroke design (smaller B/S ratio), the longer travel distance leads to less sensitivity of the charge short circuiting to the AIA. The residual gas in the upper part of the cylinder with a long stroke would help to block the charge short circuiting and also reduce its sensitivity to the AIA design. The obvious charge short circuiting can only be observed at 180°CA for both AIAs with B/S ratio of 0.66, as indicated by the marked circles in Figure 17. In comparison, the charge short circuiting can be observed at 170°CA for both AIAs with a large B/S ratio of 1.3 due to a short stroke design. Meanwhile, a large amount of fresh charge at the upper part of the cylinder for a small AIA brings about significantly stronger charge short circuiting. Since the fresh charge concentrates mainly at the lower part of the cylinder for a large AIA, the charge short circuiting is weakened. As a result, a big B/S ratio design leads to higher sensitivity of scavenging process to the AIA. This is further reflected by the change in CE with DR for different AIAs and B/S ratios in Figure 18. The higher sensitivity of the short circuiting to AIA for a large B/S ratio of 1.3 leads to lower CE with a small AIA of 60° when the DR exceeds 1. As the TE is calculated by the ratio between CE and DR, the simultaneous variation of CE and DR at the end of scavenging leads to little impact of AIA on TE, as shown in Figures 14 and 15.
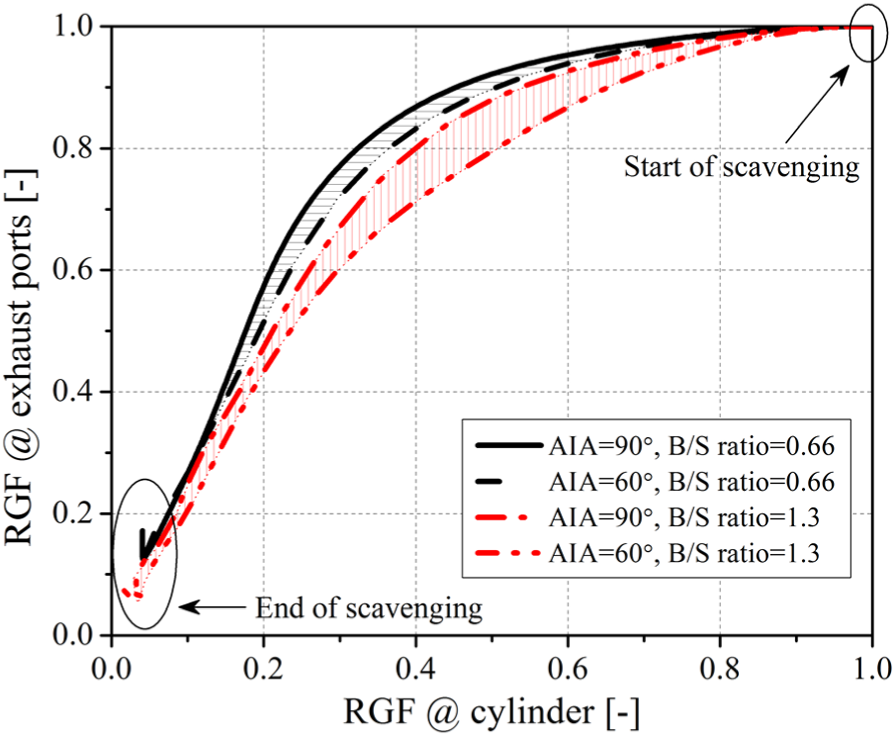
Comparison of RGF profiles in the cylinder and exhaust ports with AIA of 60° and 90°, and B/S ratio of 0.66 and 1.3.
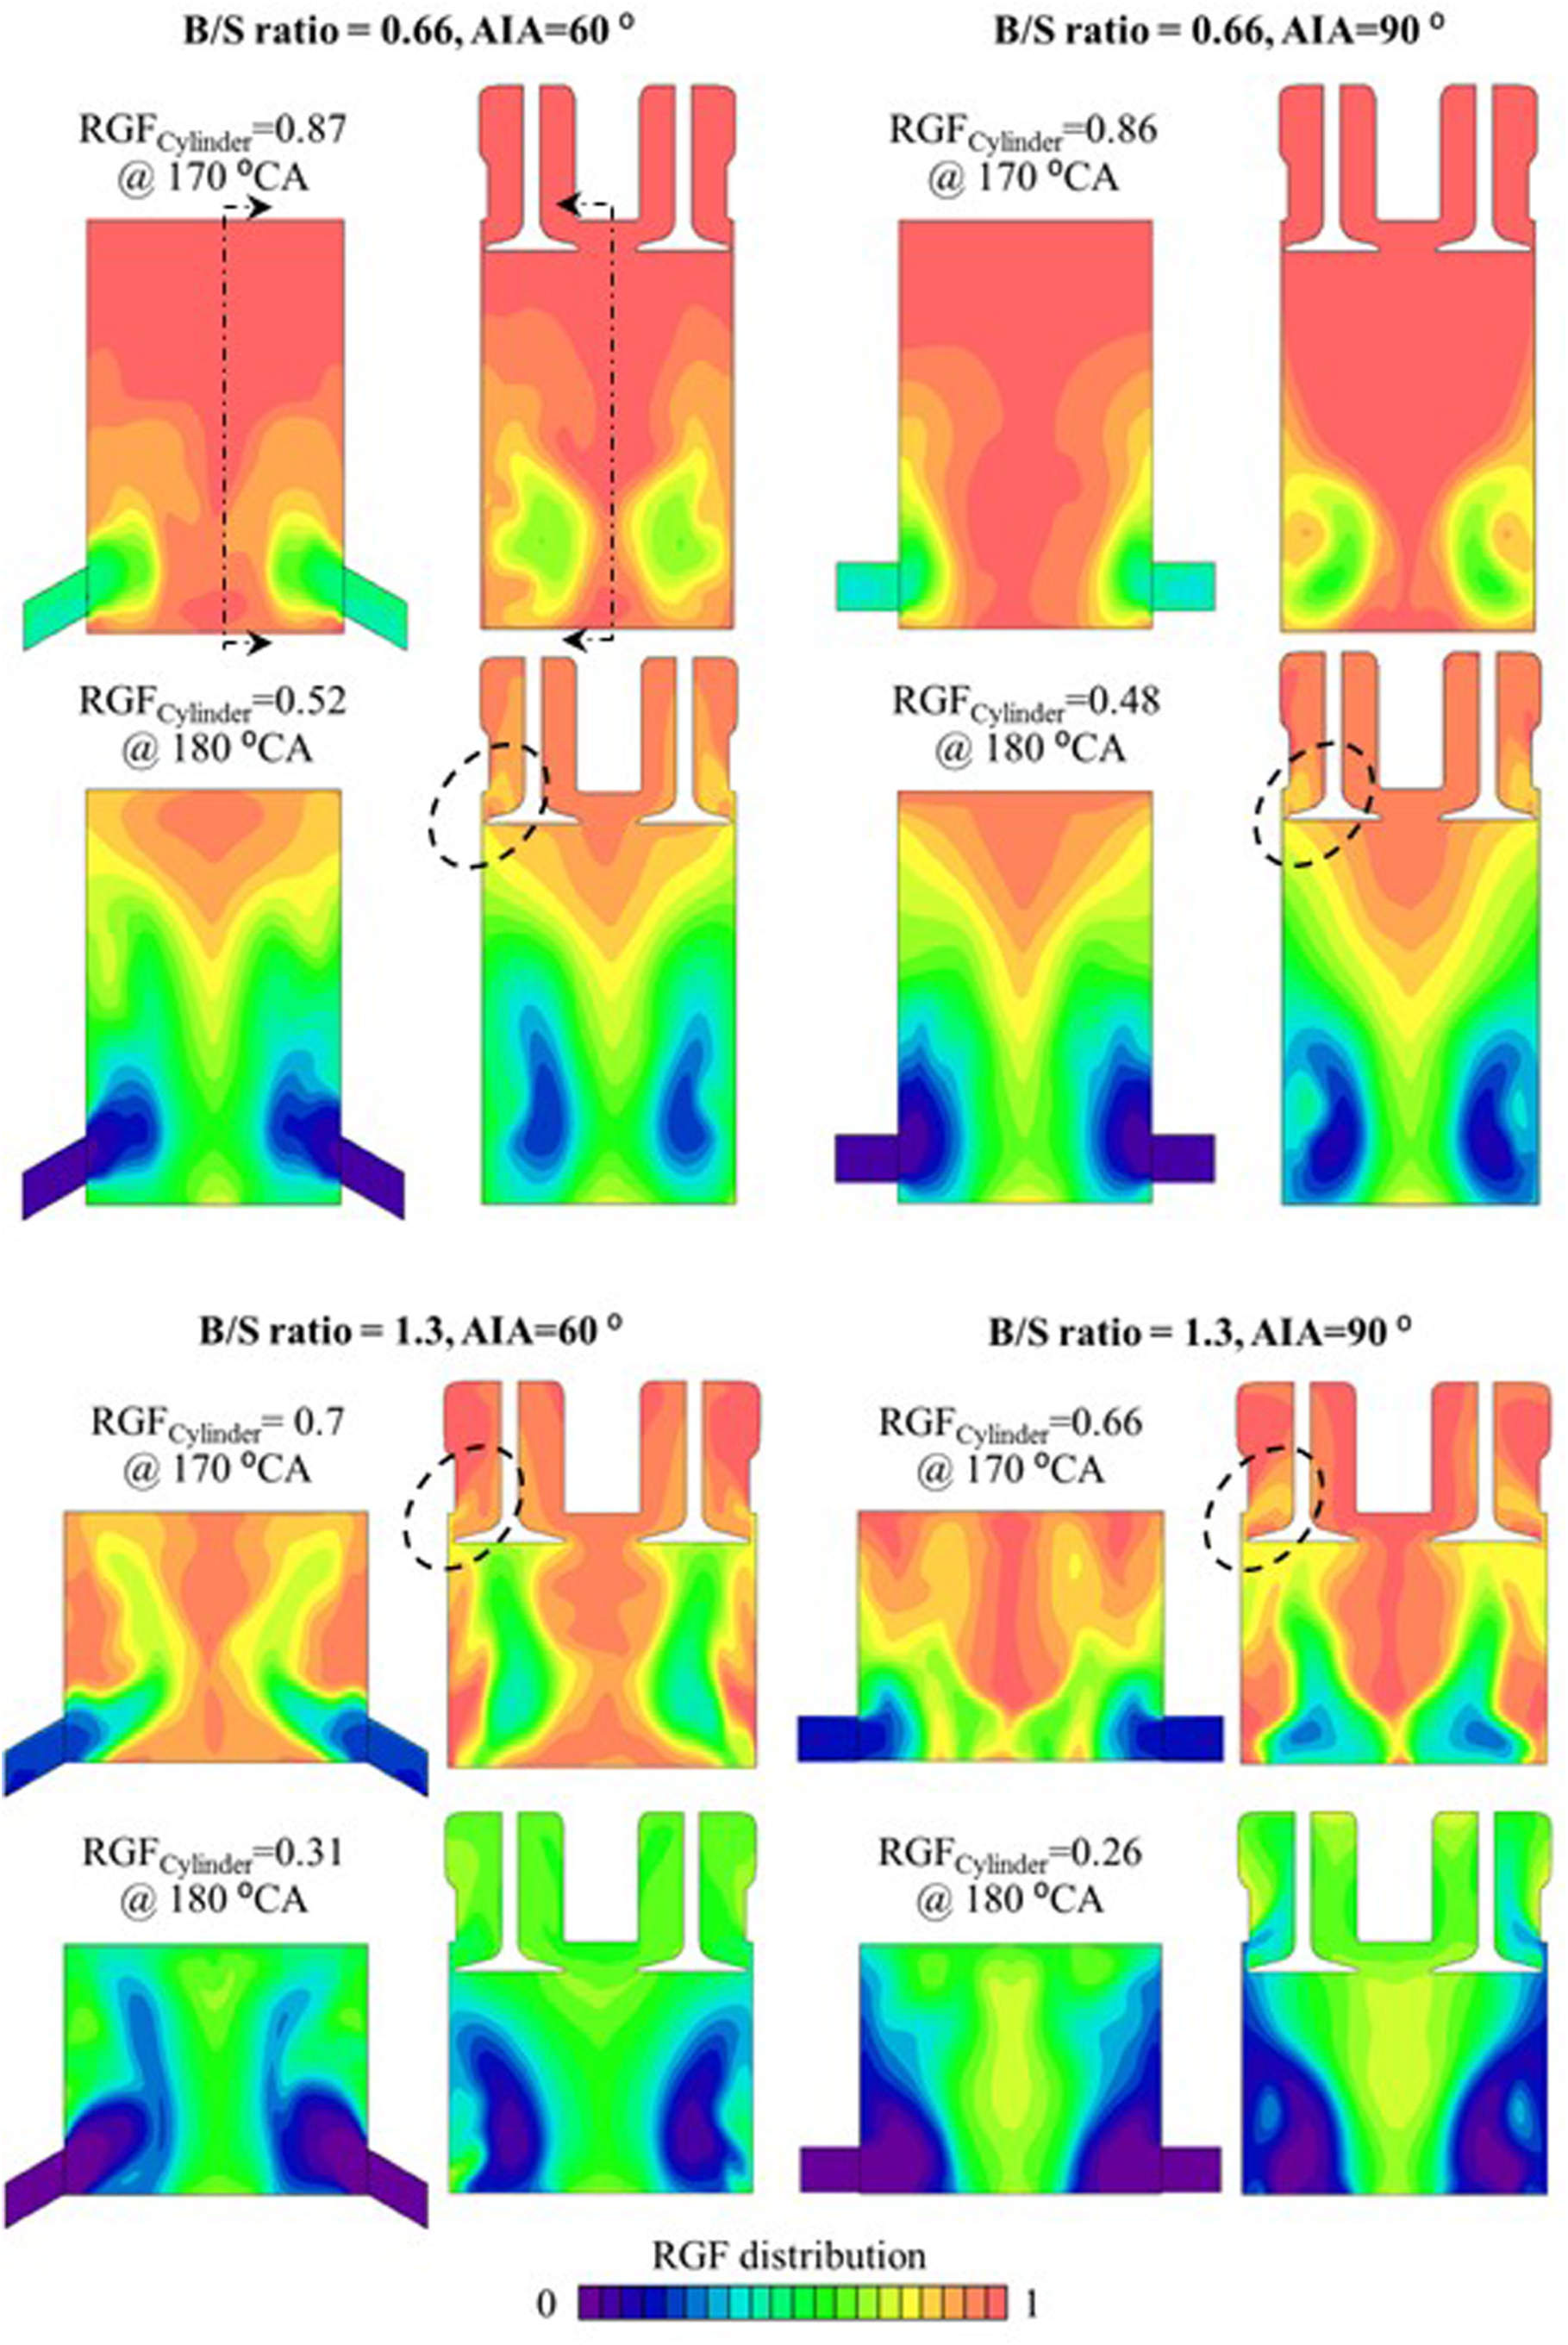
RGF distributions at 170 and 180°CA with AIA of 60° and 90°, and B/S ratio of 0.66 and 1.3.
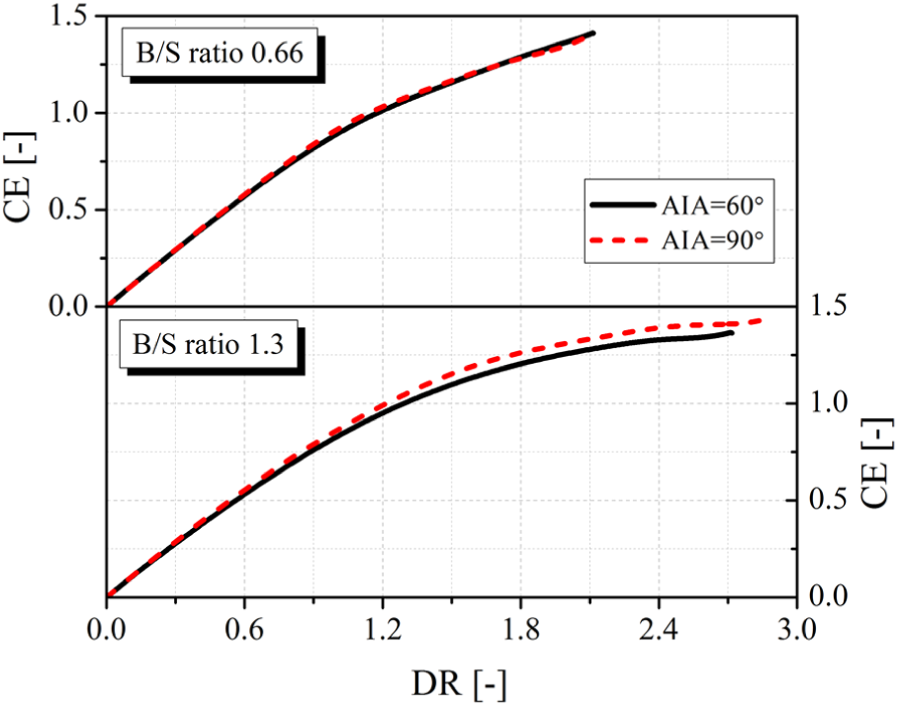
Evolutions of CE with DR for different AIAs and B/S ratios.
Effect of SOA on scavenging process with different B/S ratios
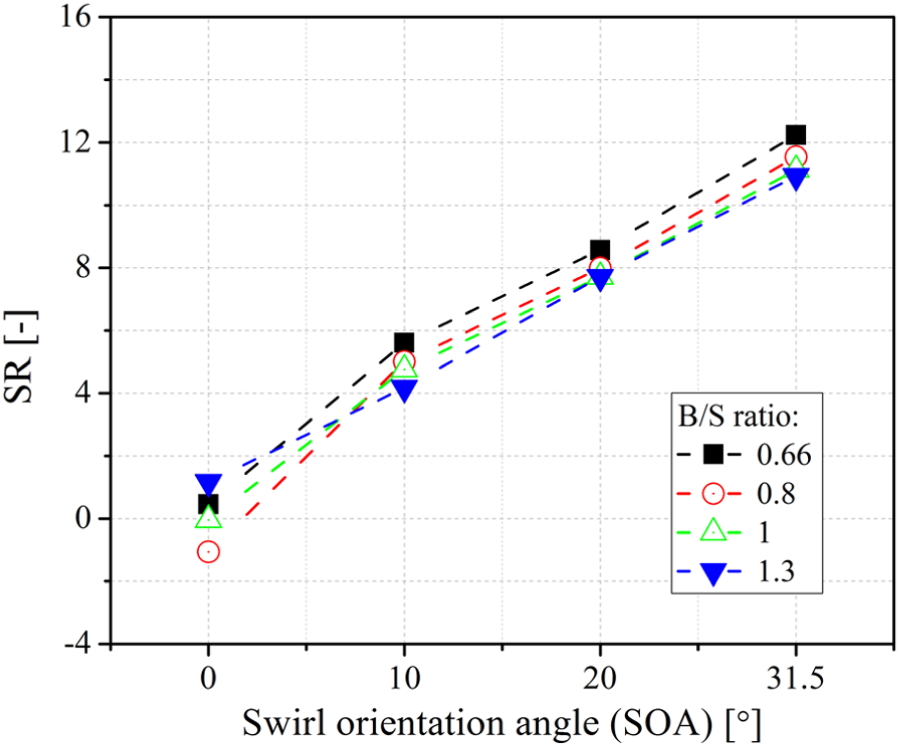
In this section, the effect of SOA on scavenging process was analyzed. The AIA angle was fixed at the baseline value (90°) for each case. As shown in Figure 19, the swirl flow motion is enhanced with increasing SOA. A large B/S ratio leads to a lower SR due to a larger bore, as discussed in previous section, except for the results with AIA of 0° in which the flow field becomes more chaotic as all the flow jets directly point to the center of the cylinder.
Effect of SOA on SR at 280°CA with different B/S ratios.
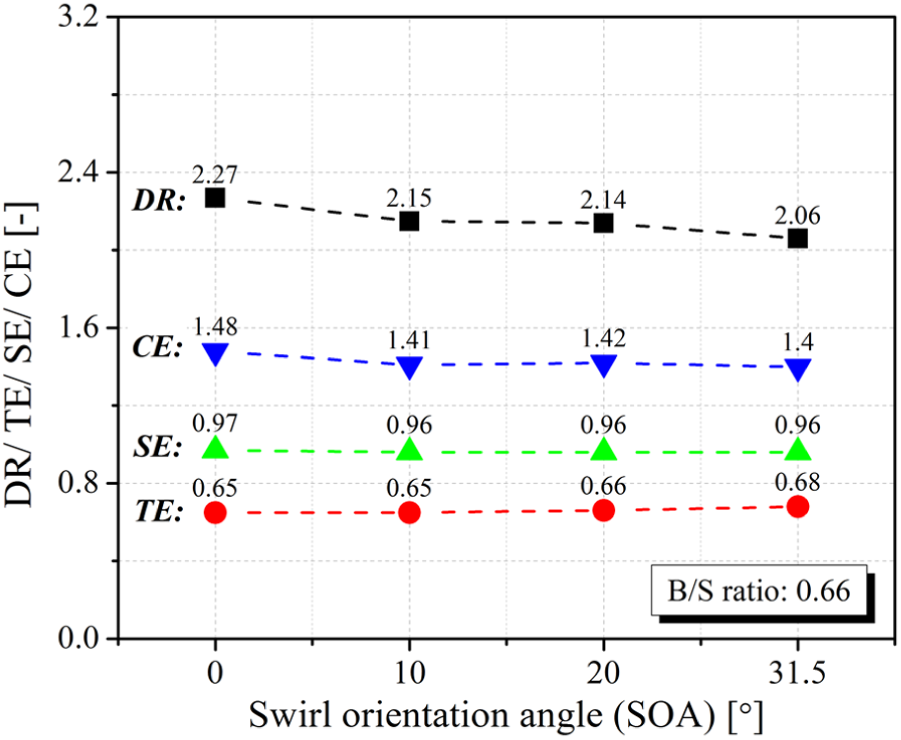
Figures 20 and 21 compare the effect of SOA on DR, TE, SE, and CE with B/S ratio of 0.66 and 1.3, respectively. The corresponding results with B/S ratio of 0.8 and 1 are provided in the Appendix for simplicity. For a uniflow engine with a long stroke and small B/S ratio, both DR and CE show a decreasing trend with SOA increasing from 0 to 31.5°. The TE is also improved slightly with a larger SOA, but SE is slightly lower, as shown in Figure 20. However, it is noted in Figure 21 that both DR and CE peak at an intermediate SOA value, e.g. 10° and 20°, in the engine with a short stroke and large B/S ratio. Meanwhile, both TE and SE are improved slightly with a large SOA.
Effect of SOA on DR, TE, SE, and CE with B/S ratio of 0.66.
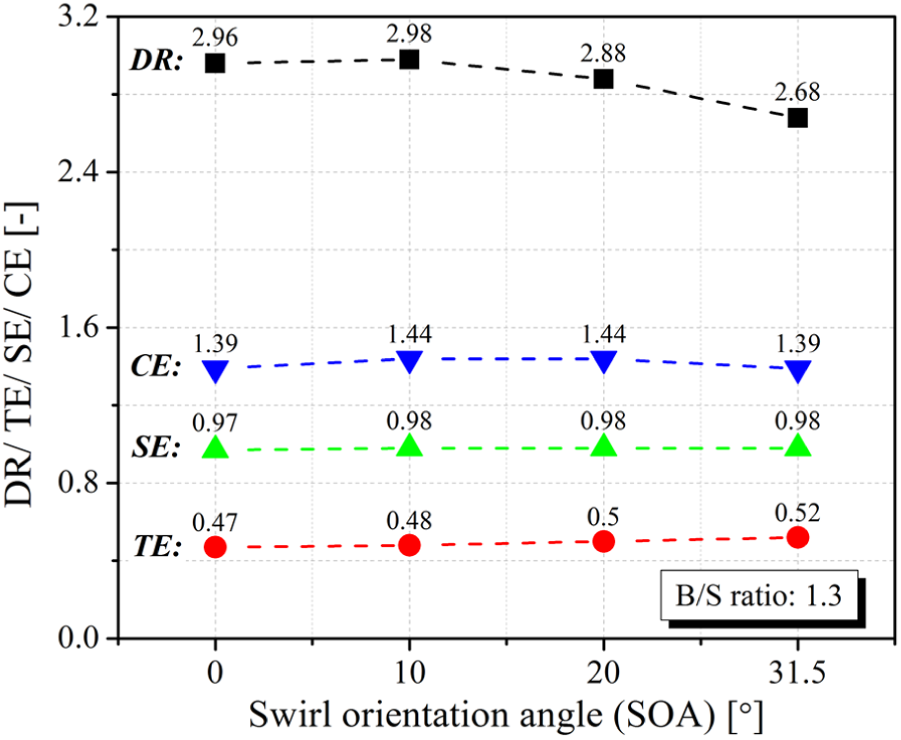
Effect of SOA on DR, TE, SE, and CE with B/S ratio of 1.3.
Figure 22 compares the RGF profiles in the cylinder and exhaust ports with SOAs of 0° and 31.5°, and B/S ratios of 0.66 and 1.3. Overall, the charge short circuiting with different SOAs is weaker for the small B/S ratio design. Although the variation of RGF profile with different SOAs for the small B/S ratio is slight, the better scavenging performance at early stage (RGFCylinder < 0.4) with weaker charge short circuiting can be observed for a large SOA of 31.5°. With the proceeding of the scavenging process, the charge short circuiting gradually become more noticeable for SOA of 31.5°, as represented by the significant drop of the RGF profile. Therefore, a larger SOA would benefit the early scavenging process but gradually deteriorate the scavenging at later stage. This effect is more pronounced for a short stroke and large B/S ratio design. As shown in Figure 22, for the B/S ratio of 1.3, the charge short circuiting with SOA of 31.5° is significantly weaker at the early stage of the scavenging process. But the RGF profile with SOA of 31.5° drops rapidly at the later stage and approaches to the RGF profile with SOA of 0° at RGFCylinder around 0.1.
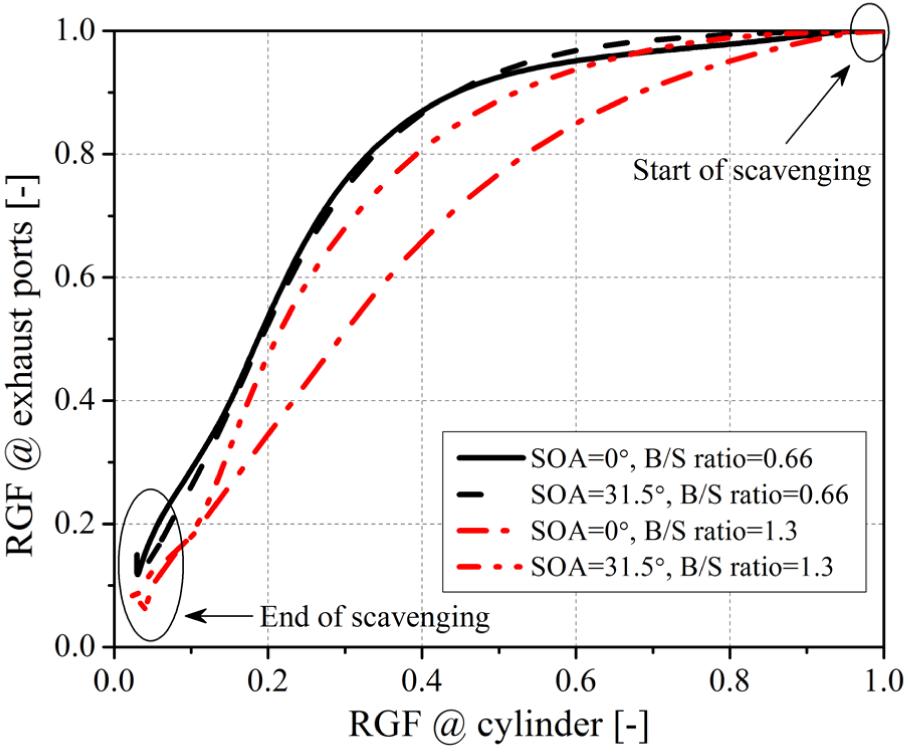
Comparison of RGF profiles in the cylinder and exhaust ports with SOA of 0° and 31.5°, and B/S ratio of 0.66 and 1.3.
The in-cylinder RGF distributions in Figure 23 show that more fresh intake charge tends to be in the center of the cylinder with SOA of 0° and concentrates at the outer region of the cylinder with a large SOA of 31.5°. A longer stroke with small B/S ratio would then help to reduce the charge short circuiting for both SOAs due to the longer travel distance of fresh charge to exhaust valves. In the case with SOA of 0°, the stronger interaction of the intake flow jets in the cylinder center would form an upward movement of the fresh charge, resulting in earlier occurrence of the charge short circuiting. However, the large SOA of 31.5°, the slower transport of the fresh charge at the outer region to the exhaust valves leads to delayed air short circuiting towards the end of scavenging process. In addition, as the B/S ratio increases from 0.66 to 1.3, the shorter stroke weakens the mixing of the penetrated fresh charge with the central residual gas while rending a direct short circuiting from cylinder center for SOA of 0°. As a result, the residual gas at two sides would be difficult to be scavenged, which contributes to a decrease of SE for SOA of 0°. Comparatively, the charge short circuiting is significantly improved for SOA of 31.5° at the early scavenging stage because of less upward motion of the fresh intake charge. However, as the fresh charge at the outer region approaches the exhaust valves, the short circuiting would then become more pronounced.
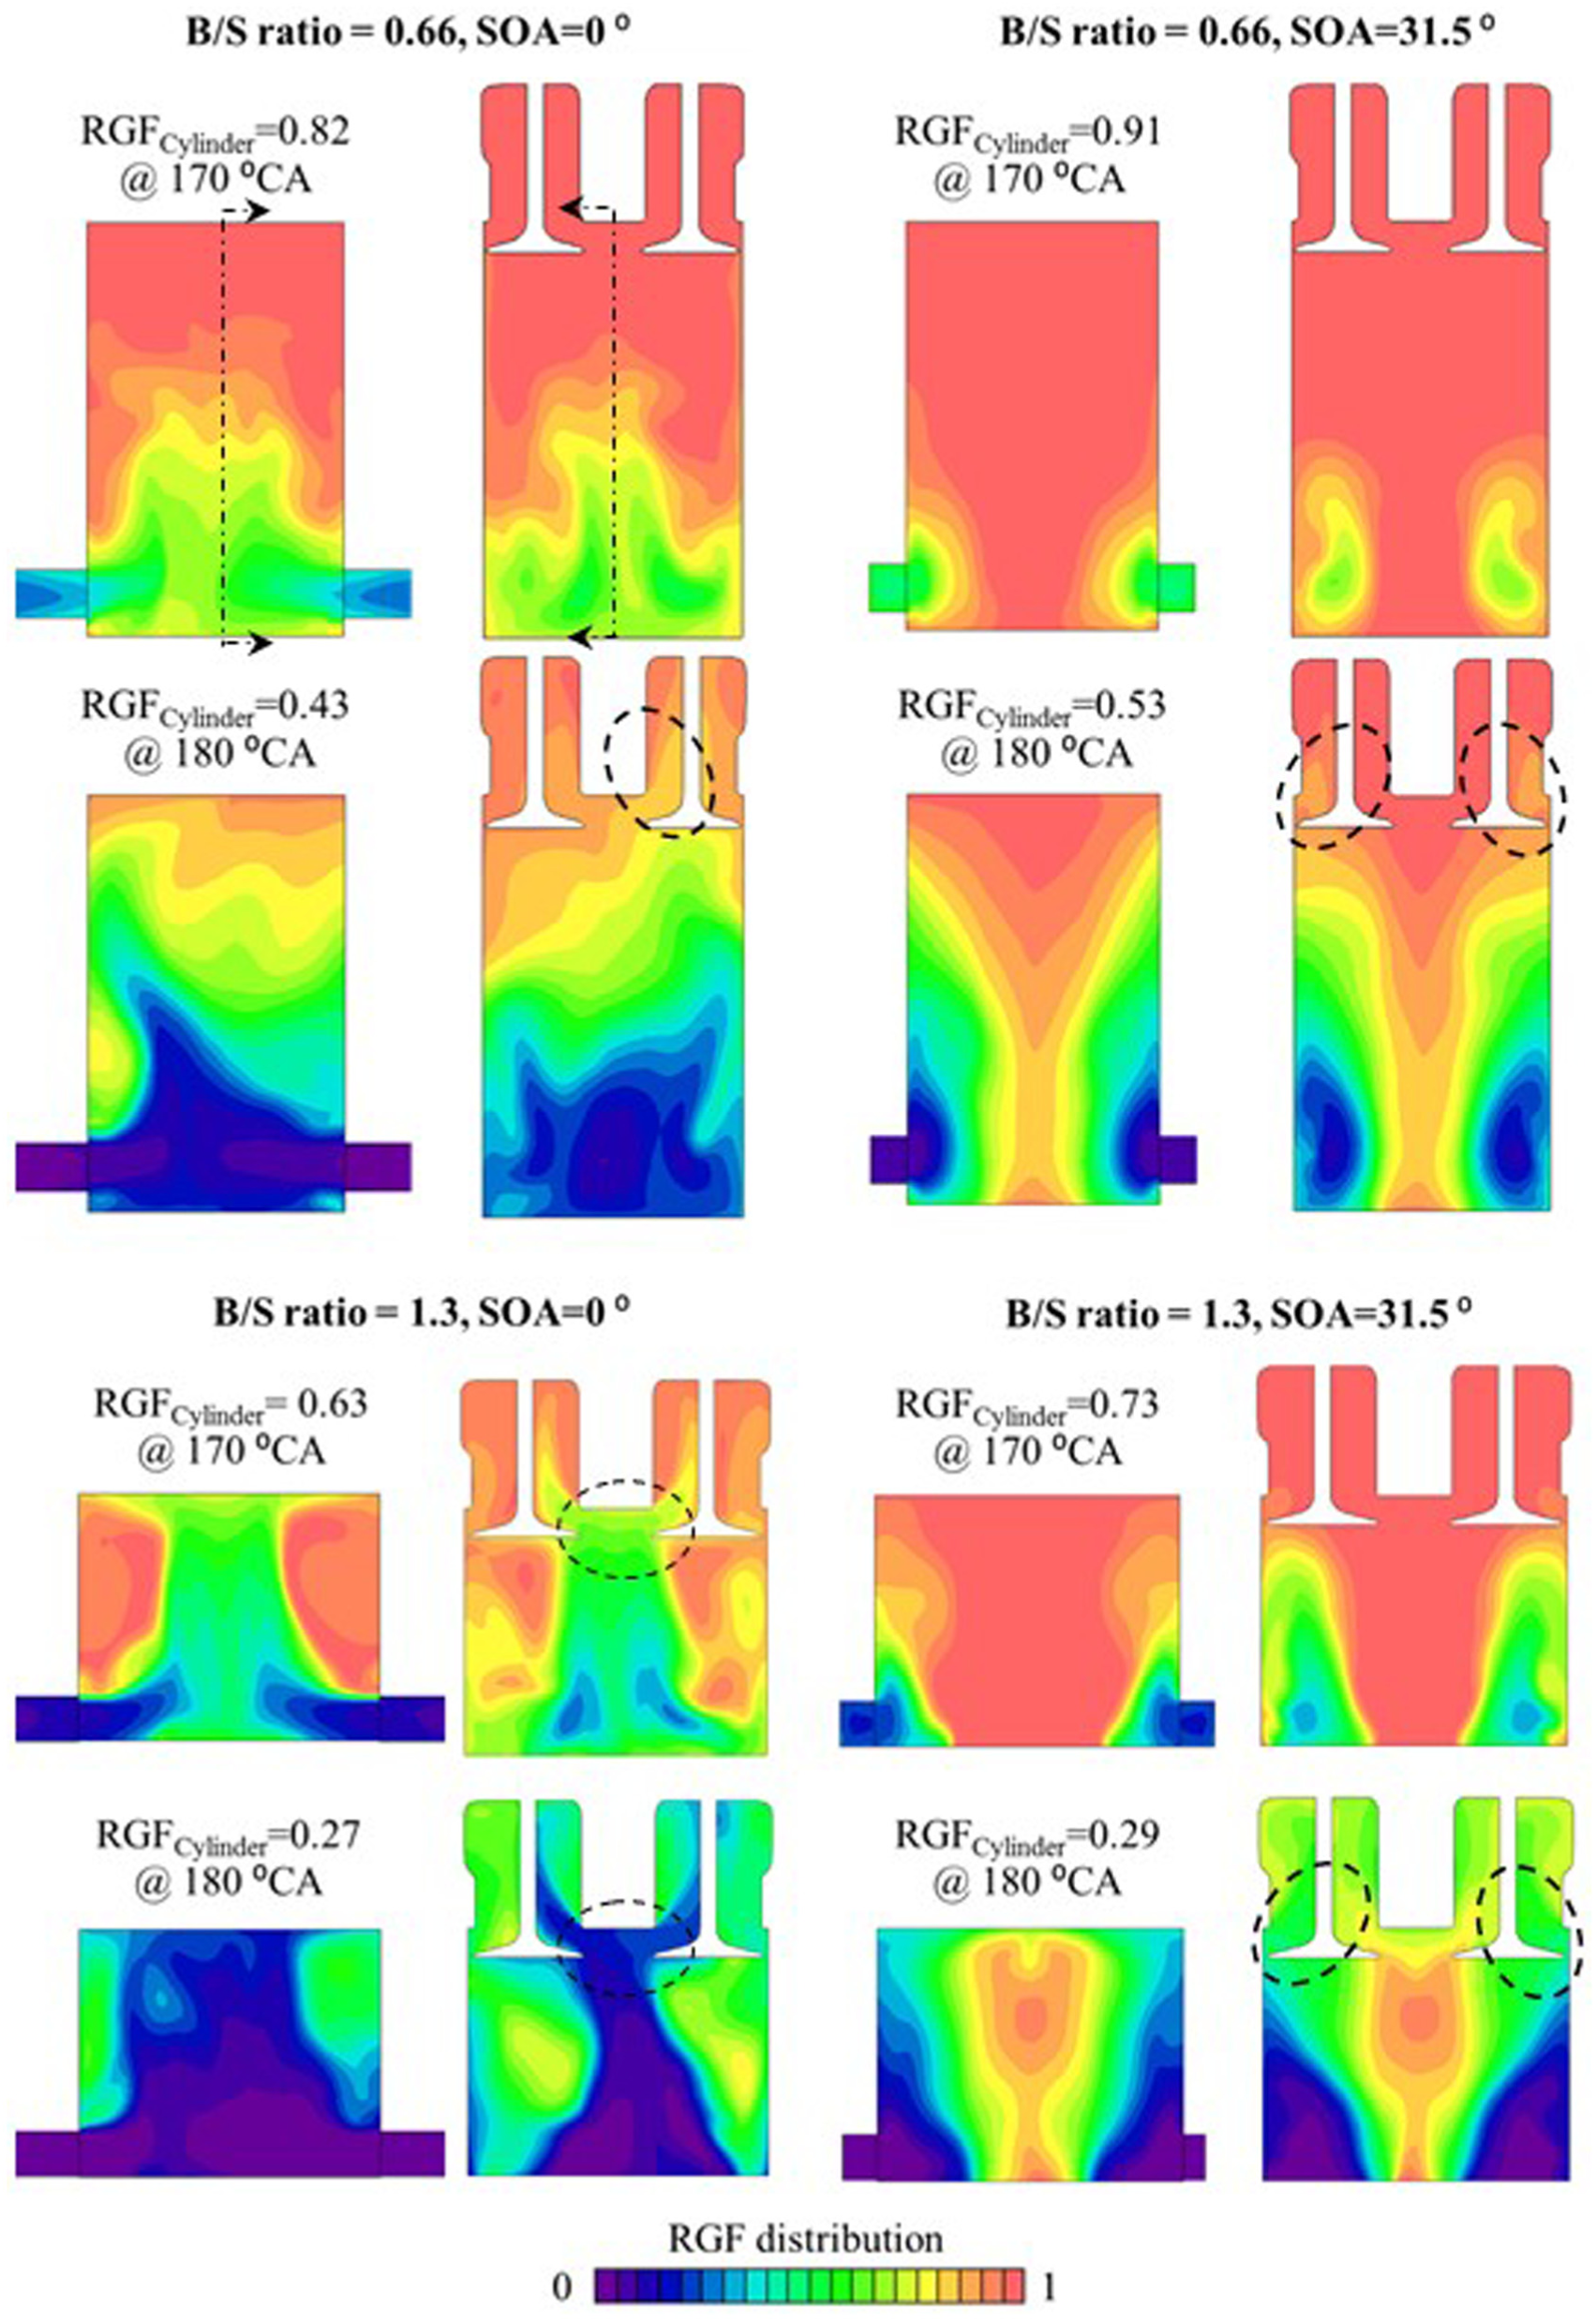
RGF distributions at 170 and 180°CA with SOA of 0° and 31.5°, and B/S ratio of 0.66 and 1.3.
As Figure 24 shows, for a small B/S ratio, the relationship between CE and DR is unaffected by the SOA, indicating a similar charge short circuiting rate at any given time during the scavenging process. For a large B/S ratio, the earlier charge short circuiting with a small SOA would lead to slower increase in CE at the early stage of scavenging, while the enhanced charge short circuiting at the later stage with a large SOA would slow down the increase of CE when DR exceeds 1.2. The improved scavenging performance at both early and late stage of scavenging is found with an intermediate SOA, e.g. 20°, for a large B/S ratio design.
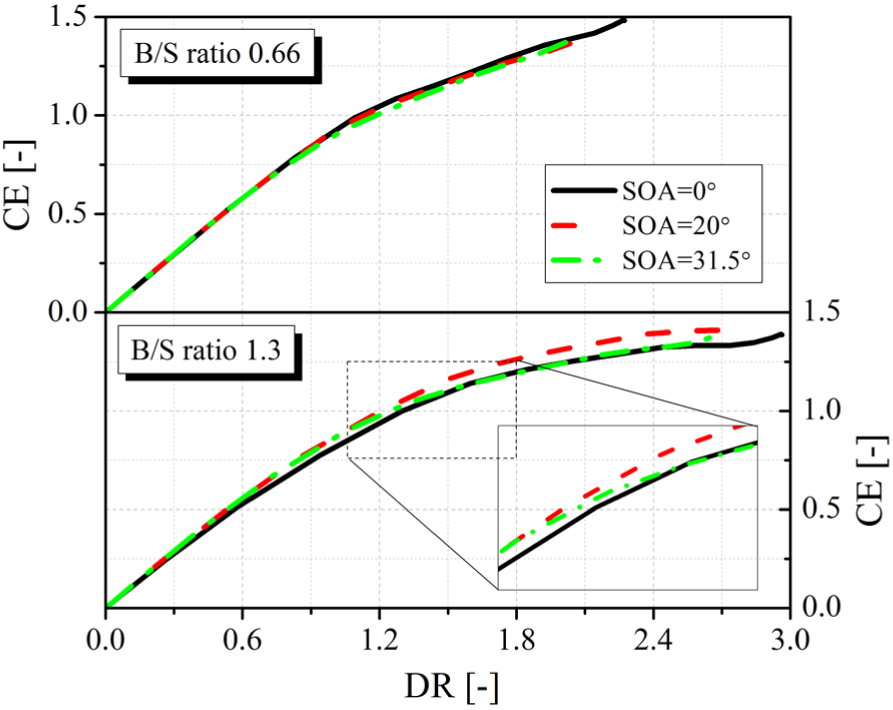
Evolutions of CE with DR for different AIAs and B/S ratios.
Summary and conclusions
In this study, 3D CFD simulations were performed to understand the effect of B/S ratio and the scavenge port angles on scavenging process in a BUSDIG engine. Two important design parameters, i.e. AIA and SOA, were investigated in detail for each B/S ratio design to achieve the optimal scavenge performance for each B/S ratio design. The findings are summarized as follows:
The increase in the B/S ratio leads to lower SR and has little impact on the TR and CTR. The larger B/S ratio also significantly increases the DR due to lower scavenging resistance, which in turn contributes to the slightly higher SE, and higher CE. However, the TE is reduced with a larger B/S ratio.
The SR at the end of scavenging is mainly controlled by the peak SR value and the subsequent decay process before the closing of exhaust valves and scavenge ports. A large AIA leads to a larger peak SR for a small B/S ratio, while the peak SR is similar for different AIAs for a larger B/S ratio. The subsequent decay is more significant for a large AIA regardless of the B/S ratios. As a result, the SR peaks at AIA of 68° for the small B/S ratios, i.e. 0.66 and 0.8, while SR shows a monotonously decreasing trend with AIA increasing for the larger B/S ratios, i.e. 1 and 1.3.
Regarding the complex impact of the B/S ratio on SR with AIA of 60°, the combined effect of a lower SR due to the larger bore and increased SR due to enhanced conversion of vertical flow to swirl flow finally leads to an early increase and later decrease of SR with B/S increasing from 0.66 to 1.3.
The scavenging performance shows stronger sensitivity to the scavenge port design for a large B/S ratio. Both DR and CE are increased proportionally with increasing AIA for a large B/S ratio of 1.3, resulting in the same TE. Meanwhile, the SE is improved slightly with a big AIA.
The swirl flow motion is enhanced with the increasing SOA. A larger SOA would promote the early scavenging process but gradually deteriorate the scavenging at later stage. This effect is more pronounced for a short stroke design. As a result, for a small B/S ratio design, DR, CE and SE show a decreasing trend with SOA increasing from 0 to 31.5°, but TE is improved slightly. However, DR and CE peak at an intermediate SOA value, e.g. 10° and 20° for a large B/S ratio. Meanwhile, both TE and SE are improved slightly with a large SOA design.
Overall, it is found in this study that a bigger B/S ratio can improve the scavenging performances with slight deterioration on SR. A larger AIA leads to a lower SR but achieves better scavenge performances, which is of particular importance for a large B/S ratio design. A small SOA design leads to lower SR but superior scavenging performances for a small B/S ratio design, but an intermediate SOA, e.g. 10 and 20°, is preferred to improve the scavenging for a large B/S ratio design.
Footnotes
Appendix
Declaration of conflicting interests
The author(s) declared no potential conflicts of interest with respect to the research, authorship, and/or publication of this article.
Funding
The author(s) disclosed receipt of the following financial support for the research, authorship, and/or publication of this article: This work was supported by the Engineering and Physical Sciences Research Council (EPSRC).