
Abstract
The COVID-19 pandemic is having a significant impact on tourism, and emotion projection is one way to understand the extent of destination image resiliency during the crisis. Therefore, this research captured emotions expressed in social media during a peak pandemic month to compare to the prior year period. Toronto and New York were selected due to their tourism importance within their countries but to also compare the effects of different policy approaches used during the pandemic. This study found resiliency of the destination images although there was a significant increase in projections of fear for both cities. Additionally, there was a significant divergence observed for the two cities with a decrease in joy and an increase in sadness projections for New York versus Toronto. This implies that tourism destination marketers have a stable basis of emotions to use in communications, but there are weaknesses to address.
Introduction
With the emergence of a novel coronavirus (COVID-19), we now face a dramatic downturn in the global tourism industry. Some estimates have pegged the decline in the range of 20%–30% (UN News, 2020) or up to 60%–80% for the international tourism economy (OECD, 2020). Historically, pandemics have not only resulted in high mortality but also helped to reshape how we live and work. For example, the tourism industry was badly hit after the outbreak of a coronavirus in 2003 that caused severe acute respiratory syndrome (SARS) (Dombey, 2004; Kuo et al., 2008; Mason et al., 2005; Min, 2005; Wen et al., 2005; Wilder-Smith, 2006). This global epidemic not only put tourists at risk but also exposed the travel destination and tourists’ home countries. The volume of media coverage and the alarming emotions expressed helped to shape public opinion of travel and tourist destinations. For example, Toronto shifted from being viewed as a safe destination to one that was more dangerous due to the SARS outbreak (Mason et al., 2005). However, the current pandemic is more severe than SARS because it only affected 26 countries, infected 8,000 people, and decreased international tourism by 0.4% (UN News, 2020). Therefore, the emotional intensity is likely to be higher in the COVID-19 pandemic.
Emotions play an important and central role in tourist destination images (Kim and Yoon, 2003; Stylidis et al., 2017). Specifically, emotions can be a driver for motivating travel and may predict future behavior (Chung and Zeng, 2020; Nadeau et al., 2008; Park et al., 2018; Rahmani et al., 2019). Therefore, understanding emotions can be an important lens to understand tourists’ perspective about a destination and social media platforms allow people to share their thoughts and feelings about a place. Besides generating content on social media, users can also use the postings to inform their perspective about a destination. For example, Twitter provides an online public platform for users to post short 140 character texts that are often directly associated with topics through the use of @ symbols or hashtags. Sentiments in messages can not only have an immediate influence but, they are searchable and thus, are longer lasting. This means that tweets can help to uncover public perceptions and feelings associated with current events and travel destinations. Additionally, sentiment analysis of informal language within microblogs (e.g., tweets) in relation to a natural disaster can add to the literature as, according to Rout et al. (2018) and Gruebner et al. (2018), this is an understudied area.
The purpose of the research is to assess the projection of emotions among tourists to understand the extent of destination image resiliency while under considerable stress during the COVID-19 pandemic. Therefore, this research captured emotions expressed in social media texts during a peak pandemic month and compared the portrayals to the prior year period. In particular, the current research sought to understand foundational emotions and potential changes in those sentiments for major tourism destinations linked to the pandemic. Toronto and New York City (NYC) were selected due to their importance within their countries as tourist destinations but also to compare the effects of different policy approaches to the pandemic.
Literature review
Pandemics and tourism
There is a body of research at the intersection of tourism and pandemics based on another novel coronavirus that first emerged back in 2002 (Dombey, 2004; Kuo et al., 2008; Min, 2005; Wen et al., 2005; Wilder-Smith, 2006). Coordinated global efforts through public health interventions quickly controlled the spread of the disease with no cases reported since 2004. The severe acute respiratory syndrome (SARS) pandemic was similar to the COVID-19 pandemic as both are novel viruses likely of zoonotic origin causing respiratory diseases. In the case of SARS, there was a direct impact on tourism in affected countries. For instance, Wen et al. (2005) analyzed the impacts of SARS on Chinese tourists’ behavior. They found that SARS influenced people’s daily life in China and reduced travel significantly, especially in the outbreak areas. Fear drove many people to shift travel to exploring their home countries instead of international destinations. Wilder-Smith (2006) notes that international arrivals were down in general while arrivals were down significantly in virus stricken hotspots. Similarly, Min (2005) research indicated Taiwan’s visitor arrivals were severely reduced during SARS by as much as 50% during the main weeks of the pandemic.
Mason et al. (2005) highlighted the role of media in influencing tourism and travel destinations, even up to 18 months after the health crisis. For SARS, the span, as well as the sensationalistic and exaggerated tones portrayed in media, contributed to its overall impacts. In North America, Toronto was identified as an epicenter for the SARS virus and American perceptions of Canada as a safe destination were changed. While the SARS pandemic was not as severe as the COVID-19 pandemic, the pandemic and travel were interlinked because travelers were identified as vectors for viral transmission in the early stages portraying travel as a risky activity (Wilder-Smith, 2006).
Emotions and tourism destination images
In the last few years, emotion detection within publicly posted natural language texts has become a point of interest for researchers (Abeysinghe et al., 2018; Charlton et al., 2016). Sentiment analysis is an established method to measure an opinion leader’s positive, negative, or neutral feelings expressed in a group of words relating to an entity (produce or service) or feature of the entity (Chung and Zeng, 2020). Thus, sentiment analysis can be defined as “an approach for analyzing people’s opinion, sentiment, attitude, evaluation and emotions towards an entity” (Rout et al., 2018, p. 182). Within the sentiment analysis literature, an intriguing and less explored facet is the recognition of types of emotions and a measure of their strength or intensity (Aman and Szpakowicz, 2007). Emotion is an important area of study because it offers a deep understanding of various aspects of a person’s experience (Aman and Szpakowicz, 2007; Chung and Zeng, 2020). According to Park et al. (2018), “many researchers describe emotion as individualistic, a psychological predisposition highly related to cognition and appraisal” (pg. 665). Dissimilar from knowledge (i.e., non-emotional information processing), emotion is tied to positive or negative feelings which can be traced to perceptions of harm or imagined benefits of the various stimuli found in one’s surroundings. Emotional analysis goes deeper than sentiment analysis, which looks only at positive or negative feelings, as it attempts to explore and find meaning in granular emotional differences expressed by linking the words into specified categories for further analysis. With the prevalence of online forums, easy access to these expressions of emotions surrounding tourists’ experiences has offered a new and exciting venue for researchers.
Ekman’s (1992) theory about foundational emotions experienced and expressed across cultures identifies six core emotions: fear, anger, disgust, sadness, happiness, and surprise. It should be noted that four of these six are negative emotions, one is positive, and one is bi-directional depending on the circumstances. This point is noteworthy for our discussion because negative emotions are tied to primal determinants of risk and the need to urgently and proactively react to danger. While Ekman’s (1992) work was based on physical characteristics as a way to determine emotion, emotion can also be identified in text using sentiment analysis (Aman and Szpakowicz, 2007). For example, Johnson-Laird and Oatley (1989) explored sentiments in text by analyzing a set of 590 emotion-based English words. Their work suggests that semantic terms inspired a small number of basic signals reflecting characteristic emotional modes that settled into one of the basic emotions of happiness, sadness, fear, anger, and disgust.
In tourism research, emotions remain an area of interest. For instance, Kwortnik and Ross (2007) used online community discussion forums to explore the role of positive emotion in tourists’ decision-making. Some research has already examined emotions in times of unusual stress. Gruebner et al. (2018) was one of the first studies to identify significant negative emotions in social media posts around a disaster. They examined Twitter (tweets) and extracted negative emotions indicating discomfort in NYC before, during, and after Superstorm Sandy in 2012. They found amplified discomfort, that is, increased negative emotions, after the storm versus during the storm and attribute this finding to when residents had to deal with the greatest stressors (e.g., damage and losses). In another example, Rahmani et al. (2019) applied Corpus Linguistics to online tourists’ blogs to measure eight basic emotions (joy, trust, fear, surprise, sadness, anticipation, anger, and disgust) and how they influenced tourists’ views of ten countries. Their work identified emotional reactions to external and internal stimuli which triggered a sense-making process and attitude formation. Their findings suggest that a combination of positive and negative emotions shaped meaning and were drivers of tourism. For example, fear was reported in higher levels in New Zealand versus France, but this emotion was connected to the thrill of adventure (high energy physical activities) while France was viewed as more intellectually stimulating so rarely dangerous (visiting of art galleries, concerts, or eating out). Comparing emotions expressed in publicly posted text, attached to different locations or time periods, can offer new and timely insights to the destination image literature.
Tourism destination images represent the attitudes that tourists hold towards a place (Echtner and Ritchie, 1991) and these include cognitions/beliefs and affect/emotions (Chew and Jahari, 2014; Kim and Yoon, 2003; Martin and del Bosque, 2008; Nadeau et al., 2008). In modeling place image effects, the affective component of the image was directly and positively related to behavioral intentions toward the place (Chen and Tsai, 2007; Chi and Qu, 2008; Nadeau et al., 2008). Further, some research suggests that emotions are more important to destination images relative to cognitions (Kim and Yoon, 2003; Stylidis et al., 2017). However, the intersection of emotions and tourism destination image in a time of crisis seems to be an understudied area.
Generally, destination images are considered stable once they are formed although these images can evolve slowly over time (Gartner and Hunt, 1987; Pike, 2017; Thorstensen et al., 2021). The evolution of the image may be facilitated through different venues including exposure to advertising campaigns (Pan et al., 2017), environment (Gertner and Freire, 2019), entertainment (Kim et al., 2012), or social media (Pike et al., 2018). Tourism destination image can also shift with visitation (Baloglu, 2001; Kim et al., 2019). However, there are contrasting results in this stream with some outcomes indicating that visitors do not necessarily hold different images from those who have not experienced the destination (Andreu et al., 2000; Chen and Kerstetter, 1999). This suggests that some destinations may have clear and well understood images. Regardless, visiting the destination is not the focus of the current study, which is about the tourism destination image held by tourists and potential tourists. Therefore, a priori images are most appropriate to understanding a general view of a place because these images may or may not be based on personal experience with the destination. To change a priori images, a sizeable shock to the beliefs or feelings regarding a place may be needed to gain attention and alter the image held. For instance, a study of the destination image for Japan following a natural disaster indicated that a negative shift in the image occurred (Wu and Shimizu, 2020). However, there is a need for more tourism destination image research examining temporal impacts (Pike, 2017).
The influence of others in the travel decision is a particular interest in current research, and the opinions of others shared in social media can be a powerful force (Bigne et al., 2020). A social media effect can occur by the emotional state (pleasant or unpleasant) transferring to others and spread with a sufficient retweet range (Bigne, et al., 2020: Park et al., 2018). For these reasons, social media can offer information to tourists from both the general public and one’s own network. In particular, social media is sought as a desirable choice for crisis-related information and is perceived as offering a more trusted insider’s view of the situation over traditional media coverage (Schroeder and Pennington-Gray, 2015). Further, positive emotional experiences, like feeling happiness or delight, have been linked to positive consumer outcomes, such as, customer satisfaction and future word-of-mouth, in social media (Park et al., 2018). On a larger scale, people’s opinion can have a reciprocal relationship with government decisions (Abeysinghe et al., 2018), and this is relevant given the policy choices made by governments to deal with the pandemic, for example, COVID-19 lockdown and closed borders. Thus, identifying emotions in social media postings through an automated approach can make the process easier and offer a deeper understanding of public texts than simple key word matching (Abeysinghe et al., 2018).
The overall negativity associated with pandemic media coverage is expected to stimulate negative emotions projected in social media about the tourism destination cities. However, the long-term stability of tourism destination images (Gartner and Hunt, 1987; Pike, 2017) suggests that there will not be a significant change in the projections of positive and bi-directional emotions. Therefore, we expect the following about positive, negative, and bi-directional emotions portrayed in social media. H1: There will be no change in positive (e.g., joy/happiness) emotions projected in social media when comparing the COVID sample to activity in the same prior year period. H2: There will be no change in bi-directional (e.g., surprise) emotions projected in social media when comparing the COVID sample to activity in the same prior year period. H3: There will be an increase in negative emotions (e.g., fear) projected in social media when comparing the COVID sample to activity in the same prior year period.
Context: the COVID-19 pandemic
The COVID-19 pandemic is primarily a global health crisis with a significant loss of life. The severity of the illness caused by the novel coronavirus for some and the seemingly ease with which it can spread through respiratory droplets (National Foundation for Infectious Diseases, 2020) led to the closure of international borders and imposed travel restrictions. In particular, the impact of COVID-19 on the tourism sector for Canada and the United States (US) can be viewed through the microcosms of its major destination cities. In Canada, Toronto is expected to suffer extensive losses from the COVID-19 pandemic (Canadian Press, 2020). Toronto’s tourism sector is important to the city accounting for 70,000 jobs, equivalent to almost 5% of the city’s workforce, and an economic impact of CDN$10.3 billion (Lewis, 2019). In the US, the impact on tourism is similar with NYC sustaining substantial decreases in travel spending from April 11 to May 30, 2020 (US Travel Association, 2020).
While COVID-19 has a similarly devastating economic impact on the tourism sector for two large tourism destinations, the policy approaches to the pandemic in the two countries has been quite different. As of June 2020, the death rate as a result of COVID-19 was substantially lower in Canada compared to the United States on a per capita basis as the US experienced more than double the infection rate (Baldwin Hess and Bitterman, 2020). The difference in infection rates in the two countries has been attributed to the lessons learned from the SARS outbreak in Toronto and the policy measures subsequently established (i.e., test, track, and trace disease monitoring procedures and Canada’s centralized public health approach) (Baldwin Hess and Bitterman, 2020). Overall, the difference in the COVID-19 experience for the two countries is expected to be observed in the social media communications with a more muted effect for the Canadian destination. Therefore, H4: There will be different year over year effects comparing the two cities with larger shifts in social media portrayals observed for New York city compared to Toronto.
Method of data collection
The review of literature about pandemics, tourism, emotions, and tourism destination image led to the development of four hypotheses that are intended to deepen our understanding of the emotion portrayals through social media during a severe pandemic. It is important to understand these portrayals in social media because the content can influence the behavior of others.
For this study, we selected Twitter as the social media platform because it is widely adopted by users (Mora-Cantallops and Sá nchez-Alonso, 2019), and it provides a valid and publicly available extraction tool to access data easier than the other social networks like Facebook. The information this medium provides about tourist experiences is helpful for tourism operators, destination marketers, and researchers (Park et al., 2018). In 2018, Twitter had around 334 million active users per month (Abeysinghe et al., 2018) who were producing significant content daily through tweets. The volume of tweets makes this form a social media compatible with an automated process of retrieval. Additionally, these tweets can be tracked to identify important information such as, the message, time it was sent, user and receiver ID, and geolocation. This information can allow researchers the ability to explore data based on the time of the experience or based on location. Twitter also disseminates posts based on followers in relationships or friendships with the content provider. The personal nature of this social media platform makes the information more credible than other information posted online for others. Thus, social media analytics can uncover popular topics and noteworthy patterns for researchers (Park et al., 2018; Rout et al., 2018).
In this research study, we used the Twitter search interface to collect travellers’ tweets based upon a set of defined keywords. The selected keywords included “travel” and popular hashtags 1 for NYC (“newyork,” “nyc,” and “newyorkcity”) and Toronto (“Toronto,” “GTA,” and “torontoLife”). To compare the tweets in two different time periods, we identified the month of April as a typically strong tourist month to begin the Spring/Summer season and was also near the beginning of the pandemic. Therefore, we selected April 2020 as the year affected by the COVID-19 pandemic and April 2019 as a pre-COVID-19 comparator. We also considered only English language tweets for this study because it is the dominant language in both cities. While extracting the tweets to build the dataset, we excluded tweets promoting travel agencies, tweets too short for sentimental analysis, and retweets.
After collecting all the posts in an excel sheet, we removed the emojis from each tweet and used a Python programing tool for data cleansing. As a first step in data cleansing, we tokenized each tweet text to words. In the tokenization process, we break down the text into smaller chunks or words, and each word becomes a single entity that is the building blocks for a sentence or paragraph. Given that stopwords (e.g., is, am, are, this, a, an, the) are considered to be noise in a tweet text, we created a list of stopwords in English language and used the Natural Language Toolkit (NLTK) 2 in Python to filter them out from the tweets’ texts. We also used other text analytics techniques such as stemming to reduce the words to their root in the data cleansing process.
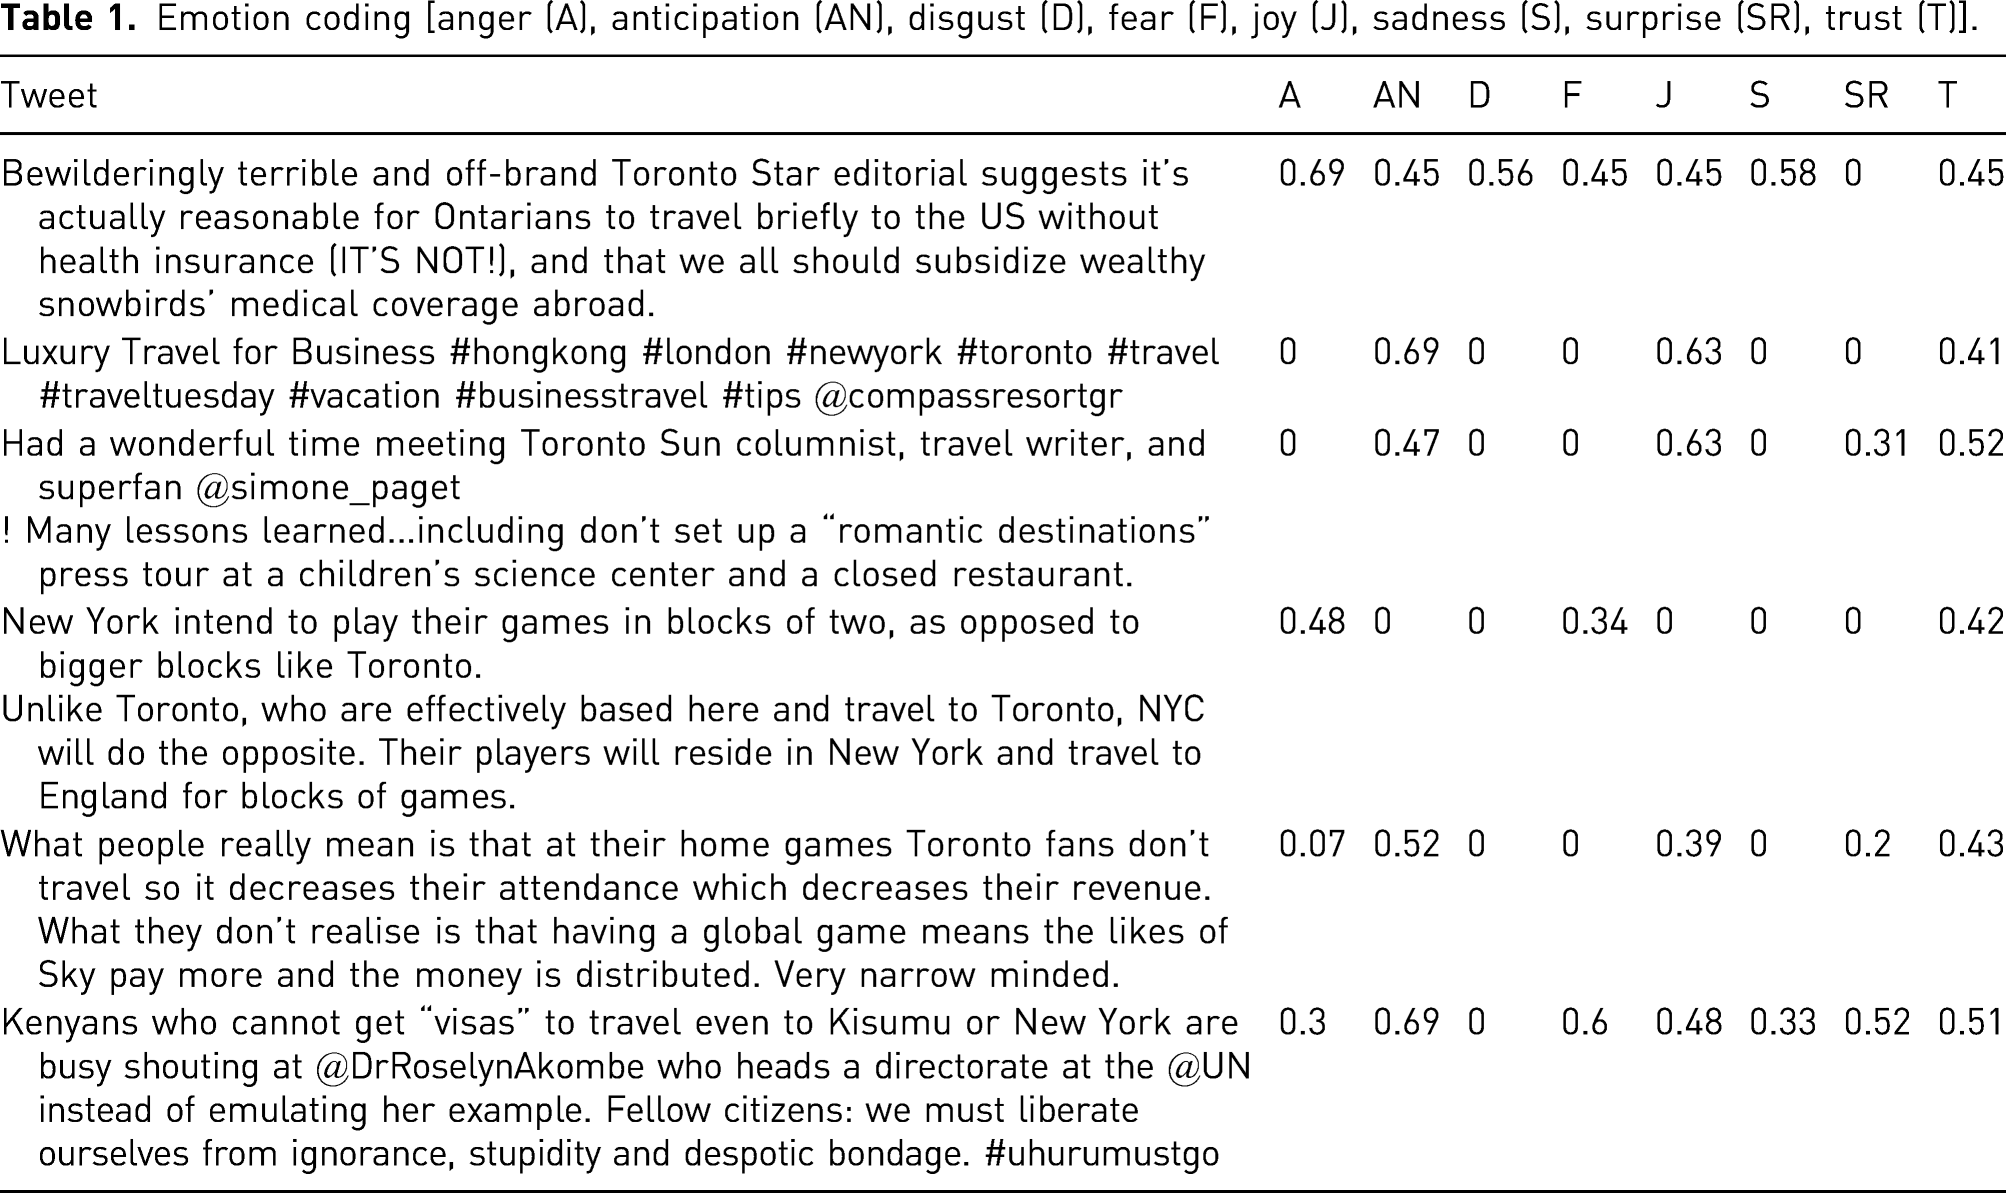
Emotion coding [anger (A), anticipation (AN), disgust (D), fear (F), joy (J), sadness (S), surprise (SR), trust (T)].
Results
MANOVA results for emotional portrayal in social media.
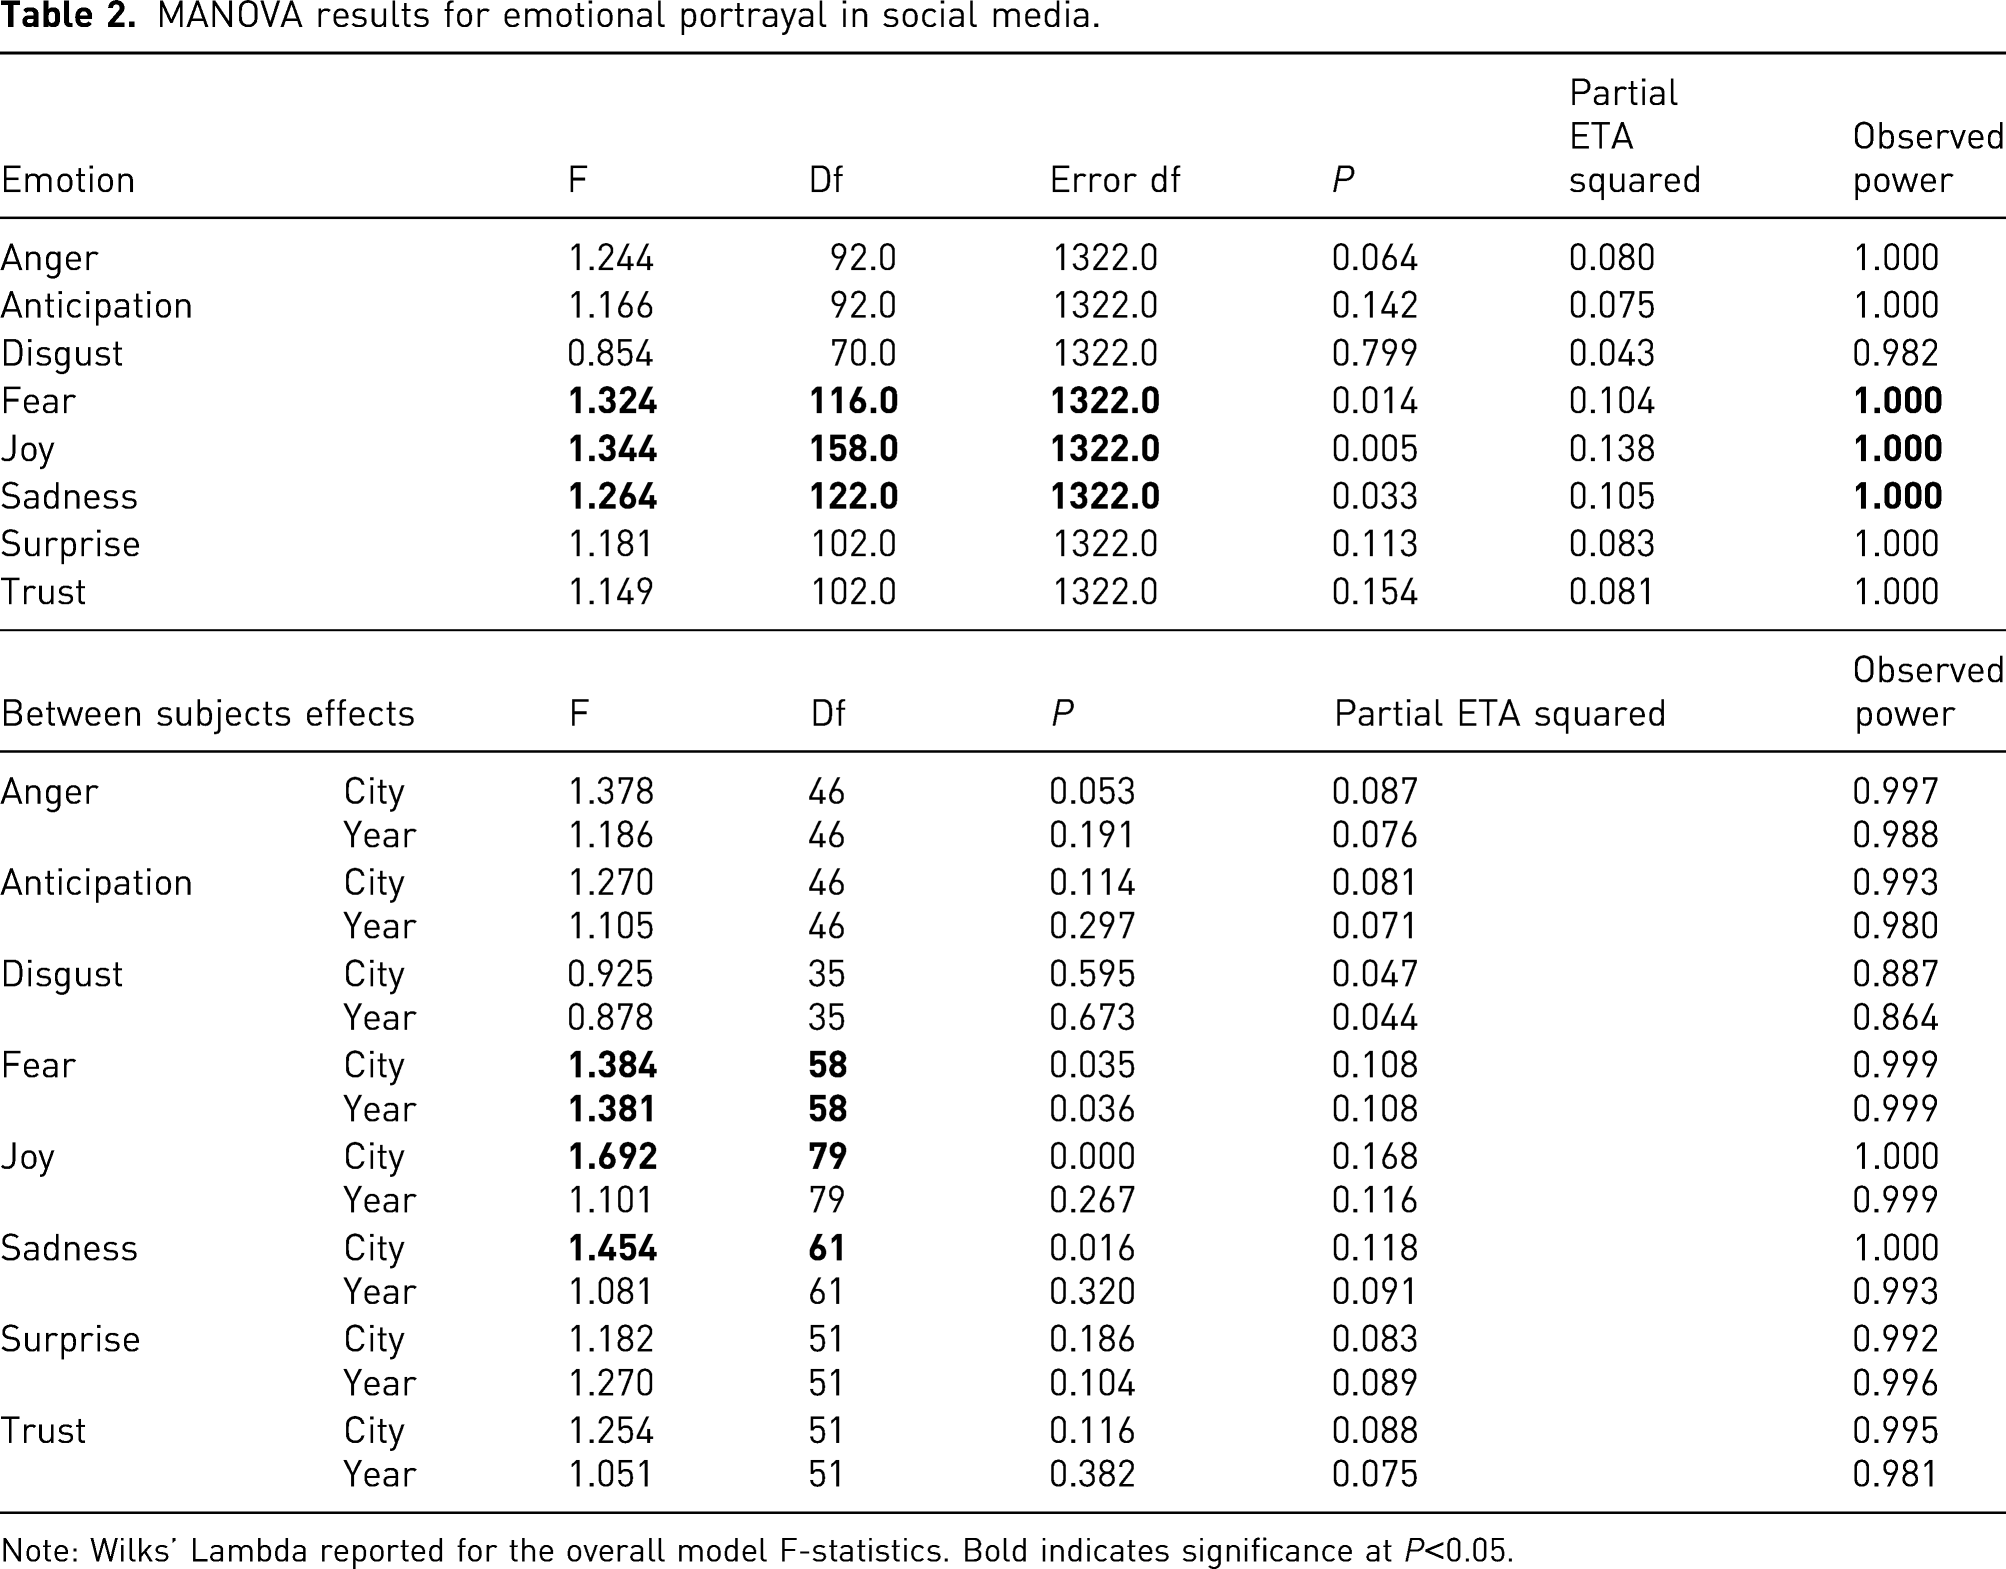
Note: Wilks’ Lambda reported for the overall model F-statistics. Bold indicates significance at P<0.05.
Mean expressed emotions in tweets about tourism (city and year comparison).
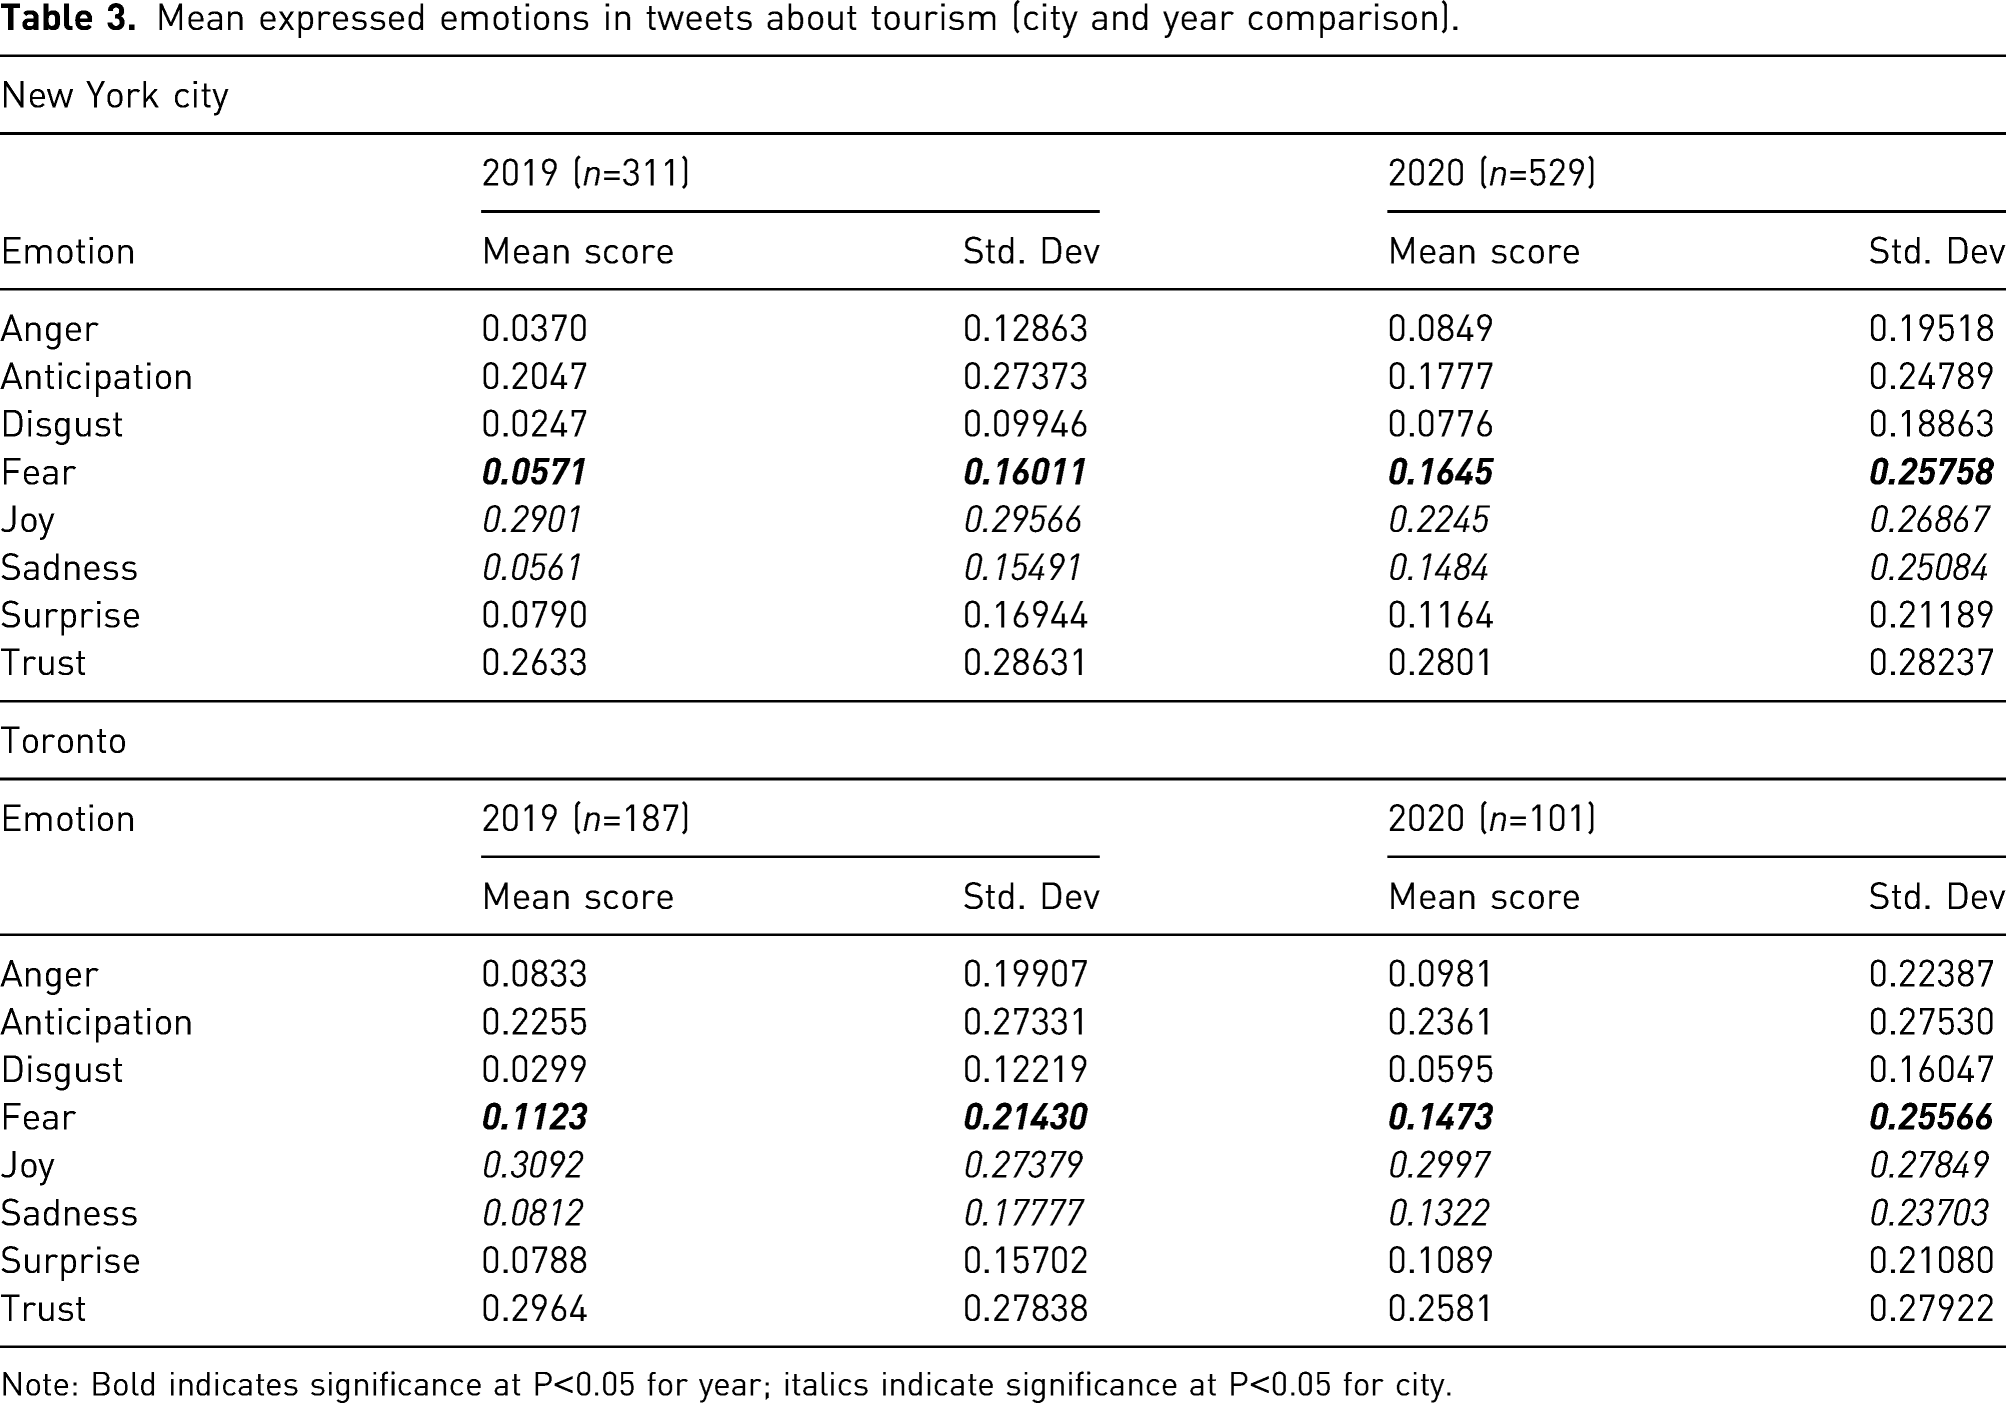
Note: Bold indicates significance at P<0.05 for year; italics indicate significance at P<0.05 for city.
In comparing the cities, there are significant results for Fear [F (58)=1.384, P=0.035], Joy [F (79)=1.692, P=0.000], and Sadness [F (61)=1.454, P=0.016]. The significant results for the cities demonstrate support for hypothesis H4 that suggested there would be differential effects for the two cities due to varying circumstances. In terms of significant changes in the period comparison, portrayals of Fear in social media posts about NYC tourism increased from 2019 (x̅=0.0571) to 2020 (x̅=0.1645). For Toronto, there is also a significant increase in Fear expressions from 2019 (x̅=0.1123) to 2020 (x̅=0.1473). The change for NYC is significantly larger than the change observed in the Toronto data.
Overall, the mean scores, on a scale of 0–1, show that NYC Tourism was dominated by expressions of Joy (x̅=0.2901), Trust (x̅=0.2633) and Anticipation (x̅=0.2047) in 2019 and Trust (x̅=0.2801), Joy (x̅=0.2245) and Anticipation (x̅=0.1777) in 2020. Similarly, the means scores for Toronto show that the projected tourism oriented emotions are led by Joy (x̅=0.3092), Trust (x̅=0.2964) and Anticipation (x̅=0.2255) in 2019 and Joy (x̅=0.2997), Trust (x̅=0.2581) and Anticipation (x̅=0.2361) in 2020. However, the MANOVA results present a significant divergence in the numbers for the two cities for Joy as Toronto posts continue at a similar level while NYC posts experience a decline in projecting Joy.
The least occurring emotions in social media posts about NYC Tourism include Sadness (x̅=0.0561), Anger (x̅=0.0370) and Disgust (x̅=0.0247) in 2019 and Surprise (x̅=0.1164), Anger (x̅=0.0849) and Disgust (x̅=0.0776) in 2020. For Toronto, social media posts infrequently portrayed Sadness (x̅=0.0812), Surprise (x̅=0.0788), Disgust (x̅=0.0299) in 2019 and Surprise (x̅=0.1089), Anger (x̅=0.0981) and Disgust (x̅=0.0595) in 2020. For both cities, the projection of sadness increases with frequency but there is a significantly larger increase observed in the NYC posts.
Discussion
This research examined emotions projected in the context of tourism to better understand the extent of destination image resiliency during a high stress event (i.e., COVID-19 pandemic). The study makes a theoretical contribution by looking at tourism destination image temporally (Pike, 2017). In particular, this study demonstrates that there is some resiliency in the tourism destination image as assessed through the lens of foundational emotions projected in social media. In general, the positive and bi-directional emotions demonstrated stability supporting previous research indicating that tourism destination image changes very slowly over time (Gartner and Hunt, 1987; Pike, 2017). The current study demonstrated this resiliency under the considerable pressure of a health crisis that significantly reduced travel activity across the globe.
Despite the resiliency of the destination images, there was an observed shift where fear projections were more pronounced for both cities, which may be related to the characterization of tourists as transmission vectors and travel being associated with heightened risk (Wilder-Smith, 2006). While there can be a shift in the negative emotion of fear, this shift remains contextualized in an overall resilient destination image. Periodically, every major city has troubling news that can shake one’s beliefs in the safety or security of the destination. Situations that include terrorist attacks, civil unrest, and criminal activity may cause concern among tourists about the destination. However, the underlying resiliency of the destination image based on other emotional dimensions provides an enduring consistency.
However, context also matters as illustrated by the significant differences observed for the two cities, namely, with respect to joy and sadness. The city-based finding suggests that there may be a threshold where other foundational emotions are altered under the increased stress as the severity of the crisis mounts. Different approaches to the crisis or systemic differences in approach to public health may be influencing the differences observed in the cities under study. Further, there seems to be a compensatory relationship among the emotions portrayed as illustrated by an increase in sadness postings along with a decline in joy projections for NYC.
Implications for practitioners
This research also has implications for tourism management as these findings provide guidance for destination marketers. The key finding that tourism destination image has some resiliency in times of crisis should provide some comfort to those who work hard to cultivate a destination image that reflects an underlying promise of experience at a place. Therefore, communications at an emotional level should serve to reinforce the stability and leverage the understanding as a point of connection. So, for instance, the top three emotional projections about Toronto were joy, trust, and anticipation for both years studied and social media managers should promote communications that reflect these feelings to maintain the image and connect based on expectations. However, the results are also cautionary for destination marketers. This pandemic is a health crisis outside of the control of many destination marketers, yet the impact can be significant in some aspects of the destination image on an emotional level. The severity of the crisis in NYC at the time of this study likely contributed to the city differences observed in the study. Specifically, the increase in sadness and a decrease in joy expressions need to be reconciled in communications to potential tourists. In addressing this negative impact on emotions about the place, the overall fear associated with the pandemic should also be included. While the intensity of fear will subside once the global population is inoculated against the virus, tourists and potential tourists will need to be provided a rationalization to support a realignment of emotions akin to the pre-pandemic levels.
Future research and limitations
This research collected a month-long cross section of postings for two cities during a peak month of the pandemic and compared the observations to the same prior year period. While this comparison accounts for tourism seasonality, it does not allow for the mapping of emotional changes throughout the pandemic nor does it assess seasonality effects over a full tourism year. Future research should examine emotional changes about a destination over time to better understand emotional shifts through the crisis and after it has abated. In addition, survey or interview-based research would enable researchers to assess relationships of foundational emotions among one another in the context of a pandemic as well as providing the opportunity to test relationships with tourism outcomes, such as, travel intentions or willingness to recommend.
Online photos are also very important for researchers to understand the destination image and tourists’ feeling. There might be difference between the textual descriptions and photos. One of the topics that can be conducted on this era is comparing the feelings perceive from the images posted by social media users with the results of text analysis. Artificial Intelligence (AI) and deep learning models can be applied to detect, recognize, and analyze human faces in these images. The performance of results of sentimental analysis can be improved when they are combined by AI-based emotion detection algorithms. Another future direction of this study is analyzing the travelers' contents using different social media such as Instagram and Facebook and comparing their posts and results of analysis to each other, given that various travelers use different social media platforms. One limitation of this study is the manual the collection of data using the Twitter search interface to analyze the tweets by humans and filtering out the useless text. This approach was used because the free version of Twitter API, that can be used for searching by a computer program, limits the number of searches per call.
Footnotes
Declaration of conflicting interests
The author(s) declared no potential conflicts of interest with respect to the research, authorship, and/or publication of this article.
Funding
The author(s) received no financial support for the research, authorship, and/or publication of this article.
Notes
Author Biographies
Dr. Enayat Rajabi is an Assistant Professor of Data Analytics at the Shannon School of Business, Cape Breton University, Canada. He received his Ph.D. in "Information and Knowledge Engineering" from University of Alcala, Spain. He was awarded an NSERC Discovery Grant, a five-year research program in the computer science domain, in 2020 in Canada. His current research interests include machine learning and semantic web. He has published more than 10 JCR papers in international journals.
Leslie J Wardley is an Associate Professor of Marketing in the Shannon School of Business and a SSHRC Exchange University Research Chair in Social Determinants of Health at Cape Breton University. Leslie's research includes exploration of targeted consumers through identification of their preferences, motivations, and buying behaviours. Thus, her research advances our knowledge regarding the psychology of how consumers select between alternative options (e.g., products, suppliers and brands), how consumers are influenced by their environment (e.g., culture, family, technology, and living arrangement), and determinants of consumer motivation and decision-making strategies. Leslie's Ph.D. (Laurentian University) garnered an award for the best Ph.D. dissertation in Canada (2015) bestowed by the Canadian Society for the Study of Higher Education (CSSHE) and she has published her findings in `A' ranked journals such as Higher Education: The International Journal of Higher Education Research.
Dr. Nadeau, a Professor of Marketing, has taught and worked at Nipissing since 2007, serving as the Director of the School of Business and now as Dean for the Education and Professional Studies Faculty. Dr. Nadeau holds a PhD in Management from the Sprott School of Business at Carleton University. His research explores different aspects of consumer behaviour and often in the context of sport and tourism. Dr. Nadeau has authored or co-authored over 100 different articles and conference presentations.3