
Abstract
Team ethnography is becoming more popular in research. However, there is currently limited understanding of how multiple ethnographers working together actually share their experiences of conducting team ethnography. There is also an associated lack of explanation regarding how evidence and conclusions are drawn from such collective endeavour. This article attempts to address this absence of detail regarding the practice and conduct of team ethnography. In the following account, the authors present details of the design, development and application of ‘team ethnography visual maps’ and the collaborative reflexivity that took place within ‘team ethnography data sessions’ that were each embedded within a mixed methods study of frontline services located in six different National Health Service Trusts throughout England (UK). After a presentation of the ethnographic methods and analyses that occurred as part of team ethnography, they are then discussed in terms of their applied and academic value from a methodological perspective.
Keywords
In this contribution to Ethnography’s Kitchen, we aim to provide critical reflections on the practice of fieldwork with particular reference to the operational aspects of team ethnography. These reflections are an attempt to provide wider understandings of the craft underlying the collective conduct of this form of (largely unexplained) ethnographic fieldwork. We also seek to make transparent how evidence and conclusions are derived from a qualitative study that utilises a team ethnography approach. These assorted aims are achieved through the presentation of various methods adopted by the authors during a mixed methods study of quality improvement projects within the National Health Service (NHS England) during 2016–2018. More specifically, we describe the evolution of what is here termed ‘team ethnography visual maps’ and how they were developed during ‘team ethnography data sessions’. This article therefore focuses upon methodological innovation in an applied study of healthcare that employed a team ethnography approach.
The article is organised into four sections. In the first section, we summarise two key concepts central to the development of team ethnography visual maps; namely team ethnography and ethnographic mapping. In the second section, we provide a short overview of the mixed methods study that utilised a team ethnography approach and introduces the audience to the numerous ‘academic’ and ‘applied’ teams that were involved in the main study. In the third section, we outline details of unique qualitative research methods and analyses that were conducted as team ethnography and employed by three ethnographers working across six locations throughout England. Finally, in the fourth section we provide a discussion on the applied and academic value of ‘team ethnography visual maps’ and ‘team ethnography data sessions’ from a methodological perspective. As such, in the latter sections, we provide an insight of how team ethnography (and a team of ethnographers) may work in practice, including a discursive account of the methodological innovation associated with such teamwork.
Team ethnography
Erickson and Stull (1998) describe ‘team ethnography’ as shared research that is completed by multiple people as part of a joint venture. In addition, they define team ethnography as a research process that emphasises close collaboration between researchers involved in fieldwork, analysis and interpretation of ethnographic data. Erickson and Stuller also emphasise the act of collaborative reflexivity, in which multiple perspectives of a particular phenomenon contribute to a common understanding of the relevant ethnographic data that extend beyond individual analysis. Jarzabkowski et al. (2015) concur with this view and contend that team ethnography provides a forum for academic collaboration, in which data may be shared and individual interpretations filtered towards wider, team-focused analyses. Consequently, team ethnography is intended to establish a ‘collective sense-making process’ (Jarzabkowski et al., 2015, 7) via shared reflections, multiple interpretations and communal conclusions in a manner that differs from the processes typically attached to more traditional ethnographic work (i.e. work that normally prioritises subjective and individual reflection, interpretation and conclusions).
Team ethnography appears to have gained popularity in social science disciplines and health-related research in a relatively short period of time. Explanations for this growth include structural changes to the funding and organisation of academic research, the rise in larger-scale research projects, growth and development of interdisciplinary research (including a reconceptualisation of ethnography per se) and the general globalisation of society, organisations and economies (Creese et al., 2008, Jarzabkowski et al., 2015; Woods et al., 2000). Notable examples of published work that describe the practice of team ethnography include studies of complementary schools in a diverse English city (Creese et al., 2008), families involved in gas and oil production in Mexico (Austin, 2003), a family-focused residential unit providing intensive intervention in an Australian city (Clerke and Hopwood, 2014) and alternative forms of consultation within general practices in UK cities (Atherton et al., 2018).
Despite this apparent growth in team ethnography, methodological challenges exist. For example, Erickson and Stuller (ibid) describe how team ethnography may involve a dramatic shift in how individual ethnographers may have previously conducted ethnographic research. For example, team ethnography potentially re-situates an individual methodological framework that may have underpinned all previous disciplinary knowledge and ethnographic experience (such as the methods of fieldwork, data collection, reflexivity, observational analysis, disciplinary interpretations and epistemological orientation). As such, when individuals are convened into a team, ‘from the coming together of multiple selves emerges various points of view that allow for rich and deep understanding, but this variety also makes reflection and sense-making more challenging … as it becomes a collective practice’ (Fayard, 2018, emphasis added).
One such collective sense-making challenge – that will be addressed by the work described in this article – relates to the identification of an ethnographic object within team ethnography as part of a multisite study. As noted by Falzon (2009), the ethnographic object concerns the phenomenon under ethnographic inquiry and is typically constructed by the interpretations and analysis of an ethnographer working alone within a particular field. As an illustration, Parkin’s (2013) multisite research was an ethnographic study of homelessness and street-based injecting drug use. However, the ethnographic object of this work concerned the way in which injecting-related harm and hazard were managed (and normalised) by people who inject drugs in street-based injecting environments.
Accordingly, in any study containing multiple sites accessed by several ethnographers there is a need for the ethnographic object to be consistent across the team conducting fieldwork (cf. Cassell et al., 2017) due to the inevitable variation in individual perception and interpretation of a given field. Such standardisation aims to identify a common ethnographic object that seeks to record/observe key actors within and across all sites involved in the study. Similarly, the ethnographic object within multi-local fieldwork seeks to identify connections and relationships between the relevant sites (i.e. the ethnographic object of a multisite study) rather than prioritise connections and relationships within each site (i.e. the ethnographic object of a lone ethnographer embedded within a single setting). Accordingly, team ethnography as a method may find multiple researchers (wittingly or unwittingly) contributing to the re-conceptualisation of ‘conventional’ ethnography through this transformation of methodological principles.
It is perhaps due to team-based tensions such as collective reflexivity and the need to identify a common ethnographic object within multi-local studies that Jarzabkowski et al. (2015) are critical of the lack of methodological explanations associated with team ethnography. They comment that there is limited understanding of how ‘research teams actually share their experience of team-based ethnography and explain how they have produced a shared understanding …. (and) ... we still know little about how teams of ethnographers work together, their concrete methods and the way they practice research’ (Jarzabkowski et al., 2015, 7).
This article therefore attempts to address this absence of detail regarding methodological orientations of team ethnography. In the following account, the authors present details of the design, development and application of ‘team ethnography visual maps’ that evolved from of a team ethnography of frontline services in the National Health Service in England. As will be discussed further below, ‘team ethnography visual maps’ emerged from focused ethnography conducted across several case study sites by multiple ethnographers as part of team ethnography into quality improvement in health service delivery. As will be demonstrated below, these maps were integral in the identification of the ethnographic object pertaining to core barriers/facilitators to quality improvement projects led by frontline staff. Team ethnography visual maps provided thick visual descriptions of ethnographic observations and the processes employed by the frontline staff. In addition, this visualisation of observation and performance drew inspiration from a form of mapping normally conducted in the field by lone ethnographers; namely ethnographic mapping.
Ethnographic mapping
Ethnographic mapping is a research method that is defined, constructed or understood in multiple ways. For example, it may refer to specific research contexts, such as the spatial organisation of territory and/or indigenous peoples (Kuznar and Werner, 2001), or to the epidemiological surveillance of particular diseases/illnesses (Margolis, 1990). Similarly, ethnographic mapping ‘may relate to the use of simple graphics or maps to visually convey information about the environment of a study area’ (Roth Allen et al., 2009, 31) in which the ethnographer(s) may ‘learn more about the geographic location and temporal movement of hidden populations’ (Oliver-Velez et al., 2002, 262). Yet another form of ethnographic mapping involves the way in which social spaces may be transformed through time via comparative analysis of the relevant ethnographic texts (ibid). In this latter approach to ethnographic mapping, text and visual data may complement one another in order to establish graphic descriptions of research settings with a combination of words and images. According to Tripathi et al. (2010, S95) ethnographic mapping/maps ‘are not simply sets of maps, showing the locations of groups and activities. (…) They also include data on the underlying social, economic and environmental factors’ that contribute to a particular population profile’ (Tripathi et al., 2010, S95). Ethnographic mapping (as an activity), and ethnographic maps (as research output), therefore aim to highlight and emphasise relationships that exist between people and places at particular points in time.
Several studies have utilised ethnographic mapping as a means of unpacking the lived-experiences of vulnerable populations who may be engaged in risk-related behaviours, or activities that may be detrimental to health of their self and/or others. For example, numerous studies have employed ethnographic mapping as a process for monitoring behaviours associated with the transmission of HIV, such as sex work and injecting drug use. Pioneers of this technique were predominantly in North American cities who responded to the burgeoning viral epidemic with a variety of novel research methods that included ethnographic mapping. Margolis (1990), for example, describes the use of maps to ‘illuminate’ the social process, events and relationships that occur between outreach workers and people who inject drugs during the distribution of harm reduction paraphernalia to reduce drug-related harm. Similarly, Carlson et al. (1994) and Oliver-Velez et al. (2002) each describe the mapping of drug using environments as part of attempts to recruit people into drug treatment programmes as part of HIV/AIDS-prevention service delivery. Roth-Allen et al. (2009) equally describe ethnographic mapping as a method to visualise the physical and social areas of HIV-risk behaviours within community settings/services and where members of the research population may be accessed and recruited. In each of these studies, ethnographic maps were produced via field-based observations of the research respondents/participants involved. In this regard, such maps provide an etic view of the phenomenon under investigation, as they provide an analytical perspective that prioritises the ‘outsider looking-in’ (Parkin, 2017). Indeed, much of this early pioneering work concerning the ethnographic mapping of drug using environments greatly informed Parkin’s previous ethnographic studies of street-based injecting drug use by people who are homeless (Parkin 2011, 2013, 2014).
The co-construction of maps between ethnographer and research participant(s) is yet another form of ethnographic mapping. This method is also known as ‘cognitive mapping’ (Armar-Klemesu et al., 2018) and relates to the way in which people and place are understood primarily from an emic perspective (i.e. viewed and understood from inside the population/geographic area in question). Examples of co-constructed, cognitive/ethnographic mapping may be noted in assorted studies of food consumption and dietary limitations (Armar-Klemesu et al., 2018; Earl 2018; MacNell, 2018; Zobrist et al., 2018) and in the routing of ethnic violence in contested urban spaces (Madueke, 2018). In each of these studies, various researchers obtained deeper understandings of spatial problems based upon the co-production of maps by those in the settings concerned.
In this article, the form of ethnographic map making follows the definition provided by Tripathi et al. (2010). Here, team ethnography visual maps attempt to visualise the relationship between ethnographic observations (of activities, events, work) and the underlying (social, economic, environmental and institutional) processes attached to the work carried out by frontline staff involved in the design and delivery of health-related quality improvement projects. In this way, ethnographic observations of frontline activity are synthesised to generate an alternative form of viewing ‘the field’ of inquiry over a given period of time.
The remainder of this article focuses upon the way in which the authors sought to identify an ethnographic object via the production of ‘team ethnography visual maps’. This mapping activity involved the development and synthesis of the key elements of ethnographic mapping across multiple research sites by multiple ethnographers. This therefore involved a blending of proactive/reactive map design, inserting etic/emic perspectives upon maps and acknowledging the prospective/retrospective positionality of events observed. This approach produced thick visual representations of ethnographic observations and the work carried out by frontline healthcare workers involved in this study. However, it is perhaps necessary to include an overview of the relevant study in which this body of work was embedded in order to better situate the development of team ethnography visual maps.
The USPex study
The overall mixed methods study was designed as a comparative case study evaluation dedicated to understanding how frontline staff use patient experience (USPex) data for quality improvement purposes within healthcare settings.
For the qualitative, ethnographic component of the study, six hospital sites from six National Health Service Trusts (NHS England) were recruited, and each hospital nominated a medical ward to take part in the study. Each hospital ward then assigned a frontline staff team (FST) (consisting of up to five members of clinical/non-clinical staff) to design and deliver a patient experience quality improvement project. These six clinical settings were to be the fieldwork locations of three ethnographers, who tracked the six FST throughout a 12-month period of fieldwork. All six NHS Trusts were dispersed throughout six different local authority areas in England.
The USPex study was funded by the Health Service and Delivery Research programme of the National Institute for Health Research (14/156/06). Ethical approval was obtained from NHS North East – York Research Ethics Committee: Ref. 16/NE0071. Full details of the study and its overall findings are presented elsewhere (Locock, et al., in press; Locock et al., 2020a; Locock et al., 2020b; Montgomery et al., 2020a; Montgomery et al., 2020b). Within this study several teams of researchers worked together. The ‘applied team’ consisted of the six FST consisting of approximately 30 healthcare practitioners with clinical or non-clinical expertise from six NHS Trusts throughout England. The ‘academic team’ included a wide range of academic researchers, clinicians and non-academic partners each connected to the host institutions leading the research. The academic team was further organised into a series of advisory panels consisting of the ‘investigator team’ (those who applied for the research grant), the ‘core-team’ (those who organised the research on a day-to-day basis), an ‘academic steering group and a lay-panel team’ (consisting of 10 patient and family carer members). Finally, the ‘ethnographic team’ consisted of three ethnographers and the study’s Principal Investigator (PI). The ethnographic team was responsible for the design, delivery and conduct of fieldwork within the six hospital wards of the applied team. The methodology and methods of team ethnography were designed and implemented by these four individuals. However, the full academic team also contributed to team ethnography in the provision of advice, opinion and direction during progress meetings throughout the course of the study.
The task of data generation from the six study sites was that of the three ethnographers. Due to the number of sites involved in the study, data generation implemented the fieldwork methods associated with focused ethnography (see below). In addition, the study PI supervised the three ethnographers and the implementation of fieldwork throughout the six locations. As such, the assorted groups within team ethnography were ‘bridged’ by the study PI, whereas the applied team were bridged to the academic team by the three ethnographers. Figure 1 presents a visual summary of the multiple teams (and their associated relationships with one another) involved in the USPex study. Visual representation of the organisation of Team Ethnography and Focused Ethnography (FE).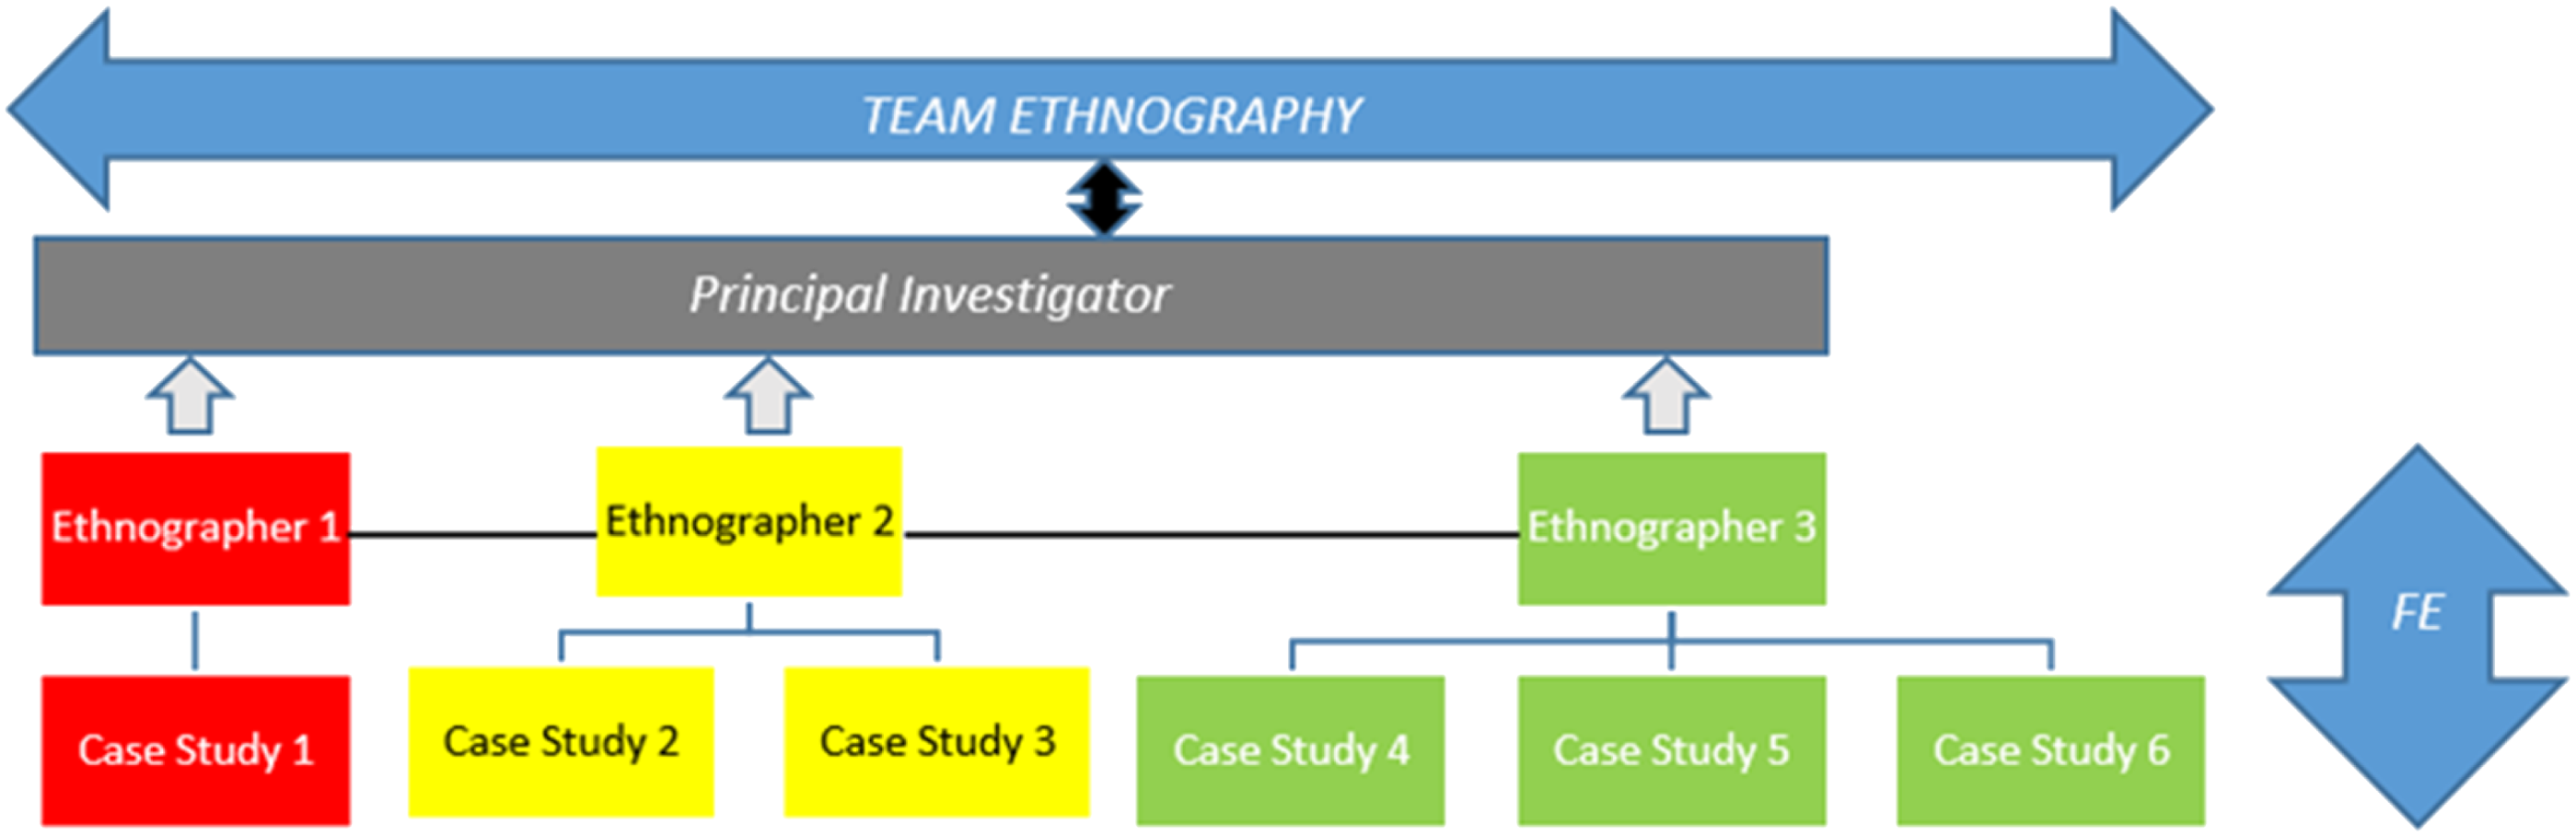
As noted above (and in Figure 1), three individuals were responsible for the management and conduct of focused ethnography (FE) across six study sites. The unequal allocation of study sites to each ethnographer correlated with individual full-time or part-time employment contracts held by the three researchers involved. However, it was a direct consequence of the organisation of fieldwork in this way that influenced the production ‘team ethnography visual maps’ conducted across the six different locations.
Team ethnography method 1: Focused ethnography
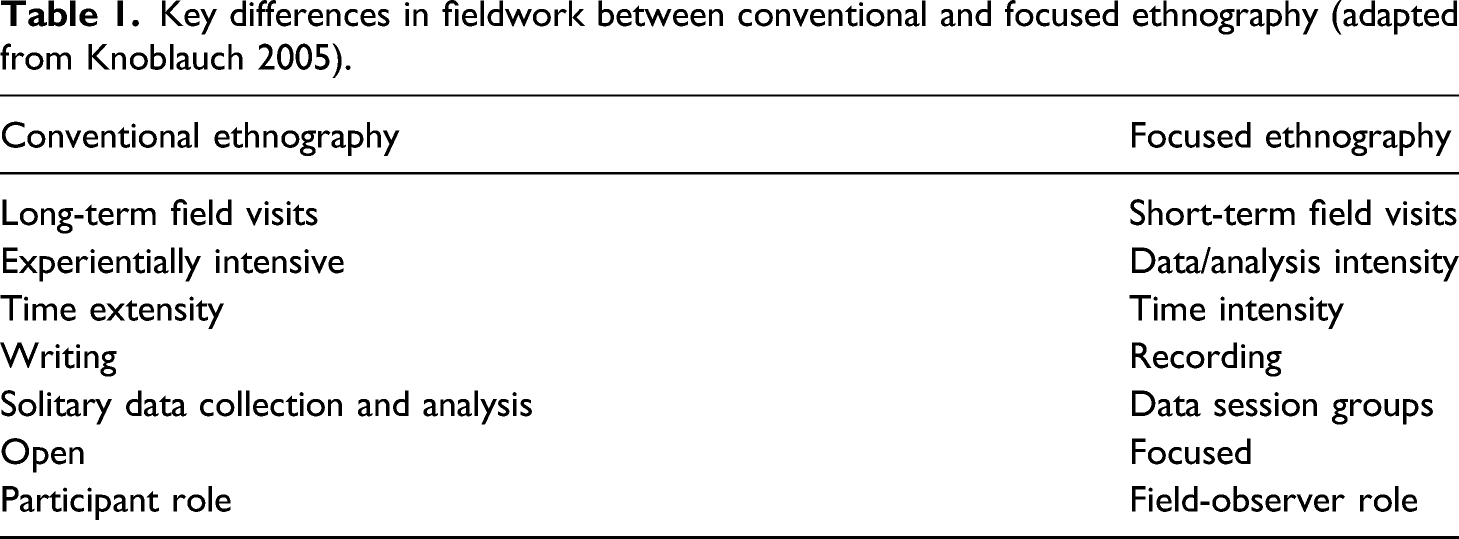
Key differences in fieldwork between conventional and focused ethnography (adapted from Knoblauch 2005).
Team ethnography method 2: Team ethnography data sessions for collective reflection
Knoblauch (2005) describes the use of ‘data sessions’ conducted within research teams as an important aspect of FE (see Table 1). Such data sessions differ from conventional ethnographic studies as the data are typically viewed, discussed and interpreted by several people rather than by one person working alone. Knoblauch describes the benefit of such collective sessions as a procedure that: … opens data socially to other perspectives. In order to support this opening, data session groups are helpful, the more they are socially and culturally mixed. (However, qualified knowledge on research goals and methods is a prerequisite for participating in such groups.) Data sessions treat data in a way that … does not presuppose ethnographical knowledge of the field. (Knoblauch, 2005, 10)
In this study, team ethnography data sessions took two distinct forms. That is, they were either prospective or retrospective in their focus and this format was dependent upon who was present in the relevant data session. Data sessions between the ethnographers took place on a monthly basis throughout the entire research project (i.e. before, during and after all fieldwork). These data sessions were primarily arranged to discuss all aspects of fieldwork covered across six geographically disparate locations. Prior to fieldwork, for example, these data sessions were used as a forum for the exchange of case descriptions in which the ethnographers summarised their desk-based research on their allocated study sites. This included summaries of grey literature pertaining to hospital performance, media reports of the relevant hospital and findings made available from ‘patient experience’ websites. This information exchange provided opportunities to discuss political and operational issues within each fieldwork location prior to commencing fieldwork. Similarly, during fieldwork, the ethnographers met to discuss fieldwork and share emerging findings from observations conducted/interviews completed. This retrospective design also permitted the opportunity for the ethnographers to reflect upon each other’s data and to identify similarities/challenges created by collective observation.
Team ethnography data sessions also took place every 4–6 weeks with the ethnographers and the study PI. These meetings were designed to provide feedback to the PI on the development of work (applied and academic) at each of the six case study sites. These data sessions therefore included summaries of assorted developments, challenges and successes noted within each the FST. In this regard, the retrospective format of the ethnographers’ data sessions was repeated. However, these meetings also provided opportunities for the PI to raise questions about specific study sites, the progress of quality improvement projects and/or the type of methods employed by the various FST involved. Similarly, these data sessions helped address any challenges faced by the ethnographers (e.g. regarding the conduct of fieldwork) and provided opportunities for the PI to become involved in team ethnography fieldwork (via critical reflection and discussion). As such, these data sessions were both retrospective (talking about work done) and prospective (talking about work to do).
In addition to the above data sessions were those held with the full academic team. These meetings occurred less frequently (approximately every 3–4 months) but required the ethnographers to present summaries of all academic and applied work conducted across the six study sites. Accordingly, and in keeping with Knoblauch’s account above, the ethnographic field reports were openly shared and subject to multiple interpretations as part of the overall team ethnography approach to studying quality improvement work within the NHS.
Team ethnography method 3: Mapping observation and processes (during fieldwork)
A third method of team ethnography involved the evolution and production of team ethnography visual maps. This method arose more by accident than design due to the way in which fieldwork sites were allocated to the three ethnographers within the academic team. As noted in Figure 1, Ethnographer 3 was responsible for the conduct of FE at three study sites. As he became more deeply immersed in fieldwork at each of these sites, the collapsed ethnographic dataset (relating to observations and interview data from the three sites) became more voluminous and more descriptive with each successive visit/observation as part of FE. As such, for all data sessions (with Ethnographers 1–3, the study PI and the wider academic team), there was a need for Ethnographer 3 to devise a system of note-taking and information sharing that did not confuse the various sites (and specific experiences) with one another, within the team or, indeed, for his own records. A form of systemised note-taking subsequently occurred in a somewhat serendipitous manner (as with conventional ethnography) as Ethnographer 3 began sketching the evolution of one FST quality improvement project at one particular location in his field journal.
The need to sketch the progress of this particular quality improvement project emerged from the complex development and progress of the multi-faceted, multi-component project designed by the FST concerned. More specifically, the relevant FST had devised a quality improvement project consisting of 3 aims and 9 objectives that were to be initiated in a stepwise manner to obtain the various goals.
As such, in order to summarise the various workstreams/methods attached to this complex project, Ethnographer 3 began charting the FST activity/progress as an evolutionary and longitudinal timeline within an A4 notebook (see Figure 2).
1
This timeline (forming the x-axis) noted the varied developments of the nine objectives (upon the y-axis), in which the ‘mapping’ exercise represented all quality improvement activity (including positive and negative influences) completed at the midpoint of fieldwork. It was at this point (6 months into fieldwork) that Ethnographer 3 needed to devise a suitable method to facilitate data session feedback, case study summaries and ethnographic reflection as spontaneous, accurate, recall was becoming too problematic. (It was also at this point in time that the three study sites visited by Ethnographer 3 were each beginning to form their own ‘identities’ that were influenced by institutional culture (and associated codes of practice) and organisational pressures). In short, a simple sketch map sought to visualise the overlap of ethnographic observations and the tracking of FST achievements. Examples of the former included notes upon the map relating to staff meetings (including cancelations), staff turnover, staff inclusions, and details of when each workstream went ‘live’ on the hospital ward. Examples of the latter included notes also sketched onto the map relating to methods used, staff involved, co-production with patients, limitations to implementation and the range of resources made available to the relevant FST. That is, the initial sketch map inadvertently portrayed methods of processes (of the frontline staff) and ethnographic analysis (of Ethnographer 3) in equal measure. As such, the visualisation of the emic and etic perspectives of the design and development of a quality improvement project took shape as a response to provide feedback to the various data sessions built into the wider study. Initial sketch map in Field Journal.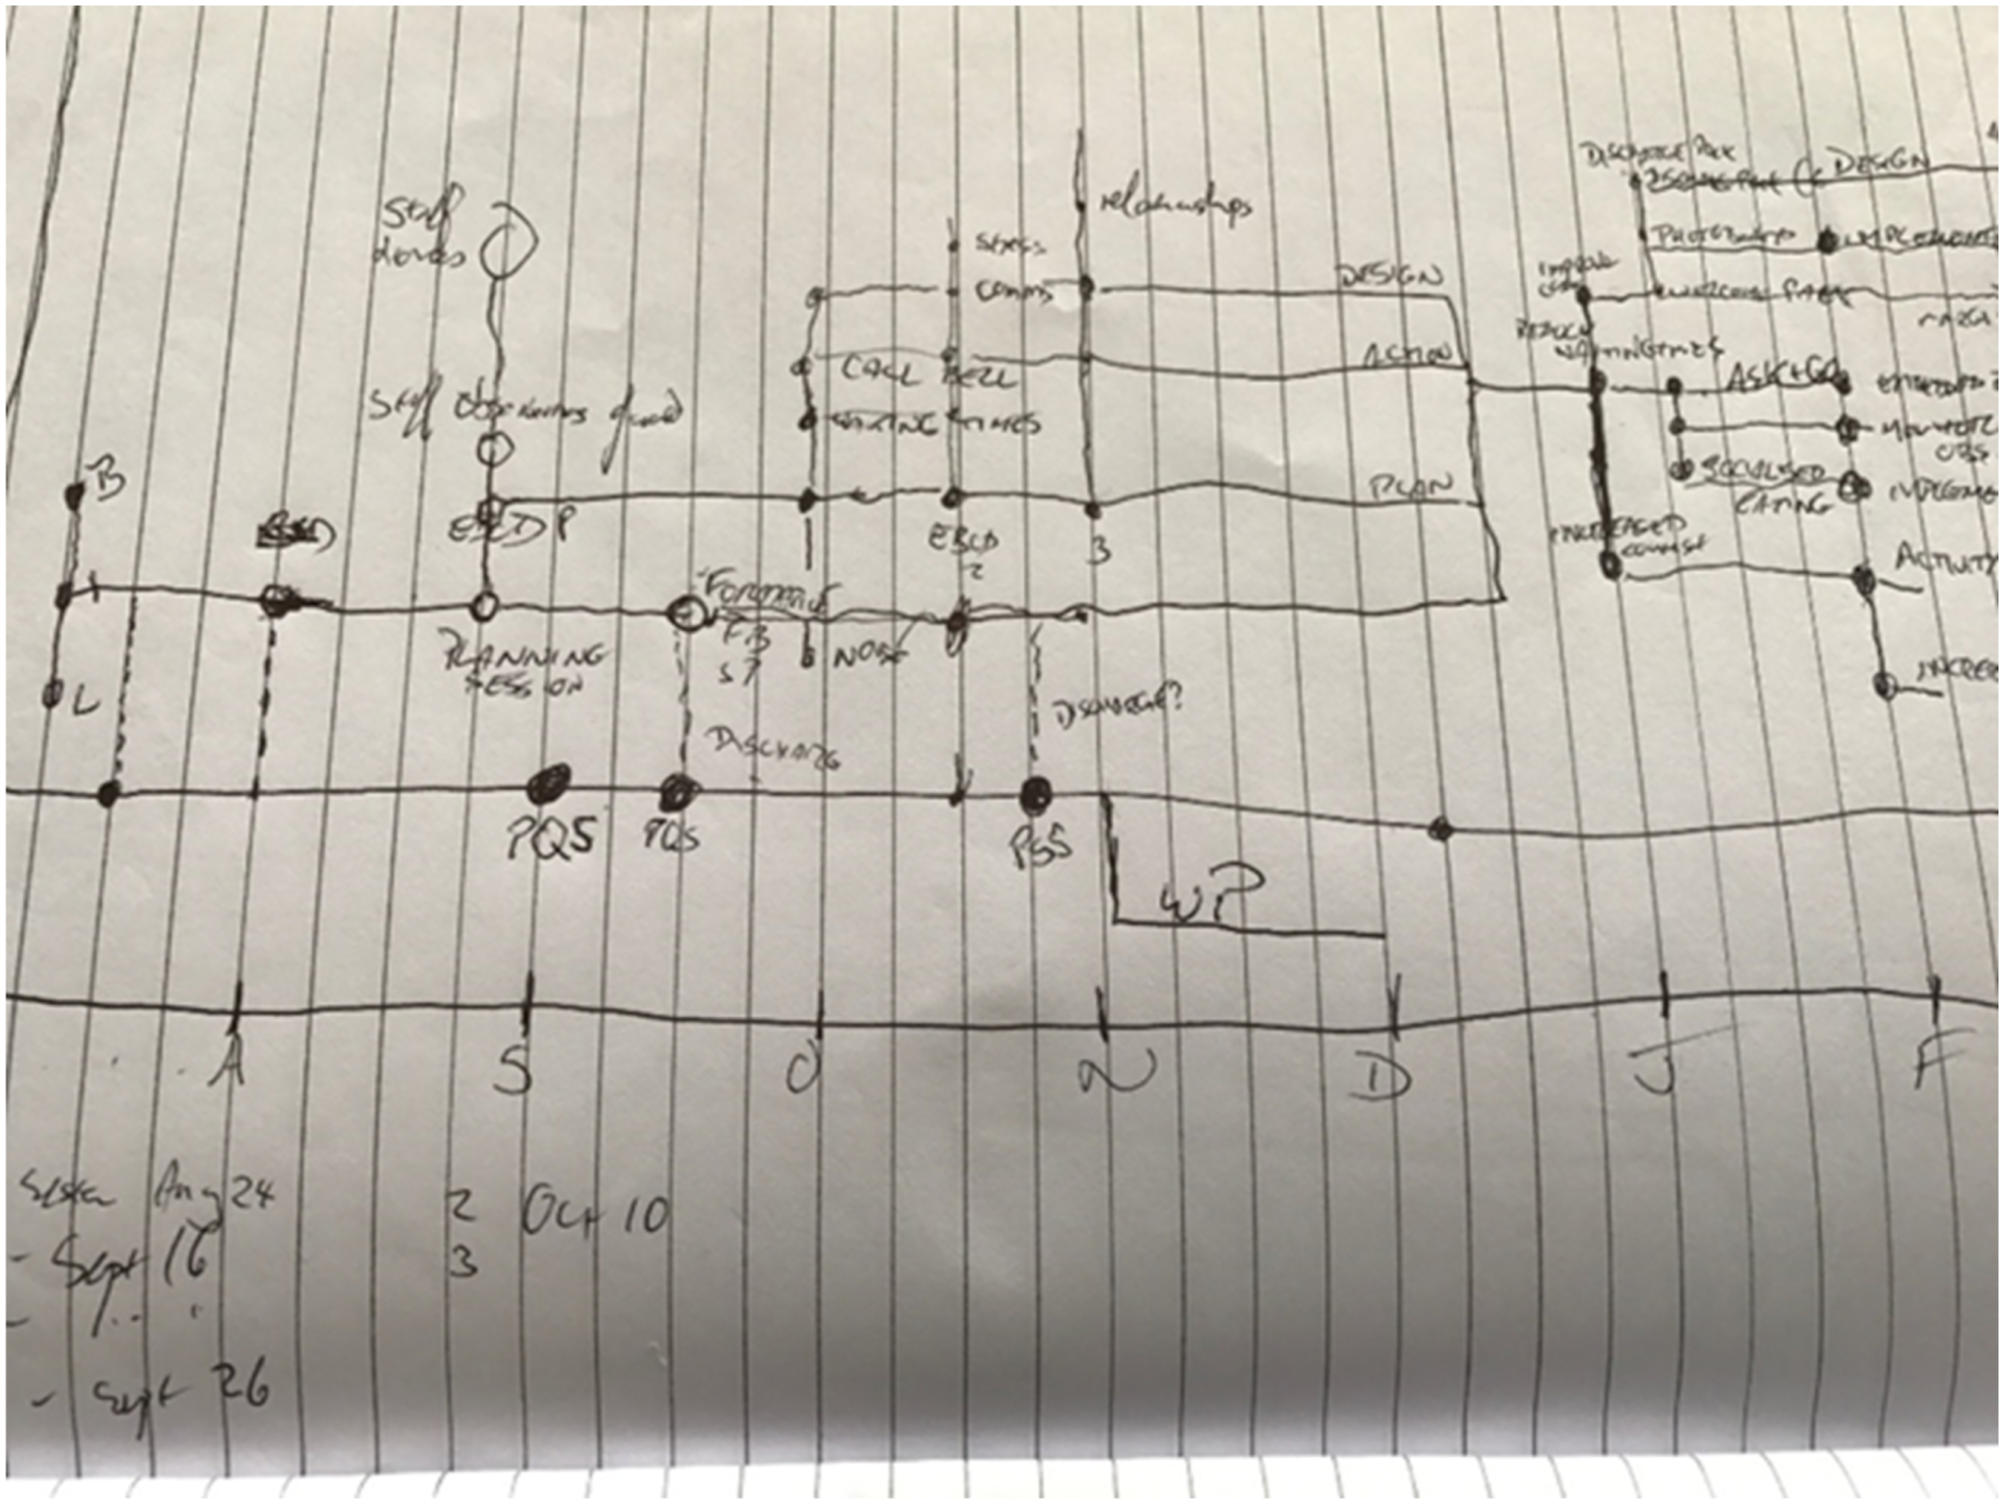
In recognising the visual impact that this initial sketch map immediately produced (especially in terms of summarising the complex work conducted by the relevant FST at the relevant data sessions), Ethnographer 3 repeated the same mapping exercise for the two additional study sites with which he worked 2 . This activity produced three remarkably different A4-sized sketch maps, that each visualised the range of different processes and assorted progress across the three study sites concerned, despite the fact that the 3 FST were each engaged in similar activity within the same institution (NHS England).
Additionally, the three maps also visually portrayed the different methods in which the respective FSTs had approached the task of conducting quality improvement on their respective wards. That is, the maps (perhaps inadvertently at this stage) began to indicate responses to the key research question regarding how frontline staff use (or do not use) patient experience data to develop quality improvement projects in frontline settings. That is, an emerging ethnographic object within these three sites became apparent and related to the observation of common structural barriers/facilitators at each of these three locations regarding the implementation of work at the frontline.
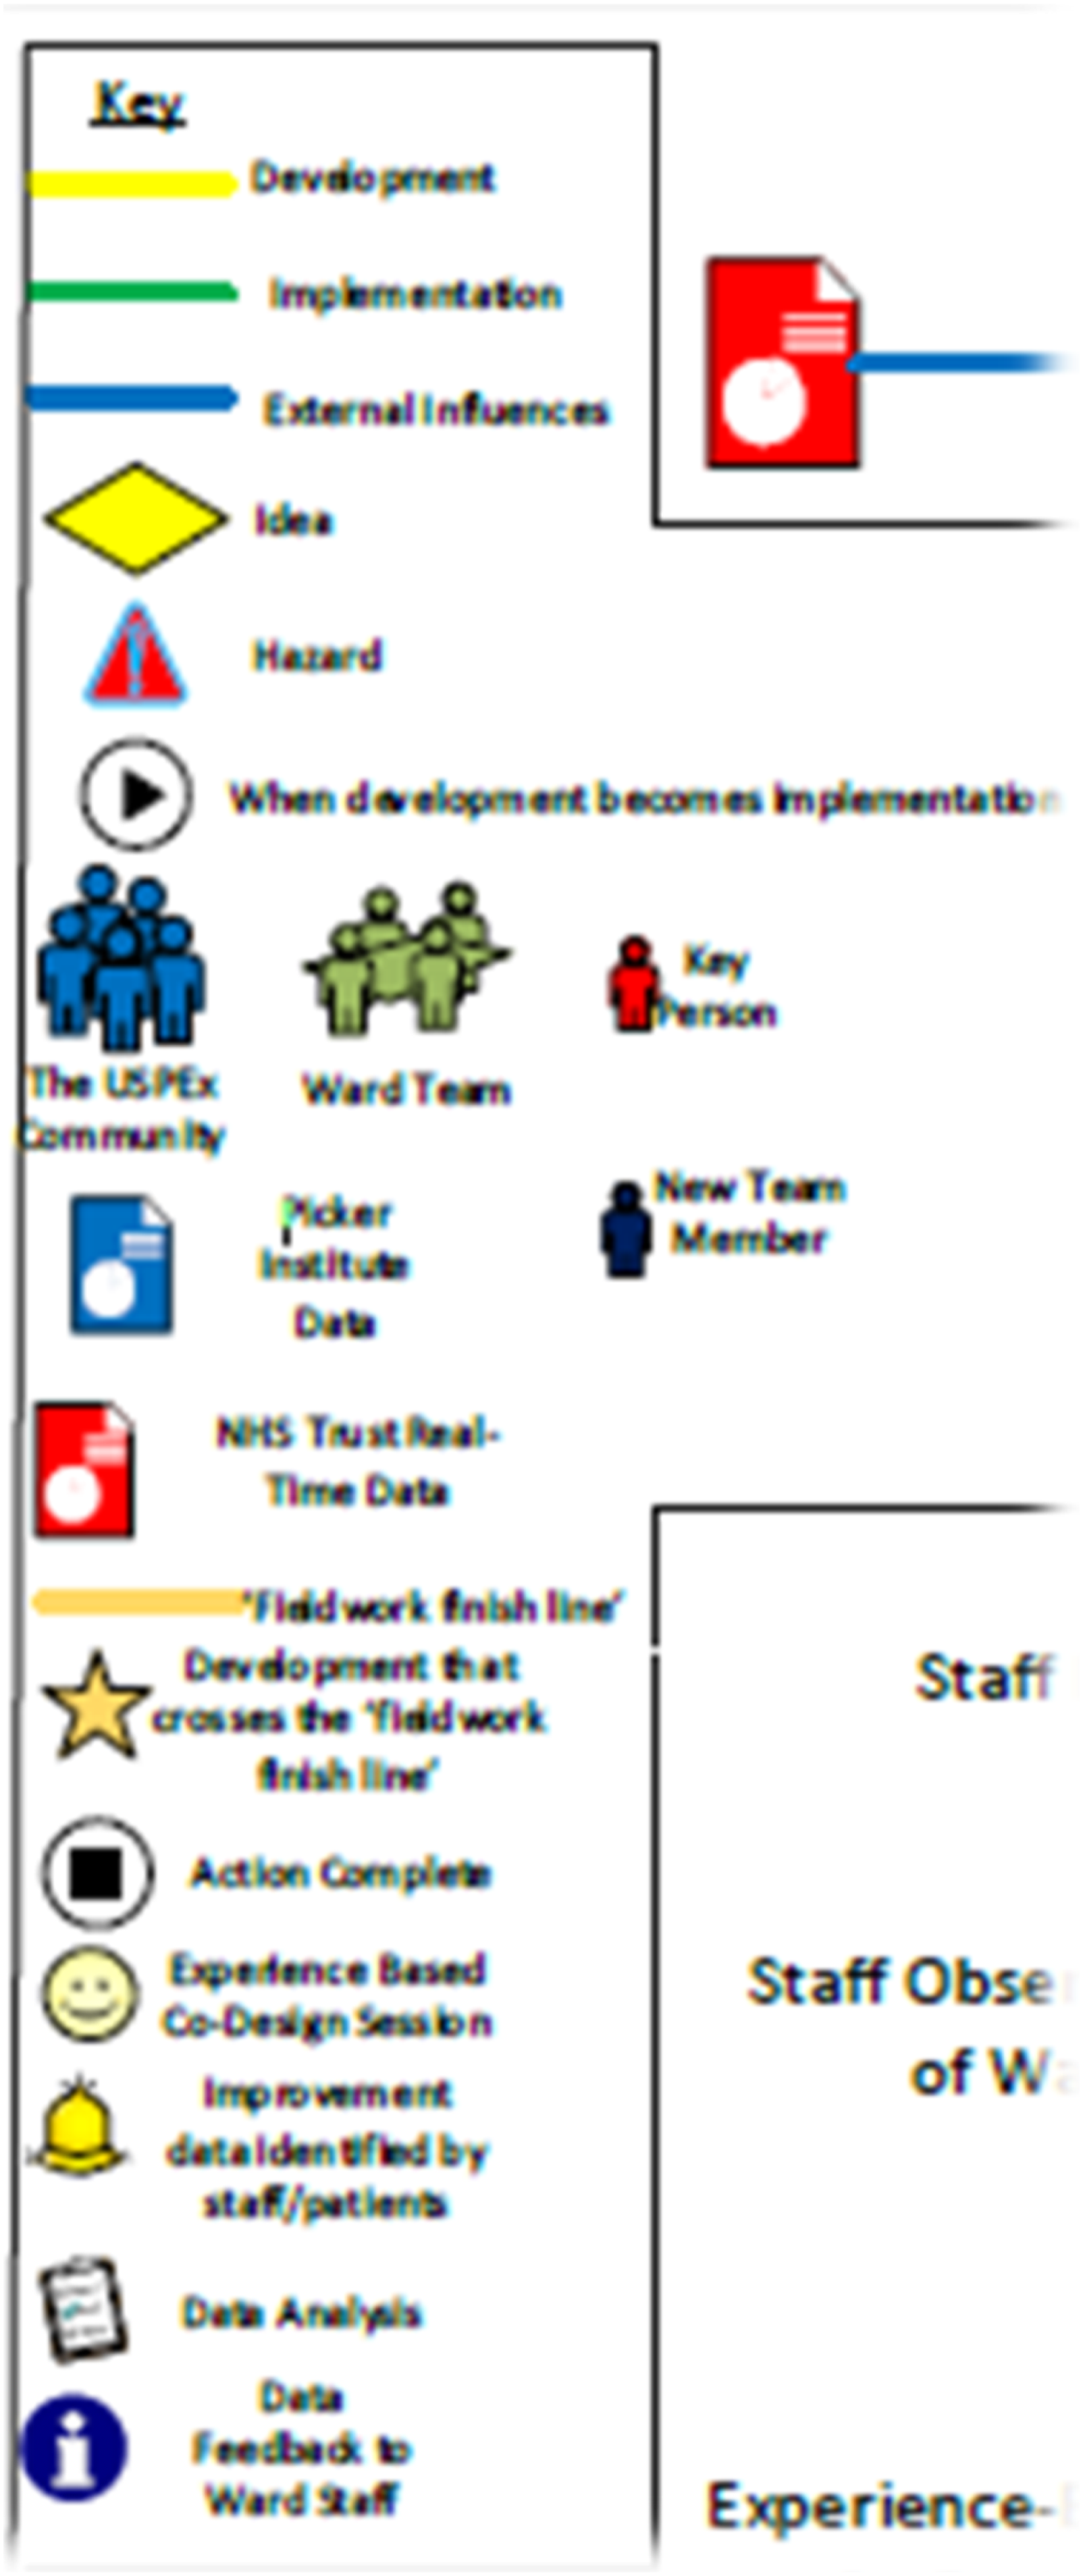
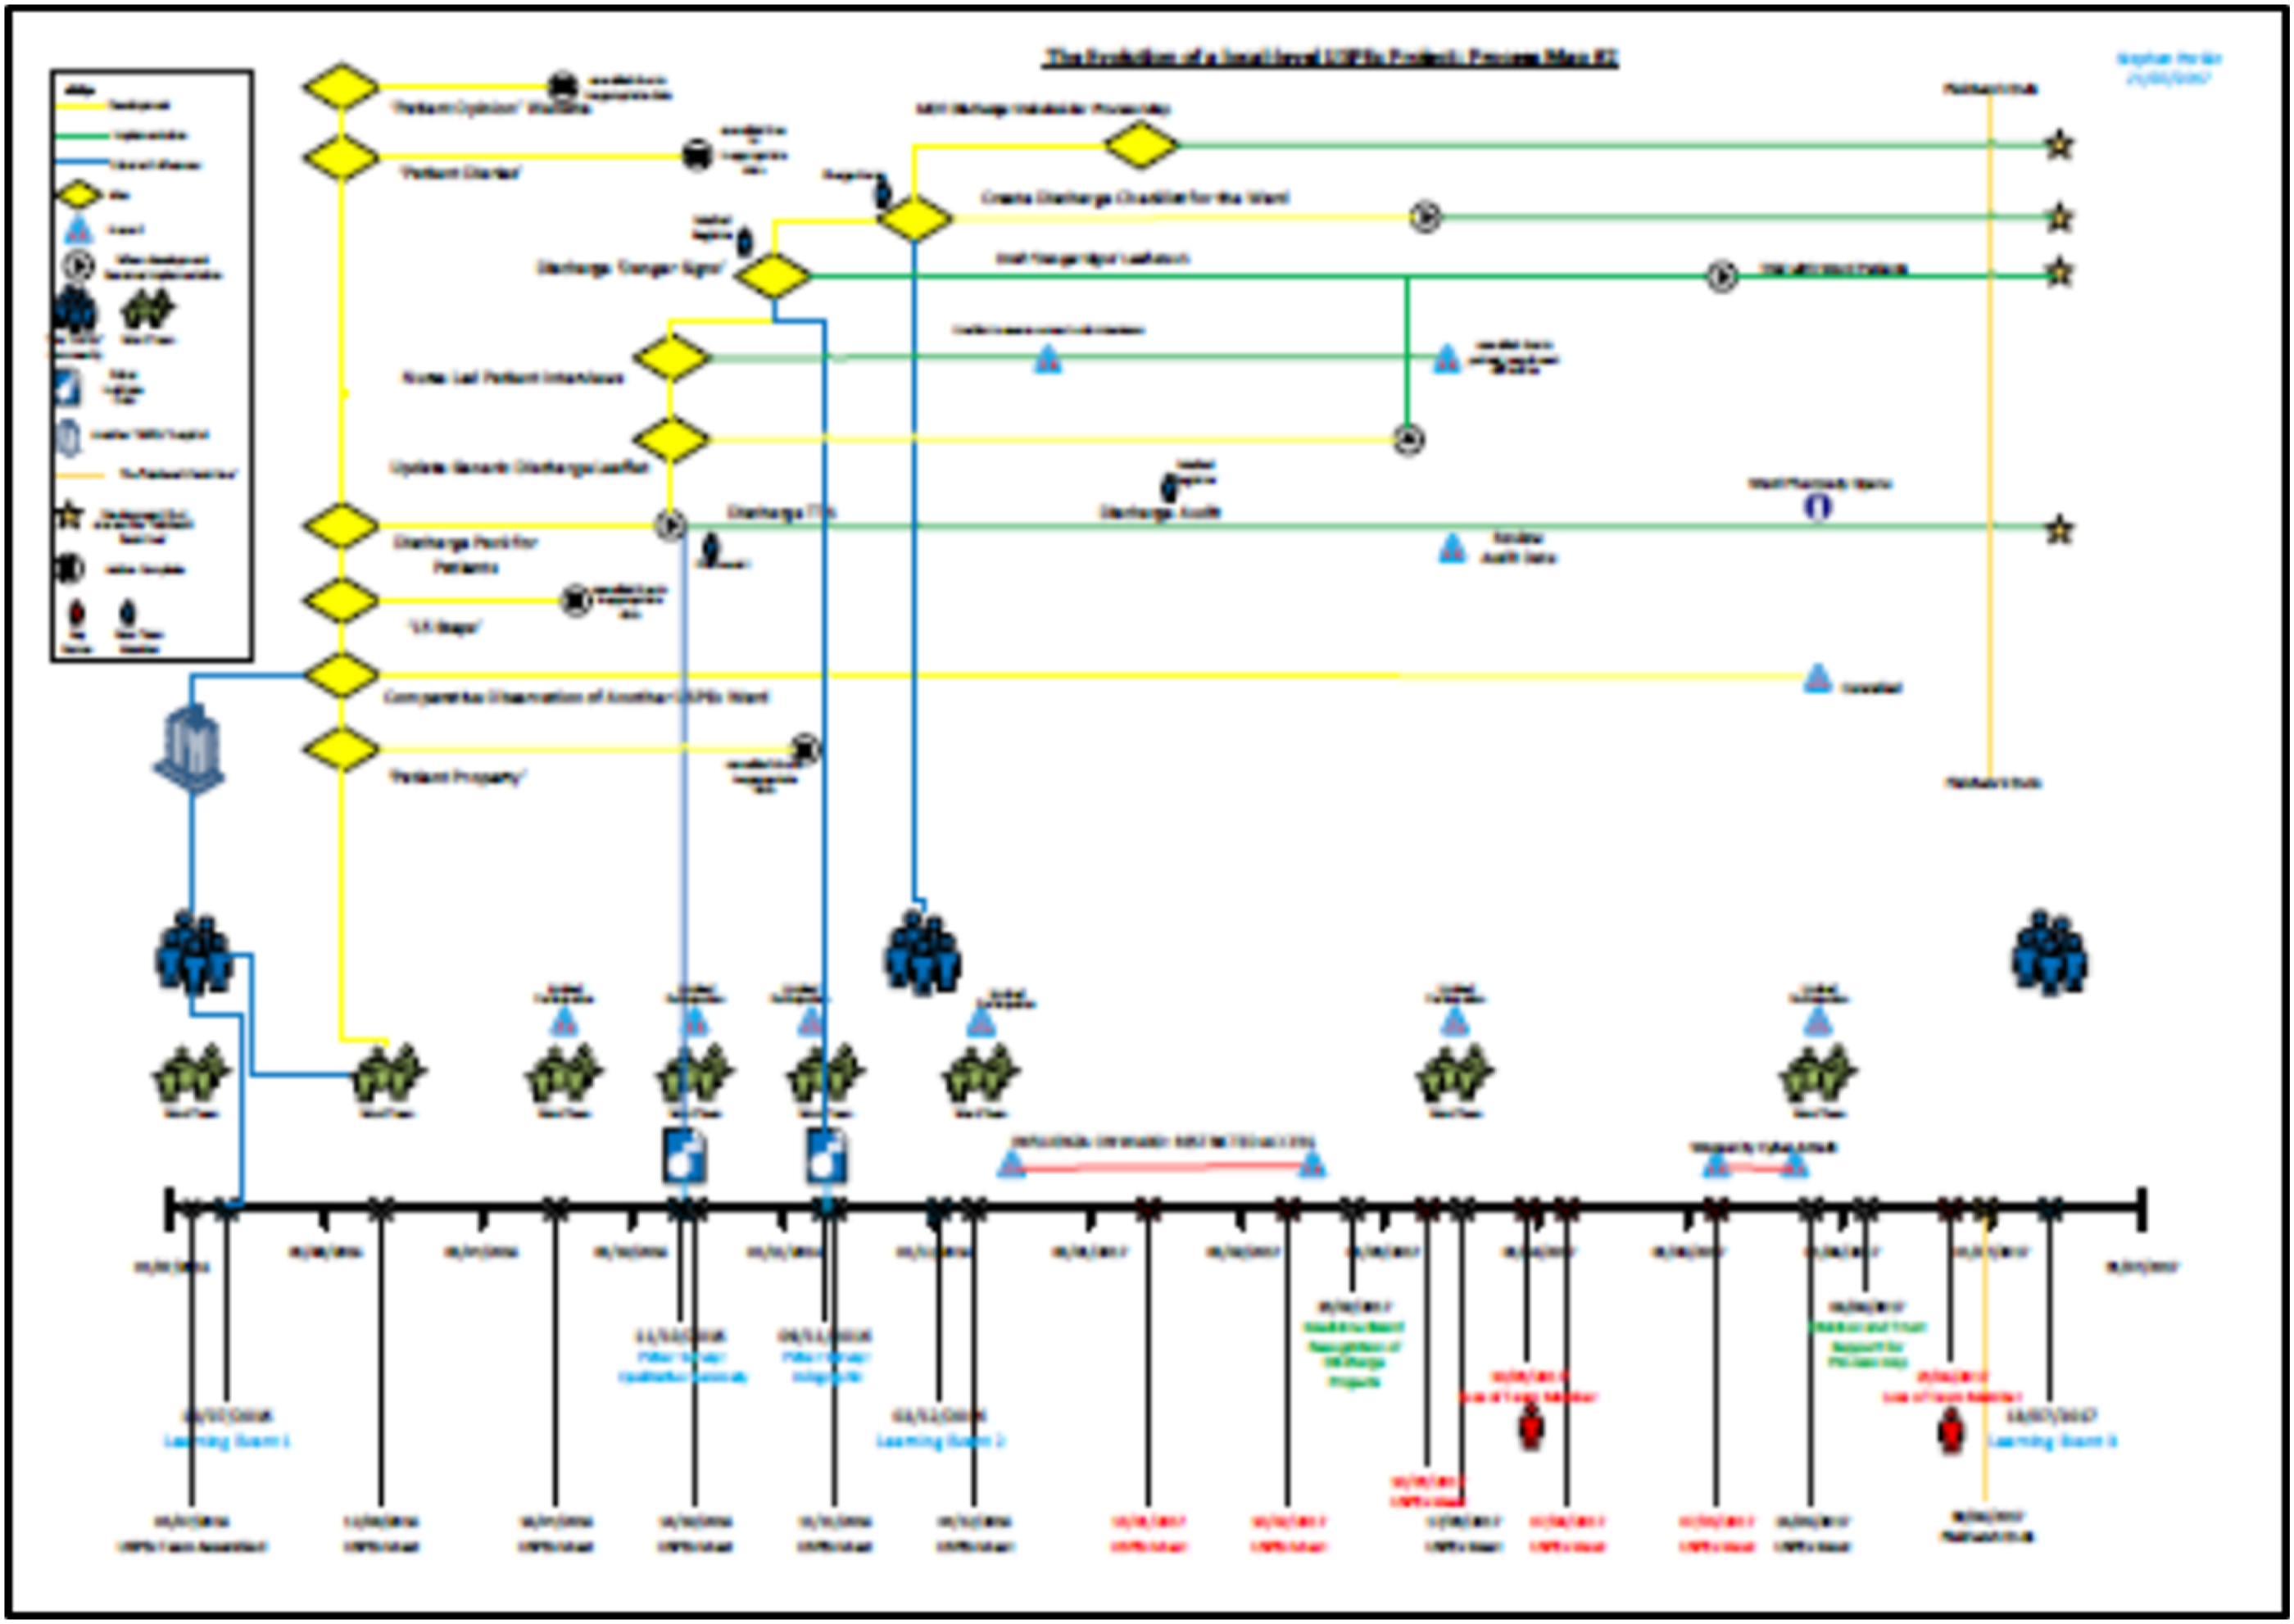
Ethnographer 3 then reproduced the three A4 notebook sketches as three large-scale A2 ‘visualisations’ (see Figures 3 and 4). These versions of the maps introduced and established a common coding-scheme (‘a key’) consisting of a colour-coded diagram with various symbols to represent and characterise the assorted activity noted across the three study sites. These symbolic representations included unique activities relating to process, progress, barriers, outcomes and ethnographic observation. For example, workstreams in ‘planning and development’ within each project were represented by a horizontal yellow line (representing forward progress through time). When these workstreams were implemented and operationalised on the hospital ward (with patient involvement) the horizontal yellow line changed to the colour green. In addition, when this line crossed the symbolic ‘finish line’ (the end of all fieldwork) the line terminated at a large gold star (representing successful completion, implementation or ongoing status of a specific quality improvement workstream). In contrast, workstreams that did not develop to full implementation (or those that were dropped by the FST) were labelled as red lines punctuated by a large bold Development of sketch map into large-scale map. Completed large-scale, hand-crafted team ethnographic visual map. Key to team ethnography visual mapping.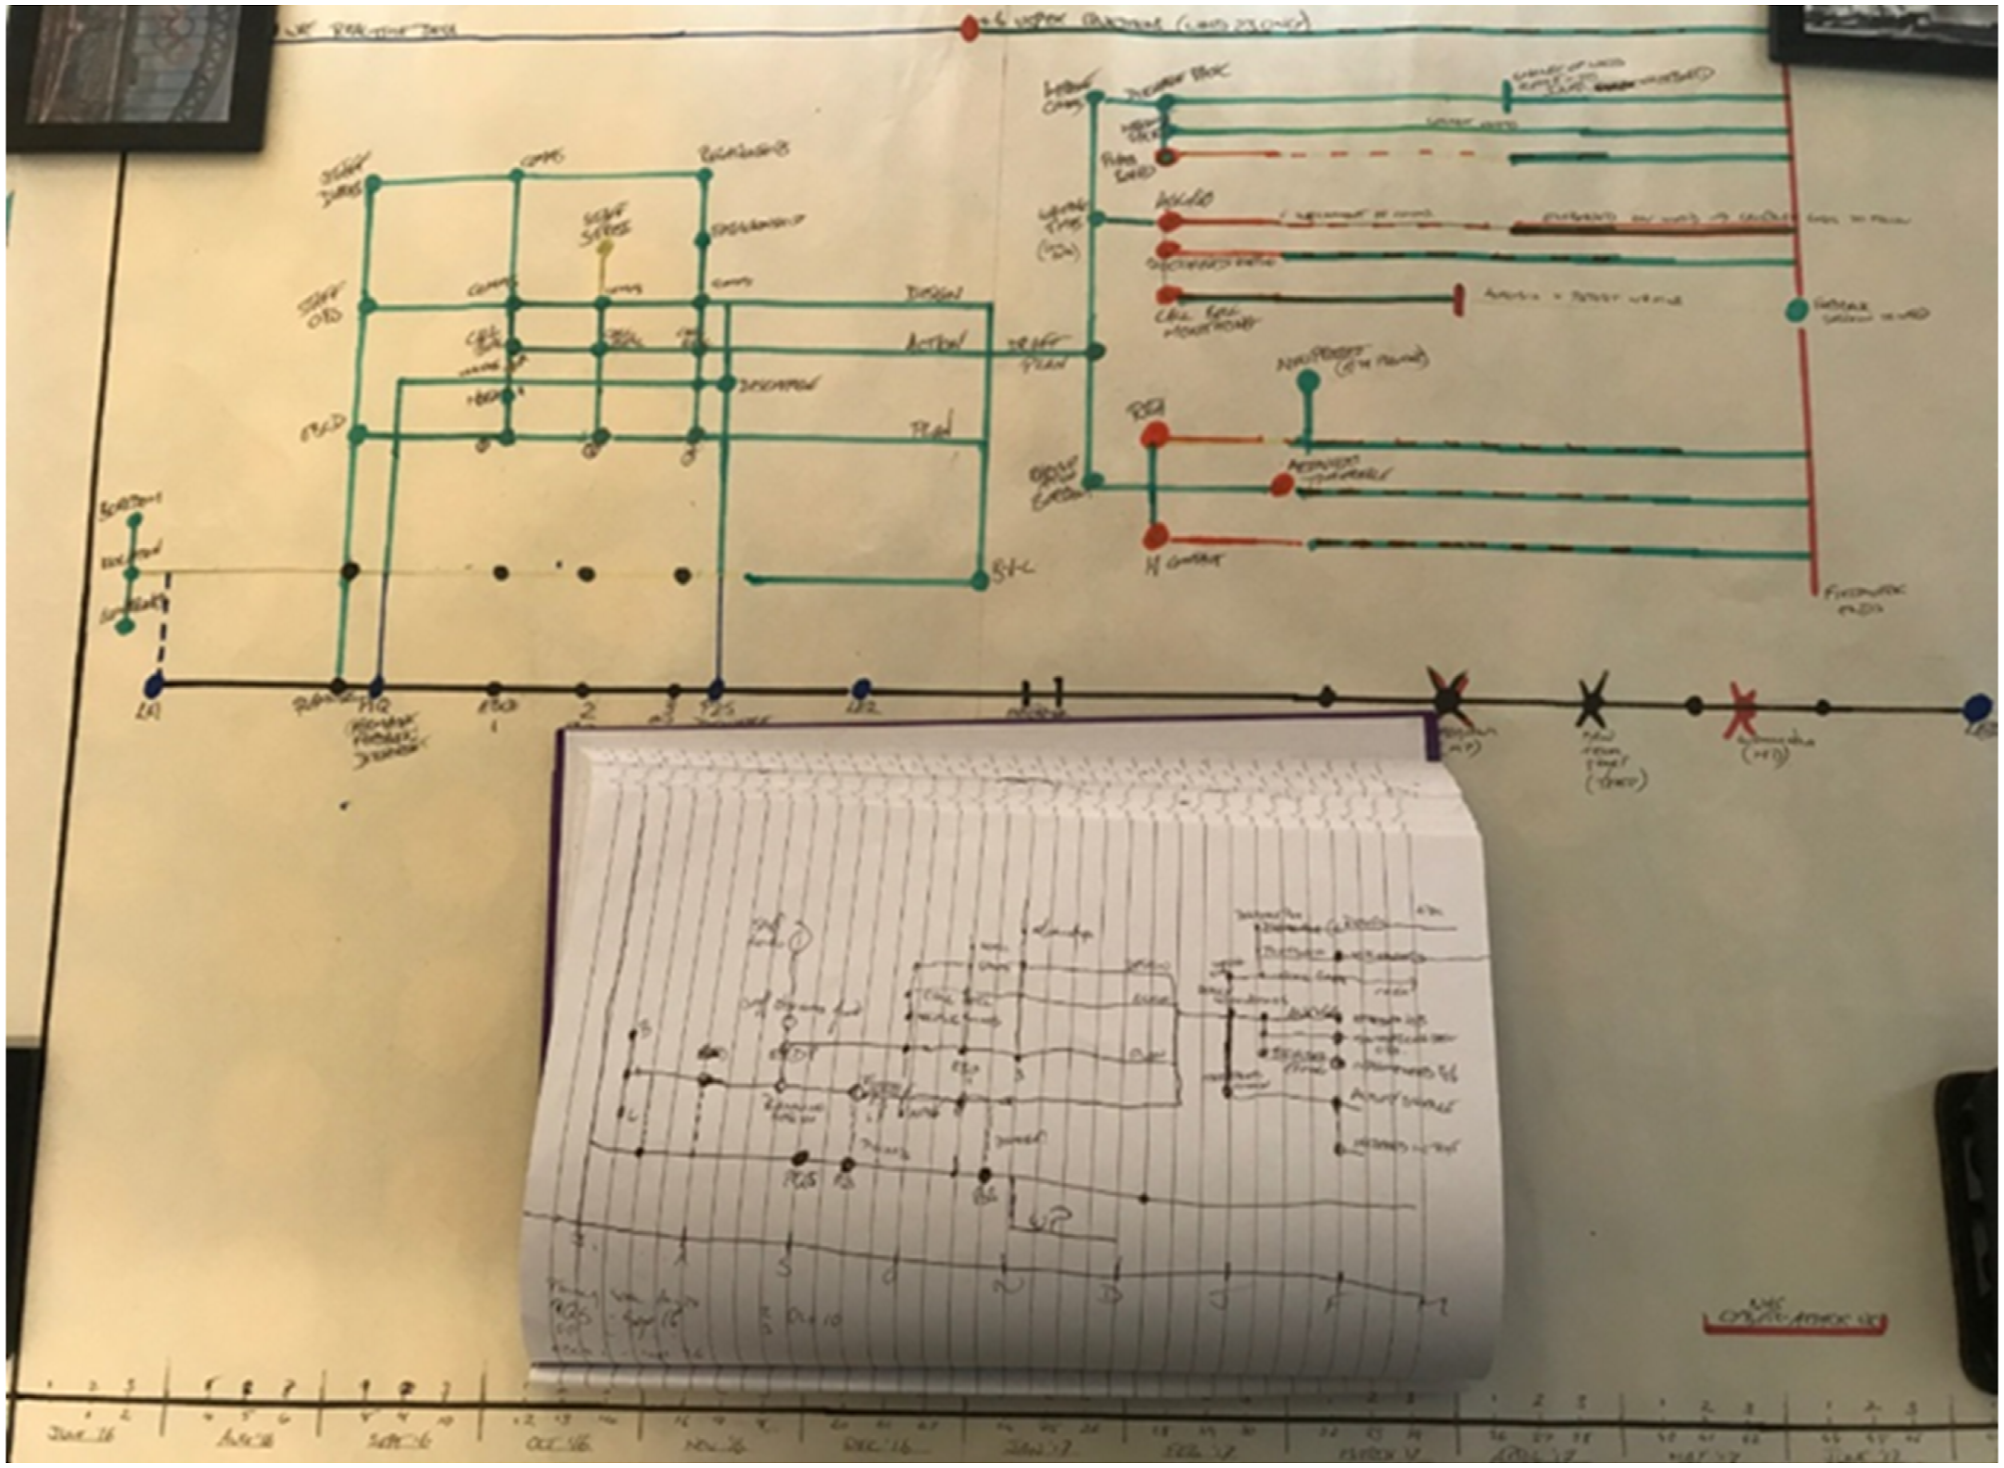
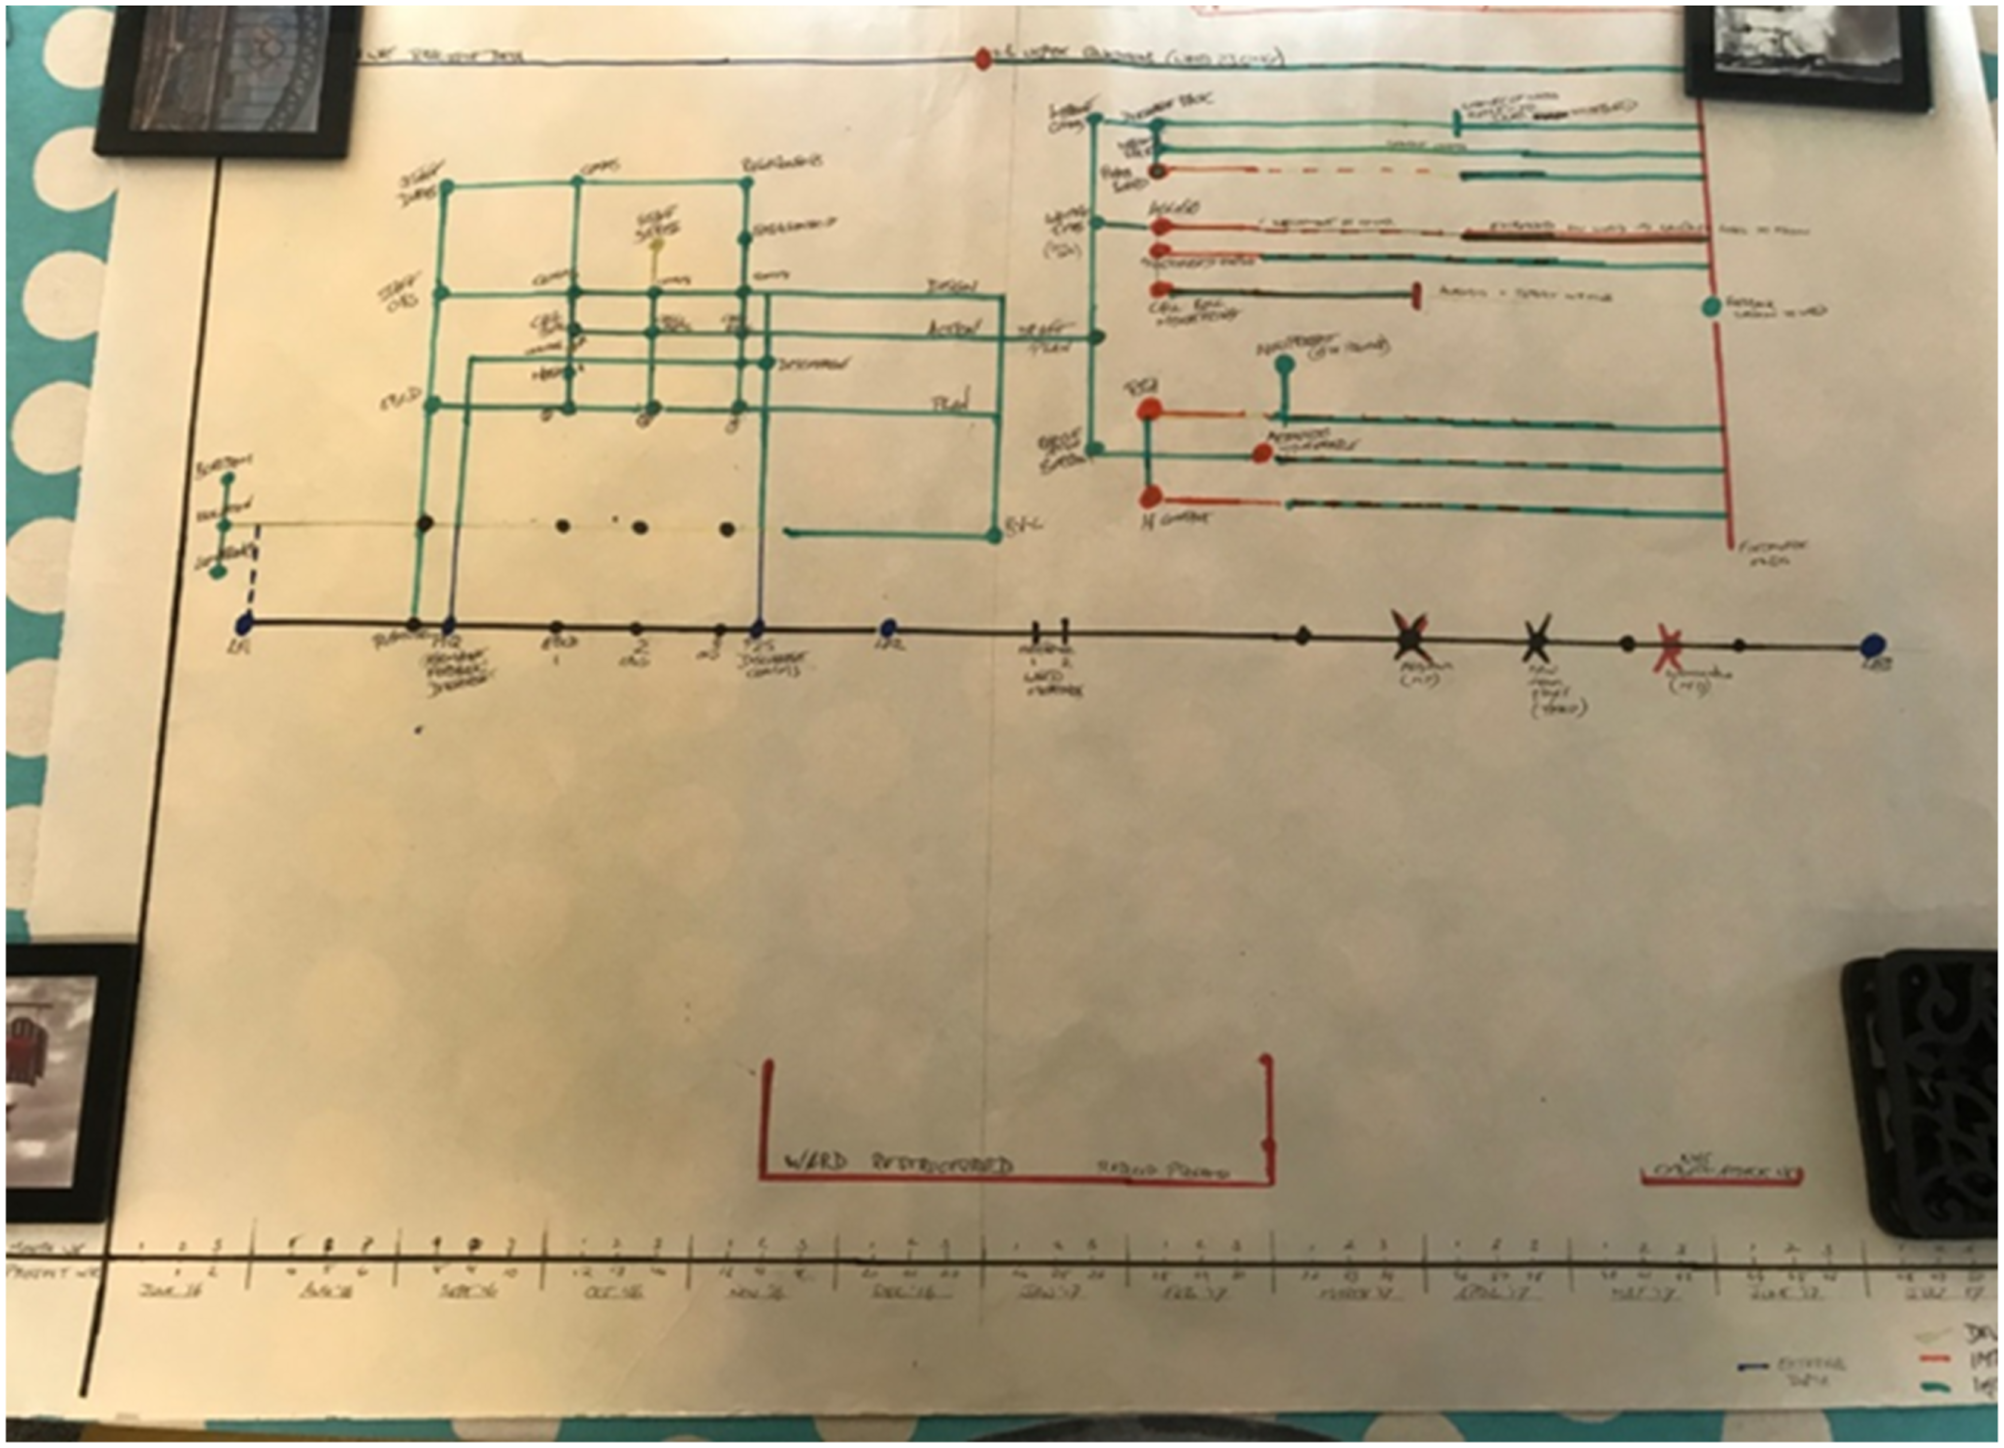

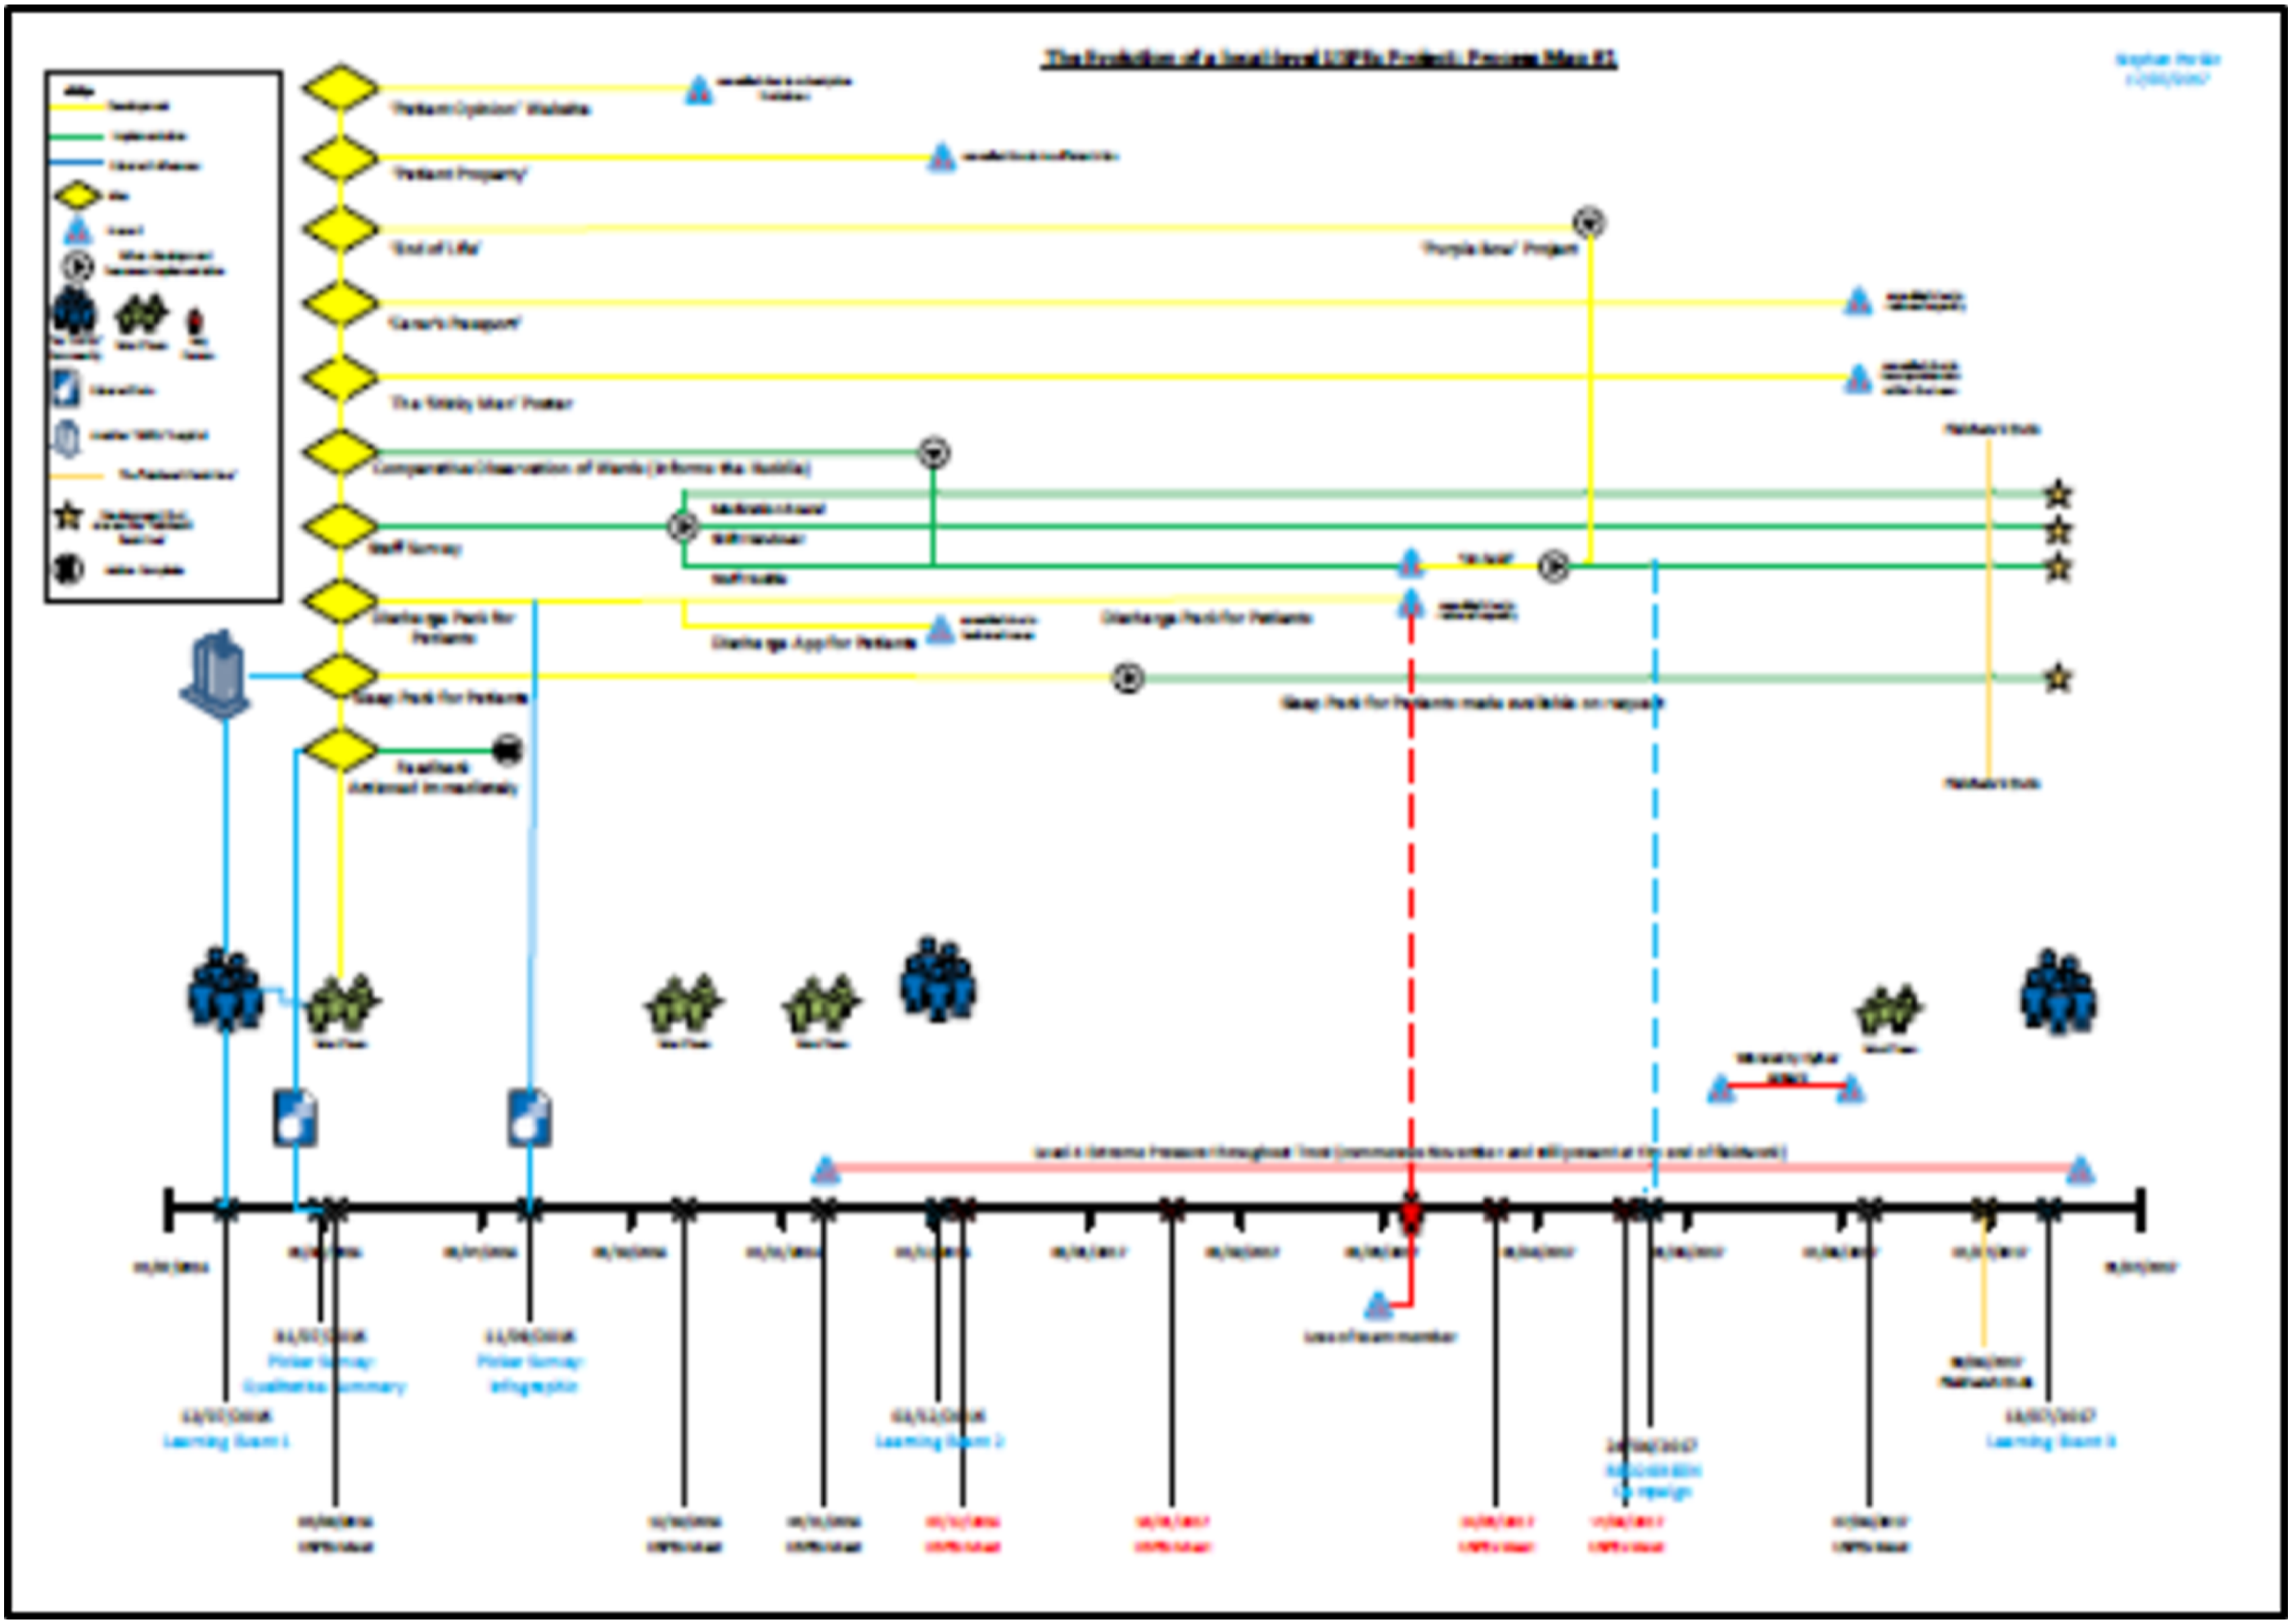
Towards the conclusion of all fieldwork (after 9–10 months), these three hand-crafted maps were subsequently recreated using Microsoft Visio 2013 (Standard Edition). The images were reformatted using this diagramming software that has been developed specifically for the professional construction of flowcharts, organigrams, building/floor plans and business-focused process maps. The subsequent recreation of uniformly designed, full colour, ‘ethnographic process maps’ had the immediate impact of producing an ‘at a glance’ description of entire workloads – or single workstreams – conducted at the three study sites. As such, the completed three maps eventually provided a visual summary of all work conducted by each FST from three different locations for the period July 2016–July 2017. These maps are reproduced in Figures 5–7 in a format to avoid identification (through partial legibility) of the NHS Trusts involved. Conversion of Figure 3 using mapping software for Site 1/Ethnographer 3. Team ethnography visual map for Site 2/Ethnographer 3. Team ethnography visual map for Site 3/Ethnographer 3.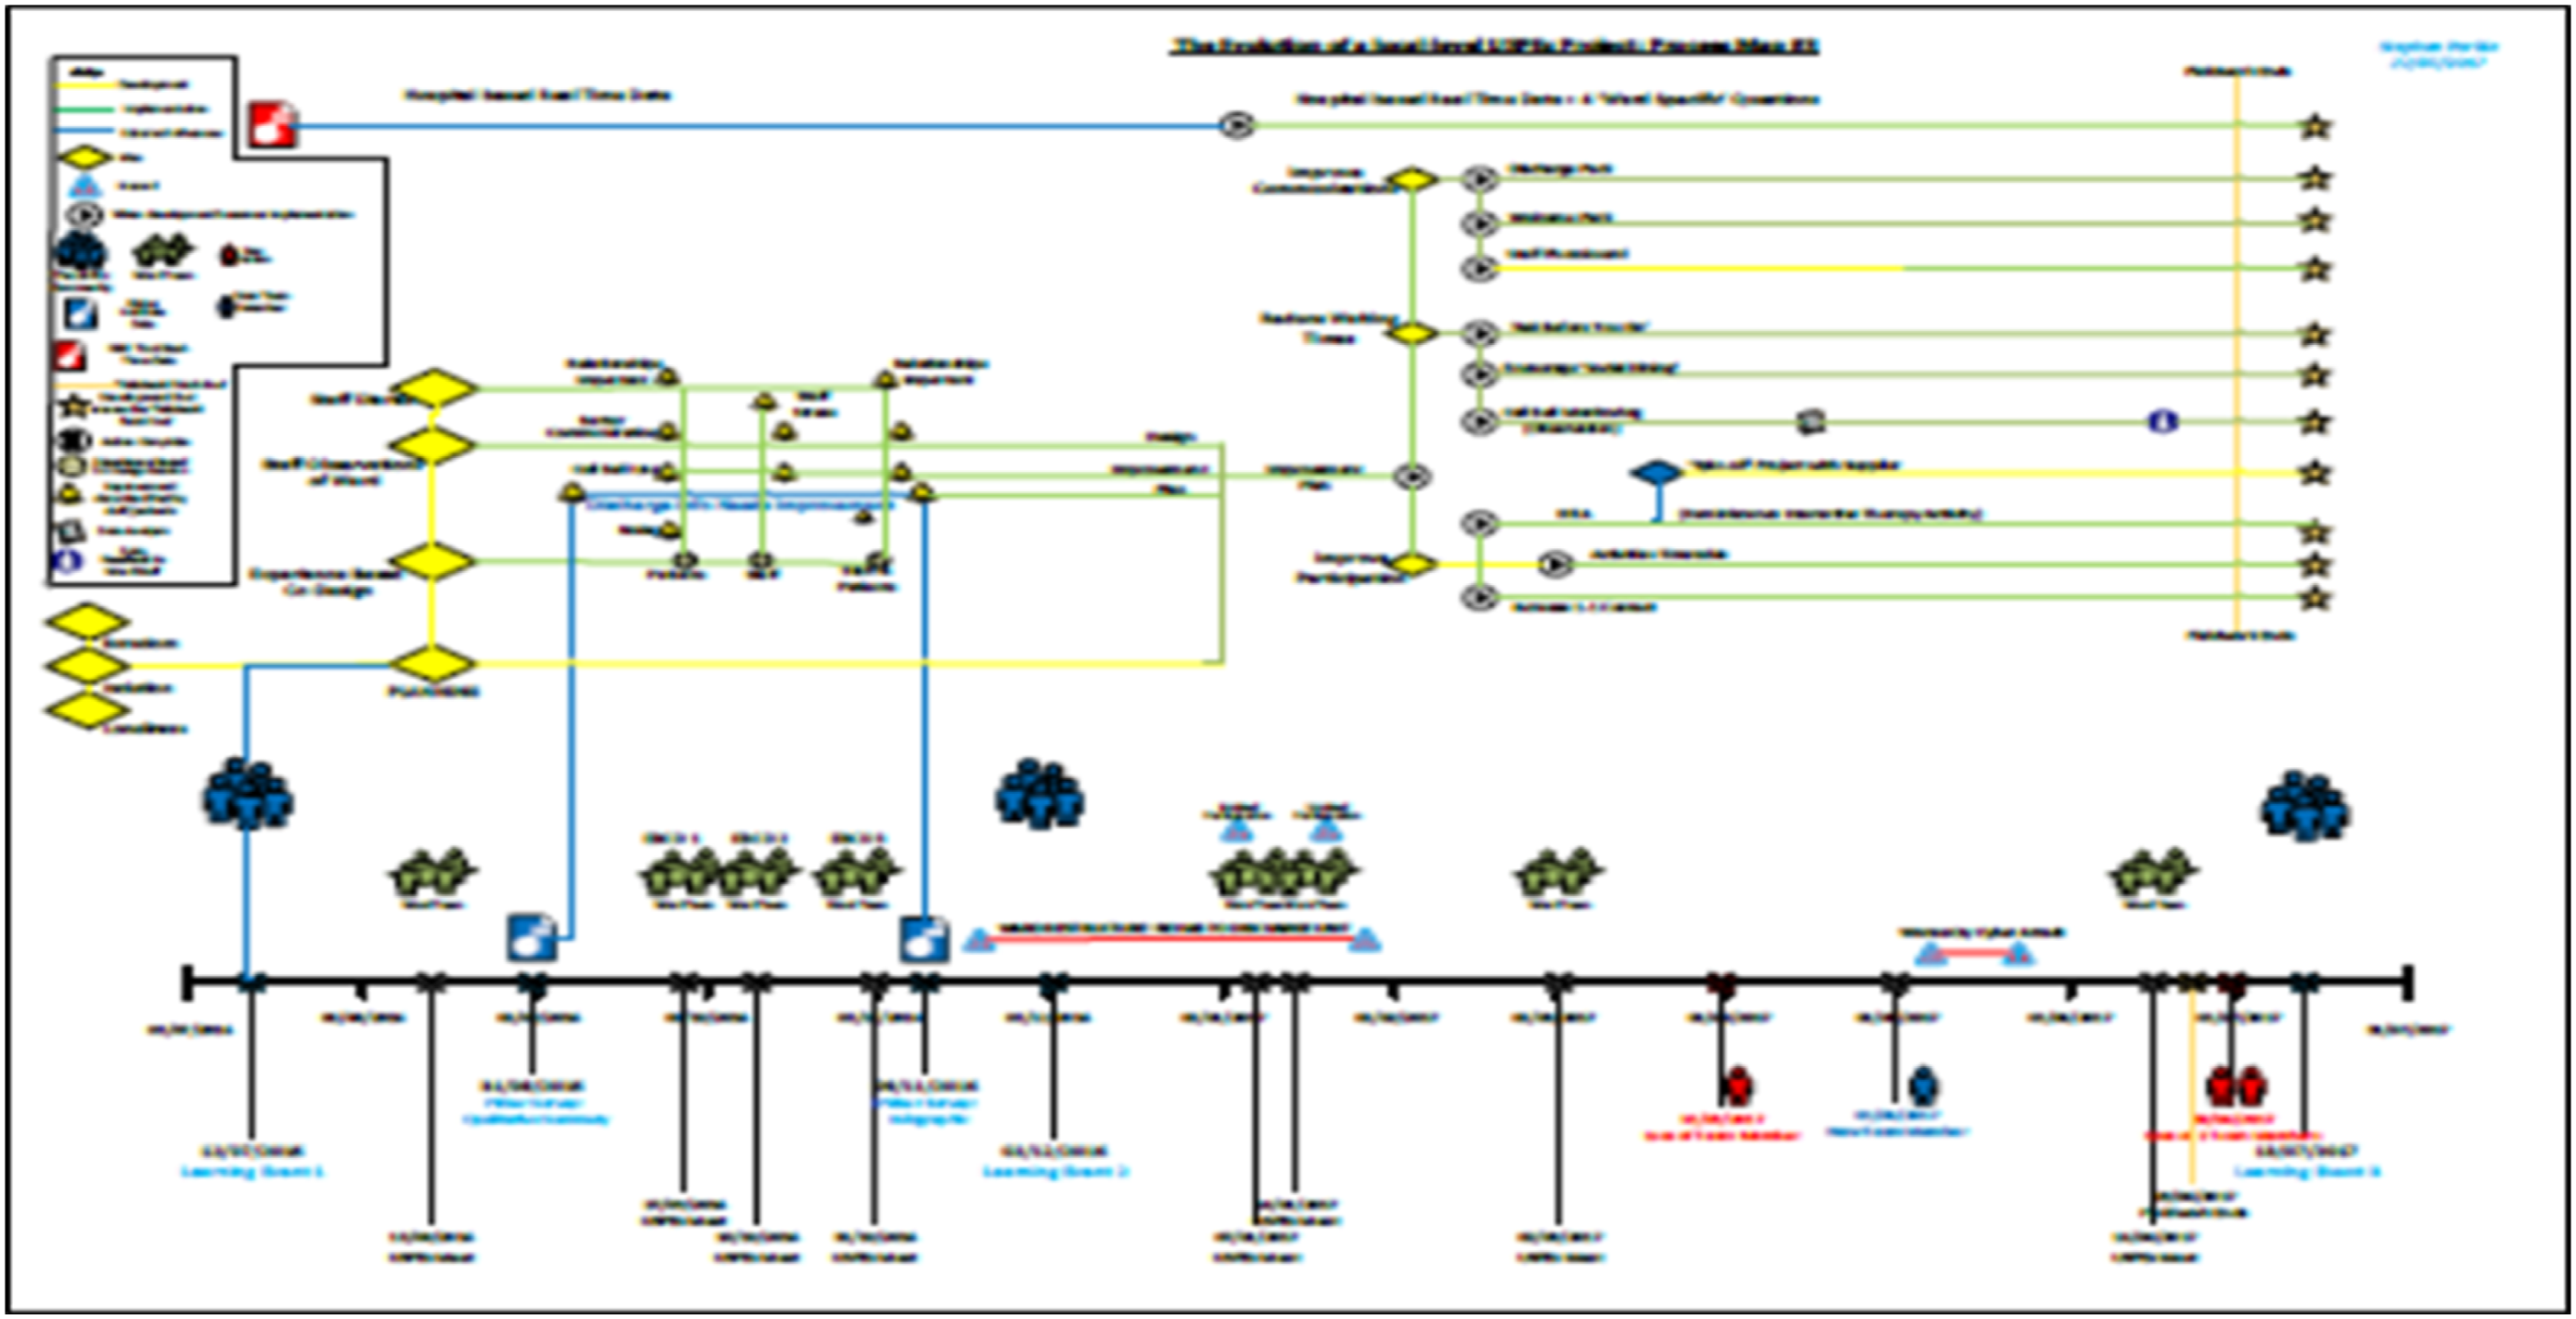
Team ethnography method 4: Mapping collective reflection (post fieldwork) via team ethnography data sessions
It is perhaps necessary to reiterate that the original construction of ‘ethnographic visualisations’ was primarily to provide a visual aide memoire for Ethnographer 3. That is to say, the original first draft sketchmaps sought to summarise only one FST project for the purpose of data recall at data sessions with other team members. However, it became apparent that the reproduction of two further sketchmaps would further facilitate the management of three qualitative datasets obtained from three different field sites. For this reason, the construction of visual representations of the field afforded immediate benefit to Ethnographer 3 – especially in terms of providing ‘formative analysis’ to assorted data sessions attached to the overall team ethnography. For example, the visualisation of processes (by the frontline teams) and of ethnographic observations (by Ethnographer 3) assisted with the narrative recall of multiple events and complex activities during team-based sessions regarding ethnographic fieldwork.
However, as the maps developed – through time, through the visual material used, and through assorted media used to create them – they also became a visual tool for assisting team ethnography data sharing and reflexivity. That is, the maps significantly informed and influenced shared reflection of the shared/common cultural/institutional barriers/facilitators to quality improvement projects designed and delivered at all six study sites. Furthermore, the three maps provided empirical tools for discussing similarities, differences, comparisons and contrasts across the three sites where no similar maps were created during fieldwork. Indeed, the maps were influential in this latter regard, that Ethnographers 1 and 2 subsequently produced similar maps of their respective study sites at the completion of all fieldwork (i.e. during the ‘analysis stage’ of the study). These additional maps followed the mapping structure and included the various keys/symbols associated with the three existing maps. In turn, the 3 additional maps provided data for further iterative and reiterative discussion within the wider academic team throughout the writing up period of the study.
Accordingly, over time, the maps shifted perspective from that of an individual ‘reporting upon ethnography’ to that of a team ‘reflecting upon collective frontline enterprise’ noted across the six different geographic locations. In this regard, the maps and the data sessions each contributed towards a collective sense-making of how frontline staff understand patient experience data with regard to the design and delivery of quality improvement projects.
Discussion
From a methods perspective, the various components described above (namely, focused ethnography, and team ethnography visual maps and data sessions) demonstrate the ways in which a large-scale, multisite qualitative study of health service delivery was completed in a relatively short period of time. The latter is especially true if the study had been premised upon a more conventional ethnographic approach, as it would have required long-term immersion at the six locations by the three ethnographers concerned. As such, the methods underlying team ethnography as described above highlight these as pragmatic responses to generating and analysing qualitative data in a rapid, yet focused and co-ordinated, manner. However, the same methods may also be considered more in terms of their methodological value, especially regarding the conduct of health-related research that is informed by social science. This methodological value is discussed below, in terms of both academic and applied research.
As noted at the onset of this article, although team ethnography appears to be an increasingly popular approach within social sciences and health research, there is currently little known about epistemological issues attached to such an approach. These epistemological issues may, for example, relate to the way in which team members may (or may not) share with wider team members (or other audiences) how they produced a common understanding of an issue under investigation; or explain how ‘evidence’ is generated in studies involving multiple investigators working together in the same ‘field’. To reiterate the point made by Jarzabkowski et al. (2015), ‘we still know little about how teams of ethnographers work together, their concrete methods and the way they practice research’. As such, the accounts of team ethnography visual maps and team ethnography data sessions in this article provide some redress to this absence of epistemological detail regarding inter-group dynamics associated with team ethnography per se.
For example, the generation of team ethnography visual maps established a visual system of curating ethnographic and process data, for the specific purpose of sharing and discussing content in team ethnography data sessions. These methods especially enabled the four members of the ethnographic team (the authors) to work as one in a joint and reflexive manner and in a way that encompassed their respective varied disciplinary (and epistemological) backgrounds and associated research experience. Indeed, it was perhaps the latter range of disciplinary and research experience that fully facilitated critical reflection and full interrogation of the team ethnography visual maps during each of the various data sessions throughout the entire project.
For these reasons, methodological value from an academic perspective therefore relates to the frequency and regularity of collaborative reflexivity employed throughout the USPex study by the ethnographic team. Furthermore, this form of iterative and reiterative reflexivity provided opportunities to identify connections and relationships within each field site, which were then consolidated in comparisons between the six sites. Accordingly, this collaborative process resulted in a form of collective sense-making (Jarzabkowski et al., 2015, 17) that simply would not have happened in a study employing a more traditional ethnographic design (i.e. typically involving one person working alone in the field and solely responsible for all data analysis/interpretation).
Further methodological value of the team ethnography methods described above may also be noted in the assorted applied outcome associated with the USPex study. As indicated above, the overall aims and objectives of the study were concerned with producing ‘real-world’ value so that frontline health practitioners could better understand and engage with patient experience data for applied purposes. The team ethnography approach to understanding how frontline staff use such data identified a number of barriers and facilitators that determined the level of success within each of the six settings and their respective quality improvement projects. Indeed, these barriers and facilitators are framed in terms of the sociological construct of capital (Bourdieu, 1986). Perhaps more accurately, we refer (Locock et al. in press; Montgomery et al. 2020b) to the concept of ‘team-based capital’ to describe the way in which access (or not) to a range of social, symbolic, economic and cultural resources within NHS (England) settings may facilitate or problematise approaches to healthcare development, especially when situated on the ‘frontline’ of delivery. The relevance of ‘team-based capital’ is perhaps one of the core findings to emerge from the USPex study, and it was this issue that was identified by team ethnography as the ethnographic object consistent across all six field sites involved in the study. However, the analyses involved in identifying this ethnographic object evolved and developed from the collective reflexivity of the ethnographic team, and specifically from the sharing of views and opinions of the content contained within the ethnographic visualisations presented during team-based data sessions. As such, the methods associated with team ethnography described above further demonstrate their methodological and academic value in relation to theory generation (i.e. team-based capital) – whilst simultaneously demonstrating the applied value of these theories within ‘real-world’ settings of healthcare (cf. the authors’ assorted recommendations [ibid] regarding the development of quality improvement projects when involving FST).
A further illustration of methodological value relates more generically to the craft of team ethnography, in which the authors are able to clarify and bolster the standards of this approach from an academic perspective. For example, the iterative development of the team ethnography visual maps was a consequence of a conceptual re-imagining of two established forms of mapping associated with recording relational aspects of assorted quality improvement projects. More specifically, the team ethnography visual maps sought to visualise the relationship between ethnographic observations and the various institutional processes that facilitated or problematised the design and delivery of health-related quality improvement projects. That is, the practice and principles of ethnographic mapping were reimagined to establish a team-focused and team-informed visual tool that captured emic and etic perspectives of the FST (x6) and ethnographers (x3) respectively.
For example, the identification of the aforementioned ethnographic object was made evident through a shared analyses of the emic (‘insider’) perspectives of ‘industry’ (here, the various work conducted by the frontline staff in the study) that were recorded on the maps as a result of the ethnographer observing such activity over a period of time. This included assorted visualisations of positive/negative workflow, assorted ‘bottlenecks’ in the system and issues relating to staff/resources that were the result of institutional level practice (i.e. within the NHS). The inclusion of an ‘ethnographic gaze’ upon these maps, reflecting the etic (‘outsider’) perspective of the three ethnographers, complemented this view. As such, ethnographic observations of relationships (including activities, events) between frontline colleagues, their patients and impact of ‘institutional culture’ were included in the maps as part of the conceptual re-imagining of ethnographic fieldwork. It was, in part, the synthesis of these two perspectives in visual form by the three ethnographers that led to the identification and confirmation of a shared ethnographic object across all six case study sites.
Finally, and perhaps most relevant to the readers of Ethnography’s Kitchen, the methodological innovation associated with team ethnography visual maps and team ethnography data sessions further bolsters the academic craft of team ethnography. Although the methods outlined in this article may provide an introductory practical guide to conducting team ethnography, they also reflect Gubrium and Holstein’s (2014) more abstract concept of ‘analytical inspiration’. Analytical inspiration concerns the way in which immersion in ethnographic fieldwork can result in the re-imagining and re-contextualisation of key research questions to produce empirically centred understandings of social phenomena. In addition, Gubrium and Holstein contend that analytical inspiration ‘not only provides insight … but also provides a roadmap for how to move along in the research’ (2014, 37), adding that ‘ethnography’ need not be bound by procedural roles associated with particular methods or preconceived notions about data generation and related analyses. Instead, they contend, analytical inspiration may emerge from more fluid, flexible and reiterative processes that become embedded within fieldwork and data analyses. For example, in Gubrium and Holstein’s ethnographic account of courtroom observations, they emphasise the way in which a shift from asking ‘what/why questions’ towards ‘how questions’ resulted in a deeper understanding of how court proceedings were socially situated and interactionally-organised. Similar contextual shifts occurred during this study following the design and reflexive interrogation of team ethnography visual maps. For example, the prioritisation of noting the dialectal relationships of the six FST with the relevant institutional setting (six NHS Trusts) as a ‘whole’ (as opposed to viewing each FST separately), coupled with the ethnographers’ collective observations of intra-group relationships within each FST, influenced ‘analytical inspiration’ in the form of reflexive, reiterative discussions within team ethnography data sessions. Indeed, and in conclusion, based upon these experiences of conducting team ethnography, the authors are able to fully concur with Gubrium and Holstein’s view that such ‘analytic inspiration is a way of seeing across the board. It brings into view what methods of procedure cannot do on their own’ (ibid).
Footnotes
Acknowledgements
The authors thank the various reviewers who provided comments and feedback on earlier drafts of this article.
Declaration of Conflicting Interests
The author(s) declared no potential conflicts of interest with respect to the research, authorship, and/or publication of this article.
Funding
The author(s) disclosed receipt of the following financial support for the research, authorship, and/or publication of this article: The research described in this article was funded by the NIHR Health Services and Delivery Research Programme.
Disclaimer
All authors were employed by the Nuffield Department of Primary Care Health Sciences at the University of Oxford at the time of undertaking the research. The views expressed are those of the authors and do not necessarily reflect the views and opinions of the authors’ (past or present) institutions or funding organisations. The research described in this article was funded by the NIHR Health Services and Delivery Research Programme 14/156/06.
Notes
Author Biographies
During the period of the research
Scholarship for