
Abstract
The sensitivity of fracture toughness to the cure path of a high-performance hot infusion epoxy resin (EP2410) is assessed in this study through single-edge notch bend testing of neat resin specimens. The specimens were prepared using a two-stage semi-curing process. In the initial stage, the partial degree of cure and the semi-cure temperature were varied. In the second stage, samples were heated to 180 °C for a secondary post-cure. These samples were compared to two baseline samples produced using the manufacturer's recommended cure cycle of 180 °C, and a modified isothermal cure at a lower cure temperature of 140 °C. The results show that the semi-curing path has no statistically significant influence on the mode I fracture toughness of the material studied here. Sample similarity was confirmed through SEM examination of the fracture surface, which showed minimal variation in surface topography. These findings open new possibilities to use this type of material for novel manufacturing processes involving semi-curing steps.
Introduction
The cure path of a fibre-reinforced thermoset refers to the thermal history it experiences during the curing process. As the thermoset cross-links, it transforms from a viscous liquid to an elastic solid through an irreversible and complex chemical process. 1 In the composites supply chain, material suppliers deliver thermosetting materials to end users, either as rolls of pre-impregnated fibres, known as pre-preg, or as liquid resins. These materials come accompanied by a data sheet that outlines the manufacturer's recommended cure cycles (MRCCs). These MRCCs are adhered to in production in order to ensure manufacturers attain minimum material properties guaranteed by the material supplier. This is especially important in the conservative aerospace sector, 2 as thermosets can have cure-dependent mechanical properties, 3 and materials certified for flight must consistently meet their as-designed performance allowable. 4
Several different mechanisms can lead to cure path dependencies arising within thermosetting resin systems. The cure profiles used in thick parts can lead to cure gradients and polymer degradation, as a result of thermal overshoots.5–12 Similarly, cure profiles can affect the dispersion, morphology, and phase-separation of particles in the toughened epoxy system, which in turn affects the mechanical properties of the material.13–20 Additionally, deviations from the MRCC can have a significant impact on the microstructural formation and cross-link density of the material, and similarly affect the development of material mechanical properties.21–23 In one such example, Odagiri et al. 22 have shown, in detail, how even for a basic bi-functional epoxy diglycidyl ether bisphenol A (DEGBA), cured with a curing accelerant and latent curing agent, the cure temperature will greatly affect how the microstructure forms. As the cure dwell temperature increased, the glass transition temperature decreased while Young's Modulus increased, indicating that the crosslinked structure is a function of cure temperature. 22
While many studies have considered commercial or multi-epoxy systems, not all material properties will be inherently cure path dependent, and this depends on the chemical formulation of the resin mixture. For example, Pramanik et al. 24 demonstrated that two different cure paths could be used to get to the same degree of conversion, and this did not affect the fracture toughness reported for the single-component epoxy mixture used in their work.
From these previous works, it is clear that predicting the mechanical properties of a resin when taking it through various cure paths is no easy task. Many mechanisms can induce cure path dependency, but resin systems are not always cure path sensitive. This fact is important when considering new manufacturing processes that deviate from the MRCCs. In order to enable future manufacturing techniques using pre-existing material systems, it has become apparent that cure path dependencies must be explored.
Previously, White and Kim 11 had suggested a staged curing approach to manufacture thick parts in order to avoid thermal overshoots. Even though they deviated from the MRCC, the laminate level mode I fracture toughness was unaffected after fully curing the pre-preg. More recently Corbett et al. 25 have presented a ‘melding’ technique, which leverages the ability to leave areas of pre-preg laminates uncured/partially cured so that adhesives can be avoided. Similar concepts have been used in liquid composite moulding processes by Moosburger-Will et al., 26 who have infused and partially cured elements of a structure prior to integrating them into secondary dry preform before fully wetting the assembly and co-curing them together in a so-called ‘novel partial cross-linking process’. These novel approaches to manufacturing large structures are clearly of interest in the aerospace sector given patents to leverage these modified curing techniques.27–29
When these modified manufacturing techniques have been explored, only the effects on laminate-level properties have been studied. However, when employing such manufacturing techniques, the neat resin will go through multiple thermal cycles and will have a different thermal history depending on where it is in a structure. As literature has proven, these different cure profiles may result in different mechanical properties, and as a result, it is important to assess if this is the case when employing modified manufacturing techniques, such as semi-curing.
Here semi-curing is defined as taking elements of a larger infused structure, forming and infusing them, and curing them to a pre-determined degree of cure. Once in their semi-cured state, they have the potential to be stored, trimmed, inspected, or treated. The elements can then be integrated into the wider structure prior to its infusion. The entire structure can then be fully infused and fully cured, potentially creating a large integrated part, free from adhesive bond lines and mechanical fasteners. Through semi-curing, semi-finished parts are produced, like with pre-preg. However, semi-curing produces fewer interfaces, requires no debulking, and allows for complex geometries to be achieved far more easily than with pre-preg. This process has the benefits of traditional resin infusion: lower cost, better storage requirements, and better material formability compared to pre-preg. Also, elements can be inspected for quality before integration into a broader structure. 30 Thus, avoiding the potential scrappage of large, expensive, parts.
In this study, we explore the key fracture properties of a high-performance aerospace-grade infusion resin taken through a semi-curing process. Fracture toughness was chosen as the metric of interest in this study since it can influence how the material on one side of an interface formed in a semi-curing process may fail. This is due to one side of the interface potentially having different fracture properties to the other. Thermal analysis is undertaken on the material to produce a cure kinetics and glass transition temperature model and to ascertain the degradation temperature of the material. Using the cure kinetics model, cure schedules are devised that mimic the thermal history of a semi-curing process. Single-edge notch bend (SENB) testing is carried out to assess how the cure schedules affect the critical plane strain fracture toughness (KIC) and strain energy release rate (GIC) of the material system. The results can be used as a starting point to define suitable curing cycles for large integrated structures that exploit the benefits of semi-curing.
Methodology
Materials
A development, single-part, epoxy thermoset resin, PRISMTM EP2410 produced by Solvay, was used at all stages of this study. It is a hot infusion resin with a dry glass transition temperature Tg of roughly 165 °C. The MRCC is for infusion at 120 °C into a composite preform, followed by heating to 180 ± 3 °C and holding at that temperature for 2 h (+30, −0 min). At all stages, a ramp rate of 2 ± 1 °C/min is called for.
Thermal analysis
The thermal characterisation of this material was carried out using a Netzsch 204 F1 Pheonix® differential scanning calorimeter (DSC), Netzsch an STA 449 F3 Jupiter® simultaneous thermal analyser (STA) capable of thermogravimetric analysis (TGA) and DSC, and an Anton Paar MCR 302 rheometer.
Firstly, the STA was employed to determine the degradation temperature of the material to inform the upper-temperature limits used in subsequent DSC experiments. Figure 1 displays the results from the STA experiments which were undertaken in this study. Three runs were carried out in total, two at 10 °C/min and one at 5 °C/min, ramping from 30 °C to 330 °C in a nitrogen atmosphere. From the STA, it is possible to plot both the heat flow and mass loss, showing how the sample reduces in mass while it cures. All future dynamic DSC experiments were capped at a maximum ramp rate of 5 °C/min and 290 °C limiting the mass change to 3% during curing. Using a heating rate of 10 °C/min would result in a 4%–5% mass loss during curing. Using a 5 °C/min ramp rate the exothermic peak ends at roughly 280 °C allowing for the upper limit of the dynamic ramps to be set to 290 °C, as indicated in Figure 1 with the dashed line.
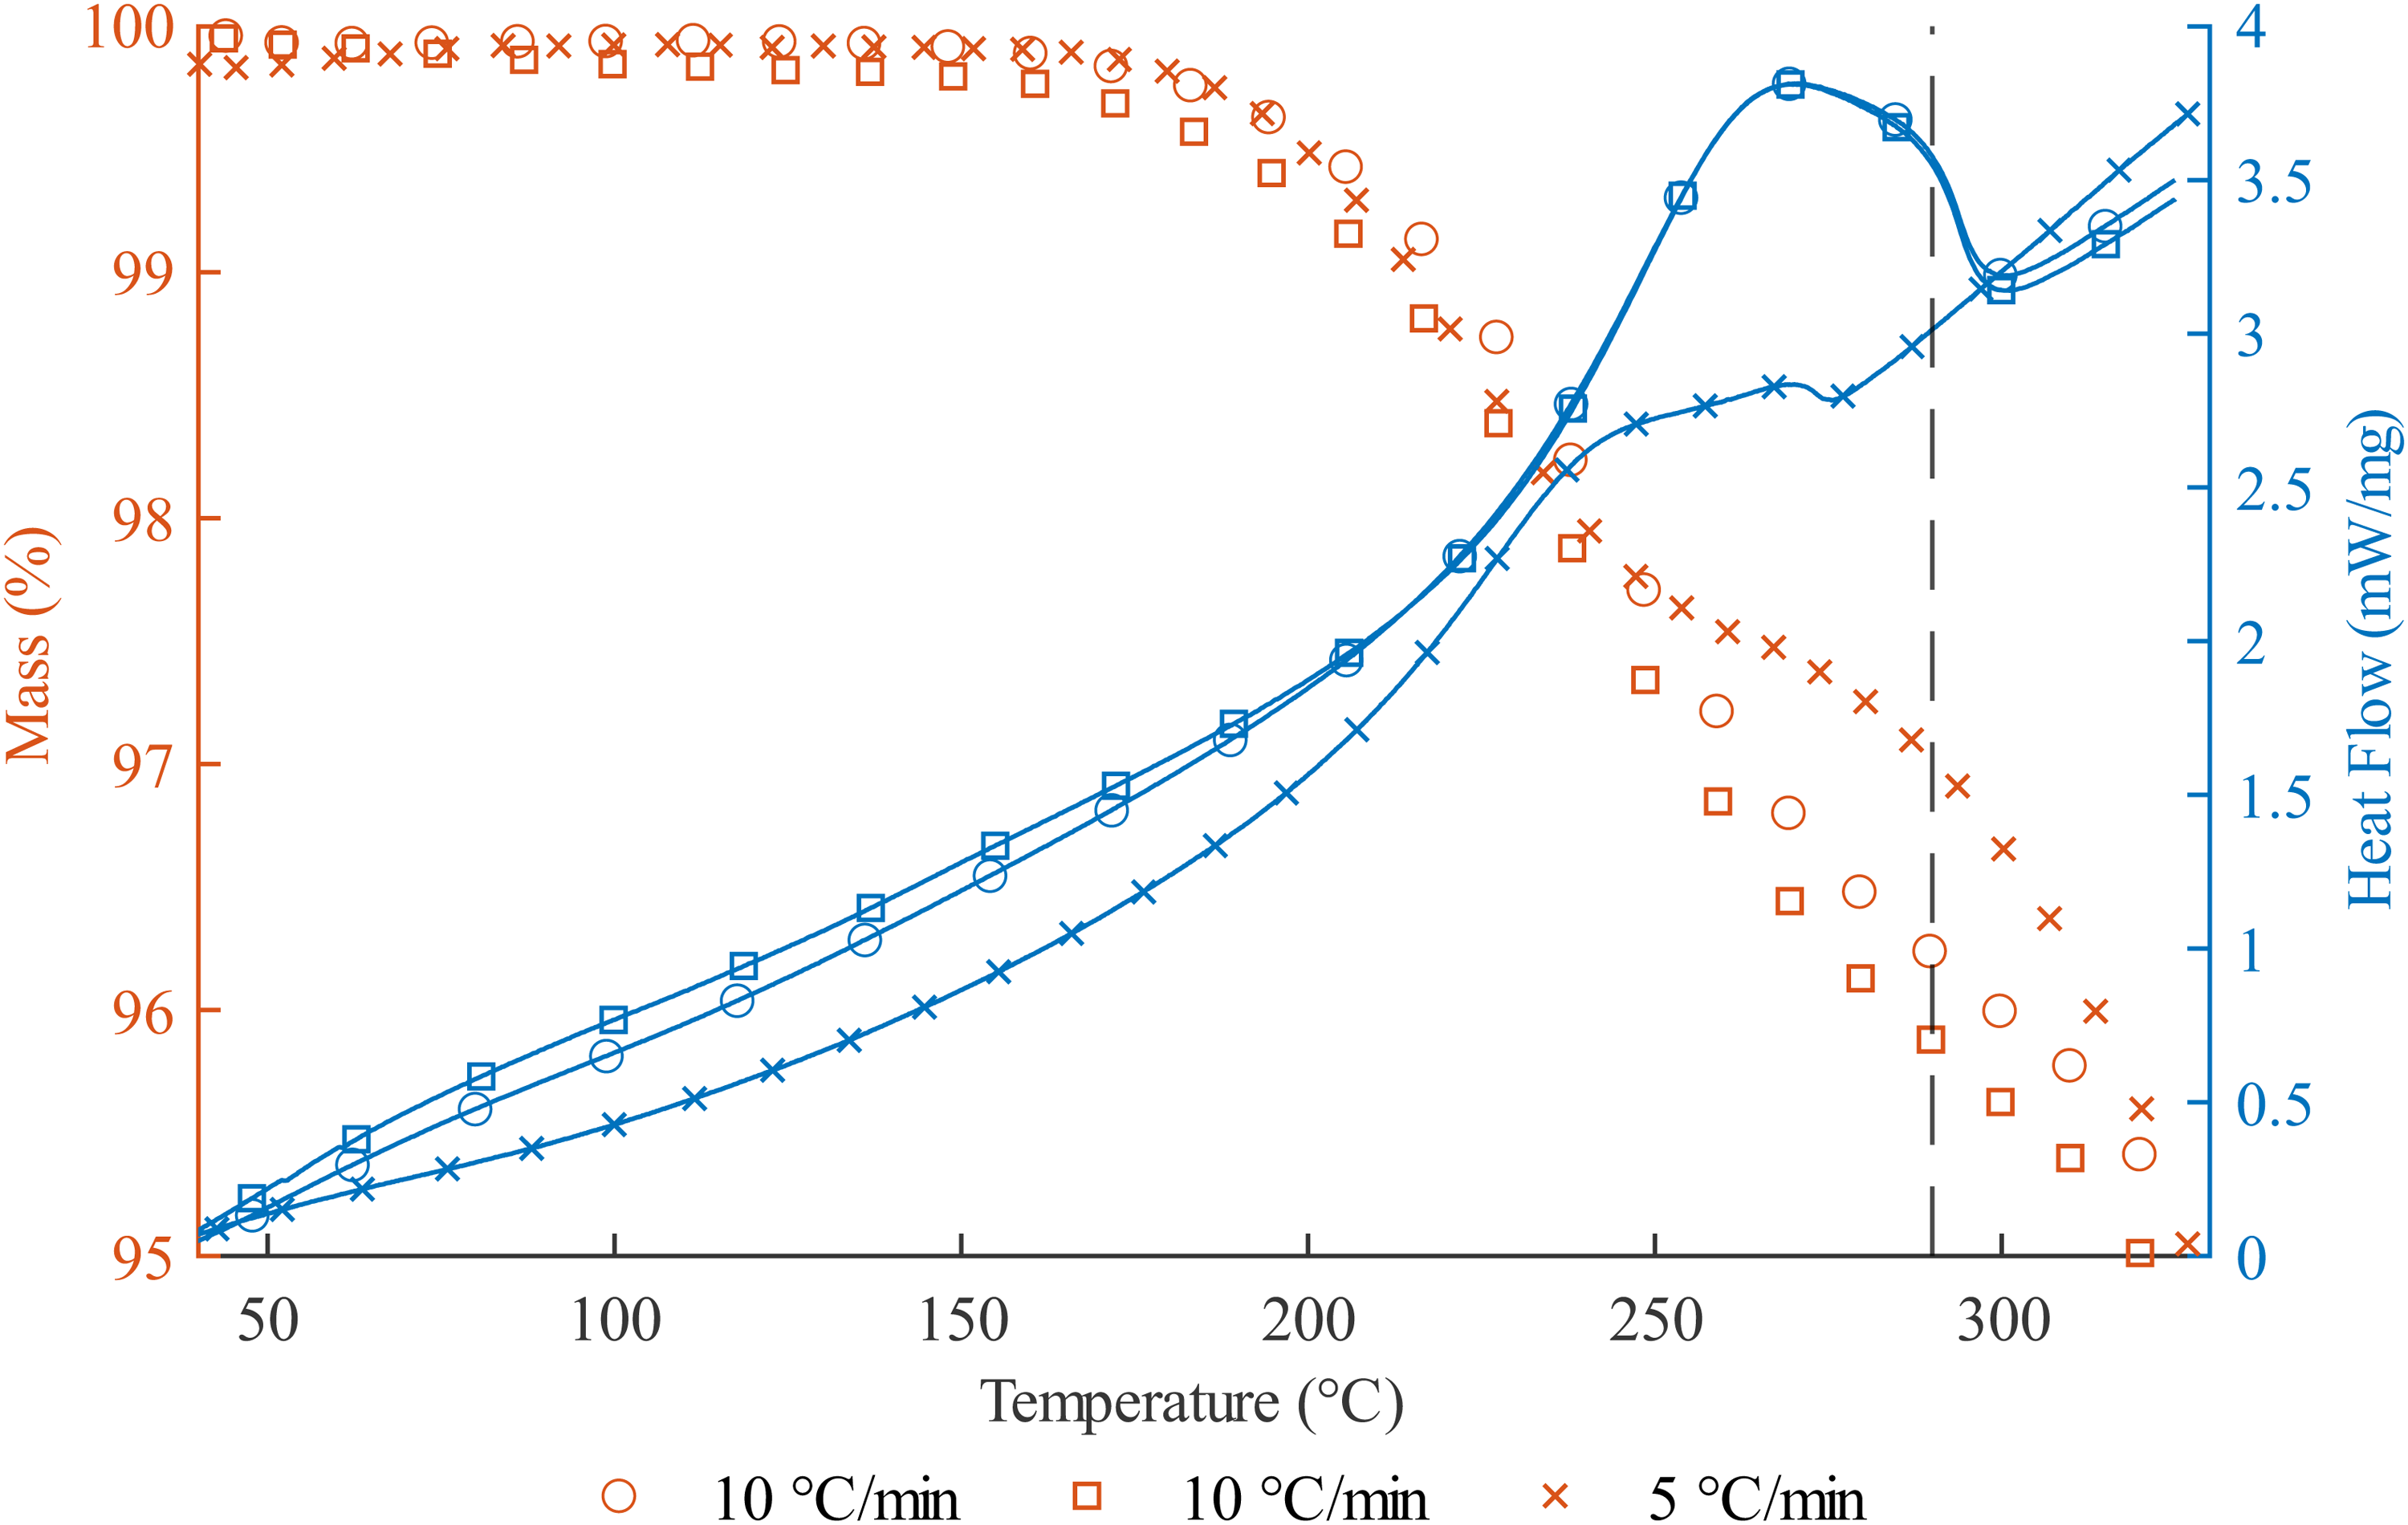
STA results. The upper heating temperature for future DSC experiments is shown by the vertical dashed line.
The initial mass loss in the material is likely a result of moisture being released by the sample. This moisture likely resulted from decanting and freezing at −20 °C. Subsequent mass loss could be attributed to volatiles being released from the material as it cures. 31 Finally, after the end of the exothermic peak, it is likely that the sample begins to char degrade and this would account for any additional mass loss. An increased rate of mass loss is seen around 250 °C when the faster heating rate of 10 °C/min is used. The increased mass loss is likely the result of the polymer network degrading while still curing. The high ramping rate of 10 °C/min results in more energy being added to the curing polymer more quickly than if a lower ramp rate was used, thus the curing polymer reaching its degradation temperature before it is fully cured.
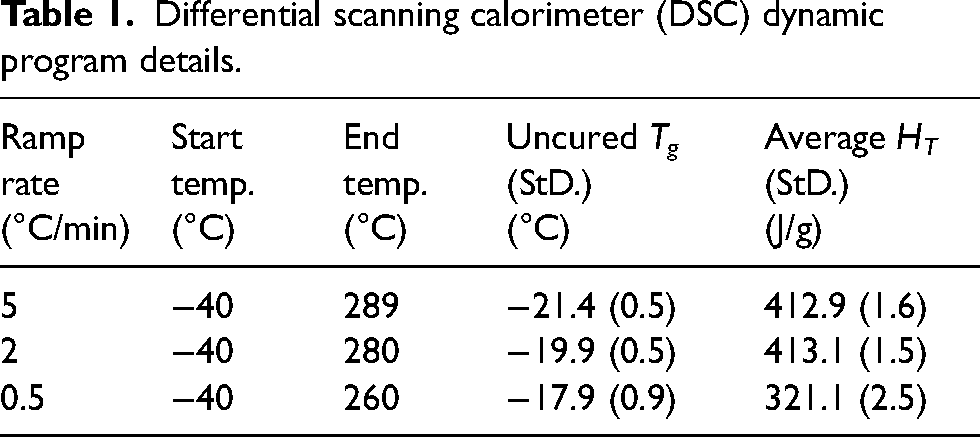
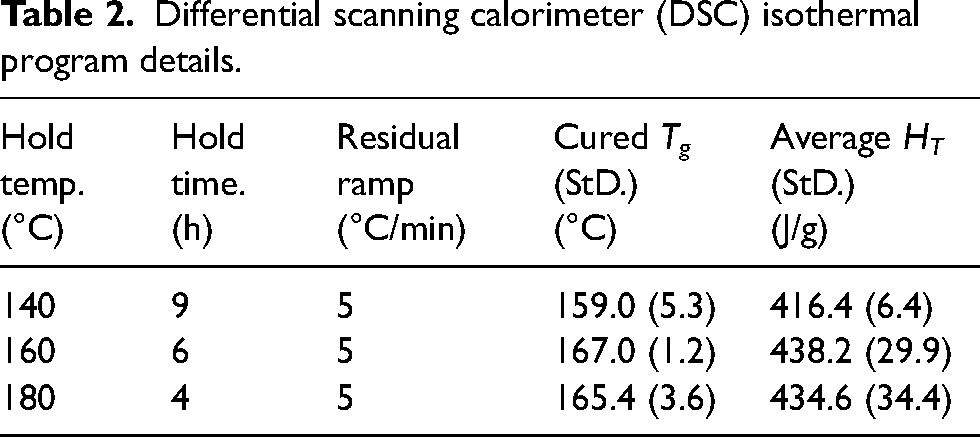
Secondly, dynamic and isothermal DSC experiments were performed to generate data for a cure kinetics analysis. The dynamic experiments were conducted using heating rates of 0.5, 2, and 5 °C/min with temperature ranges outlined in Table 1, while the isothermal scans were performed at 140 °C, 160 °C, and 180 °C. After each isothermal run, the samples were quenched to 0 °C and re-ramped at 5 °C/min to 290 °C, allowing for the capture of the Tg as well as to measure any residual heat flow, indicative of incomplete curing. Details of the dynamic and isothermal programs used in the generation of the cure kinetics model can be found in Tables 1 and 2.
Differential scanning calorimeter (DSC) dynamic program details.
Differential scanning calorimeter (DSC) isothermal program details.
An additional set of isothermal holds were cure-quenched to assess Tg development with degree of cure at temperatures of 140 °C and 180 °C. The 140 °C isothermals were cure-quenched in 50-min intervals from 50 to 400 min. The 180 °C isotherms were cure-quenched in 10-min intervals between 30 and 60 min and 80 and 120 min. To find the fully cured Tg of the material an extended isothermal hold at 180 °C was carried out using a dwell time of 240 min. After each cure-quenched test, the sample was cooled, and a dynamic scan was performed at 5 °C/min from room temperature to 290 °C in order to determine the residual heat in the sample and the cure-quenched Tg of the resin.
All the DSC experiments were temperature-modulated (TM-DSC). The modulation period was 60 s with a temperature variation of ±1 °C. Example TM-DSC data is shown in Figure 2. TM-DSC splits the heat flow into reversible and non-reversible components, allowing for momentarily reversible transitions such as Tg to be measured even when the temperature range they occur in overlaps with the heat released from the non-reversible curing reactions.
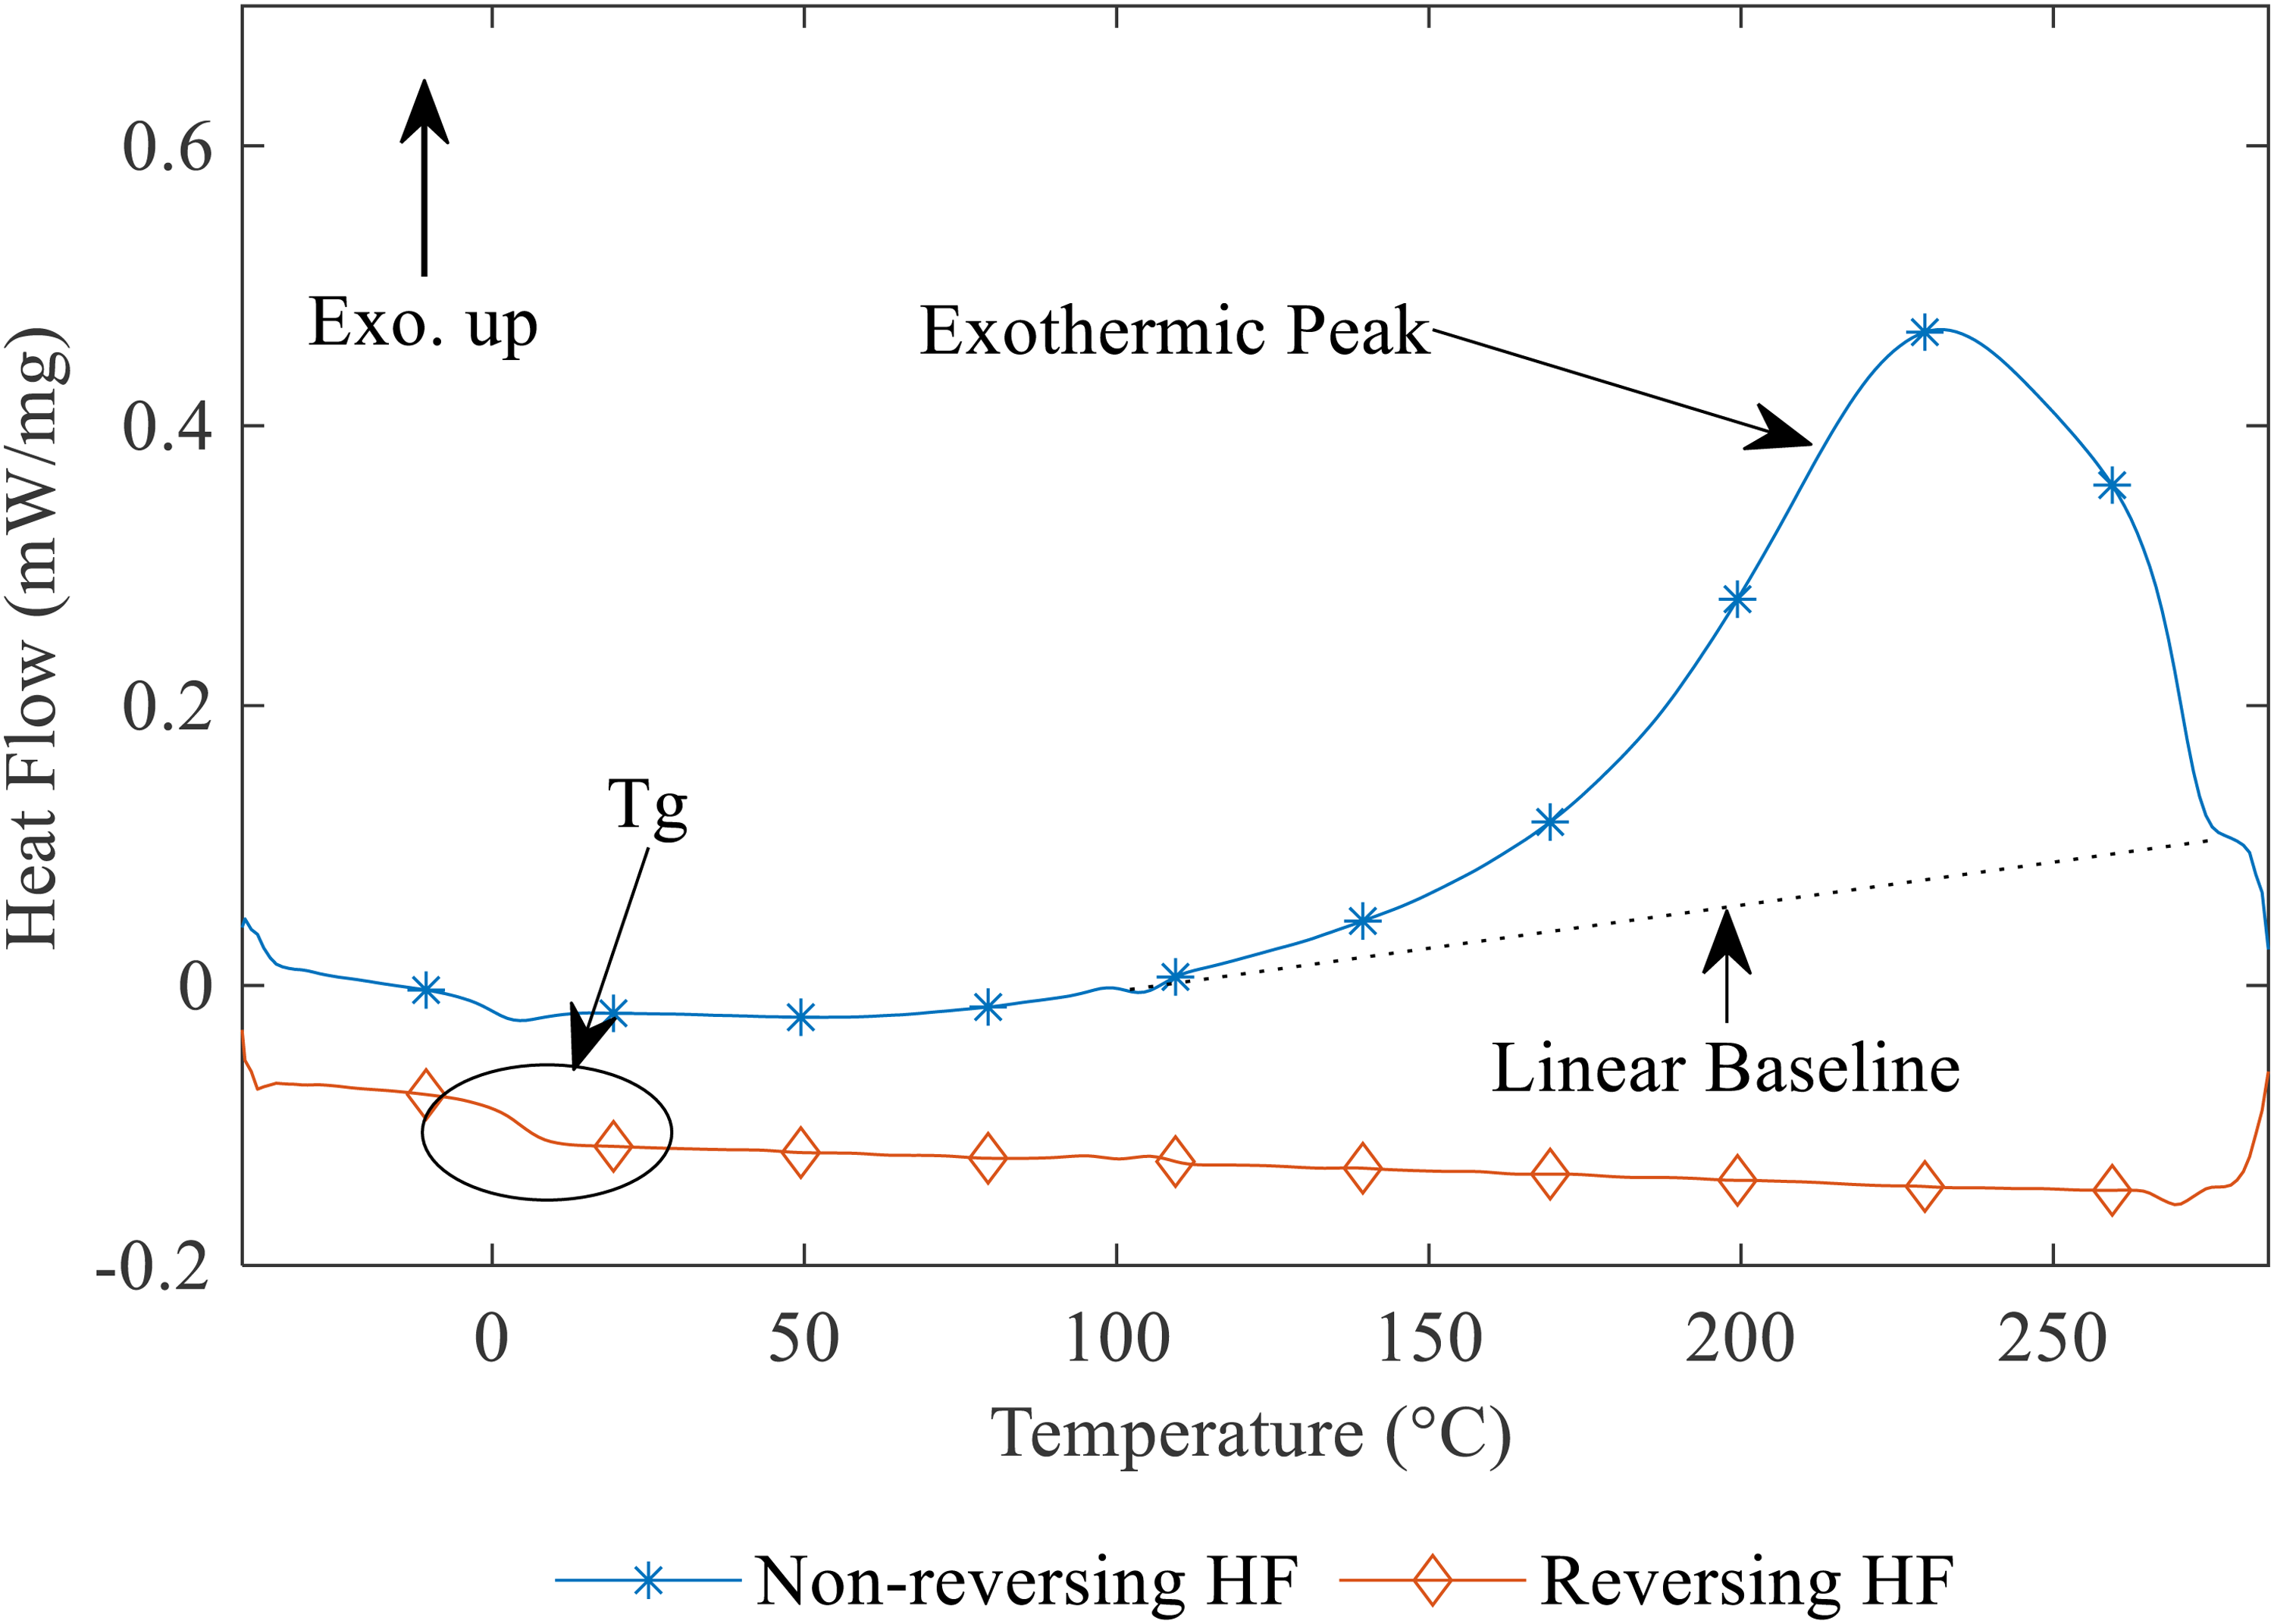
Example differential scanning calorimeter experiments were temperature modulated (TM-DSC) measurements at a constant heating rate of 5 °C/min. The Tg is observed in the reversing heat flow signal, followed by curing in the non-reversible heat flow signal.
Thirdly, to ascertain the gel point of the resin system a set of isothermal rheological experiments were undertaken at isothermal temperatures of 140 °C, 160 °C, and 180 °C. At each temperature, at least two repeats were performed. These experiments were carried out using an Anton Paar MCR 302 rheometer equipped with a Peltier hood to provide a stable temperature with minimised gradients over the entire temperature range. To reach the isothermal hold temperature the samples were ramped from room temperature to the hold temperature at 20 °C/min. A disposable plate-plate geometry with a top plate diameter of 25 mm and an initial experimental gap of 1 mm was used. All the experiments were carried out in oscillation mode with a frequency of 1 Hz and strain amplitude of 1%. The strain amplitude was gradually reduced after the torque increased to 5 nN·m.
SENB sample production
SENB specimens were machined from panels of neat resin cast in a two-part glass and PTFE mould, as shown in Figure 3(A). This was constructed from a 5.5 mm-thick PTFE spacer sandwiched between two vertical glass plates that had been coated in a release agent (Frekote 770-NC). Cut-outs were machined into the PTFE, into which the resin was poured. Prior to curing, the resin was degassed twice, once before transfer into the mould and once after transfer to prevent bubbles from forming in the cured plates. Each casting consisted of neat resin which was cured entirely over the course of one cure cycle producing monolithic castings, which could then be machined.
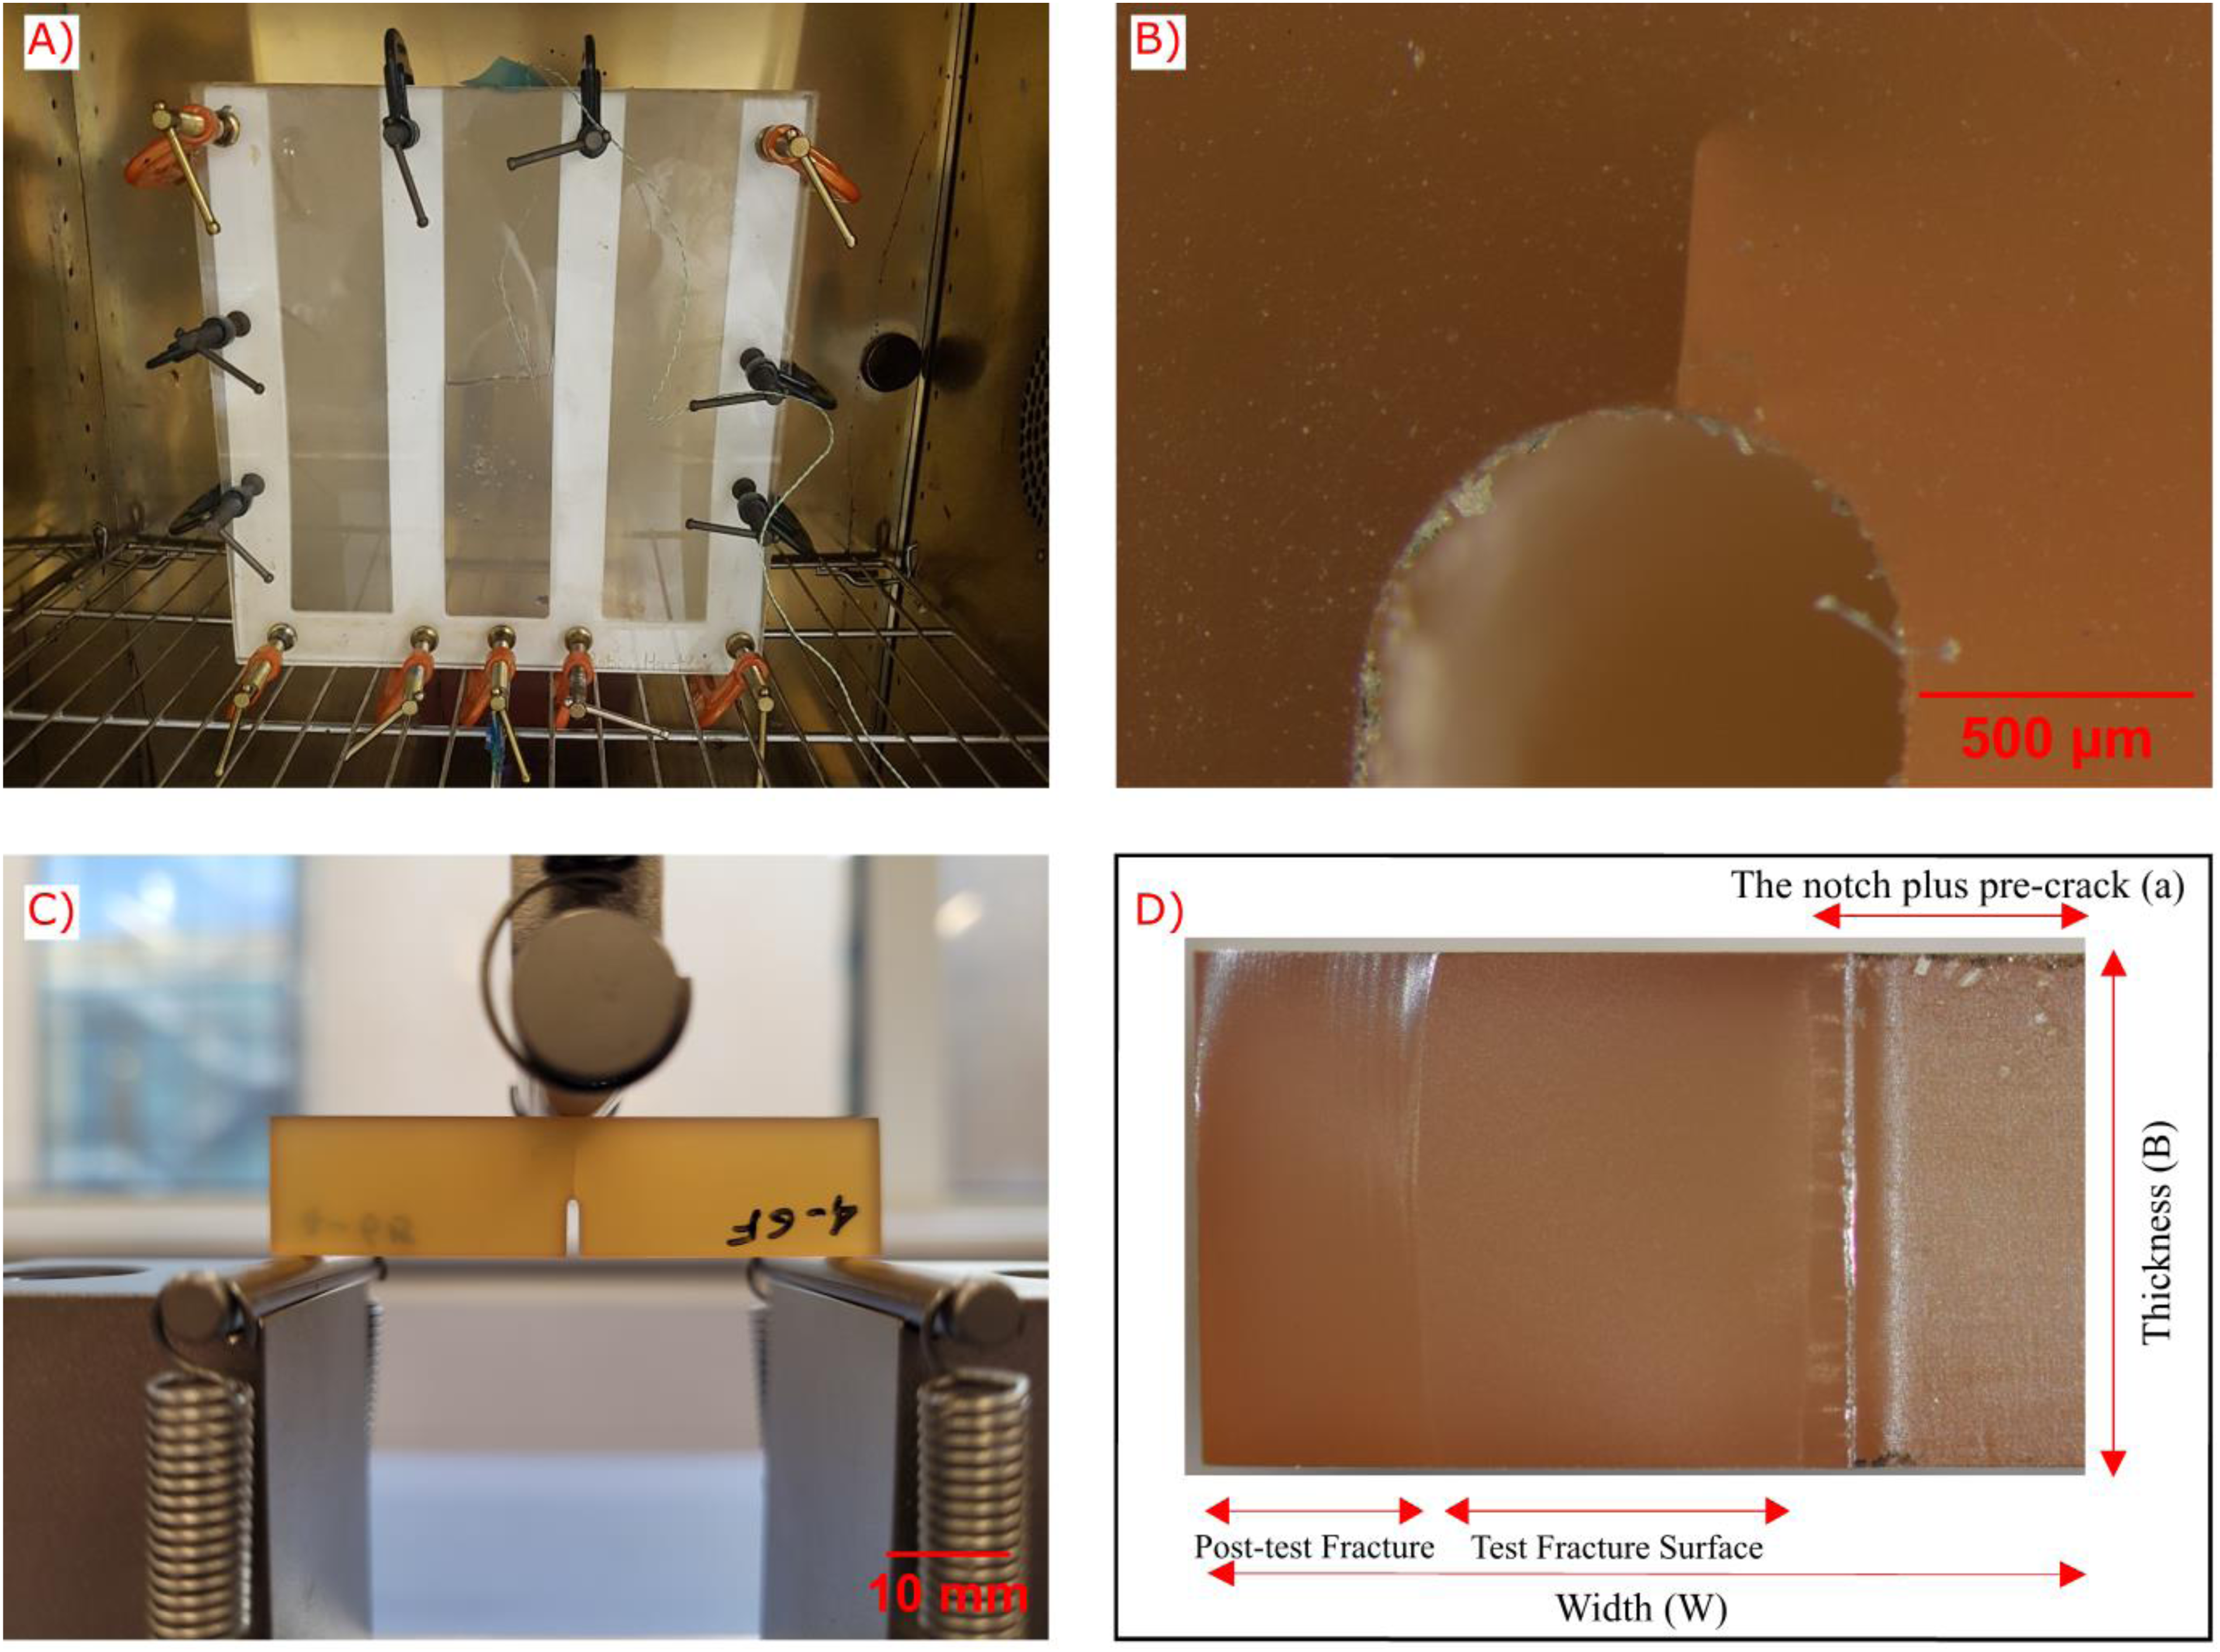
Fracture toughness testing workflow: (A) plate casting, (B) notch and pre-cracking, (C) single edge notch bend (SENB) testing and (D) top-down view of a failed SENB specimen showing the machined notch and pre-crack, along with the fracture surface of the material with the left-most banding being the location of the end of the crack produced during testing.
The six fully cured resin castings were machined into the SENB samples using a CNC router fitted with a 1 mm diameter 4 flute coated carbide end mill bit. The specimens were sized to meet the dimensional requirements outlined in ASTM D5045-14. 32 The standard specifies tight tolerances for the length of the notch + pre-crack (target = H/2 ± 5%), which can be challenging to meet as the length of pre-crack propagation is hard to control. The notch was milled to end 0.5 mm short of the specimen's half height (H/2). It was found that sharp pre-cracks (≈ 0.5 mm) could be generated with reasonable consistency (see Figure 3(B)) using an in-house drop weight rig developed previously. 33 The drop weight rig operates by placing a fresh, unused, razor blade into the machined notch and dropping a weight from a known height. The force of the drop weight on the razor then transfers to the specimen, producing a sharp, straight crack. The crack length was measured after testing using a microscope and DSLR images.
Table 3 details the six different cure cycles used. These can be split into two groups:
Full cured (FC): Castings cured in a single ramp-hold-cool cycle either at 180 °C or 140 °C. The 180 °C cycle represents the MRCC and the 140 °C cycle is used to explore the effect of the lower curing temperature on fracture toughness. Semi-cured (SC): Castings cured in a two-stage process comprising two sequential ramp-hold-cool cycles. In stage 1, the isothermal hold times were tailored according to the cure kinetics model to target partial degrees of cure of either 0.3 or 0.7, achieved using two isothermal temperatures (180 °C and 140 °C). In the second stage, the castings were ramped to 180 °C and held for 165 min, 45 min longer than the MRCC. The additional time is added to ensure a high ultimate degree of cure.
Single edge notch bend (SENB) specimen cure details.
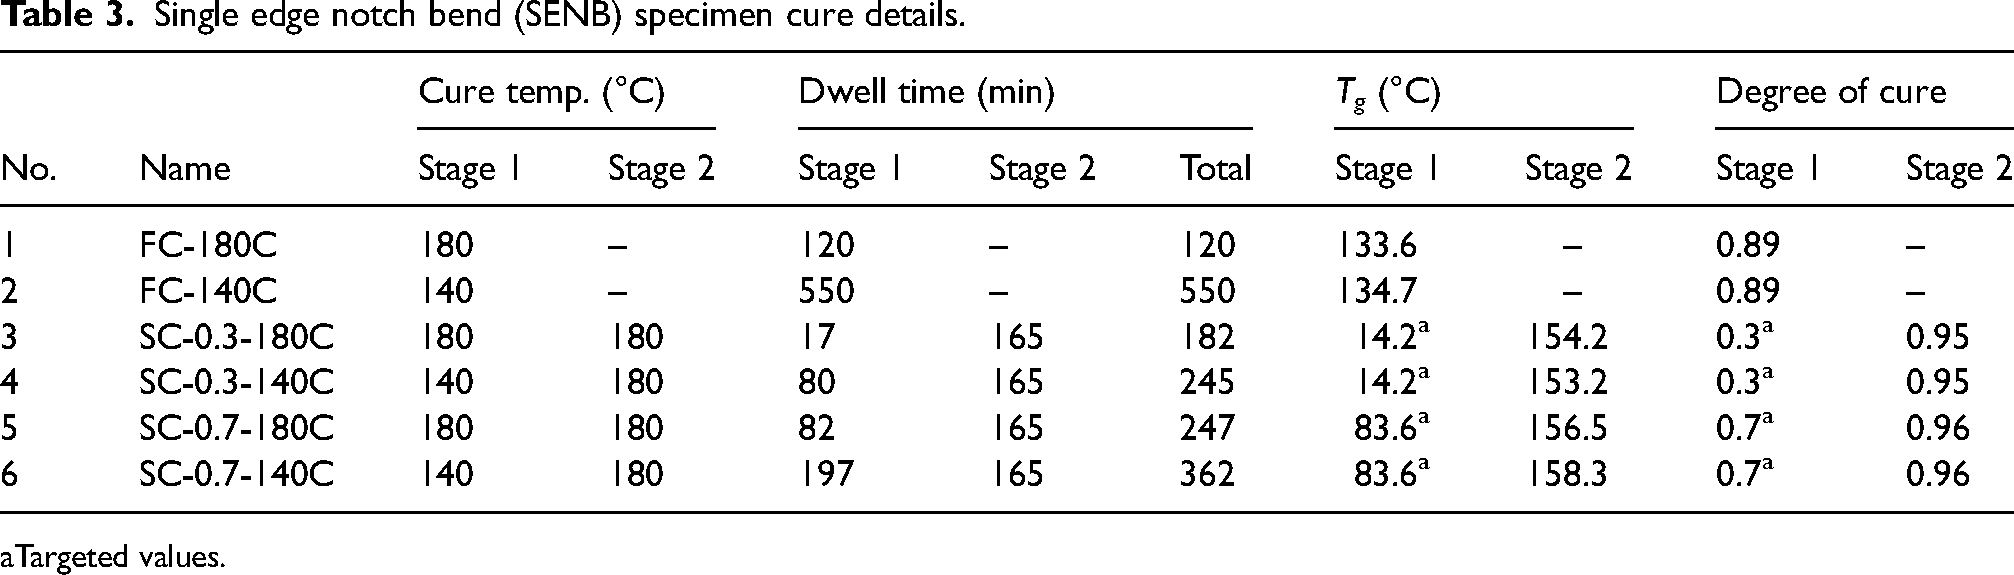
Targeted values.
The partial degrees of cure of 0.3 and 0.7 were chosen for the SC castings as they represented degrees of semi-cure at opposing ends of a polymer cure path. With 0.3 being much closer to uncured than FC and 0.7 being much closer to cured than uncured. At a degree of cure (α) of 0.3, the polymer will have a Tg of 14 °C meaning it will be nearing a glassy solid state at room temperature. Laminate manufacturing trials with this material system have found that an initial α of 0.3 is rigid enough to handle, yet tacky and it still retains a large portion of its chemical reactivity and tack for bonding to other components. At a degree of cure of 0.7 the polymer has a Tg of 82 °C, well above room temperature, and is close to, but not fully gelled. At an α of 0.7, the residual reactivity is less, but this may be beneficial to reduce the risk of exotherm when bonding thick sub-assemblies together or for operations between curing stages (e.g. trimming or inspection). A degree of cure of 0.7 is also close to the material gel point, which previous studies have shown to be an inflection point for the retention of interfacial properties between initially partially cured sub-assemblies and freshly infused structures. 34
The α and Tg evolution over the course of representative FC and SC cure schedules are shown in Figure 4. The cure kinetics and Tg are calculated using the models (described later) and the embedded thermocouple data from two of the castings. The thermal history shown for the staged sample is that of Sample No. 3, SC-0.3-140 °C, while the traditional is Sample No. 1, FC-180 °C.
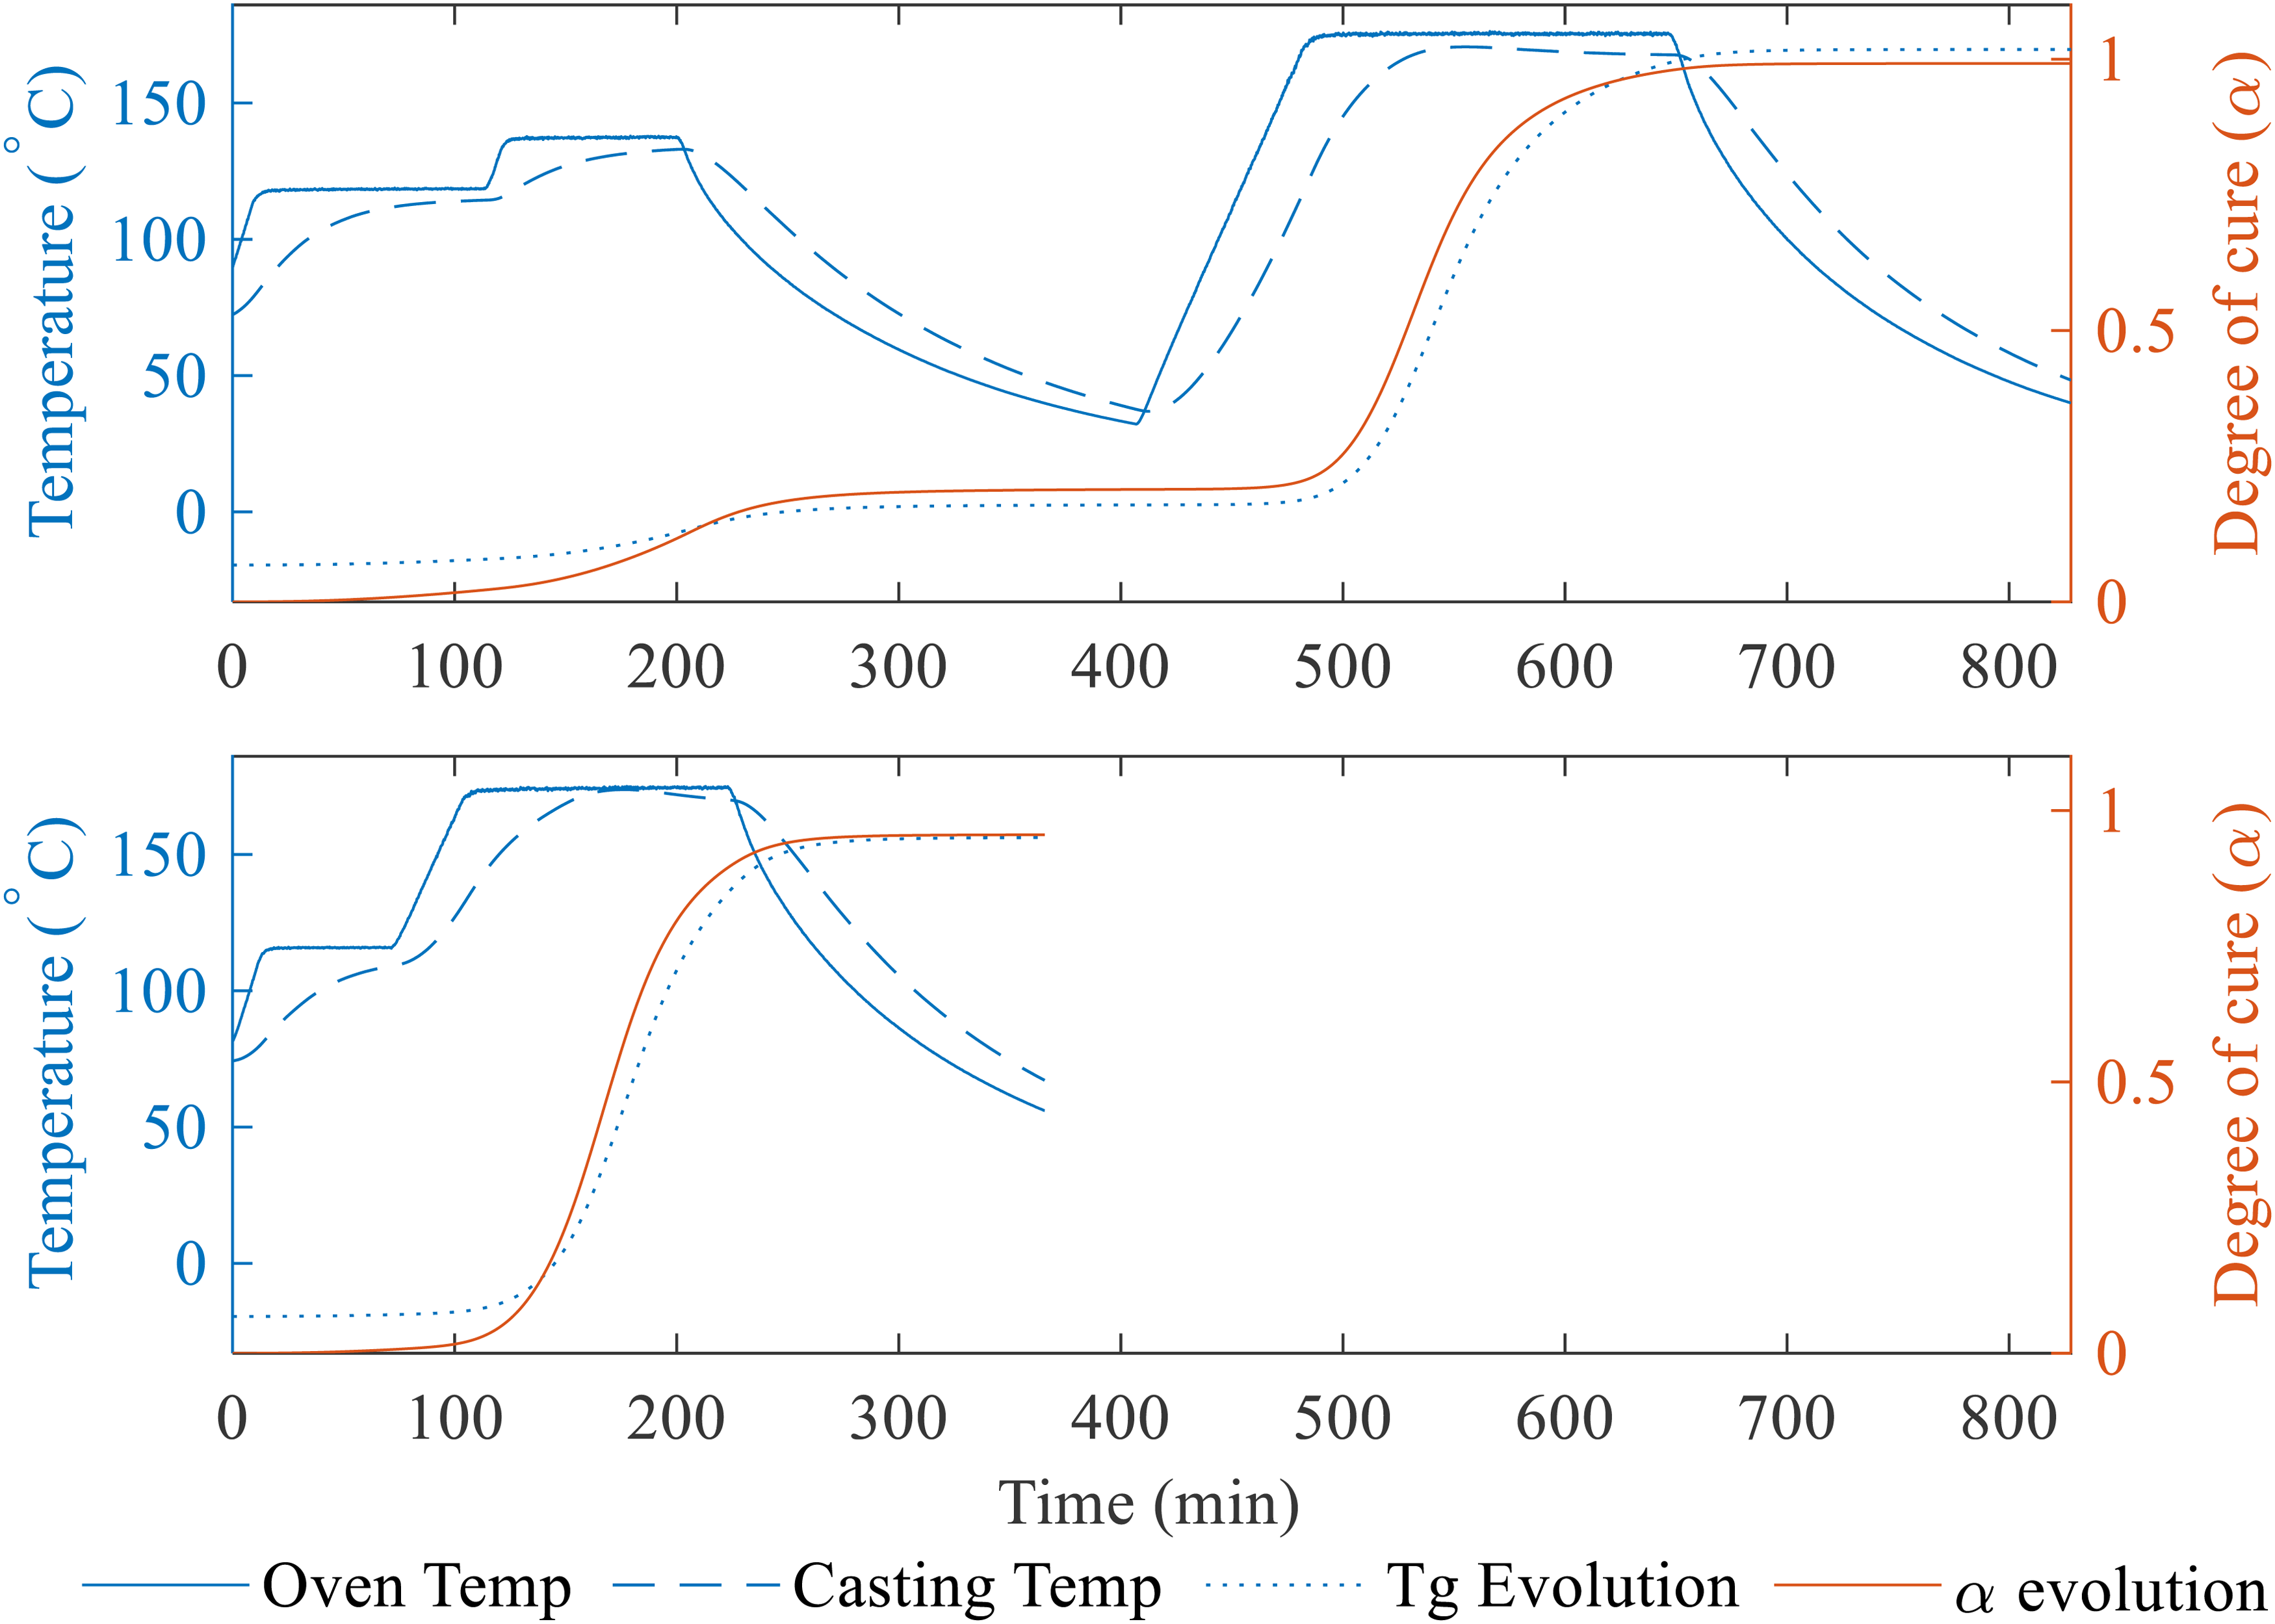
Evolution of α and Tg for a cure schedule employing semi-curing (top) and a traditional ramp-hold-cool cure cycle (bottom).
Prior to ramping to the primary dwell temperature, all castings were held at 120 °C for 1 h. This was done to mimic the infusion time and temperature needed when infusing a large part. In all cases, the ramp rates of 2 °C/min were used. The effect of the hold at 120 °C is assumed to be minimal given the extreme length of time required to fully cure this material at this cure temperature (>14 h). Also, heating the material to 120 °C allows for the material viscosity to drop significantly so that the mould, which stands upright in the oven, is fully filled with the resin, which flows into the mould due to the effects of gravity.
Mode I fracture testing
Fracture toughness testing of the SENB specimens was undertaken in accordance with ASTM D5045-14 in a 3-point bend setup, as shown in Figure 3(C). 32 The tests were carried out using a Shimadzu AGS-X electromechanical universal testing machine equipped with a 500 N load cell, operated in displacement control at a rate of 10 mm/min. Displacement values were taken directly from the machine stroke. Test compliance was accounted for using the method outlined in the D5045-14 standard.
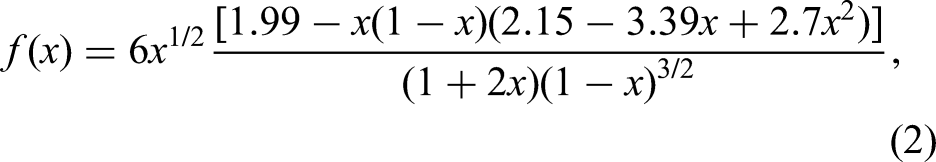
The following equation was used to calculate the critical stress intensity factor 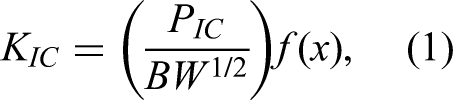
To calculate the plane strain energy release rate, GIC, from the SENB tests, equation (3) was used, where a is the crack length (which includes the milled notch plus the pre-crack), U is the energy released during the test and corrected to account for machine compliance and 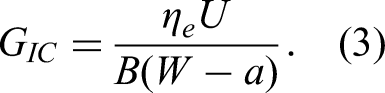
A minimum of three samples were successfully tested for each sample group. While a minimum of six were machined from each sample group, if the pre-crack was outside the required crack length, those samples were marked as invalid. All mechanical test data can be found in the accompanying supplementary data pack.
Fracture surface imaging
The failed SENB specimens were imaged using a Hitachi TM303Plus table-top SEM, a Zeiss Axio Zoom.V16 microscope, and a standard Nikon DSLR camera. The SEM was used to assess for potential differences in the failure mechanisms of the samples in different sample groups at the micron level. Prior to SEM imaging, a thin layer of silver coating was added to the fracture surface using a sputter coater. The microscope and DSLR images were used to identify the area of the un-failed region of the specimens and the length of the notch and pre-crack, with both clearly visible in Figure 3(D).
Results and discussion
Cure kinetics
The total exothermic heat of reaction (HT) for the resin was found using the non-reversing signal from Figure 2. A linear baseline was drawn between the start and end of the exothermic peak to calculate the total exothermic heat of the reaction. To find the heat released during the isothermal hold, a horizontal baseline was drawn from the point where the non-reversing heat flow signal flat lines.
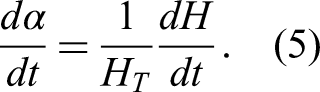
A phenomenological model was created to describe the curing reaction of the resin. This starts by examining the extent to which the resin is chemically reacted and is given a degree of cure, α, a value between 0 and 1; where 0 and 1 correspond to the uncured and final cured states, respectively. The degree of cure is defined as the ratio between the total heat released by the resin and the heat released from the resin at time t in the process, as measured by the DSC: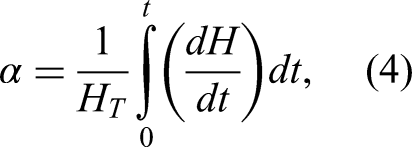
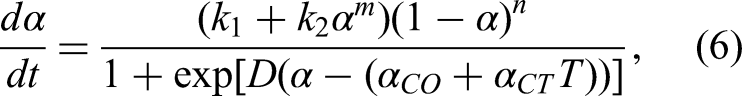
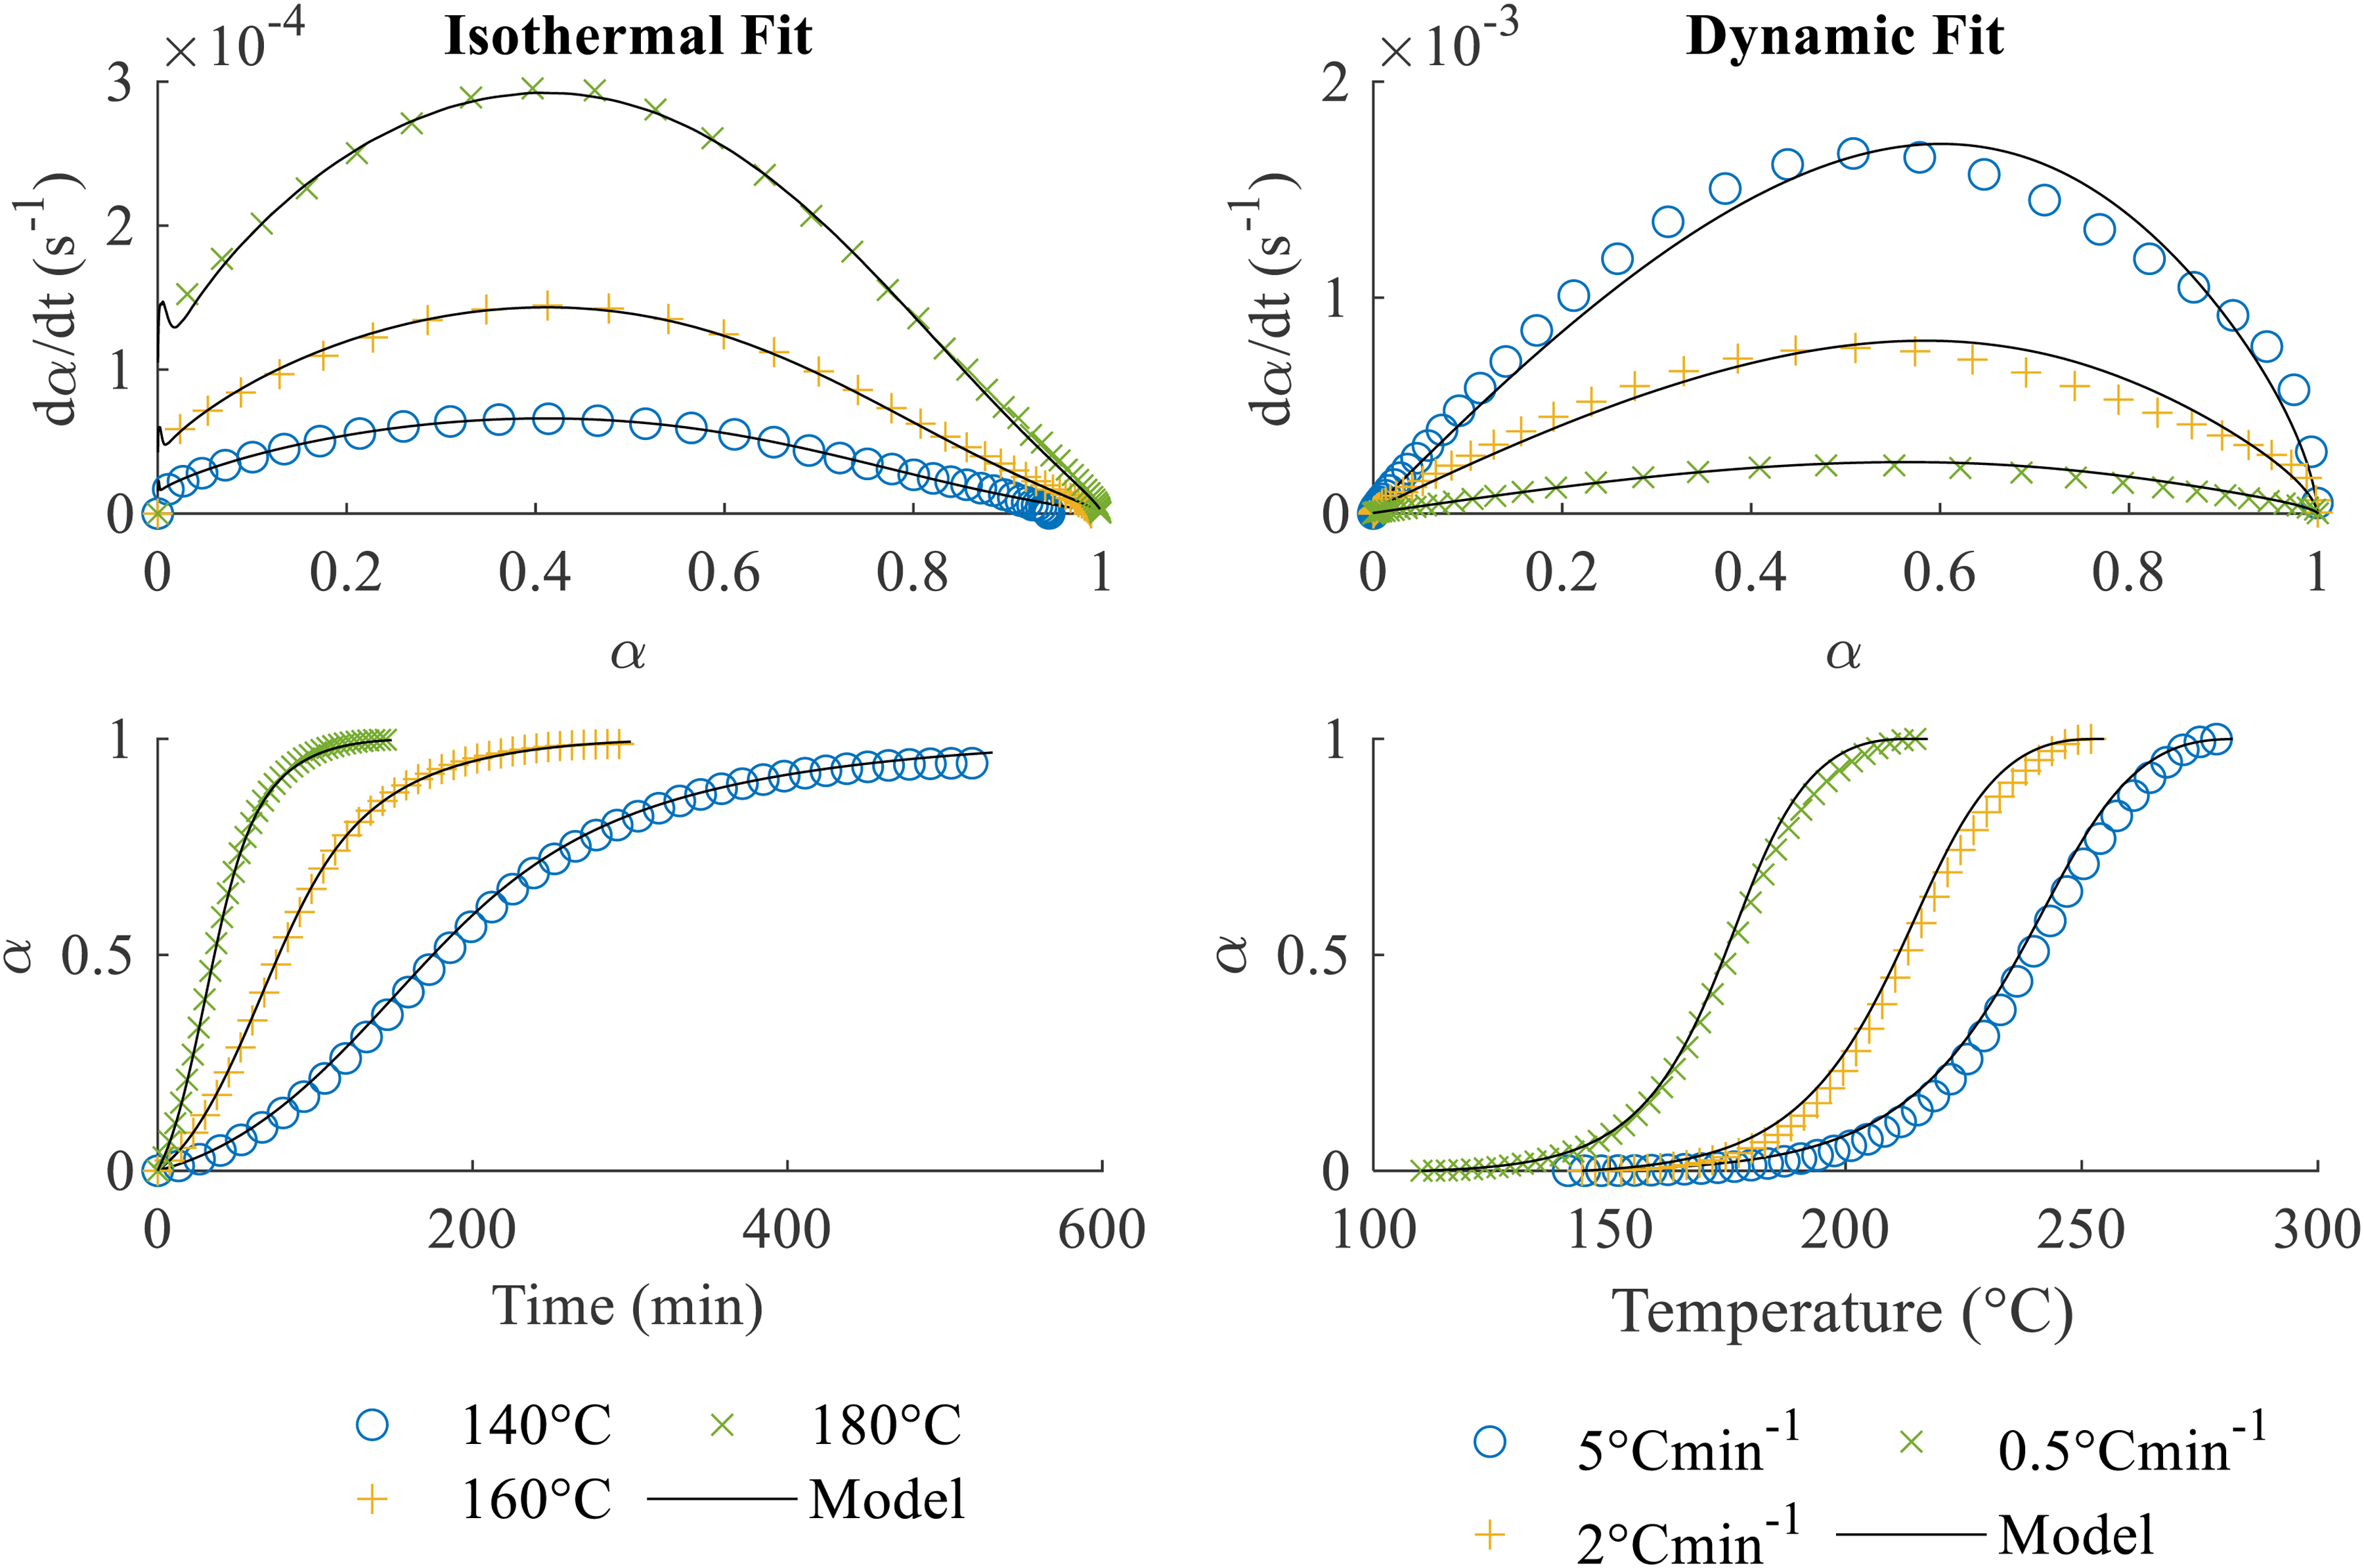
The fitting parameters for equations (6) and (7),
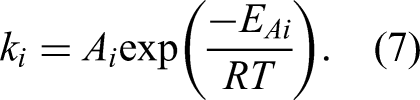
Cure kinetics model plotted versus experimental data for both isothermal and dynamic experiments.
Cure kinetics fitting parameters.
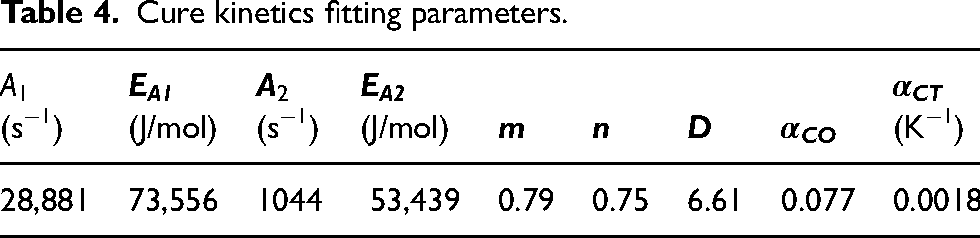
Figure 5 compares the experimental isothermal and dynamic data to predictions derived from equations (6) and (7). For clarity, representative data from each isothermal hold temperature and each dynamic ramp rate is compared for both cure rate and degree of cure evolution. The full data is available in the Supplemental Material provided. The use of the obtained fitting parameters within equation (6) can be seen to accurately predict the cure evolution. In light of this agreement, the cure kinetics model was used to confidently define the cure schedules to produce the SENB samples to predetermined degrees of cure.
The total heat of the reaction during the dynamic DSC testing at 0.5 °C/min was notably lower than the other dynamic and isothermal testing conditions (Tables 1 and 2). Even though the heat release is lower, the degree of cure still reaches a value of 1 because no further cross-linking is possible. It is likely that the network formation is different, resulting in a lower cross-link density when the material is heated at 0.5 °C/min, therefore the minimum heating rate during SENB manufacturing was set to 2 °C/min, as described in the SENB sample production. This is the case as the curing temperature during the dynamic experiments was always above the ultimate achievable Tg of the resin system, with the dynamic experiments running to 310 °C and the ultimate Tg of the material being 173 °C, as shown in the following section.
Glass transition temperature
The glass transition temperature, Tg, of the resin, was found by examining the reversing component of the dynamic scan TM-DSC signal (see Figure 2). Here the Tg of the resin is seen as the second-order transition in the reversible heat flow signal. The degree of cure corresponding to the Tg was found by measuring the residual heat from the non-reversing heat flow signal.
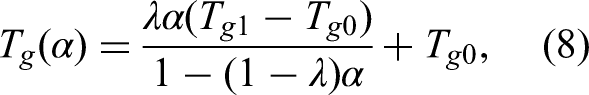
The relationship between the degree of cure and Tg has been modelled using the DiBenedetto equation
36
:
DiBenedetto fitting parameters.
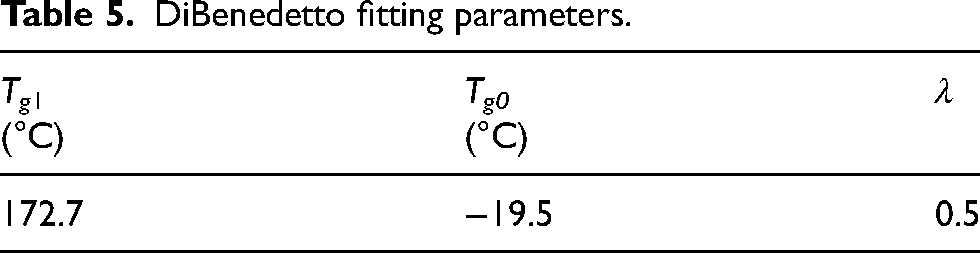
Figure 6 displays the fit between the experimental Tg data and predicted values from equation (8). The model appears to accurately describe the Tg progression for the 140 °C and 180 °C temperature tests.
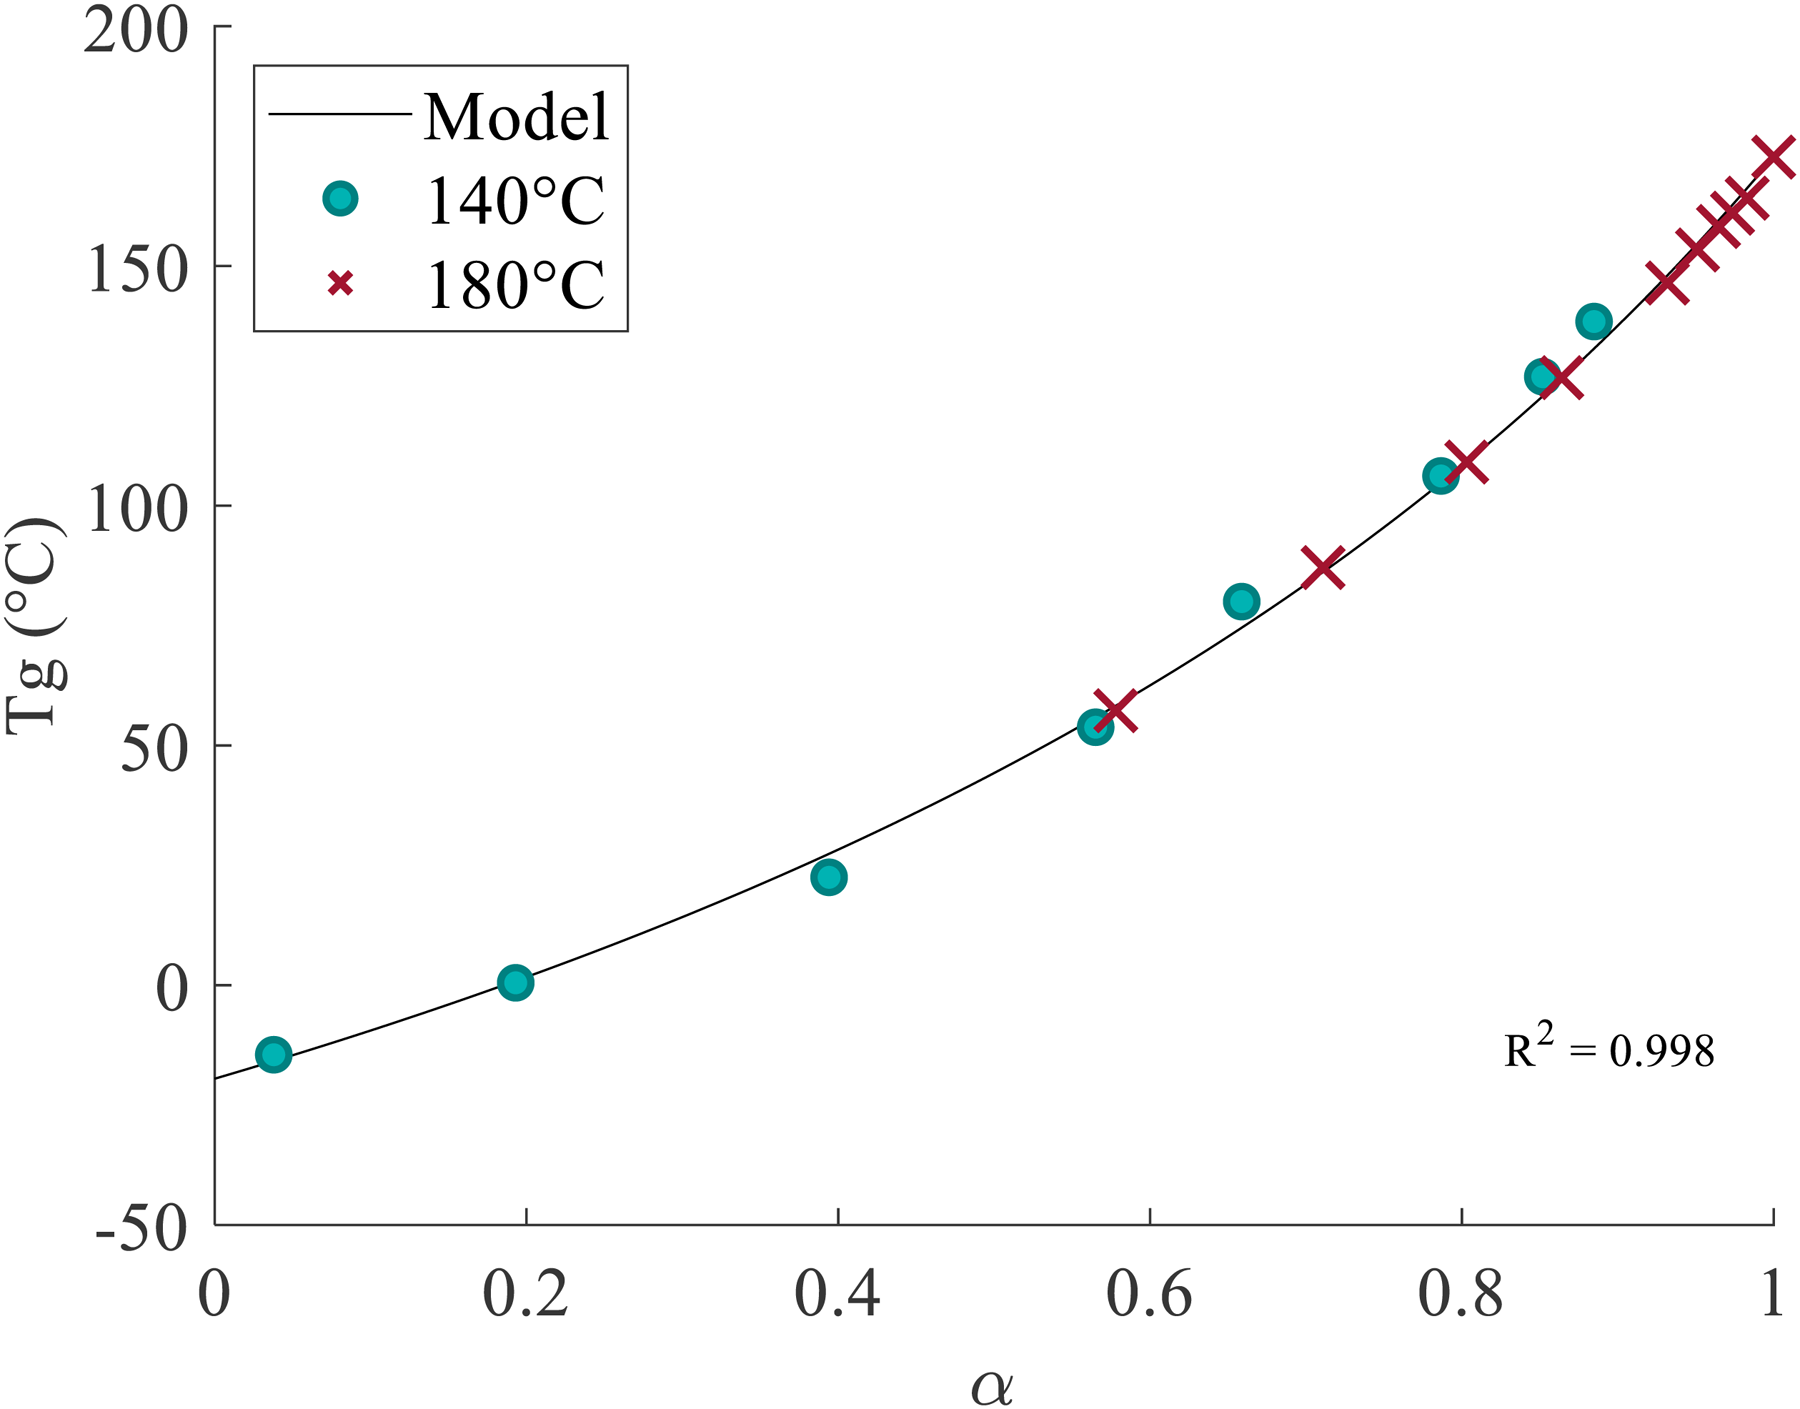
Tg model comparison to experimental data for both 140 °C and 180 °C isothermal experiments.
Rheology
Figure 7 shows the results of the rheology in terms of complex viscosity. The gel point of the material was found by examining the storage and loss moduli of the material. In this study, the gel point was defined as the point where the storage modulus surpasses and crosses the loss modulus (i.e. where tanδ = 1). The degree of cure at this point was found using the cure kinetics model outlined in the ‘Cure kinetics’ section, along with the time and temperature history recorded by the rheometer. On each curve the gel point has been marked with a bold ‘×’ and the degree of cure that corresponds to the gel point is reported.
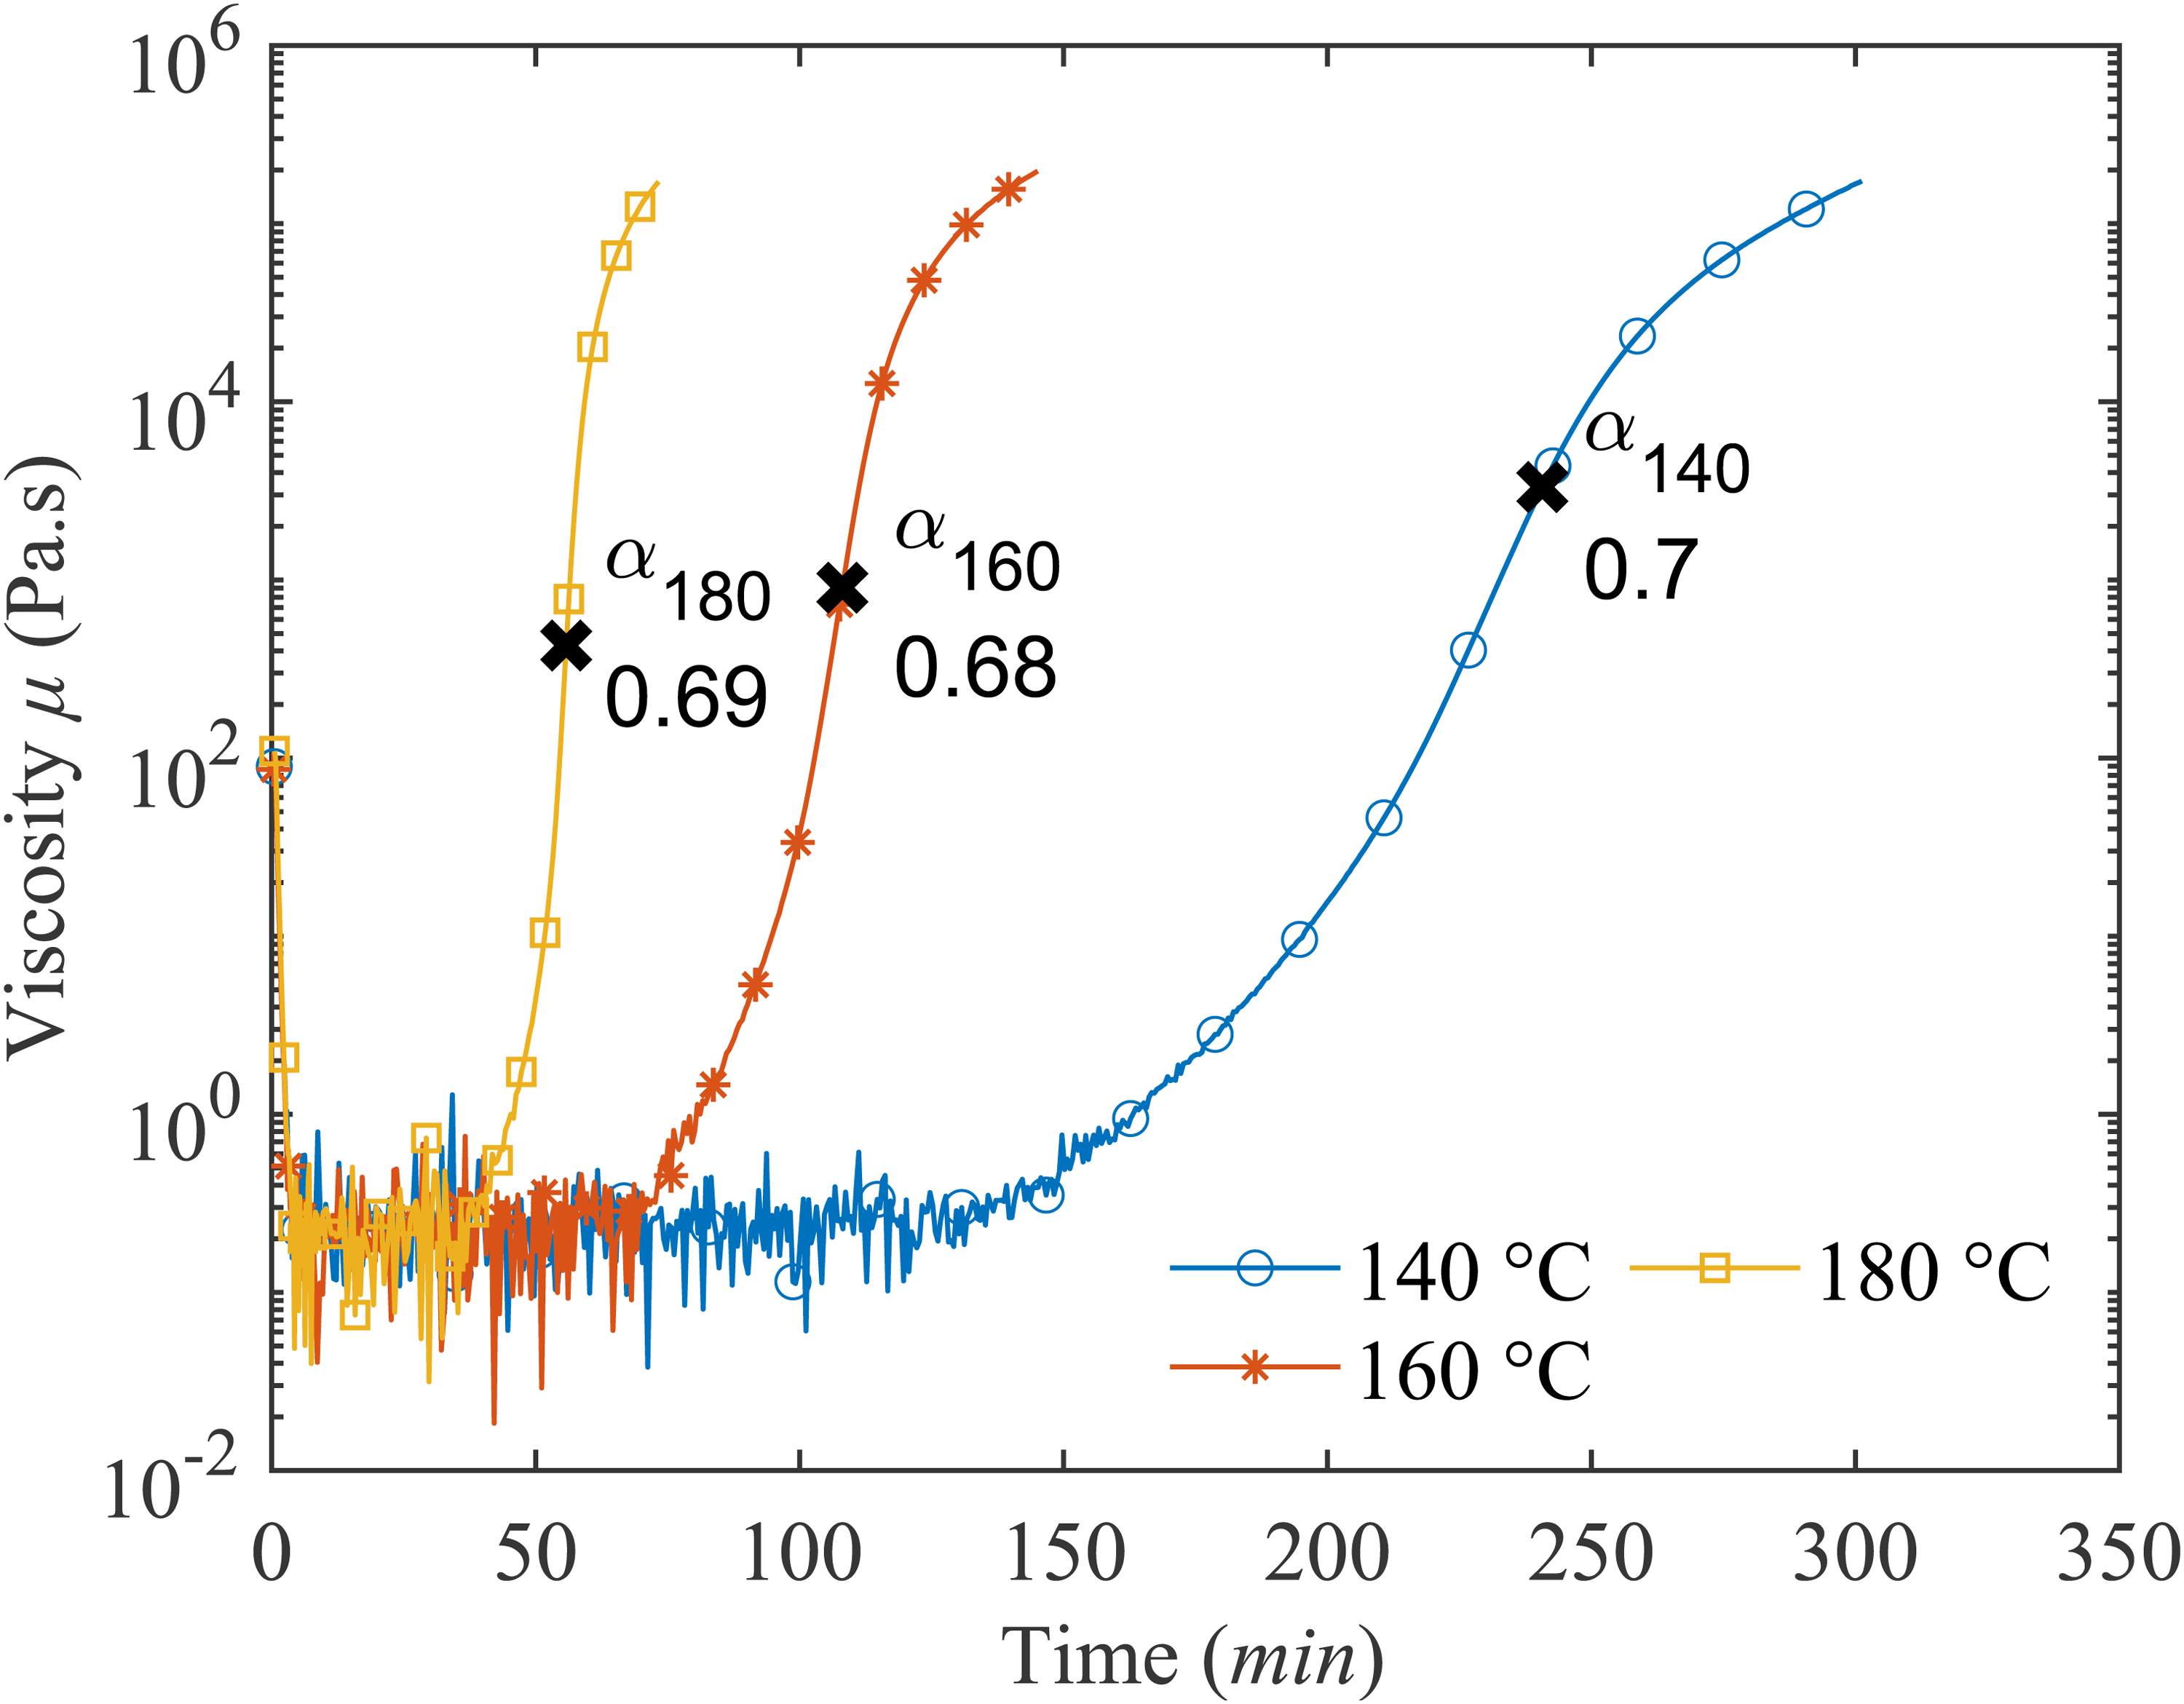
Rheology results. For each isotherm, the ‘×’ denotes the gel point with the degree of cure at gelation given for each temperature.
Fracture toughness
The fracture toughness results measured by SENB testing are shown in Figure 8 (K1C) and Figure 9 (GIC). The results are presented as box plots, with the sample group average shown as black diamonds. In the box plots, the top and bottom of the boxes represent the 75th and 25th percentiles of the sample results, with the distance between the top and bottom being the sample interquartile range. The red line in the box represents the sample median. The whiskers extend from the boxes to the minimum and maximum observed values and the red cross indicates outlier values. The notches in the box represent variability in medians between sample groups. The size of the notch is set so that those boxes that do not overlap have different medians at the 5% significance level.
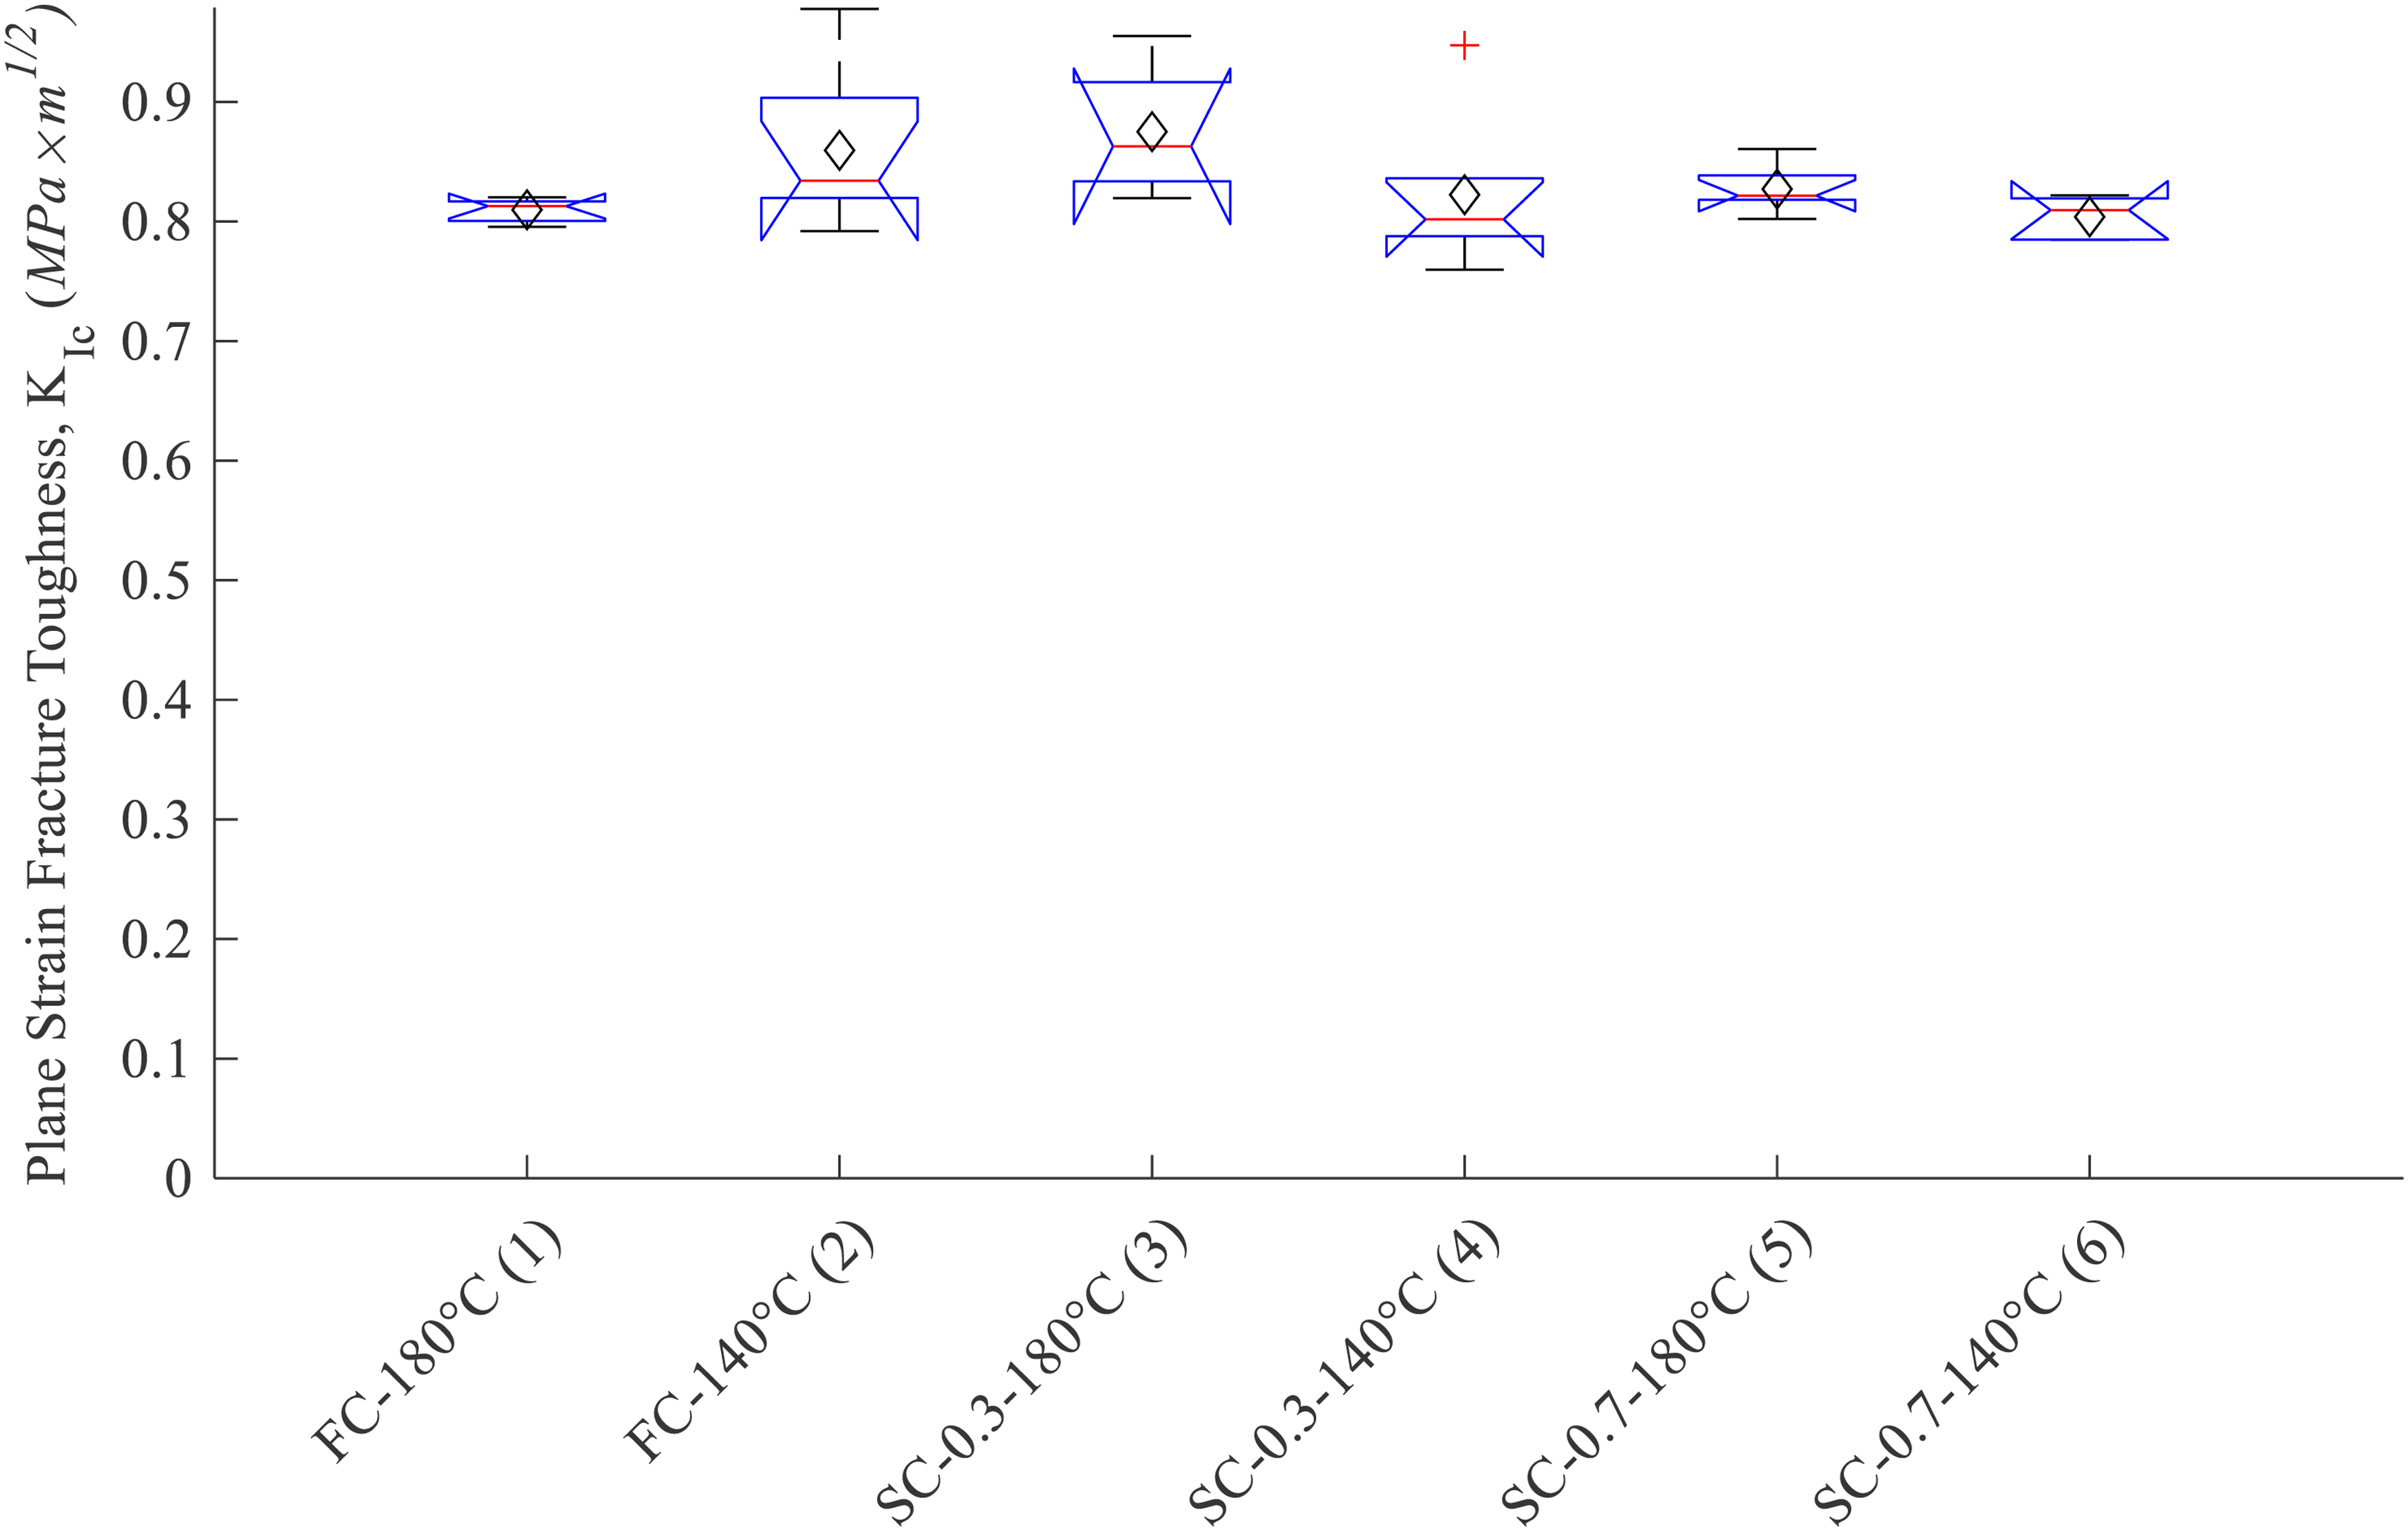
Plane strain fracture toughness of single edge notch bend (SENB) specimens with 1–6 denoting the casting number and SC denoting the degree of semi-cure reached after the initial stage within the staged cure.
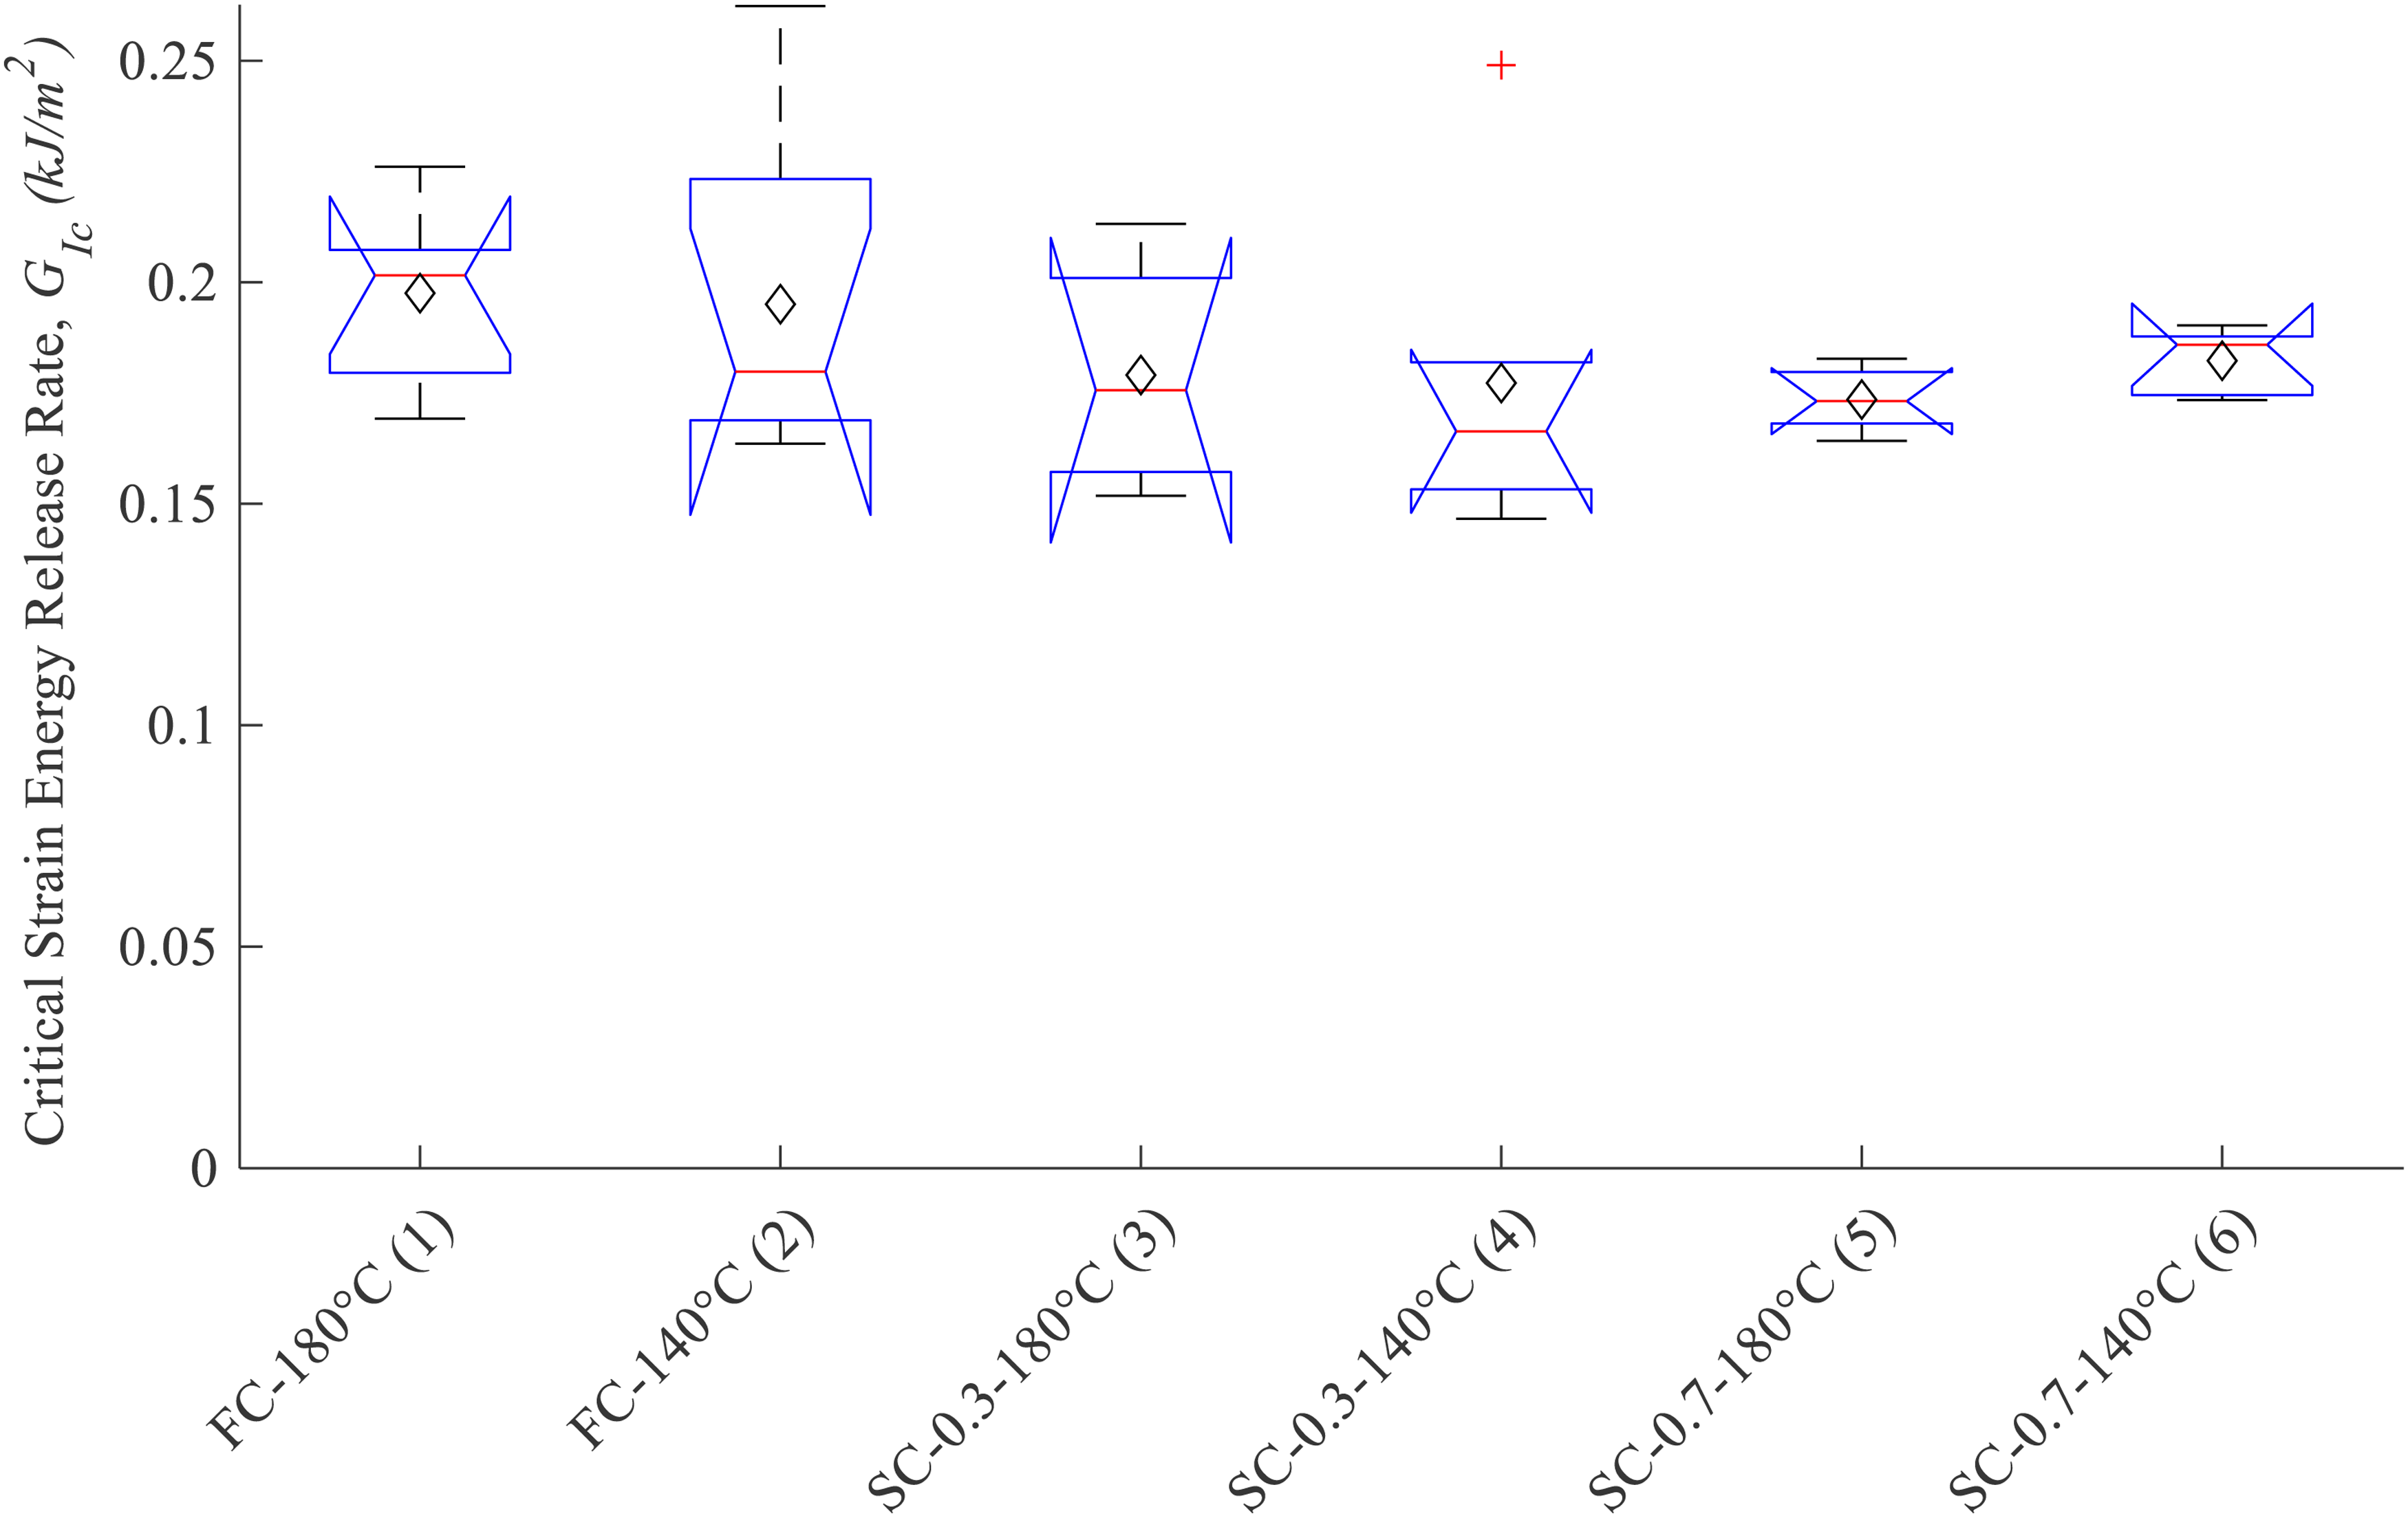
Critical strain energy release rate for the different sample groups.
The average KIC values between sample groups were consistent between the MRCC and the SC cycles. The overlapping notches of the box plots identify that the spread of values is also similar between sample groups. These visual observations were confirmed through a one-way analysis of variance (ANOVA1) P-test, which did not return any statistically significant difference between sample sets (with P = 0.14). The temperature of the initial semi-curing step, whether 140 °C or 180 °C, does not affect the results.
The average GIC values were also consistent between all curing conditions. A one-way analysis of variance (ANOVA1) P-test confirmed again that there is no statistically significant difference between the sample groups (where P = 0.56). The FC sample group averages are slightly higher than the SC sample groups. The FC samples had a lower final degree of cure (0.89) than the SC samples (0.95). The lower degree of cure in the FC samples likely results in a less tightly bound polymer network, and thus a less brittle material when compared to the SC sample sets. This links back to the ideas put forward by Marks et al. that fracture toughness is a function of cure temperature and the degree of cure reached at a given cure temperature. 37 Importantly, the semi-curing process studied here does not influence the material GIC, when compared to the MRCC.
The variability within the sample groups for both the KIC and GIC results is likely a product of the test setup rather than a reflection of the material performance. Factors such as the batch of resin used, the machining of the sample and notch, imperfections in the notch pre-crack, alignment of the sample in the fixture and so on can all also affect test results and lead to an inherent amount of scatter within samples.
Representative SEM images are shown in Figure 10. All the SEM micrographs show river line features parallel to the direction of crack travel. 38 This is caused by the crack propagating along multiple different crack fronts simultaneously. If these crack fronts are on slightly different planes, then the points of convergence will produce a perturbance (a step up or down) which manifests as these river markings. The images reveal no significant differences between the fracture surfaces of the specimens made by semi-curing. These images were taken from the centre of the fracture surfaces where propagation was unstable, that is, self-propagating. Studies have shown that more flexible plastics produce fewer surface features when propagating unstably, 39 and this is likely the cause of the limited surface roughness. No significant differences are seen in the SEM images, and this reflects the limited difference in the mechanical test results between sample groups.
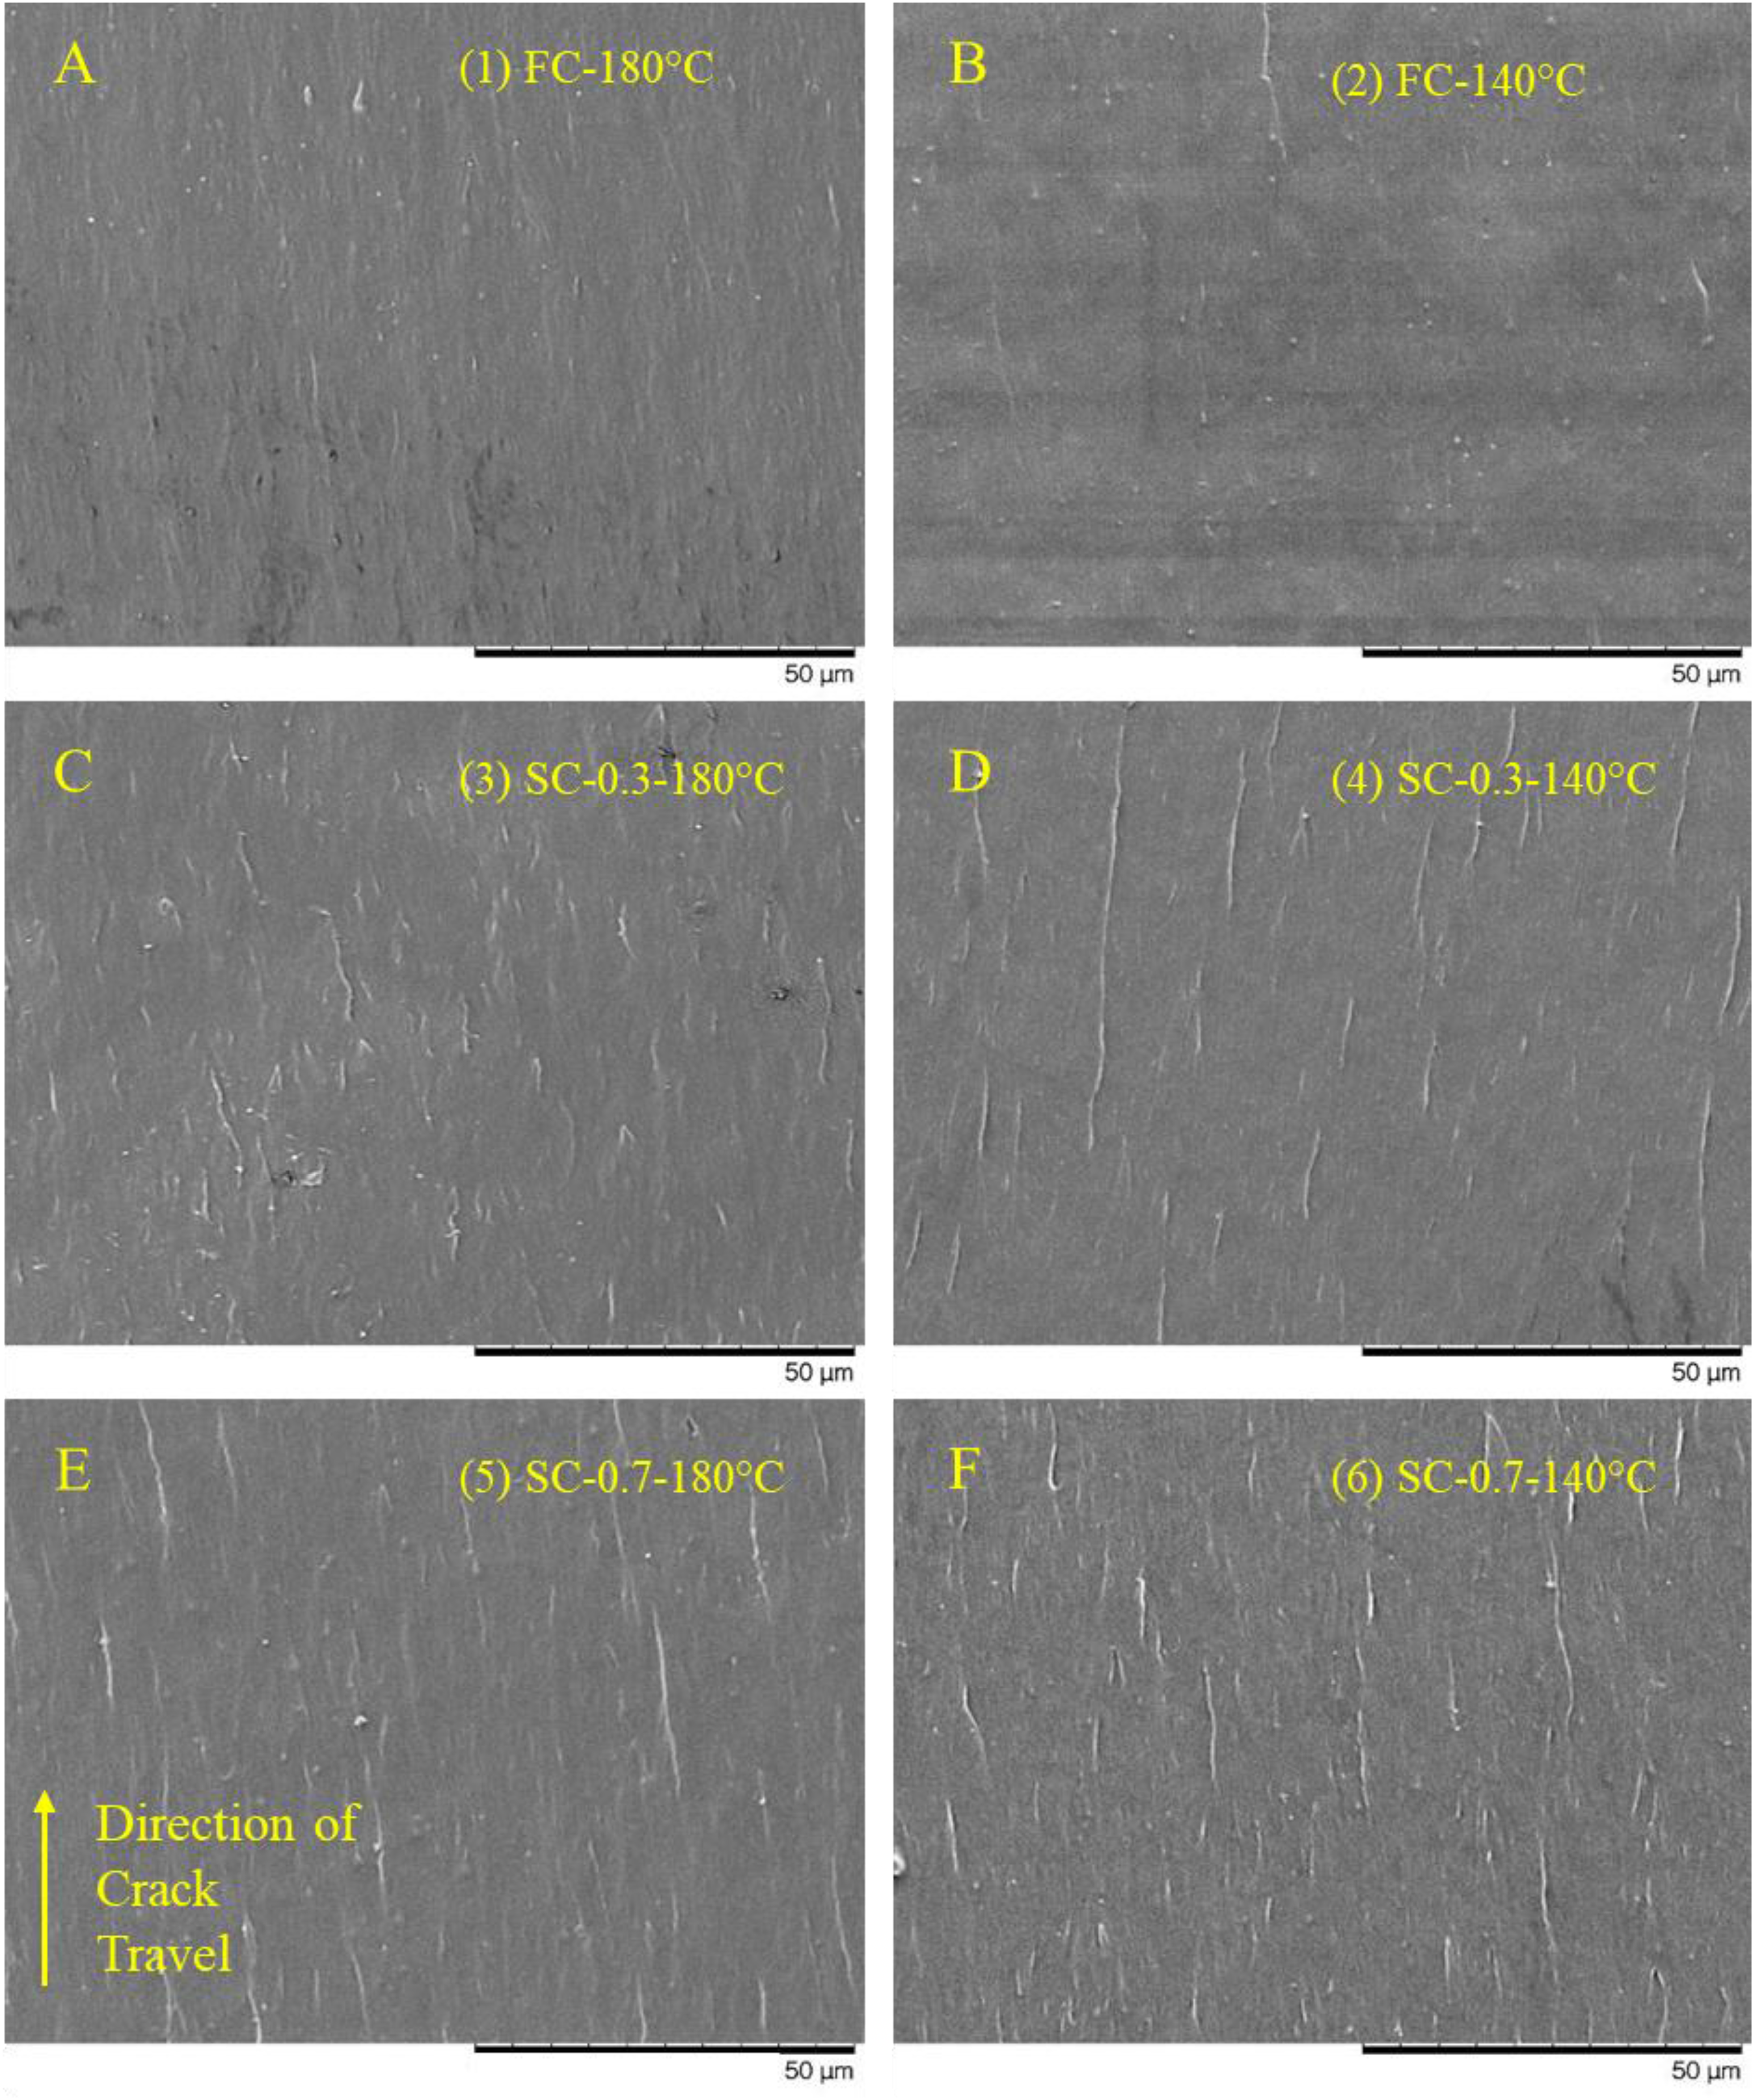
SEM images of single-edge notch bend (SENB) fracture surfaces.
Conclusions
In this study, we investigated the effect of the cure path on a high-performance hot-infusion epoxy resin system. A robust set of cure kinetics and glass transition temperature models were generated to define the cure schedules. The resin was cast into plates and cured according to the MRCC at 180 °C, a modified and longer cure cycle at 140 °C, and cure cycles featuring SC stages at 140 °C and 180 °C.
No cure path dependency was found using the semi-curing process outlined here. Single edge notch bending tests were performed on the FC samples and the fracture properties of the neat epoxy resin were found to be statistically similar. In our case, the final cure temperature in the semi-curing process was the same as the MRCC. The results agree with previous literature that highlights the importance of process temperature when the final degree of cure is reached.
Due to the commercially sensitive nature of the resin system being employed, a more in-depth and comprehensive view of the cross-linking process and the microstructural evolution using the likes of Fourier-transform infrared spectroscopy or Raman spectroscopy was not permitted.
These findings open new and exciting opportunities to develop composite manufacturing processes to integrate SC and uncured preforms into larger and more complex structures. However, further work is needed to assess how interfaces form and perform between the initial SC resin and the uncured resin. As this is likely to involve fibre reinforcement, future studies are planned at the composite laminate level.
Supplemental Material
sj-docx-1-prc-10.1177_14658011241273536 - Supplemental material for The effect of semi-curing on neat resin mode I fracture properties
Supplemental material, sj-docx-1-prc-10.1177_14658011241273536 for The effect of semi-curing on neat resin mode I fracture properties by Michael O’Leary, Robin Hartley, Turlough McMahon and James Kratz in Plastics, Rubber and Composites
Footnotes
Acknowledgements
This work was funded by Airbus, the EPSRC Centre for Doctoral Training in Advanced Composites for Innovation and Science (EP/L016028/1), and the EPSRC Future Composites Manufacturing Hub (EP/P006701/1) Layer by Layer Curing project. The authors would like to acknowledge the support of Dr Karolina Gaska for completing the rheological experiments presented in this study.
Declaration of conflicting interests
The author(s) declared no potential conflicts of interest with respect to the research, authorship, and/or publication of this article.
Funding
The author(s) disclosed receipt of the following financial support for the research, authorship, and/or publication of this article: This work was supported by the EPSRC Centre for Doctoral Training in Advanced Composites for Innovation and Science, EPSRC Future Composites Manufacturing Hub, Airbus UK (grant numbers EP/L016028/1 & EP/P006701/1).
Supplemental material
Supplemental material for this article is available online.
References
Supplementary Material
Please find the following supplemental material available below.
For Open Access articles published under a Creative Commons License, all supplemental material carries the same license as the article it is associated with.
For non-Open Access articles published, all supplemental material carries a non-exclusive license, and permission requests for re-use of supplemental material or any part of supplemental material shall be sent directly to the copyright owner as specified in the copyright notice associated with the article.