
Abstract
Sustainable value co-creation (SVCC) is designed to collaboratively develop long-term, innovative solutions with and for end-users, ensuring enhanced services for society. Simultaneously, social entrepreneurship (SE) has emerged as a highly significant research field for businesses and scholars, particularly in the areas of sustainability and value co-creation. This research, therefore, focused on exploring the influence of SVCC strategies on SE from the viewpoint of entrepreneurs. Therefore, qualitative and quantitative research methods were employed. First, a systematic literature review and thematic analysis identified 35 SE indicators and 13 SVCC strategies. Second, a multi-layer decision-making approach in an uncertain environment was taken to (i) screen and select, via Fuzzy Delphi, the 10 most significant indicators of SE from entrepreneurs’ perspectives; (ii) calculate the relative importance of each finalised indicator and determine the causal relations amongst indicators by mixed fuzzy cognitive map (FCM) and Decision Making Trial and Evaluation Laboratory (DEMATEL); and (iii) classify the SVCC strategies based on their influence on SE indicators according to the scores derived from FCM-DEMATEL. The cause–effect relationships among these indicators were analysed, and their weights were assessed. ‘Trust’, ‘people management’ and ‘responsibility’ emerged as the most important indicators.
Introduction
In recent years, the emphasis on sustainability has continued to increase due to growing concerns about business development and an increasing emphasis on shareholders’ value (Matarazzo et al., 2024). Sustainability is regarded as a progressively vital strategic goal of markets in either developed or emerging economies (Brown et al., 2022; Casidy and Yan, 2022). Moreover, the role of value co-creation in entrenching sustainability within businesses is well documented. According to the United Nations (UN) sustainable development goals (SDGs), sustainable development is founded on three pillars: economic, social and environmental (Kyriakopoulos, 2024). Sustainable practices lead to durable profitability while positively affecting society (Singh et al., 2022). Recently, sustainable value co-creation (SVCC) has become a crucial approach to facilitate achieving sustainability pillars (Xie et al., 2022). Theoretically, SVCC potential is about understanding the processes, resources and practices which customers use to manage their activities while simultaneously considering the three pillars of sustainability (Babgohari et al., 2023; Devine et al., 2021). The strategies of SVCC have a significant influence on gaining and sustaining SDGs as well as on social entrepreneurship (SE), which is dramatically highlighted in both developing and developed countries (Apostolidis et al., 2021; Babu et al., 2020). Some examples demonstrate how SE not only contributes to technological advancements but also plays a vital role in economic growth, job creation, healthcare, environmental sustainability and global connectivity (Gu and Wang, 2022).
The impact of SE is evident in various sectors and across different countries, highlighting its global significance. Economically, according to a PricewaterhouseCoopers (PwC) report, investment in climate tech start-ups increased 210% from 2020 to $16.3 billion in the first half of 2021. This investment drives innovation in clean energy, sustainable food systems and carbon capture technologies (Dhayal et al., 2023). According to the International Renewable Energy Agency (IRENA), the renewable energy sector employed 11.5 million people globally in 2019, and this number is projected to increase to 42 million by 2050. This demonstrates significant job creation potential in sustainable sectors (Tunçalp and Yildirim, 2022). These facts and examples illustrate the tangible impact of SE on economic growth in diverse ways. As sustainable practices become more integrated into the global economy, their contribution to economic development is expected to continue rising (Matemane et al., 2024). Figure 1 shows trends in the approximate investment in SE across different regions. The problem of unequal investment in SE is evident when analysing regional distributions (Korkut Pata et al., 2022). As shown in Figure 1, investment in SE is highly concentrated in a few regions, including the UK, the United States and Continental Europe. In contrast, regions like Africa, Latin America and parts of Asia receive minimal investment. This difference highlights the need to address inequalities and to detect and analyse the main factors and strategies, which contribute to SVCC and SE (Vrhovac et al., 2024).
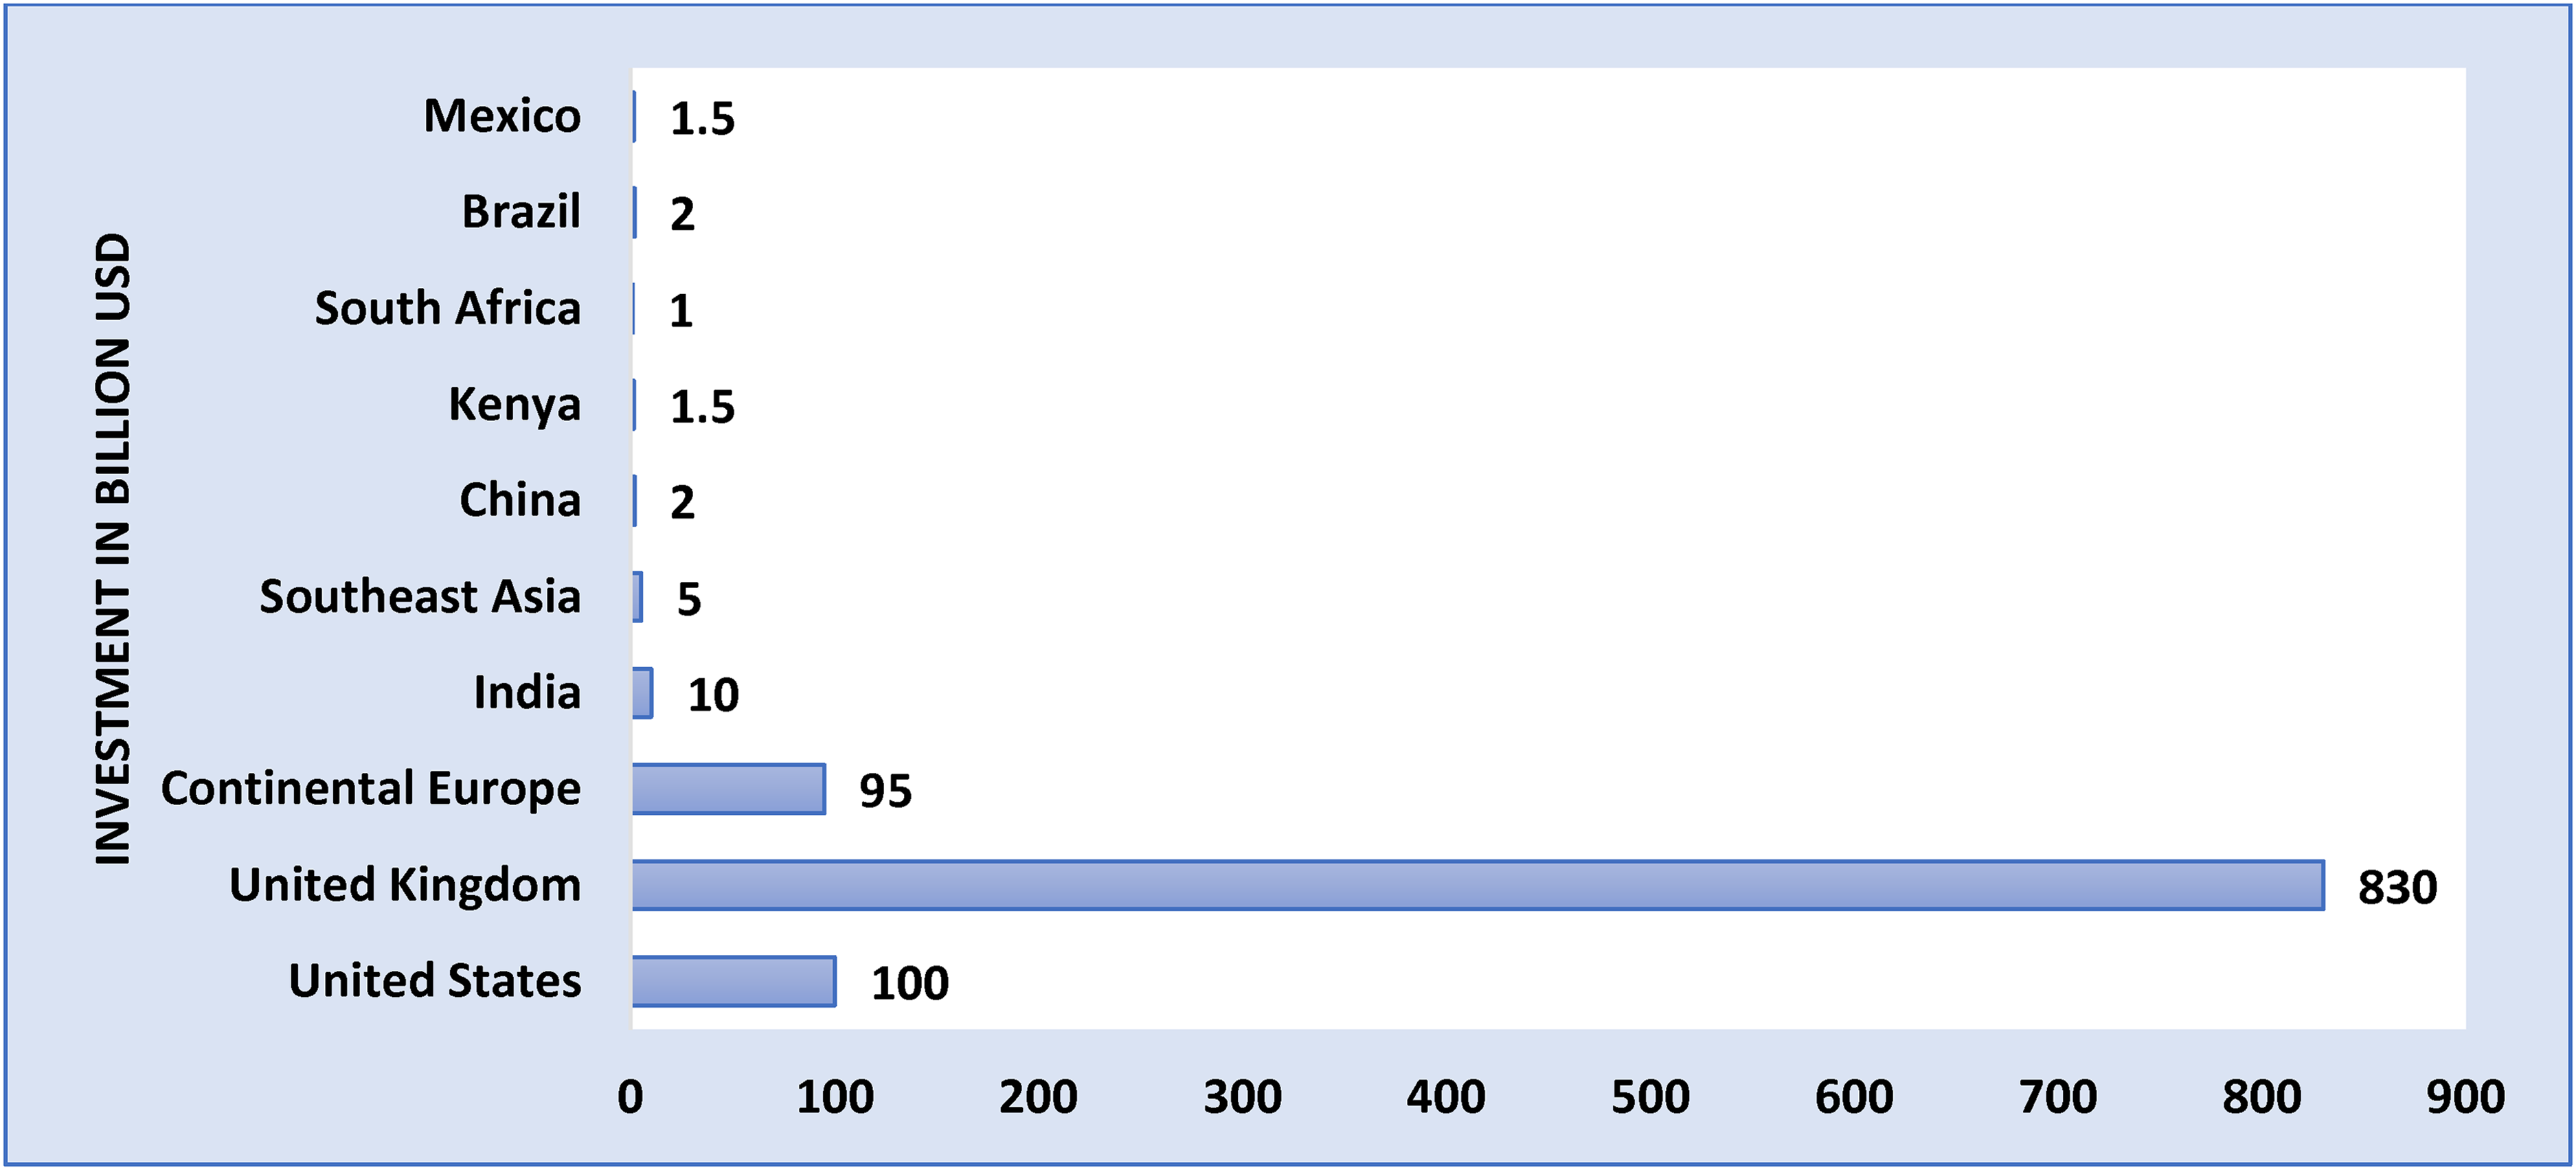
Approximate investment in social entrepreneurship across different regions (adapted from García-Jurado et al. (2021)).
In recent years, the development of social enterprises, which instantaneously create both social and economic value, specifically in emerging economies, has brought about basic changes in the dichotomy between social innovation endorsed by for-profit (De Silva et al., 2020) and not-for-profit companies (Al-Tabbaa et al., 2019). Although the research on SVCC is still evolving (Mahajan et al., 2023), analytical interpretations of SVCC are lagging and there is a lack of clarity on how SVCC strategies can contribute to or impede SE considering the sustainability approach. Particularly concerning sustainability in the value co-creation context, the existing literature offers only a tenuous understanding of how organisations perceive the factors that affect the co-creation of sustainable value (Li et al., 2022). Furthermore, limited research has systematically analysed SVCC strategies that determine SE development. Sinthupundaja et al. (2020) argued that there are strategies and actions for SVCC which can support SE indicators. Several indicators must be considered when deciding on the best-suited SVCC strategies. These indicators exhibit qualities that can be numerically scored or qualitatively described. Due to the involvement of multiple indicators, uncertainties, conflicting goals and individual perspectives (Razavi Hajiagha et al., 2024) in this decision-making process, a multi-criteria decision-making (MCDM) process is needed to identify the best SVCC strategies (Keleş Tayşir et al., 2024).
MCDM is vital for evaluating and comparing various strategies based on multiple criteria. It is essential for decision-makers facing complex judgements with difficult-to-compare aspects. By systematically examining all relevant indicators, MCDM enables the making of well-informed decisions, ensuring that no key elements are overlooked and all options are thoroughly evaluated (Shu et al., 2023). This approach promotes transparency by clearly articulating the indicators used in the decision-making process. Our research employs a multi-layer decision-making framework in an uncertain, fuzzy environment. Real-world decision-making problems often involve incomplete or uncertain information due to a lack of data, time, or cognitive capacity (Puška et al., 2024). Addressing this challenge, MCDM is explored in an uncertain environment to enhance the robustness of our decisions.
While the importance of SVCC and SE in achieving sustainability goals is widely acknowledged, there remains a significant gap in understanding how SVCC strategies influence the effectiveness of SE indicators across different sectors and regions (John and Supramaniam, 2024). Specifically, the existing literature offers limited insight into how organisations perceive the indicators contributing to the SVCC and how these factors interact with sustainability. Additionally, there is a lack of comprehensive frameworks that systematically evaluate the strategies for SVCC and indicators for SE, particularly in the context of both developed and emerging economies. Furthermore, while MCDM approaches are increasingly recognised for their utility in decision-making in uncertain environments, there is limited application of MCDM in analysing the strategic decisions related to SVCC and their direct impact on SE outcomes.
The topics of SE and SVCC are crucial for several reasons. Firstly, growing concerns about the environmental impact of business activities have increased pressure on organisations to reduce their carbon footprint and minimise environmental harm. SE is vital for businesses to address these concerns (Manjon et al., 2022). Secondly, SE can help organisations reduce costs and enhance competitiveness by cutting waste and inefficiencies, thereby improving their bottom line (Baquero and Monsalve, 2022). Despite the importance of these topics, research gaps remain. Few studies have explored which SE indicators are most effective in enhancing business sustainability. Additionally, the impact of SVCC strategies on SE indicators has not been thoroughly evaluated. This study aims to fill these gaps by examining the influence of SVCC strategies on SE indicators. To this aim, the research questions (RQs) are as follows:
RQ1: What are the key SE indicators and the most effective SVCC strategies? RQ2: What is the relative importance of each indicator and how do they interact with one another? RQ3: How do SVCC strategies influence SE indicators?
The next sections of the paper are organised to provide a comprehensive analysis of SVCC strategies and their impact on SE indicators. An overview of SVCC strategies is presented alongside various definitions of SVCC and SE provided by different authors. Following this, the research methodology is detailed, encompassing a systematic literature review, thematic analysis (TA) and a multi-layer decision-making approach. The ‘Findings’ section presents the findings and outputs from each phase of the research framework. The ‘Discussion’ section then discusses the research findings. Finally, the study's limitations and suggestions for future research are addressed in the ‘Limitations and future recommendations’ section.
Literature review
Sustainable value co-creation
Sustainability is regarded as an increasingly important strategic goal for any company intending to gain and maintain competitive advantages (Almeida, 2024). Studies in the business development literature explore how sustainability can support value co-creation (VCC). For instance, utilising the example of seaports as business networks, (Lavissière et al., 2020) highlights the prominent role of managing and maintaining sustainability strategies and facilitating VCC. With the advent and pervasiveness of a more networked economy, value co-creation has become a prominent area of research in marketing literature. By introducing the VCC concept, companies involve customers in developing an offering beyond the production or design phase. Consequently, customers are now actively involved with companies in developing their offerings by investing their time, resources (operant and operand) and insights/ideas (Hollebeek et al., 2019). This indicates that VCC is a resource integration process that can benefit firms more.
VCC theory describes collaboration between multiple stakeholders and suggests that a firm does not merely generate value for a particular product by producing it but co-creates it with its primary stakeholders (Al-Omoush et al., 2023). In SVCC, benefits are offered to the actors directly involved in the process and to stakeholders in the wider ecosystem, including local communities and the broader society, thus improving the sustainability of the ecosystem within which the actors collaborate (Rosenstock et al., 2020). Given the exponential advancement of sustainability, sustainable development goals and the inherent characteristics of the subject matter, scholars and professionals commonly adopt diverse viewpoints to compile a comprehensive inventory of SVCC strategies. To date, a thorough evaluation that contributes to understanding the significance of efficient strategies within the context of SVCC is still lacking. SVCC is an emerging field that emphasises generating benefits for direct business partners and broader stakeholders, including local communities and society. This approach often involves innovative business models that integrate sustainability principles, engage multiple stakeholders and build long-term relationships. Key aspects of SVCC include multi-stakeholder engagement (Civera et al., 2023), business model innovation (Ancillai et al., 2023) and comprehensive impact measurement (Safaei Pour et al., 2023). This leads to studies taking a strategy-oriented approach (Ciasullo and Troisi, 2013) for industries, societies, economies and other relevant entities. (Brown et al., 2024). Social enterprises pursue social goals while striving to co-create sustainable value. Due to the diverse and competing social and commercial logic and strategies of SVCCs, SE faces several indicators or criteria, such as communication (Bastida and Alvaran, 2024) and innovation projects (Qian, 2013).
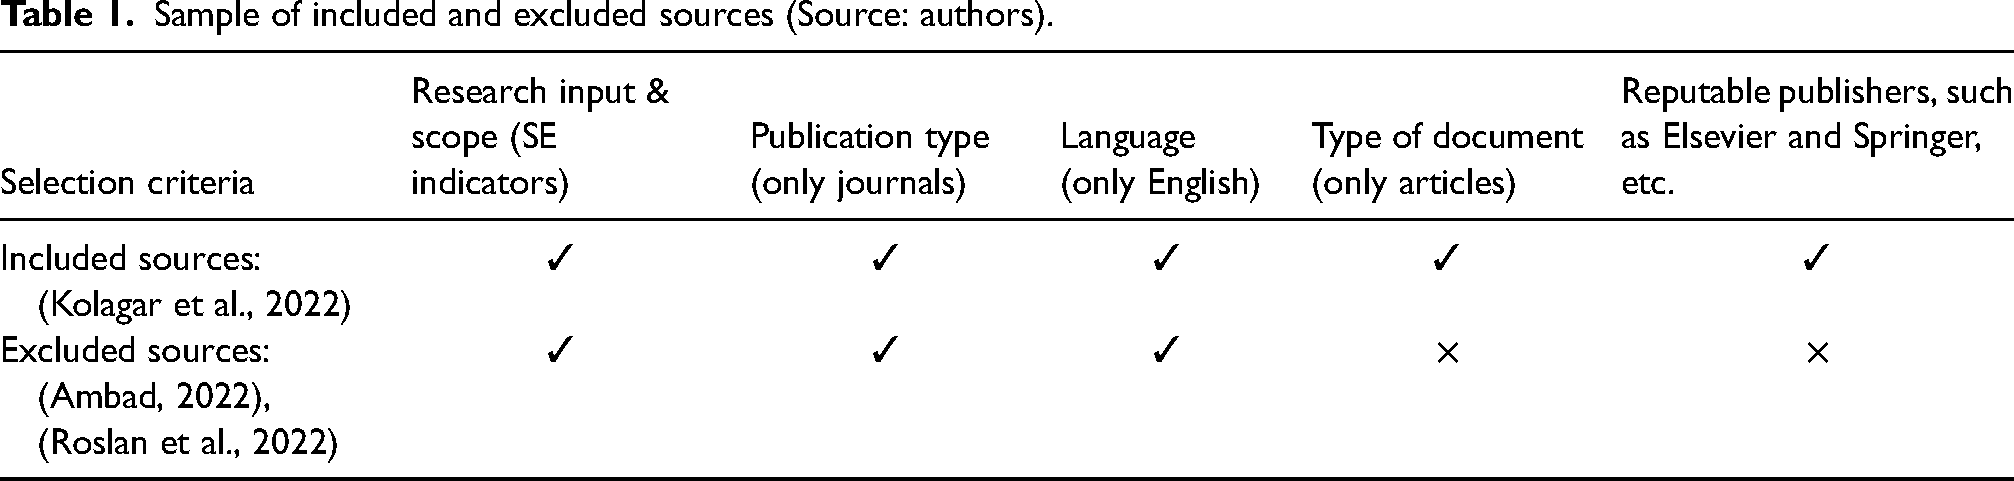
To systematically review SVCC strategies and SE indicators, the SPAR-4-SLR (Scientific Procedures and Rationales for Systematic Literature Review) protocol is applied (Paul et al., 2021). This four-stage protocol begins with planning the review, where clear objectives and research questions are defined, inclusion and exclusion criteria are set and a preliminary search is conducted to refine the strategy (Pollock and Berge, 2018). In this regard, six criteria are considered for conducting the SPAR-4-SLR protocol: (i) research required input and scope, (ii) source type, (iii) language, (iv) search mechanism, (v) period and (vi) keyword. Second, the main search mechanisms are formulated as VALUE CO-CREATION (All Fields) and STRATEGIES, or TACTICS, or POLICIES, PLANS, SCENARIOS, APPROACHES (Topic) and SUSTAINABLE (Topic) to search in both SCOPUS and World of Science (WOS) databases. Second, the filtering process is based on the indicators of publication type (limited to journals), language (restricted to English) and document type (restricted to articles). English review and research articles (type and language of source) listed in Scopus and WOS are targeted, particularly those from five reputable and popular publishers: Elsevier, Springer, Taylor & Francis, Wiley and Emerald. These sources are deemed appropriate for providing valuable information for investigating articles, including details such as the year of publication and type of article (Amoozad Mahdiraji et al., 2024a). To clarify how the selection criteria are determined in practice, four related articles are assessed and presented in Table 1.
Sample of included and excluded sources (Source: authors).
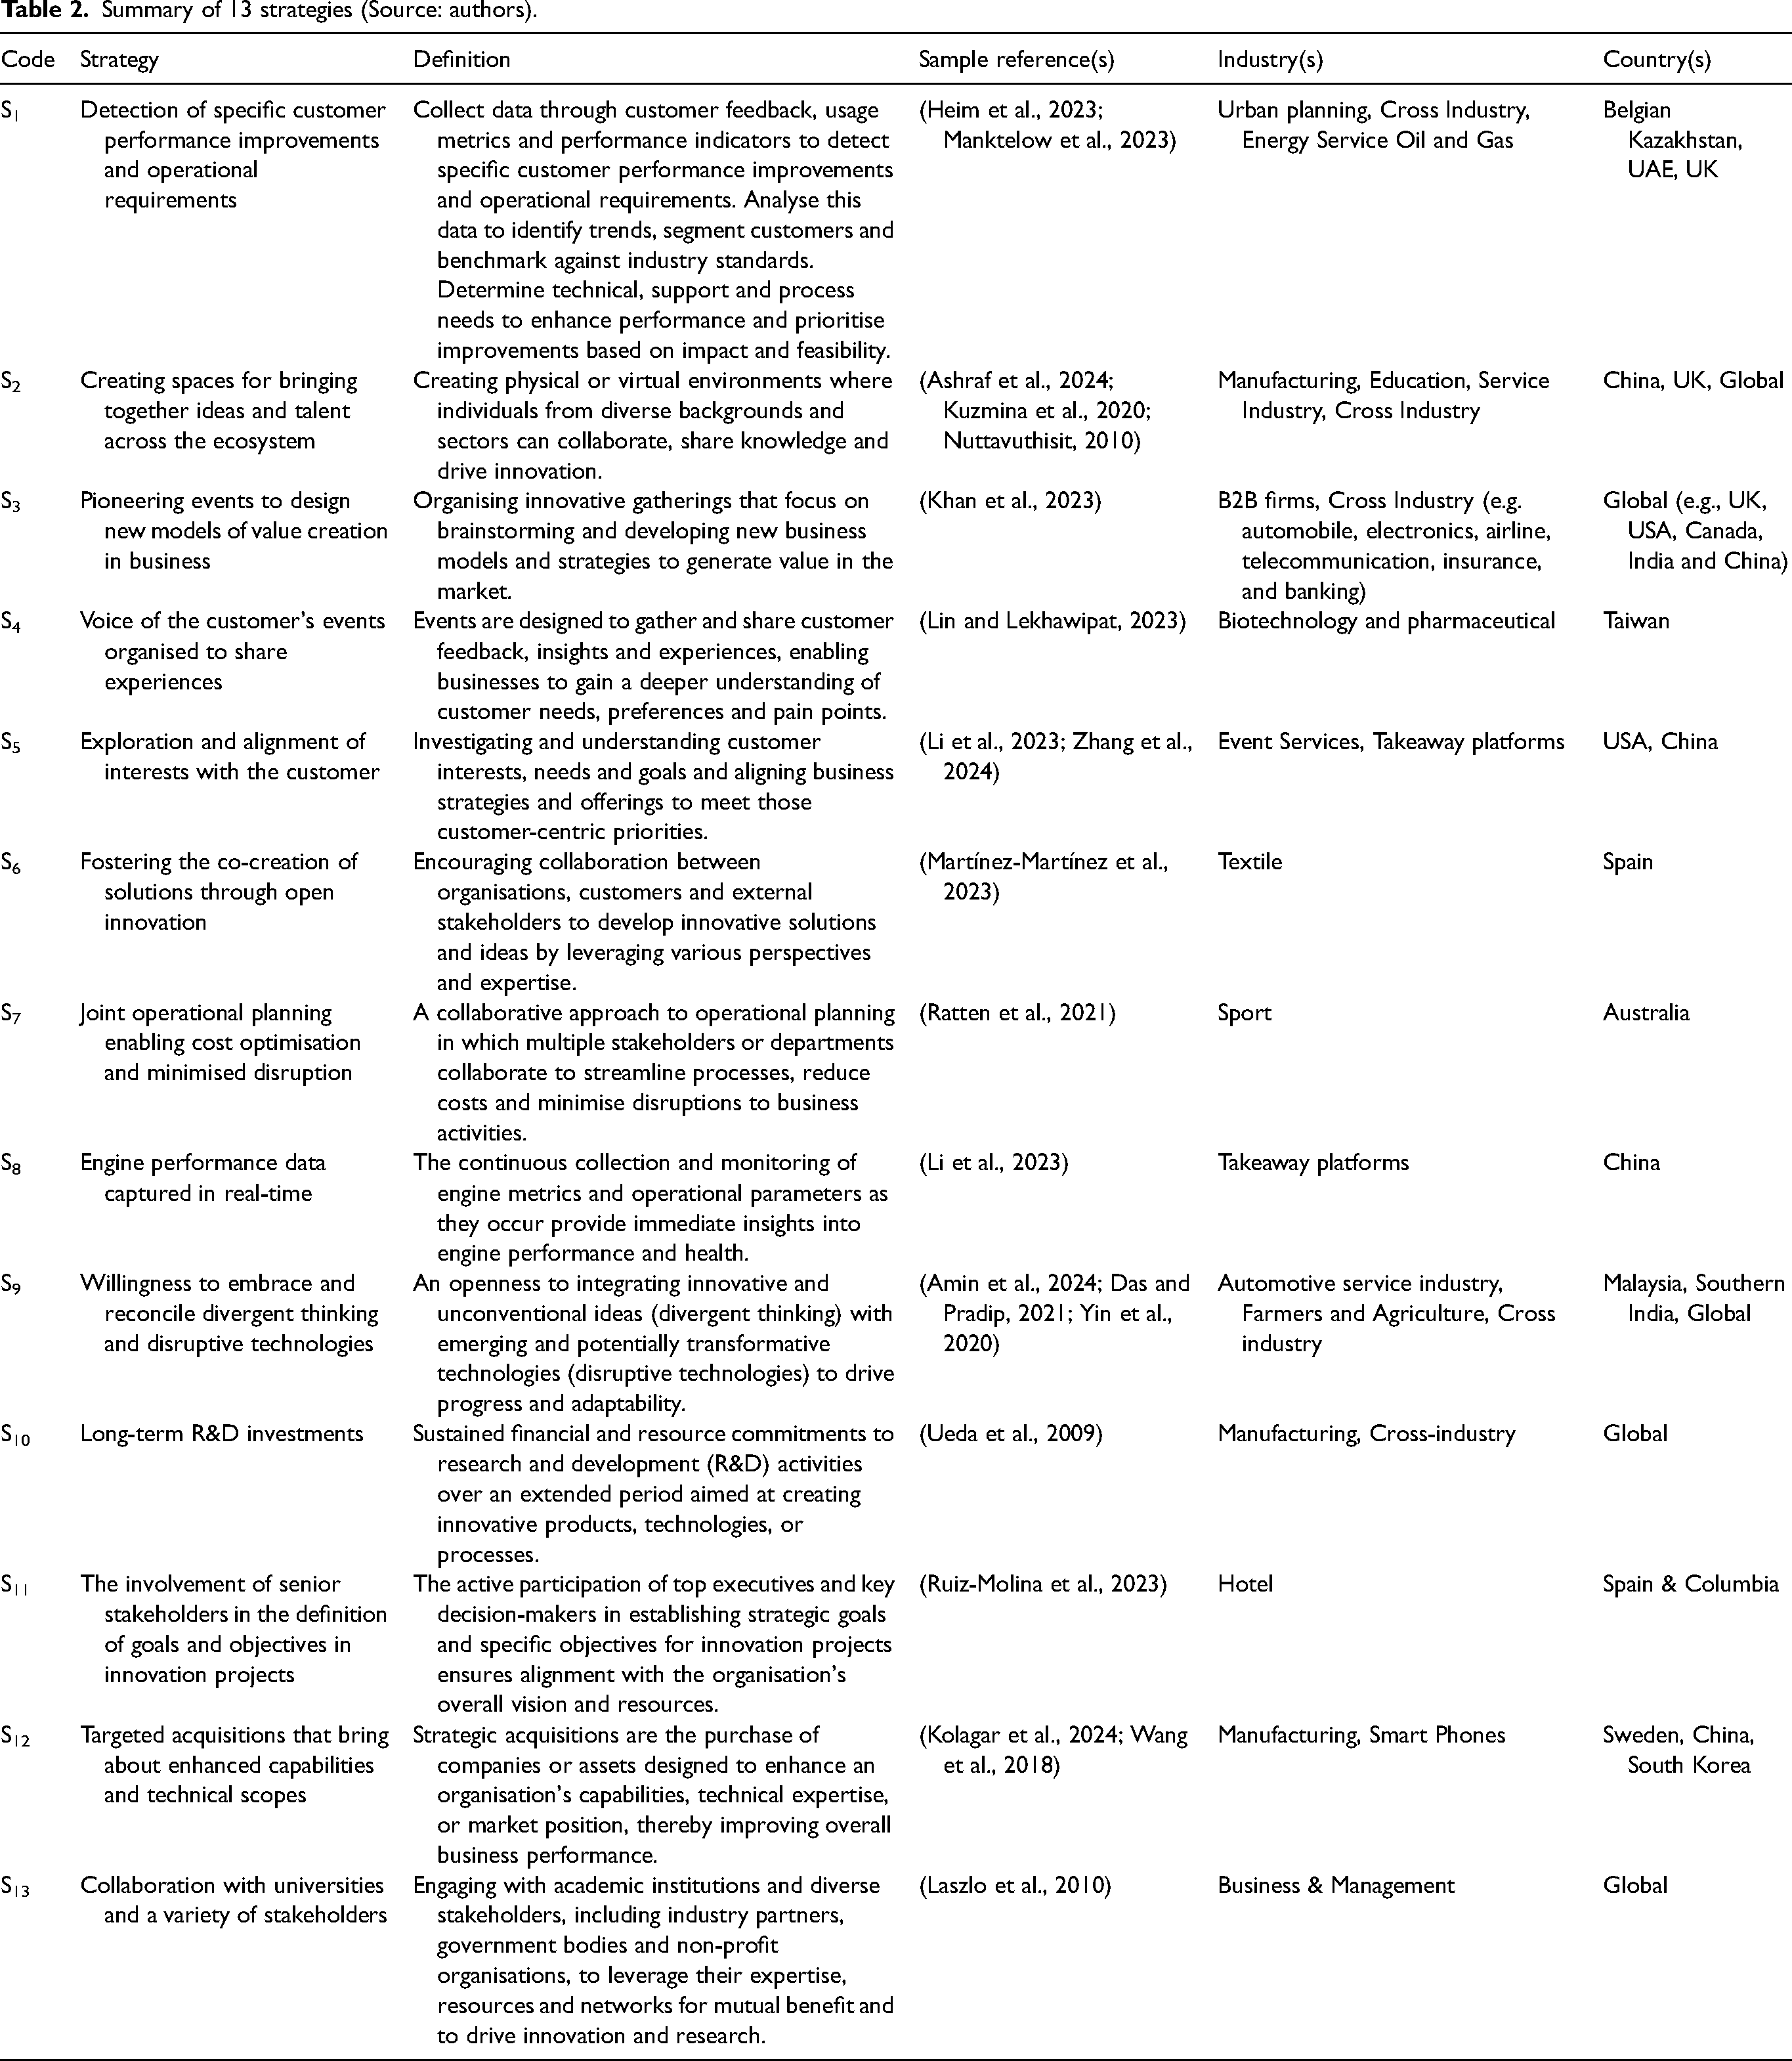
In the second phase of SPAR-4-SLR, a thorough review of the existing literature resulted in the selection of WOS and Scopus as the primary bibliometric databases. Their advanced filtering capabilities enable quick and efficient access to the most relevant records, particularly those published in English and in top-ranked journals – the search yielded 179 documents from WOS and 41 from Scopus, totalling 220. After removing 28 duplicates, 192 items remained and were checked based on publication type (including journals from four publishers) and document type (including articles). As a result, this filtering removed 100 items. After a brief abstract review of the remaining 92 items, 23 articles were selected to identify SVCC strategies according to their abstracts. Finally, reviewing the 23 articles in the fourth phase revealed 13 critical strategies for value co-creation within the sustainability paradigm, as presented and analysed in Table 2.
Summary of 13 strategies (Source: authors).
In the third phase, SVCC strategies were identified using TA with MAXQDA software, exploring the co-occurrence relations among the main themes in 13 strategies. Figure 2 presents a neural network-based theme map, visually depicting the interconnections between different themes related to SVCC. This map helps understand how various strategies interact and contribute to sustainability objectives and SE indicators. Figure 2 visually illustrates the interrelationships among the SVCC strategies (S1 to S13), with S3 and S4 emerging as central nodes, indicated by their larger size and greater number of connections. The thickness of the connecting lines represents the strength of these relationships, with thicker lines (e.g. between S3 and S4 and between S4 and S6) signifying stronger interactions. The visual map highlights S3 (Pioneering events to design new models of value creation in business) and S4 (Voice of the customer events organised to share experiences) as key strategic hubs, both demonstrating strong mutual linkage and robust connections with S6 (Fostering the co-creation of solutions through open innovation). This configuration suggests that organising events to generate innovative business models and gathering customer insights plays a pivotal role in facilitating collaborative innovation and value creation. These strategies align with high-impact indicators, such as the implementation of innovation projects and effective people management, as further illustrated in Figure 5.
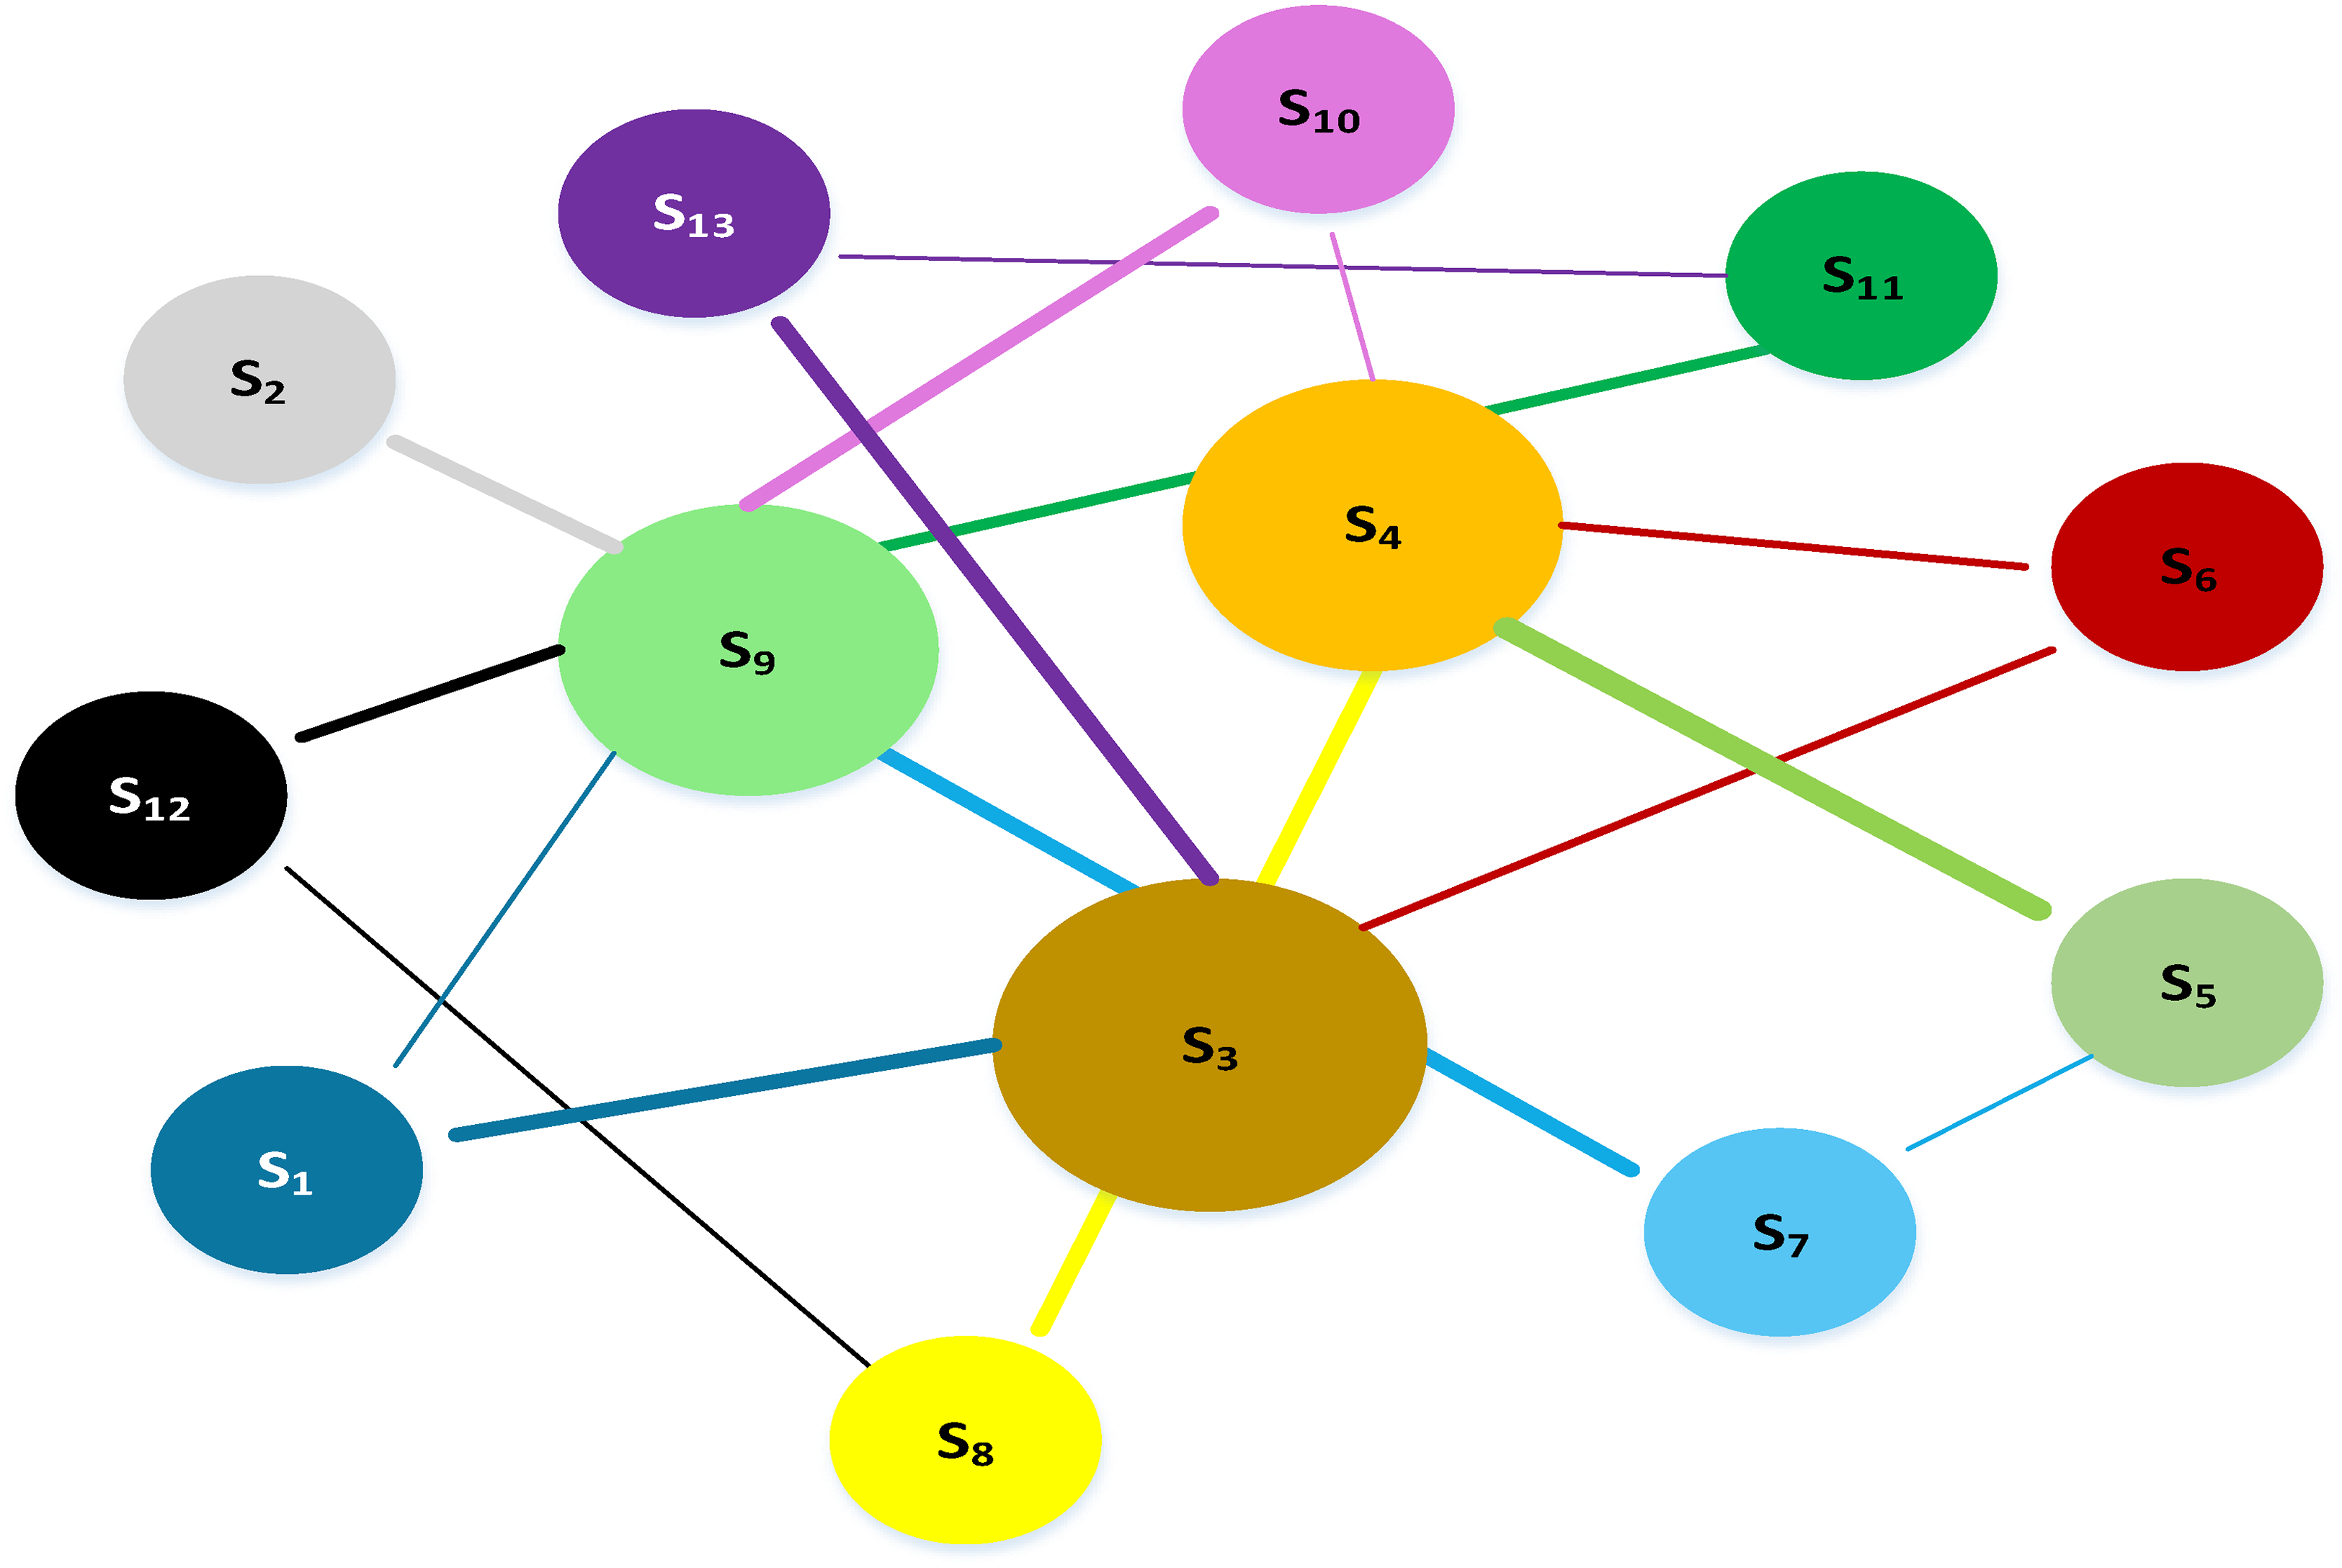
Neural network-based theme map for SVCC strategies (Source: authors).
Social entrepreneurship
While traditional for-profit entrepreneurship is driven by economic gain, SE prioritises social benefits over private profit. Social entrepreneurs create products and services to address societal needs and implement policies to foster social development, such as employing individuals with disabilities and promoting workforce inclusivity. By aligning business activities with social impact, social entrepreneurs contribute to broader societal welfare, extending beyond economic outputs and advancing sustainable and inclusive development (Gidron and Monnickendam-Givon, 2017). Governments often struggle to achieve large-scale social and economic transformation on their own in resource-constrained emerging economies with large populations, inadequate infrastructure and numerous institutional gaps. SE is a powerful tool for combating unemployment, poverty, gender discrimination, inadequate education and poor health standards (Sengupta et al., 2018). Social entrepreneurs and innovators are increasingly recognised as crucial partners in socio-economic development, with many governments in emerging economies supporting them through economic incentives, funding opportunities and conducive policy frameworks. This support includes financial grants, tax incentives and access to networks, encouraging the growth of social enterprises that address societal and environmental challenges while generating sustainable revenue (Li et al., 2020).
SE gains traction in response to environmental concerns, reflecting a broader understanding of the role of economic agents in addressing societal challenges. SE emphasises creating social and environmental value alongside economic returns (Middermann et al., 2020). Although various definitions of SE exist, it can be broadly defined as a process to address social issues through innovative indicators. This involves identifying and implementing indicators to measure success in solving these problems. Social entrepreneurs focus on creating a positive impact by developing new methods, products, or services that tackle poverty, inequality and environmental degradation (Al-Qudah et al., 2022). The emphasis is on innovation and measurable outcomes, ensuring solutions address immediate concerns and contribute to long-term sustainable development. Based on previous studies, SE has numerous and diverse indicators that suggest that SVCC strategies can have a significant influence. To the best of our knowledge, the highlighted gaps in previous studies on SE are addressed. However, the indicators of SE have not been systematically identified and reviewed in the related literature.
Following the previous section, the SPAR-4-SLR protocol is implemented to systematically identify and review SE indicators. In the first phase, six criteria were considered: (i) research input and scope, (ii) source type, (iii) language, (iv) search mechanism, (v) period and (vi) keyword. In the second phase, key search terms included ‘SOCIAL ENTREPRENEURSHIP INDICATORS’ (TITLE), ‘SOCIAL ENTREPRENEURSHIP CRITERIA’ (TITLE), ‘SOCIAL ENTREPRENEURSHIP KEY SUCCESS FACTORS’ (TITLE), ‘SOCIAL ENTREPRENEURSHIP FACTORS’ (TITLE) and ‘SOCIAL ENTREPRENEURSHIP DRIVERS’ (Title). These keywords guided the search in the Web of Science (WOS) and Scopus bibliometric databases. The document type and source language were also considered and articles were filtered to only English. Publishers such as Elsevier, Springer, Taylor & Francis, Wiley and Emerald were selected for their reputation. The search identified 54 related documents (26 WOS and 28 SCOPUS), with two duplicates removed. The remaining documents included conferences, chapters, etc., totalling 32. Ultimately, 20 documents published in top-ranked journals were reviewed and analysed to discover SE indicators. These documents served as inputs for the MAXQDA software, facilitating TA and the identification of 35 critical SE indicators.
The final phase of the SPAR-4-SLR protocol involved a thorough evaluation and comprehensive reporting of findings. This included an in-depth scan of 20 relevant studies to extract and classify SE indicators. The extracted data was documented systematically using Microsoft Excel and Word for organised reporting. The synthesised information is presented in Table 3. Furthermore, Figure 3 illustrates the identified SE indicators, highlighting key metrics and factors in current research and providing a foundation for future studies and practical applications in software engineering.
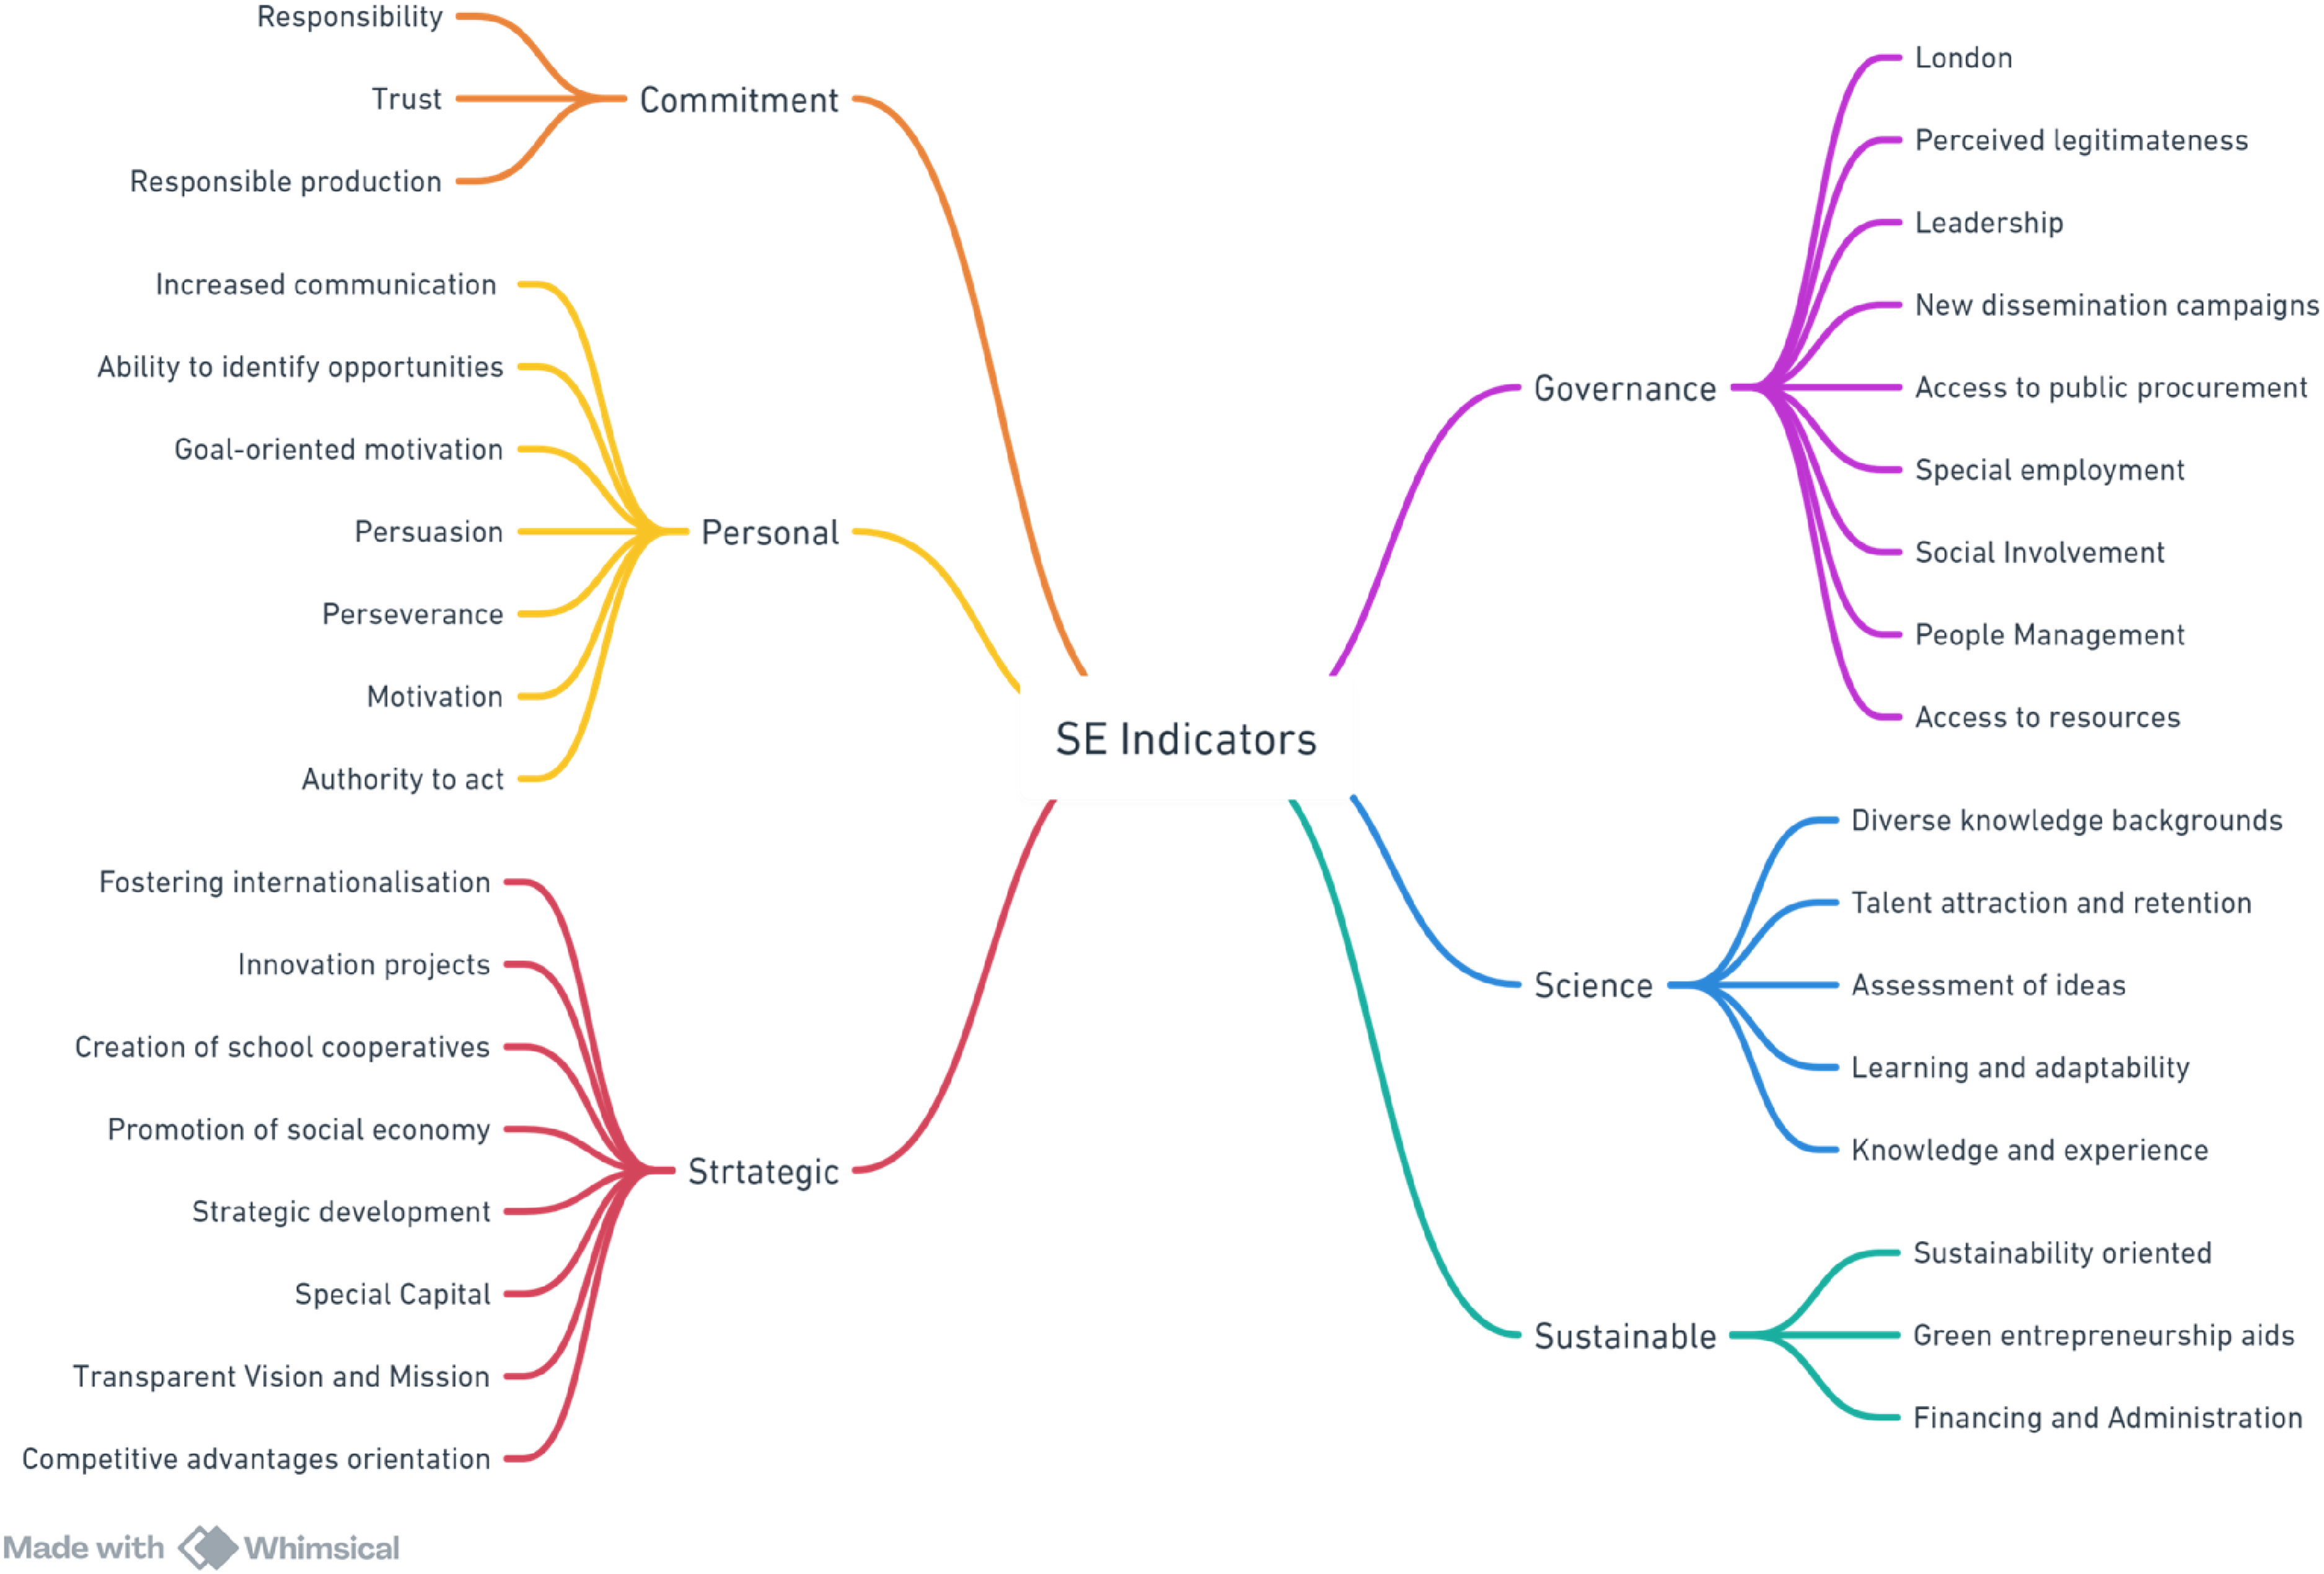
SE indicators classification (Source: authors).
Review of SE indicators (Source: authors).
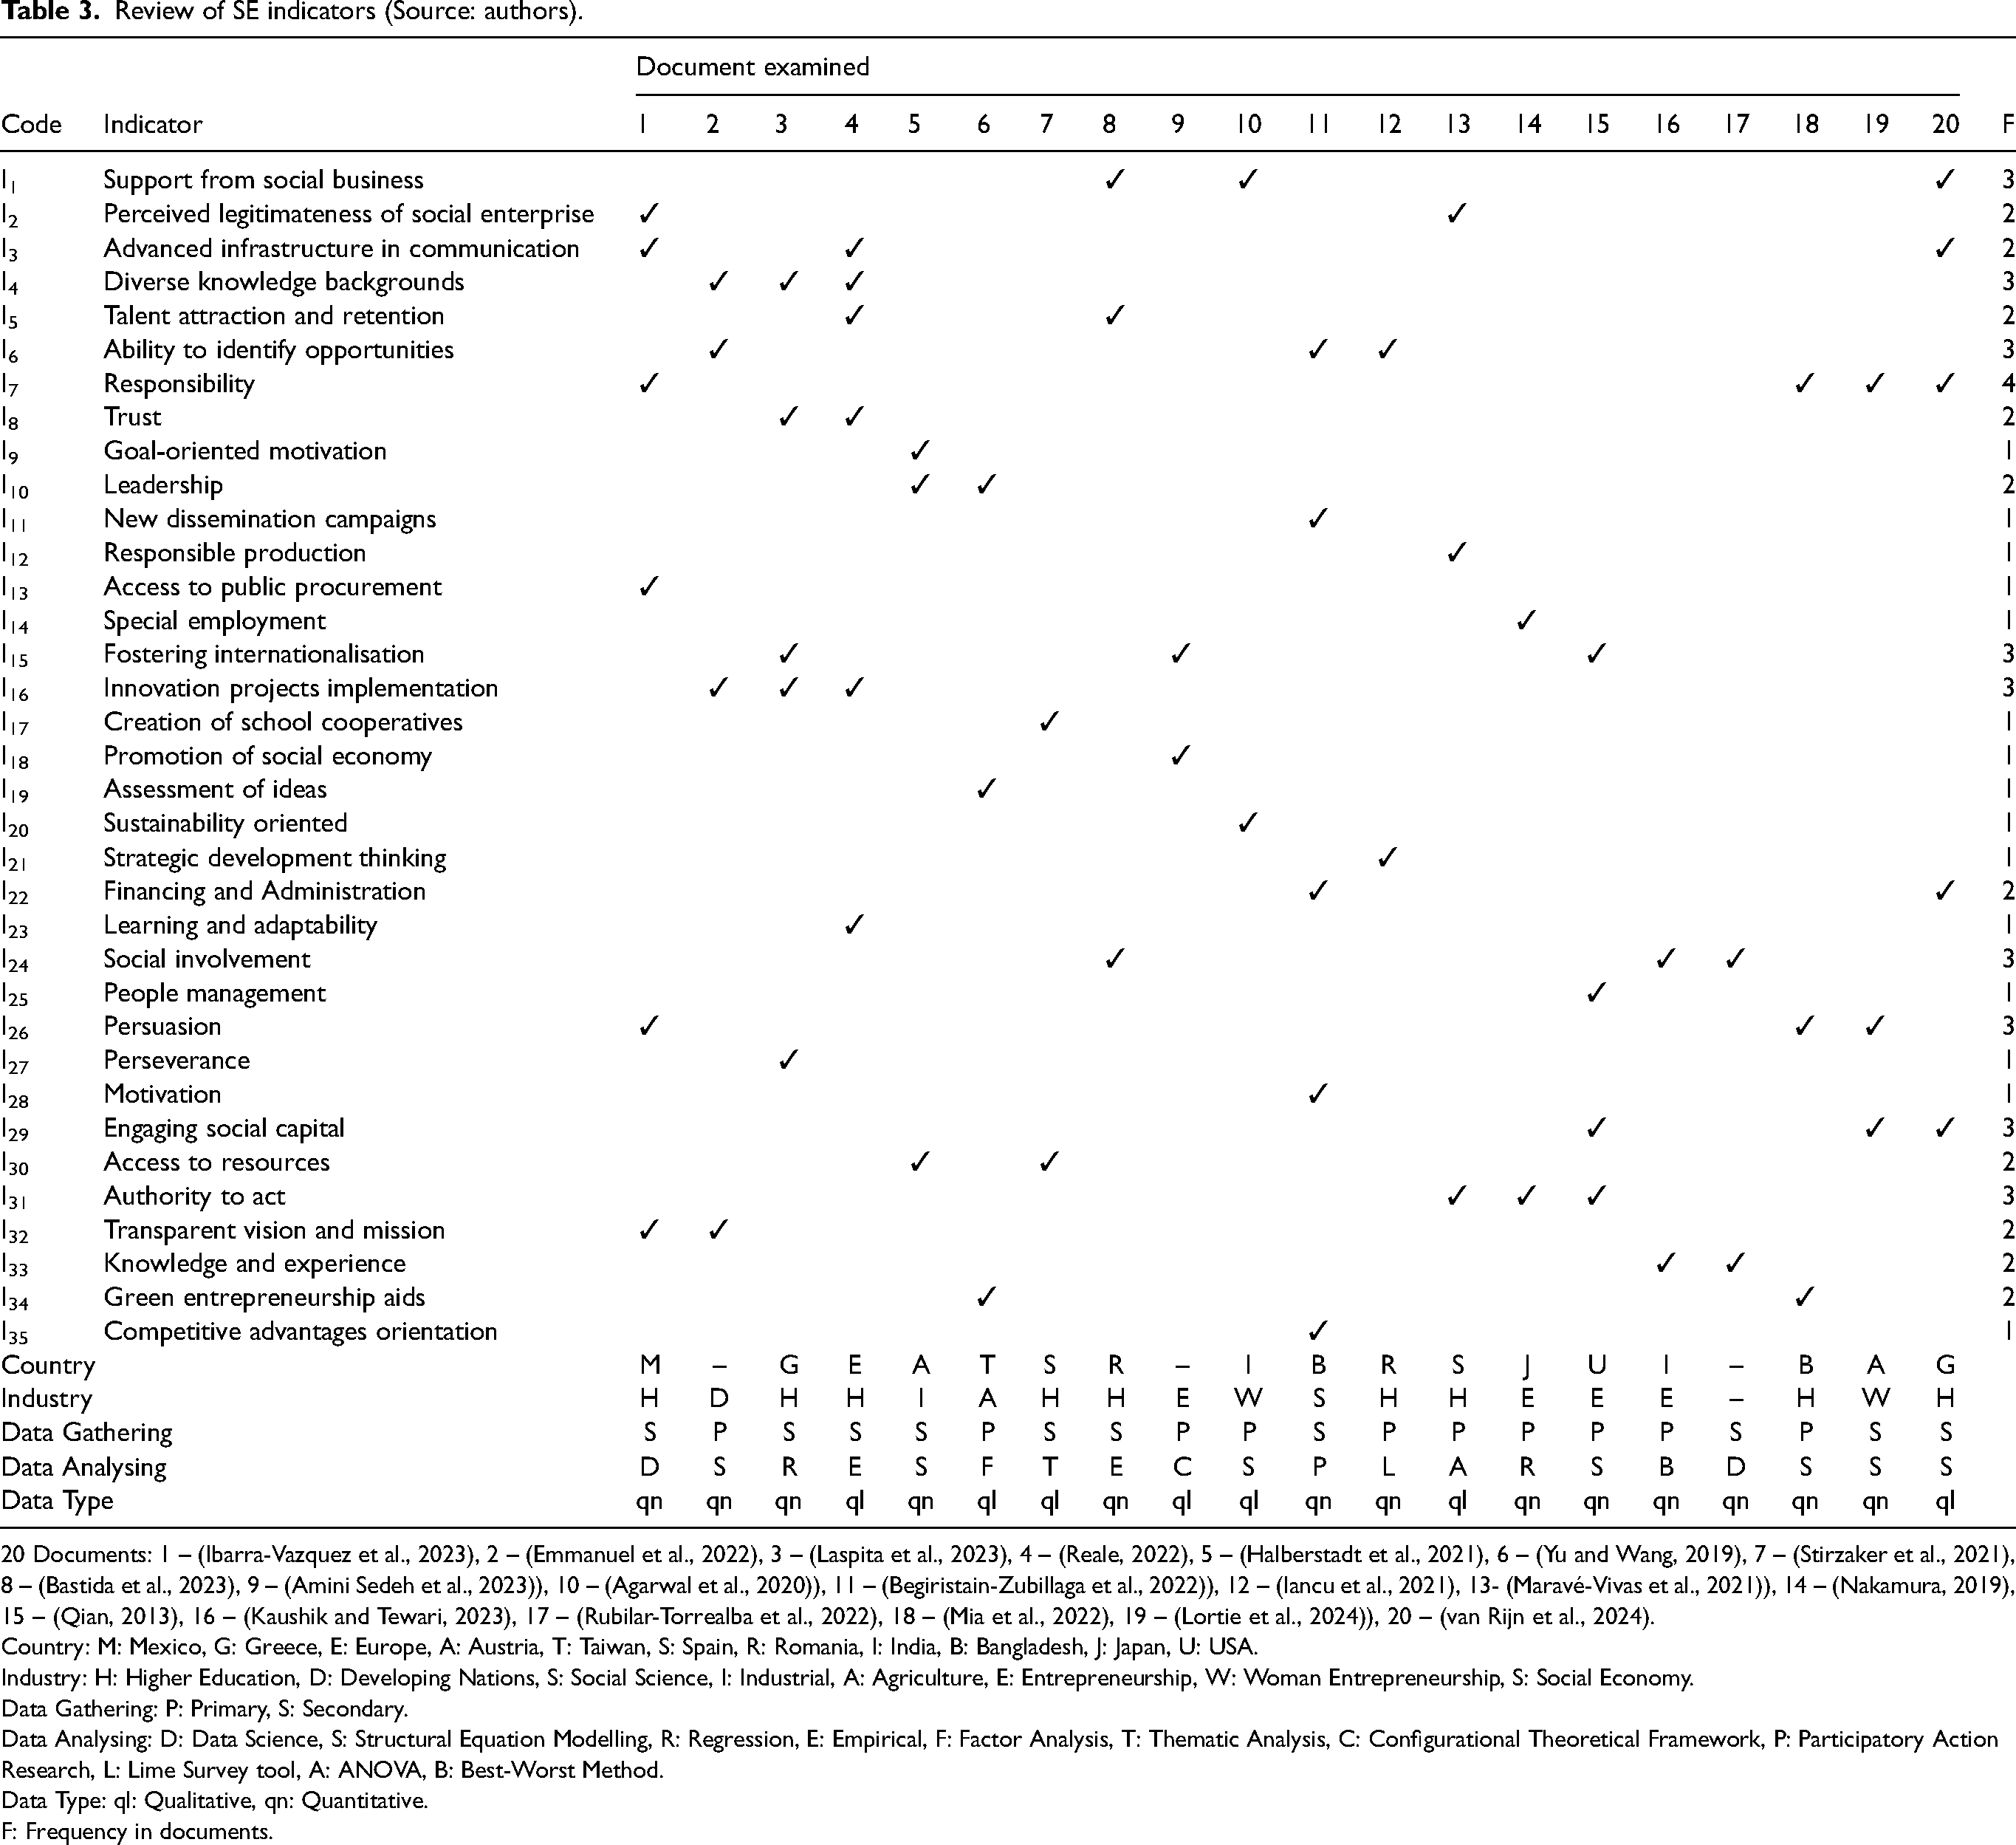
20 Documents: 1 – (Ibarra-Vazquez et al., 2023), 2 – (Emmanuel et al., 2022), 3 – (Laspita et al., 2023), 4 – (Reale, 2022), 5 – (Halberstadt et al., 2021), 6 – (Yu and Wang, 2019), 7 – (Stirzaker et al., 2021), 8 – (Bastida et al., 2023), 9 – (Amini Sedeh et al., 2023)), 10 – (Agarwal et al., 2020)), 11 – (Begiristain-Zubillaga et al., 2022)), 12 – (Iancu et al., 2021), 13- (Maravé-Vivas et al., 2021)), 14 – (Nakamura, 2019), 15 – (Qian, 2013), 16 – (Kaushik and Tewari, 2023), 17 – (Rubilar-Torrealba et al., 2022), 18 – (Mia et al., 2022), 19 – (Lortie et al., 2024)), 20 – (van Rijn et al., 2024).
Country: M: Mexico, G: Greece, E: Europe, A: Austria, T: Taiwan, S: Spain, R: Romania, I: India, B: Bangladesh, J: Japan, U: USA.
Industry: H: Higher Education, D: Developing Nations, S: Social Science, I: Industrial, A: Agriculture, E: Entrepreneurship, W: Woman Entrepreneurship, S: Social Economy.
Data Gathering: P: Primary, S: Secondary.
Data Analysing: D: Data Science, S: Structural Equation Modelling, R: Regression, E: Empirical, F: Factor Analysis, T: Thematic Analysis, C: Configurational Theoretical Framework, P: Participatory Action Research, L: Lime Survey tool, A: ANOVA, B: Best-Worst Method.
Data Type: ql: Qualitative, qn: Quantitative.
F: Frequency in documents.
According to Figure 3, the intersection of governance, science and personal competence is at the core of SE. In a study, (Wu et al., 2020) explored the relationship between ‘social entrepreneurship’, ‘social entrepreneur’ and ‘social enterprise’ and revealed that effective interactions of factors, such as social mission, resource management skills, entrepreneurial characteristics and form of entrepreneurship, lead to organisational sustainability and more significant impact. Moreover, social entrepreneurial commitment encompasses responsibility, trust and responsible production (Ibarra-Vazquez et al., 2023). Furthermore, sustainable indicators imply the importance of green activities, corporate social responsibility and also issues related to financing and administration, which lead to sustainable competitive advantages (Mishra et al., 2024).
Methodology
Given the absence of empirical research to ground this study, a multi-layer decision-making framework is developed within an uncertain and fuzzy environment. This innovative framework, specifically designed to evaluate the impact of SVCC strategies on indicators relevant to SE, stands out for its ability to provide a practical tool for managing uncertainties and imprecisions in decision-making processes related to SE. MCDM, a widely used method for selecting the best solution from various alternatives using quantitative and qualitative indicators, is extensively used by researchers due to its reliability and precision in resolving real-world challenges (Hashemkhani Zolfani et al., 2023). For instance, Kaushik and Tewari (2023) identified 13 SE indicators from previous literature and analysed them by applying a hybrid Delphi method. A panel of 24 experts from industry and academia across India then applied the best-worst method. Decision-making complexity is often compounded by ambiguity, where complete information is rarely available. To address this, Zadeh (1965) introduced the fuzzy set theory to account for the inherent ambiguity and uncertainty in complex systems. Fuzzy MCDM integrates MCDM methodologies with fuzzy set theory, providing a practical framework for effectively managing these complex problems. This approach enables decision-makers to address the uncertainties and imprecision inherent in decision contexts, thereby enhancing the robustness and applicability of decision-making processes (Erol et al., 2022). Figure 4 illustrates the general framework of the study. The next subsections describe the Fuzzy Delphi Method (FDM) and fuzzy cognitive map and decision making trial and evaluation laboratory (FCM-DEMATEL), as well as the SAW method.
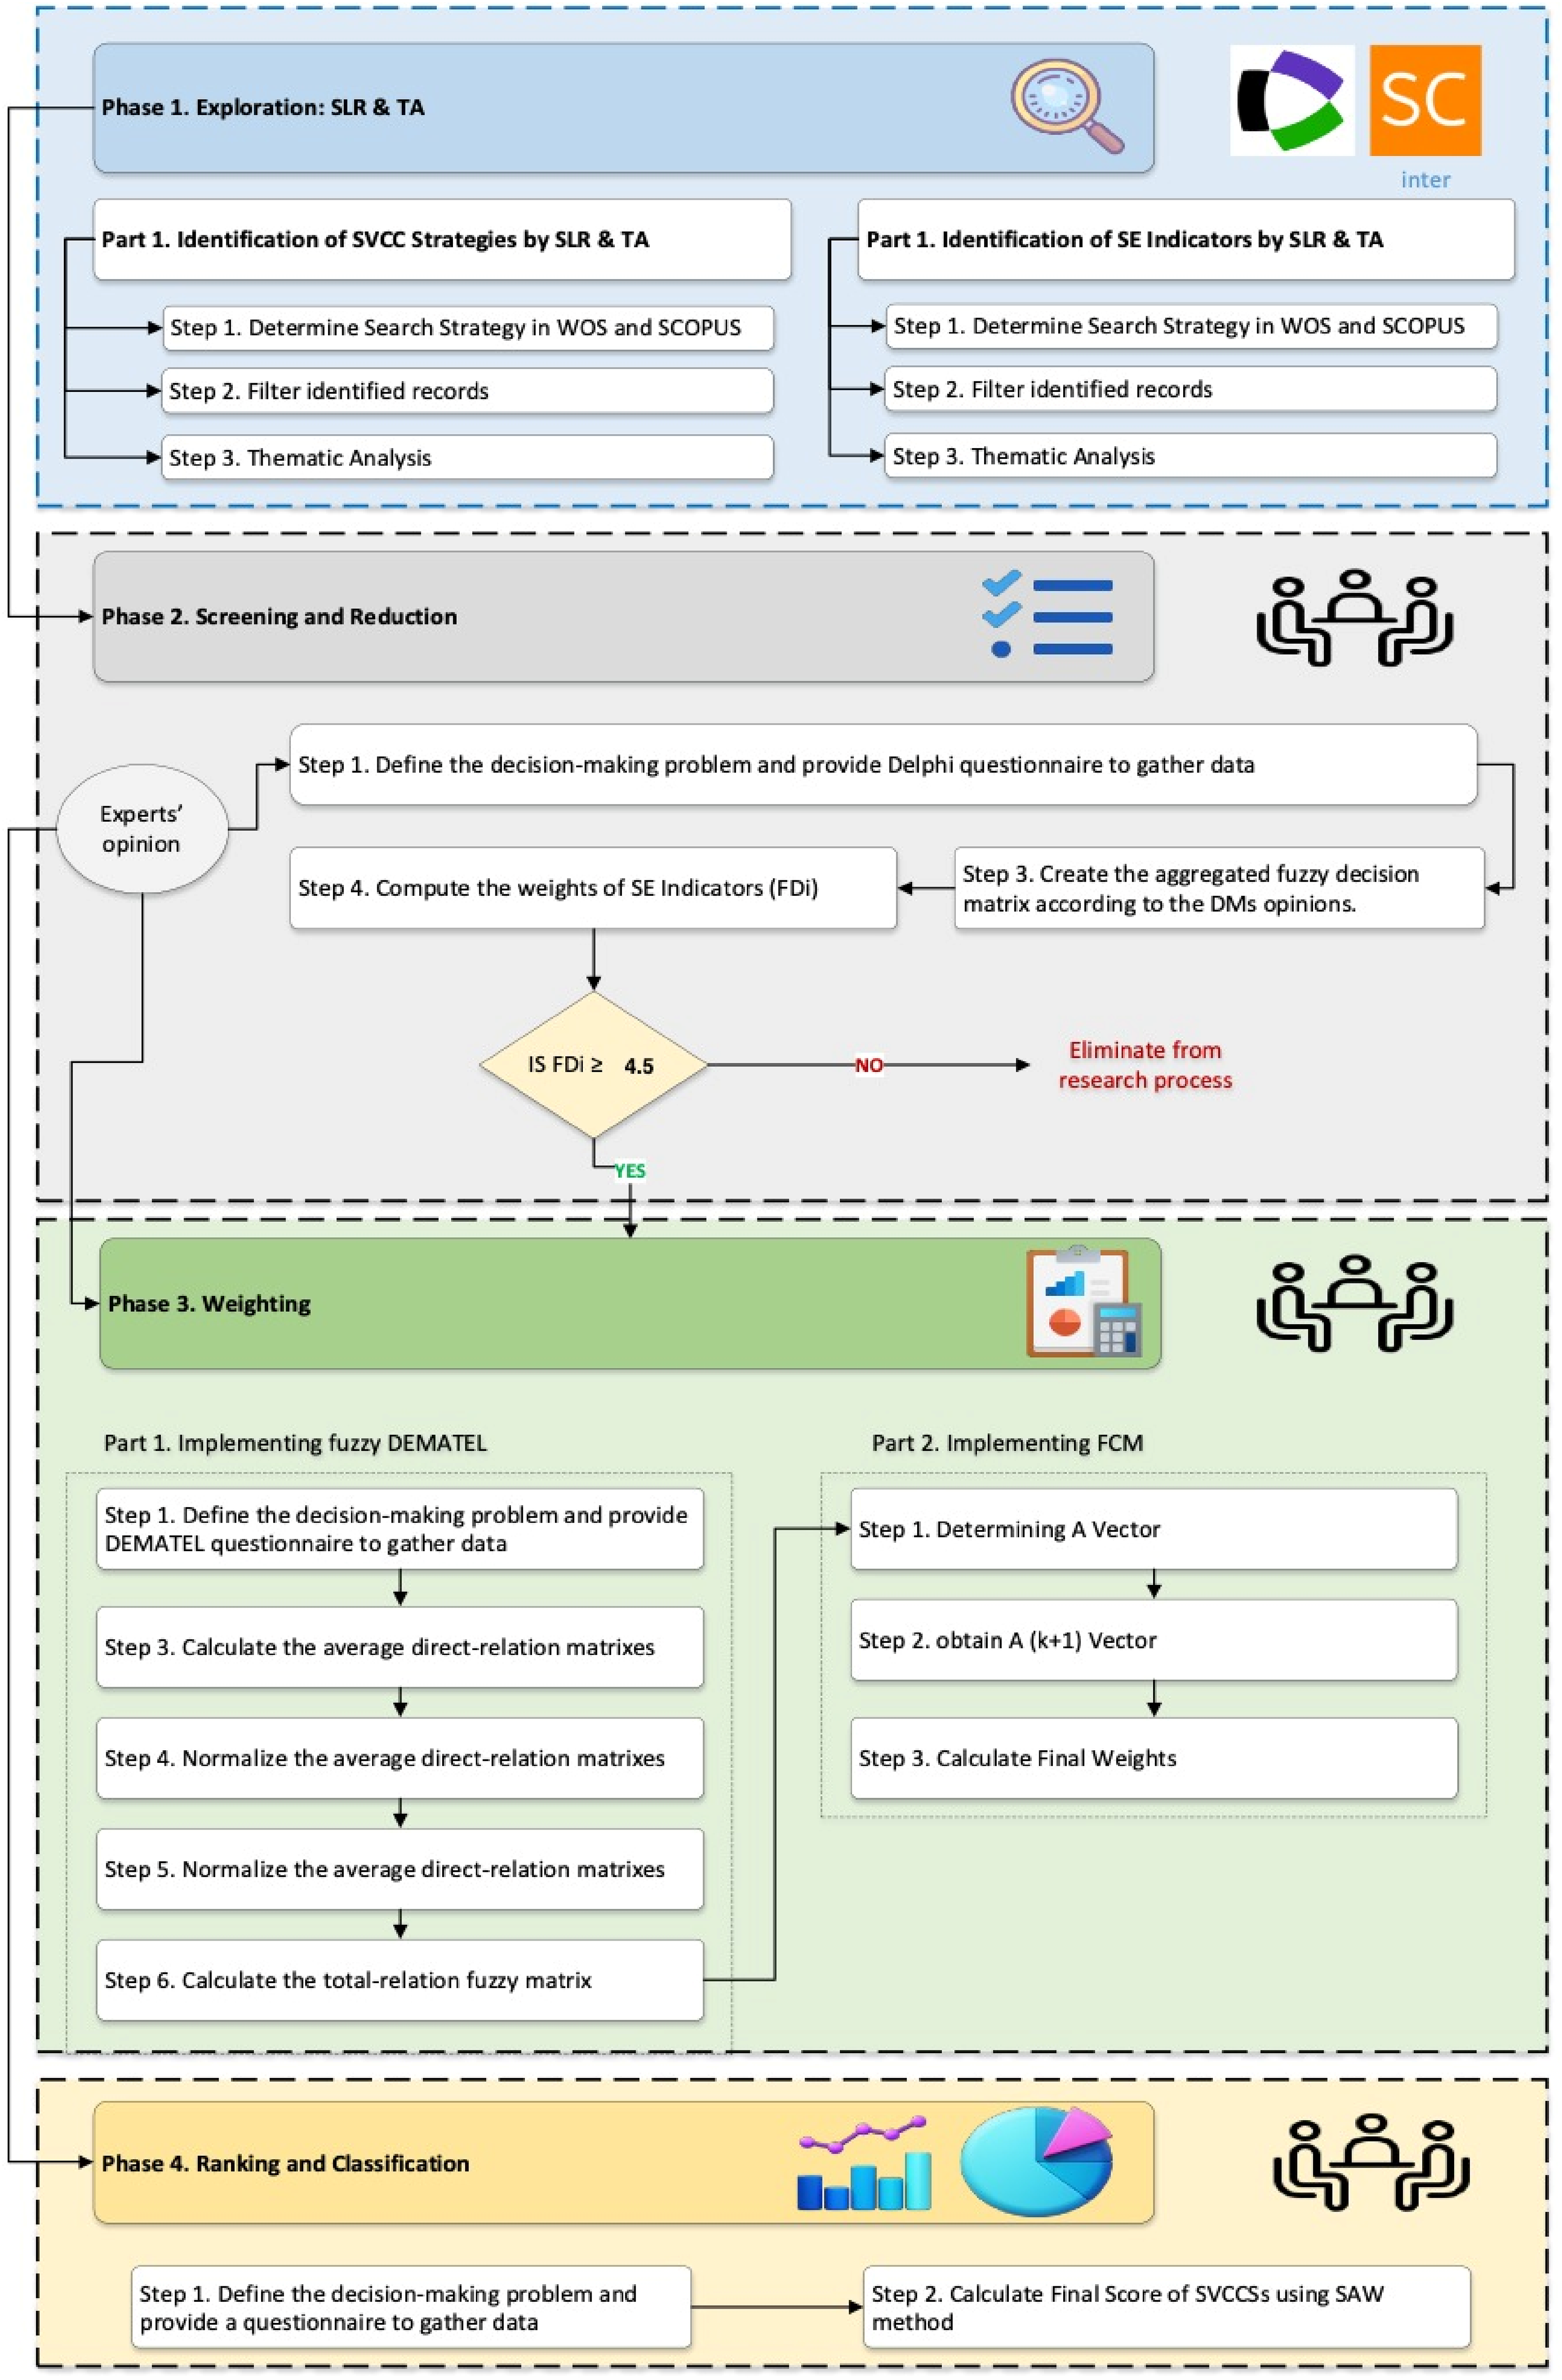
Research Framework (Source: authors).
Experts’ profile (Source: authors).
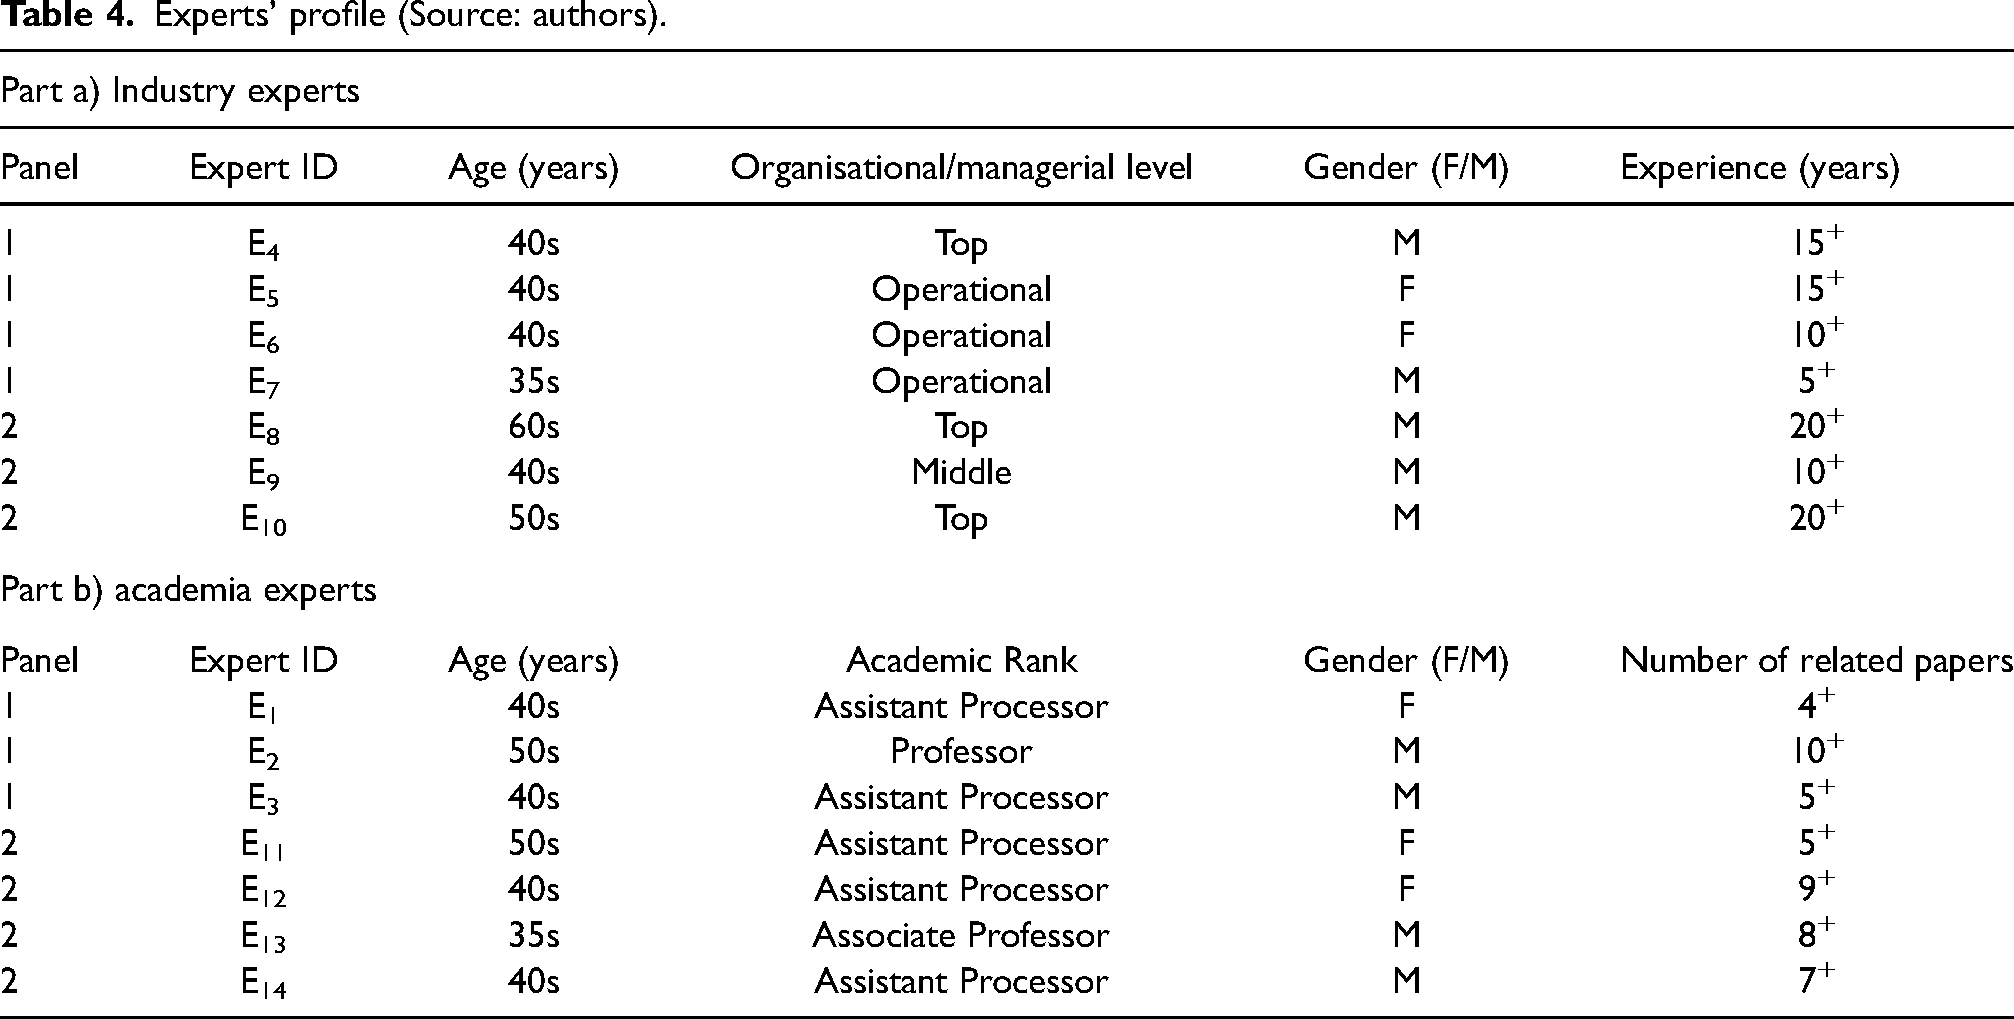
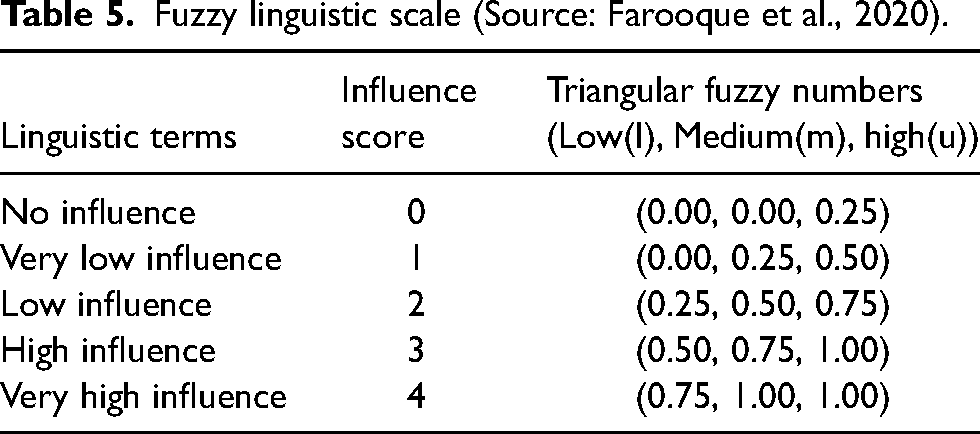
A precisely designed Fuzzy-Delphi questionnaire (Appendix 1) captured the experts’ opinions on the importance of the SE indicators. These questionnaires were distributed to the 14 experts and collected two weeks later. The responses were meticulously converted using the fuzzy value method, ensuring the accuracy and reliability of the data analysis and gauging the importance of each SE indicator. Similarly, after the Reduction phase in July-August 2024, data on the importance of the finalised SE indicators were collected using two expert panels through a DEMATEL questionnaire (Appendix 2). The process and panel composition were identical to those in the previous phase. The questionnaires were collected after two weeks, and the responses were converted using the Fuzzy value method, as detailed in Table 5. In addition to calculating the score of SVCC strategies, data on the role of SVCC strategies on finalised SE indicators were gathered in July–August 2024 using the same experts’ panels via a 5-point Likert scale questionnaire (Appendix 3). The questionnaires are collected after one week.
Fuzzy linguistic scale (Source: Farooque et al., 2020).
Let's assume a triangular fuzzy number (TFN) as
Step 1. After gathering the completed FDM questionnaires, calculate the fuzzy numbers of each indicator (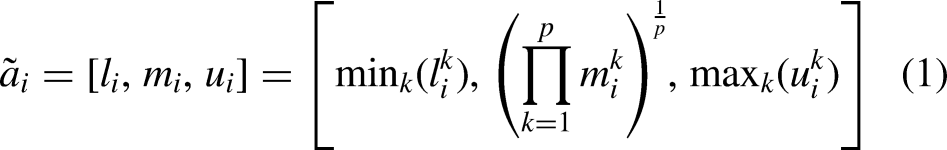
In Equation 1, k is the expert's index:
Step 2. To achieve consensus regarding the importance of SE indicators, the weighted centre of gravity 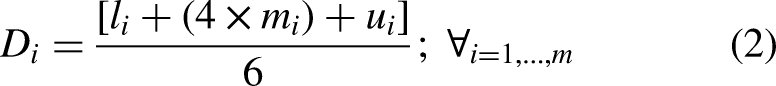
Step 3. If
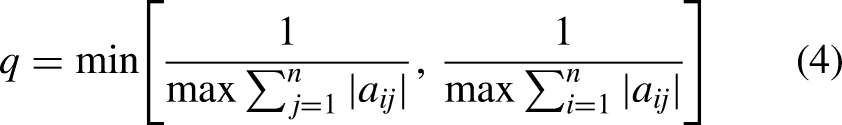

In Equation 4:

Simple Additive Weighting (SAW)
Churchman and Ackoff (1954) first defined the SAW method for the portfolio selection problem. Because of its simplicity, SAW is the most popular method for MADM problems (Vafaei et al., 2021). In this research, the following procedures were implemented for calculating the score of SVCC strategies. Our proposed SAW method is adopted from Jaberidoost et al. (2015) with the following steps:
Findings
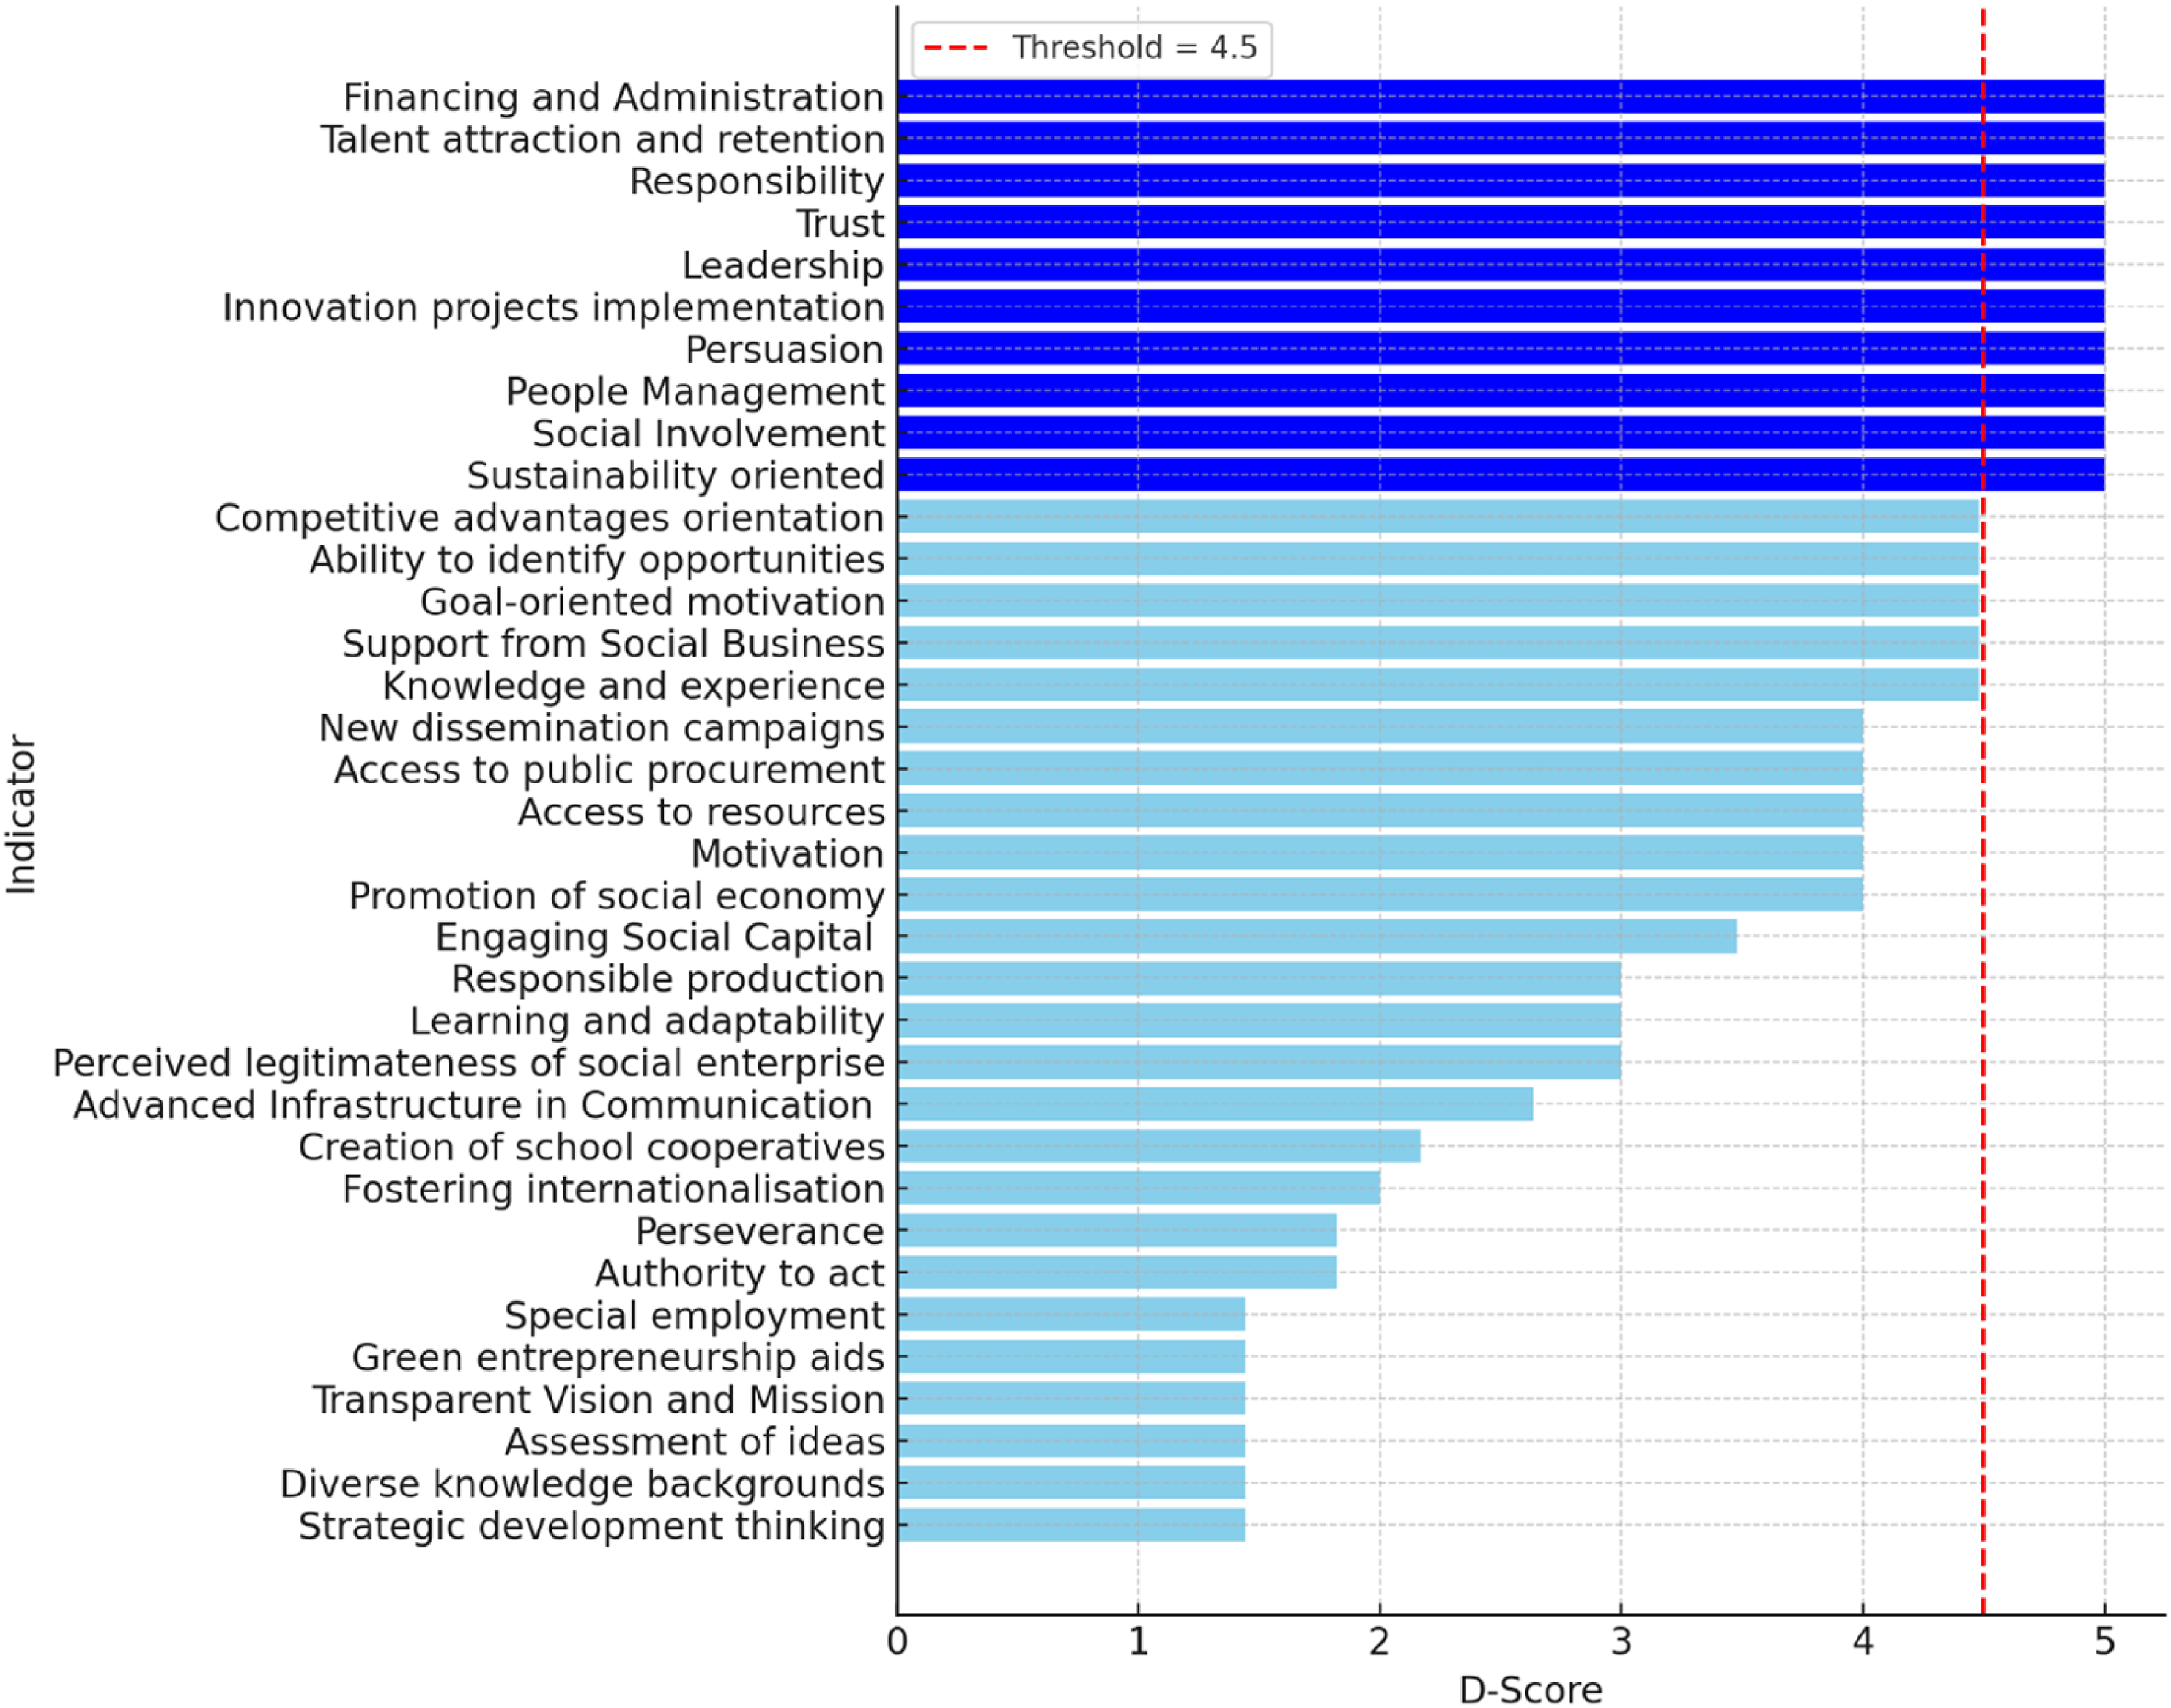
As the ‘Literature Review’ section states, the SPAR-4-SLR protocol for identifying SE indicators and SVCC strategies was employed, as presented in Tables 2 and 3, respectively. Due to the large number of indicators, the Fuzzy Delphi method was applied in the next section to reduce the number of indicators and select the most prominent ones. Recent research on SE indicators has been limited, as evidenced in Table 3. This systematic review identified various indicators with differing weights and significance. To address this issue and incorporate expert opinions, the Fuzzy Delphi method was employed, ensuring that the identified indicators align with SE and SVCC strategies. In the initial step of the Fuzzy Delphi method, experts from two panels rated the importance of 35 indicators using a 5-point Likert scale, where 1 indicated ‘Very Low Importance’, 2 indicated ‘Low Importance’, 3 indicated ‘Moderate’, 4 indicated ‘High Importance’, and 5 indicated ‘Very High Importance’. After collecting and converting these linguistic assessments into numerical data, Equations 1 and 2 in Excel were used to calculate the score for each indicator. The results of this analysis are presented in Figure 5, where the horizontal axis represents the indicators and the vertical axis displays the calculated scores.
Fuzzy Delphi experts’ integrated opinions for SE indicators (Source: authors).
According to Figure 5, a bold red line denotes a critical threshold of 4.5; indicators above this threshold are selected for the subsequent phase, while those scoring below are excluded from further consideration. As illustrated in Figure 5, ten of the 35 identified indicators were selected as the final SE indicators, with the remaining 25 being removed from the research process.
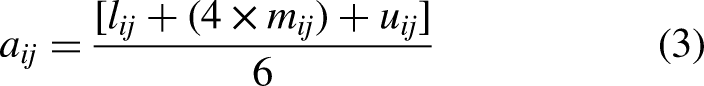
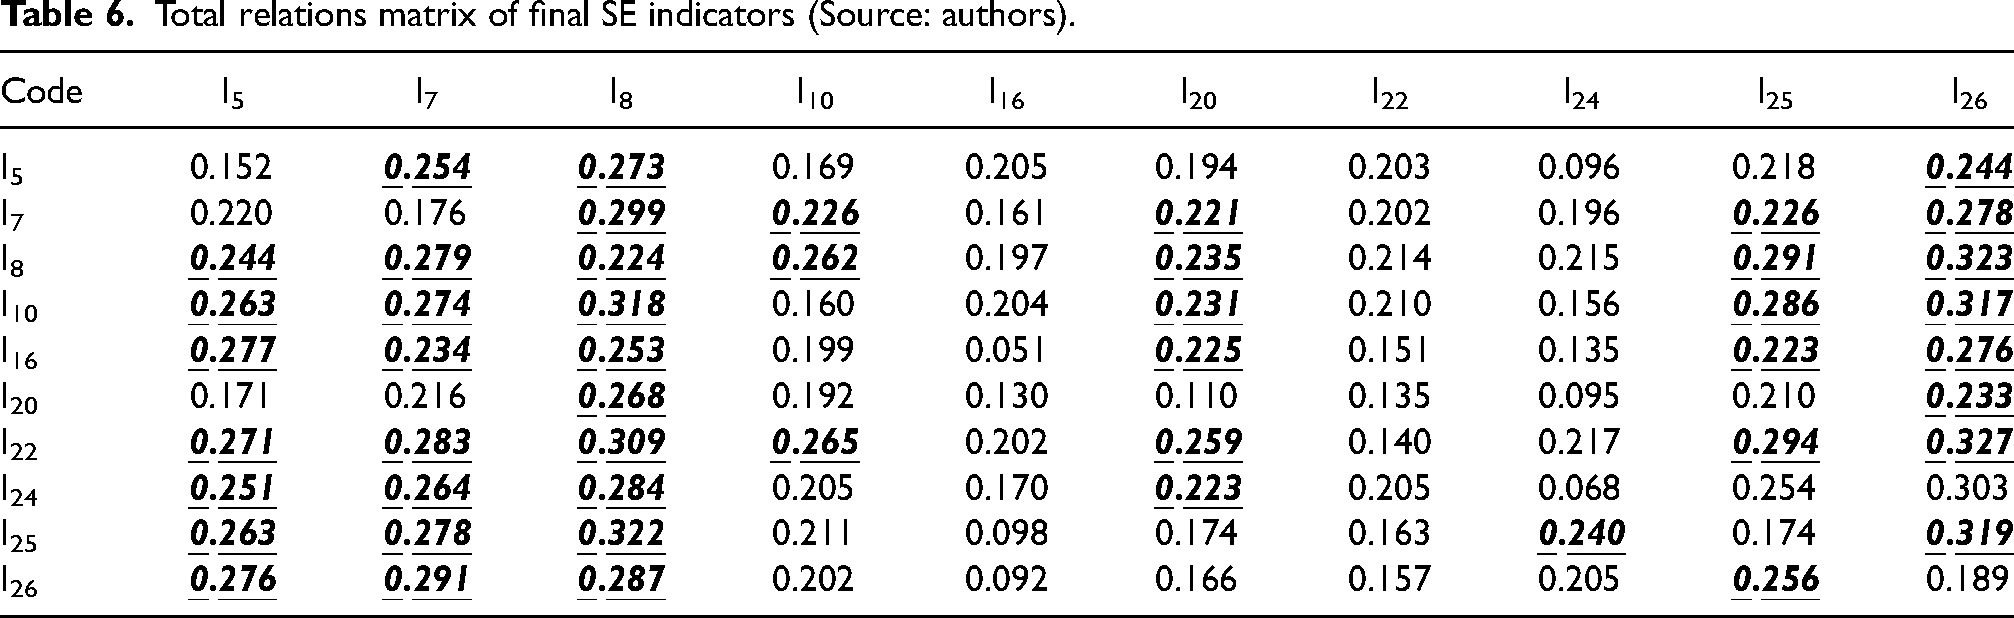
The Fuzzy DEMATEL-FCM method was implemented in the third phase to determine the finalised indicators’ weights and their causal relationship. Initially, the fuzzy DEMATEL method was applied to establish the total relations matrix (TRM), as shown in Table 6, which served as the input for the FCM method in the subsequent step. A pairwise DEMATEL questionnaire was distributed among two expert panels to collect the necessary data, as detailed in Table 4. The experts compared the ten final SE indicators (as a result of the Fuzzy Delphi stage) using a scale ranging from 0: No Influence (NI) to 4: VHI, with intermediate levels of VLI, LI and HI. All collected data were converted into triangular fuzzy numbers, as shown in Table 5. Then, Equations (3)–(6) (steps 2 to 5 in Fuzzy DEMATEL) are followed to achieve the TRM results, as presented in Table 6. In the DEMATEL method, TRM is a key component used to determine the cause-and-effect relationships among indicators in a decision-making framework (Wang et al., 2024). Based on the literature, TRM is analysed to map cause–effect chains, identify the most influential indicators (those with strong outgoing influences) and detect critical feedback loops (those with strong indirect effects). For instance, in Table 6, the value of
Total relations matrix of final SE indicators (Source: authors).
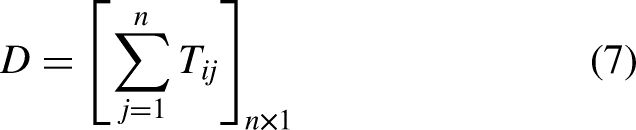
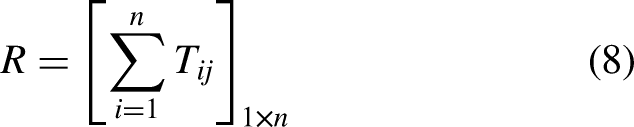
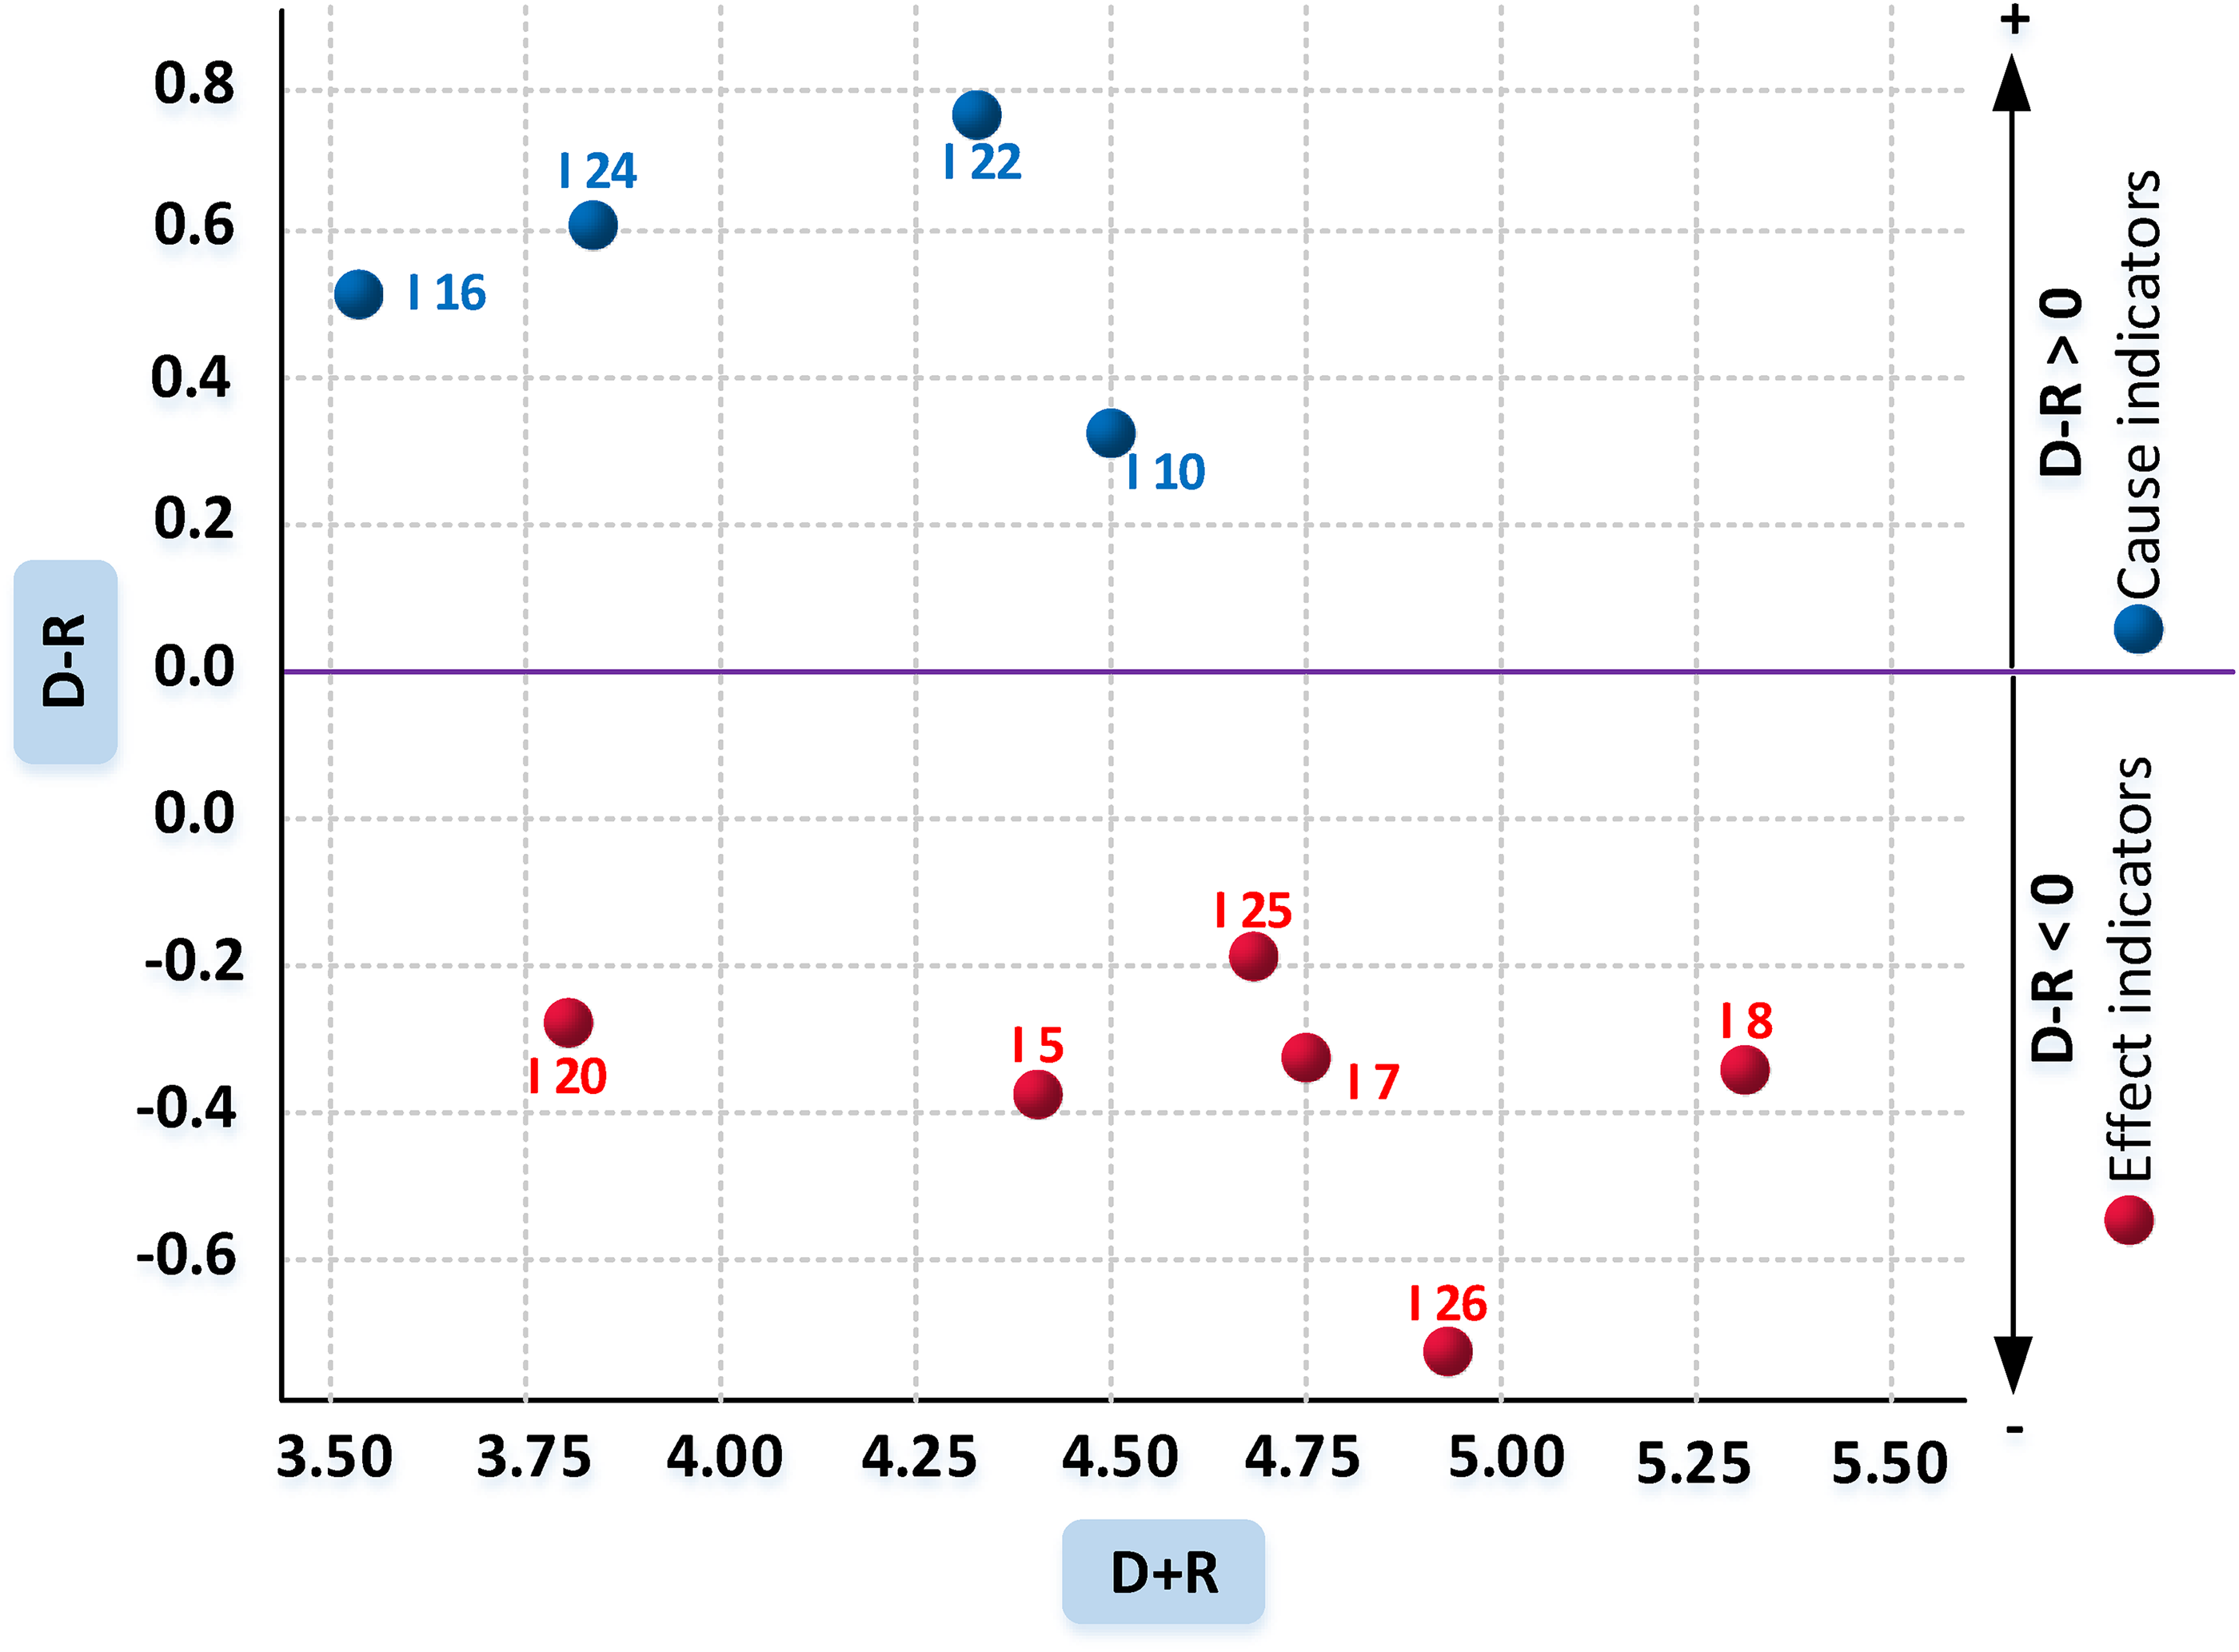
By following steps 5 and 6 of the Fuzzy DEMATEL process (Equations (6)–(8)) using Excel software, the final results are depicted in Figure 6. This figure's horizontal axis represents the
Graphical view of SE indicators cause–effect results (Source: authors).
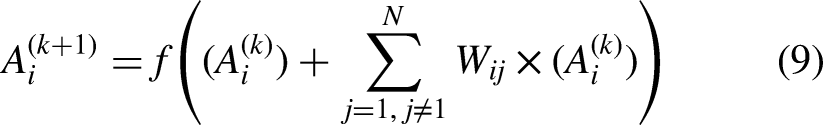
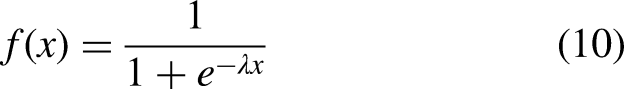
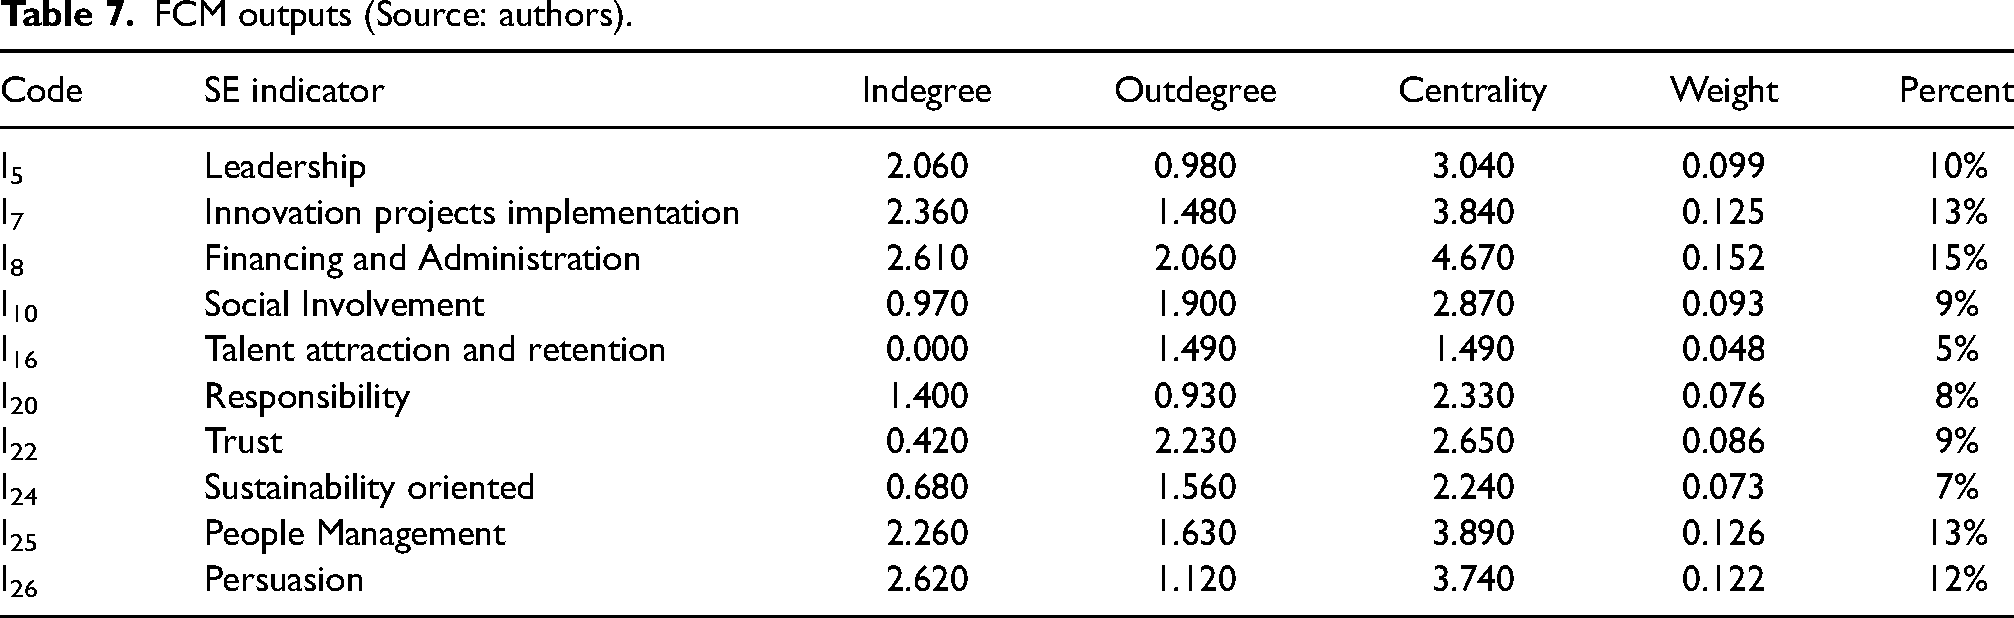
The FCM method was utilised with Mental Modeler software to determine the weights of the ten final SE indicators. This analysis produced a cognitive map and calculated the Indegree (I), Outdegree (O) and Centrality (C) indices for each indicator. Indegree represents the influence of a node (SE indicator) on another, Outdegree reflects the extent to which an indicator affects others and Centrality, the sum of Indegree and Outdegree, indicates the overall importance of each indicator within the map (Karatzinis et al., 2023). The final weights of the SE indicators were derived from these Centrality values through linear normalisation and are presented in the last column of Table 7. Following Equations (9) and (10), and based on these final weights, it can be concluded that I8 (Trust), I25 (People Management) and I7 (Responsibility) hold the greatest weight and importance.
FCM outputs (Source: authors).
Additionally, Figure 7 illustrates the cause-and-effect relationships among SE indicators, as extracted from the Mental Modeler software. This model comprises ten components, including one Driver Component and nine Ordinary Components, connected by 51 relationships. In this context, an Ordinary node is characterised by having both Indegree and Outdegree, indicating that it influences and is influenced by other components. In contrast, a Driver Component possesses only an Outdegree, meaning it solely influences other components without being influenced itself (Apostolopoulos et al., 2024).
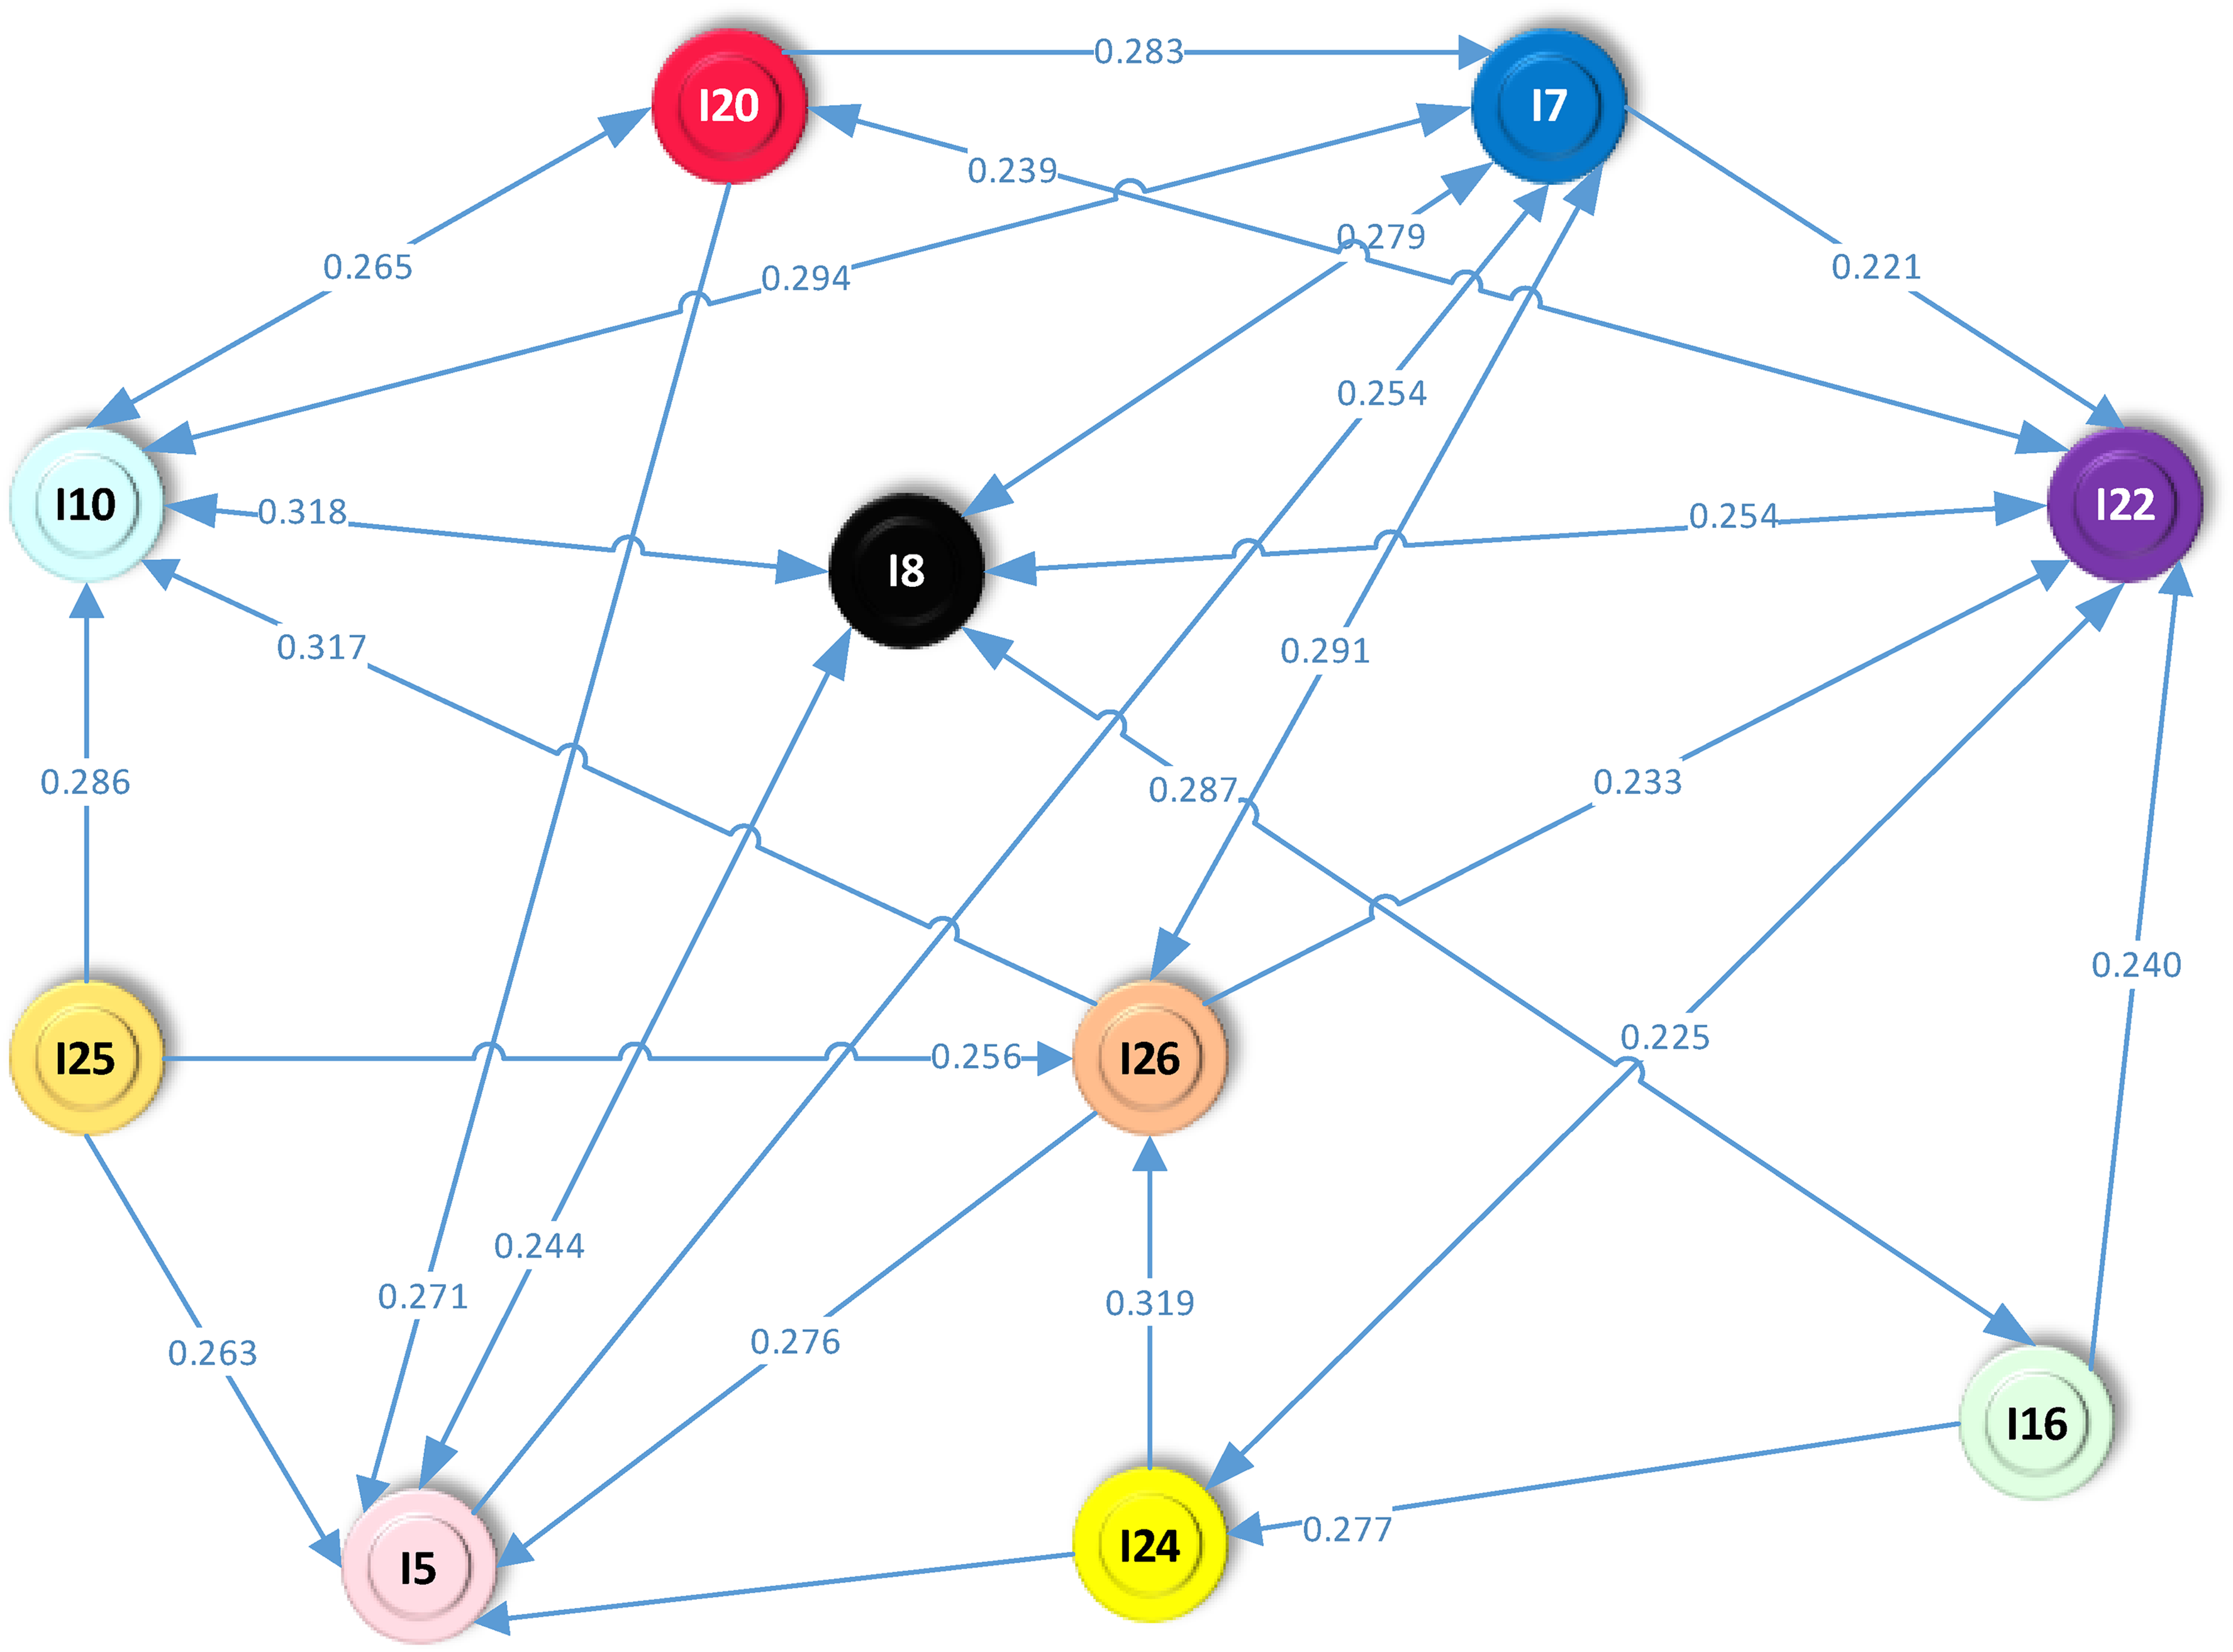
Cause and effect relations among SE indicators (Source: authors).
During the final phase of the research, the SAW method was employed to calculate the final score of SVCC strategies for two objectives: (i) ranking and (ii) classification. The necessary data for this phase were gathered from two expert panels. They were based on an assessment of the influence of SVCC strategies on the finalised ten SE indicators, using a scale ranging from 0: NI to 4: VHI, with intermediate levels of VLI, LI and HI. Data collected from 14 experts were converted into an average matrix using the formulas outlined in Step 2 of the SAW method. Subsequently, the weighted matrix was calculated by multiplying the average matrix with the SE indicators weight matrix. The final scores of the SVCC strategies were calculated by
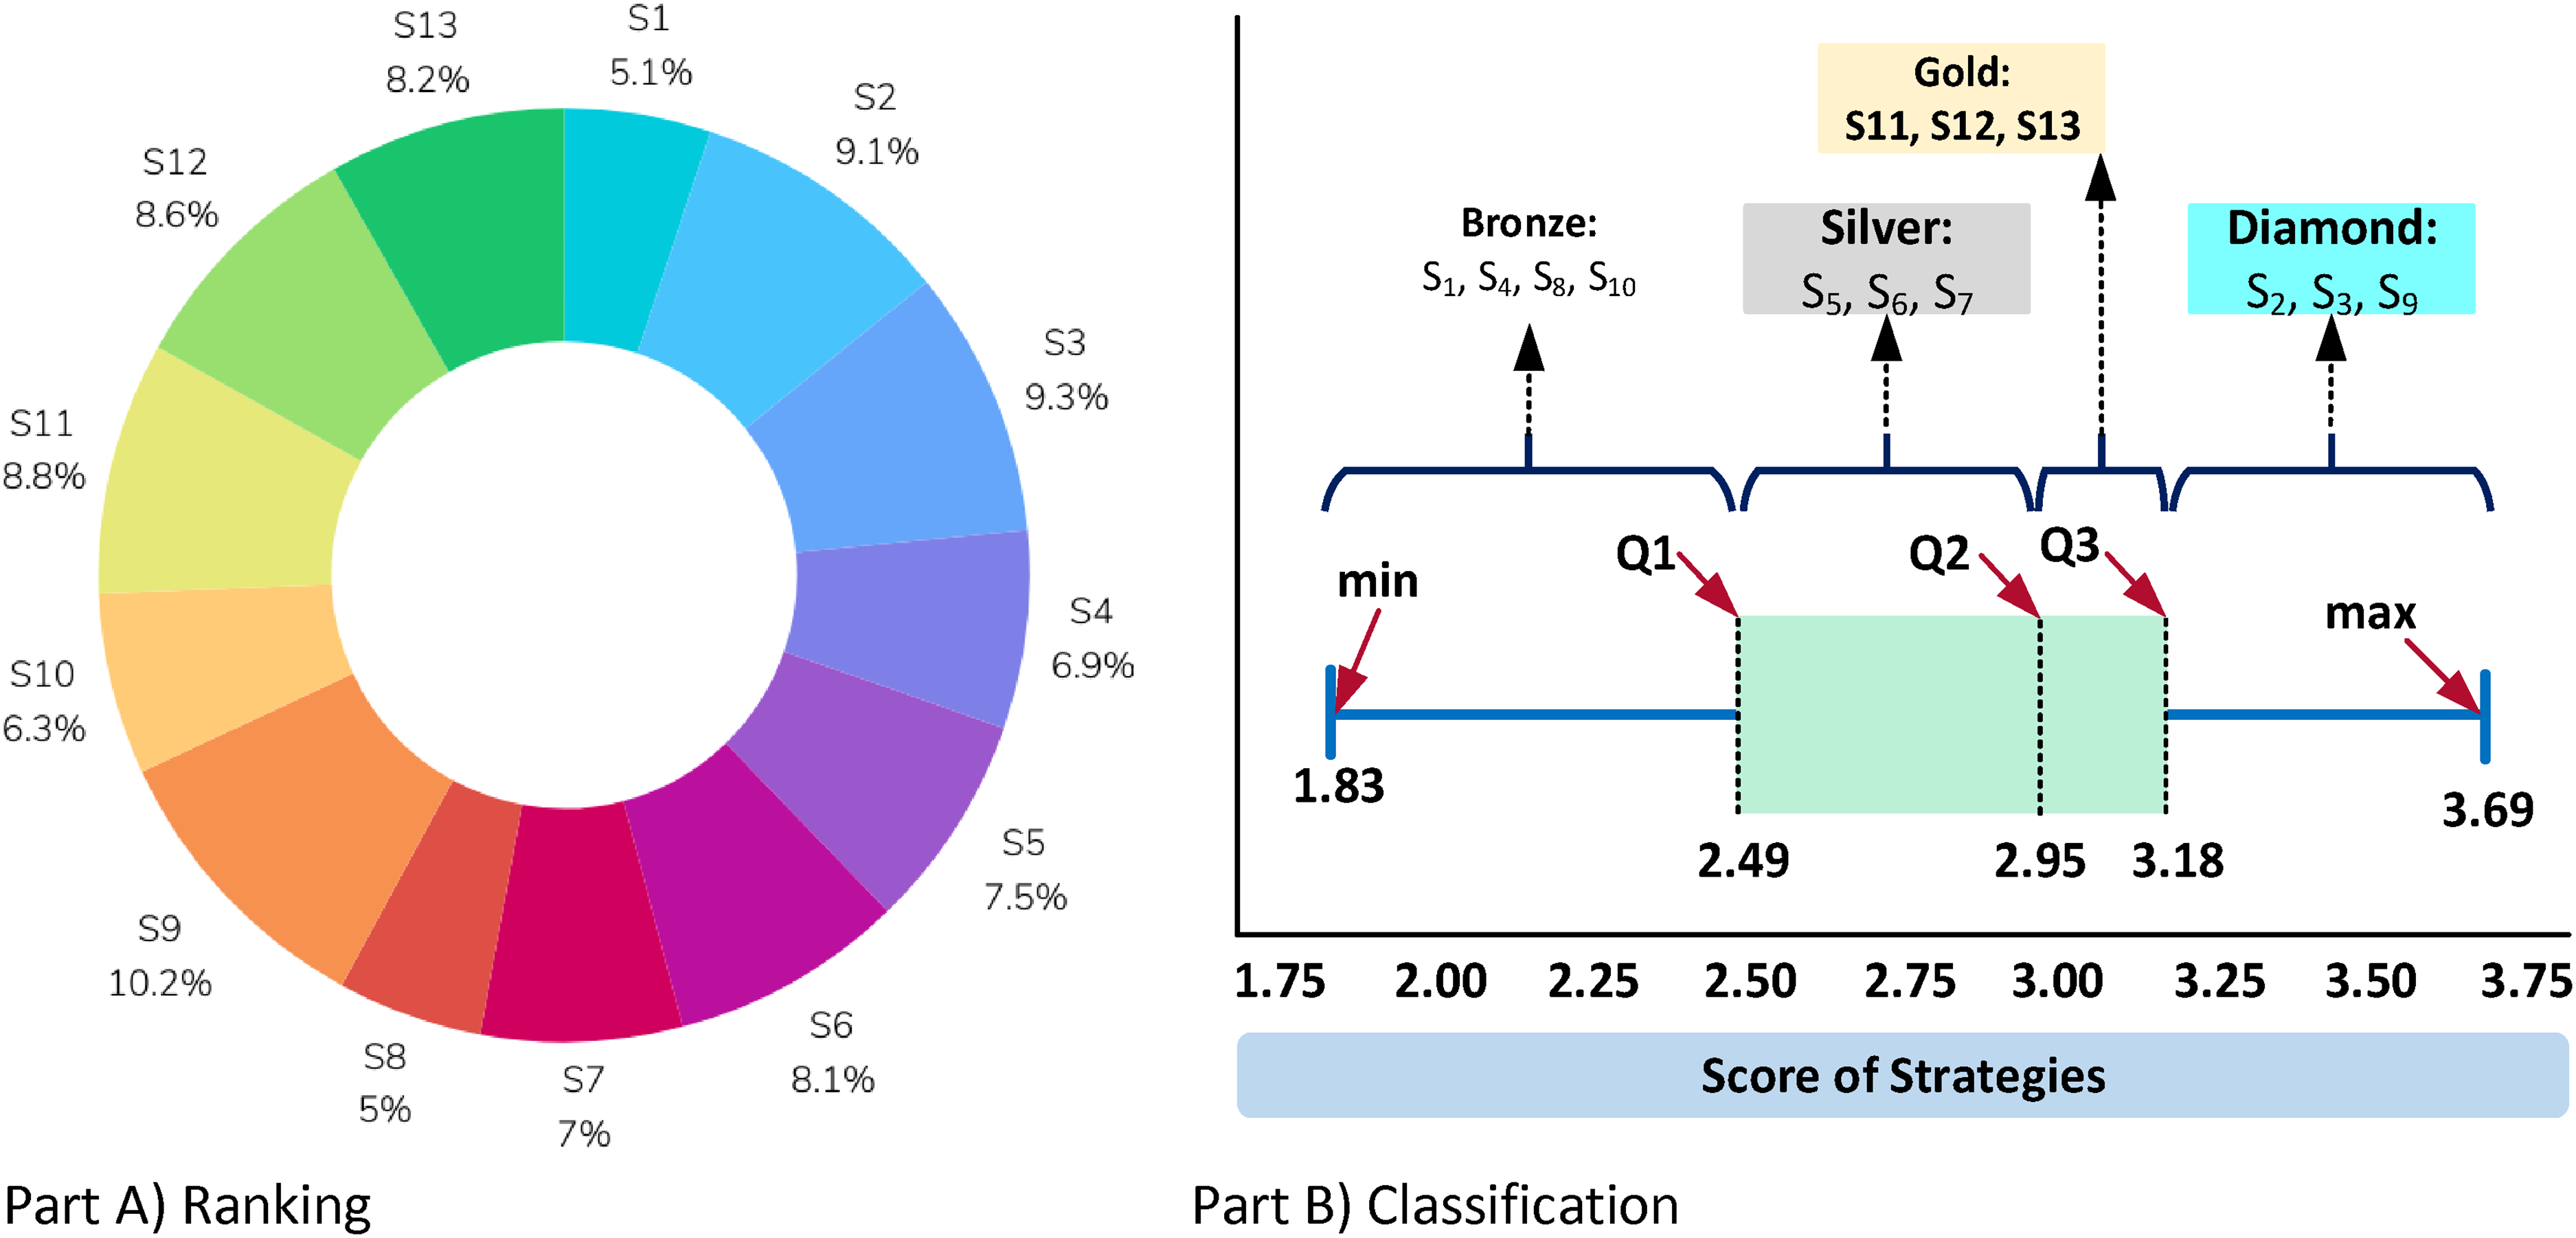
Ranking and classification of SVCC strategies (Source: authors). Part (A) Ranking, Part (B) Classification.
The results indicate that S9 (Willingness to embrace and reconcile divergent thinking and disruptive technologies), S3 (Pioneering events to design new models of value creation in business) and S2 (Creating spaces for bringing together ideas and talent across the ecosystem) received the highest scores, ranking 1st, 2nd and 3rd, respectively. In contrast, S10 (Long-term R&D investments), S1 (Detection of specific customer performance improvements and operational requirements) and S8 (Engine performance data captured in real-time) were prioritised in 11th, 12th and 13th positions, respectively. Additionally, the strategies were classified using Quartiles and Minimum, Q1, Q2, Q3 and Maximum indices based on the calculated scores. Four rules were applied to classify the SVCC strategies, as outlined below.
The analysis of the figures highlights that the most impactful indicators for an organisation or project are those with a D-Score exceeding the 4.5 threshold in Figure 5, including Financing and Administration (I22), Talent Attraction and Retention (I5), Responsibility (I7), Trust (I8) and Leadership (I10). These, alongside other critical indicators such as Innovation Projects Implementation (I10) and People Management (I25), should form the core focus areas for businesses aiming to drive meaningful and measurable outcomes. Furthermore, the network analysis presented in Figure 7 reveals that central indicators – particularly Trust (I8) – exert strong influence over other indicators, suggesting that enhancing trust can have a cascading effect on related elements, such as Persuasion (I26). However, Figure 6 indicates that some indicators with high D-Scores may exhibit negative DR-Indicator values, which could present challenges in practical implementation.
A key managerial implication is the need to prioritise these high-impact indicators while adopting a balanced strategic approach, as illustrated in Figure 8, where strategies S1 to S13 are relatively evenly distributed. Strategies such as S9 (10.2%) and S2 (9.1%) show slightly greater emphasis. For instance, if S9 corresponds to initiatives such as Investing in Leadership Development or Enhancing Financial Management, then increased resources should be allocated towards strengthening I22 (Financing and Administration) and I10 (Leadership). Similarly, if S2 pertains to Talent Development Programmes, it can directly support I5 (Talent Attraction and Retention). By concentrating efforts on leadership, trust and financial resilience – while anticipating implementation challenges and aligning strategic priorities – organisations can optimise performance and achieve sustainable, long-term growth.
SVCC Strategies are classified into four tiers, Bronze, Silver, Gold and Diamond, based on their impact on SE indicators, performance and alignment with SVCC establishment. Bronze strategies meet basic requirements with minimal impact and serve as foundational strategies. Silver strategies deliver moderate results that often address localised issues with limited scalability. Gold strategies achieve significant outcomes for SE and present broader applicability. Ultimately, Diamond's strategies are exceptional and have a transformative impact that aligns with the SVCC's mission and objectives. Quartile classification can justify the strategy tiers by statistically segmenting strategies based on performance metrics. The first class (
The classification of SVCC strategies into Bronze, Silver, Gold and Diamond categories reveals distinct priorities based on their weighted significance. The Diamond category, representing the highest-ranking strategies, includes S9 (Willingness to Embrace and Reconcile Divergent Thinking and Disruptive Technologies), S3 (Pioneering Events to design New Models of Value Creation in Business) and S2 (Creating Spaces for Bringing Together Ideas and Talent Across the Ecosystem). These strategies emphasise the critical importance of embracing innovation, fostering creativity and building collaborative ecosystems to drive sustainable value creation. Conversely, strategies in the Bronze category, which received lower priority, include S10 (Long-term R&D investments), S1 (Detection of specific customer performance improvements and operational requirements) and S8 (Real-time engine performance data capture), ranking 11th, 12th and 13th, respectively. These strategies, while still valuable, focus on foundational or operational aspects of co-creation, such as technical data analysis, long-term research planning and customer performance tracking (Bordian et al., 2023).
Discussion
This paper addresses a gap in the literature concerning SVCC implementation strategies by identifying indicators of SE based on the decision-making approach. To this end, a hybrid multi-layer decision-making model comprising four layers was employed: (i) exploration, (ii) screening and reduction, (iii) weighting and (iv) ranking and classification. The results of this study provide significant insights into identifying and prioritising indicators and SVCC strategies using a decision-making and multi-layered approach (Amoozad Mahdiraji et al., 2024b). Integrating the SLR-TA, Fuzzy Delphi, Fuzzy DEMATEL-FCM and SAW methods facilitates a reliable and comprehensive analysis, ensuring the final indicators and strategies are relevant and impactful (Patel et al., 2021). Furthermore, research highlights the multi-layered nature of SVCC, emphasising the integration of sustainability principles into value co-creation processes and the essential role of multi-stakeholder engagement (Beck et al., 2023). Meanwhile, the identification of 13 critical SVCC strategies provides a comprehensive framework for organisations aiming to enhance their sustainability efforts while simultaneously creating value for a broad range of stakeholders, including customers and business partners (Beck and Ferasso, 2023).
In the initial phase, 13 SVCC strategies were identified that emphasise the significance of customer-centric approaches, collaborative innovation and strategic planning for achieving sustainable outcomes (Bordian et al., 2023). For instance, strategies such as ‘Detection of specific customer performance improvements (S1)’ and ‘Voice of the customer events (S4)’ emphasise the importance of understanding and addressing customer needs as a foundation for sustainable value creation (Beck et al., 2023). Additionally, the inclusion of strategies such as ‘Fostering the co-creation of solutions through open innovation (S6)’ and ‘Collaboration with universities and a range of stakeholders (S13)’ underlines the essential role of cross-sector collaboration and the integration of diverse perspectives in driving innovation and sustainability (Barile et al., 2024). Meanwhile, employing the SLR-TA methodology to explore SE indicators aids in understanding the factors that drive SE. In the second phase, the application of the Fuzzy Delphi method resulted in the selection of ten key SE indicators from an initial set of 35, as determined by expert evaluations. A threshold value of 4.5 effectively filtered out less critical indicators, ensuring the significance of the selected ones. This process highlights the importance of expert judgement in refining and focusing on the most relevant SE indicators. The finalised indicators, such as ‘trust’, ‘people management’ and ‘responsibility’, align with the core values and operational needs of SE, highlighting the importance of human-centric and ethical considerations within these organisations (Lortie et al., 2024).
In the third phase, the Fuzzy DEMATEL-FCM analysis further enhanced our understanding of the relationships among these indicators. The identification of ‘Leadership’, ‘Innovation Projects Implementation’, ‘Financing and Administration’ and ‘Social Involvement’ as Cause indicators underlines their crucial role in influencing other aspects of SE performance. The distinction between cause-and-effect indicators offers practical insights for managers and policymakers, suggesting that interventions targeting cause indicators could lead to widespread improvements across various dimensions of SE activity (García-Jurado et al., 2021; Hietschold et al., 2023). Figure 7 illustrates four key relationships among the primary indicators that contribute to establishing an SVCC. The first relationship suggests that enhancing People Management (I25) has a unique and central role in influencing Persuasion (I26), which can contribute to the implementation of the Innovation project (I7). Persuasive technologies for health-related behaviour change raise ethical concerns (Jacobs, 2020). People management drives innovation project implementation by fostering a culture of creativity, collaboration and psychological safety. Managers address resistance to change with transparent communication and adaptive strategies (Wilden et al., 2023). Moreover, generalised trust represents an important regional resource for a firm. It can be increased by innovative project implementation (Bischoff et al., 2023). Consequently, two propositions can be highlighted as below:
In implementing SVCC strategies, people management has a significant impact on innovation project implementation through the mediating role of persuasive technologies.
Persuasion has a significant impact on trust through the implementation of innovation projects.
Further to the above relations, there is a significant relationship between leadership (I5), talent attraction and retention (I16), sustainability-oriented (I24) and persuasion (I26). The dependent indicator is talent attraction and retention. (Mujtaba and Mubarik, 2022), in a study showed a significant direct impact of talent attraction on organisational sustainability. In addition, sustainable leadership is a new domain of effective leadership, recognised recently for coping with issues related to SVCC (Iqbal and Ahmad, 2021). To conclude, the other two propositions are highlighted below:
Talent attraction and retention have a significant impact on sustainability through their mediating role in persuasion.
Talent attraction and retention have a significant impact on trust through their mediation role in persuasion.
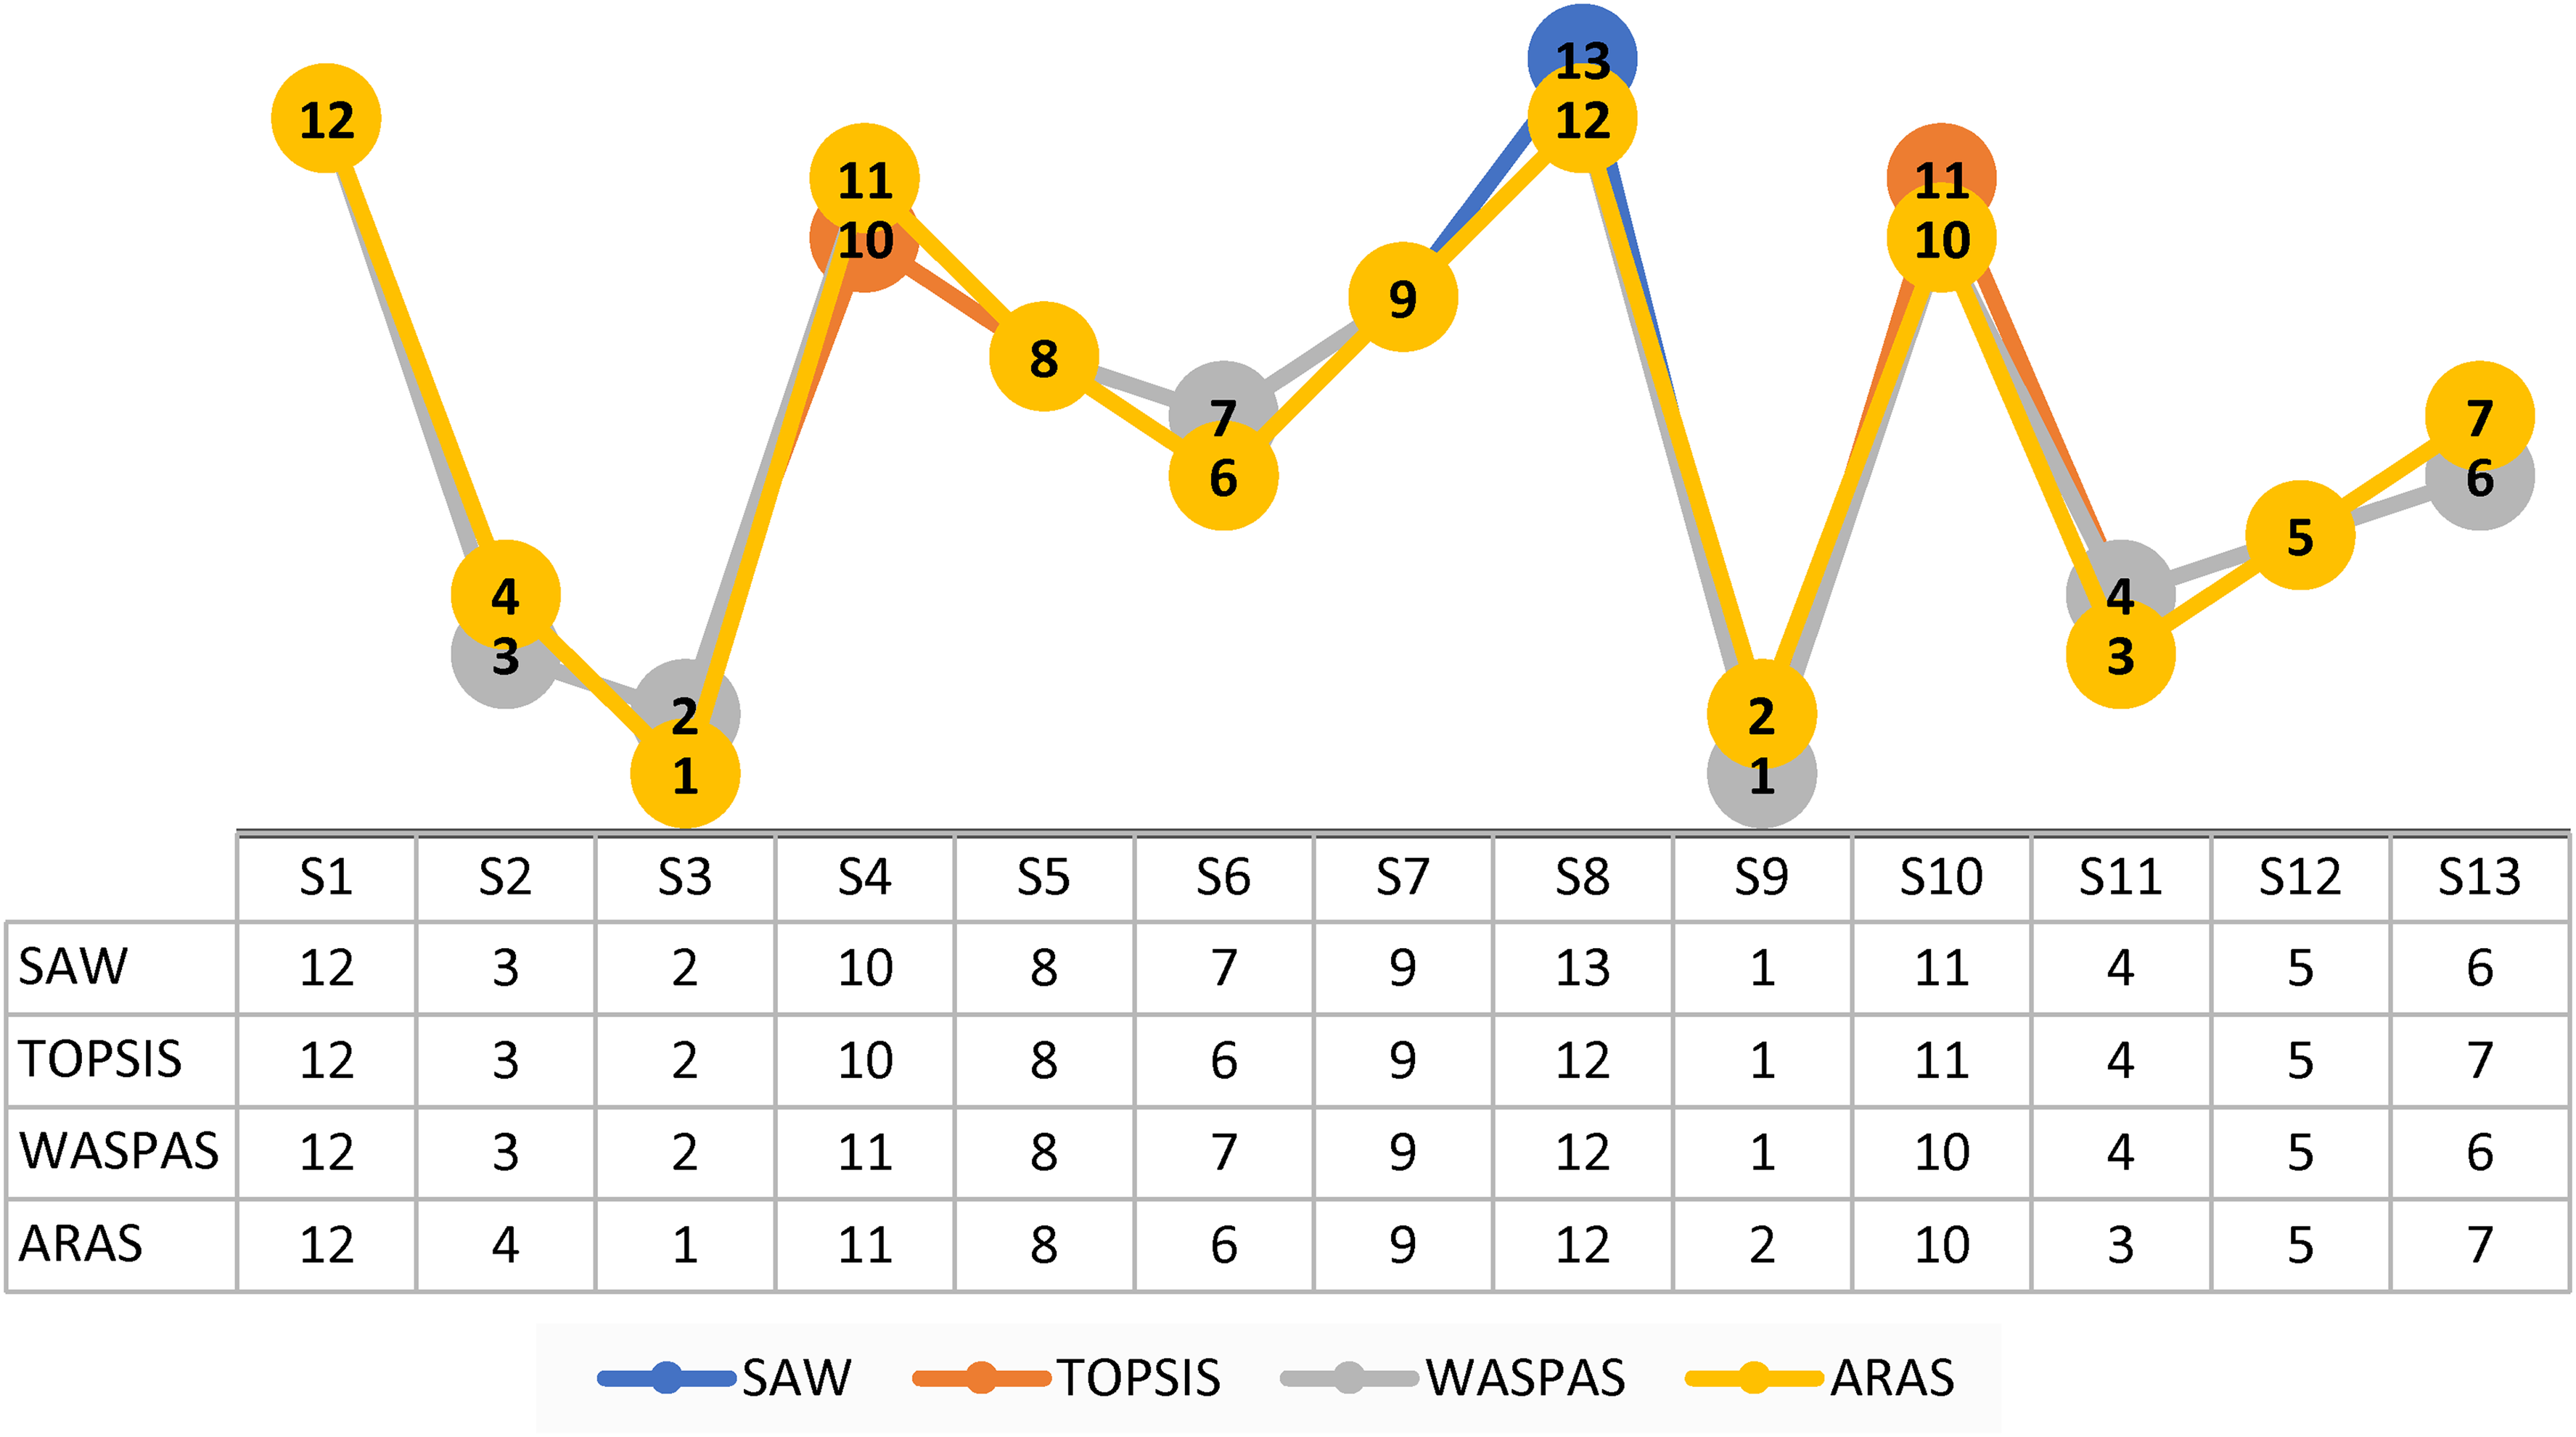
In the final phase, applying the SAW method allowed for the ranking and classification of SVCC strategies. The top-ranked strategies, such as ‘Willingness to Embrace and Reconcile Divergent Thinking and Disruptive Technologies (S9)’, underscore a clear preference for innovative and forward-thinking approaches in corporate value creation efforts. The classification into Diamond, Gold, Silver and Bronze categories provides a structured framework for organisations to prioritise their strategic initiatives. To ensure our ranking using the SAW method, three other MCDM methods are employed, including TOPSIS (Xie et al., 2024), ARAS (Yücenur and Maden, 2024) and WASPAS (Akmaludin et al., 2024). The results and rankings of each SVCC strategy, based on three named methods and their differences with the SAW method, are presented in Figure 9. The figure illustrates that for strategies S1, S5, S7 and S10, the rankings are quite consistent across all four methods, as indicated by the similar ranks within the group. Other strategies, such as S4, S6 and S13, exhibit greater variability in rankings across the different methods. Additionally, strategies S1 and S8 are consistently ranked lowest by most methods, while S3, S11 and S12 generally achieve higher rankings.
Results of different MADM methods for ranking SVCC strategies (Source: authors).
These findings have several practical implications. Concentrating on the identified cause indicators for SE could significantly enhance organisational performance (García-Jurado et al., 2021). Furthermore, the SVCC strategies ranking insights can guide corporate decision-makers in aligning their business strategies with broader social value creation objectives (Lortie et al., 2024). The clear categorisation of strategies into tiers provides a straightforward tool for prioritisation, especially for organisations seeking to maximise their social impact with limited resources (Beck et al., 2023).
Figure 10 presents a heat map illustrating the impact of SVCC strategies on SE indicators. The vertical axis represents the strategies, while the horizontal axis corresponds to the indicators. The values, ranging from 0.07 to 0.60, reflect the degree of impact based on expert opinions gathered during the fourth phase of the study. This figure enables a comparative analysis of the performance of various strategies across a consistent set of indicators. Certain strategies, such as S9 and S11, demonstrate a higher impact (e.g. 0.60) on specific indicators, whereas others, such as S8, exhibit a lower level of impact (e.g. 0.12). The heatmap visually reinforces the alignment between strategy classifications and their quantitative impact scores. Diamond-tier strategies (S2, S3, S9) are represented by the darkest cells, with values ranging from 0.45 to 0.60, particularly across critical indicators such as I8 and I25, underscoring their superior performance. Gold-tier strategies (S11–S13) consistently achieve high scores (above 0.5) across multiple indicators, while Bronze-tier strategies (S1, S8) are associated with the lightest cells (values below 0.3), reflecting their comparatively limited influence. This clear visual correlation, where darker cells systematically align with higher strategic tiers, provides strong validation of the classification system, confirming that it accurately represents the relative impact strength of each strategy.
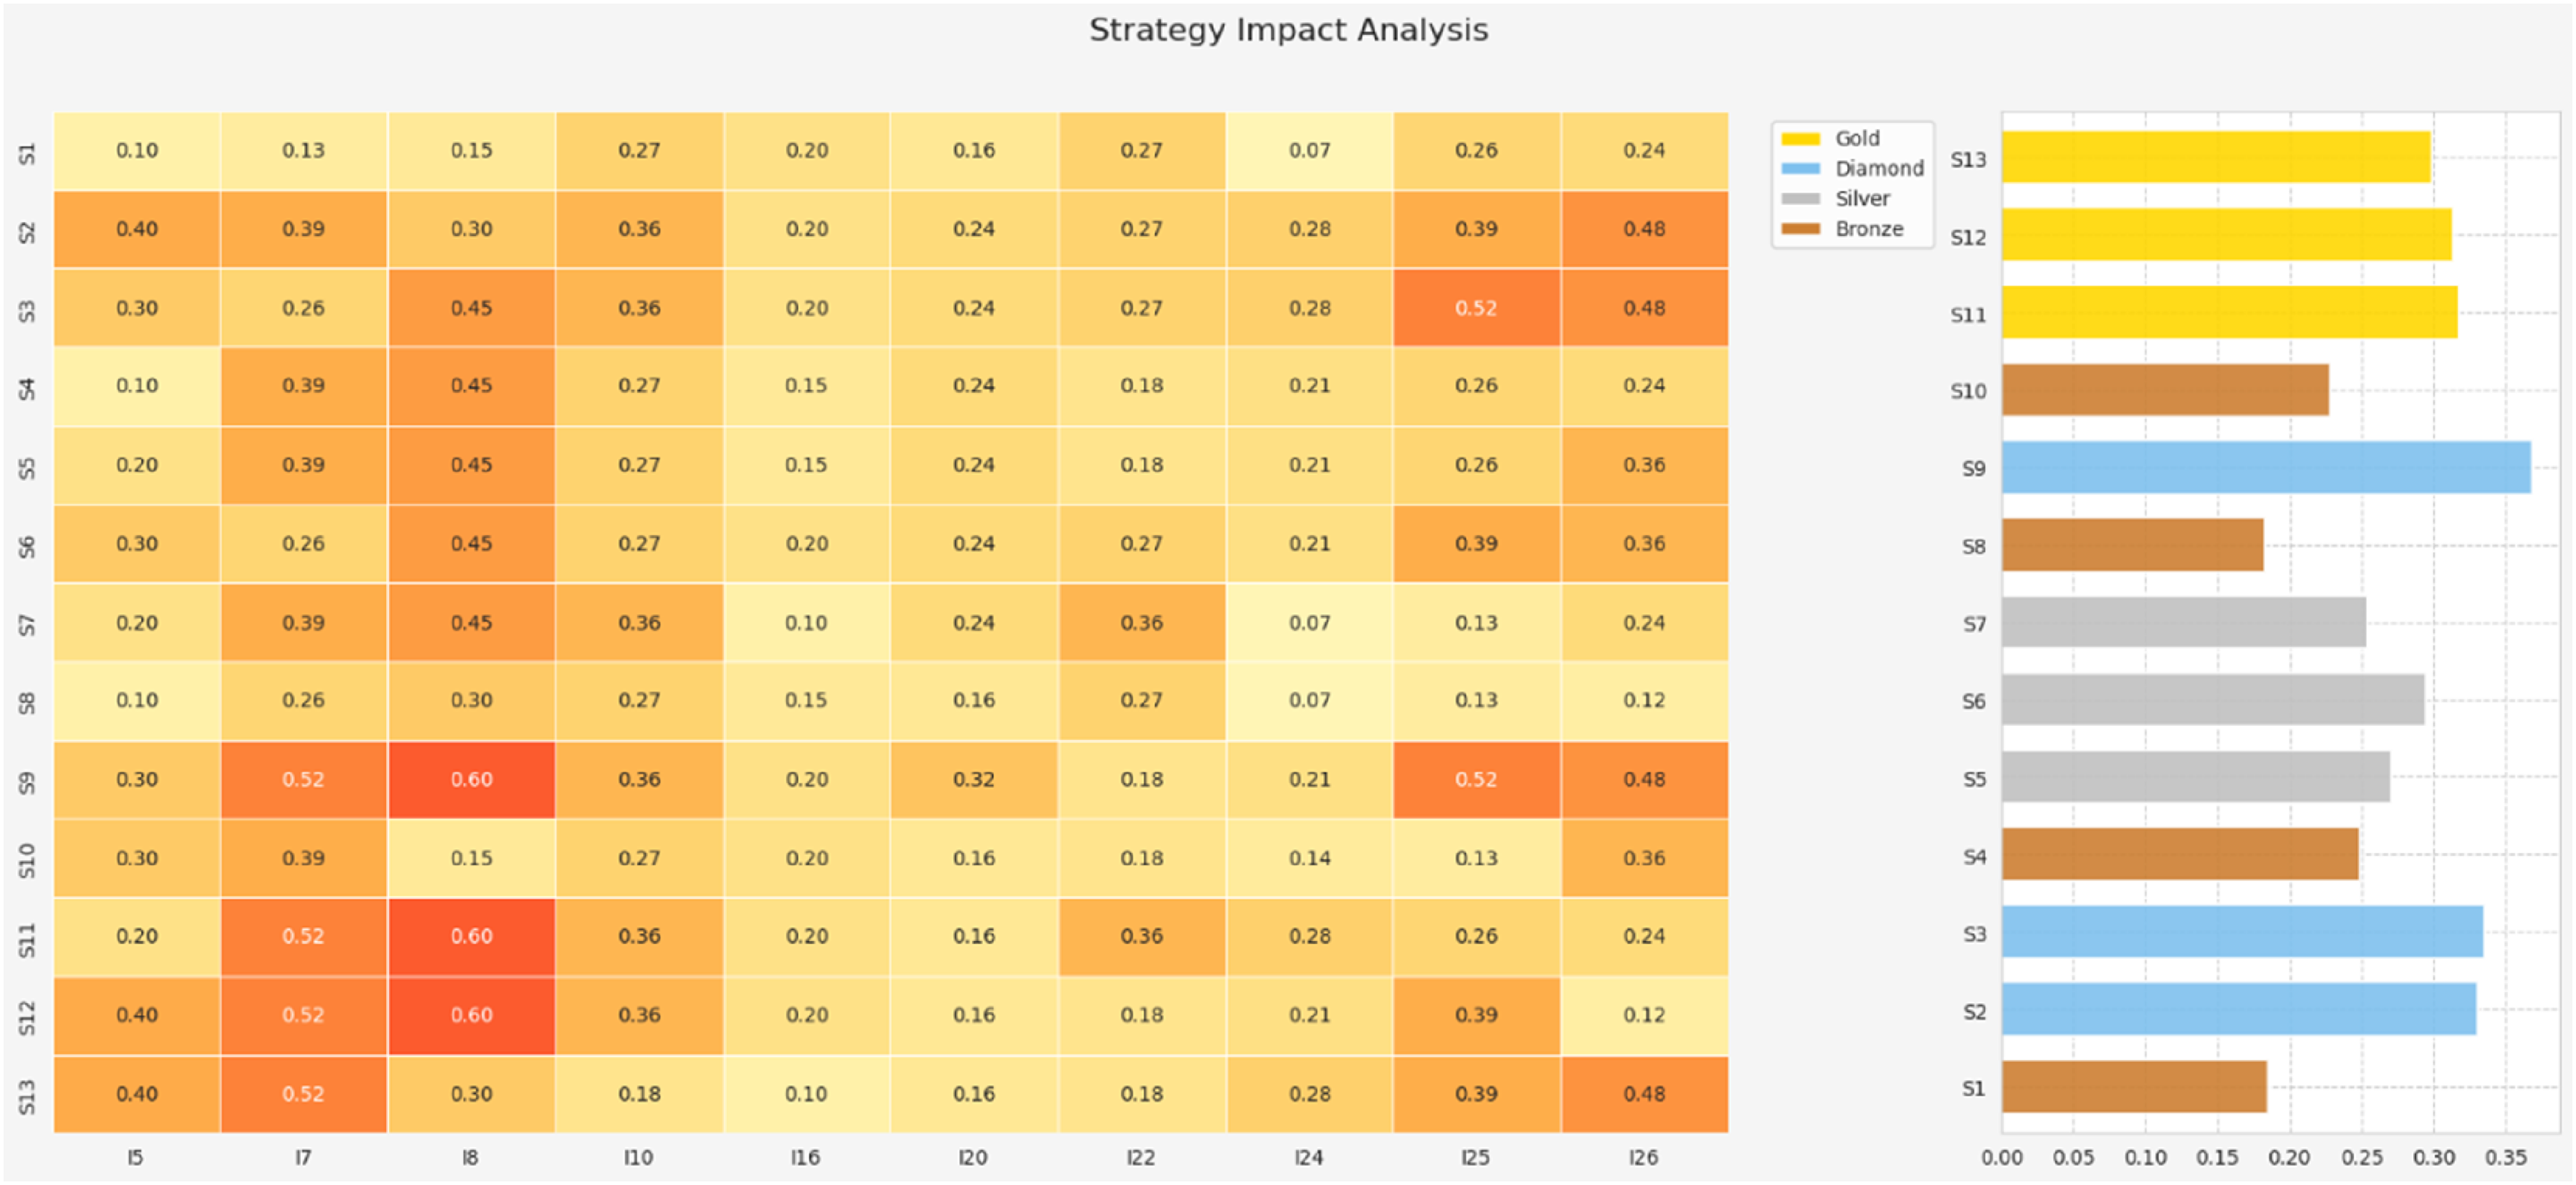
Impact of each SVCC strategy on each SE indicator.
Limitations and future recommendations
This study demonstrated the significance of SVCC strategies in addressing SE indicators. It identified the SE indicators associated with SVCC strategies and ranked these strategies based on their impact on SE indicators. While the methodologies used yielded robust results, as discussed in the ‘Discussion’ section, inherent limitations exist. The main limitation is that the experts’ opinions may not be obtained for the problem being solved by MCDM methods. Although this problem was overcome using a multi-layer framework based on fuzzy logic, more comprehensive examinations and results can be obtained by involving a larger number of participants. The nationality of panel members and survey respondents could have significantly influenced the understanding and implementation of the SVCC strategies. Expanding the research to include experts from other countries and representatives of the main types of SE could bridge these gaps and enable effective global application of the system. This research delineated the cause-and-effect relationships of SE indicators using a single-layer FCM method. Future research should employ SE indicators in separate layers, such as sustainability and resilience, to identify the impacts of each layer on the others. The insights from this analysis are also relevant for developing countries, which face many economic, financial, political, market, technical, institutional, administrative, socio-cultural, ecological and geographical challenges in implementing and developing SVCC strategies. However, the nature, dynamics and intensity of these challenges may vary depending on the governance structure and the level of economic development. It is recommended that country-specific indicators and strategies be developed, as value co-creation and SE can differ significantly from one country to another. Likewise, as statistical information improves, it would be convenient to introduce classified indicators based on the sustainability context, particularly those of an environmental, social and economic nature, with a focus on the role of value co-creation.
Footnotes
Declaration of conflicting interests
The authors declared no potential conflicts of interest with respect to the research, authorship and/or publication of this article.
Funding
The authors received no financial support for the research, authorship and/or publication of this article.
Appendix
Appendix 1: Delphi Questionnaire
Indicator
Importance
Support from social business
□
□
□
□
□
Perceived legitimateness of social enterprise
□
□
□
□
□
Increased communication
□
□
□
□
□
Diverse knowledge backgrounds
□
□
□
□
□
Talent attraction and retention
□
□
□
□
□
Ability to identify opportunities
□
□
□
□
□
Responsibility
□
□
□
□
□
Trust
□
□
□
□
□
Goal-oriented motivation
□
□
□
□
□
Leadership
□
□
□
□
□
New dissemination campaigns
□
□
□
□
□
Responsible production
□
□
□
□
□
Access to public procurement
□
□
□
□
□
Special employment
□
□
□
□
□
Fostering internationalisation
□
□
□
□
□
Innovation projects
□
□
□
□
□
Creation of school cooperatives
□
□
□
□
□
Promotion of social economy
□
□
□
□
□
Assessment of ideas
□
□
□
□
□
Sustainability oriented
□
□
□
□
□
Strategic development
□
□
□
□
□
Financing and administration
□
□
□
□
□
Learning and adaptability
□
□
□
□
□
Social involvement
□
□
□
□
□
People management
□
□
□
□
□
Persuasion
□
□
□
□
□
Perseverance
□
□
□
□
□
Motivation
□
□
□
□
□
Special capital
□
□
□
□
□
Access to resources
□
□
□
□
□
Authority to act
□
□
□
□
□
Transparent vision and mission
□
□
□
□
□
Knowledge and experience
□
□
□
□
□
Green entrepreneurship aids
□
□
□
□
□
Competitive advantages orientation
□
□
□
□
□
Appendix 2: DEMATEL Questionnaire
Very High Influence (VHI)
High Influence (HI)
Low Influence (LI)
Very Low Influence (VLI)
No Influence (NI)
Code
Talent attraction and retention
Responsibility
Trust
Leadership
Innovation projects implementation
Sustainability
Financing and Administration
Social Involvement
People Management
Persuasion
Talent attraction and retention
-
□
□
□
□
□
□
□
□
□
Responsibility
□
-
□
□
□
□
□
□
□
□
Trust
□
□
-
□
□
□
□
□
□
□
Leadership
□
□
□
-
□
□
□
□
□
□
Innovation projects implementation
□
□
□
□
-
□
□
□
□
□
Sustainability oriented
□
□
□
□
□
-
□
□
□
□
Financing and Administration
□
□
□
□
□
□
-
□
□
□
Social Involvement
□
□
□
□
□
□
□
-
□
□
People Management
□
□
□
□
□
□
□
□
-
□
Persuasion
□
□
□
□
□
□
□
□
□
-
Appendix 3: SAW questionnaire
Very High Influence (VHI)
High Influence (HI)
Low Influence (LI)
Very Low Influence (VLI)
No Influence (NI)
I5
I7
I8
I10
I16
I20
I22
I24
I25
I26
S1
□
□
□
□
□
□
□
□
□
□
S2
□
□
□
□
□
□
□
□
□
□
S3
□
□
□
□
□
□
□
□
□
□
S4
□
□
□
□
□
□
□
□
□
□
S5
□
□
□
□
□
□
□
□
□
□
S6
□
□
□
□
□
□
□
□
□
□
S7
□
□
□
□
□
□
□
□
□
□
S8
□
□
□
□
□
□
□
□
□
□
S9
□
□
□
□
□
□
□
□
□
□
S10
□
□
□
□
□
□
□
□
□
□
S11
□
□
□
□
□
□
□
□
□
□
S12
□
□
□
□
□
□
□
□
□
□
S13
□
□
□
□
□
□
□
□
□
□