
Abstract
Objective:
To compare the stress distribution and total strain applied to the dentition, periodontal ligament (PDL) and cortical and trabecular bones by three Class II correctors using finite element analysis.
Design:
Three-dimensional analysis of stresses and total strain of the dentition with three Class II correctors.
Setting:
Computational study.
Methods:
Three-dimensional finite element models of Class II elastics, the Forsus Fatigue Resistant Device (FRD) and the Carriere Motion Appliance (CMA) were constructed from a cone-beam computed tomography (CBTC) image of an orthodontic Class II patient. The distribution of stress (von Mises and principal stress) and the total strain (mm) in maxillo-mandibular dentition, PDL, cortical and trabecular bone were analysed.
Results:
The highest von Mises yield and the maximum principal stress in the three models were found at the teeth, followed by the cortical bone, trabecular bone and PDL. The maximum stress and total deformation were located at the upper canines and lower molars in the Class II elastics and CMA models, in the upper first molars in the Forsus FRD and CMA, and in the lower first premolars in the Forsus FRD. In addition, stress was distributed in the anterior and posterior regions of the teeth, and the total deformation was found in the distal direction in the upper arch and in the mesial direction in the lower arch.
Conclusion:
The stress concentrations in the three models were located close to the active components of each appliance, producing specific patterns of stress distribution and displacement that should be taken into account when planning the type of appliance to be used for the correction of the Class II malocclusion.
Introduction
Class II malocclusions are some of the most frequent problems found in orthodontics (Bishara, 2006). The prevalence can be 15%–30% in different parts of the world (Proffit et al., 1998). The aetiology is multifactorial and may present as skeletal (maxillary prognathism, mandibular retrognathism or a combination of both) or dental malocclusion or both (Proffit et al., 2019). Class II malocclusions may have negative social and/or psychological impacts on patients (Proffit et al., 2019). Specifically, an increased overjet may cause a higher incidence of incisal trauma (Batista et al., 2018). Different techniques and biomechanics have been proposed over the years to treat Class II malocclusions. Among the more common are orthopaedic appliances, intermaxillary elastics, extractions and distalisation of the upper dentition (Arora et al., 2018; Bishara, 2006; Cozza et al., 2006; Guest et al., 2010; Jones et al., 2008; Moresca et al., 2020; O’Brien et al., 2009; Quinzi et al., 2020).
Class II elastics are effective in correcting malocclusions, and their effects are primarily dentoalveolar, including retroclination and extrusion of the upper incisors, proclination of lower incisors, and mesialisation and extrusion of the lower molars (Janson et al., 2013). However, patient compliance influences their effectiveness; for example, deficient patient cooperation can lead to unsuccessful treatment (Leone et al., 2019). Alternatively, fixed correctors, such as the Forsus Fatigue Resistant Device (FRD), overcome the need for patient compliance and effectively correct the malocclusion, resulting in overjet and overbite decrease, improved molar relationship, retroclination of the maxillary incisors, proclination and intrusion of the mandibular incisors, and mesialisation of the mandibular molars (Cacciatore et al., 2014a; Mahamad et al., 2012). A third option is the Carriere Motion Appliance (CMA), an appliance that combines a fixed upper arch attachment and Class II intermaxillary elastics, which transmit the force needed to produce the distal movement of the upper maxillary first molars and canines. Usually, a lingual arch or an Essix appliance is added to the lower arch to anchor the intermaxillary elastics, producing mesial movement of the mandibular molars and proclination of the mandibular incisors (Areepong et al., 2020; Fouda et al., 2022). However, this appliance also requires the patient’s cooperation in the use of intermaxillary elastics.
Many authors have studied the dentoskeletal effects of these three Class II correctors (Areepong et al., 2020; Barakat et al., 2021; Cacciatore et al., 2014b; Janson et al., 2013; Kendre et al., 2021; Kim-Berman et al., 2019). In a clinical study, Jones et al. (2008) evaluated the effects of the Forsus FRD and Class II elastics and found no statistically significant differences in the clinical changes between the two therapies, but they observed greater mesial movement of the lower molars and greater correction of the molar relationship in the Forsus FRD group. Aras and Pasaoglu (2017) compared the effectiveness of the Forsus FRD and intermaxillary elastics in individuals with Class II subdivision malocclusions and found that the Forsus appliance was more effective. In a retrospective study, Yin et al. (2019) evaluated the treatment effectiveness of the CMA compared to Class II intermaxillary elastics and Forsus FRD. They found that the time needed for correction using the CMA and Forsus FRD was significantly shorter than that needed for Class II elastics. In addition, the amount of Class II correction (canine/molar relationship) observed was significantly less when using the CMA than the Forsus appliance.
To our knowledge, no other study has compared the biomechanical effects of these appliances, showing that although they have similar clinical effects, they have different elements that are anchored to different parts of the teeth, such that the actions exerted on the dentition are different. There have been few comparative studies of these therapeutics, possibly because conducting randomised controlled clinical trials and finding patients who lend themselves to this type of study is difficult. In these cases, the finite element method (FEM) is an excellent way to simulate the distribution of stress and strain on the dentition of these three therapies using a mathematical model (Cattaneo et al., 2005; Knop et al., 2015). This allows us to analyse these distributions and reveal possible biomechanical effects in areas that are difficult to assess clinically which are risk-free for patients. Thus, orthodontists are provided with important information with which to make more accurate therapeutic decisions. The aim of the present study was to compare the stress distribution and total strain over the dentition, periodontal ligament (PDL), and cortical and trabecular bones from Class II elastics, the Forsus FRD and the CMA using FEM.
Materials and methods
This in -silico study was conducted using FEM to build maxillo-mandibular models from an existing cone-beam computed tomography (CBTC) image of the skeletal Class II division 1 malocclusion of a 16-year-old female patient with an overjet of 6 mm. The study was approved by the ethics committee at the Institución Universitaria Colegios de Colombia (UNICOC) in Bogotá, Colombia, and meets the ethical principles under the Declaration of Helsinki.
To conduct the finite element analysis, the steps below were performed.
Imaging
Imaging and 3D reconstruction
The CBCT was taken using Planmeca dental tomography equipment (Planmeca Oy, Helsinki, Finland). Images were generated in standard digital imaging and communication in medicine (DICOM) format and reconstructed into continuous slices with an axial thickness of 0.4 mm.
Image processing
Anatomical structure models: The 3D geometry of the teeth, mandible, PDL, and cortical and trabecular bones was reconstructed through a semi-automated process with 3D-DOCTOR 4.0 software (Able Software Corp., Lexington, MA, USA). Once the reconstruction was finished, an STL file (point cloud) of each required geometry was generated. This was converted into a solid.
Models of non-anatomical structures: The mechanical elements of the three appliances—Class II elastics, Forsus FRD (L-pin, 3M Unitek, Monrovia, CA, USA) and the CMA (Henry Schein Orthodontics, Melville, NY, USA)—were modelled via computer-aided geometric design using photographs and direct measurements of the appliances’ components and imported into SolidWorks 2018 (Dassault Systèmes, Surenes, France). To simulate the Class II elastics and the Forsus FRD appliance, a set of upper and lower brackets with a 0.22 × 0.28-inch slot, MBT prescription and a passive 0.19 × 0.25-inch stainless-steel archwire were made. For the CMA, an acetate plate with a thickness of 0.060 inches (Leone S.p.A, Sesto Fiorentino, Firenze, Italy) and a tube for the lower first molar were also modelled. Subsequently, the assembled simulated appliances were placed in their recommended positions in the arches (Figure 1).
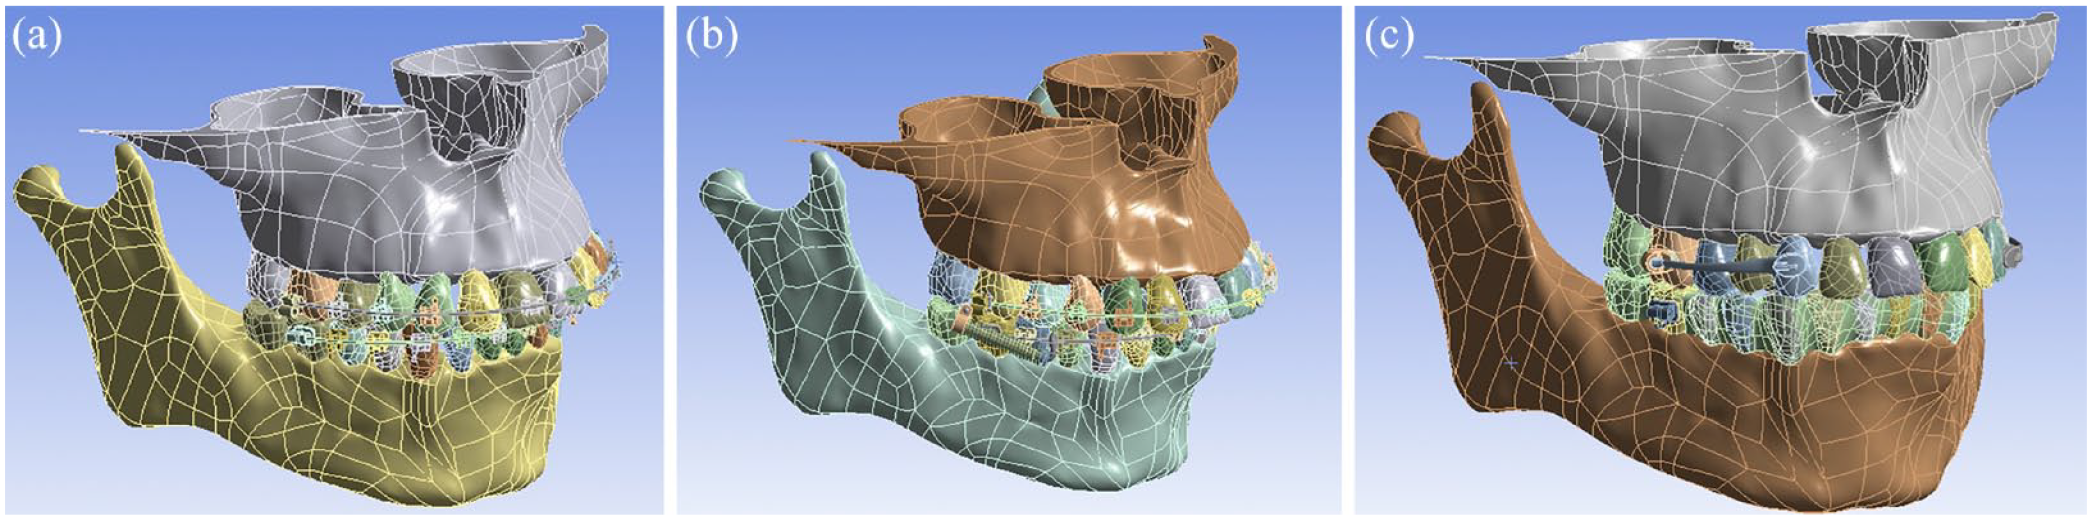
Models of the three Class II correctors. (a) Class II elastics, (b) Forsus Fatigue Resistant Device and (c) Carriere Motion Appliance.
Meshing
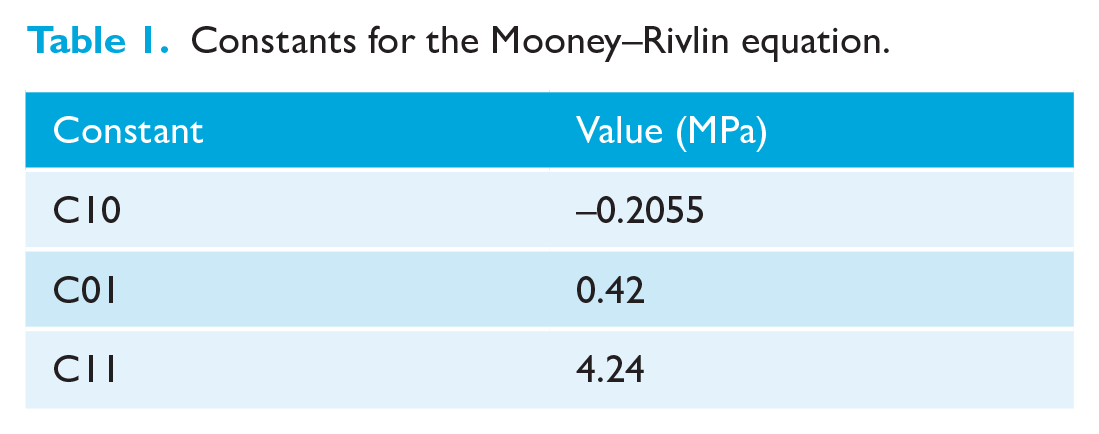
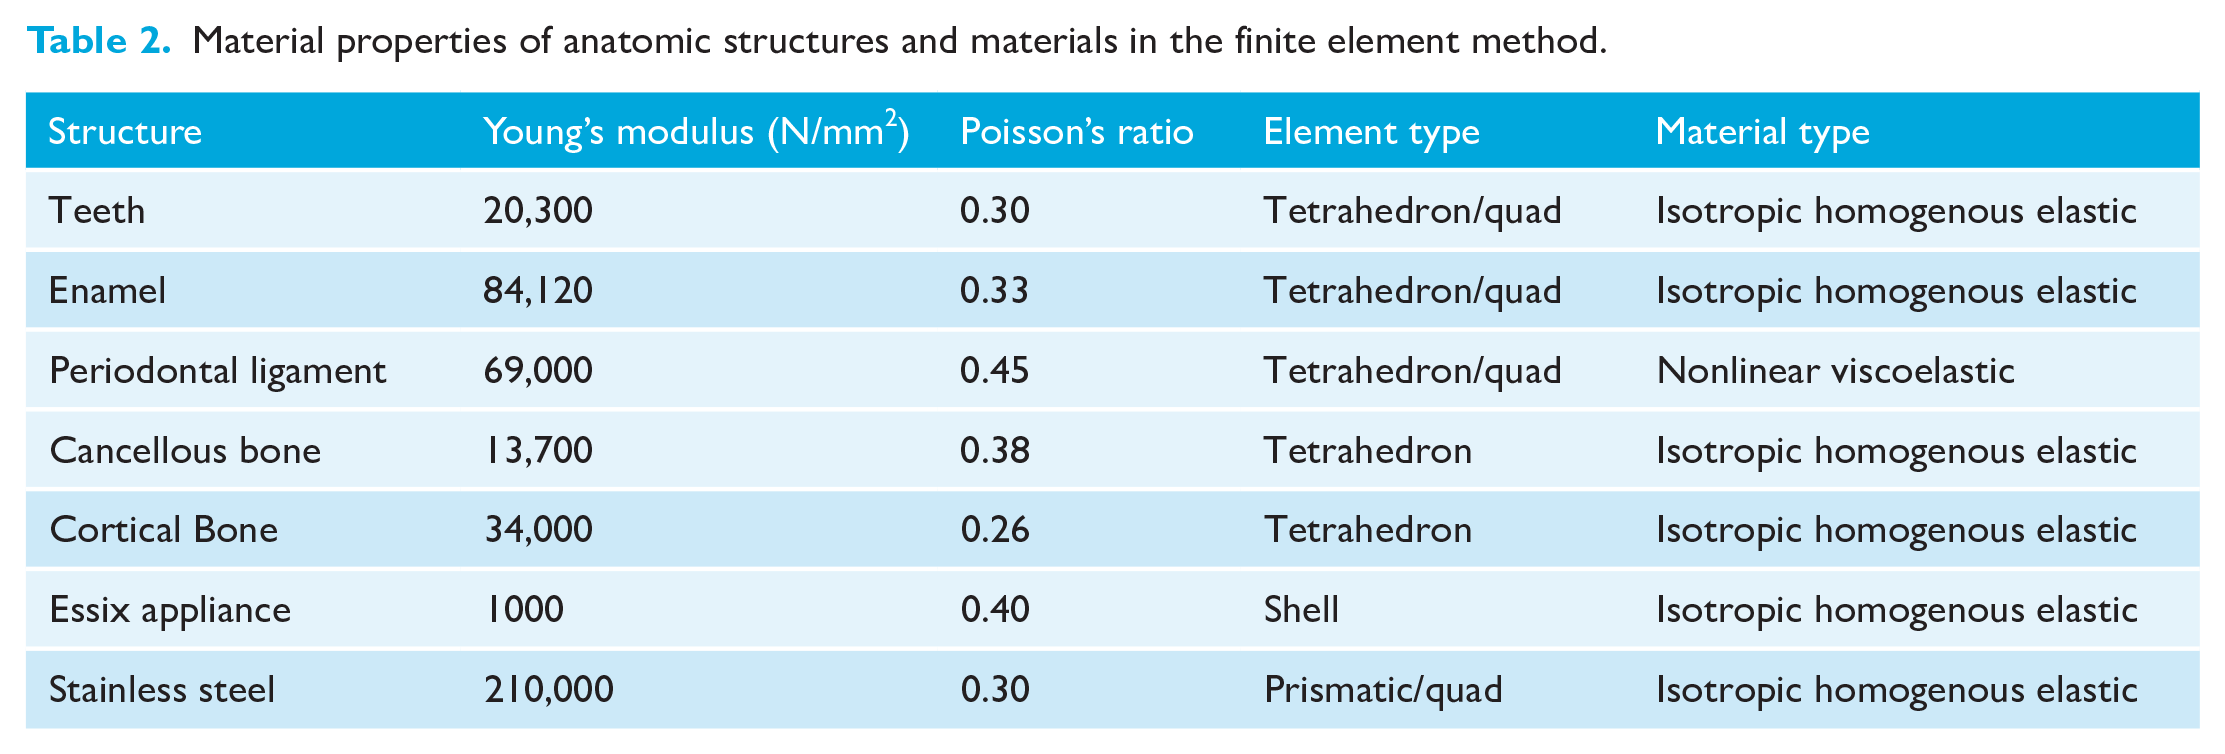
The PDL was modelled with a thickness of 0.25 mm and was considered non-linear and viscoelastic, according to the Mooney–Rivlin theory (Uhlir et al., 2016). The constants used for the Mooney–Rivlin equation are shown in Table 1. The other components of the models were assumed to be linearly elastic, isotropic and homogeneous. Young’s modulus and Poisson’s ratio were set for each component, as also reported by previous authors (Ludwig et al., 2013; Singh et al., 2016; Zhu et al., 2022) (Table 2). The assembled finite element models of the three appliances were imported into ANSYS software (version 13.1; Ansys, Inc., Canonsburg, PA, USA) for analysis. The total numbers of nodes and elements for each model were as follows: Class II elastics = 1,207,182 nodes and 748,983 elements; Forsus FRD = 1,280,801 nodes and 771,350 elements; and CMA = 933,279 nodes and 599,868 elements.
Constants for the Mooney–Rivlin equation.
Material properties of anatomic structures and materials in the finite element method.
Boundary and load conditions
The boundary conditions were determined as the maxillary process to the anterior nasal spine, the zygomatic process for the maxilla and the neck of the condylar process for the mandible. For all three models, a force magnitude of 2 N was applied for each side. The simulations included forces of compression, traction and shearing, based on the activation of the assembled components of each appliance. Specifically, traction forces were simulated for the Class II elastics, compression was applied for the Forsus FRD spring and shearing forces were simulated for the posterior pad with the articulating ball in a socket of the CMA.
Types of solutions
To analyse the distribution of the stress in the structures, the estimated principal stress and von Mises yield values were measured in megapascals (kPa). The principal stress develops along the principal axis of the body and the von Mises yield combines three principal stresses into one equivalent stress (Srirekha and Bashetty, 2010). The total deformation was measured in mm. The colour scale on the left side of each figure identified the maximum (red) and minimum (blue) stress/strain values. The total deformation figures were increased on a scale of 2.2 × 10⁴ to help observe the results of the total deformation of the area of displacement in a didactic form.
To verify the validity of the results obtained in the simulations, a mesh sensitivity analysis was conducted. This analysis involved generating meshes with an increased number of nodes and simulating them, allowing for the observation of numerical variations in the obtained results. In this case, the maximum von Mises yield was used as the comparison parameter. The number of nodes used in the final model was selected by considering the relative error between its result and the result obtained in the simulation with a smaller number of nodes. This error was limited to less than 5%, taking into account the computing capacity of the equipment used.
Results
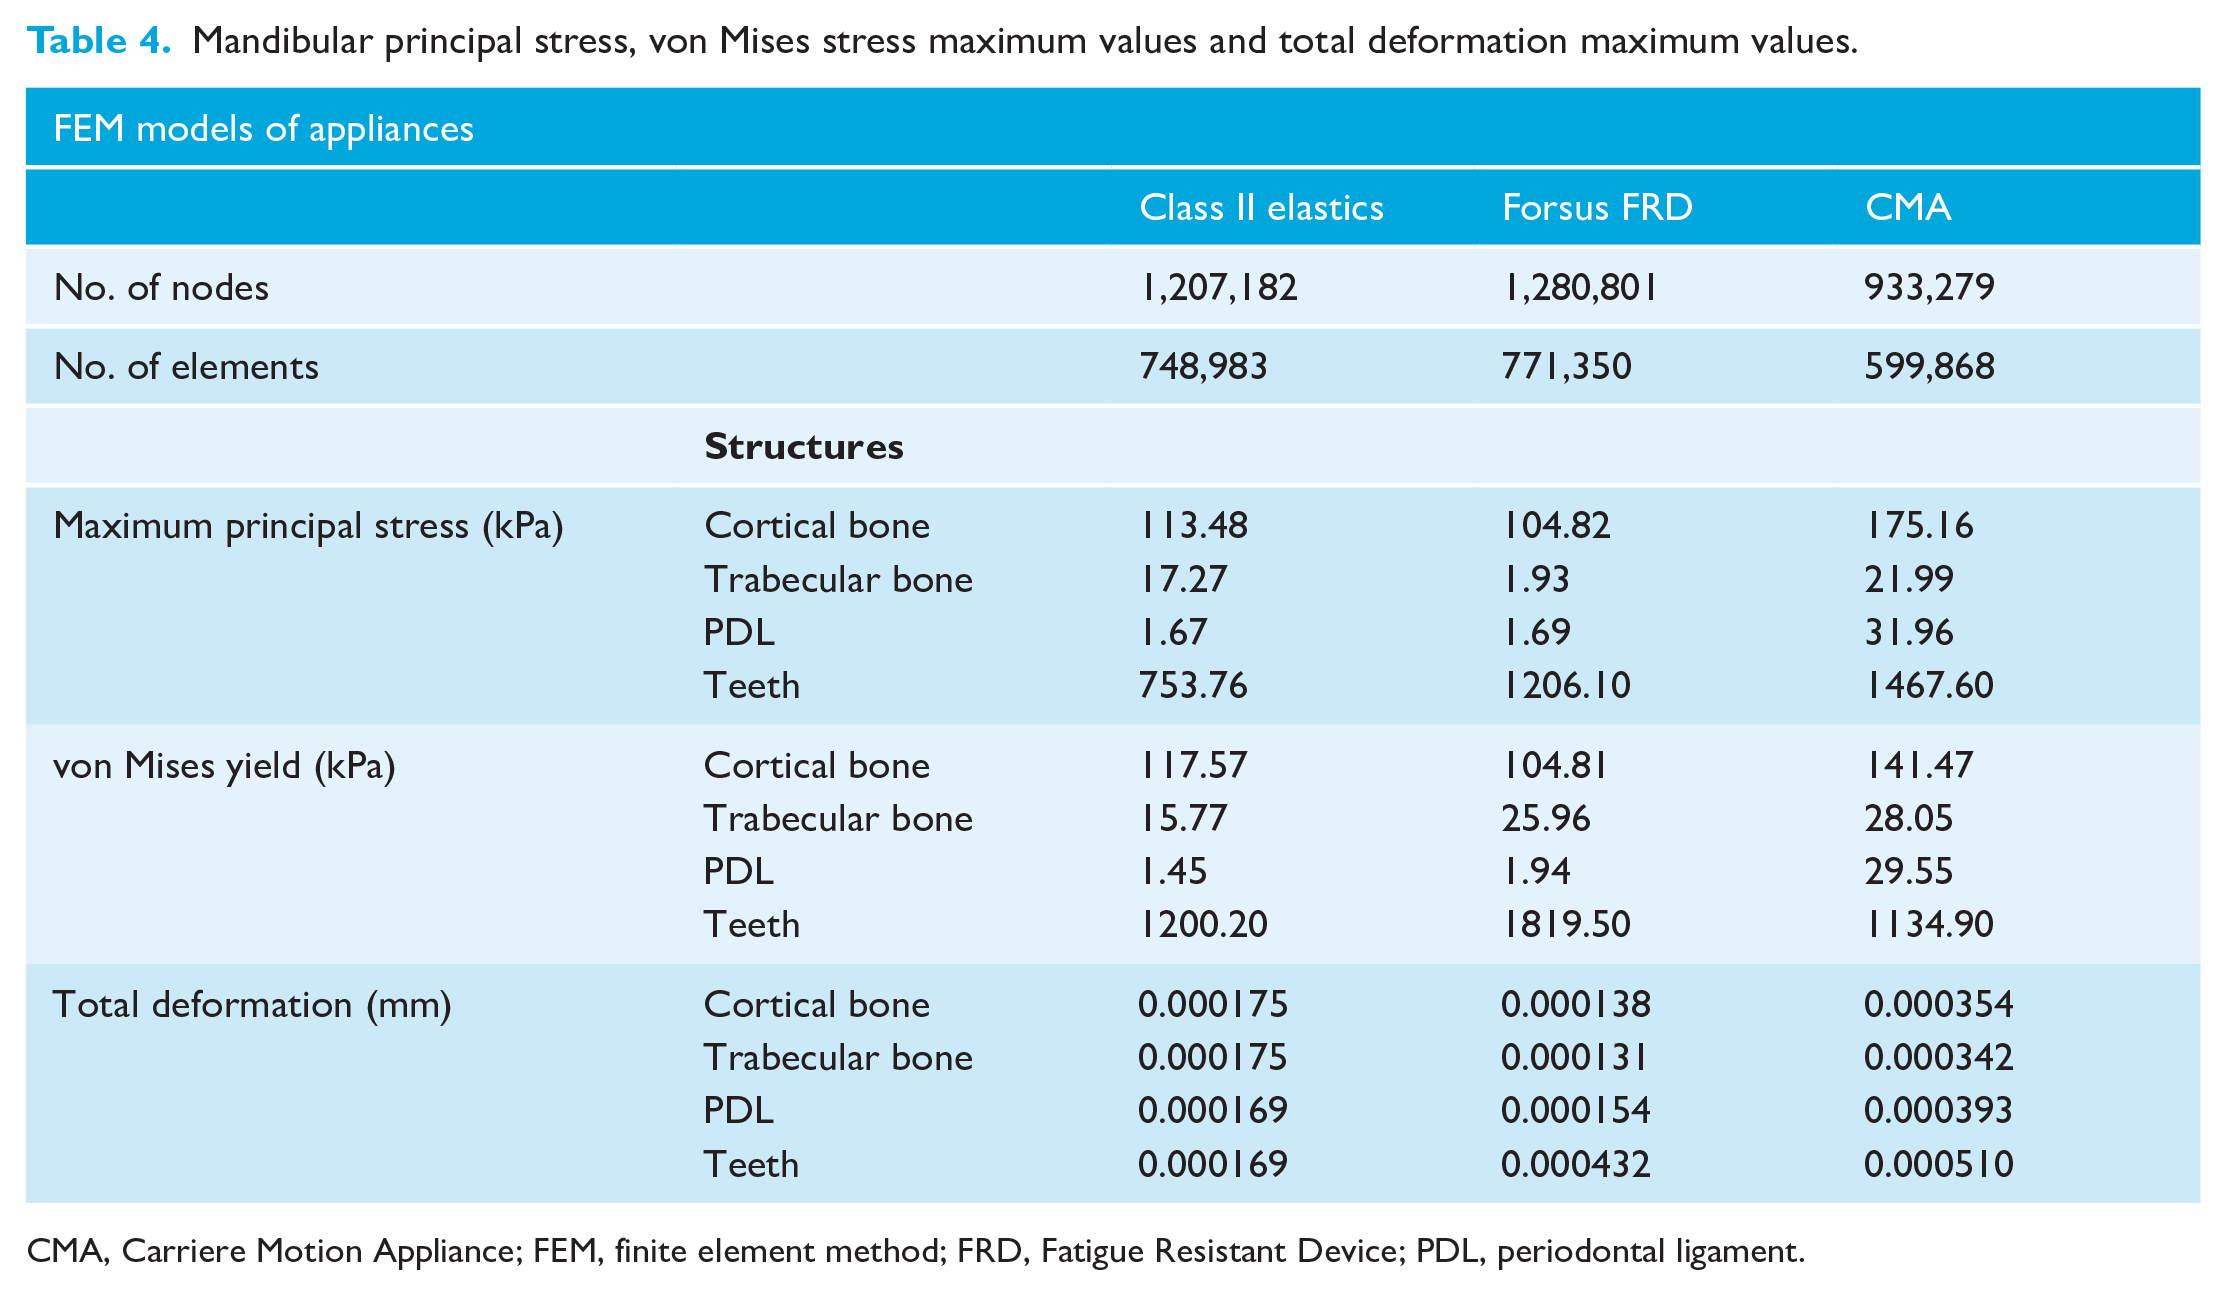
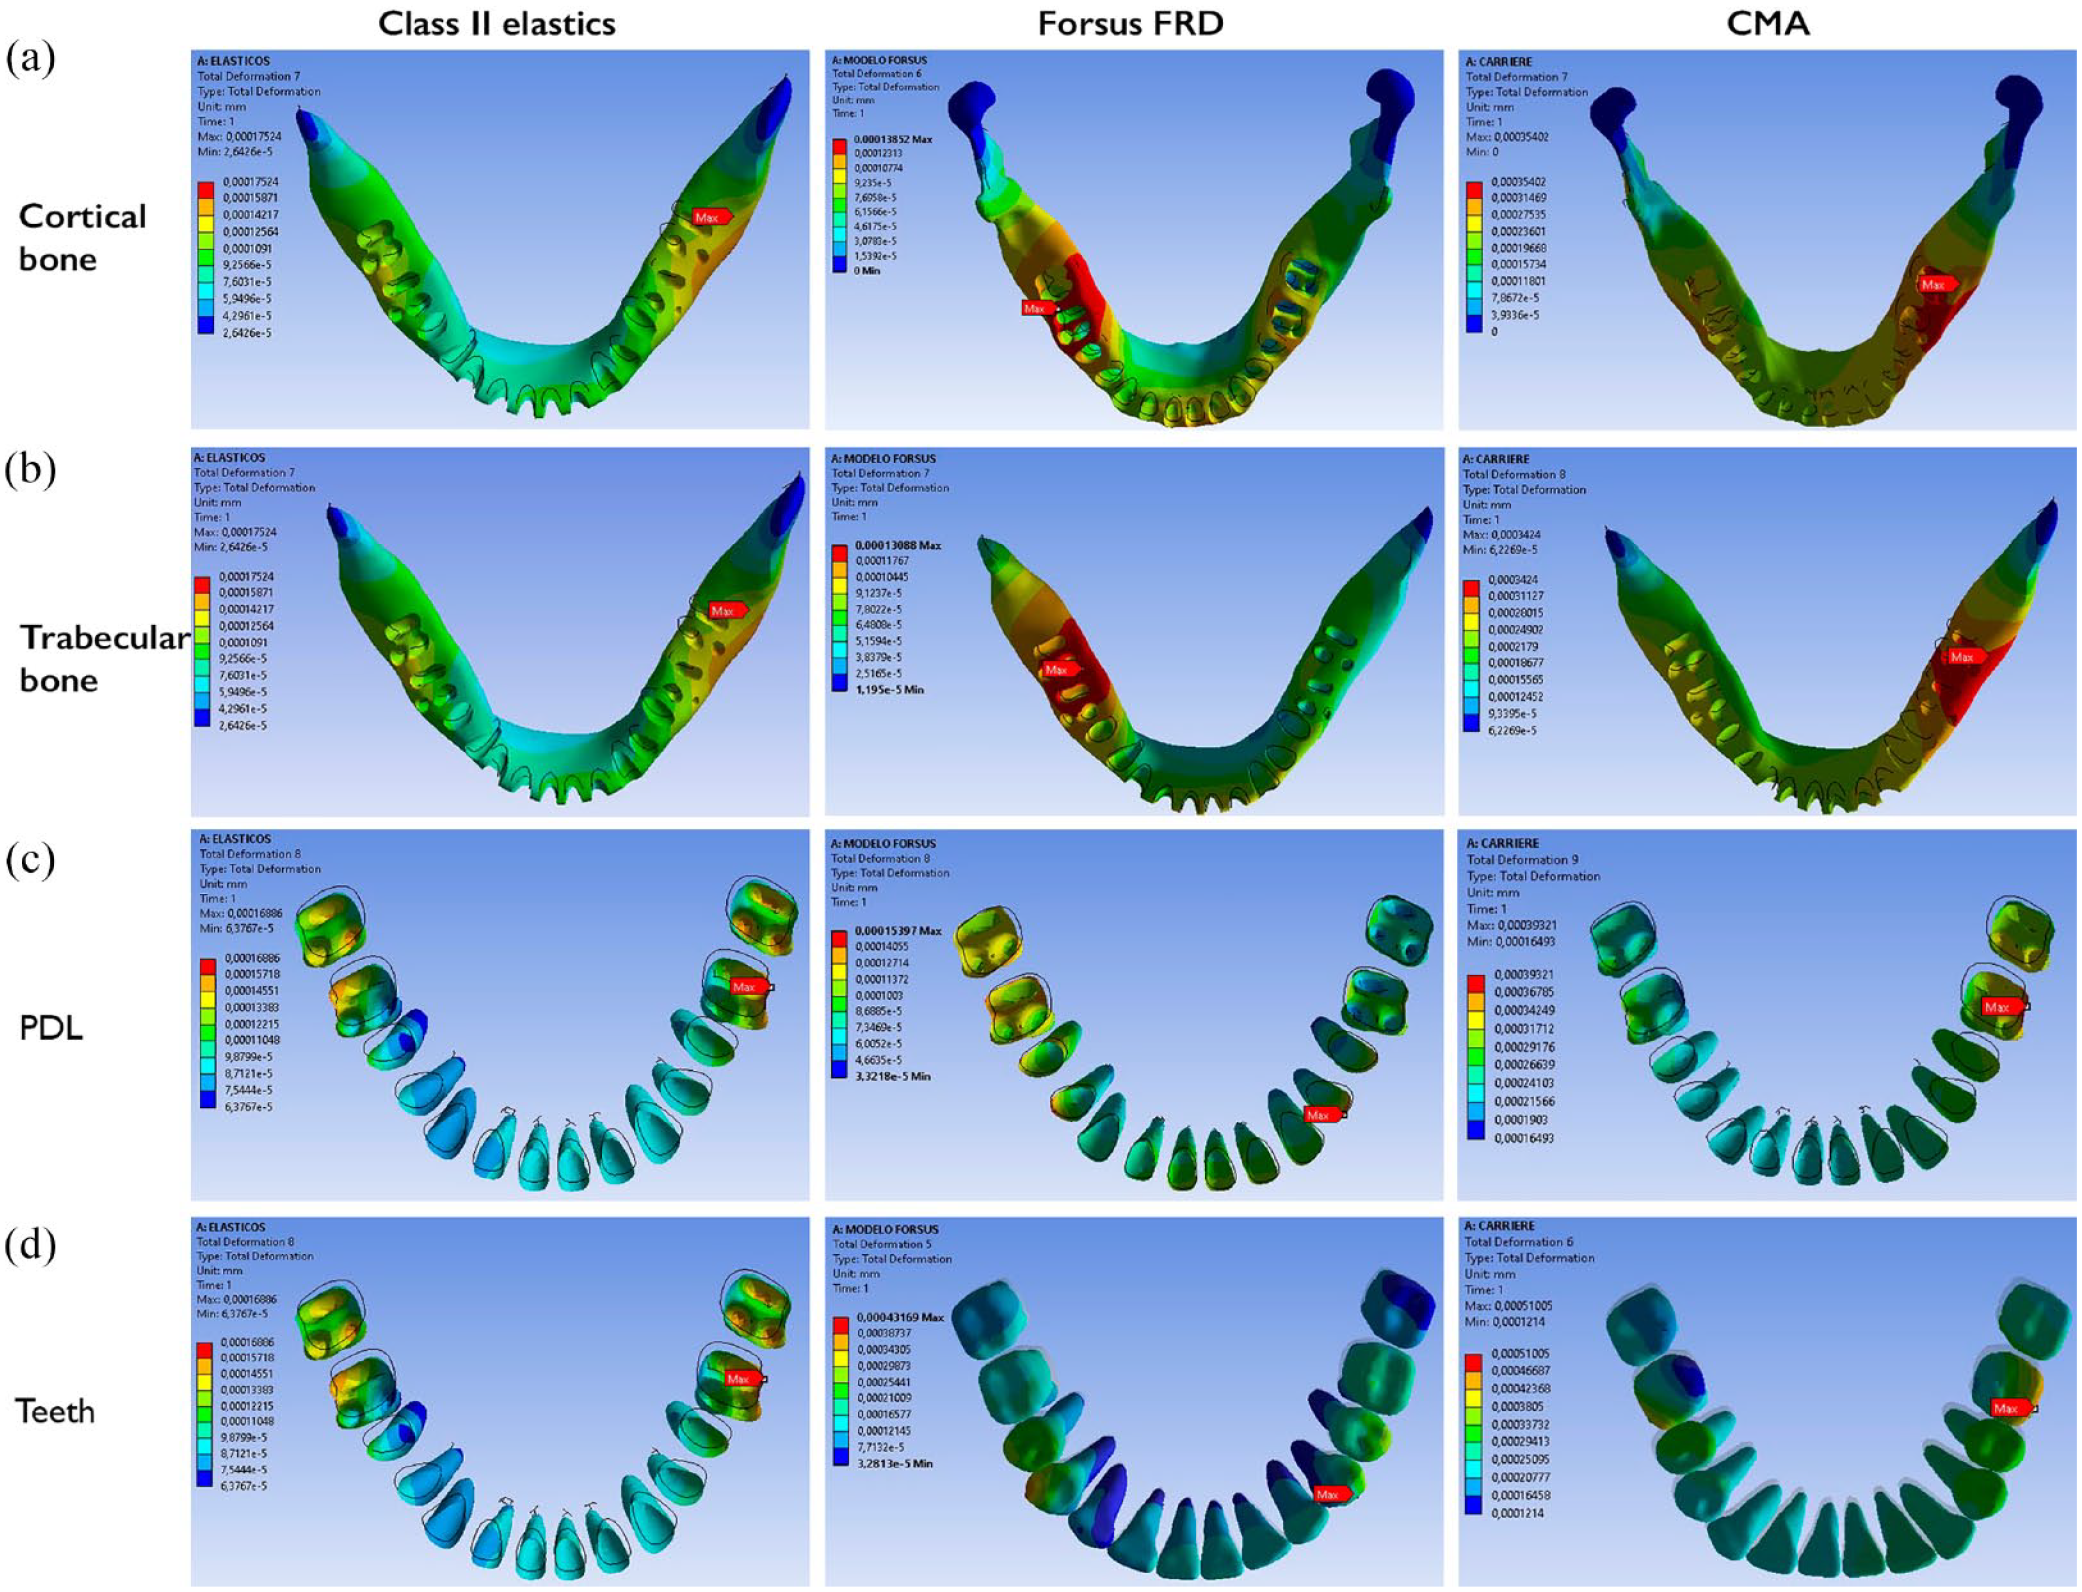
The results of the principal stress, von Mises yield and total deformation values are shown in Tables 3 and 4. In general, the highest stresses in the three models were found in the teeth, followed by the cortical bone, trabecular bone and PDL. The maximum principal stress ranged from 1.67 kPa (Forsus FRD, teeth, upper first molars) to 1516.30 kPa (Class II elastics, PDL, lower second molar). In the upper arch, these stresses were localised in the upper canines (Class II elastics and CMA) or upper first molars (Forsus FRD and CMA). Similar results were found for the von Mises yield values, which ranged from 1.45 kPa (CMA, teeth, upper canines) to 1899.10 kPa (Class II elastics, PDL, lower second molars). In the lower arch, the principal stress and von Mises yield were observed in the lower first molars (Class II elastics and CMA) and lower first premolars (Forsus FRD) (Figures 2 and 3).
Maxillary principal stress, von Mises stress maximum values and total deformation maximum values.
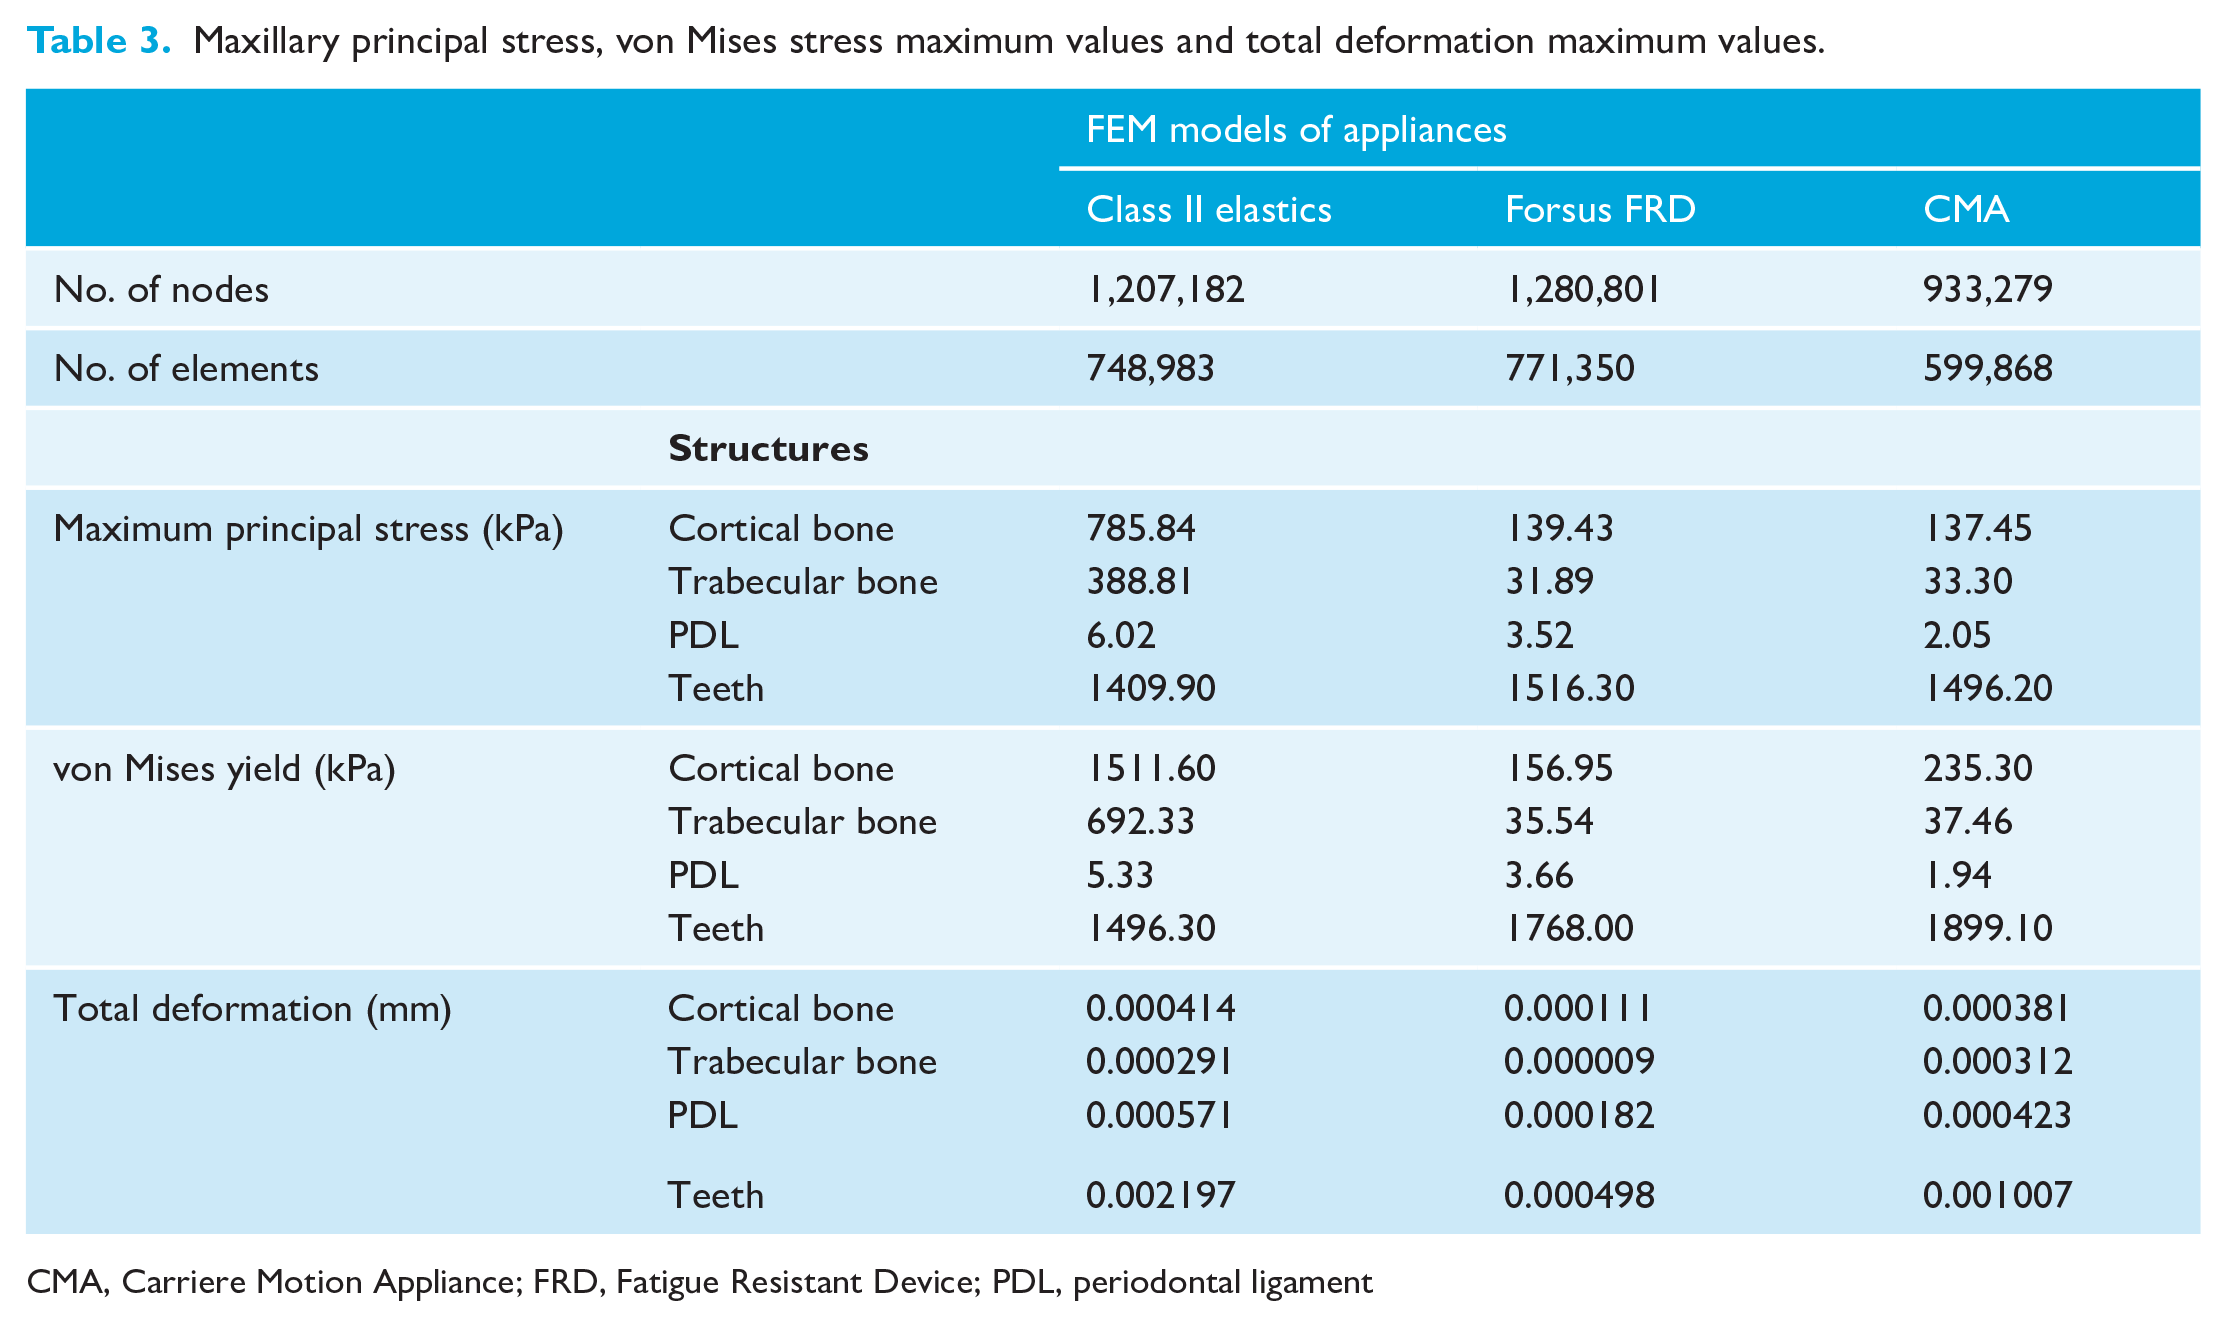
CMA, Carriere Motion Appliance; FRD, Fatigue Resistant Device; PDL, periodontal ligament
Mandibular principal stress, von Mises stress maximum values and total deformation maximum values.
CMA, Carriere Motion Appliance; FEM, finite element method; FRD, Fatigue Resistant Device; PDL, periodontal ligament.
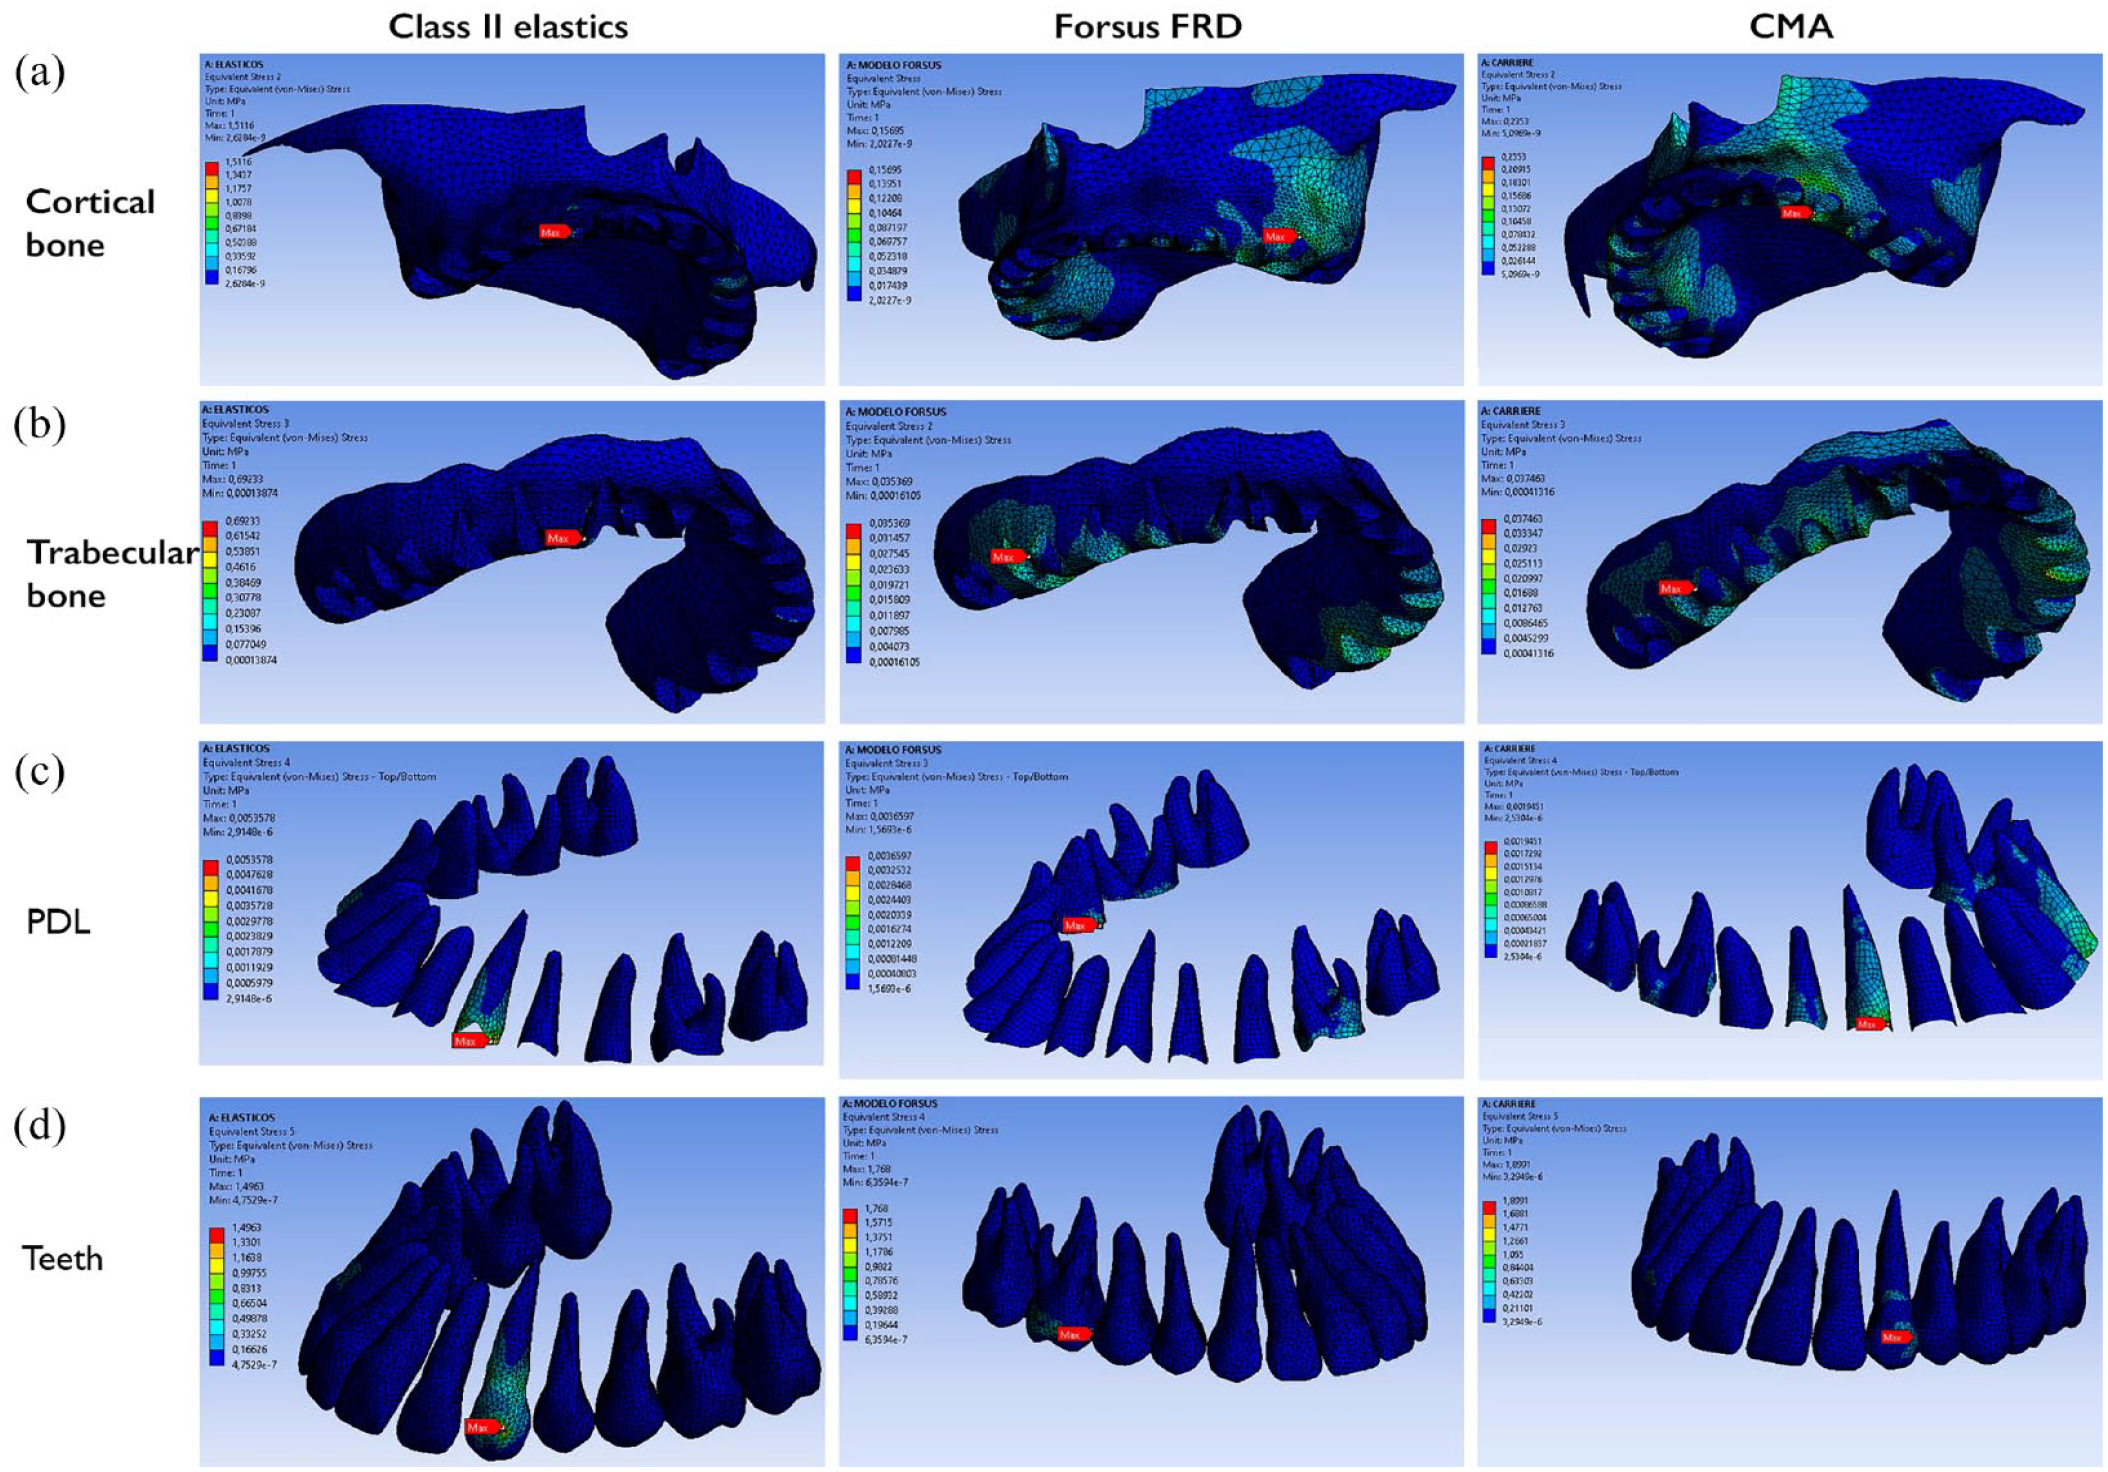
von Misses stress in the maxillary arch for the three Class II correctors.
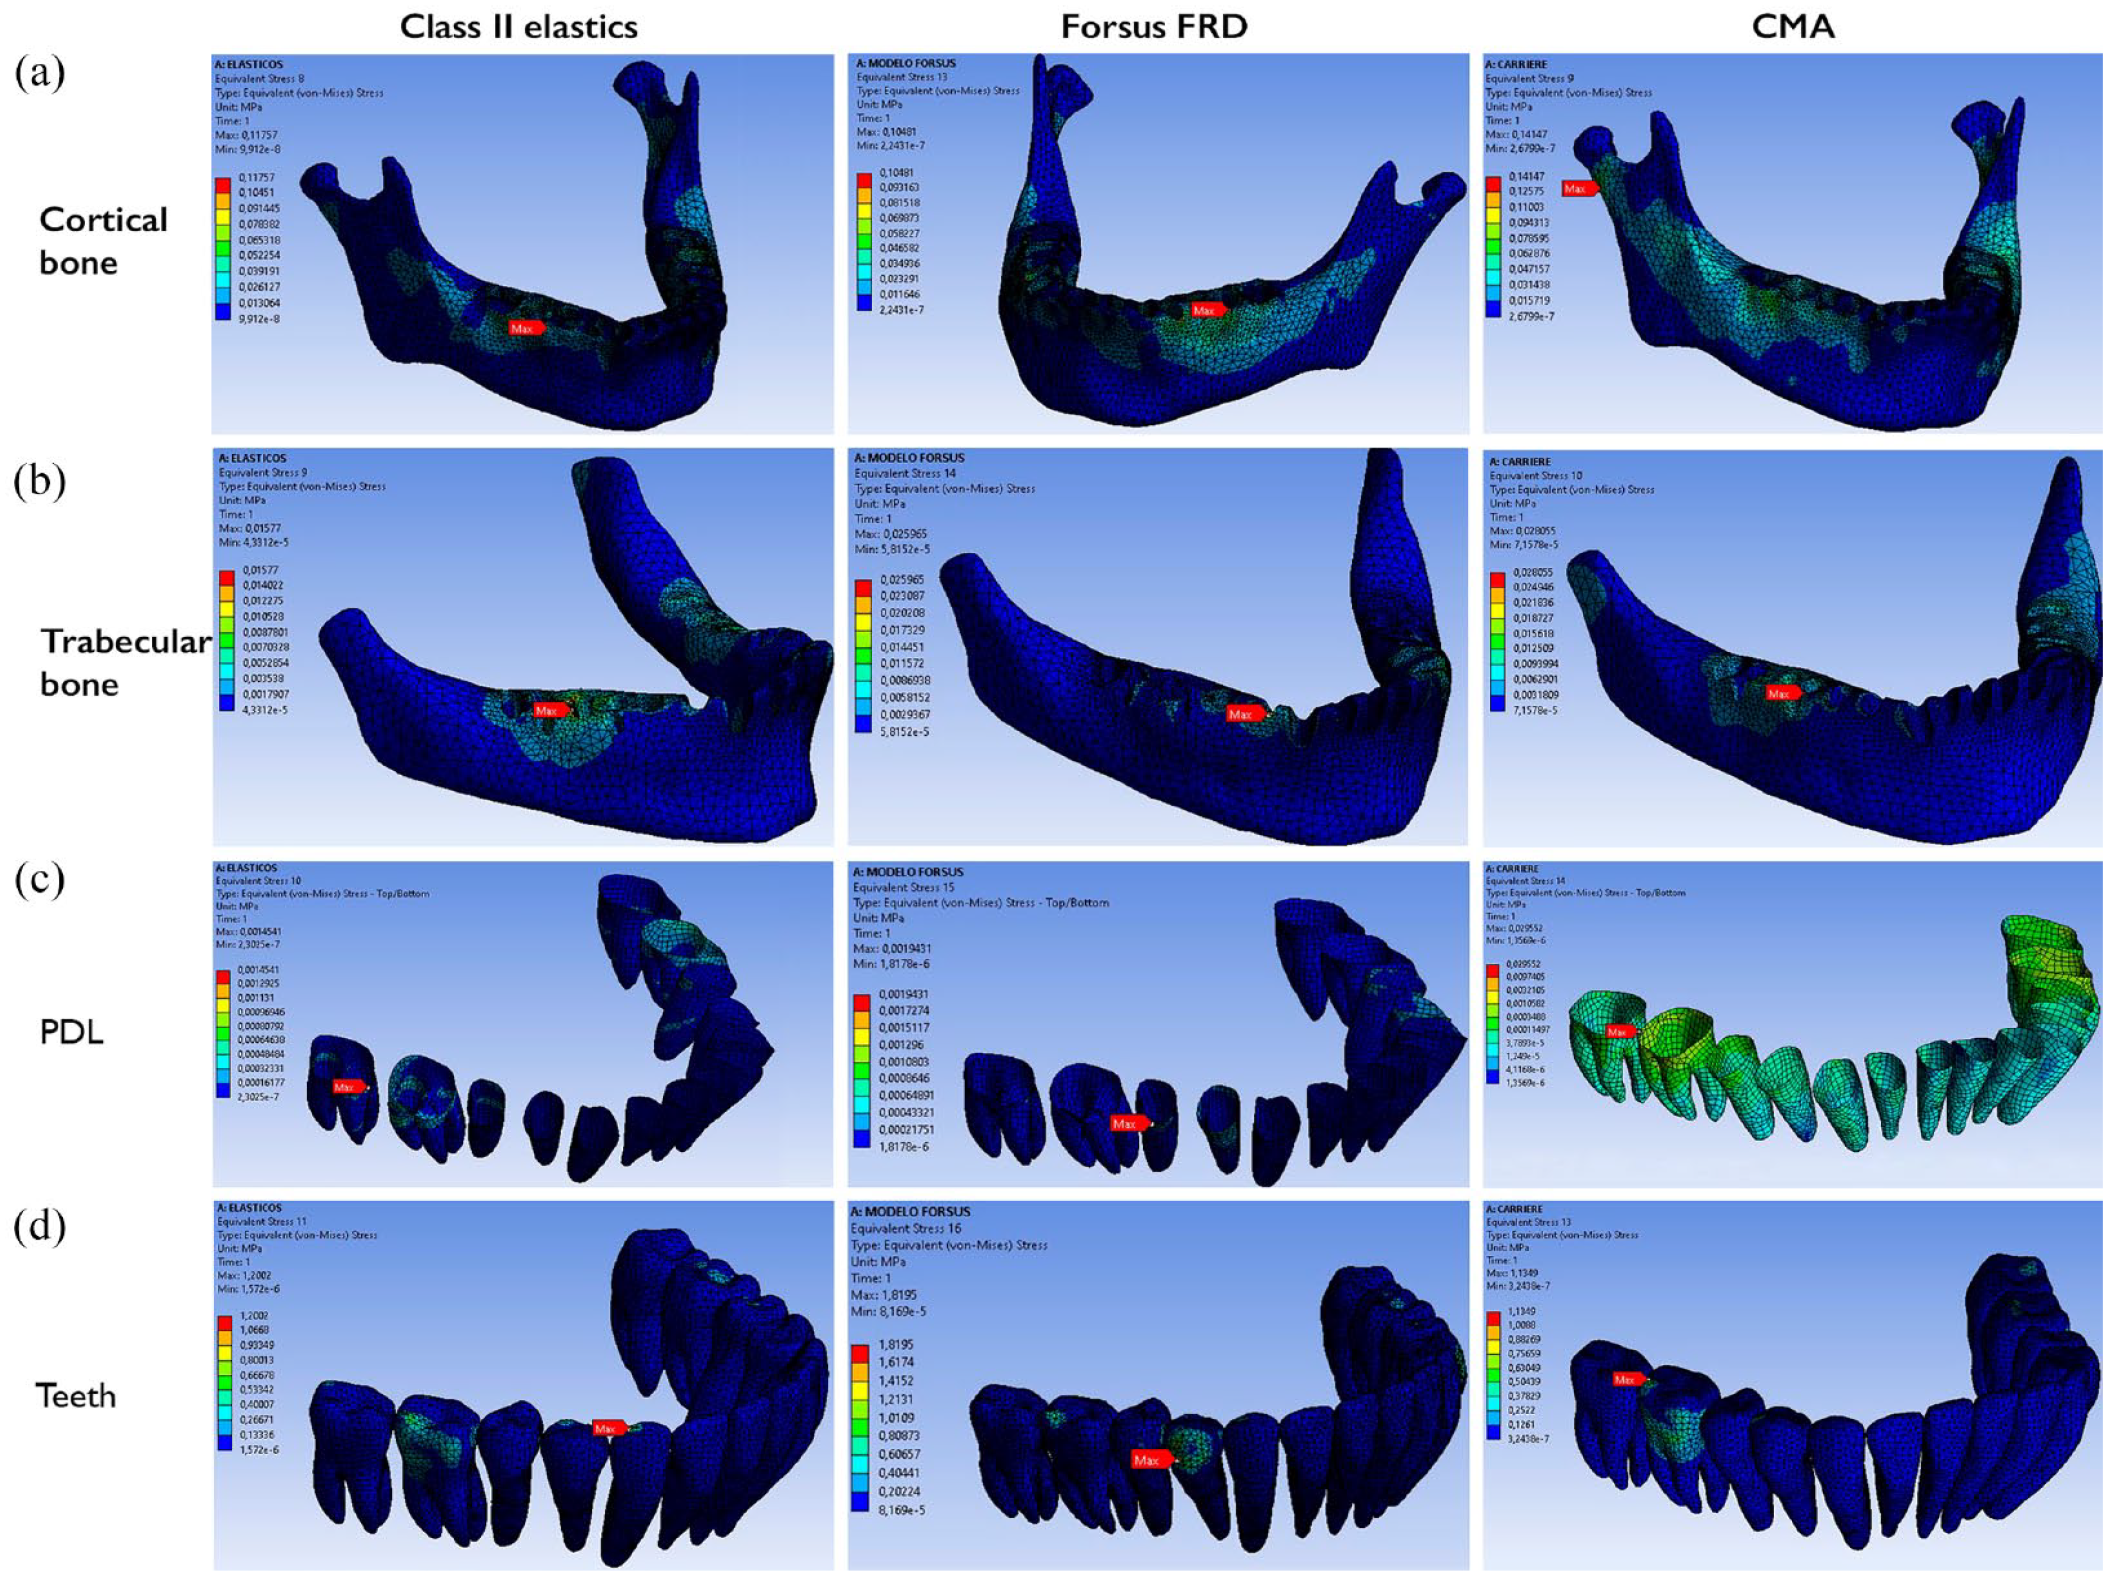
von Misses stress in the mandibular arch for the three Class II correctors.
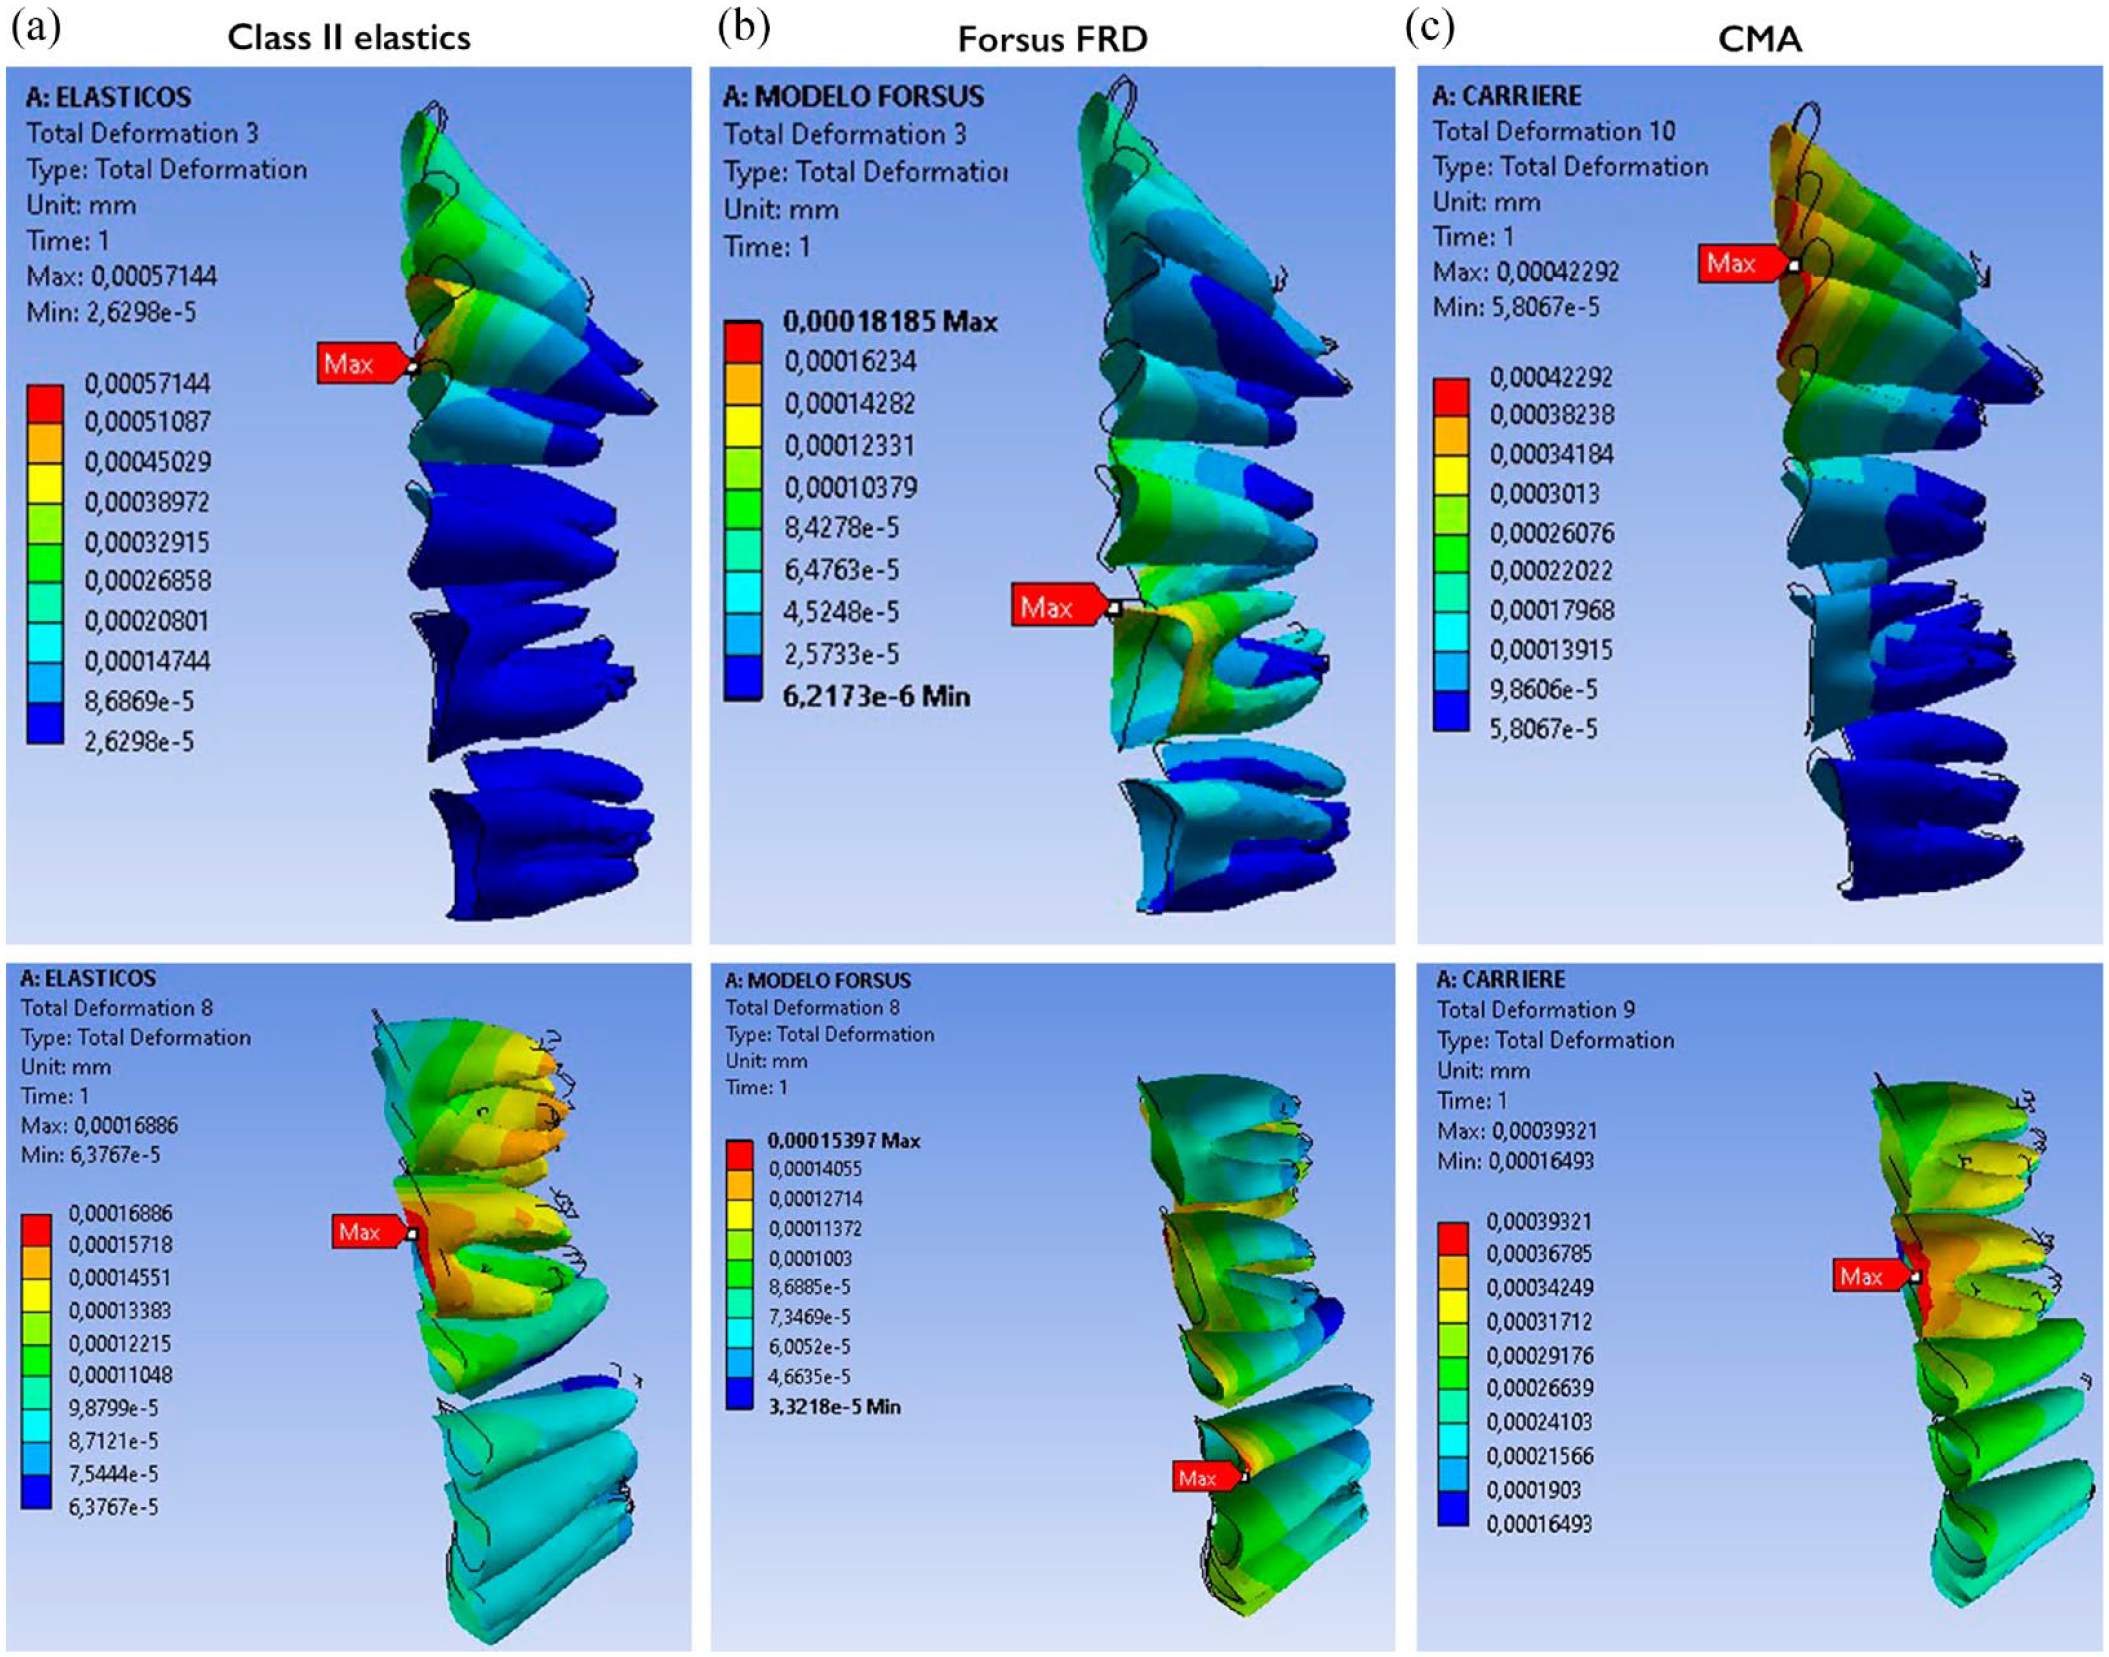
The total deformation in the upper arch showed that the maximum displacements in the Class II elastics and CMA models were localised in the upper canines; in the Forsus FRD, they were localised in the upper first molars. All were in the distal direction. Moreover, in all three simulations, the upper anterior teeth displacements were palatal. The CMA showed the greatest palatal displacement of the upper incisors, followed by Class II elastics and Forsus FRD. The Forsus FRD and the CMA models showed greater distal movement of the upper first molar than the Class II elastics model. In addition, the buccal displacement of the upper first molars was observed in the Forsus FRD model but not in the Class II elastics or the CMA models. The total deformation in the lower arch at the PDL showed maximum displacement in the Class II elastics and CMA models at the lower molars, with proclination of the lower incisors. In the Forsus FDR model, it was observed at the first premolar and had less proclination of the lower incisors (Figures 4 and 5). The total deformation showed vertical displacements in each FEM model. With Class II elastics and the CMA, we observed extrusion of the upper anterior teeth, especially the canines, and extrusion of the lower molars. In the Forsus FRD model, extrusion of the upper anterior teeth, intrusion of the upper first molars and intrusion of the lower anterior teeth were observed (Figure 6).
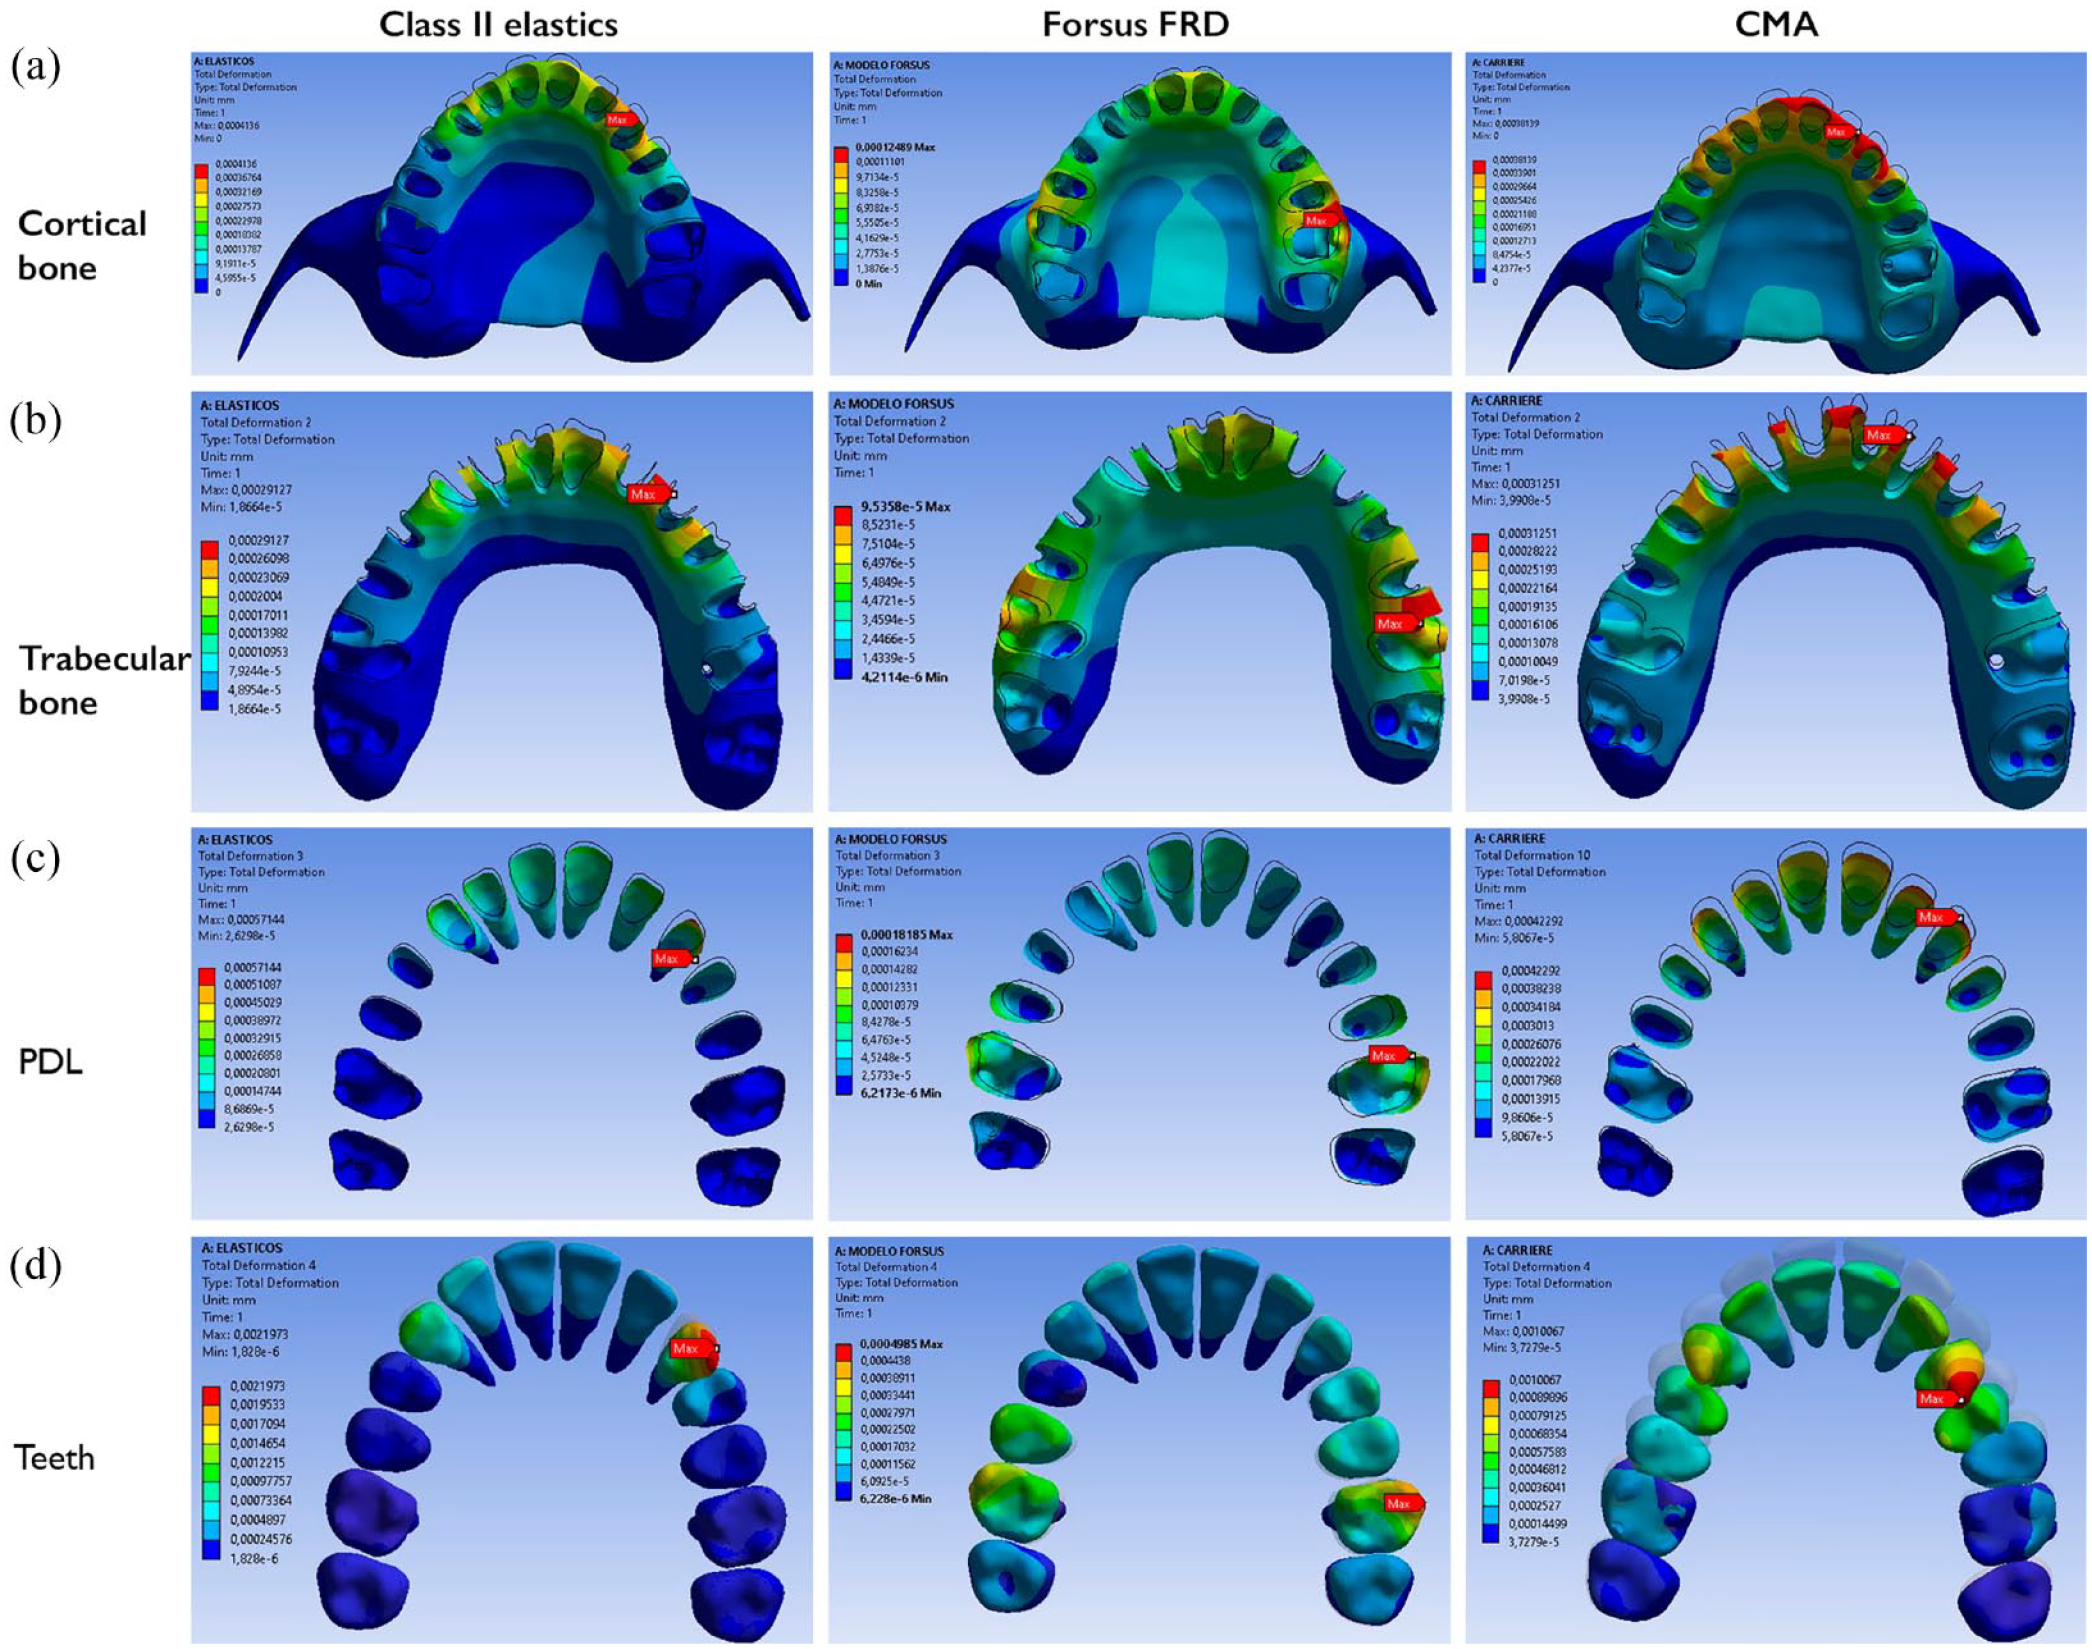
Comparative effects in the total deformation between the FEM models of the three appliances in the maxillary with a deformation scale of 2.2 × 10⁴.
Comparative effects in the total deformation between the FEM models of the three appliances in the mandible with a deformation scale of 2.2 × 10⁴.
Comparative vertical effects of the total deformation on the PDL between the FEM models of the three appliances.
Discussion
This study aimed to evaluate three Class II correctors from the biomechanical point of view using the hypothesis that having individual active components, located at different places at the upper and lower dentition, could have a distinct distribution of the stresses and total deformation. Cattaneo et al. (2005) highlighted the importance of the stress/strain distribution within the PDL and the surrounding alveolar bone when an orthodontic load and corresponding tooth movement is applied. Diverse studies (Meikle et al., 1984; Tanne and Sakuda, 1991) have shown that the compressive and tensile stresses from orthodontic forces are essential factors in the remodelling of the bones; they change the cellular activity in the PDL, which results in bone resorption or deposition and leads to the intra-alveolar displacement of the teeth. FEM is non-invasive and allows observation of the stress/strain distributions in alveolar support structures and analysis of the possible biomechanical behaviours of different orthodontic appliances (Knop et al., 2015).
In the present study, we found that the highest stresses (von Mises yield and maximum principal stress) were located in the upper canines (Class II elastics and CMA) or upper first molars (Forsus FRD and CMA). In the lower arch, maximum stresses were observed in the lower first molars (Class II elastics and CMA) or lower first premolars (Forsus FRD). Similar results were found by Akış and Doruk (2018), who investigated the biomechanical effects of Forsus FRD with and without miniscrews in the maxillary and mandibular teeth. They found that the maximum and minimum principal stresses were observed in the neck areas of the first upper molars and in the buccal neck of the lower canines, which was the anchorage site on the lower arch for the push road in their study (in our study, the anchorage site was distal to the first premolars). Chaudhry et al. (2015) evaluated the stress distribution on the mandible using the Forsus FRD versus the resting stage and found that the highest von Mises yields were in the cortical bone from the canines to the premolar area. Chai et al. (2009) conducted an FEM study analysing the stress distribution in mandibles advanced with Forsus FRD and found that the concentration of the stress was observed in the anterior part of the condyle, mandibular notch and lower molars, and the areas of maximum displacement were observed at the chin and lower incisors. In a FEM study of Class II elastics and clear aligners, Wang et al. (2022) found that the stress on the PDL was concentrated in the lower first molars: there was compressive stress in the mesial cervical region and tensile stress in the buccal-distal cervical region. In the present study, we also found the highest concentration of stress in the lower arch at the first molars in the Class II elastics model, but we noted compressive stress in the buccal distal region and tensile stress in the mesial cervical region. Xie and Li (2021) found that with Class II elastics, the highest von Mises yield in the lower arch at the PDL was located in the distal root of the first molars, which decreased gradually in the mesial direction.
We also observed that the stress was distributed in different areas of the anterior and posterior regions of the maxillo-mandibular dentition depending on the simulated appliance. Thus, there was distal displacement of the upper dentition and mesial displacement of the lower dentition in all three models. However, the distribution of the total deformations differed in each model. In the upper arch, the displacements in the Class II elastics model were from the upper first premolars and canines to the anterior teeth. Almost no deformation was observed in the posterior teeth. With the Forsus FRD, the displacements were from the first molars to the premolars and to the anterior teeth. With the CMA, the displacements were from the canines and premolars to the anterior teeth. The three simulations showed palatal displacement of the upper incisors and distal displacement of the upper posterior teeth, but greater retroclination of the anterior teeth was shown in the CMA model and greater upper molar distalisation in the Forsus FRD appliance. In the lower arch, for the Class II elastics and CMA models, the displacements were from the second and first molars to the anterior teeth. For the Forsus FRD, the displacements were from the first premolar molars to the anterior teeth. All the models showed mesial displacement of the lower dentition with proclination of the lower incisors. The Class II elastics model showed the greatest displacements for both the molars and lower incisors.
FEM studies on Class II elastics have found similar results. Chang (2004) found that, with Class II intermaxillary elastics, the initial bodily displacements were concentrated in the anterior part of the upper dentition. Wang et al. (2022) evaluated the displacement and stress distribution of mandibular dentition by various positions of Class II elastics during en masse retraction in clear aligner therapy. They found lingual tipping of the lower central incisors and mesial tipping of the lower first molars, producing mandibular anchorage loss. Xie and Li (2021) studied the influence of the cross-sectional shape of ribbon archwires on intermaxillary traction in Class II malocclusion treatment and found mesial displacement of the lower dentition and labial-oriented inclination of the anterior teeth. FEM studies with Forsus FRD (Akış and Doruk, 2018; Chaudhry et al., 2015) were consistent with our findings. Kumar et al. (2022) evaluated the stress distribution and the displacements produced by a Forsus FRD anchorage to a miniplate and found retrusive movement of the maxillary incisors and mesial displacement of the mandibular molars, but with less proclination in the mandibular incisors.
In the present study, the Forsus FRD model showed stress in the buccal cervical region of the upper first molars, indicating that distal and expansive force was produced in this region. Similar results were found by previous authors using Forsus FRD or similar Class II correctors in FEM studies (Akış and Doruk, 2018; Duggal et al., 2021). Therefore, if this expansion effect in the upper molars is not clinically necessary, it must be controlled with a transpalatal arch or similar appliance.
As for the vertical dimension, we observed extrusion of the upper anterior teeth in all three models and extrusion of the lower molars in the Class II elastics and CMA models. The Forsus FRD showed intrusion of the upper molars and lower incisors. Our results agree with diverse clinical studies of the studied appliances (Aras and Pasaoglu, 2017; Cacciatore et al., 2014a; Jones et al., 2008; Kim-Berman et al., 2019; Xie and Li, 2021).
Few clinical studies (Aras and Pasaoglu, 2017; Jones et al., 2008; Yin et al., 2019) have compared dentoalveolar effects in the Class II correctors simulated in our study. Jones et al. (2008) found greater distal movement of the upper molars, retroclination of the upper incisors, mesialisation of the lower molars and proclination of the lower incisors in the Forsus group than in the Class II elastics group. On the contrary, Aras and Pasaoglu (2017) found that Class II elastics produced more palatal tipping on the maxillary incisors in individuals with Class II subdivision malocclusions, that both the Class II elastics and Forsus groups proclined the lower incisors, and that the Forsus group showed significantly greater improvement in overjet. Yin et al. (2019) compared the clinical effects of the CMA, Class II elastics and Forsus FRD, finding greater Class II molar and canine correction in the Forsus group, followed by the CMA and Class II elastics groups. They also found that part of the Class II corrections with the CMA were achieved by derotating the maxillary first molars distally.
In our study, the CMA showed the greatest palatal displacement of the upper incisors. This may be related to the fact that the CMA has been previously used to fix appliances, unlike Class II intermaxillary elastics and Forsus FRD, which are used over rectangular wires into the brackets. This brings not only more anchorage, as the dentition can move as a unit, but it also allows more torque control at the anterior teeth because of the couple between the 0.19 × 0.25-inch stainless-steel archwire in the bracket slot (Arreghini et al., 2014; Kusy, 2005).
In our study, we observed asymmetry in the deformations between the right and left sides of the maxilla and mandible. These differences in the results obtained from the simulated models are due to the non-symmetry of the geometry used. The geometry was obtained from a patient’s CBCT, where the distribution of teeth and bone was modelled in the full arch, and the right and left sides were not exactly the same.
These findings may help clinicians understand different patterns of stress distribution and displacements from these Class II correctors, which may lead to different biomechanics used to correct Class II malocclusions. Clinicians should choose treatment based on individual patient needs and not on clinician preferences or branding.
This study considered the non-linear viscoelastic properties of the PDL, as other authors (Minch, 2013; Srirekha and Bashetty, 2010) have found that the loading of the periodontium cannot be explained as the simple compression/tension along the loading direction, but as a more complex structure that is in charge of transmitting the orthodontic force for bone remodelling to allow tooth movement. Thus, a non-linear analysis may provide more accurate and reliable results (Cattaneo et al., 2005; Hemanth et al., 2015). Although the mechanical behaviour of bone and teeth also fits within the non-linearly elastic properties (Tanne et al., 1995), in this study, they were assumed to be linearly elastic, isotropic and homogeneous in order to simplify the solutions. This choice was made considering the time-consuming nature and increased computing power required for non-linear models. Furthermore, the lack of scientific data for assigning non-linear mechanical properties to these structures could introduce errors in the computer simulation. However, it is recommended that future studies take into account the heterogeneity and anisotropy of bone and teeth for a more comprehensive analysis.
The present study has some limitations, as the calculations were made using a mathematical model. Therefore, they may not accurately simulate the complex biological dynamics of tooth movement. Another limitation is that FEM studies can record only instantaneous stress patterns, not clinical situations in orthodontic treatments that are carried out over longer periods. Therefore, the results of the present study must be taken with caution, and we recommend that more randomised clinical trials be performed to compare these effects in vivo.
Conclusion
In the upper arch, maximum stresses were localised in the upper canines (Class II elastics and CMA) and upper first molars (Forsus FRD and CMA). In the lower arch, maximum stresses were observed in the lower first molars (Class II elastics and CMA) and lower first premolars (Forsus FRD). The total deformation in the upper arch showed the maximum displacements in the distal direction at the upper canines (Class II elastics and CMA) and upper first molars (Forsus FRD). Differences were observed in the distribution of the total deformation among the three Class II correctors. Greater palatal displacement of the anterior teeth was observed in the CMA model, greater proclination of the lower incisors was noted in the Class II elastics model and greater distal movement of the upper first molar was seen in the Forsus FRD model.
Footnotes
Acknowledgements
The authors acknowledge the mechanical engineer, Ricardo Augusto Ríos Linares, MSc in Engenieering, who runs the FEM models.
Declaration of conflicting interests
The author(s) declared no potential conflicts of interest with respect to the research, authorship, and/or publication of this article.
Funding
The author(s) received no financial support for the research, authorship, and/or publication of this article.