
Abstract
Objectives:
To determine differences in the location of centre of resistance (Cres) between functional and hypofunctional teeth and to evaluate the relationship between the pulp cavity volume and locations of the Cres, using the finite element (FE) method.
Design:
Retrospective cohort study.
Participants:
FE models of right maxillary central incisor, derived from cone-beam computed tomography (CBCT) images of 46 participants, were divided into normal function (n = 23) and hypofunction (n = 23) groups using anterior overbite and cephalometric measurements.
Methods:
Measurements of the tooth and pulp cavity volume were made from the CBCT. Cres levels were presented as percentages of the root length from the root’s apex. All data were analysed and compared using the independent t-test (P < 0.05). The relationship between the location of Cres and volume ratios were evaluated statistically.
Results:
The means of the pulp cavity/tooth volume and root canal/ root volume ratio of the maxillary central incisor in the anterior open bite group were significantly greater than those in the normal group. The average location of Cres in the anterior open bite group was 0.6 mm (3.7%) apically from the normal group, measured from root apex. The difference was statistically significant (P < 0.01). There was a significant correlation between root canal/root volume ratio and locations of Cres (r = −0.780, P < 0.001).
Conclusions:
The Cres in the hypofunctional group was located more apical than the functional group. As the pulp cavity volume increased, the level of Cres shifted apically.
Introduction
Normal occlusal loading plays a crucial role in maintaining the structural integrity of the periodontal ligament. Teeth that do not have occlusal loading (e.g. in open bite malocclusion) are so-called hypofunctional teeth. Atrophic changes have been reported in the periodontium of hypofunctional teeth, including reduced alveolar bone mass, narrow periodontal ligament space, reduced root surface areas and structural changes of the gingiva (Motokawa et al., 2013a; Steigman et al., 1989; Suteerapongpun et al., 2017). Moreover, hypofunctional teeth are more prone to abnormal root shapes and root resorption compared to functional teeth (Motokawa et al., 2013b). Furthermore, a recent study showed that occlusal hypofunction resulted in increased pulp cavity volume and decreased root volume (Kuharattanachai et al., 2021).
Tooth anatomy can vary among individuals and different races (Brook et al., 2009). Studies have consistently shown that there is sexual dimorphism in tooth size, with male individuals generally having larger teeth than female individuals (Alvesalo, 2009). In addition, there are reported differences in tooth size among different ethnic groups, with African and Native American individuals having larger teeth compared to those of Asian individuals (Brook et al., 2009). It is important to consider the potential diversity in tooth anatomy when identifying the position of the centre of resistance (Cres) in orthodontic treatment. The position of Cres is influenced by various factors, including tooth geometry, root length, pulp size and the environment surrounding the tooth (Choy et al., 2000). Therefore, differences in tooth anatomy among races may have implications for the predictability of orthodontic treatment outcomes. The Cres is a reference point crossed by a force vector at which bodily tooth movement is achieved (Smith and Burstone, 1984). It is important to identify the location of the Cres clearly so that orthodontic tooth movement can be predicted. Moreover, a recent finite element (FE) study demonstrated that the dental pulp cavity affected the location of the Cres in maxillary central incisor models, which resulted in an apical shift in the Cres (Kuharattanachai et al., 2022). Accordingly, variations in tooth dimension and pulp cavity volume in hypofunctional teeth, may alter the position of the Cres.
Treatment modalities for anterior open bite malocclusion differ depending on the patient’s age, aetiological factors and severity of the malocclusion. In mild-to-moderate anterior open bite malocclusion, a camouflage orthodontic treatment aims to compensate for the abnormal tooth position. Retraction of anterior teeth results in uprighting and relative extrusion as the crown is retracted below the centre of rotation (Sarver and Weissman, 1995). By using the multiloop edgewise archwire (MEAW) technique, the open bite is corrected by retraction and extrusion of the anterior teeth (mostly maxillary) while maintaining the vertical position of the molars, thus preventing severe backward rotation of the mandible (Erdem and Küçükkeleş, 2018). The extrusion arch technique exerts a force on the maxillary incisors located anterior to the Cres, resulting in force moment that tends to upright the anterior teeth (Vasconcelos et al., 2020). Therefore, control of force vectors and moments is crucial to obtain desired tooth movement, such as uncontrolled tipping, controlled tipping, translation (bodily movement) or root torque (Jang et al., 2010).
The objectives of this study were to compare the location of the Cres of maxillary central incisors in patients exhibiting anterior open bite with patients exhibiting anterior normal overbite, and to evaluate the relationship between the pulp cavity volume and locations of the Cres.
Participants and Methods
Participants and image acquisition
All procedures performed in studies involving human participants were in accordance with the ethical standards by the Human Experimentation Committee, Faculty of Dentistry, Chiang Mai University (No. 63/2020). Signed informed consent was obtained from patients before enrolment in the present study. Cone-beam computed tomography (CBCT) images were acquired from 46 participants who required pretreatment CBCT for orthodontic treatment. The CBCT images were obtained using the NewTom Giano (Verona, Italy) CBCT unit at 90 kV, an 8 × 8 cm field of view and a voxel size of 0.16 mm.
The inclusion criteria were as follows: aged 15–29 years; Class I sagittal skeletal relationship (A point, nasion, B point [ANB] angle of 2° ± 2°); presence of all permanent maxillary teeth and complete root formation (except for the third molars); and no history of previous orthodontic treatment. Participants with abnormal tooth morphology, evidence of root resorption, radiographic signs of periodontitis or periapical lesions, abnormal oral habits and craniofacial anomalies were excluded.
Lateral cephalometric radiographs were then collected for all participants and were digitally traced using the Dolphin imaging software version 11.9 (Dolphin Imaging & Management Solutions, Chatsworth, CA, USA). Participants were divided into two groups according to the six cephalometric measurements: (1) the sella-nasion (SN) to gonion-gnathion (GoGn) angle; (2) the SN to palatal plane (PP) angle; (3) the PP-GoGn angle; (4) the gonial angle; (5) the facial index; and (6) the ratio of posterior to anterior face height. Participants were classified as an anterior open bite group when ⩾3 measurements presented open vertical skeletal configuration. If ⩾4 measurements demonstrated normal vertical skeletal configuration, the participants were classified as a normal overbite group. The normal overbite group had anterior normal overbite (overbite = 0–2 mm). The anterior open bite group had anterior open bite (overbite < 0 mm).
Generation of the models
The surface models of the teeth and periodontal structures were created based on CBCT images using an image processing software (Mimics Research Software version 17.0; Materialise, Leuven, Belgium). The tooth segmentation method was explained in detail in a previous article (Kuharattanachai et al., 2021). Briefly, after orientation of the images in the axial, coronal and sagittal planes, a mask of the areas of interest was created using different threshold values. The selected tooth was manually identified in each slice for segmentation and separation from the surrounding structures. The ‘region-growing’ tool was used to separate the tooth and pulp cavity. Finally, three-dimensional (3D) tooth and dental pulp models were constructed using the ‘Calculate 3-D’ tool. The cemento-enamel junction was traced using the ‘Create curve’ tool to distinguish the root from the crown. By using 3-Matic research software (version 9.0, Materialise), the root length, pulp cavity volume, pulp chamber volume, root canal volume, tooth volume, crown volume and root volume were automatically calculated. The segmentation processes of the tooth and pulp cavity are illustrated in Figure 1a and b.
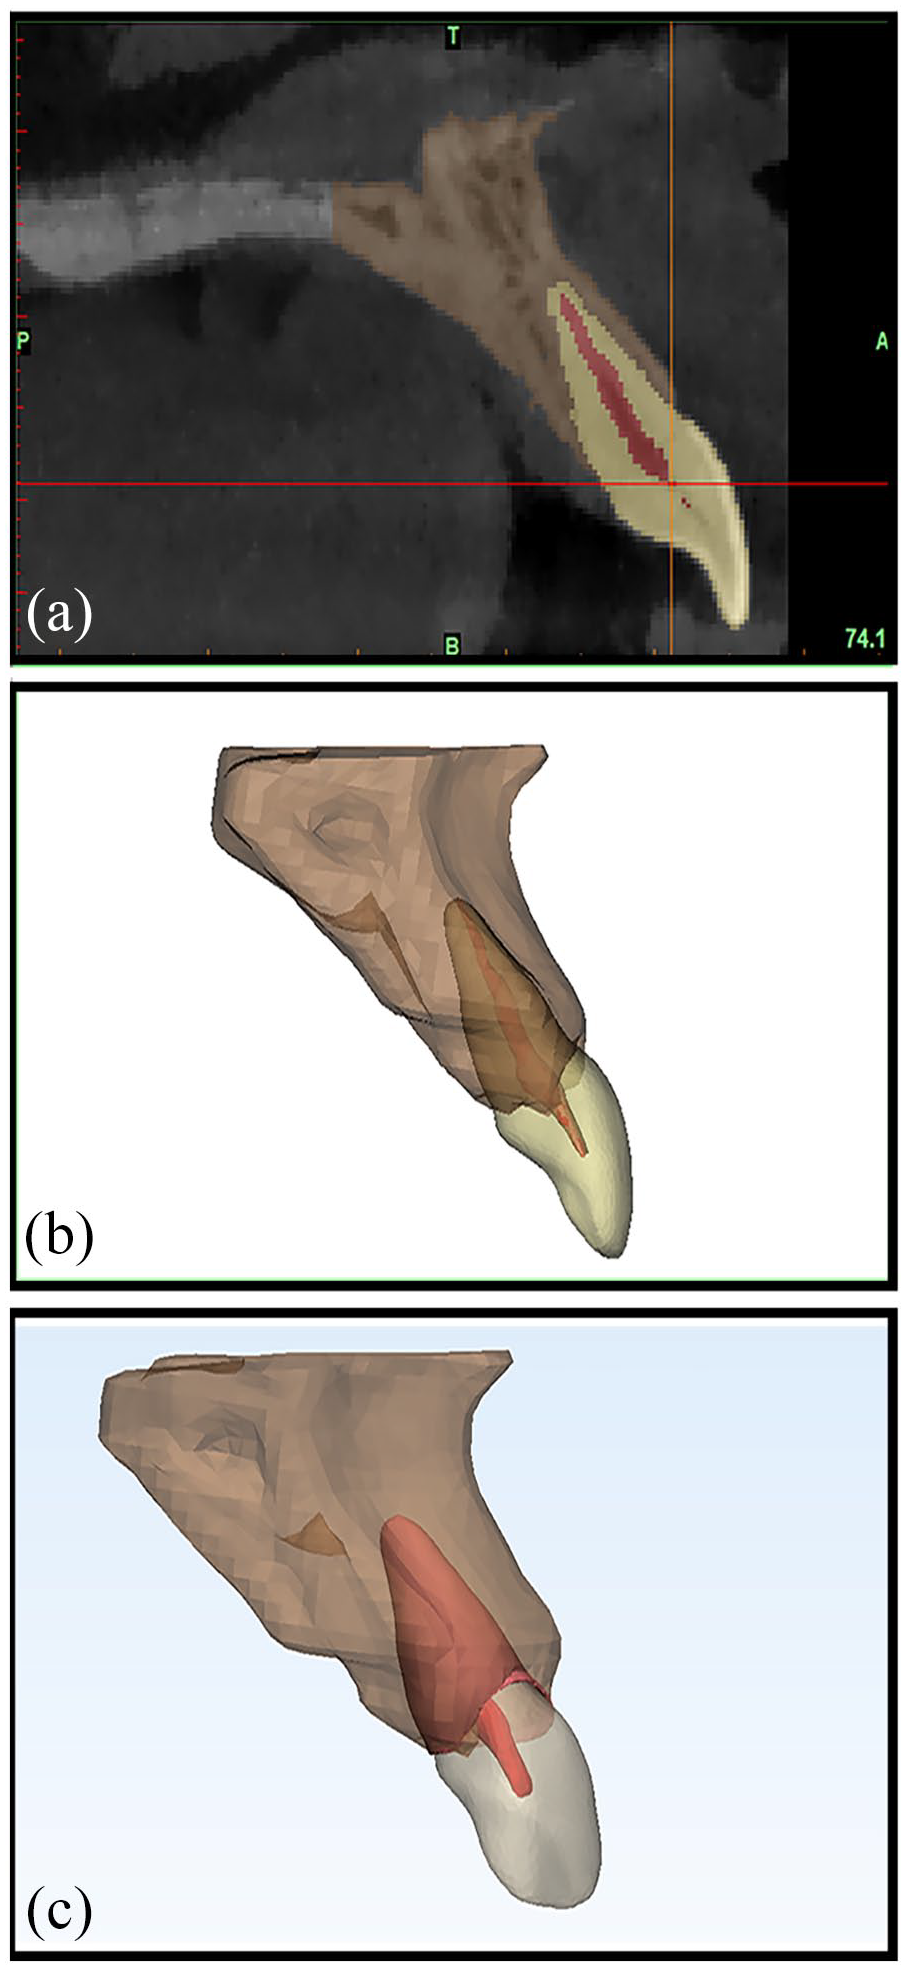
Construction of the finite element model from a right maxillary central incisor. (a) Segmentation of cone-beam computed tomography images, including maxillary central incisor, pulp cavity and alveolar bone, (b) The final segmented image of the model and (c) detailed view of surface mask rendering of maxillary central incisor, pulp cavity, periodontal ligament and alveolar bone.
All measurements were performed by the same examiner. To test intra-examiner reliability, CBCT images of all participants were re-examined after an interval of 4 weeks. An intraclass correlation coefficient (ICC) analysis between two measurements was carried out to evaluate intra-examiner reproducibility.
Finite element procedure
The surface models were converted to a volume model using the Materialise 3-Matic Research 9.0 software (Materialise, Leuven, Belgium) (Figure 1c). The periodontal ligament (PDL) of the maxillary right central incisors with a thickness of 0.2 mm were used, as described in the previous FE method studies (Kojima and Fukui, 2011; Nyashin et al., 2016). Following the previously described method, we limited our loading forces to produce strains within the lower tail of the PDL’s non-linear curve, justifying a linear elastic behaviour of the PDL with E = 0.05 MPa (Viecilli et al., 2013). The alveolar bone crest was constructed to follow the curve of the cemento-enamel junction. All structures were integrated, meshed and analysed in the FE software (ABAQUS, Dassault System S.A., Waltham, MA, USA). The mesh was generated with the isoparametric, 10-noded tetrahedral element (Figure 2a). Altogether, the maxillary central incisor model and its periodontal structures were made up of approximately 35,500 nodes and 123,000 elements. The X, Y and Z axes of the 3D FE model represented the mesio-distal, the bucco-palatal and the inciso-gingival directions, respectively.
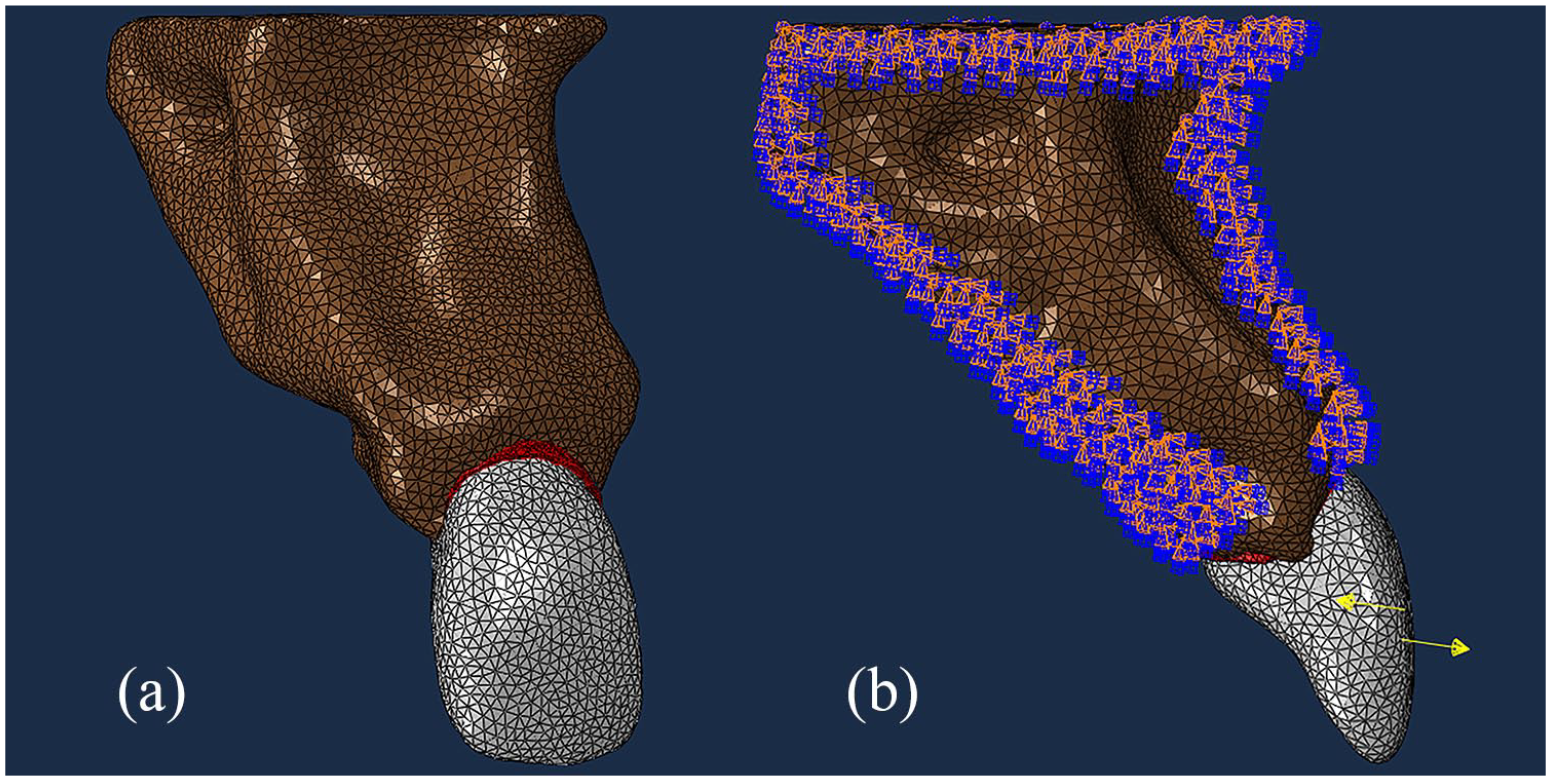
(a) 3D mesh of the finite element model of the right maxillary incisor with periodontal ligament and alveolar bone and (b) The force couples are demonstrated by the yellow arrows at the buccal surface of the tooth. Boundary conditions are indicated by the arrows on the outer surfaces of the alveolar bone. All three translational degrees of freedom of the nodes on the outer surface of the alveolar bone are fixed.
To determine the Cres, the maxillary central incisors were loaded with a couple force of 3 N·mm around the bucco-lingual axis via the buccal surface of the tooth (Figure 2b). The tooth movement consisted of rotation around the centre of rotation (Crot). The initial displacement of the tooth without the surrounding PDL and alveolar bone was displayed using a colour scale according to the calculated amount of displacement. The Crot was the point within the root with the least displacement and was marked by the elements with the least displacement displayed by dark blue color (Figure 3). The Crot was determined and its location was identified as the Cres (Jiang et al., 2016). The Cres position was measured as a percentage of total root length, which was defined as the vertical distance from the apex (0%) to the alveolar bone crest margin (100%). All the nodes on the bottom, mesial and distal surfaces of the alveolar bone were restrained in all degrees of freedom to avoid displacement of the entire model.
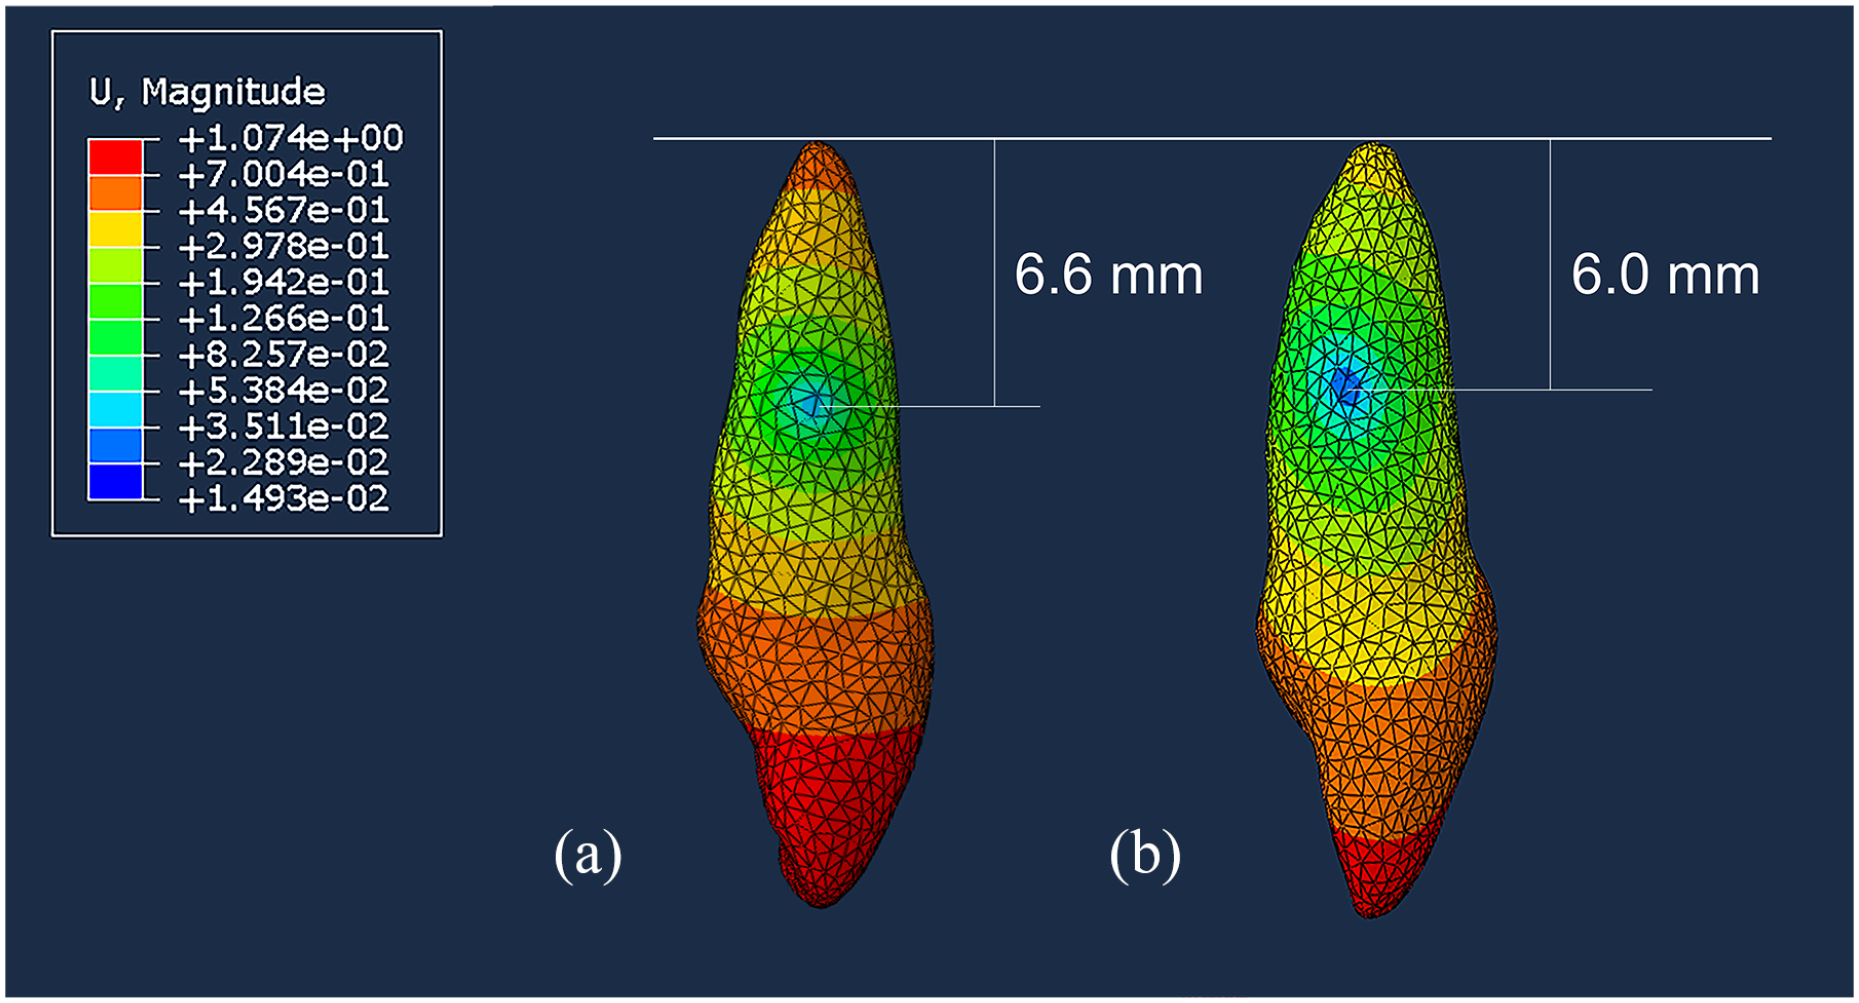
The mean location of the centre of rotation or centre of resistance of the maxillary central incisor when couple force was applied in (a) the normal overbite group and (b) the anterior open bite group. The centre of resistance was represented through the areas with lowest displacement (presented in dark blue).
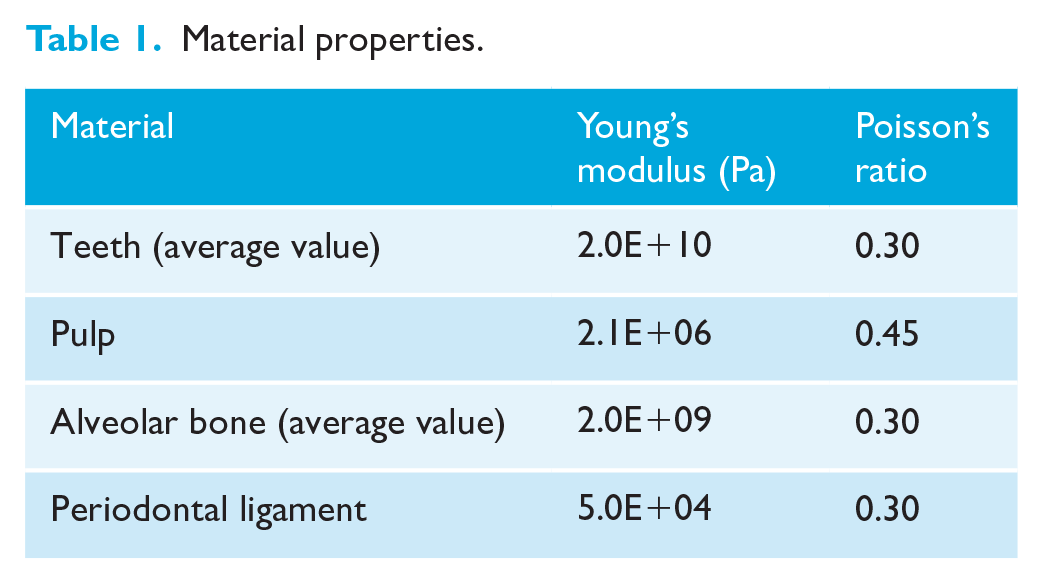
The material parameters of the tooth and its surrounding structures were taken from previously published studies (Moga et al., 2019; Reimann et al., 2007; Viecilli et al., 2013). The PDL was considered a linear, elastic film with a uniform thickness of 0.2 mm. For all calculations, a homogenous, isotropic, linear elastic material behaviour were assumed. Table 1 summarises all material properties used in this study. The contact constraints between the tooth and the PDL and between the alveolar bone and PDL were established with the ‘tie’ feature of the software program.
Material properties.
Statistical analysis
To calculate the required minimum sample size, a pilot study was performed. The sample size calculation was performed using the G*Power software program (version 3.1.9.4, University of Kiel, Germany). Considering a power of 80% and a significance level of 5%, the final sample was composed of 22 participants in each group.
The mean and standard deviations of the root length, pulp cavity volume, root canal volume, tooth volume, root volume, pulp cavity/tooth volume ratio and root canal/root volume ratio were calculated. The distribution was analysed using the Shapiro–Wilk test. The differences between the groups regarding the age and sex of the individuals were evaluated using the independent samples t-test and chi-square test, respectively. The independent samples t-test analysis was performed for the comparison of means of the root length, pulp cavity volume, root canal volume, tooth volume, root volume and volume ratios between the anterior normal overbite group and anterior open bite group.
The location of the Cres was measured from the root’s apex as a percentage of total root length, embedded within the alveolar bone. The average location of the Cres was calculated in the anterior normal overbite group and the anterior open bite group. The mean and standard deviations of all data were calculated and tested for normality using the Shapiro–Wilk test. The independent samples t-test analysis was used to evaluate the difference in Cres coordinates between the anterior normal overbite group and the anterior open bite group. The results were considered statistically significant if P < 0.05.
Pearson’s correlation coefficient was used to determine relationships between the volume ratios and the location of Cres in both types of occlusions. A value of P < 0.05 was considered for statistically significant differences.
Results
The intra-examiner reliability test for measurements in our study showed high intra-class correlation (ICC = 0.901, 95% confidence interval [CI] = 0.778–0.958) and suggested high reliability in measurement.
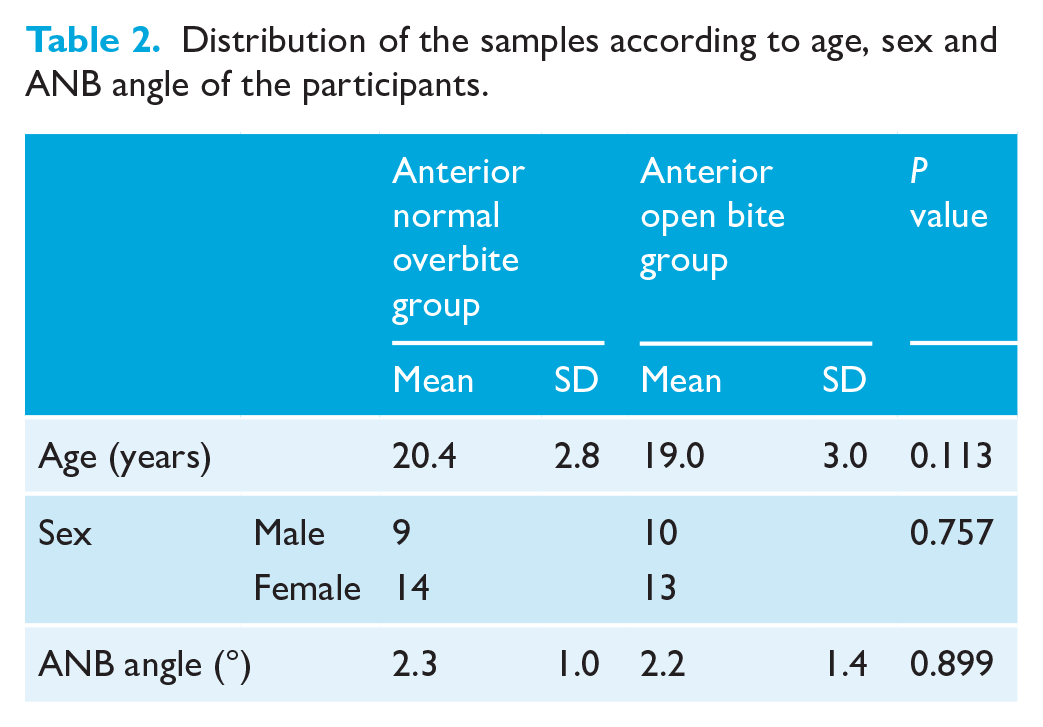
A total of 46 CBCT scans were selected from participants who met the inclusion criteria, with a mean age of 19.7 ± 2.9 years. The anterior normal overbite group consisted of 23 participants (9 men, 14 women; mean age = 20.4 ± 2.8 years) and the anterior open bite group consisted of 23 participants (10 men, 13 women; mean age = 19.0 ± 3.0 years). The demographic data of the participants are presented in Table 2. There was no significant difference between groups regarding age, sex and ANB angle.
Distribution of the samples according to age, sex and ANB angle of the participants.
Descriptive statistics of the root length, pulp cavity volume, tooth volume and the volume ratios for central incisors are shown in Table 3. All data in both groups were normally distributed. There was no significant difference between the mean root length of the anterior open bite group (10.8 ± 0.9 mm) and the anterior normal bite group (11.2 ± 0.8 mm) (95% CI = −0.139 to −0.894, P = 0.148). The mean pulp cavity volume and root canal volume of the maxillary central incisors of the anterior open bite group were significantly greater than those of the anterior normal overbite group (95% CI = −7.077 to −0.971, P = 0.018 and 95% CI = −4.965 to −1.389, P = 0.001, respectively) (Table 3). The mean tooth volume and root volume of the maxillary central incisors of the anterior open bite group were significantly smaller than those of the anterior normal overbite group (95% CI = −7.822 to 69.352, P = 0.015 and 95% CI = 13.162–54.567, P = 0.002, respectively) (Table 3).
Descriptive data of the root length, pulp cavity volume, root canal volume, tooth volume, root volume and the volume ratios for central incisors in both groups.
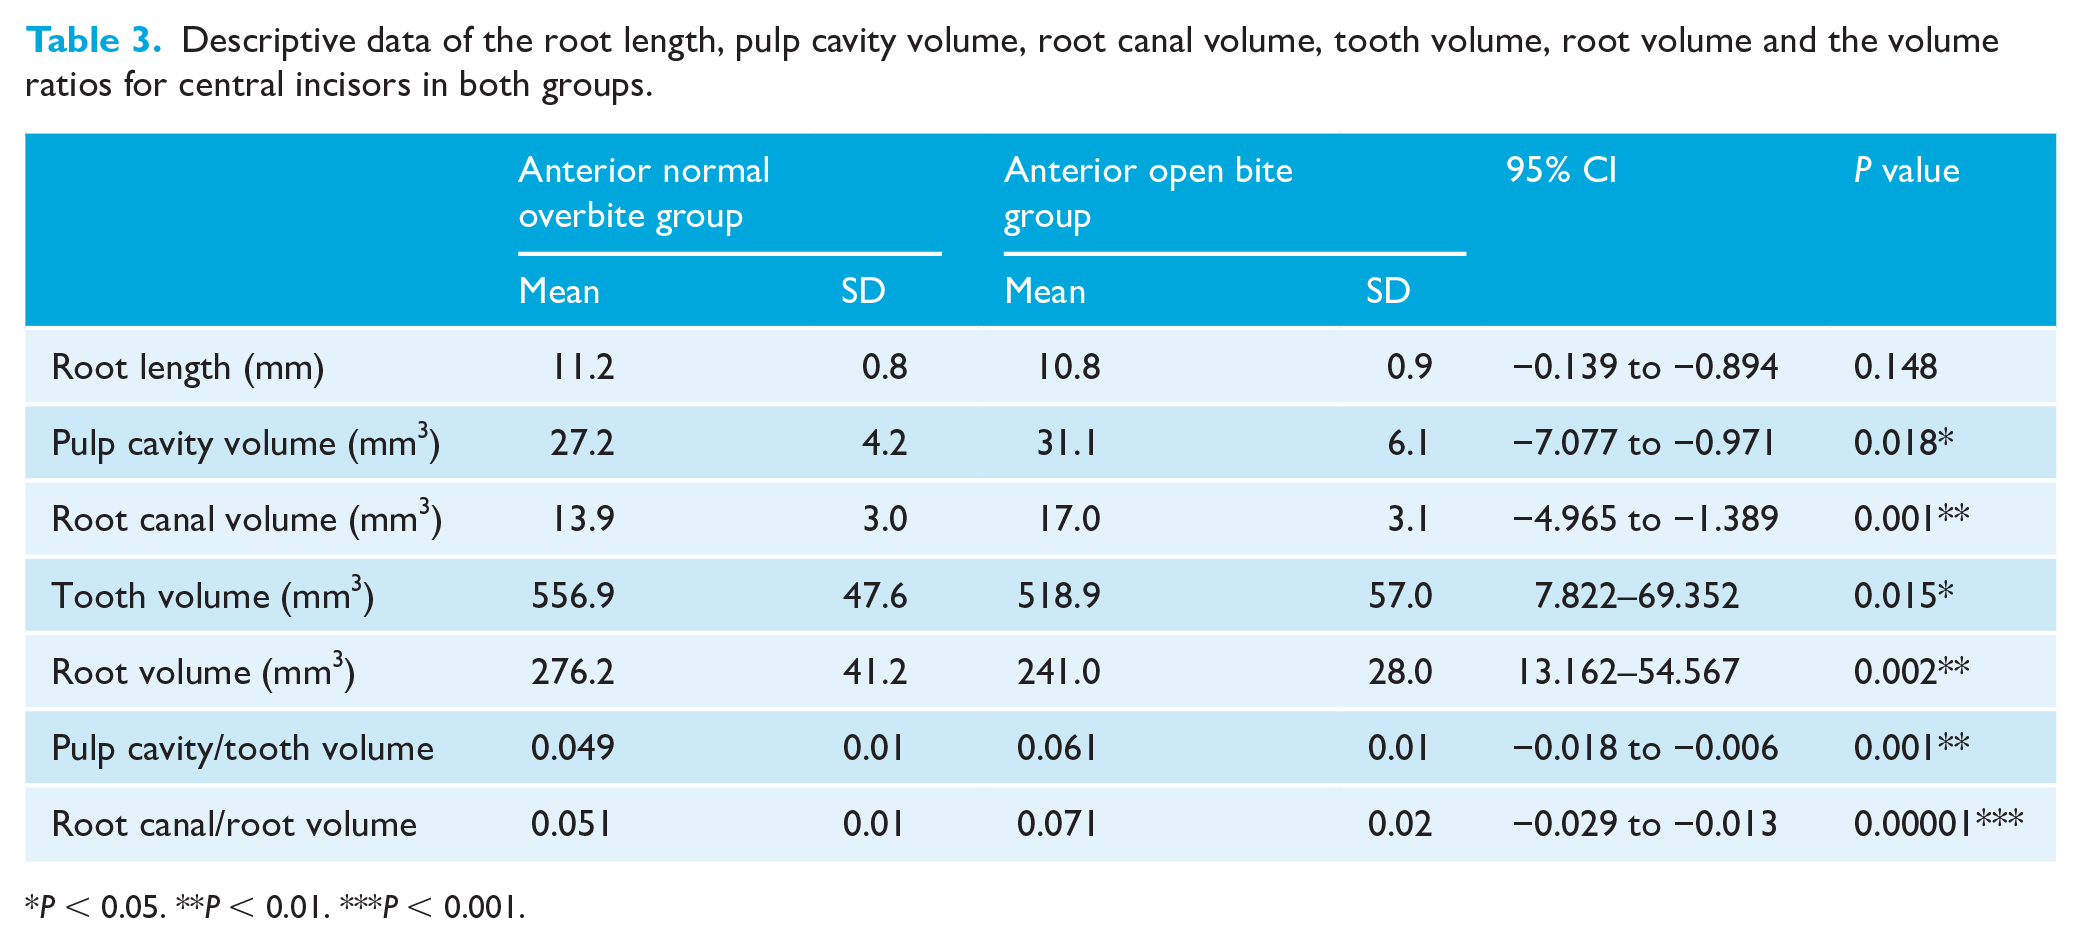
P < 0.05. **P < 0.01. ***P < 0.001.
Considering the effect of individual variation in tooth size, the mean values of the pulp cavity/tooth volume and root canal/root volume ratio were also calculated. Results of the independent t-test demonstrated that the means of the pulp cavity/tooth volume and root canal/root volume ratio of the maxillary central incisors of the anterior open bite group were significantly greater than those of the anterior normal overbite group (P = 0.001 and P = 0.000005, respectively). Whereas there were no significant differences of the means of pulp chamber/crown volume ratio between groups (Table 3).
The average location of the Cres for the maxillary central incisors was 58.6% ± 2.8% (6.6 mm) in the anterior normal overbite model and 54.9% ± 3.3% (6.0 mm) in the anterior open bite model, relative to the root apex. The average difference in the location of Cres of the anterior open bite model was 3.7% (0.6 mm) apically from the anterior normal overbite model and was statistically significant from the independent samples t-test (P = 0.0002).
Pearson’s correlation coefficient was calculated to measure the effect of pulp cavity on the locations of Cres. Based on the analysis, the pulp cavity/tooth volume ratio (r = −0.428, P = 0.004) and root canal/root volume ratio (r = −0.780, P < 0.001) significantly affected the location of Cres. The relationship between the volume ratios and the location of Cres is shown in Figure 4. As the pulp cavity/tooth volume and root canal/root volume ratio increased, the location of Cres shifted more apically.
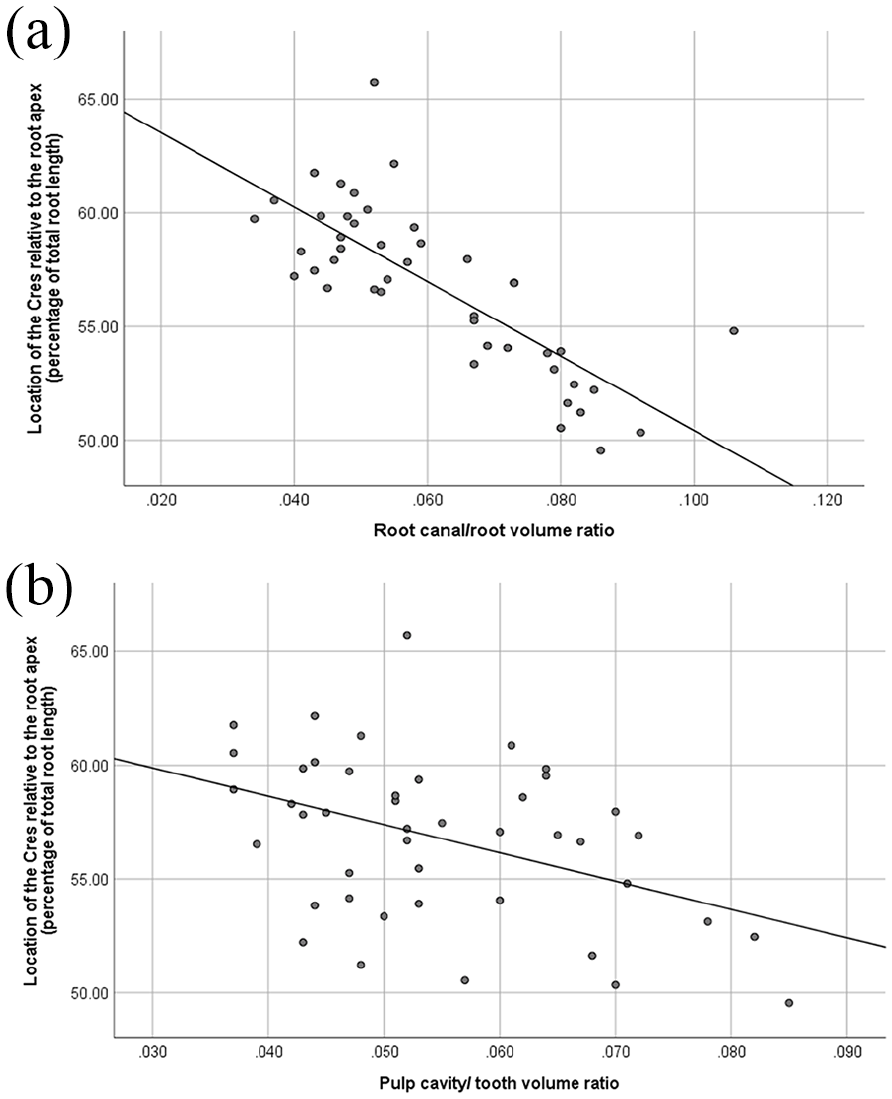
Pearson correlation values between (a) location of the centre of resistance and pulp cavity/tooth volume (b) location of the centre of resistance and root canal/root volume.
Discussion
Summary
The present FE study showed a significant difference in the location of the Cres in the anterior open bite group compared with the anterior normal overbite group. The results revealed that the anterior open bite tooth models produced more apical Cres locations than the anterior normal bite tooth models. Moreover, an increase in the pulp cavity/tooth volume and root canal/root volume ratios generally shifted the Cres location towards the apex of the root. It could be assumed that the pulp cavity volume and root canal volume may influence the location of the Cres.
Comparison with other studies
Our results are consistent with those of several other studies that investigated the association between pulp cavity size and occlusal hypofunction. Previous animal studies found that anterior open bite malocclusion may have an influence on tooth morphology by increasing dental pulp volume and decreasing root surface area (Motokawa et al., 2013a; Steigman et al., 1989). A recent experiment demonstrated that there was an increase in pulp cavity volume and decrease in tooth volume due to occlusal hypofunction in anterior open bite patients (Kuharattanachai et al., 2021). The dental roots of maxillary central incisors in patients with anterior open bite have been reported to be short, which may be related to the loss of occlusal contact (Uehara et al., 2013). The previous study reported that the root surface areas of the maxillary central and lateral incisors in the anterior open bite group were significantly lower than in the normal overbite group (Suteerapongpun et al., 2017). In the present study, the measurements of tooth volume and root volume in the anterior open bite group were found to be significantly lower, and the pulp cavity volume and root canal volume ratio were significantly higher than the anterior normal overbite group. However, the root lengths of the central incisors were not significantly different between groups.
The reduced lifespan of hypofunctional odontoblasts has been proposed as a potential explanation for the atrophic changes in the periodontium of hypofunctional teeth, including reduced alveolar bone mass, narrow periodontal ligament space and reduced root surface areas (Risnes et al., 1995; Steigman et al., 1989). While incisal contact is absent in hypofunctional teeth, previous animal studies suggest that the reduced lifespan of odontoblasts and dentine production may also occur in humans, particularly affecting dentine formation in the root. Therefore, it is reasonable to hypothesise that the presence of hypofunction in patients with anterior open bite may primarily affect the dentine formation of the root. Moreover, the literature suggests that the absence of occlusal function can impact the healing of periodontal injuries by altering the healing process, leading to reduced formation of bone and cementum and a higher incidence of ankylosis (King and Hughes, 1999).
The influence of aging on the size of the pulp cavity is well-established, whereby the process of secondary dentine deposition commences following the completion of tooth eruption, leading to a reduction in its size over time (Venkatesh et al., 2014). A micro-CT imaging study further highlights that this decrease in pulp cavity volume typically occurs in men aged 50–60 years and in women aged 40–50 years (Agematsu et al., 2010). As the present study focused on patients aged 15–29 years, it can be concluded that age-related secondary dentine formation did not have any impact on the volume of the pulp cavity in this study.
Similar to other reports, our results found that the Cres was located at approximately a half to two-thirds of the root length, measured from the root apex (Table 3). Tanne et al. (1988) reported that the Cres of the maxillary central incisor was positioned at approximately 76% of the root length from the apex. An FE study by Geramy reported a position of 58% of the root length from the apex using the upper central incisor tooth model without alveolar bone loss (Geramy, 2000). The results obtained from single-rooted teeth in human jaw specimens revealed that the Cres was located at 58% of the alveolar height, measured from the root apex, regardless of root length and force direction (Poppe et al., 2002). The mean Cres value of 57.2% from the root apex was obtained from FE simulations of initial tooth movement (Geiger and Lapatki, 2014). In our study, the location of the Cres was in the range of 50%–65% of the root length, measured from the apex. The results were partly consistent with prior studies, especially regarding the Cres of the normal overbite group (58.6% from root apex); however, the average Cres in the anterior open bite group was located more apically than in some previous studies (54.9% from root apex).
Previous studies of Cres determination did not integrate the pulp cavity into the FE for calculation (Geiger and Lapatki, 2014; Geramy, 2000; Poppe et al., 2002; Tanne et al., 1988). However, every tooth has a pulp cavity, which must be taken into consideration. Our recent FE study revealed that when integrating the dental pulp cavity in the FE models, the deformation of the tooth within the alveolar bone was greater in the pulp cavity model compared with the solid model (Kuharattanachai et al., 2021). Moreover, the Cres was located in a more apical direction in the model with pulp cavity (Kuharattanachai et al., 2021). The current study evaluated maxillary central incisors obtained from CBCT images of orthodontic patients instead of teeth from dental study model. The 3D tooth models derived with this method provided accurate geometry of dentoalveolar structures, which was crucial for FE simulation. The results showed differences in the pulp cavity volume and root canal volume ratios between groups, resulting in different Cres positions between groups. This variation in the Cres location due to dental pulp cavity size has not been emphasised in previous FE studies because most studies calculated the location of the Cres based on commercially available dental models. Variations in the Cres among individuals were reported, emphasising the fact that the Cres is a patient-specific parameter. Statistical generalisation of the location of Cres by inferring the results from a sample and applying them to a population might produce errors (Gandhi et al., 2021). The method applied in this study can be used for generating FE models from individuals and enables the clinician to locate the position of Cres more precisely. The findings of this research could be used as biomechanical guidelines for clinical treatment planning in individual patients.
Implications for clinical practice
Orthodontic tooth movement depends on the relationship between the forces generated by the orthodontic appliance and the location of the Cres. The Cres of a tooth may change depending on geometric variables of the tooth itself, the direction of applied forces and the structures surrounding the tooth (Nyashin et al., 2016). Our previous FE study found that integration of the dental pulp cavity into the model may influence the Cres of the teeth (Kuharattanachai et al., 2022). The results of this study present clear support for the influence of dental pulp cavity volume on the location of the Cres by relocating the Cres apically. Furthermore, the results indicated that there was a moderately negative linear relationship between pulp cavity volume and location of the Cres, whereas a strong negative linear relationship was found between root canal volume and location of the Cres.
The crown-root angle of incisors exhibits substantial variation in shape, form, and size, with a difference of over 24° between the minimum and maximum values reported in a study. This variation is critical during orthodontic treatment as it significantly influences the final position of the tooth. When a retraction force is applied, the low crown-root angle model exhibits a smaller vertical distance between the force application point and the tooth’s centre of resistance than the normal group. As a result, less moment is produced, which leads to less stress in the periodontal ligament of the tooth with a low crown-root angle. In addition to the aforementioned variables, the location of the Cres depends on the geometry and boundary conditions of the root and the support from the periodontal ligament and bone (Bulcke et al., 1987; Jiang et al., 2016). Therefore, it could be assumed that differences in root morphology have a significant influence on the location of the Cres, which has already been demonstrated in FE studies using single-tooth models (Jiang et al., 2016; Poppe et al., 2002; Tanne et al., 1991). This assumption is supported by the results of FE simulation in the present study. Thus, the deviation of the Cres location should thus be more pronounced for higher root canal/root volume ratio teeth, as observed in this study.
Three-dimensional control of anterior tooth movement represents a fundamental stage of orthodontic treatment. To control tooth movement, the relationship between the line of force and the location of Cres should be precisely determined. Our results indicated that, in the hypofunction group, the location of the Cres generally predicted translational tooth movement was located more apically due to a high pulp cavity/tooth volume and root canal/root volume. A decrease in pulp cavity volume appears to be due to age-associated secondary dentine deposition and may be influenced by local factors, resulting in an increase in the pulp cavity volume. In addition, pulp cavity volume may be increased and root size possibly reduced due to disuse atrophy resulting from occlusal hypofunction in anterior open bite malocclusion (Motokawa et al., 2013b; Steigman et al., 1989). Therefore, changes in the pulp cavity volume are associated with increasing age and hypofunctional occlusion. The relocation of the line of force action could be proposed in some patients, such as anterior open bite and young patients. These findings present general trends of the effect of pulp cavity volume on the location of the Cres; however, tooth movement during orthodontic therapy should always be observed and compared with the desired treatment plan. Our results provide reasonable modelling approaches for generating quantitative data on Cres locations based on the individual patient.
The FE method has been widely applied to examine the mechanical properties of the PDL. Differences in the mechanical modelling of PDL properties could affect the location of the Cres. The physical properties of the PDL were assumed to be non-linear and the thickness non-uniform due to uneven alveolar bone surfaces. Due to a lower CBCT resolution, the PDL could not be identified and segmented from the images; therefore, the root was first identified, then the PDL was grown from the surface of the root at a uniform thickness of 0.2 mm. In previously published studies, the material properties of the PDL were modelled as both linear and non-linear elastic (Jiang et al., 2016; Kojima and Fukui, 2011; Nyashin et al., 2016; Viecilli et al., 2013). In our study, couple forces of 3 N·mm were applied to the buccal surface of the tooth, as per a previous study by Viecilli et al. (2008). Maximum PDL principal strains were lower than 7.5% in all directions with this applied load (Viecilli et al., 2013). Therefore, linear modelling of the PDL for FE simulation could be considered adequately accurate (Viecilli et al., 2008).
Limitations
The limitation of this FE study is that the results are appropriate only for initial tooth movement, which was performed by elastic deformation of the PDL. Long-term orthodontic tooth movement might not be identical to the initial tooth movement. Calculation models for the FE simulation used in the present study were made based on a single tooth because the process to create an accurate model is very time-consuming. Furthermore, the force system might vary with tooth movement when many teeth are integrated into the model for calculation.
Conclusions
Occlusal hypofunction in anterior open bite malocclusion may have an influence on tooth morphology by increasing dental pulp volume and decreasing tooth volume. The Cres of maxillary central incisor was located more apically in the anterior open bite model. As the pulp cavity/tooth volume and root canal/root volume ratio increased, the location of Cres shifted in more apical direction.
Footnotes
Acknowledgements
We wish to thank Cambridge Proofreading & Editing for their help with the English proofreading.
Data availability
The data underlying this article will be shared on reasonable request to the corresponding author.
Declaration of conflicting interests
The author(s) declared no potential conflicts of interest with respect to the research, authorship, and/or publication of this article.
Funding
The author(s) disclosed receipt of the following financial support for the research, authorship, and/or publication of this article: The work was supported by the Research Fund for Postgraduate Student of the Faculty of Dentistry, Chiang Mai, University, Chiang Mai, Thailand.