
Abstract
Objective:
To determine the psychometric properties of a pre-existing orthodontic satisfaction questionnaire and to assess patient satisfaction of their orthodontic treatment.
Design:
Psychometric assessment of a pre-existing orthodontic satisfaction questionnaire.
Setting:
Two sites at King’s College Hospital NHS Foundation Trust.
Participants:
Individuals aged 12–15 years who had completed fixed orthodontic treatment.
Methods:
An expert panel assessed a pre-existing orthodontic treatment satisfaction questionnaire for validity and readability. As a result, revisions were made to the questionnaire and it was distributed to 103 participants aged 12–15 years, on completion of their fixed orthodontic treatment (T1). Test–retest reliability of the questionnaire was assessed through completion of a second questionnaire by 17 participants, at a two-week interval (T2). The questionnaire was assessed for reliability using item-total correlations (I-TC) and Cronbach’s alpha. Factor analysis allowed exploration of the underlying factor structure of the questionnaire. Test–retest reliability was assessed using Cohen’s kappa coefficient. Multiple regression analysis was used to find out the significant demographic variables that predicts the satisfaction level of treatment.
Results:
Following validity and readability assessment by the expert panel, the questionnaire was revised. Eleven items were removed following item analysis (with I-TC ⩽ 0.3). Factor analysis was deemed uninterpretable. The overall scale demonstrated greater reliability than the underlying sub-scales. Therefore, the sub-scales were removed, resulting in one scale which assessed overall orthodontic satisfaction, comprising 37 items, with a Cronbach alpha of 0.92. The test–retest reliability of the revised 37-item scale was deemed to be poor (kappa coefficient = 0.39). Multiple regression analysis identified ethnicity as a significant predictor of orthodontic treatment satisfaction (P = 0.01).
Conclusion:
This study provides a valid measure to assess orthodontic treatment satisfaction for use in a UK population aged 12–15 years on completion of fixed orthodontic treatment.
Introduction
Patient satisfaction is a primary aim of orthodontic treatment and can determine whether the treatment is a success or failure. For the level of patient satisfaction to be established, appropriate outcome measures are required that should be reliable and valid for the population in which they are being used (Nair et al., 2018).
The purpose of assessing the validity of a questionnaire is to ensure that it measures what it intends to measure, for which there are several methods. Content validity is defined as: ‘Determination of the content representativeness or content relevance of the items of an instrument’ and may be quantified by use of the Content Validity Index (CVI) (Lynn, 1986). Face validity is a qualitative method, where the content is judged by lay persons or experts for its representativeness within the questionnaire, which includes its relevance to the construct, readability and clarity of language. Although this is often beneficial, face validity is considered a weaker form of validity due to its subjective nature (Lynn, 1986; Mosier, 1947; Yassir et al., 2017). Construct validity has been defined as ‘the degree to which a test measures what it claims, or purports, to be measuring’ (Cronbach and Meehl, 1995). Typically, this is determined through a process of exploring with an expert group the underlying construct and developing assessments of those constructs – usually items in a questionnaire. The Orthodontic Satisfaction Questionnaire explored in the current study was developed in this manner (Bos et al., 2003).
Previously, studies have often assessed parental satisfaction with their child’s treatment (Baheti et al., 2015; Bennett et al., 1997, 2001; Mascarenhas et al., 2005), and outcomes as perceived by the orthodontist (Bos et al., 2005; Katz, 1978). However, this does not necessarily reflect the opinions of the patient (Katz, 1978) and therefore gaining treatment outcomes from the patient’s perspective is preferable (Nair et al., 2018). Age-appropriate outcome measures have also been recommended to ensure the readability level is suitable for the patient with which it is being used (Phillips, 1999), as the levels of understanding will differ between patients of varying age and cognitive development status.
Measuring patient satisfaction in the form of one question alone such as ‘How satisfied are you with your orthodontic treatment overall?’ has been found to generate high satisfaction levels (Bennett and Tulloch, 1999). However, satisfaction is a multidimensional concept, requiring multi-item questionnaires to adequately assess satisfaction level (Nair et al., 2018). One question alone will miss out many of the subtleties of a global outcome tool, lacking the ability to provide accurate information about the areas of treatment that may lead to a patient’s satisfaction or dissatisfaction (Bennett et al., 2001).
Measurement of patient satisfaction with orthodontic treatment has frequently been undertaken using generic oral health-related quality of life questionnaires such as: The Short-Form 36-Health Survey (SF-36); 14-item Oral Health Impact Profile (OHIP-14); or the Child Perception Questionnaire (PCQ). These instruments were not originally designed for patients undergoing fixed orthodontic treatment and are not directly applicable for use within this patient cohort (Yassir et al., 2017). As such, use of a treatment-specific questionnaire is likely to have greater benefit in determining patient outcomes (Keles and Bos, 2013).
Validation of questionnaires specific to fixed orthodontic treatment has been undertaken in a previous study by Yassir et al. (2017), involving the assessment of validity and reliability of three questionnaires for use with patients undergoing fixed orthodontic therapy, before, during and after treatment. The aim of the present study was to provide a validated age-specific satisfaction questionnaire for use with fixed orthodontic patients in the UK, incorporating items relating to the multidimensional construct of satisfaction, such as the situational aspects of treatment, and the doctor–patient relationship, which have been found in previous literature to have a close association with treatment satisfaction (Bos et al., 2005).
The aims of the present study are as follows:
(1) To determine the readability, reliability and content validity of a pre-existing orthodontic patient satisfaction questionnaire that has been revised for use in a UK population aged 12–15 years who have completed fixed orthodontic treatment;
(2) To assess participants’ demographic variables in relation to their satisfaction with orthodontic treatment;
Materials and methods
A study undertaken to assess patient satisfaction after orthognathic surgery led to the development of a satisfaction questionnaire containing 38 items, assessing patient-centred outcomes of treatment (Phillips, 1999). A subsequent study (Bos et al., 2003) used this questionnaire and translated it into Dutch. Twenty questions were added to allow its use within an orthodontic population. The total scale was divided into six sub-scales: the doctor–patient relationship; situational aspects of treatment; dentofacial improvement; psychosocial improvement; dental function; and a residual category. This questionnaire was psychometrically assessed for use within a Dutch population only. The aim of the present study was to validate this pre-existing 58-item questionnaire, for use within a UK population of adolescents aged 12–15 years.
Ethical approval was obtained from the London Dulwich Research Ethics Committee (LREC 16/LO/002), and King’s College Hospital NHS Foundation Trust granted Research and Development approval. During the ethical approval process, five questions were removed from the questionnaire, as they did not meet the necessary ethical criteria for use within our subject population, highlighting the need for questionnaire validation for its use within a UK population. Patients were included in the study if they had completed orthodontic treatment, were aged 12–15 years at the time of questionnaire completion, and consent was given by both patients and their primary carers.
The instrument was validated using various measures such as content validity and readability, internal consistency, test–retest reliability and assessment of predictors of orthodontic satisfaction (Figure 1).
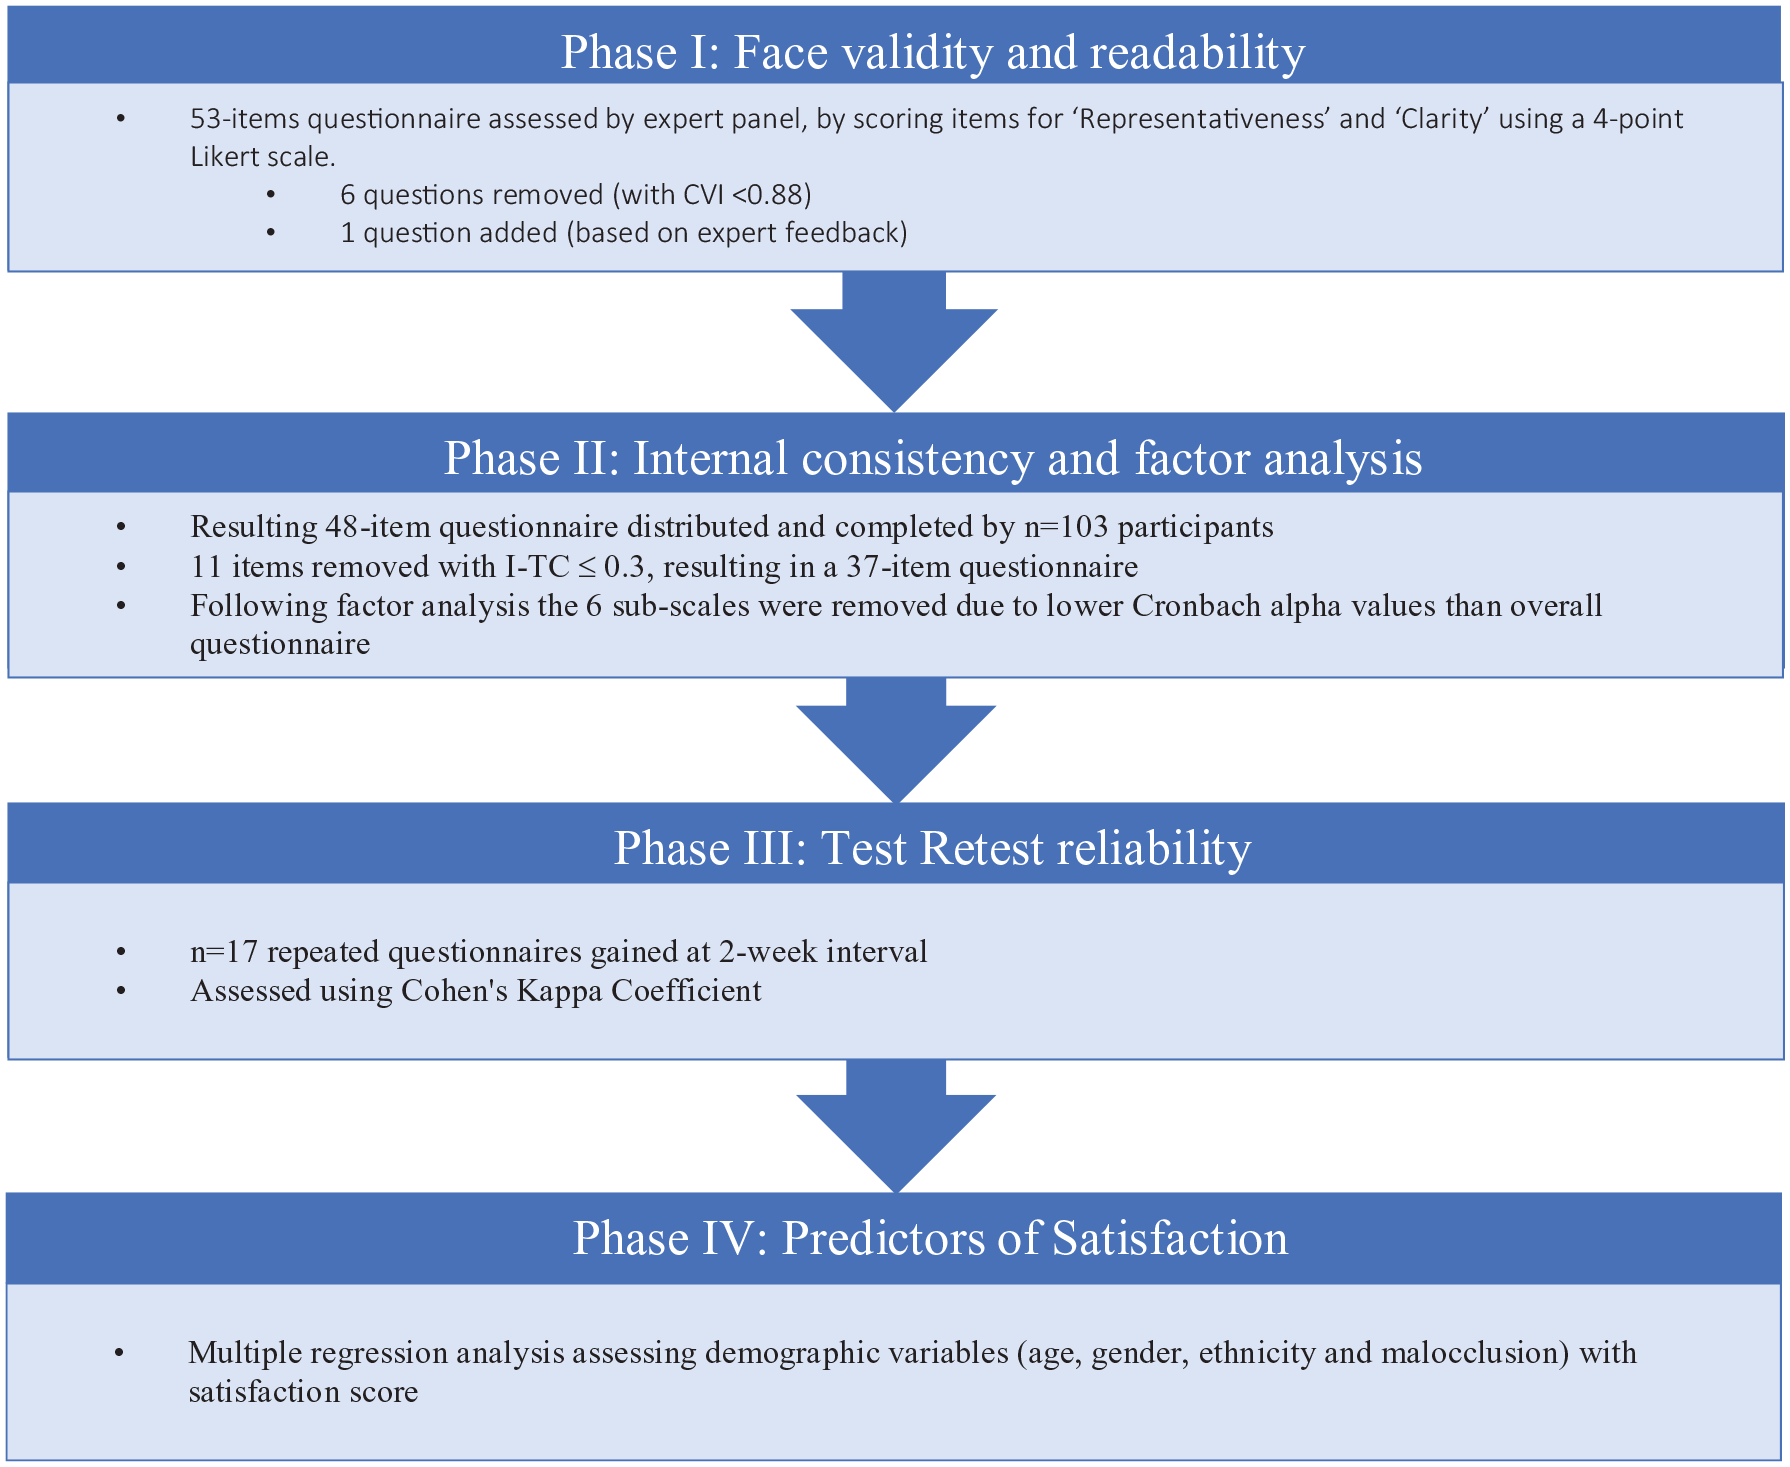
Flow diagram of methodology.
Phase I: Content validity and readability
Content validity and readability of the resulting 53-item patient satisfaction questionnaire was assessed using an expert panel consisting of five consultant orthodontists and five clinical psychologists. The questionnaire was distributed via email to this panel and eight responses were gained from five orthodontists and three clinical psychologists.
Content validity of questionnaire items was determined through the use of the CVI (Lynn, 1986). Experts were asked to independently rate each item for representativeness (validity) to the underlying construct. They rated each item using a 4-point Likert scale, ranging from 1 = ‘item is not representative’ to 4 = ‘item is representative’ using the CVI, and in a similar manner for ‘clarity’ of the items. The CVI for each item is calculated by the proportion of experts that rate the item as 3 or 4 (i.e. item is valid). For a panel of eight experts, seven or more needed to endorse the item for it to be content valid and retained in the questionnaire (CVI ⩽ 0.88 at P < 0.05). Therefore, items were removed from the questionnaire if more than one expert scored it as 1 or 2 for ‘representativeness’ (i.e. ‘item is not representative’ or ‘item needs major revision to be representative’) according to Lynn’s (1986) methodology.
Face validity of the questionnaire was assessed by asking experts to score each item for clarity (readability), as well as commenting on areas for item revision if necessary. Each item was then marked ‘Yes’ or ‘No’ by the experts as to whether it should be included in the questionnaire. Items were then modified if needed, based on the expert panel comments and readability scores.
The readability of the revised questionnaire was assessed using Flesch Reading Ease Score and Flesch-Kincaid Grade Level readability statistics (Microsoft Word 2016, Microsoft Corporation, Redmond, WA, USA).
Phase II: Internal consistency and factor analysis
Internal consistency was assessed through questionnaire distribution to participants meeting the inclusion criteria. A convenience sample of consecutive participants was recruited from the orthodontic departments of King’s College Dental Hospital and Queen Mary’s Hospital, Sidcup.
Patient and primary carer information leaflets were given to prospective participants before obtaining written consent.
The revised questionnaire was completed by 103 participants at the time of debond or at a subsequent retainer review. The questionnaire contained 48 items, answered on a 6-point scale with endpoints 1 (completely disagree) and 6 (completely agree), and no neutral point.
An additional comments box was included at end of the questionnaire for patient feedback, and these data were used along with expert panel comments to assess the face validity and readability of the questionnaire.
The overall questionnaire and the sub-scales were assessed for reliability using Cronbach’s alpha (Everitt, 2002; Field, 2005), and the individual item reliability was assessed using item-total correlation (I-TC). The lowest I-TC of ⩽ 0.3 was used as the acceptable criteria for items to remain in the questionnaire. To establish for underlying sub-scales within the questionnaire, factor analysis using the principal component method with varimax rotation was undertaken.
Phase III: Test–retest reliability
The reliability (test–retest) of this questionnaire was assessed by asking participants to repeat the questionnaire two weeks after the first attempt. Twenty repeated questionnaires were deemed desirable; therefore, a second questionnaire was posted to the first 35 participants along with a cover letter and return stamped addressed envelope, allowing for dropouts.
Phase IV: Assessment of predictors of orthodontic satisfaction
Demographic details such as age, gender and ethnicity were collected from participants in the study along with malocclusion. An assessment of the predictors of orthodontic satisfaction was carried out using multivariate regression analysis by considering the demographic variables as the potential predictors of orthodontic satisfaction scores.
Results
A total of 103 participants were recruited into the study, between October 2017 and February 2018.
Participant Demographics
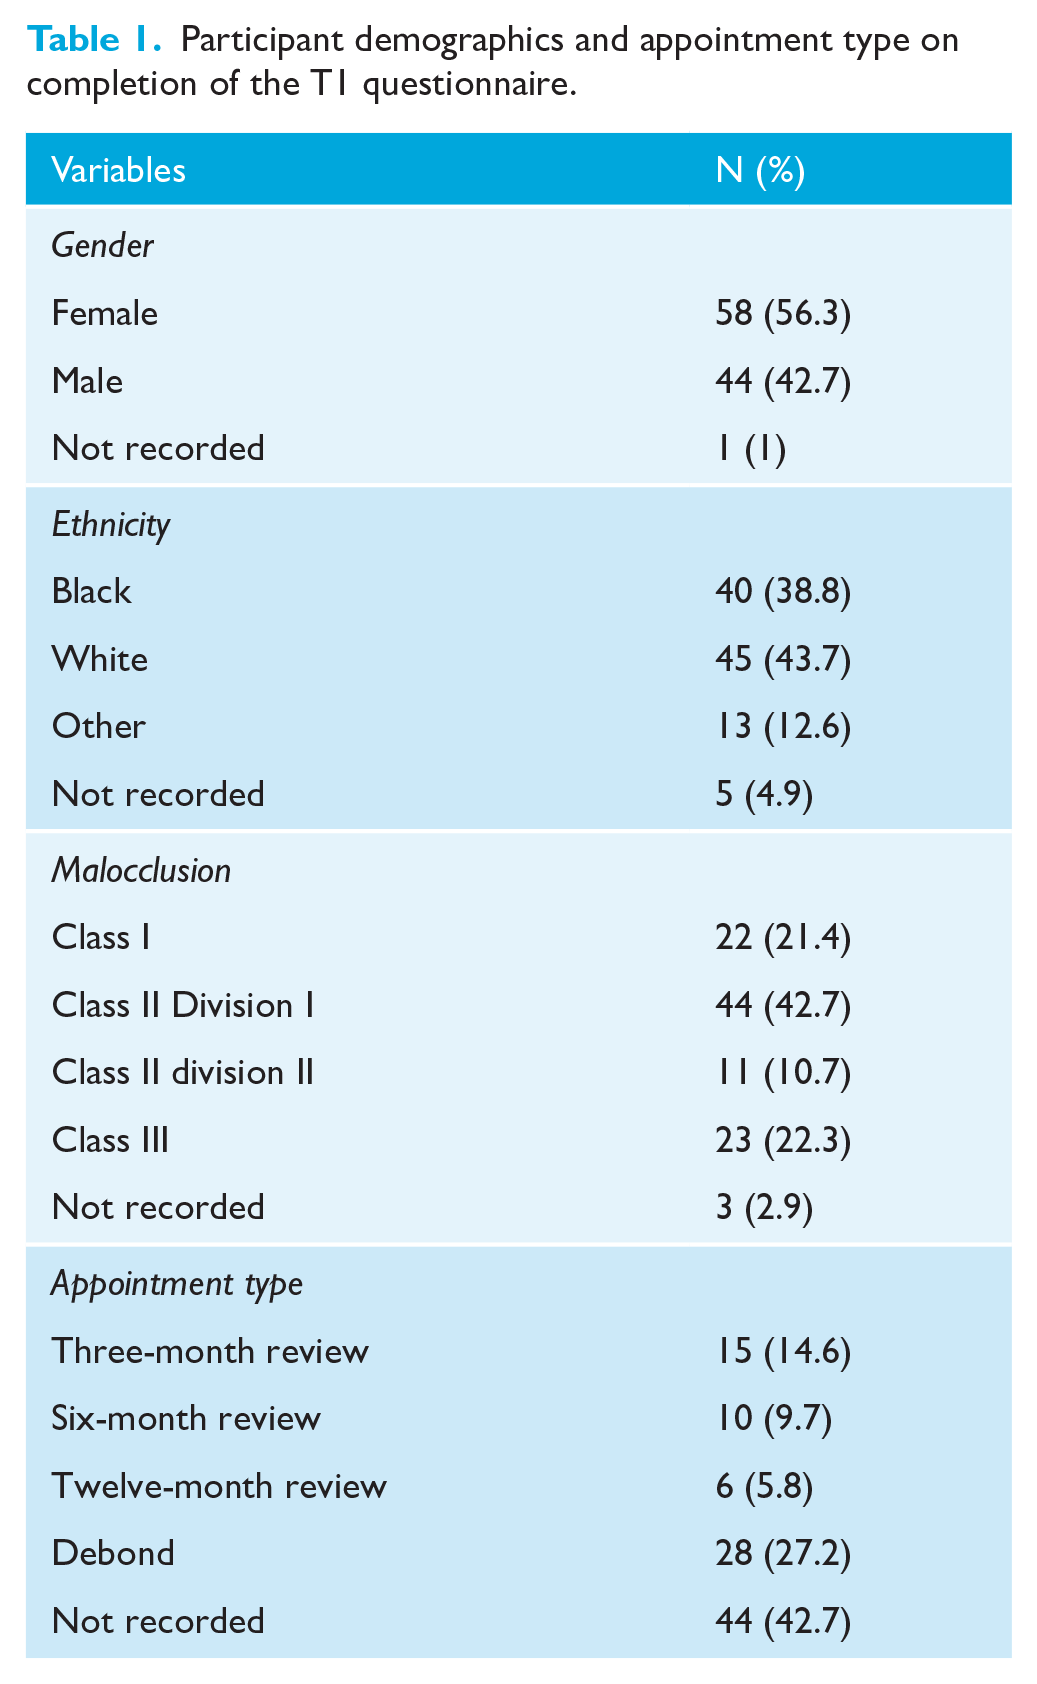
The demographic characteristics of the study participants are shown in Table 1. The median age for participants was the same for both genders; however, the sample consisted of more girls than boys. The larger groups based on ethnicity were those of ‘White’ and ‘Black’ origins, with a smaller proportion of participants from ‘Other’ ethnic backgrounds. Class II division 1 malocclusions were the largest malocclusion group and Class II division 2 malocclusions were the least frequently observed. T1 questionnaires were completed at various stages after completion of active orthodontic treatment, with approximately one-quarter being completed on removal of the fixed appliances.
Participant demographics and appointment type on completion of the T1 questionnaire.
Phase I: Content validity and readability
The questionnaire was revised by removing six items which were rated as ‘not valid’ by the experts (with CVI < 0.88). These removed item numbers were 2, 3, 14, 17, 40 and 42.
The assessment of face validity resulted in a minor revision in item wording when indicated and one item was added based on feedback from the expert panel requesting an additional question: ‘I would have liked more information to help ease the pain from braces’.
The revised questionnaire had a Flesch Reading Score of grade level 6.8 for the 48 items, demonstrating suitability of the questionnaire for individuals aged 12 years.
Phase II: Internal consistency and factor analysis
Scale analysis was undertaken to assess the reliability of the overall questionnaire (including 48 items), as well as the reliability of the six sub-scales within the questionnaire.
The following items’ scores were reversed as they had a negative inter-item correlation: item numbers 2, 3, 12, 15, 21 and 22.
The internal consistency of the total scale was found to be high with a Cronbach’s alpha of 0.85. The individual sub-scales were found to be less reliable than the overall scale, with the exception of the ‘Dental Function’ sub-scale which had a Cronbach’s alpha of 0.90, suggesting that this sub-scale is highly reliable. The lowest Cronbach’s alpha value of 0.17 was for the ‘Residual’ scale, as this scale comprises the items that do not fit into other sub-scales, as shown in Table 2.
Overall scale and sub-scale analysis.
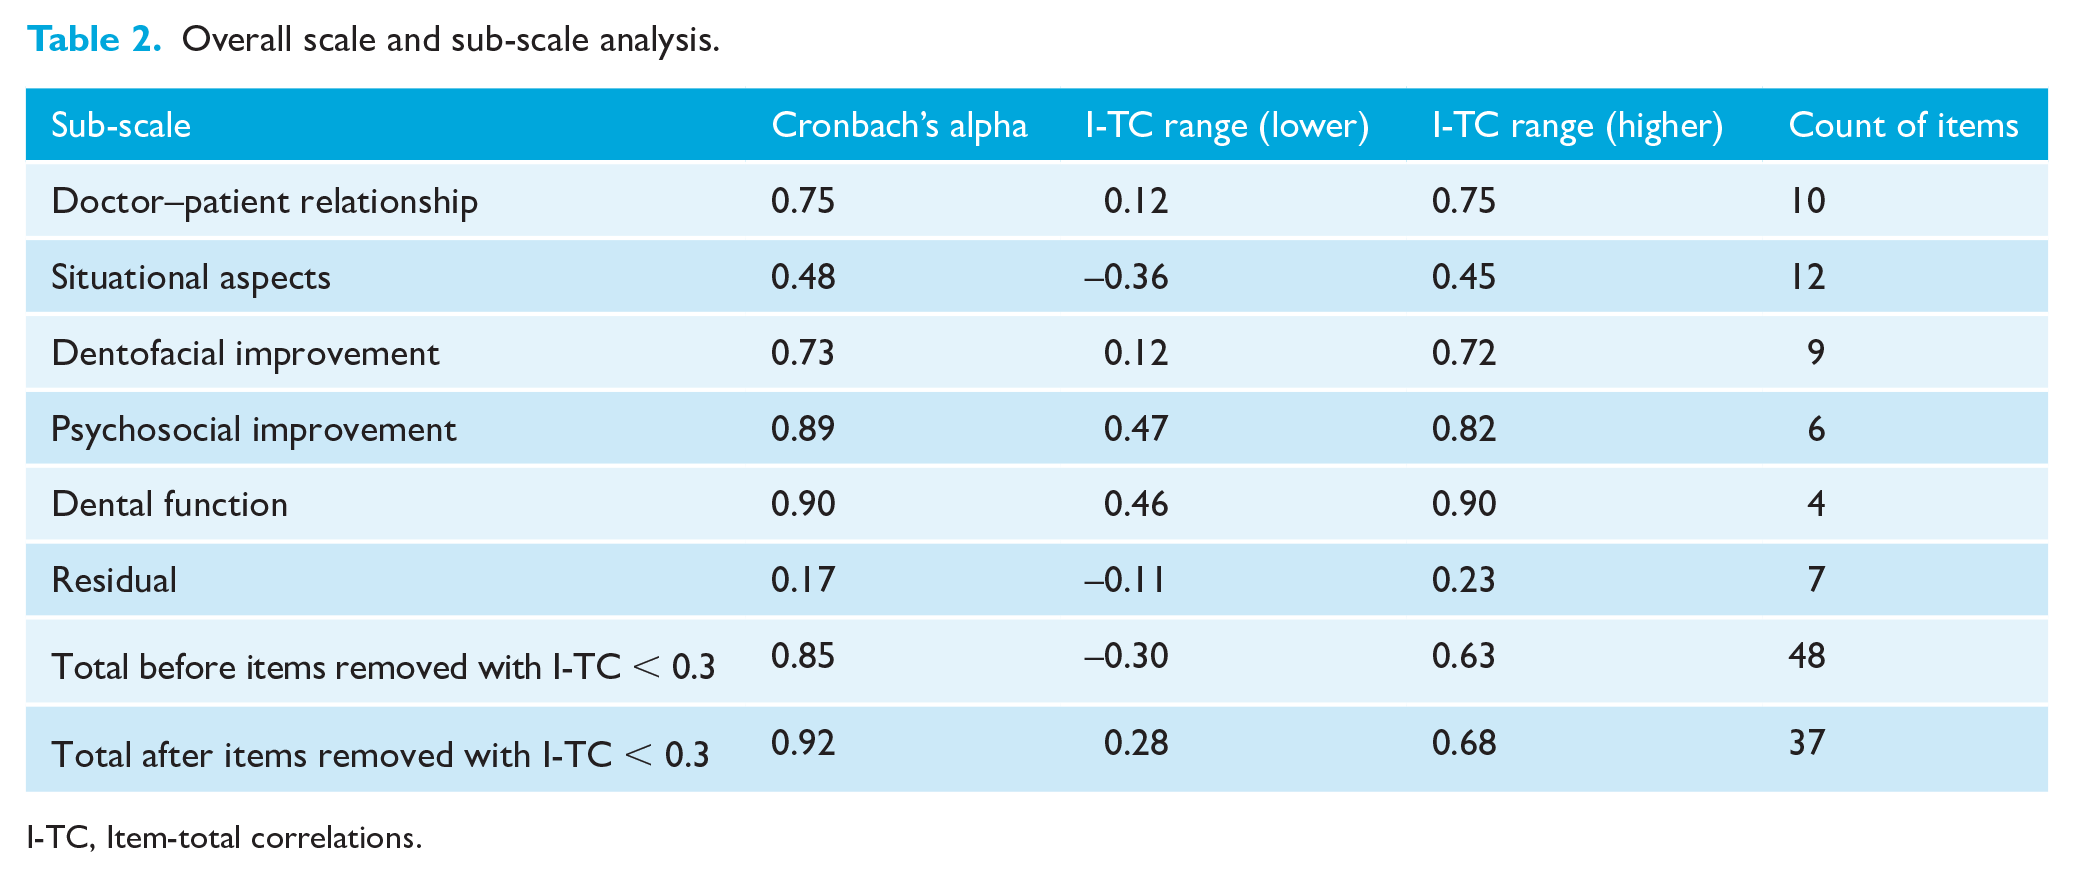
I-TC, Item-total correlations.
Item analysis found that none of the items in the questionnaire had 90% or more of the participants responded with the same answer, demonstrating that the questionnaire is good at establishing differing levels of satisfaction between individuals.
Reliability of the items was assessed using I-TC. An accepted cut-off value of ⩾ 0.3 was used for items to remain in the questionnaire (Everitt, 2002; Field, 2005), resulting in 11 items being removed. The revised 37-item scale had a higher overall Cronbach’s alpha of 0.92, demonstrating high reliability of the revised questionnaire. The most reliable items within the questionnaire are listed in Table 3, along with the associated Cronbach’s alpha value of a scale containing only these items.
Items with the highest corrected I-TC.
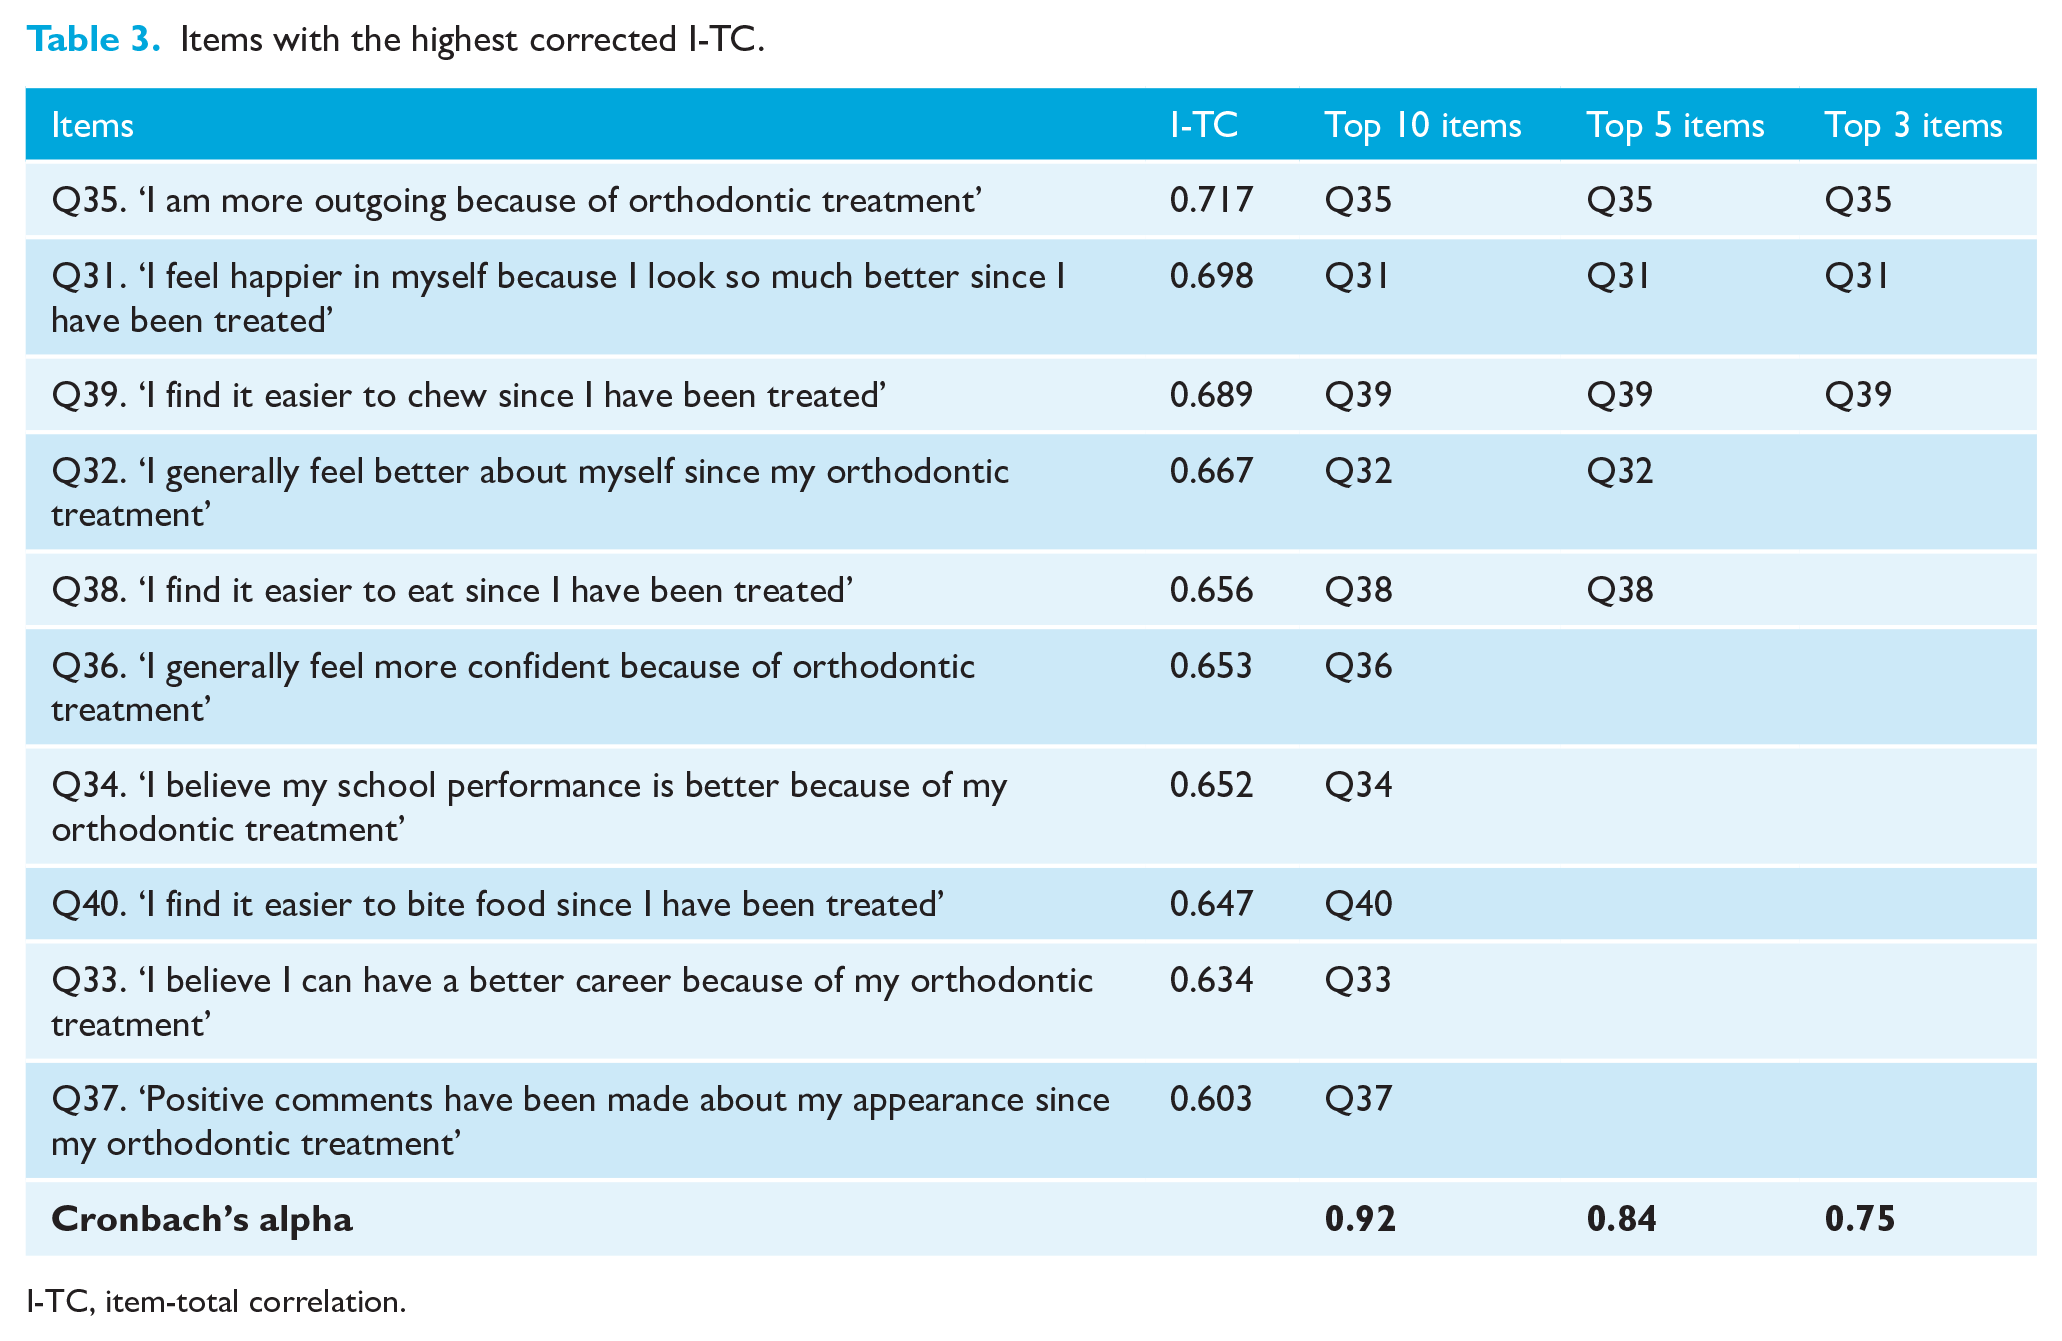
I-TC, item-total correlation.
A principal components factor analysis with Varimax rotation of the 48-item questionnaire was undertaken. The initial solution yielded 13 factors with eigenvalues > 1.0 but was deemed uninterpretable. Forcing the solution to yield six factors gave a solution that was similar to the original structure of the questionnaire as described by Bos et al. (2003), but with a great degree of overlap between the factors. Given the high Cronbach’s alpha for the 37-item questionnaire, the authors propose that the scale be treated as a total measure without sub-scales
Phase III: Test–retest reliability
Seventeen repeated questionnaires were returned, and agreement between the first (T1) and second time responses (T2) was assessed using Cohen’s Kappa coefficient (Table 4).
Test–retest reliability using Cohen’s Kappa coefficient.
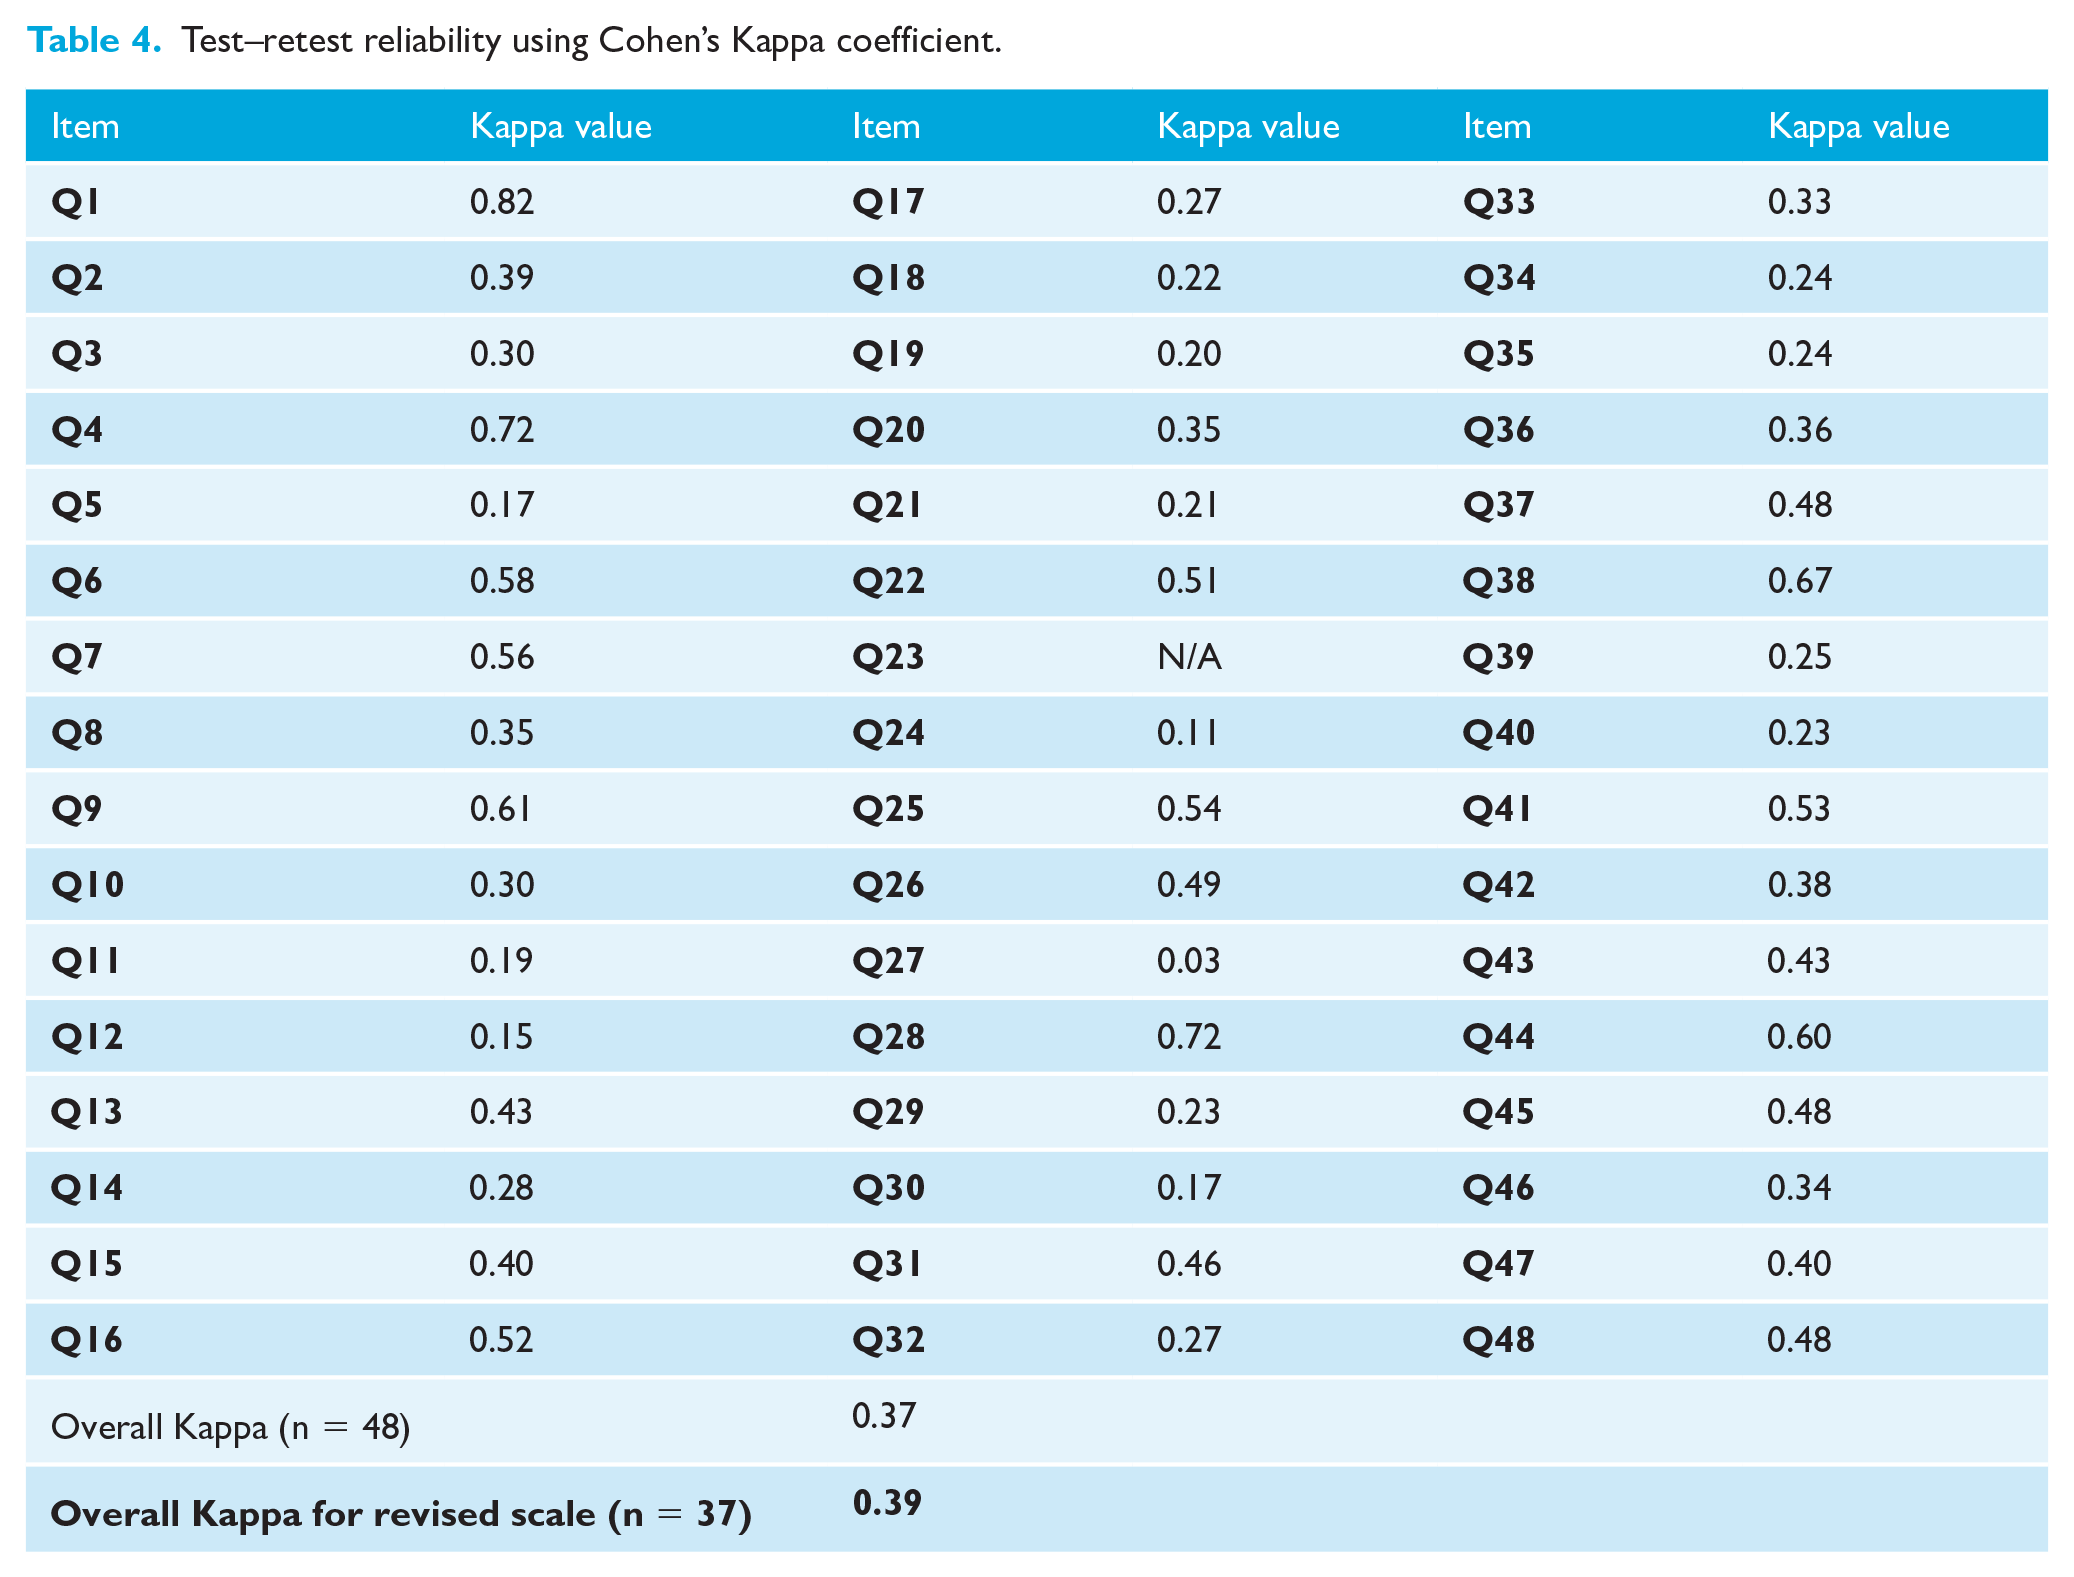
The overall kappa value for the scale was 0.37. It was not possible to calculate the kappa for item 23, as all the participants at T1 gave the same response for this item, with 82% participants giving the same value at both timepoints (T1 and T2).
The kappa value for the overall scale (n = 37) after removal of the previously specified items following scale analysis was 0.39, which is greater than the initial scale (containing 48 items) that had a kappa value of 0.37.
Phase IV: Predictors of patient satisfaction
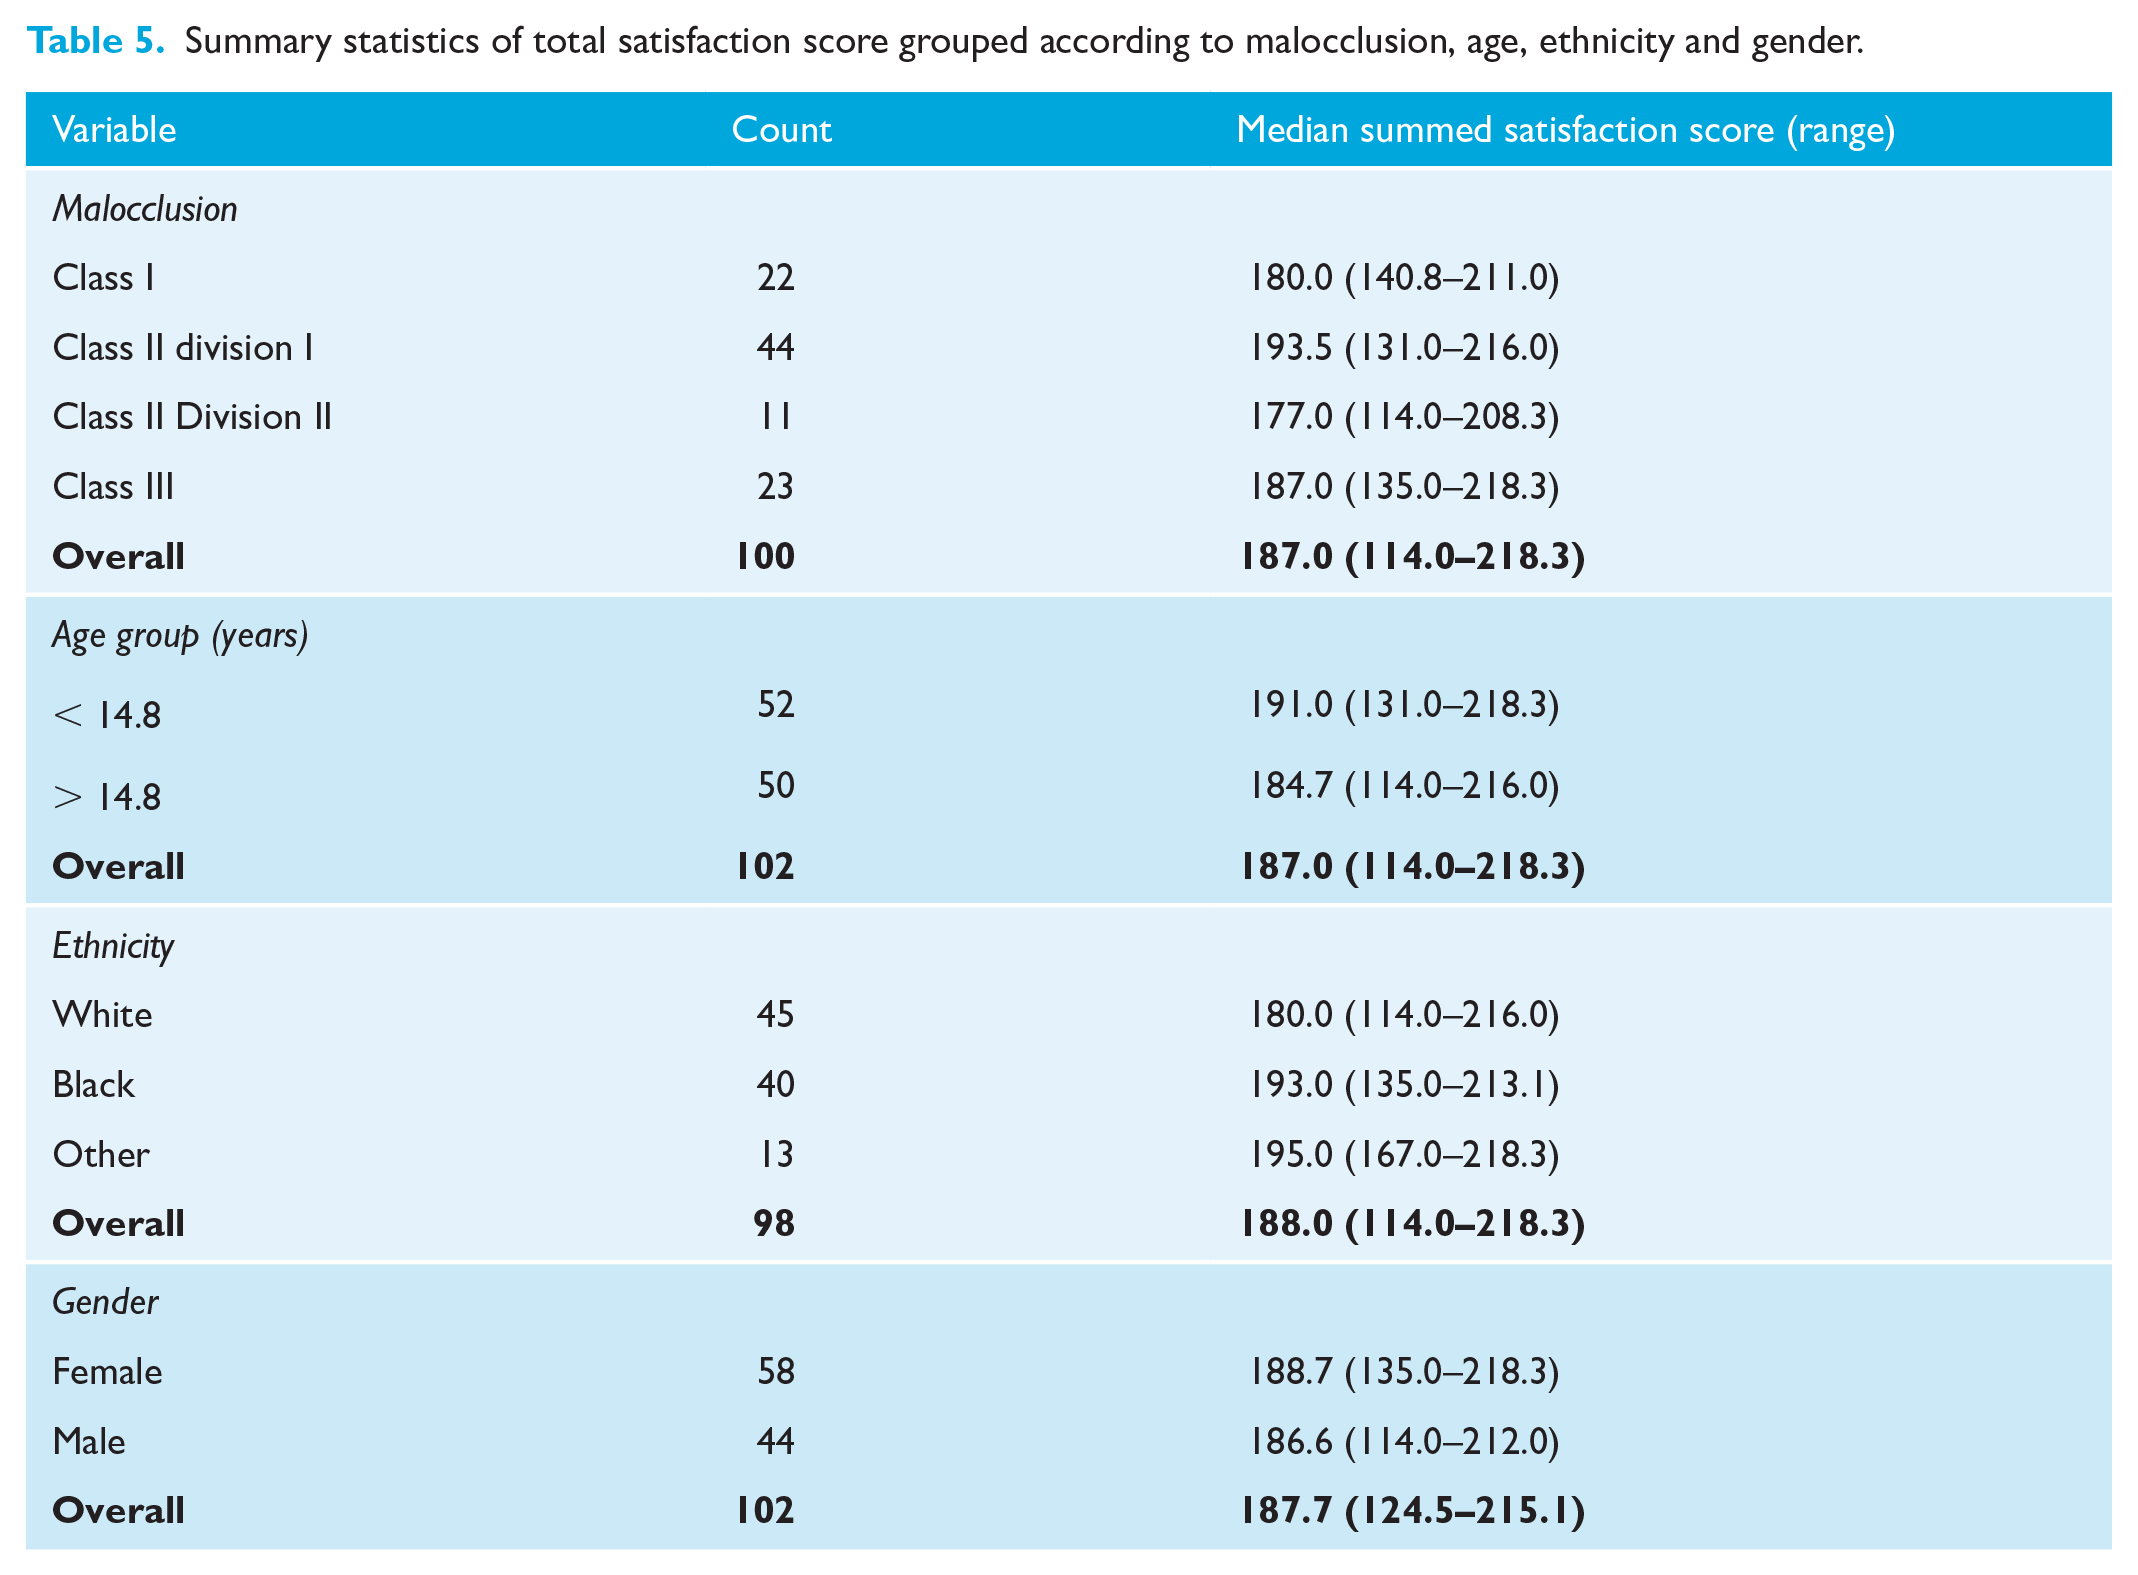
Total satisfaction score of the revised scale containing 37 items was analysed along with the predictors, namely age, gender, ethnicity and initial malocclusion (Table 5).
Summary statistics of total satisfaction score grouped according to malocclusion, age, ethnicity and gender.
Results of multivariate regression analysis for demographics
Multiple regression analysis was undertaken to assess the relationship between demographic variables and satisfaction. Any missing demographic data (missing values) were inputted using an expectation maximisation (EM) algorithm. The only variable found to have a significant influence on level of satisfaction was ethnicity, with participants in the ‘Other’ ethnic category having significantly greater satisfaction (P = 0.01) than participants of ‘White’ ethnic groups (Table 6).
Multivariate regression analysis of participant demographics.
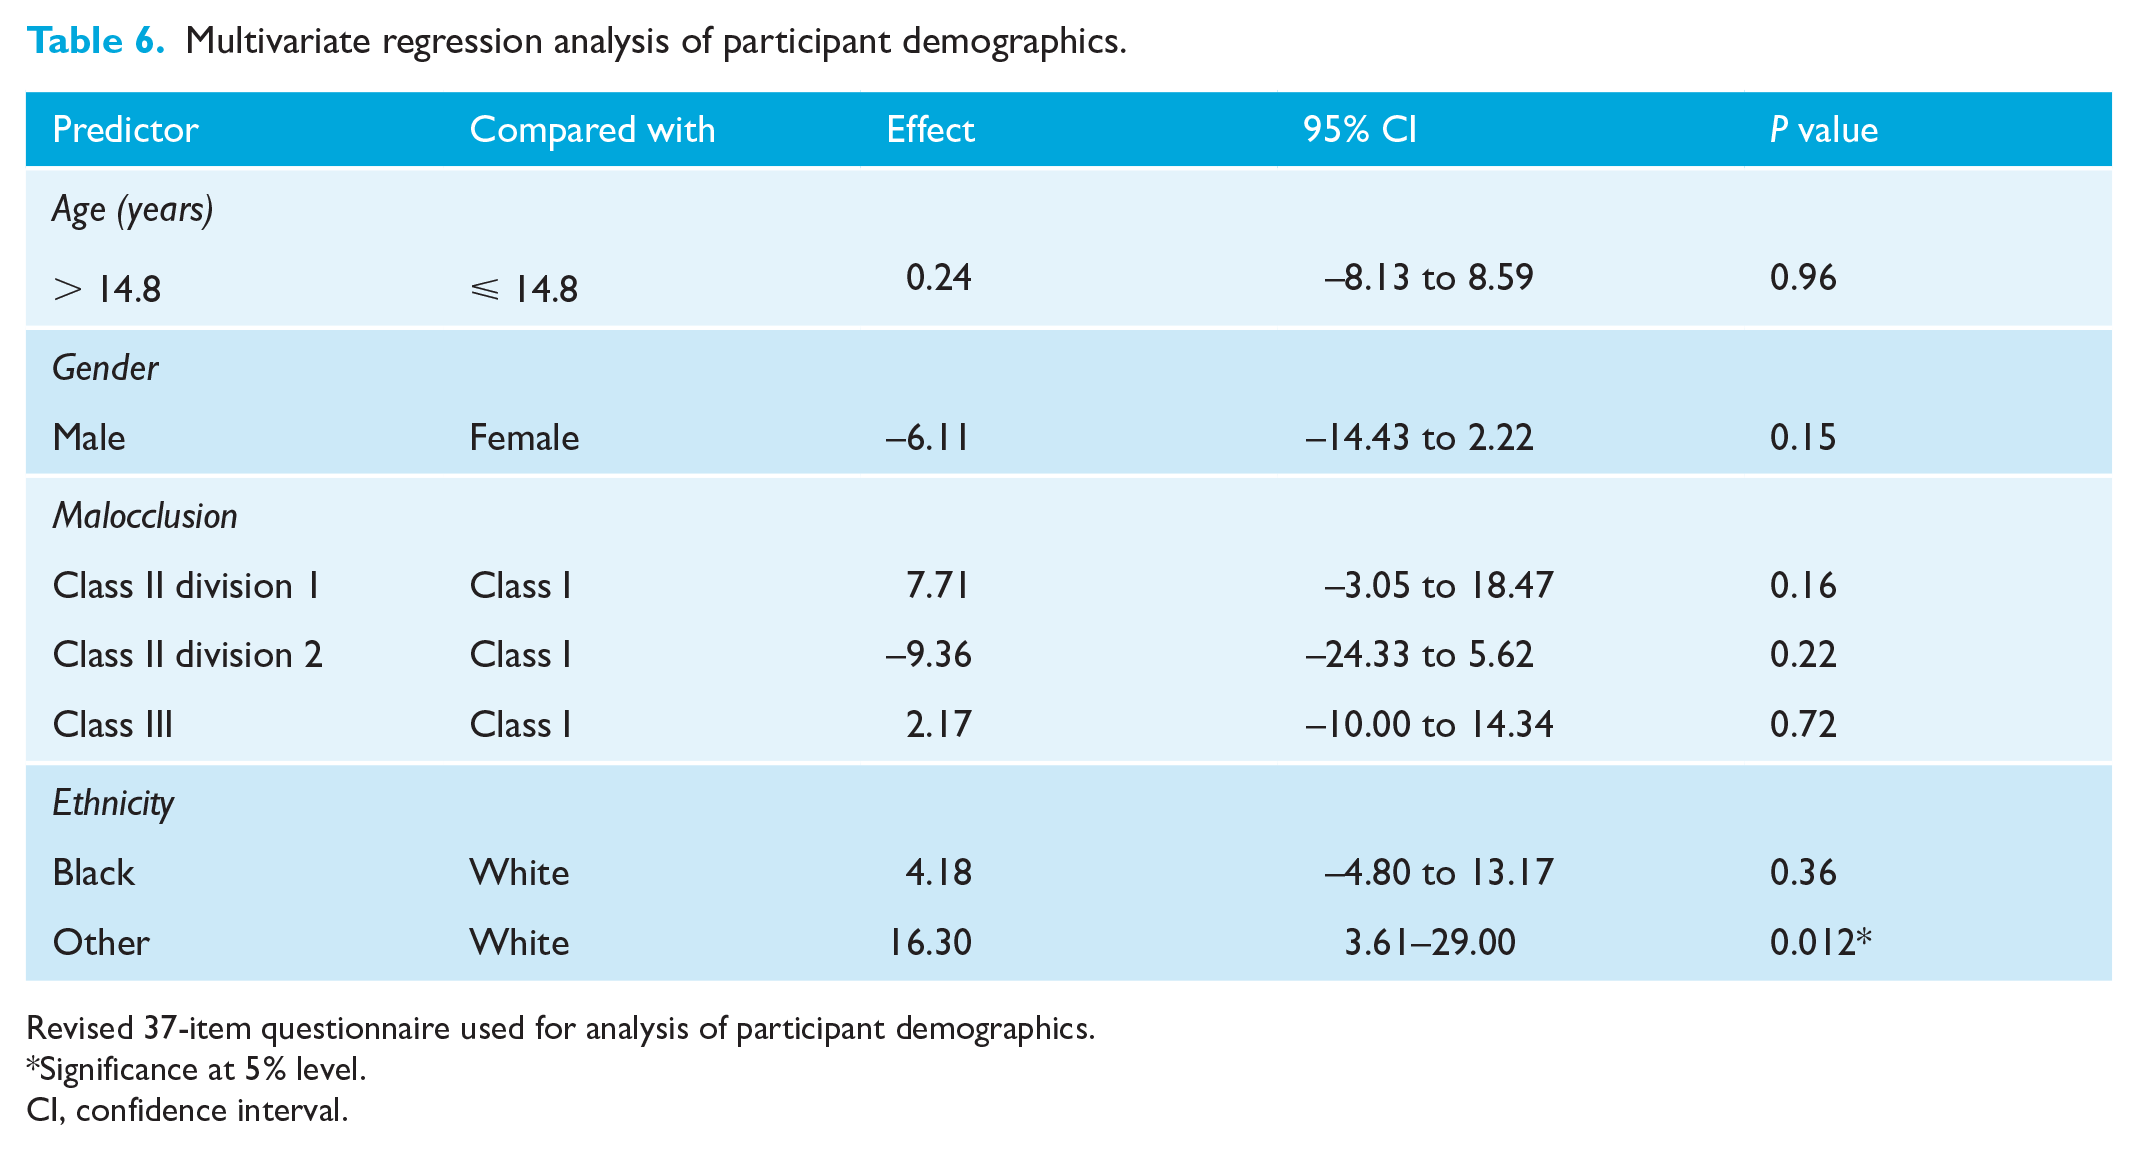
Revised 37-item questionnaire used for analysis of participant demographics.
Significance at 5% level.
CI, confidence interval.
Discussion
The aim of the present study was to assess a pre-existing patient satisfaction questionnaire for validity, readability and repeatability in a UK population aged 12–15 years on completion of fixed orthodontic treatment.
In the UK, a high proportion of orthodontic treatment is undertaken using fixed appliances in adolescents aged 12–15 years, and this study provides a 37-item satisfaction questionnaire that is reliable for use within this cohort. We excluded participants treated by other means as the specific type of treatment a patient undergoes is likely to influence patient satisfaction, due to the wide variation in treatment complexity, time and surgical intervention. A recent systematic review including 19 publications, assessing the quality of patient satisfaction questionnaires relating to oral healthcare, found common methodological deficiencies, including: a lack of consideration for populations other than adults; lack of internal consistency reporting of sub-scales within the questionnaire; limited assessment of stability of satisfaction scores over time; and no studies revalidated the questionnaire when used between cross-cultural populations (Nair et al., 2018). In the present study, we addressed these commonly occurring methodological deficiencies, through their incorporation into the study design.
The original questionnaire was developed for patients undergoing orthognathic surgery treatment (Phillips, 1999), before being translated into Dutch and modified for patients undergoing orthodontic treatment (Bos et al., 2003). As a result, the questionnaire requires psychometric validation for use in the UK, as the domains of patient satisfaction may differ between populations (Almeida et al., 2015; Nair et al., 2018).
Although the assessed questionnaire has been reduced in terms of the number of items, some may still consider a 37-item questionnaire lengthy and challenging to incorporate into a busy clinical schedule. A shortened version of the questionnaire validated within this study may be considered by using the top ten, five or three most reliable items, as listed in Table 3. Although the use of only these items provides acceptable reliability, eliminating the remaining items could result in certain aspects of satisfaction not being assessed, reducing the information that may be gained. Therefore, it would be advisable to interpret the results with caution, should a shortened scale be used.
Test–retest reliability
While there is no full consensus in the literature as to the interpretation of Cohen’s kappa, it is generally accepted that a value of 0.39 for items with six response categories is poor (Bakeman et al., 1997). This could result from the questionnaire properties, the low response rate of 49% to the questionnaire retest, as well as reflecting genuine change in the participants. The two occasions of testing were on completion of treatment and two weeks later, which may reflect a time of adjustment in their perception of the outcome of treatment.
Seven of the 48 items were found to have very poor agreement (kappa < 0.2) between the T1 and T2 responses; however, three of these items were subsequently removed from the questionnaire following internal consistency analysis. Potential rationale for these items demonstrating very poor test–retest agreement may be due to the fact that many participants completed the initial (T1) questionnaire at their debond appointment. This is unlikely to have provided a sufficient time lapse for the patient to provide truly reflective responses to questions such as those asking how they find their appearance and eating, since completing treatment. Therefore, it may be advisable to delay the assessment of patient satisfaction until after removal of the fixed appliances, to allow the patient to have an adequate period of adjustment and reflection. In addition, a further bias is that participants completed the T1 questionnaire in the orthodontic clinic or in the reception, which may have led to participants feeling under pressure to give inflated ratings (Bennett et al., 2001). If the T1 questionnaire was completed at home, they might have felt greater anonymity to give more reflective responses. This could have led to differences between the T1 and T2 responses.
Rationale for the low test–retest response rate of 49% may be due to certain groups being less likely to respond to postal questionnaires, which could result in response bias (Williams, 2003). Differing time intervals between receiving the questionnaire and its completion may also have varied responses between participants.
Demographics and satisfaction
In the present study, we found individuals of ‘Other’ ethnic groups to have significantly greater satisfaction with orthodontic treatment than those of ‘White’ ethnic origins.
Although some of the previous research assessing patient or parent demographic variables including age, gender and ethnicity have found no significant association with level of orthodontic satisfaction (Bennett et al., 2001; Feldmann, 2014; Pachêco-Pereira et al., 2015), differences have been identified between ethnicities in patients’ self-perception of dentofacial appearance (Christopherson et al., 2009), desire for orthodontic treatment (Sadek et al., 2015) and treatment expectations (Sayers and Newton, 2006). Such differences between ethnic groups at the outset may provide understanding for the differences in satisfaction level found on treatment completion in this study; however, further investigation into the observed differences in satisfaction level between ethnic groups would be beneficial.
Limitations
The present study did not redetermine the construct validity of the scale; this could have been achieved by exploring with a group of experts with relevant expertise the dimensions underlying the construct of ‘satisfaction with orthodontic treatment’. In addition, individuals who had completed orthodontic treatment could have been asked to participate in the content validity task. However, in this study it was deemed unnecessary as this was a pre-existing questionnaire that had already undergone participant involvement and is currently used to measure patient satisfaction with orthodontic treatment in the Netherlands and USA (Bos et al., 2003, 2005; Phillips, 1999).
This validated questionnaire has shown it is appropriate for use within a population aged 12–15 years; however, it may not be appropriate for patients aged younger than 12 years, due to the readability level and ability with understanding of the content. The readability level would be suitable for patients aged 15 years and older; however, the present did not psychometrically assess the questionnaire for these age groups.
Our patient sample only included patients who had completed fixed orthodontic treatment in an NHS hospital setting; therefore, this validated questionnaire may not be appropriate for those undergoing orthodontic treatment using alternative orthodontic appliances or those being treated in a specialist practice.
The low response rate for test–retest reliability may have resulted in response bias, which should be considered when interpreting the results. Reliability may also have been improved by asking patients to complete T1 and T2 questionnaires in the same setting at home.
Rasch analysis as a technique would provide a more robust ability to draw inferences concerning the validity of the scale but was not undertaken in the present study.
Conclusions
In conclusion, the revised 37-item patient satisfaction questionnaire had good levels of readability, and satisfactory content validity for use with participants aged 12–15 years who have undergone treatment with fixed orthodontic appliances. The test–retest reliability of the revised 37-items scale was poor. Factor analysis and exploration of the internal consistency of the scale suggested that the overall scale was best interpreted as a single dimension measuring ‘Patient Satisfaction’. In addition, participants of ‘Other’ ethnic origins were found to have significantly greater treatment satisfaction than those of ‘White’ ethnicities.
Footnotes
Acknowledgements
The authors thank the orthodontists and clinical psychologists who took part in this study and to the participants for their time in completing the questionnaires.
Declaration of conflicting interests
The author(s) declared no potential conflicts of interest with respect to the research, authorship, and/or publication of this article.
Funding
The author(s) received no financial support for the research, authorship, and/or publication of this article.