
Abstract
One of the major findings of the literature on Euroscepticism is that support for European integration generally declines as one moves closer to the extremes of the left-right ideological spectrum. However, in multidimensional policy space, Euroscepticism varies in more complex ways. This article explores the relief of Euroscepticism for citizens in four European states – the Netherlands, Germany, Italy and France – based on data from voting advice applications fielded before the 2019 elections of the European Parliament. The results reveal that the way Euroscepticism maps onto other dimensions differs significantly for citizens and for parties and across political contexts. Such variation is important for understanding how preferences for European integration are embedded into existing structures of political competition.
Introduction
What are the attitudes of European citizens towards the EU polity, politics and policies? How do these attitudes towards the EU and European integration relate to other, perhaps more fundamental, political attitudes, preferences and orientations? The academic literature addressing these questions is rich and mature. Scholars of European public opinion have moved beyond simply dichotomies of Eurosceptic/Europhile attitudes and provided more nuanced categorizations (De Vries, 2018; Halikiopoulou et al., 2012; Van Elsas et al., 2016). A related scholarship has examined how the European ‘dimension’ fits into established structures of political competition in Europe (De Vries and Marks, 2012; König et al., 2017; Wheatley and Mendez, 2021; Whitefield and Rohrschneider, 2019).
One of the major findings of this literature is that support for European integration generally declines as one moves closer to the extremes of the general left-right ideological spectrum (Krouwel and Abts, 2007; Kutiyski et al., 2021). This has given rise to the famous inverted U-curve idea, where extreme-left and extreme-right positions on a general left-right dimension are associated with lower levels of EU support, while centrists exhibit higher levels of support (König et al., 2017; Van Elsas and Van der Brug, 2015).
In most of these analyses, however, EU support is bundled with other issues that do not belong to the left-right dimension understood in socio-economic terms, such as immigration, nationalism, moral permissiveness, the environment and others (for some important exceptions, see Bakker et al., 2012; Kitschelt, 2013; Wheatley and Mendez, 2021). This ‘other’ dimension goes by different labels: post-materialism, conservative/progressive, conservative/liberal, authoritarian/liberal, GAL/TAN 1 (Hooghe et al., 2002) and transnational/nationalist (Jackson and Jolly, 2021). But whatever the exact label, EU attitudes are supposed to be closely intertwined with it.
This article builds on the idea that attitudes towards European integration should be examined not only in terms of how they relate to the left-right dimension but in terms of other established dimensions of political attitudes as well, without assuming that they bundle with liberal, progressive, GAL, and other post-materialist issues. Acknowledging the complexity of political attitudes of Europeans opens up a series of research questions that motivate this study: How do attitudes towards Europe fit multidimensional political space in different European states? What is the structure of EU-related preferences itself?
To address these questions, we depart from the idea that there is one best way to characterize the political and policy-relevant attitudes of citizens. We examine these attitudes not only in terms of self-placement on general ‘ideological’ scales, as most often done in the existing literature, but also in terms of a priori ‘objective’ scores on these scales, aggregated from concrete positions on policies and issues that relate to these scales, according to the opinion of experts. We also relax the assumption that experts know the content of the ideological scales and we let the structure of citizen attitudes speak for itself by a posteriori inductively deriving the main dimensions of the structure of attitudes from a large set of policy positions and value statements.
Our analyses are made possible by the rich data provided by voting advice applications (VAAs), which feature many more responses than typical nationally representative surveys, a large set of items on which citizens express their opinions (so that the structure of policy positions can be induced), and party positions scored on the same set of items (so that citizens and parties can be compared in a common space). Concretely, we use four VAAs fielded in the build-up to the European Parliament (EP) elections in 2019 in four countries from Western and Southern Europe: the Netherlands (Kieskompas Europese verkiezingen), Germany (Wahlkompass), Italy (Navigatore Elettorale) and France (La Boussole européenne). These countries exemplify different ways in which EU preferences are theorized to relate to other dimensions of political competition: mapping on the ‘cultural’ dimension in the (North) West and on the economic one in the South (Otjes and Katsanidou, 2017).
In line with our exploratory research objectives, our analyses rely heavily on visual methods for presenting the data. We introduce three-dimensional (3D) plots to show how EU preferences vary simultaneously with left-right and conservative-progressive positions. The resulting political landscapes allow us to see complex interactions that otherwise remain hidden in regression analyses of the same data. To infer the underlying structure of political preferences inductively from the data, we use factor analyses with polychoric correlations and oblique promax rotation that allows for the factors to be correlated.
Our results reveal that the way EU attitudes map onto other political dimensions differs significantly for citizens and for parties, across political contexts and depending on the types of measures used. When we analyze citizen self-placements, EU support decreases as one moves from the socio-economic left to the right and from the progressive to the conservative corner of the political space. However, in the Netherlands and Germany EU support decreases monotonically from left to right, while in Italy and France it peaks in the middle of this scale, but only for citizens with conservative positions. For progressive citizens in these Southern countries, EU support does not vary much with left-right positions based on self-placement.
Yet, these self-placements are only weakly and inconsistently correlated with actual positions on policy issues that should relate to the underlying scales. So, when we examine the political space with regard to these a priori deductively derived positions, the pictures we get are rather different. For example, now we observe an inverted U-curve between socio-economic left-right and EU support in the Netherlands and Germany, with lower EU support at the extremes.
The inductive analyses complicate the results further by showing that positions on issues related to the EU and European integration do not form a single dimension. Support for the EU as it is loads separately than items related to further expansion of the EU. Some EU items load with positions on issues such as Islam and immigration, others with items related to policies such as the environment.
Literature review and theoretical background
The idea that political attitudes and public policy preferences can be reduced to a small number of underlying scales or dimensions is at the core of contemporary political science and common political discourse (Benoit and Laver, 2012; De Vries and Marks, 2012; Rovny and Whitefield, 2019). Most fundamentally, political competition is said to be structured around a left-right axis, with the left and right categories having intuitive meaning to citizens, predictive power for vote choice, and actual policy content. The left-right dimension is considered so basic that its existence is traced back to the fundamentals of human psychology (Jost, 2009). In its turn, where people are positioned on the left-right spectrum is supposed to affect all kinds of social dispositions and attitudes beyond the domain of politics (Sapolsky, 2017: 450). The emergence of a single dimension of political competition is also supported by the logic of how social cleavages shape struggles for political power (Hooghe and Marks, 2018).
The dominance of the left-right dimension in political science might be related to the fact that much of the analysis is focused on the US, where the two-party system reinforces the relevance of a single dimension that absorbs all kinds of political and policy issues and preferences. In the multiparty political systems in Europe, however, the hold of the left-right dimension is weaker, and possibly declining over time (Albright, 2010; Huber and Inglehart, 1995; Stoll, 2010; Warwick, 2002). Even if the left-right still captures preferences over socio-economic policies and class conflict (Lachat, 2017), a second dimension related to post-materialist values, such as care for the environment, moral permissiveness and others, has been rising in importance (Huber and Inglehart, 1995; Kriesi et al., 2006).
The second dimension of political competition has different policy content in different conceptualizations, capturing issues as diverse as the rights of homosexual couples, care for the environment, opposition to immigration and military interventionism abroad. Recently, the salience of issues related to immigration has increased, fueled by and fueling a rise in support for populist parties with vocal and negative positions on immigration, Islam, asylum-seekers and lack of national border control. Generally, it has been assumed that the bundle of issues around immigration has gained an important place in this second dimension of politics rather than fragmenting the political space even further by splitting from the conservative/progressive or GAL/TAN dimensions.
Issues related to European integration, including support for European integration, have also been assumed to load on this second dimension (but see Gabel and Hix, 2002). It has been recognized that EU support is not perfectly and linearly related to (socio-economic) left-right (Van Elsas and Van Der Brug, 2015). But it is often taken for granted that it is very strongly and linearly related to the ‘other’ dimension (Hooghe et al., 2002). Scholars have proceeded to analyze how positions on the anti-pro EU dimension map on the left-right dimension (Jackson and Jolly, 2021; Marks et al., 2006; Otjes and Katsanidou, 2017; Schäfer et al., 2021). The main result that emerges is that the relationship resembles an inverse U-curve, with EU support being highest in the middle of the left-right dimension and declining towards both the left and right ends (König et al., 2017; Van Elsas and Van Der Brug, 2015). The exact shape of the inverted U-curve, as well as absolute levels of EU support throughout the left-right spectrum, differs across different European states. But the broad relevance of the pattern has been shown repeatedly with different sources of data.
Some scholars have considered whether the economic left-right, social left-right and EU dimensions are separate from each other (in particular, Bakker et al., 2012) and have found supportive evidence for this conjecture using data on party positions. In fact, most of the theoretical reasoning and the empirical analyses leading to the results summarized above are based on studying political party positions (Bakker et al., 2012; Gabel and Hix, 2002; König et al., 2017; Reiljan et al., 2019). But political space might look quite different when we consider the attitudes and positions of citizens rather than parties.
In general, the preferences of people would be less structured than those of parties and politicians, because people are to a smaller extent subject to constraints for consistency and coherence of their preferences. People have limited knowledge and interest in most political and policy issues so that trade-offs and inconsistencies can go unnoticed. Moreover, most people – unlike elites within political parties – rarely face direct, tangible costs for inconsistent preferences. More charitably, people might have fewer strategic incentives to bundle their positions into a very small number of underlying dimensions.
These considerations call for a separate analysis of the political space as it appears from the positions of people rather than parties and elites. There are already a few existing studies with such a focus (e.g. Wheatley and Mendez, 2021), yet their findings are still heavily influenced by our knowledge about the party political space. With regard to positions towards European integration in particular, the implication is not only that we should shift the focus of analysis from the positions of parties to the positions of citizens but also that we should open up the possibility that European integration preferences are to some extent separate from other non-left-right issues.
The literature on EU public opinion has recognized that citizen preferences are more complex than what a simple dichotomy between Euroscepticism and EU support can capture (De Vries, 2018; Krouwel and Abts, 2007; Whitefield and Rohrschneider, 2019). Support for individual policies and expansion in particular policy fields can coexist with deep-seated scepticism about the final outcome of European integration. Citizens across Europe can have meaningful preferences over a variety of futures for European integration, rather than a simple choice between federalization and disintegration (Goldberg et al., 2021). Even nationalism has been shown to have a complex relationship with support for European integration that works differently in different countries (Aichholzer et al., 2021). And criticism of individual institutions and particular policy actions can coexist with general support for the current state of the EU and future progress of integration. This suggests that positions over Europe themselves are context-dependent (De Vreese et al., 2019) and might have structure, with some elements being more or less closely related to the left-right, conservative-progressive or other ‘master’ dimensions. Recognizing the context-dependent nature of EU preferences has led to more methodologically sophisticated attempts to measure a single dimension of EU support, analogous to the concept of ‘policy mood’ (Di Vettimo, 2022), but it also raises the question about how exactly the various aspect of EU-relevant preferences relate to broader categories of political ideology.
Research approach and data collection
To address the questions about the structure of political space and the place of attitudes towards European integration in it, this article uses data from VAAs. VAAs are popular and rapidly spreading online applications that citizens can use to express positions on a set of policy issues and get a ‘voting advice’ based on the proximity of their positions to those of different political parties (see Germann and Gemenis, 2019 for an overview). The advantage of VAA data is that it comprises of a large number of observations, up to hundreds of thousands in some European states, as well as a relatively large number (typically 30) of policy statements on which opinions are expressed. The disadvantage of VAA data is that it is not based on a random probability sample, but users self-select into using the application. Reassuringly, Toshkov and Romeijn (2021) find a close match between estimates of public opinion for the supporters of different parties based on data from VAAs and from large traditional surveys, once the latter have been subject to multi-level regression with post-stratification to stabilize the estimates for smaller parties in particular. Nevertheless, VAA users are typically more highly educated, younger and with higher interest in politics than the general population. This is not necessarily problematic if we want to generalize our findings to those citizens with some interest in politics rather than to the entire population. Furthermore, we can explore how the self-selected nature of the VAA samples influences the empirical results.
The particular VAAs that we use have been fielded in the build-up to the elections for the EP in 2019 in four countries: the Netherlands (Kieskompas Europese verkiezingen), Germany (Wahlkompass), Italy (Navigatore Elettorale) and France (La Boussole européenne) (see the Online appendix for the number of valid responses). The first three VAAs feature a set of 30 issue statements that partly overlap and cover issues related to European integration but also more general political and policy questions (the French one features 19 statements). The set of issues includes both concrete policy questions, such as increasing subsidies for green energy, and value statements, such as perceived religious threats to country's values. The users express their views on all statements using a five-point Likert scale between ‘Strongly support’ and ‘Strongly oppose’ with a ‘Neutral’ answer in the middle, and the opportunity to skip a statement. The selection of statements has been done by experts to reflect for each country the contemporary political and policy agendas and some general issues of common European interest. The selection also features items that can be assigned to different ideological scales based on considerations from existing literature and theory.
In addition to these user opinions on 30 statements, the VAAs feature data on party choice (based on voting at past national elections) and vote intention (for future EP elections), demographic variables, and self-placement on three briefly defined political scales: left-right, conservative-progressive, anti-pro EU (see the Online appendix for the exact wording of the statements and the scales). These questions are asked in a separate, optional module after the policy statements, but before the voting advice provided by the application. A relatively small share of all VAA users answers these additional questions, but in absolute terms, the total number is quite large, and larger than in traditional surveys.
Before we analyze the data, we restrict the observations to responses that were completed within the country of interest, took between 90 s and 15 min to complete all the statements, and where the users only filled in the VAA once.
We consider three different ways to conceptualize and operationalize the nature of citizens’ political positions, each based on different theoretical starting points. The first type is based on the self-placements on the three scales mentioned above. This resembles most closely traditional analyses of political ideology where respondents position themselves on the scales. This conceptualization assumes that both experts – who have developed the self-placement scales – and citizens share a common understanding of what the scales mean and how they refer to different national political context. Moreover, the interpretation of the scales is stable and substantively similar over time and across national borders, so that diachronic and synchronic comparisons are meaningful.
The second type of positions is based on aggregating citizen positions on the three scales, but this time the content of the scales is defined a priori by the researchers based on substantive considerations which opinions should load on the left-right, conservative-progressive and anti-pro EU scales. Citizens are positioned on these scales based on the answers they provide on concrete questions relevant to the scales. This avoids the problem that citizens might have different conceptions of what the scales mean and what they should refer to (Bauer et al., 2017). For the exact mapping on policy positions to scales, see the Online appendix. In short, the left-right scale collects items related to government intervention in the economy and redistribution. The conservative-progressive scale collects a diverse set of non-left-right items, including ones related to immigration, the environment, moral issues and others. The anti-pro EU scale collects the items with reference to the EU and its policies.
We refer to these positions as a priori and ‘objective’, in the sense that they are not based on subjective self-placement but on citizens’ actual policy positions, as expressed in the VAA. Of course, the ‘objectivity’ is only relative to the choices about what defines the scales, which are influenced by the subjectivity of the researchers. Once the content of the scales is defined, we calculate the score of each respondent on each scale by taking the mean of their responses on the relevant items. The limitation of this approach, however, stems from the fact that researchers predefine what the relevant scales are and how the questions should be related to the scales.
To address this, the third type of positions we explore is based on a posteriori inductive analyses of the dimensionality of the space defined by the responses to the statements included in the VAA. In this approach, the previously considered three scales might appear from the data, but it could also happen that different dimensions – both in terms of number and content – are uncovered. We use principal component analysis (PCA) and factor analysis with polychoric correlations to recover the dimensions. The polychoric correlations are appropriate for the ordinal data that the VAA provides. In comparison to the PCA, which imposes orthogonal principal components, the factor analysis rotates the solution to increase interpretability. In particular, an oblique rotation (promax) is implemented, allowing for the factors to be correlated with each other, which is substantively justified given the correlations between the ideological scales we observe and expect. Related techniques such as item response models or Mokken scale analysis have been shown to produce very similar results to factor analysis of the polychoric correlations, which is numerically equivalent to a graded item response model fit by means of robust maximum likelihood (Kappenburg-ten Holt, 2014: 2).
We select the number of dimensions to retain in the factor analyses based on formal methods, such as inspection of the scree plots and parallel analysis, but also considering the interpretability and uniqueness of the dimensions (see the Online appendix). In light of concerns about the tendency of factor analysis of categorical data for over-dimensionalizing (Van der Eijk and Rose, 2015), in three out of the four countries, we extract a smaller number of dimensions than the one suggested by the formal methods 2 .
As mentioned above, the VAA data are not representative for the population of voters in each country as it is collected from a form of an opt-in sample. However, this is not necessarily a problem for uncovering the structure of the political preferences of the population, even if it is a problem for calculating valid population-level statistics, such as mean support for some policy. For our analyses to hold, the relationships between different positions, as they are in our sample, need to be similar in the broader population. This is likely to be the case, if we consider only citizens with some minimum amount of political interest. If anything, the structure of political preferences in the population that lacks political interest, knowledge (Fishman and Davis, 2022) and sophistication (Lupton et al., 2015) – which, arguably, is not very well represented in the VAA – is likely to be even more diffuse and amorphous. Reassuringly, we find very similar results when we replicate the analyses on the much smaller subset of VAA users who filled-in the additional modules and when we weight the VAA sample based on demographic and party support variables such that it resembles the general population.
Empirical analyses
We report our findings country by country, starting with the Netherlands. Each country section follows the same template: first, we analyze the positions based on self-placement, then we turn to the positions aggregated from deductively defined scales (a priori), and then we estimate the structure of attitudes inductively from the policy positions (a posteriori).
The Netherlands
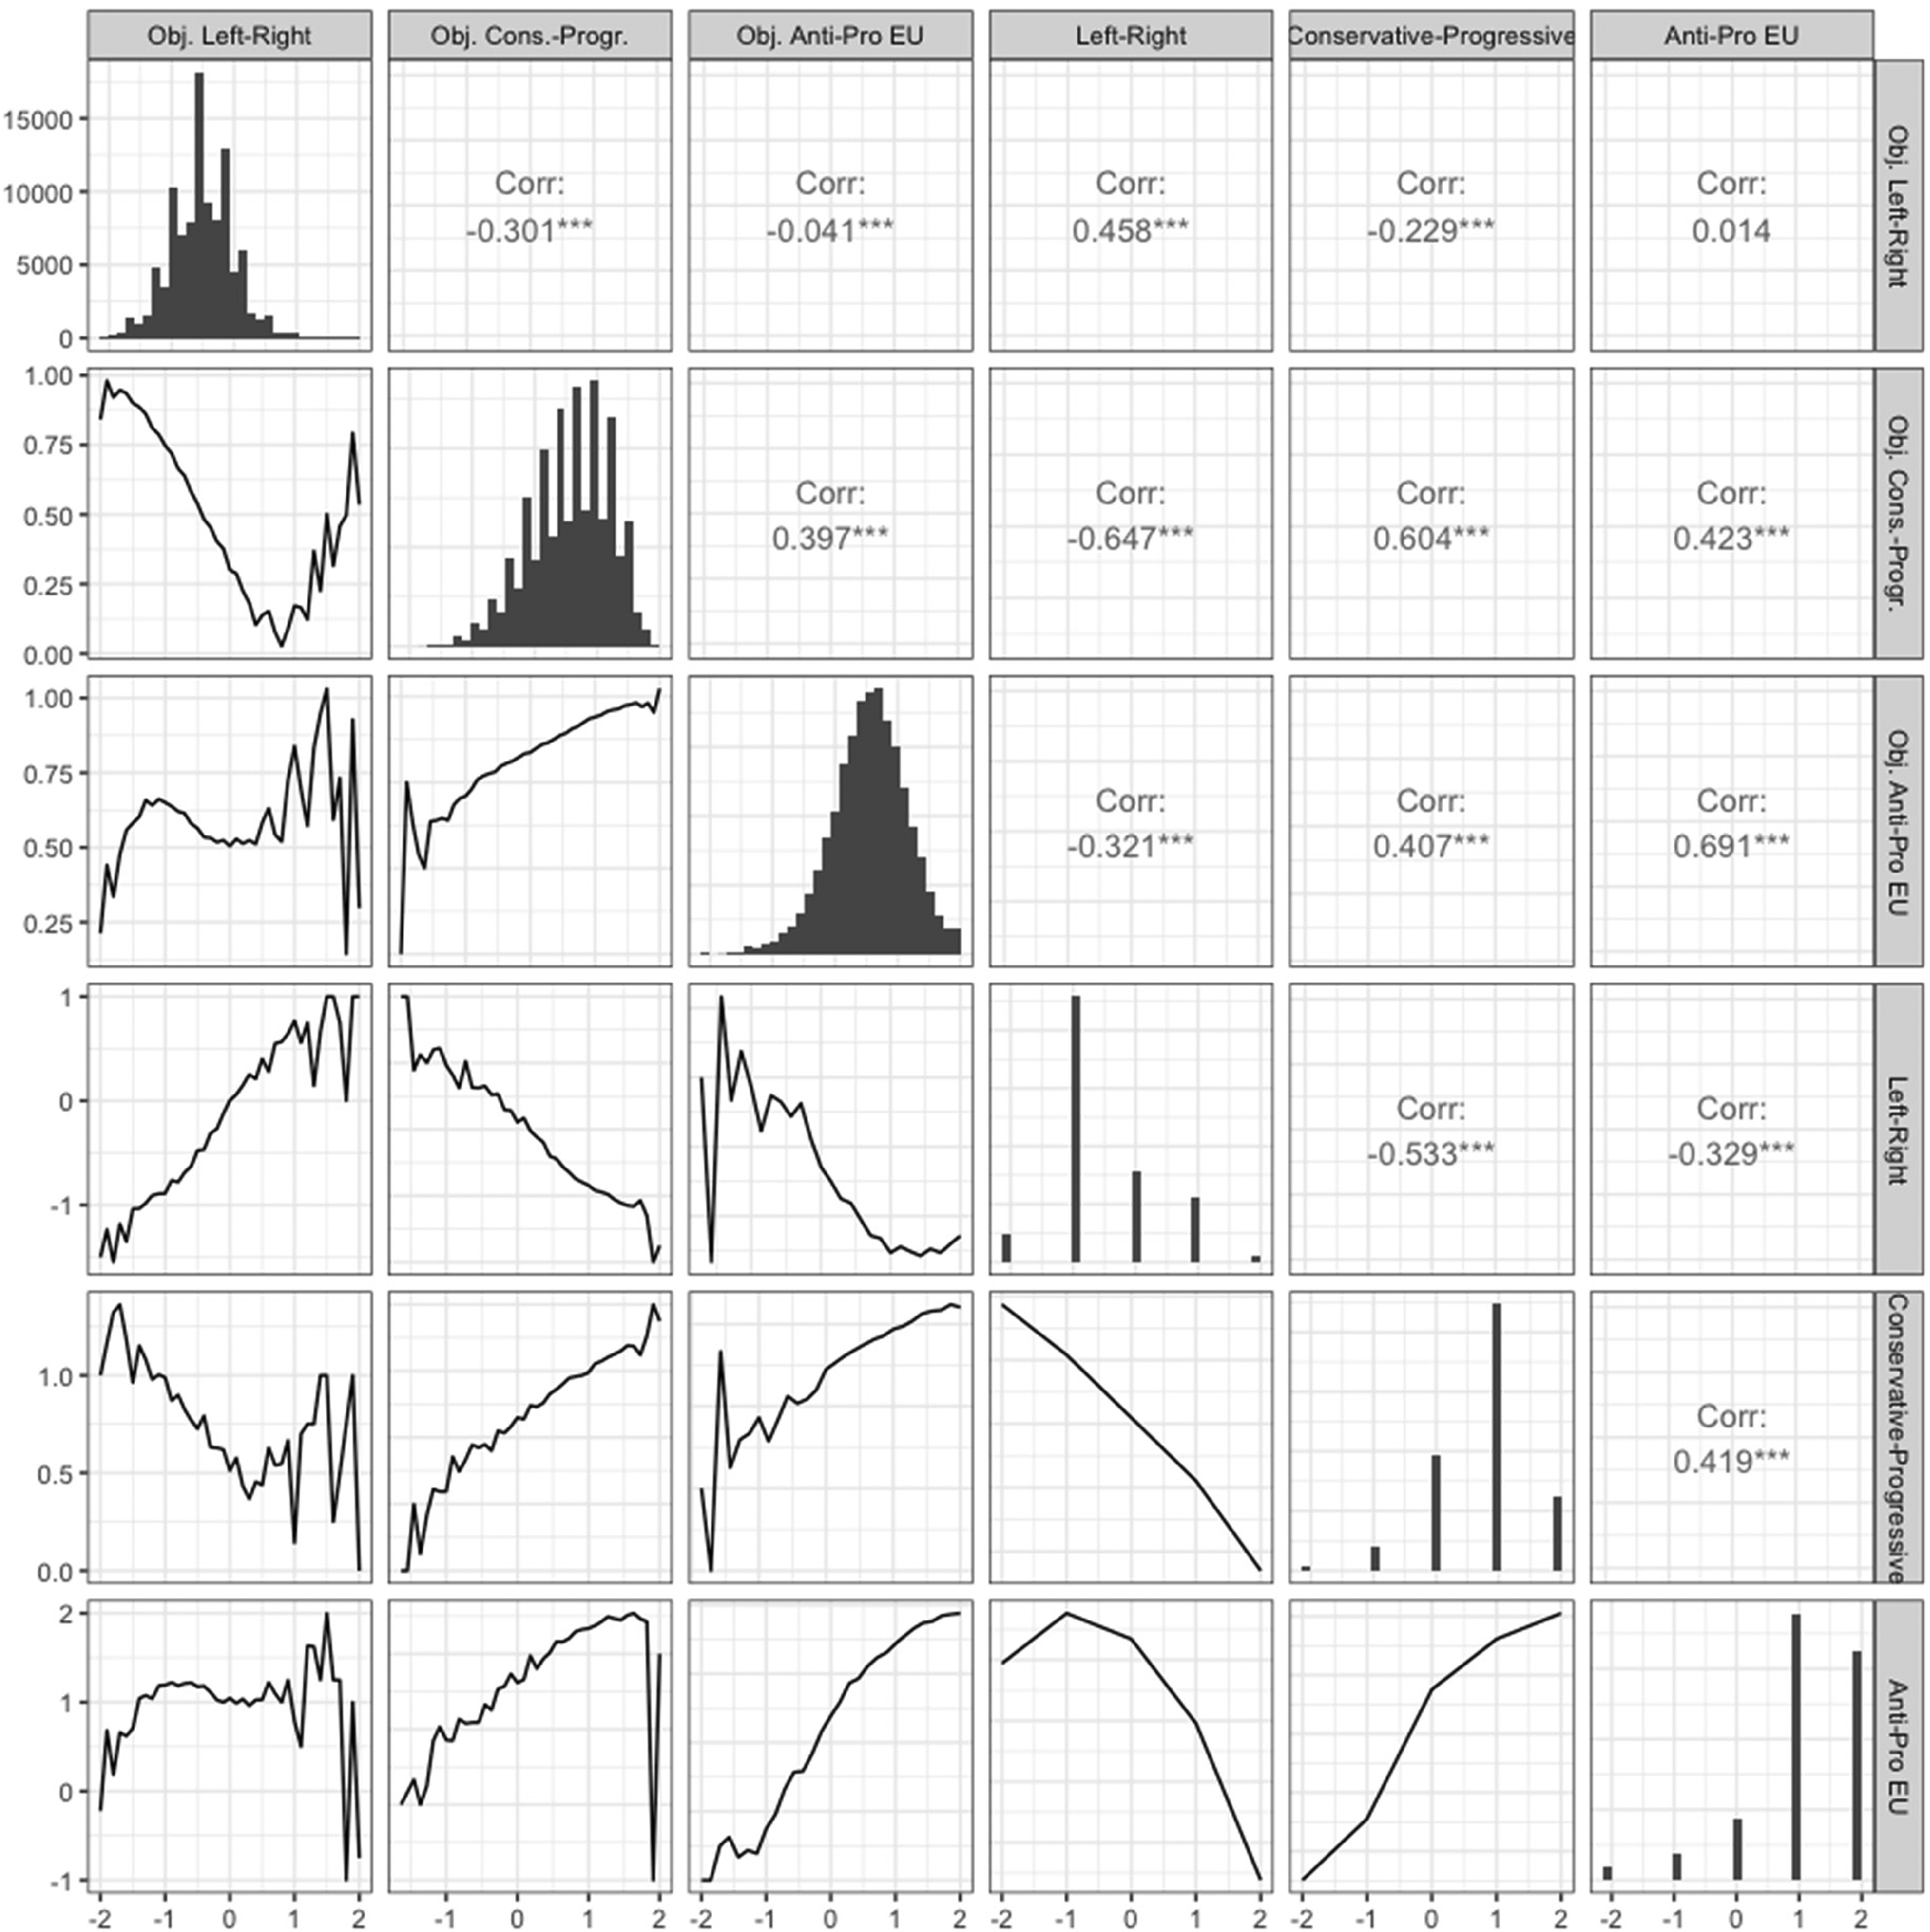
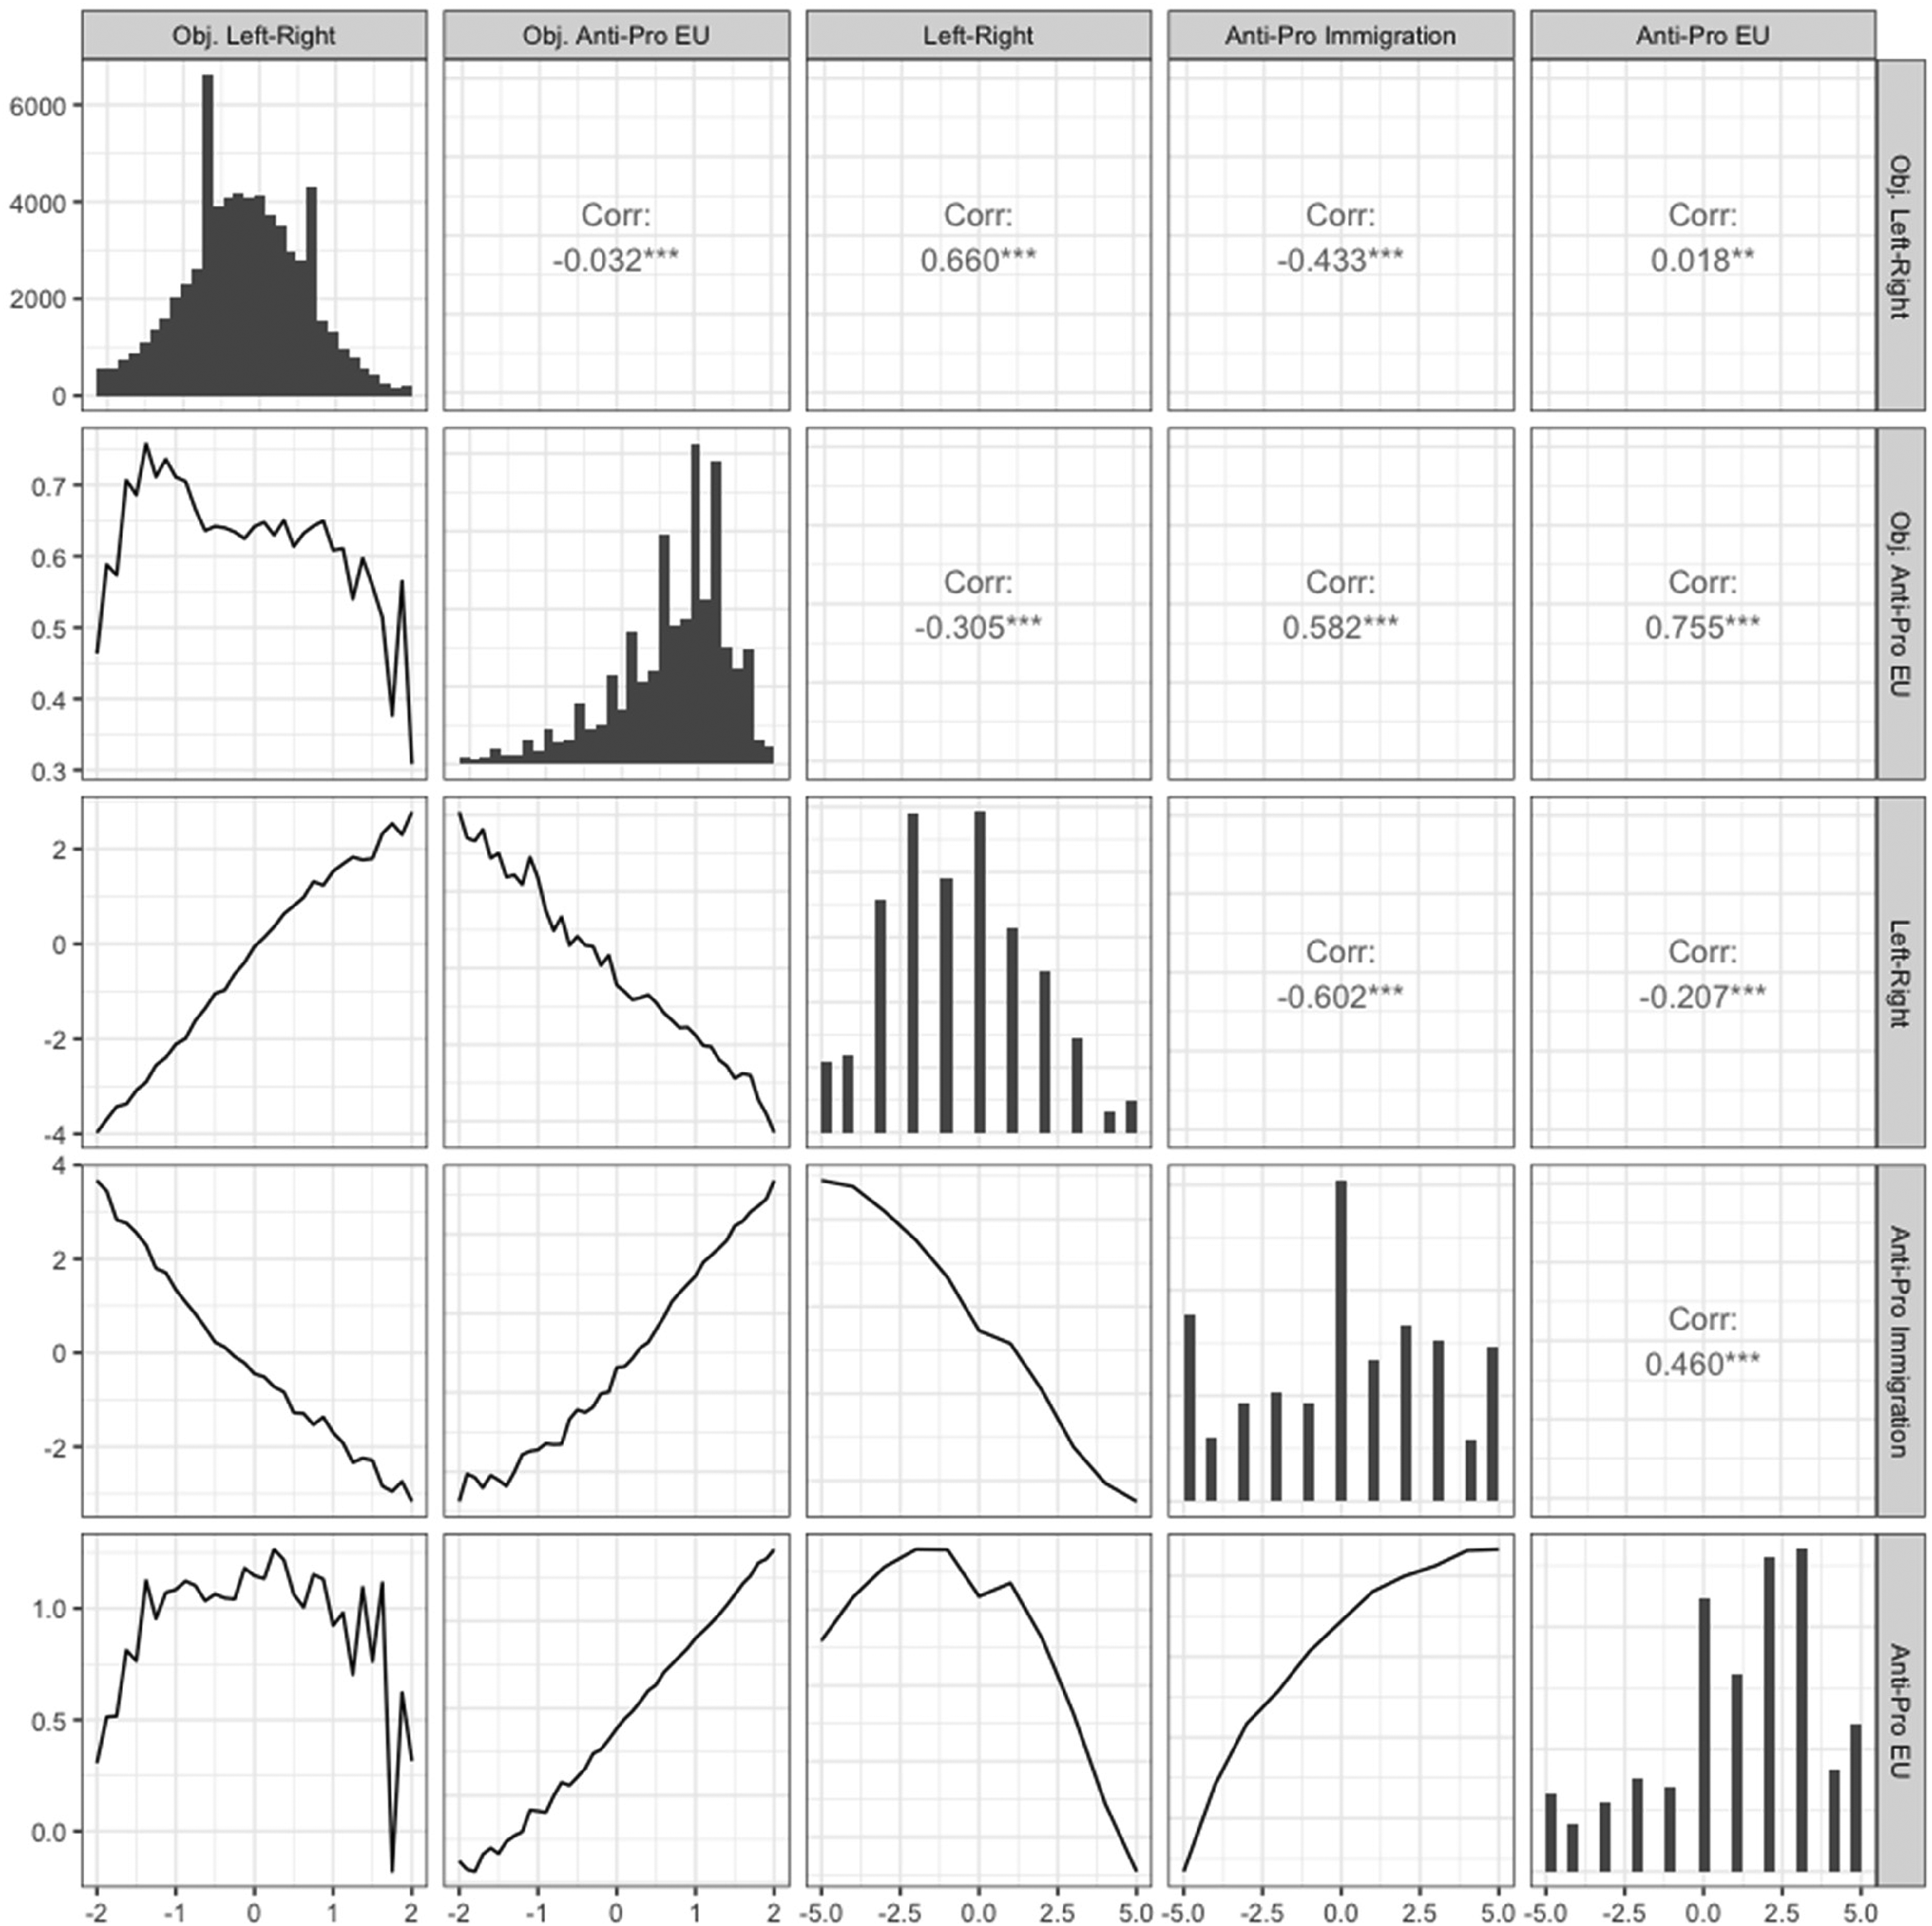
First, we look at the self-placement on the three scales of political ideology (Figure 1, bottom-right corner). The sample is on average leaning towards the left on the left-right scale, it is relatively progressive and pro-European. This is in line with the patterns in the general Dutch population. There is a moderately strong correlation between the left-right and conservative-progressive scales at −0.45, as well as between each of these and the anti-pro EU scale (−0.32 and 0.42). As visible from the lower triangle of the correlation matrix plotted below, the relationships are not quite linear. Pro-EU self-placement is higher and rather flat on the left side of the left-right scale but declines rapidly as one moves past the center towards the right. The relationship with the conservative-progressive scale is more monotonic, but it increases most steeply as one moves away from the conservative end of the scale.
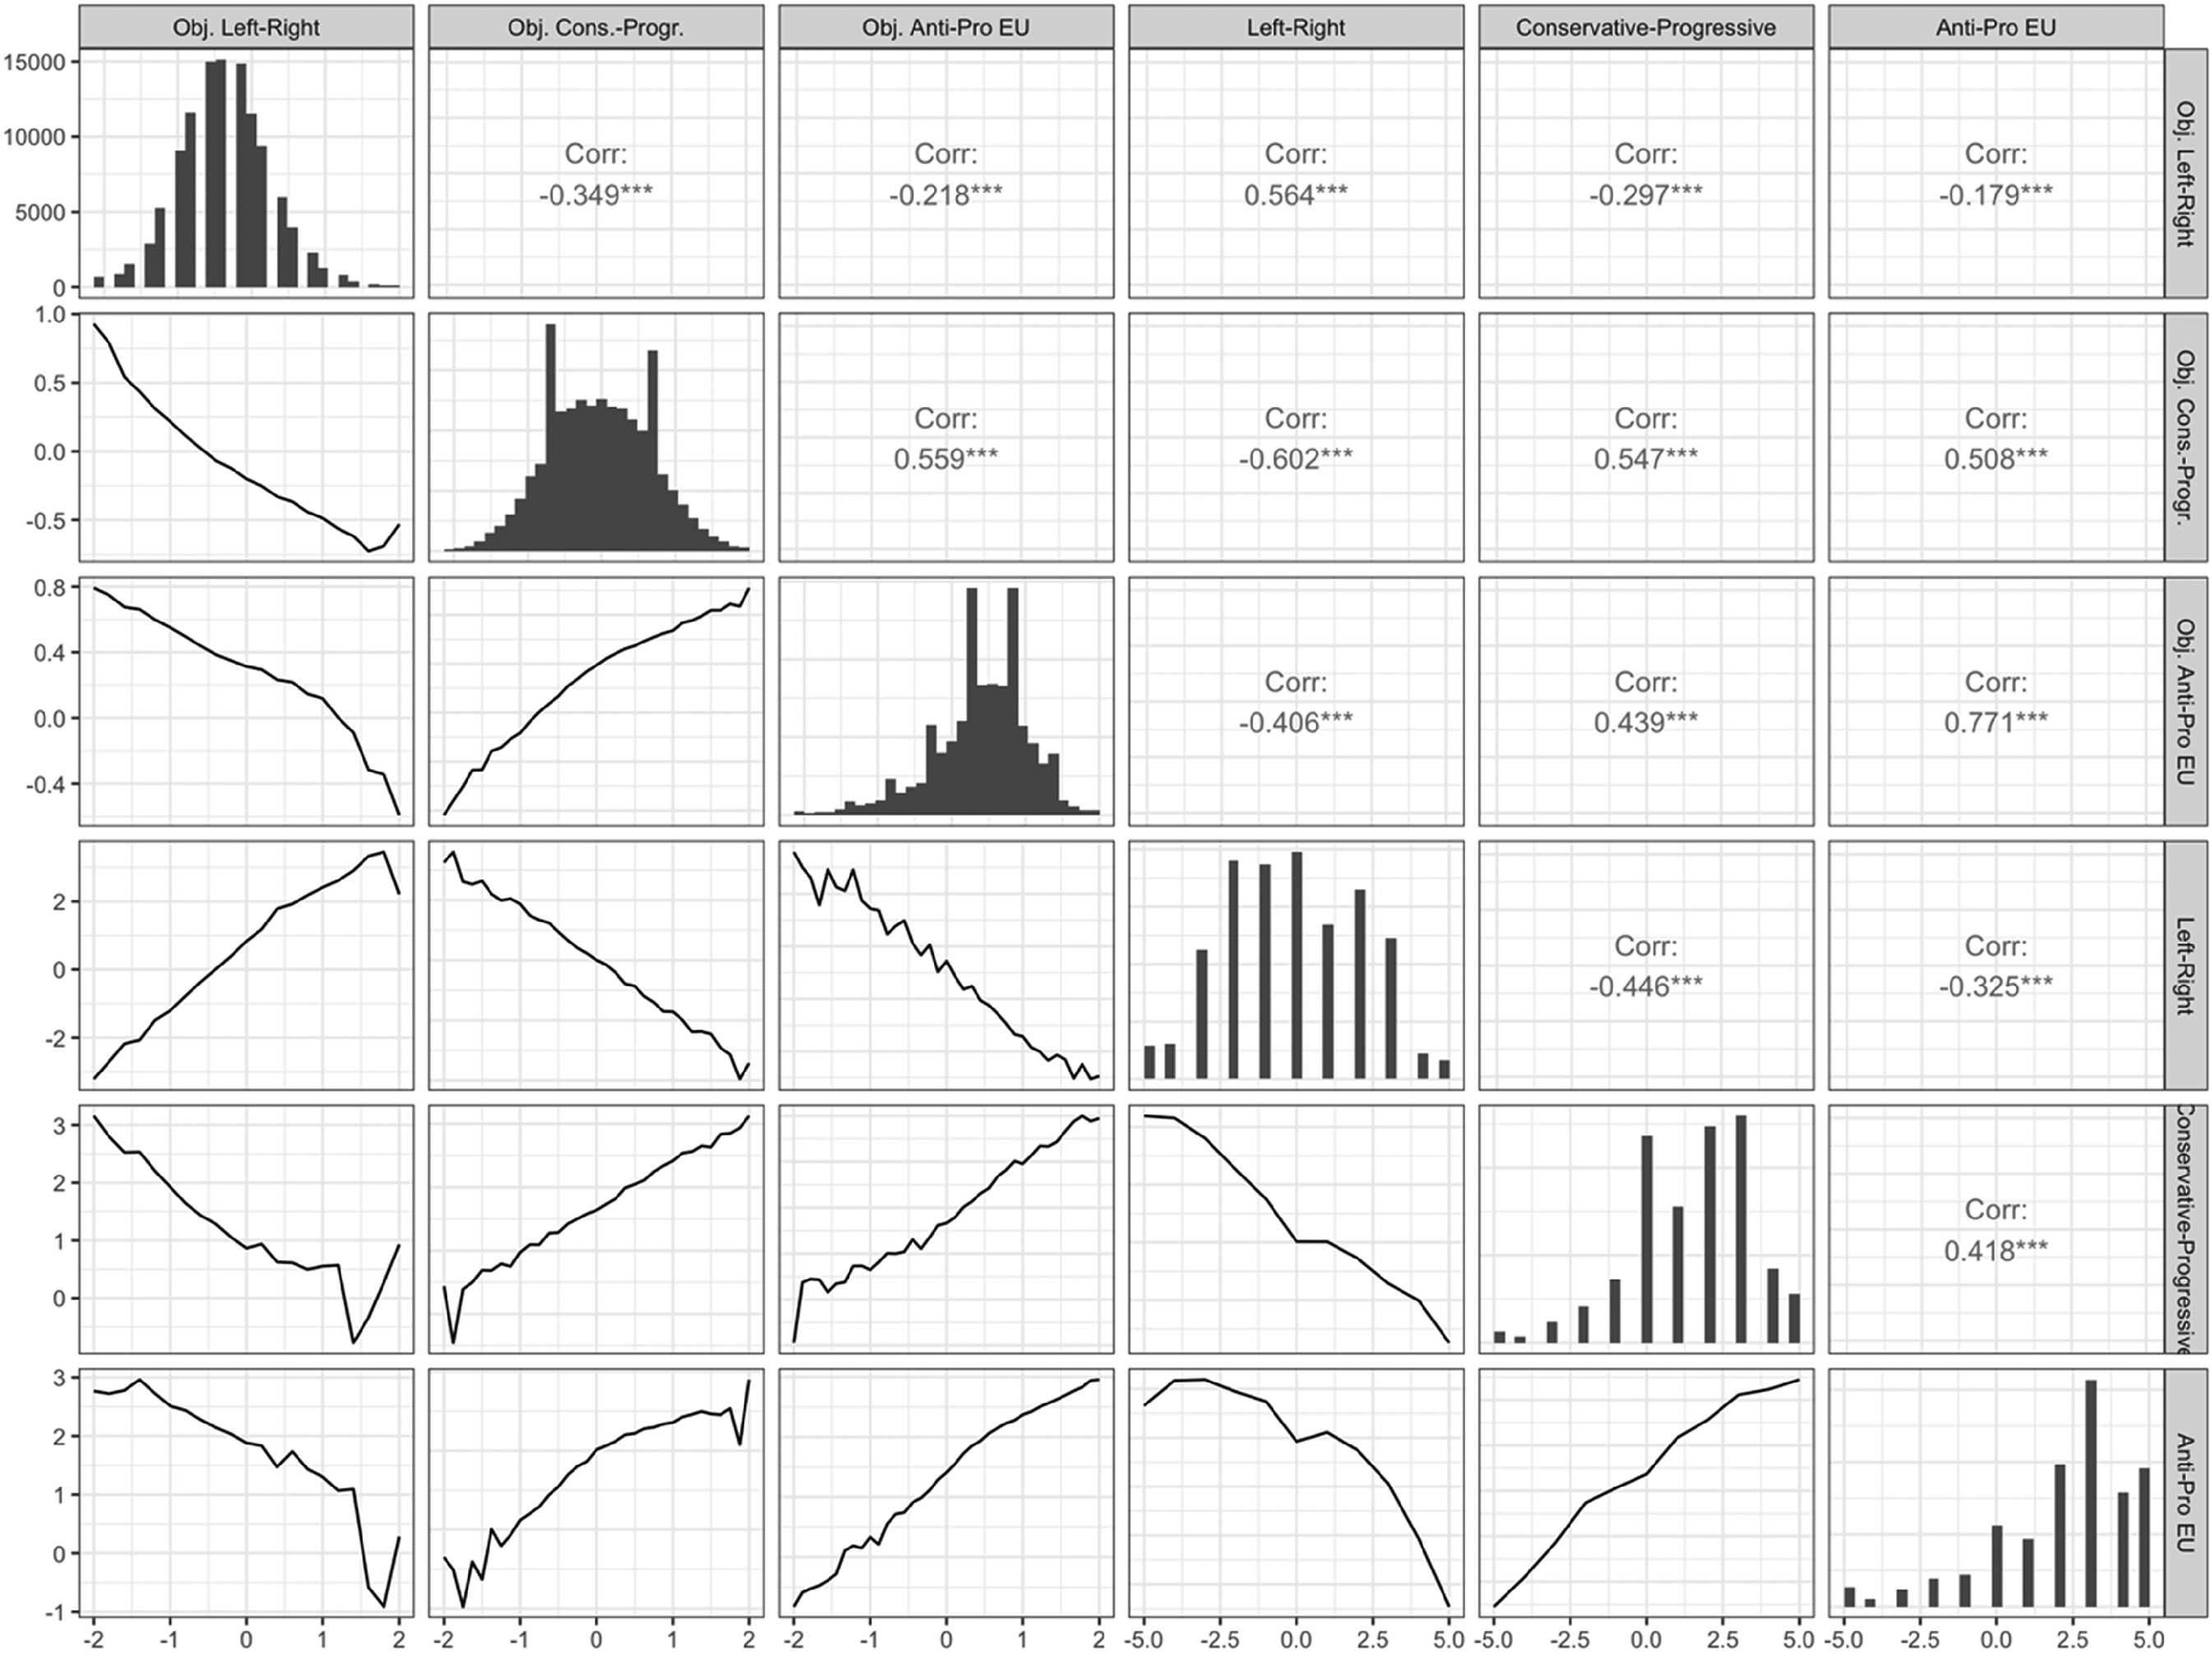
Distributions and cross-correlations of citizen positions on three self-placement scales and three ‘objective’ a priori defined scales; the Netherlands, 2019.
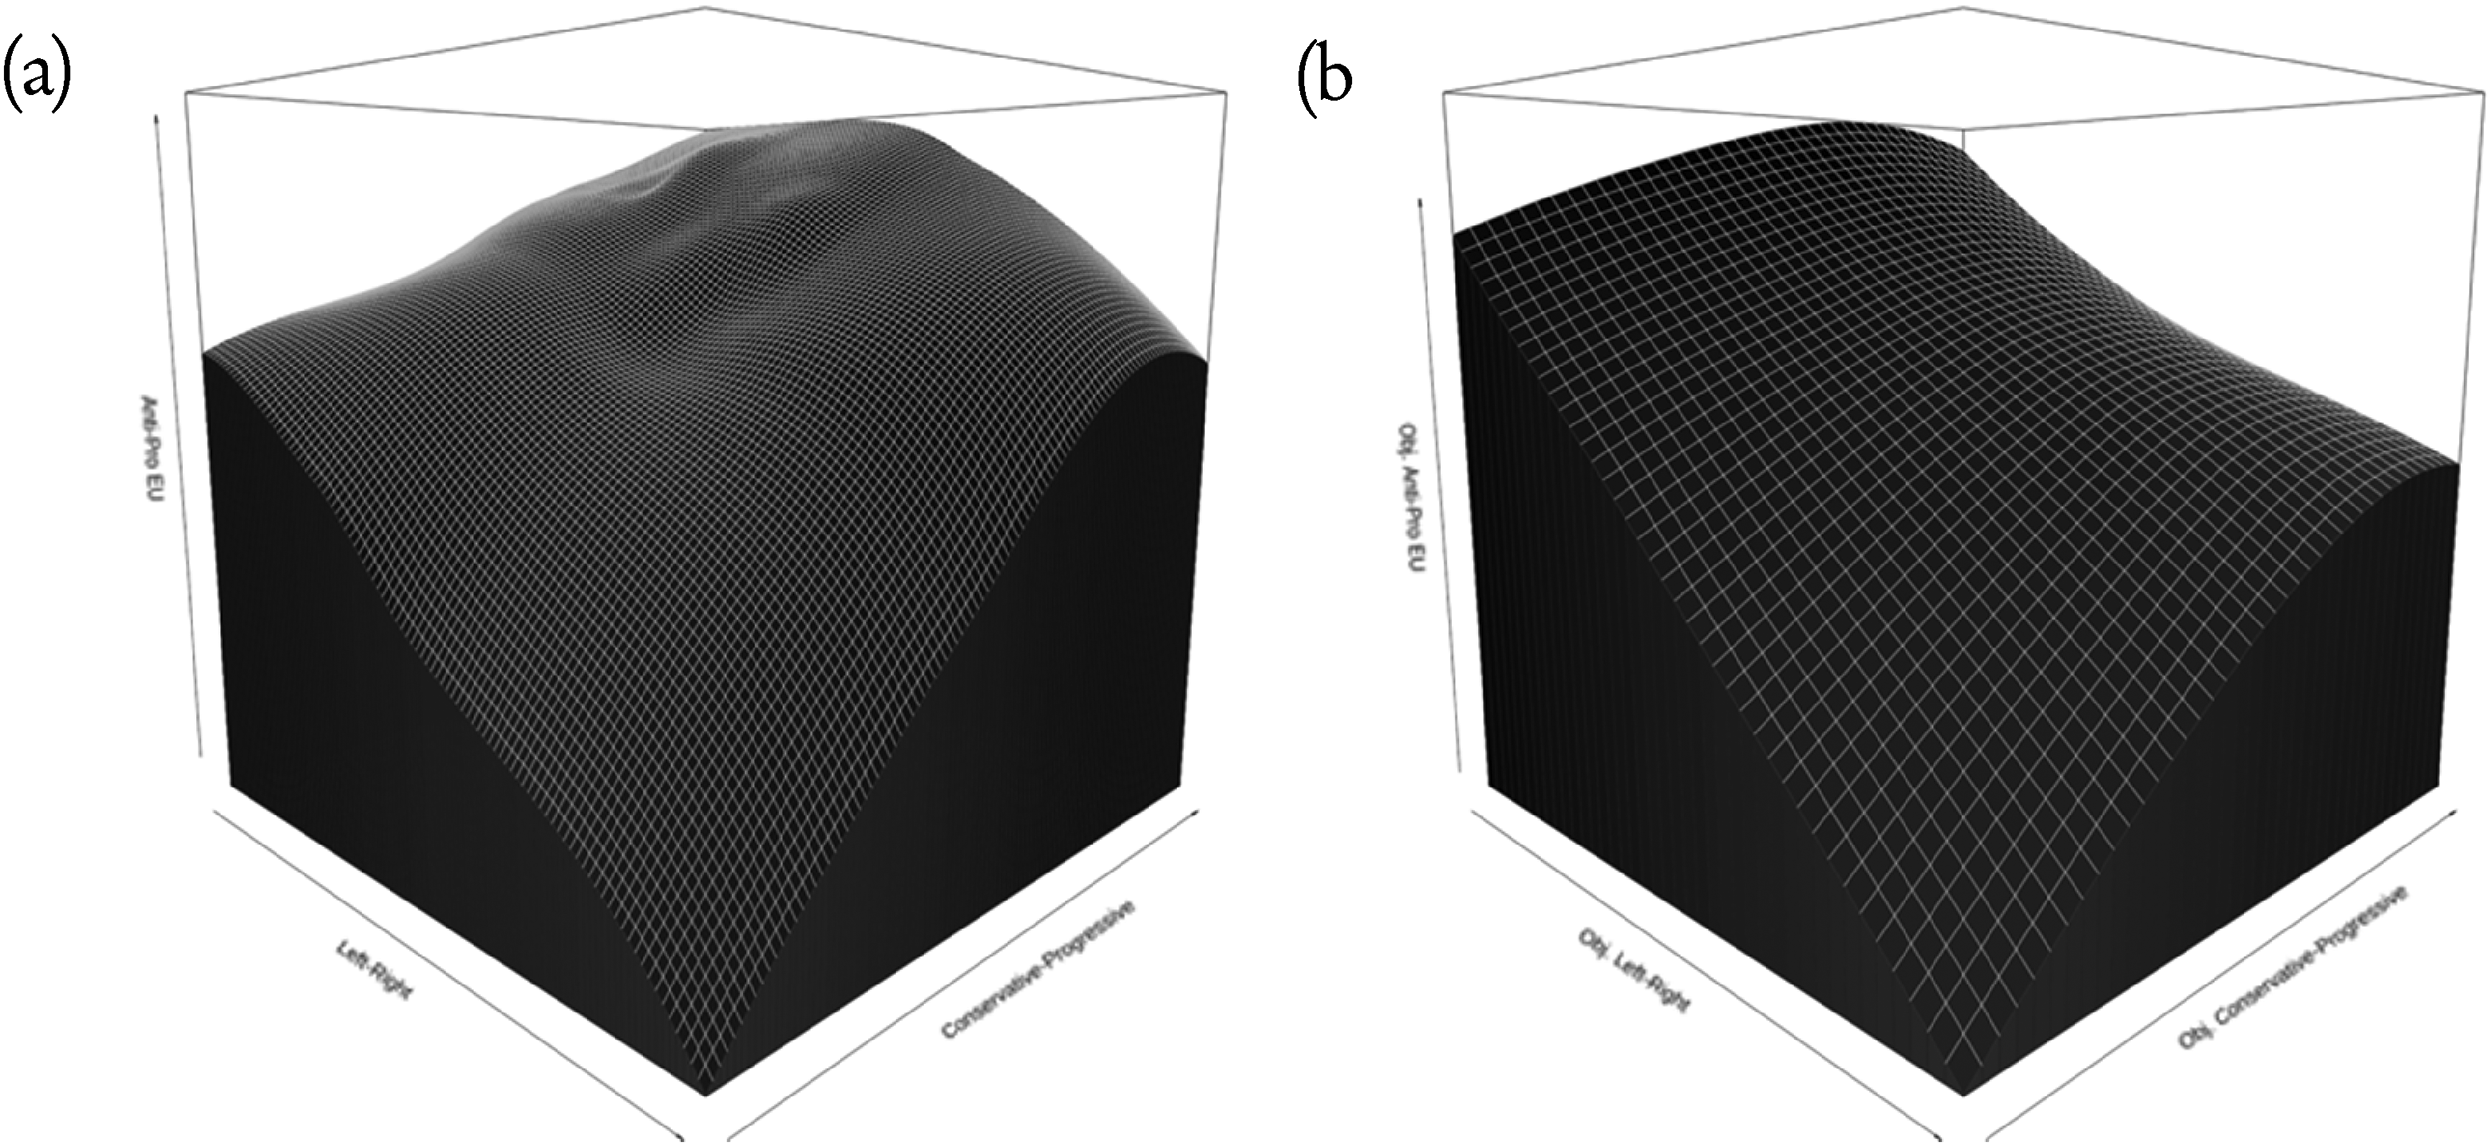
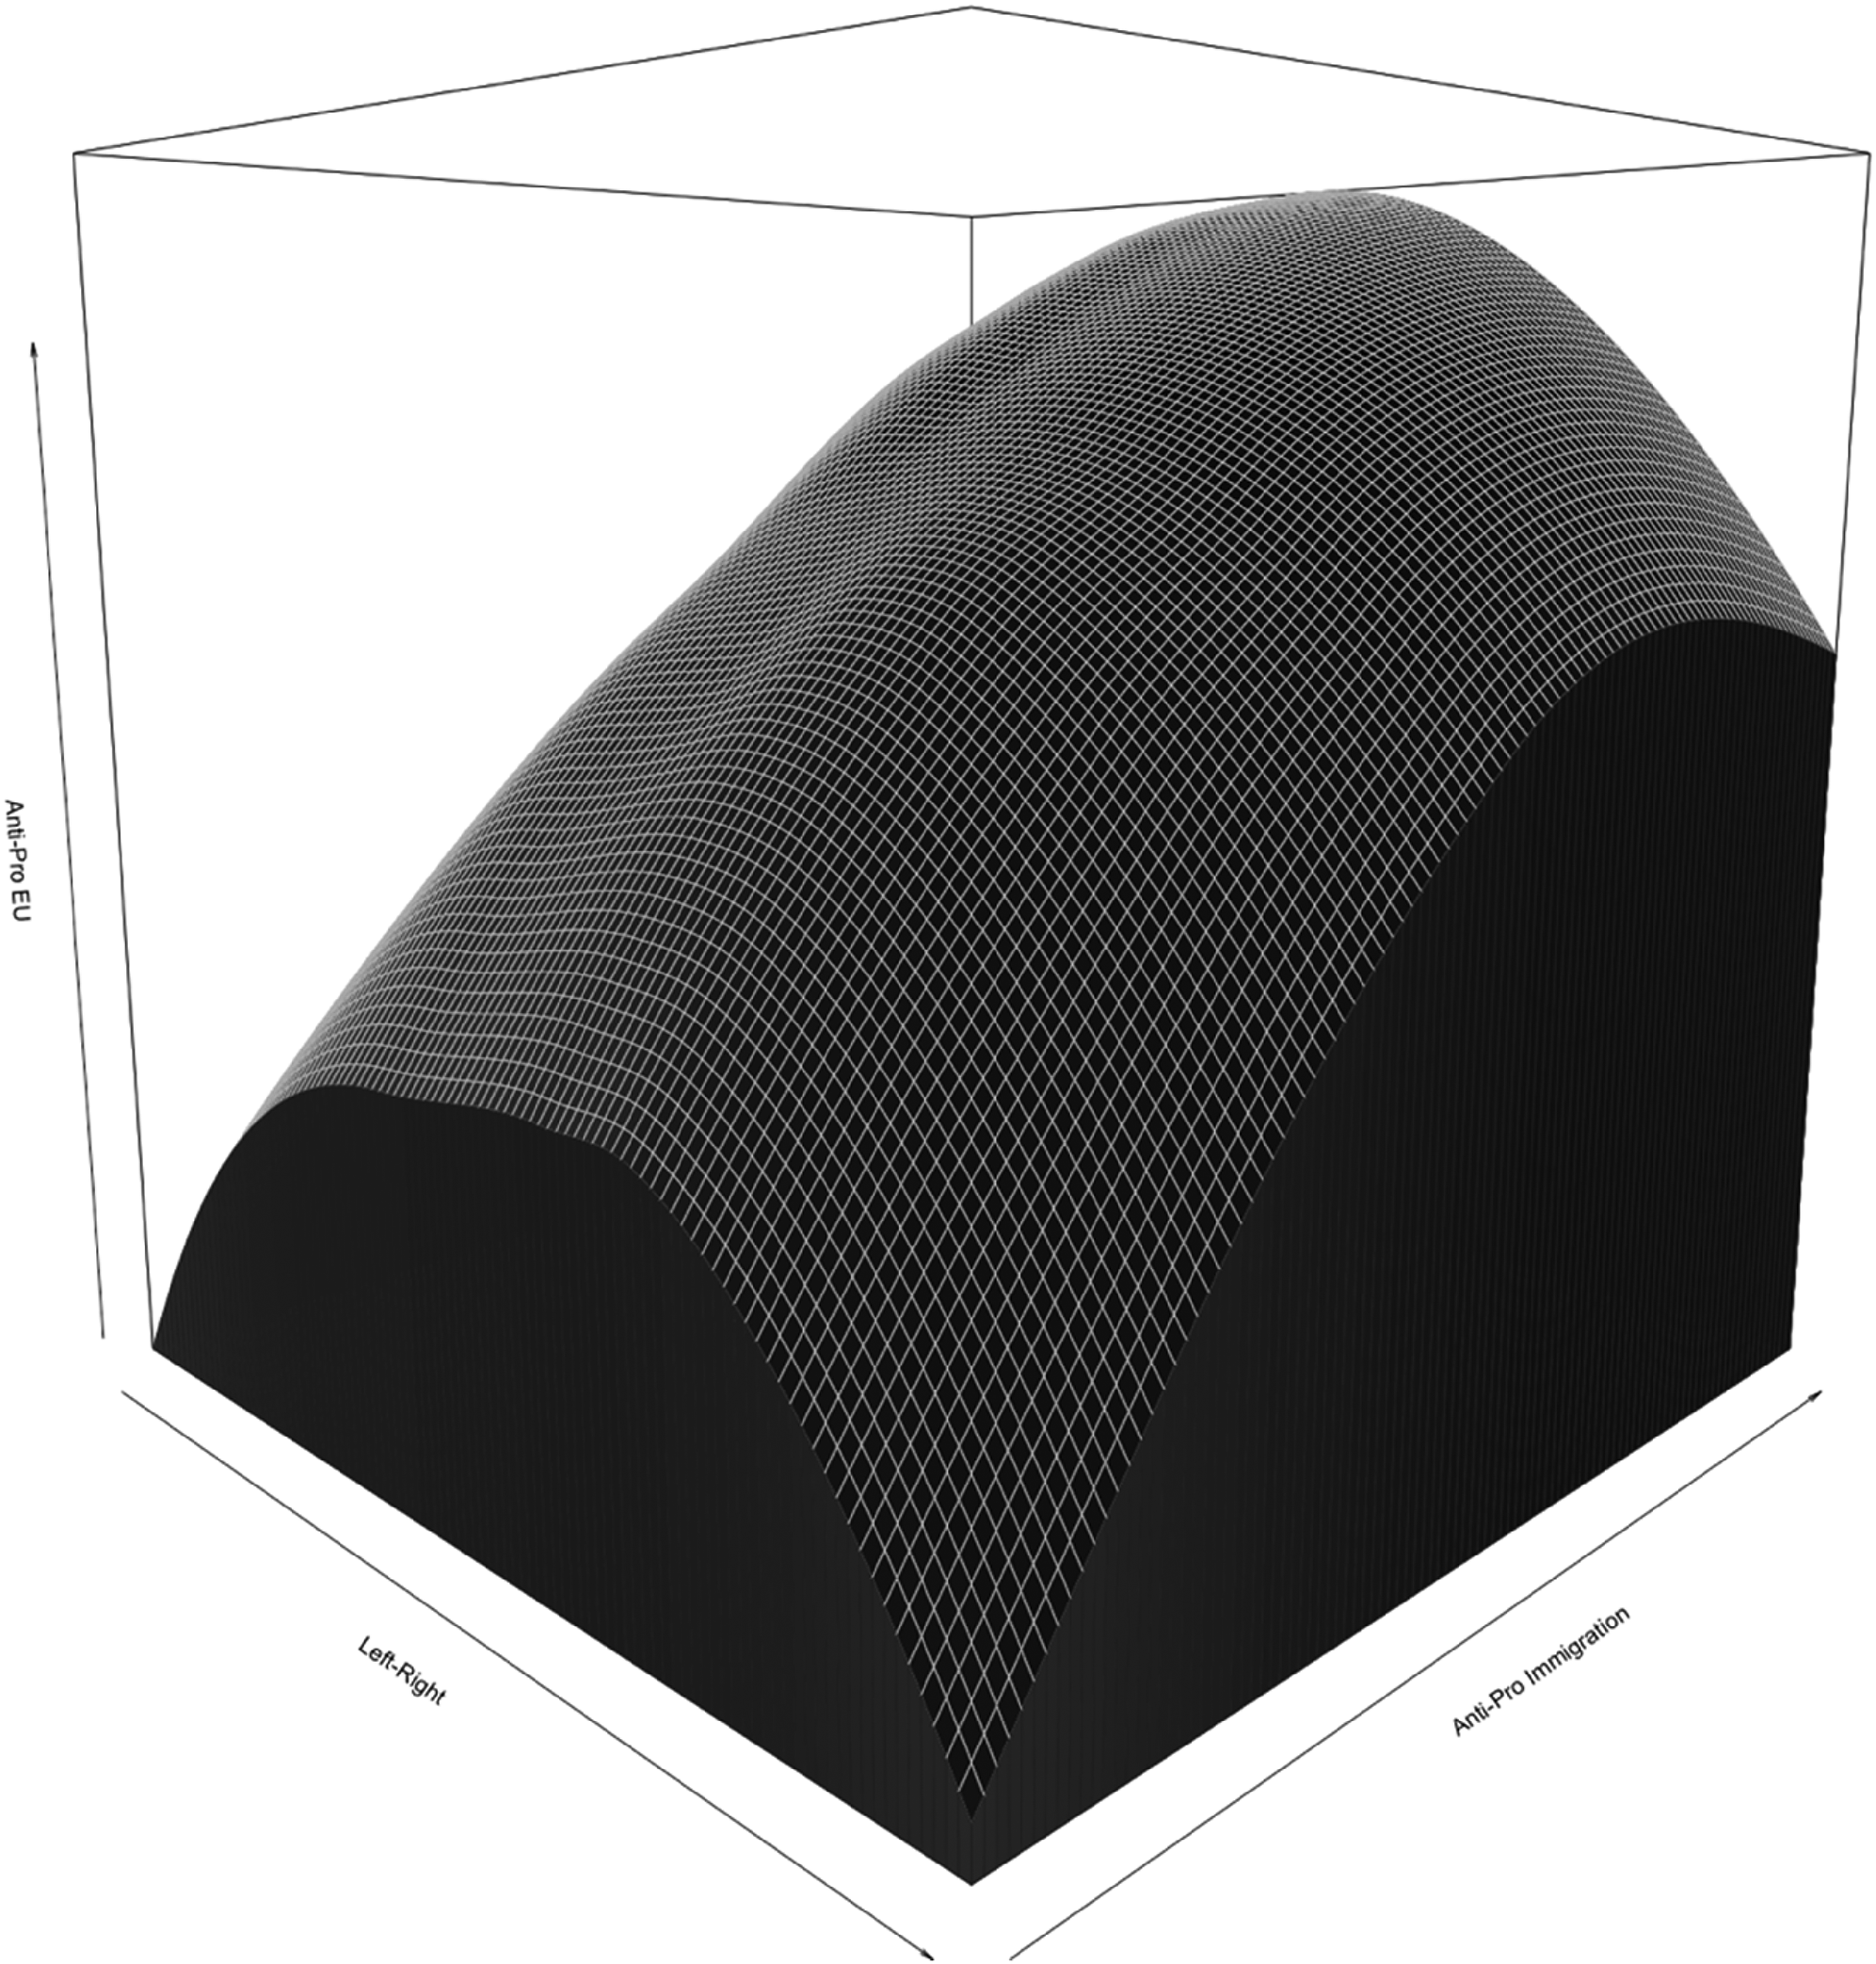
The correlation matrix presents the univariate and bivariate relationships between these three variables, but it is important to explore how anti-pro EU positions vary in the two-dimensional space defined by left-right and conservative-progressive scales simultaneously. Figure 2(a) shows the average level of EU support at each combination of positions on the other two scales. The values of EU support are smoothed using a flexible, non-parametric function (loess, or local polynomial regression), which does not impose linear or quadratic forms on the relationship. Figure 2(a) shows that the average level of EU support is lowest for citizens who place themselves in the right/conservative corner of the space defined by these two dimensions. The highest values of EU support are registered for citizens at the progressive endpoint of that scale but not quite at the left extreme of the left-right scale (yet far from the center as well). Moreover, we can see that EU support increases from its minimum faster as one moves along with the left-right scale than it does with moving away from the conservative endpoint. Also, for conservatives, EU support declines monotonically as one moves from right to left. But for progressives, the peak is reached before the left extreme. For additional representations of the relationships between the three variables see the Online appendix.
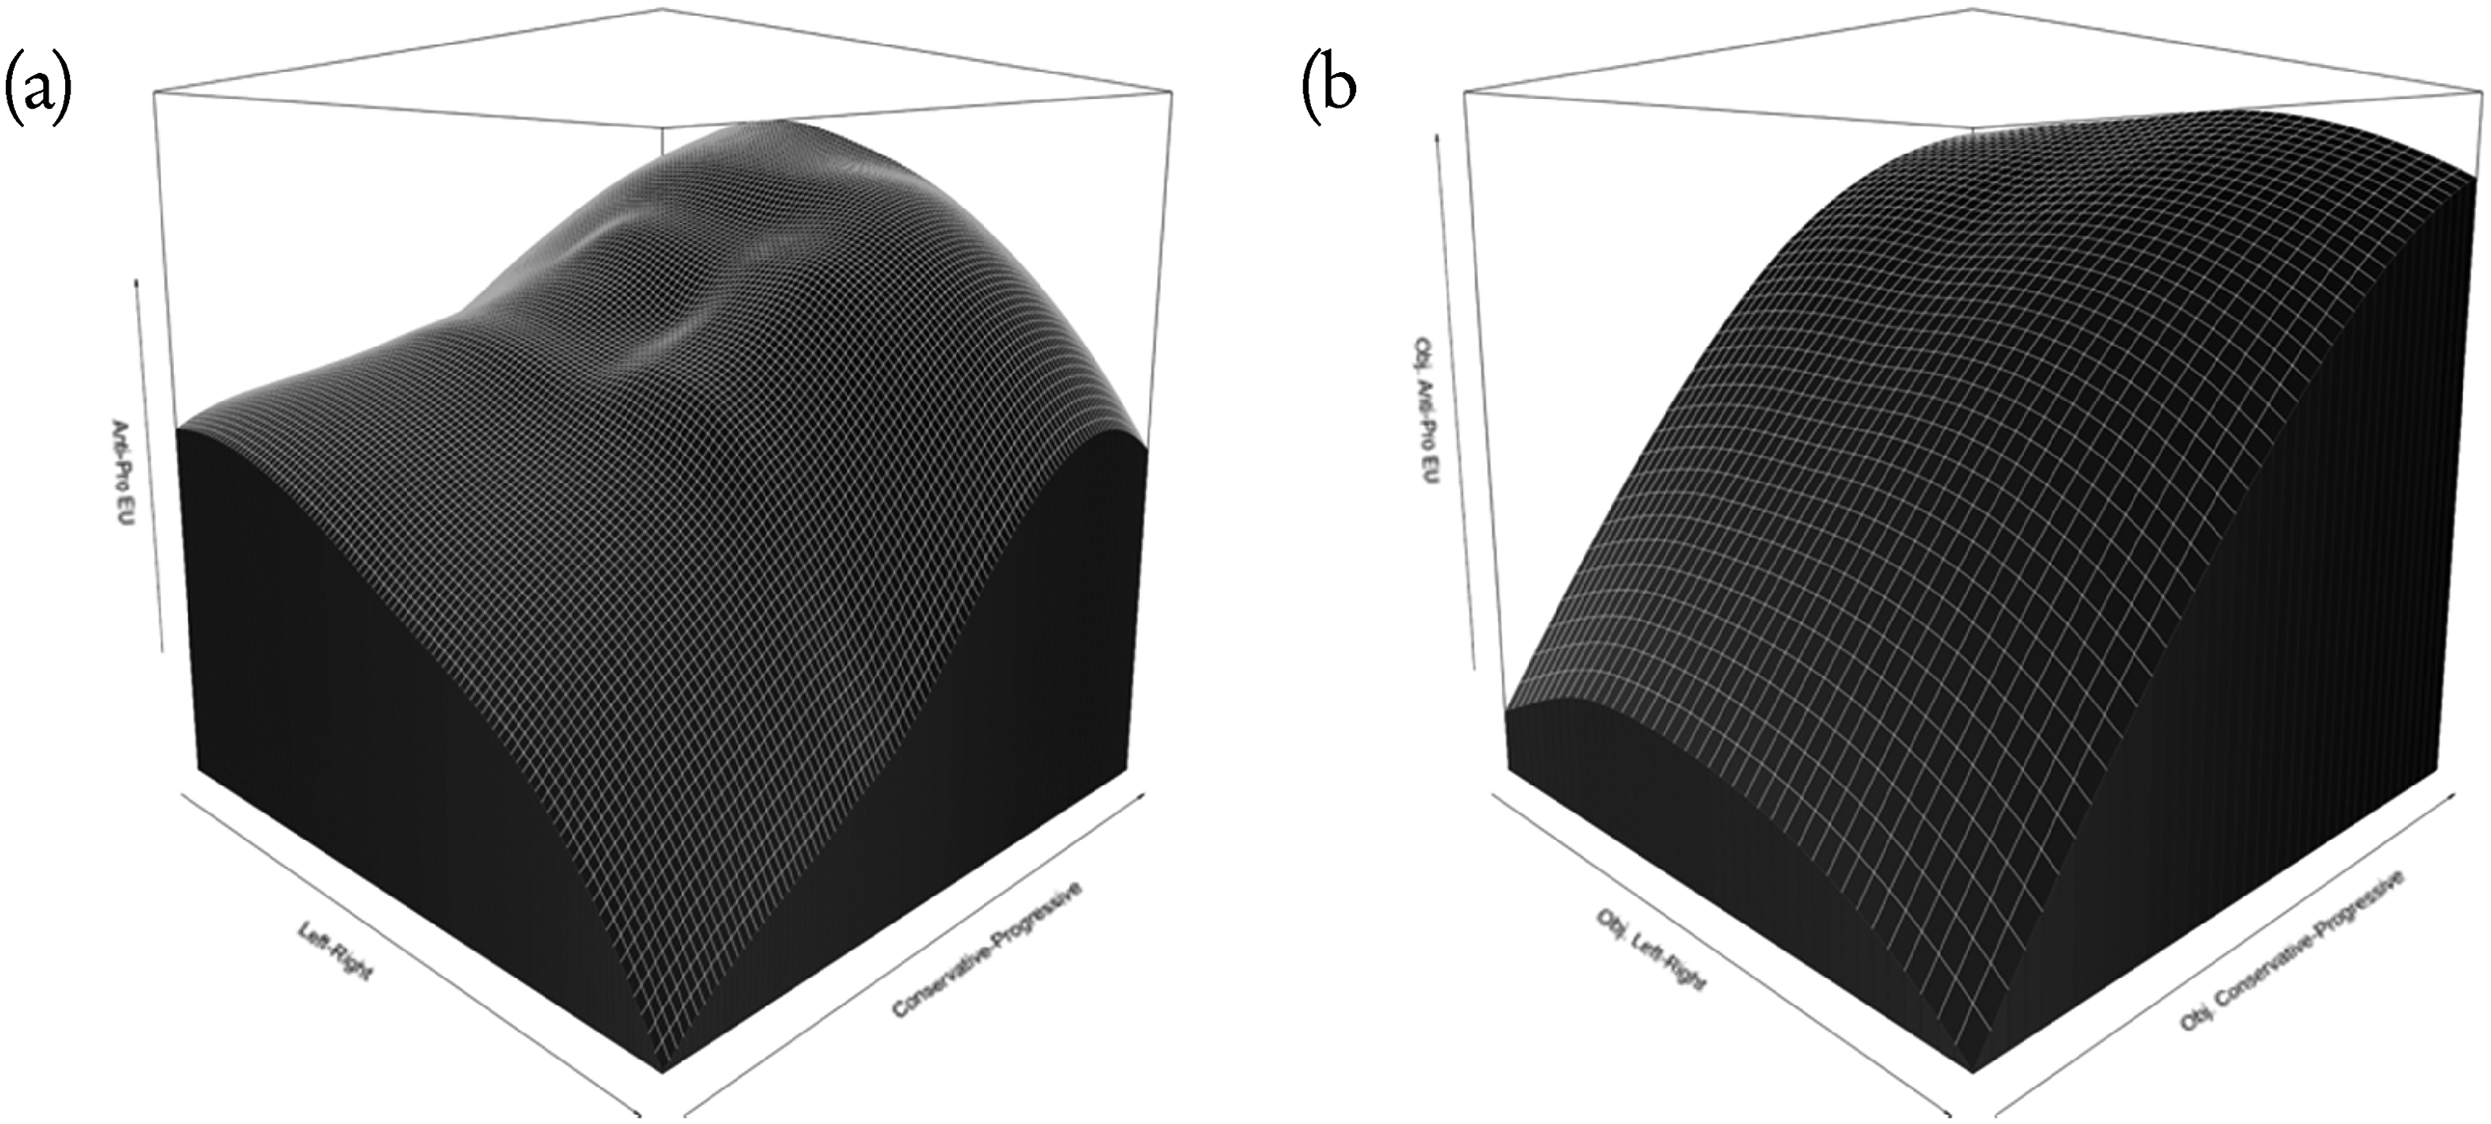
Average positions on the anti-pro EU scale (mapped to height) as a function of positions on the left-right and conservative-progressive scales: (a) self-placement on ideological scales; (b) ‘objective’ positions aggregated from policy preferences; the Netherlands, 2019.
Next, we examine the positions of citizens by aggregating their positions on policy issues that we assign a priori to deductively defined scales. The correlations between the ‘objective’ positions and the self-placement are relatively low (see Figure 1). ‘Objective’ left-right positions are correlated with self-placement on the left-right at 0.56 3 and ‘objective’ conservative-progressive positions are correlated with self-placement on the conservative-progressive scale at 0.55. The correlation between ‘objective’ EU and self-placement on anti-pro EU is higher, at 0.77, which is reasonable given that the label of the scale's content is much clearer. It should be noted that ‘objective’ positions on the conservative-progressive scale correlate at 0.60 with self-placement on left-right and 0.50 with self-placement on anti-pro EU. Some apparent non-linearities in the relationships between these scales are visible in Figure 1, but they might be due to the relatively low number of observations at their extremes.
When we plot the relationships between the positions on the three ‘objectively’ defined scales (Figure 2(b)), the picture we get is different than the one based on self-placement. In particular, we find a curvilinear relationship between left-right and anti-pro EU, but only for citizens at the conservative end of the conservative-progressive scale. For citizens at the progressive end of the scale, EU support does not change much from right to left. With the ‘objective’ positions, the increase in EU support with more progressive positions is very similar for people with different values on the left-right scale, unlike the case above with self-placement 4 . These results imply that actual extreme-left positions on issues related to redistribution are associated with lower support for the EU (compared to more moderate positions), while self-designation as extreme-left are not. This can be explained by people choosing to self-place on the extreme left end of the left-right scale because of identity – rather than policy-based considerations.
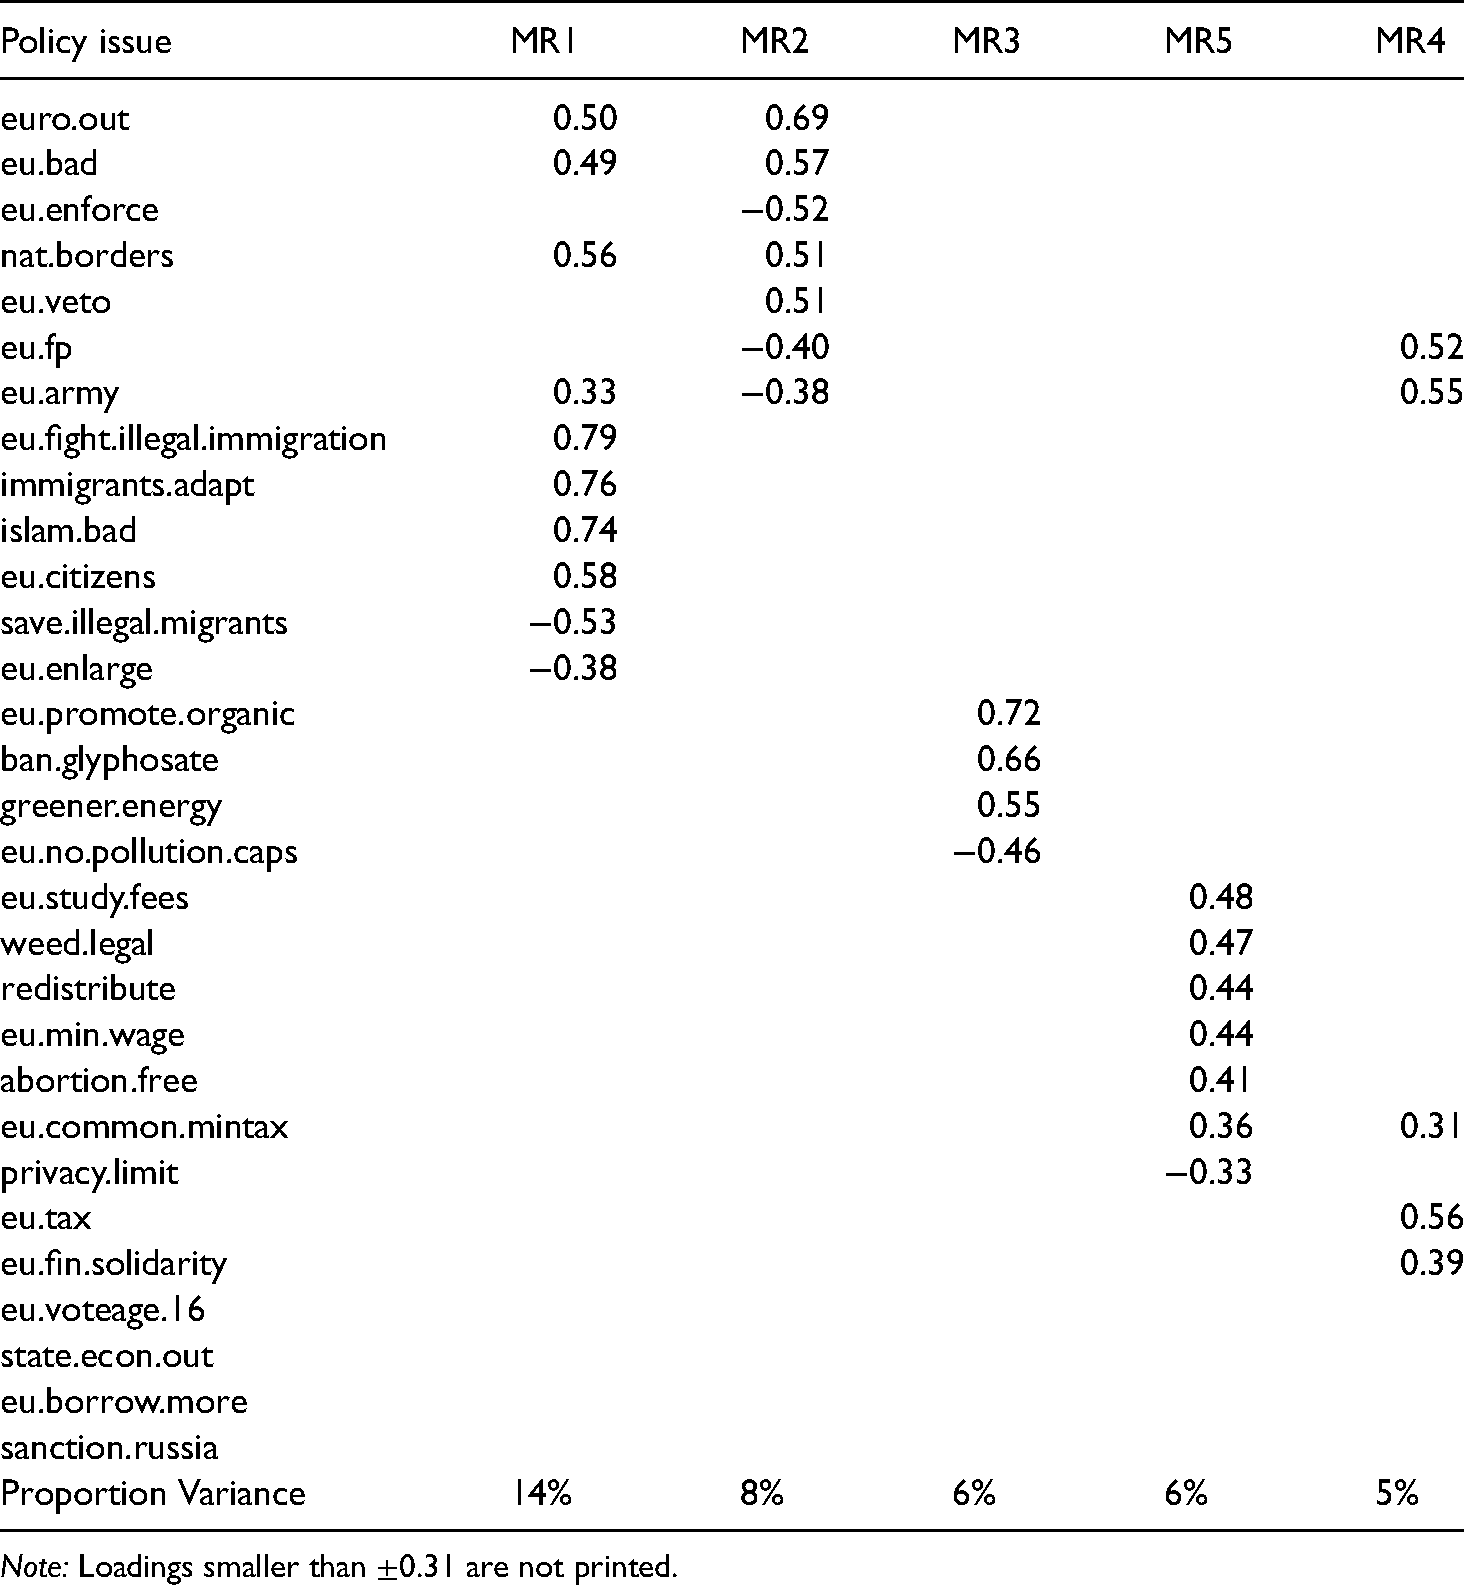
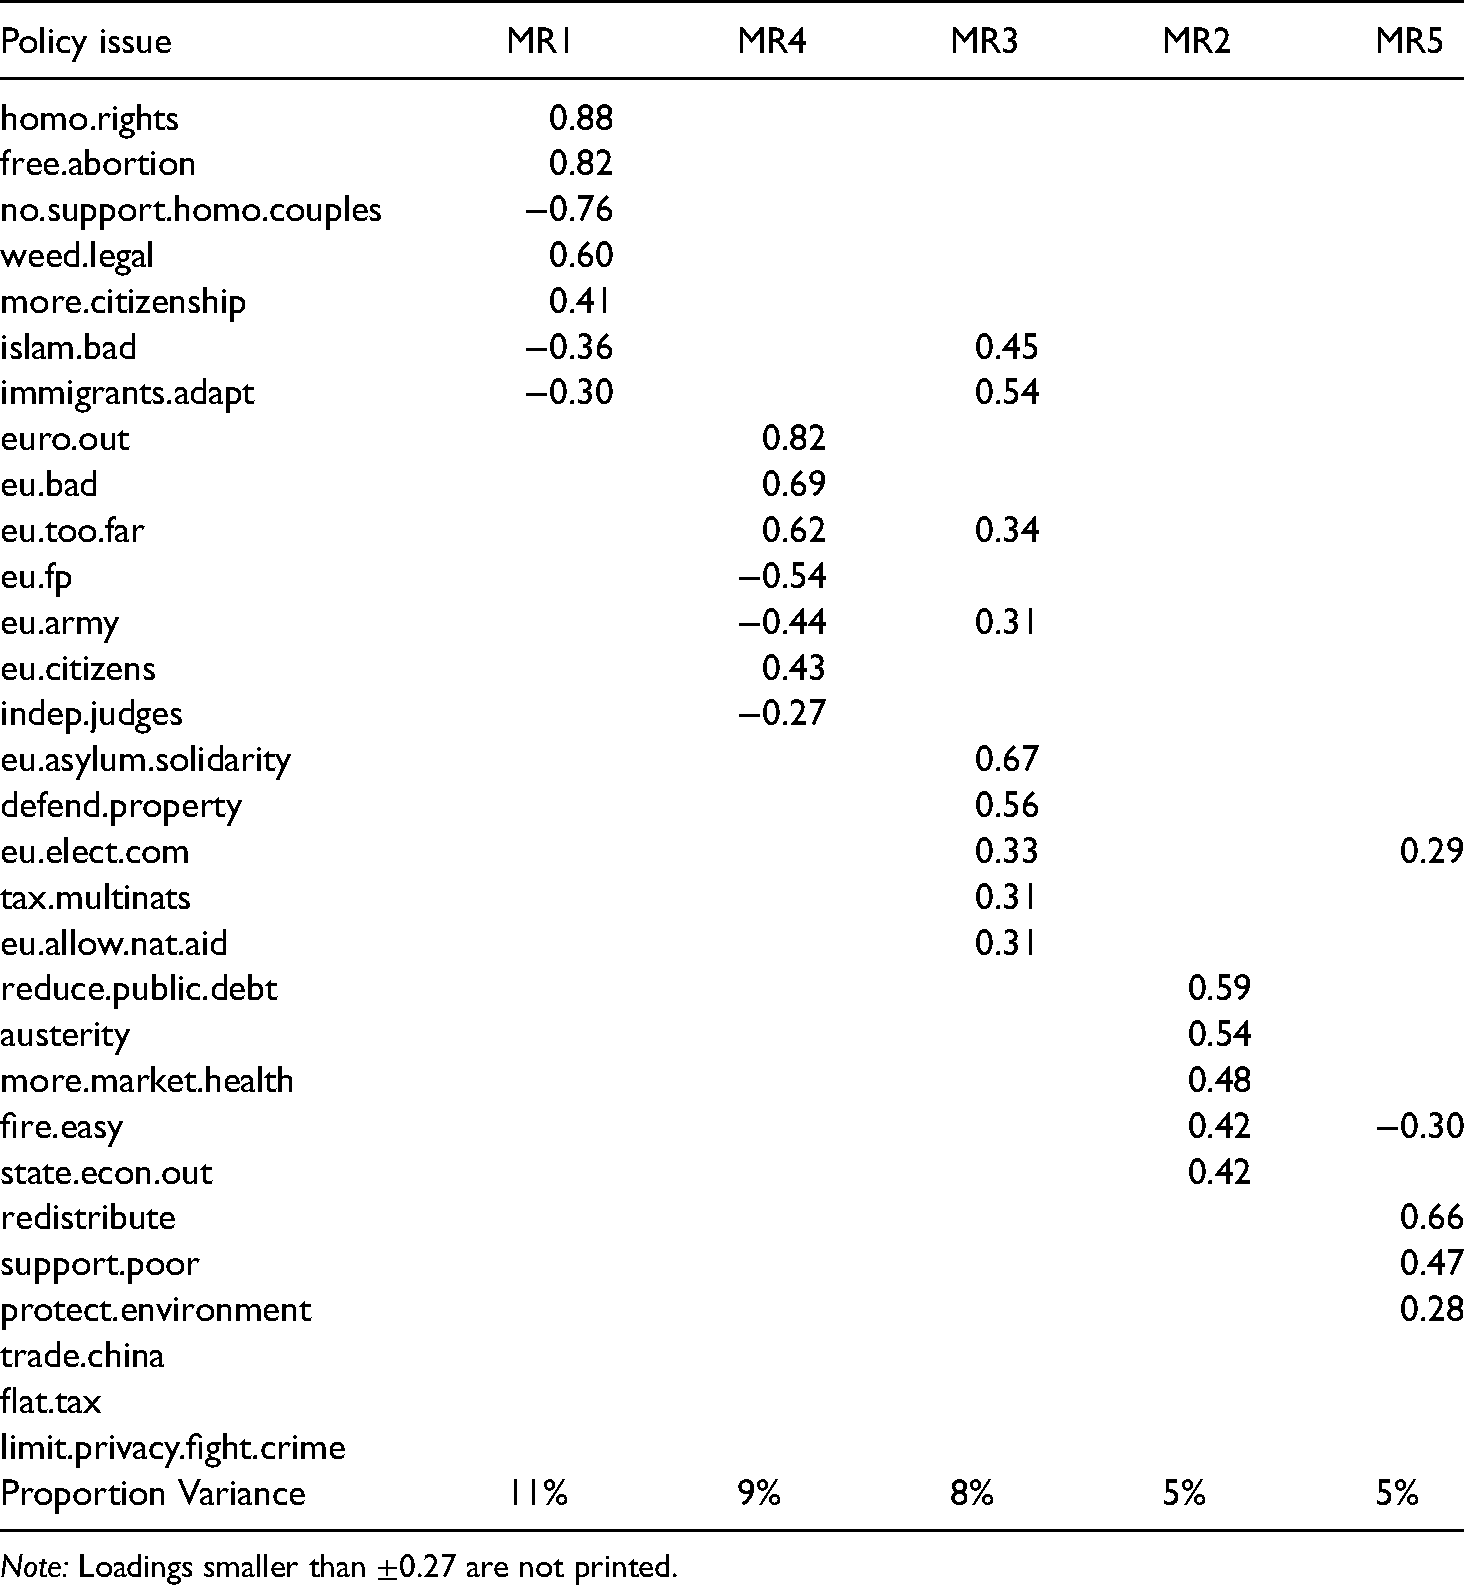
Moving to the inductive analysis of a posteriori positions, we report the results from the factor analysis in Table 1 (a PCA of the same data is reported in the Online appendix). Formal methods suggest seven factors to extract, but the last factor does not appear to be related exclusively to any item that is not already part of another one, so we prefer a six-factor solution. Even with six factors, only 43% of the variation in the data is accounted for.
Factor analysis results from the Netherlands, 2019.
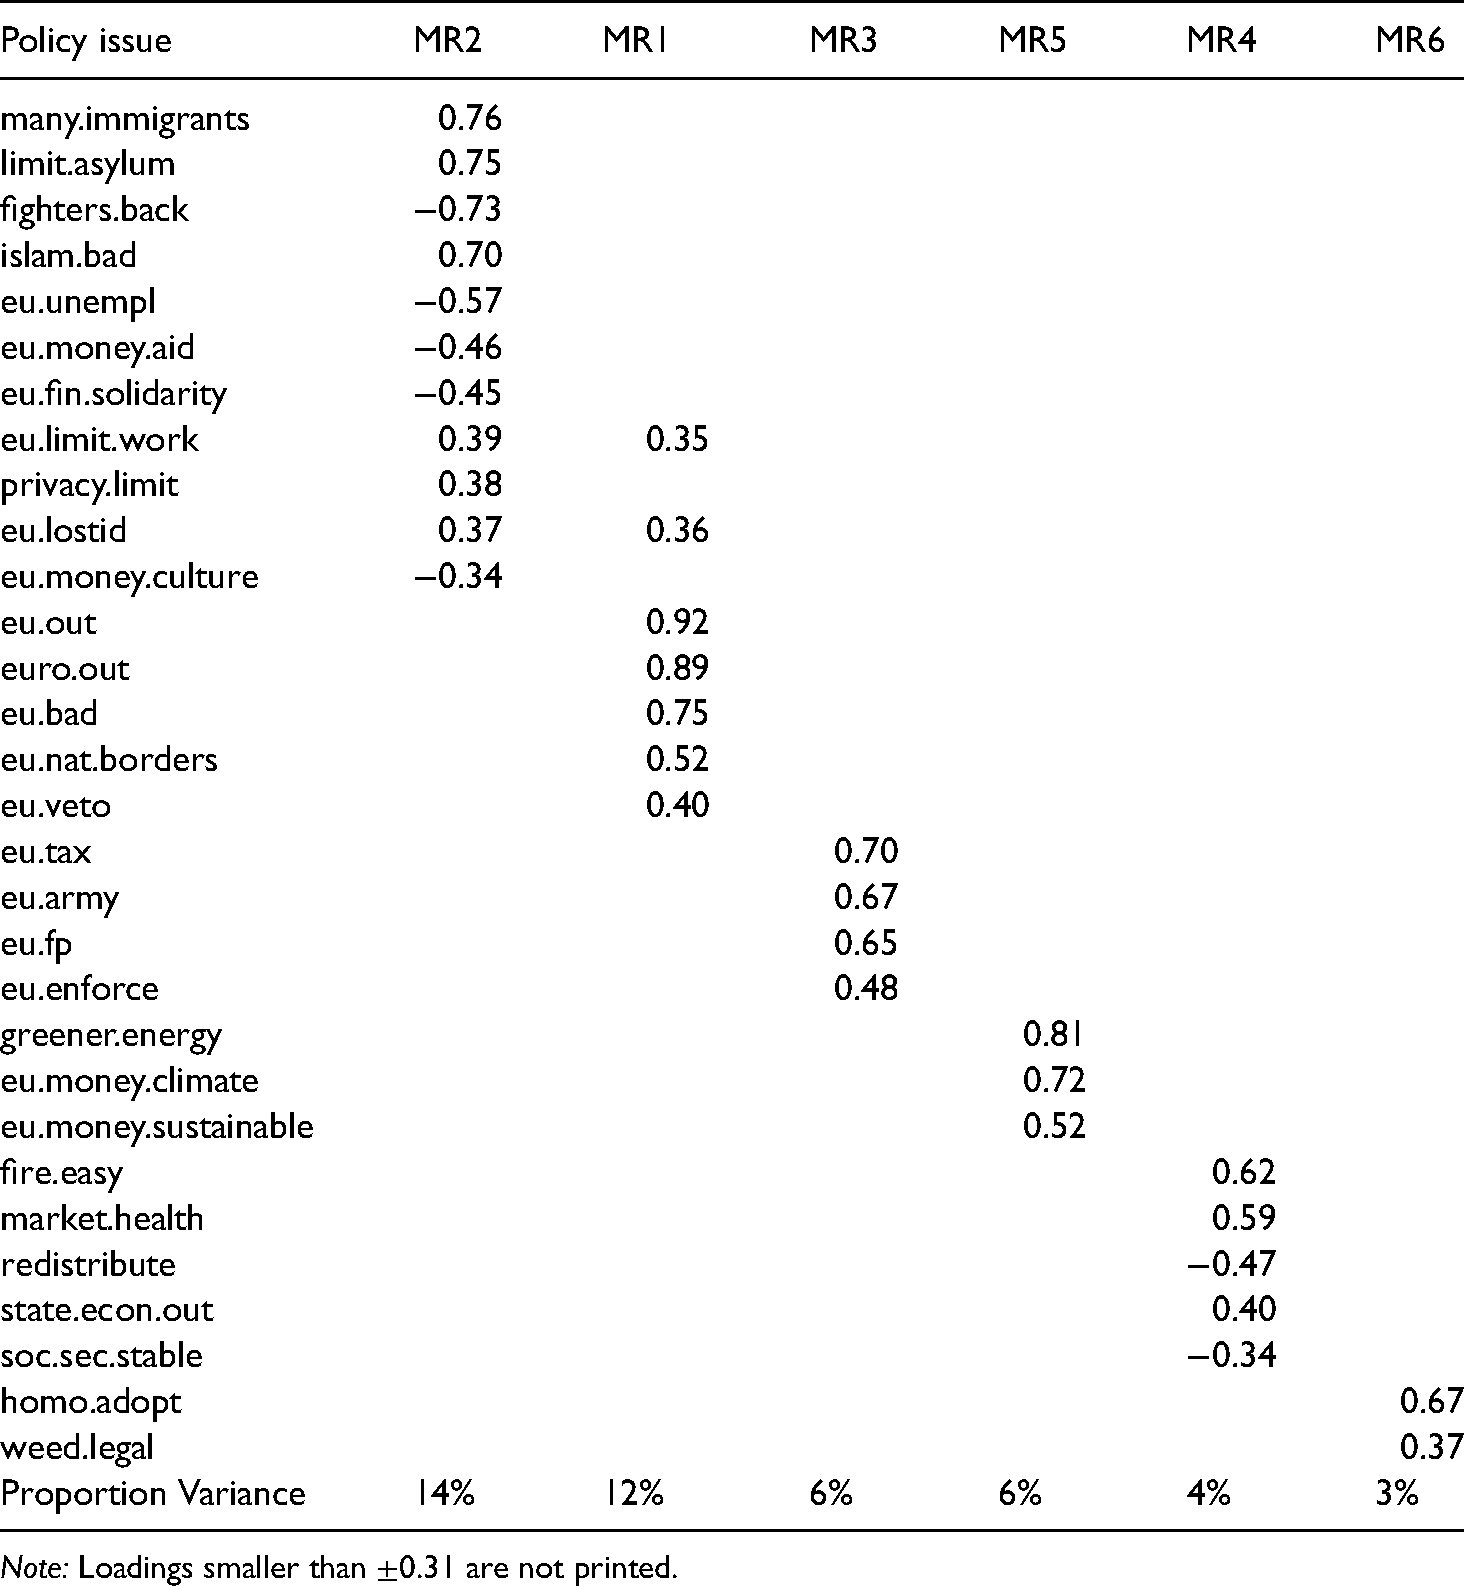
Note: Loadings smaller than ±0.31 are not printed.
The first factor that accounts for the largest share of variation (14%) is related to nativism – i.e. preferences against immigration, asylum seekers and Islam, support for security at the expense of privacy, and some anti-EU attitudes related to solidarity. The second factor is related to Euroscepticism in general. The third factor is clearly related to the expansion of EU powers and responsibilities.
It is noteworthy that the EU-related items are associated with two factors rather than one (and partly with the first general one as well). This implies that attitudes towards EU expansion are not part of the same bundle as the attitudes towards the reversal of European integration. In other words, people who hold positive opinions of the EU as it is now are not necessarily the same who support further expansion of EU responsibilities. The fourth factor is related to environmental items, including ones connected to the EU. The fifth one captures items related to redistribution and socio-economic policies, and the sixth one relates to issues of moral permissiveness. It is remarkable that the typical left-right issues are not connected with issues of EU money-spending and that the moral permissiveness issues, which should be at the core of the progressive dimension, are not related to general EU support items at all. Also, the left-right and progressive factors account for relatively small shares of the variation –4% and 3%, respectively.
We find similar results in three additional analyses, reported in the Online appendix: (a) for the subset of responses that have also recorded positions on the self-placement scales; (b) for the subsample of people who know for sure for which party they will vote; and (c) for the weighted sample based on demographic and party affiliation variables to resemble the general population. This implies that the results are not driven by people with low political interest, with uncertain political preferences or a demographically biased sample more generally.
To sum up the conclusions about EU attitudes that emerge from the inductive analysis of citizens’ positions in the Netherlands: first, support for EU expansion is a separate bundle of positions, relatively distinct from opposition to the current state of European integration; second, attitudes towards specific policies load with other substantive preferences (e.g. pro-environment or anti-immigration) rather than with the general factors related to the EU; third, the traditional left-right and (moral) progressive issues form separate factors from the ones related to the EU.
Germany
In terms of self-placement, the German sample is relatively left-wing, progressive and very pro-EU. The correlations between the scales are modest and very similar to the ones observed in the Netherlands (see Figure 3). The non-linearities in the relationships between the scales might be due to low number of observations at some combinations. But EU positions might be rising with progressivism first faster and then slower than a linear trend would predict.
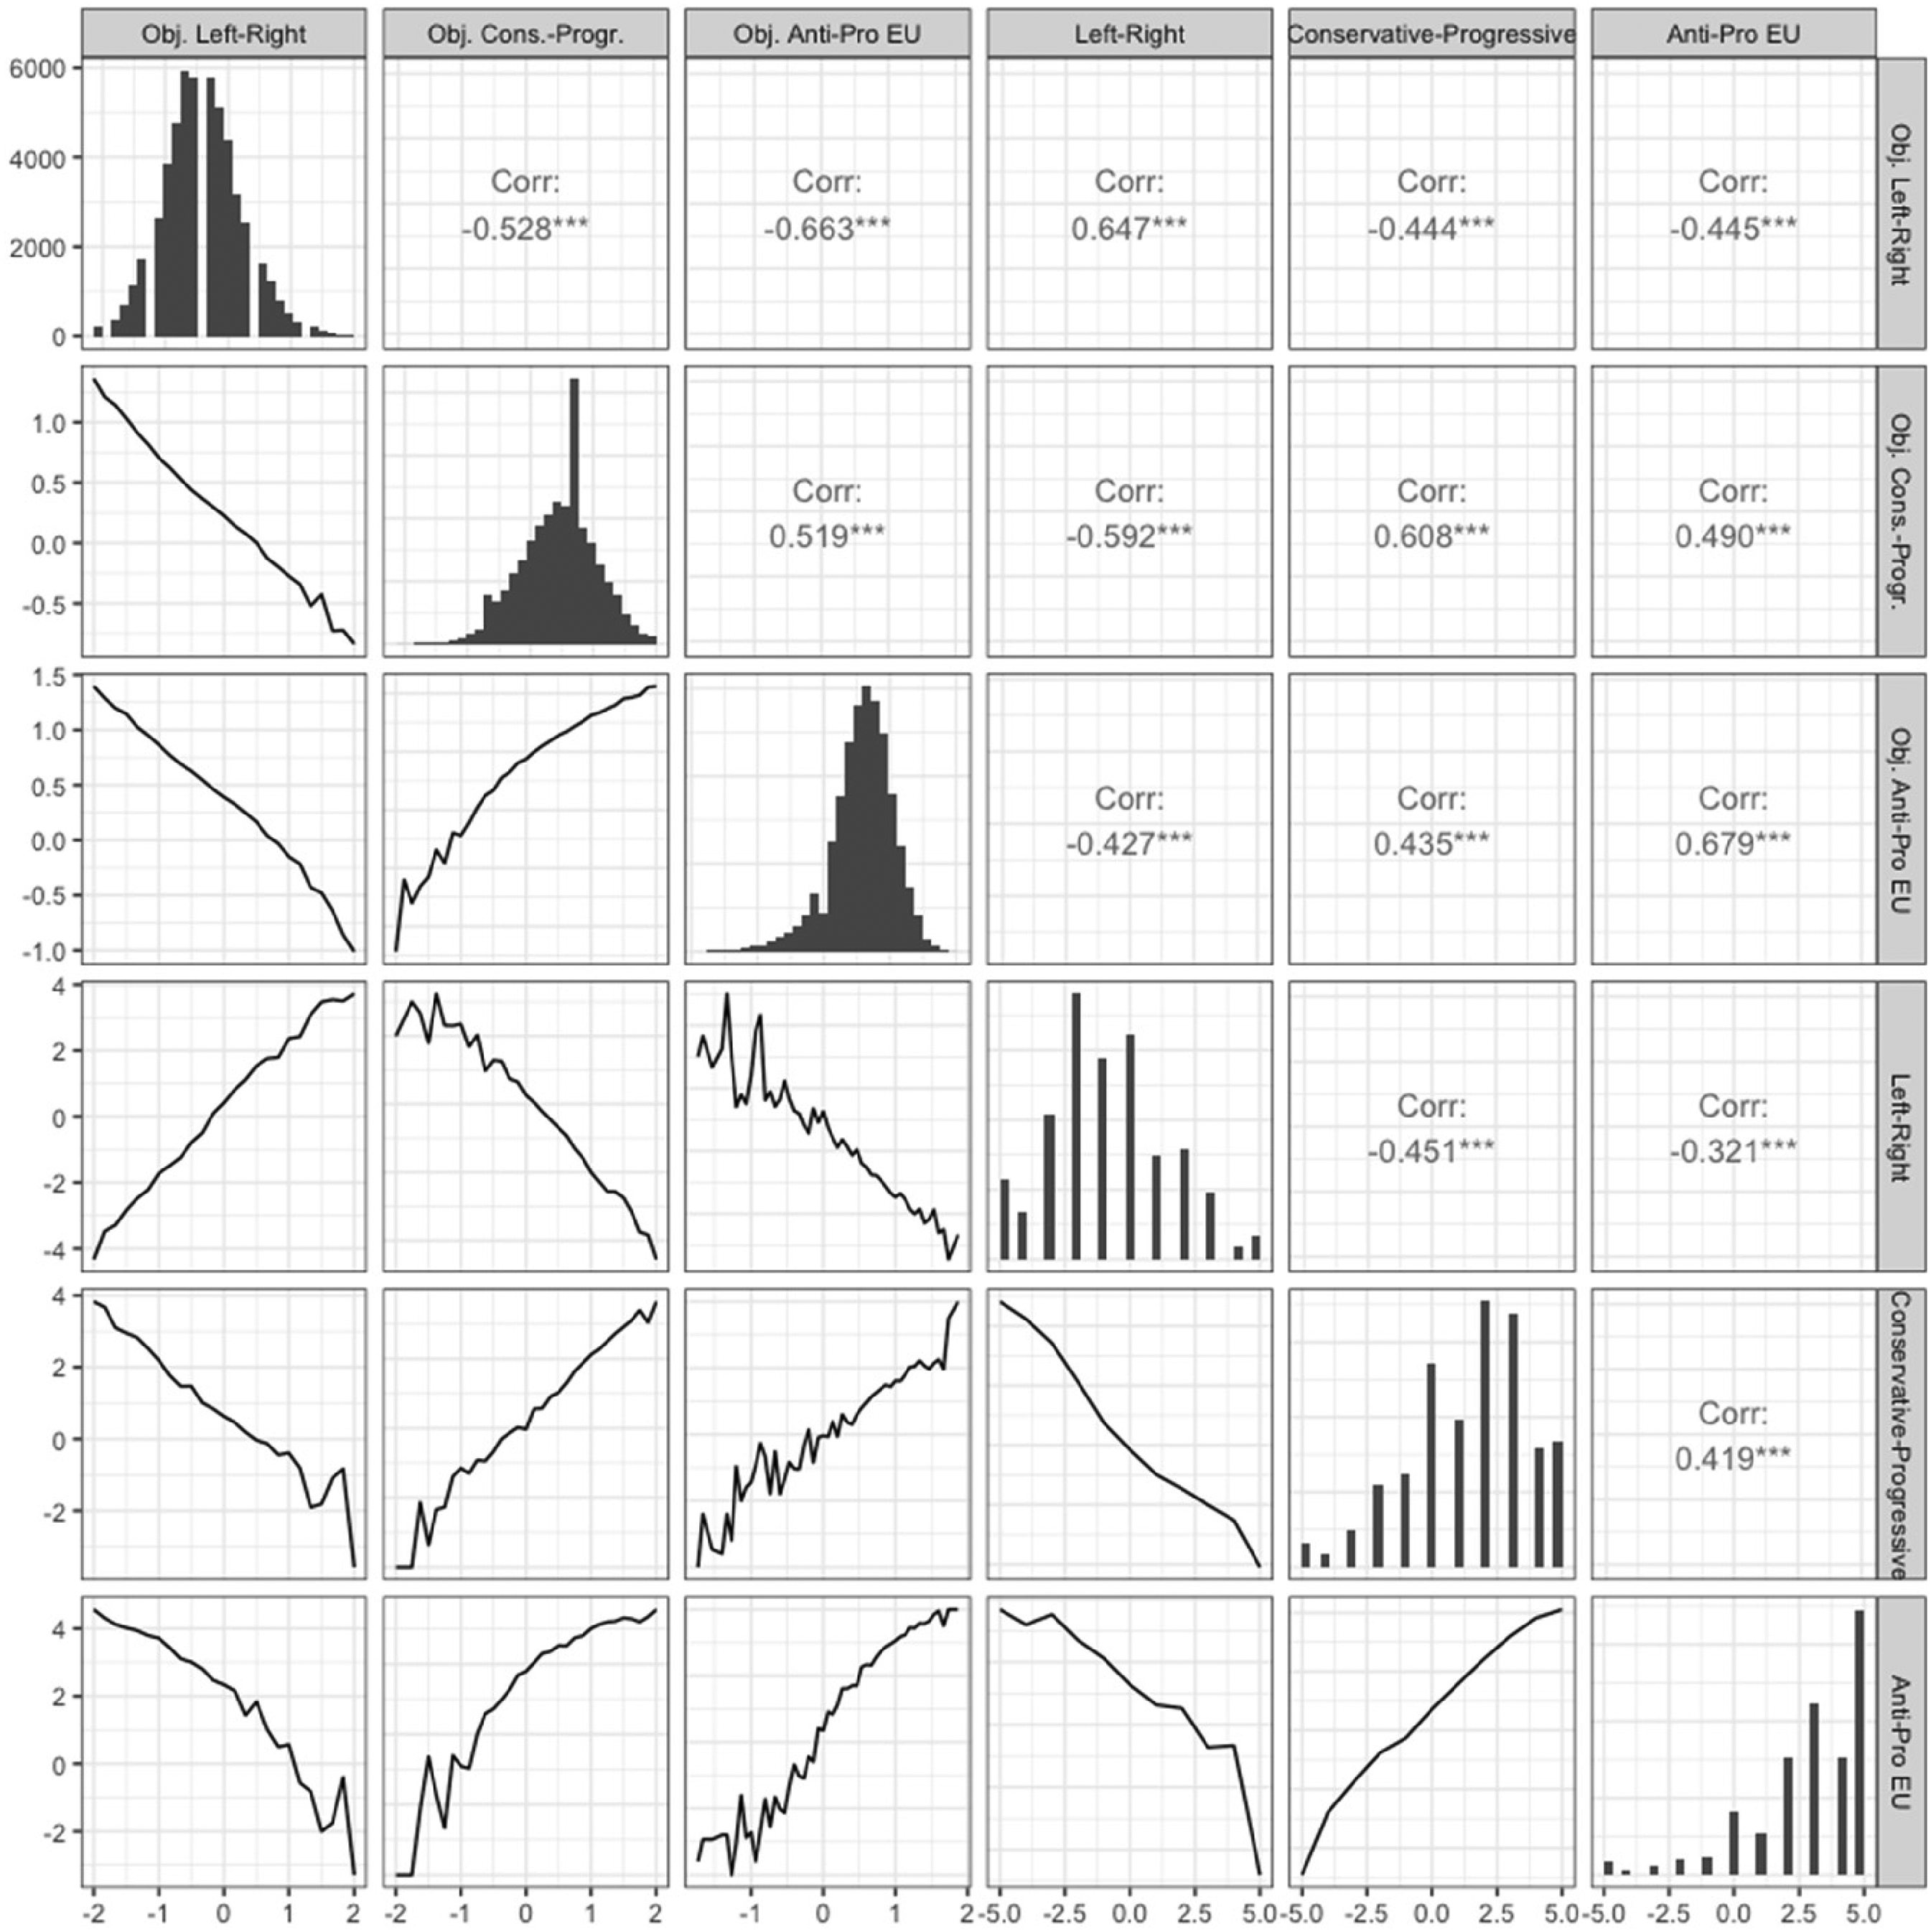
Distributions and cross-correlations of citizen positions on three self-placement scales and three ‘objective’ a priori defined scales; Germany, 2019.
In Figure 4(a), we plot EU positions considering both the left-right and conservative-progressive scales, finding a very similar landscape to the Dutch one. However, the peak of EU support is (almost) at the very left/progressive corner. EU support rises faster as one moves from conservative to progressive than it does as one moves from right to left. Looking at the ‘objective’ positions based on aggregated policy preferences, we find moderate correlations with the self-placement (Figure 3). However, there are only a couple of statements that capture socio-economic positions that do not have a connection with the EU (for details see the list in Online appendix). ‘Objective’ left-right is correlated with the self-placement on that scale at 0.65, at −0.44 with conservative-progressive and at −0.45 with anti-pro EU. ‘Objective’ conservative-progressive positions are correlated at 0.61 with self-placement on the conservative-progressive scale and almost as highly with self-placement on left-right (−0.59).
Average positions on the anti-pro EU scale (mapped to height) as a function of positions on the left-right and conservative-progressive scales: (a) self-placement on ideological scales; (b) ‘objective’ positions aggregated from policy preferences; Germany, 2019.
We have to conclude that there is no clear correspondence between the positions of citizens estimated from their actual policy preferences and the self-placement scales. Although the correlations are too strong to be dismissed as random noise, they are far from deterministic. Even more importantly, the correlations are just as strong with self-placement on the ‘wrong’ scales, with ‘objective’ conservative-progressive positions especially being equally related to left-right and conservative-progressive, and very strongly to anti-pro EU self-placement as well.
The political landscape looks rather different when average EU positions are plotted against a priori ‘objectively’ measured positions on the left-right and conservative-progressive scales (see Figure 4(b)). EU support is highest on the extreme left and declines after, more steeply for conservatives than for progressives. For socio-economic left-wingers, positions on the conservative-progressive dimension do not matter much for EU support, but for right-wingers they do. Interestingly, when progressive positions are measured with policy preferences rather than self-placement, the peak of EU support is not quite at the progressive end of the scale, but a couple of points before.
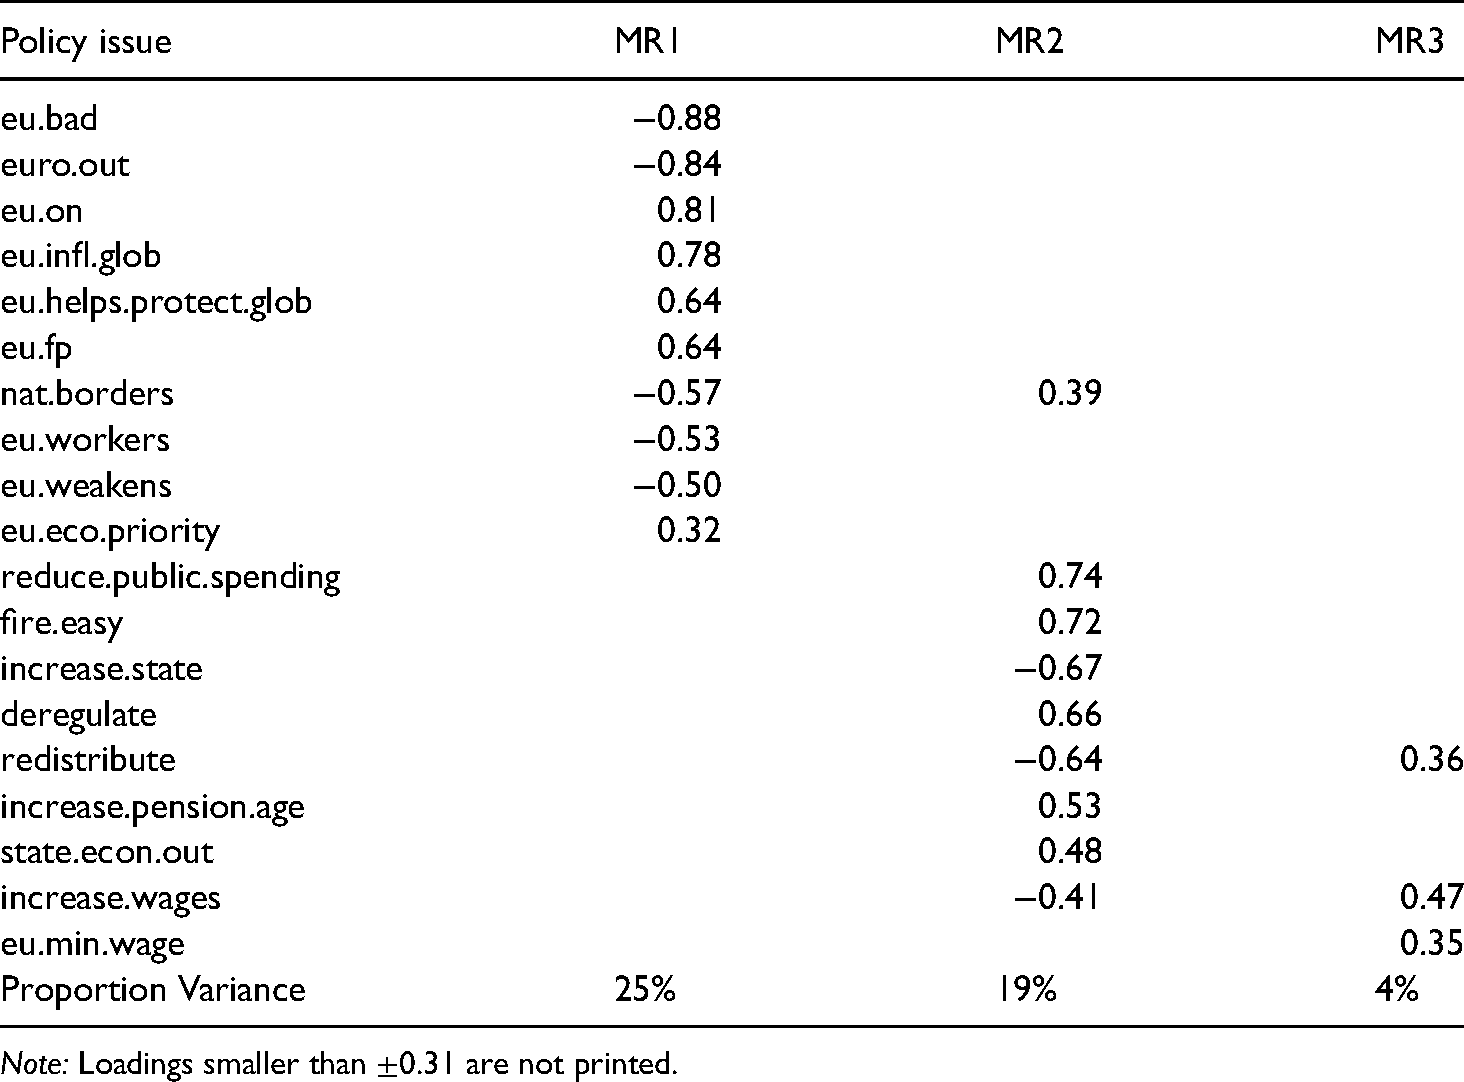
When we analyze the structure of policy positions inductively, we get a rather complex picture. Table 2 shows the results from the factor analysis (see the Online appendix for the PCA results). When five factors are extracted with oblique promax rotation (formal methods suggest six), the first one is clearly related to nativism (anti-EU, immigration and Islam). The second factor captures partly the same EU items but also ones that are clearly related to EU expansion. Environmental items are now separated in the third factor. Moral permissiveness items are bundled with socio-economic issues and solidarity in the fourth factor. The fifth factor collects items related to EU again. Even with five factors the total variance explained is only 39% and four items still do not load highly on any of the factors.
Factor analysis results from Germany, 2019.
Note: Loadings smaller than ±0.31 are not printed.
Italy
In Italy, the correlations between the left-right and conservative-progressive scales with anti-pro EU are at −0.33 and 0.42, respectively. The relationship with left-right in particular is non-linear (Figure 5). In Figure 6(a), when we examine how average EU support varies with left-right and conservative-progressive positions simultaneously, we get a rather different landscape than the one observed in the Netherlands and Germany.
Distributions and cross-correlations of citizen positions on three self-placement scales and three ‘objective’ a priori defined scales; Italy, 2019.
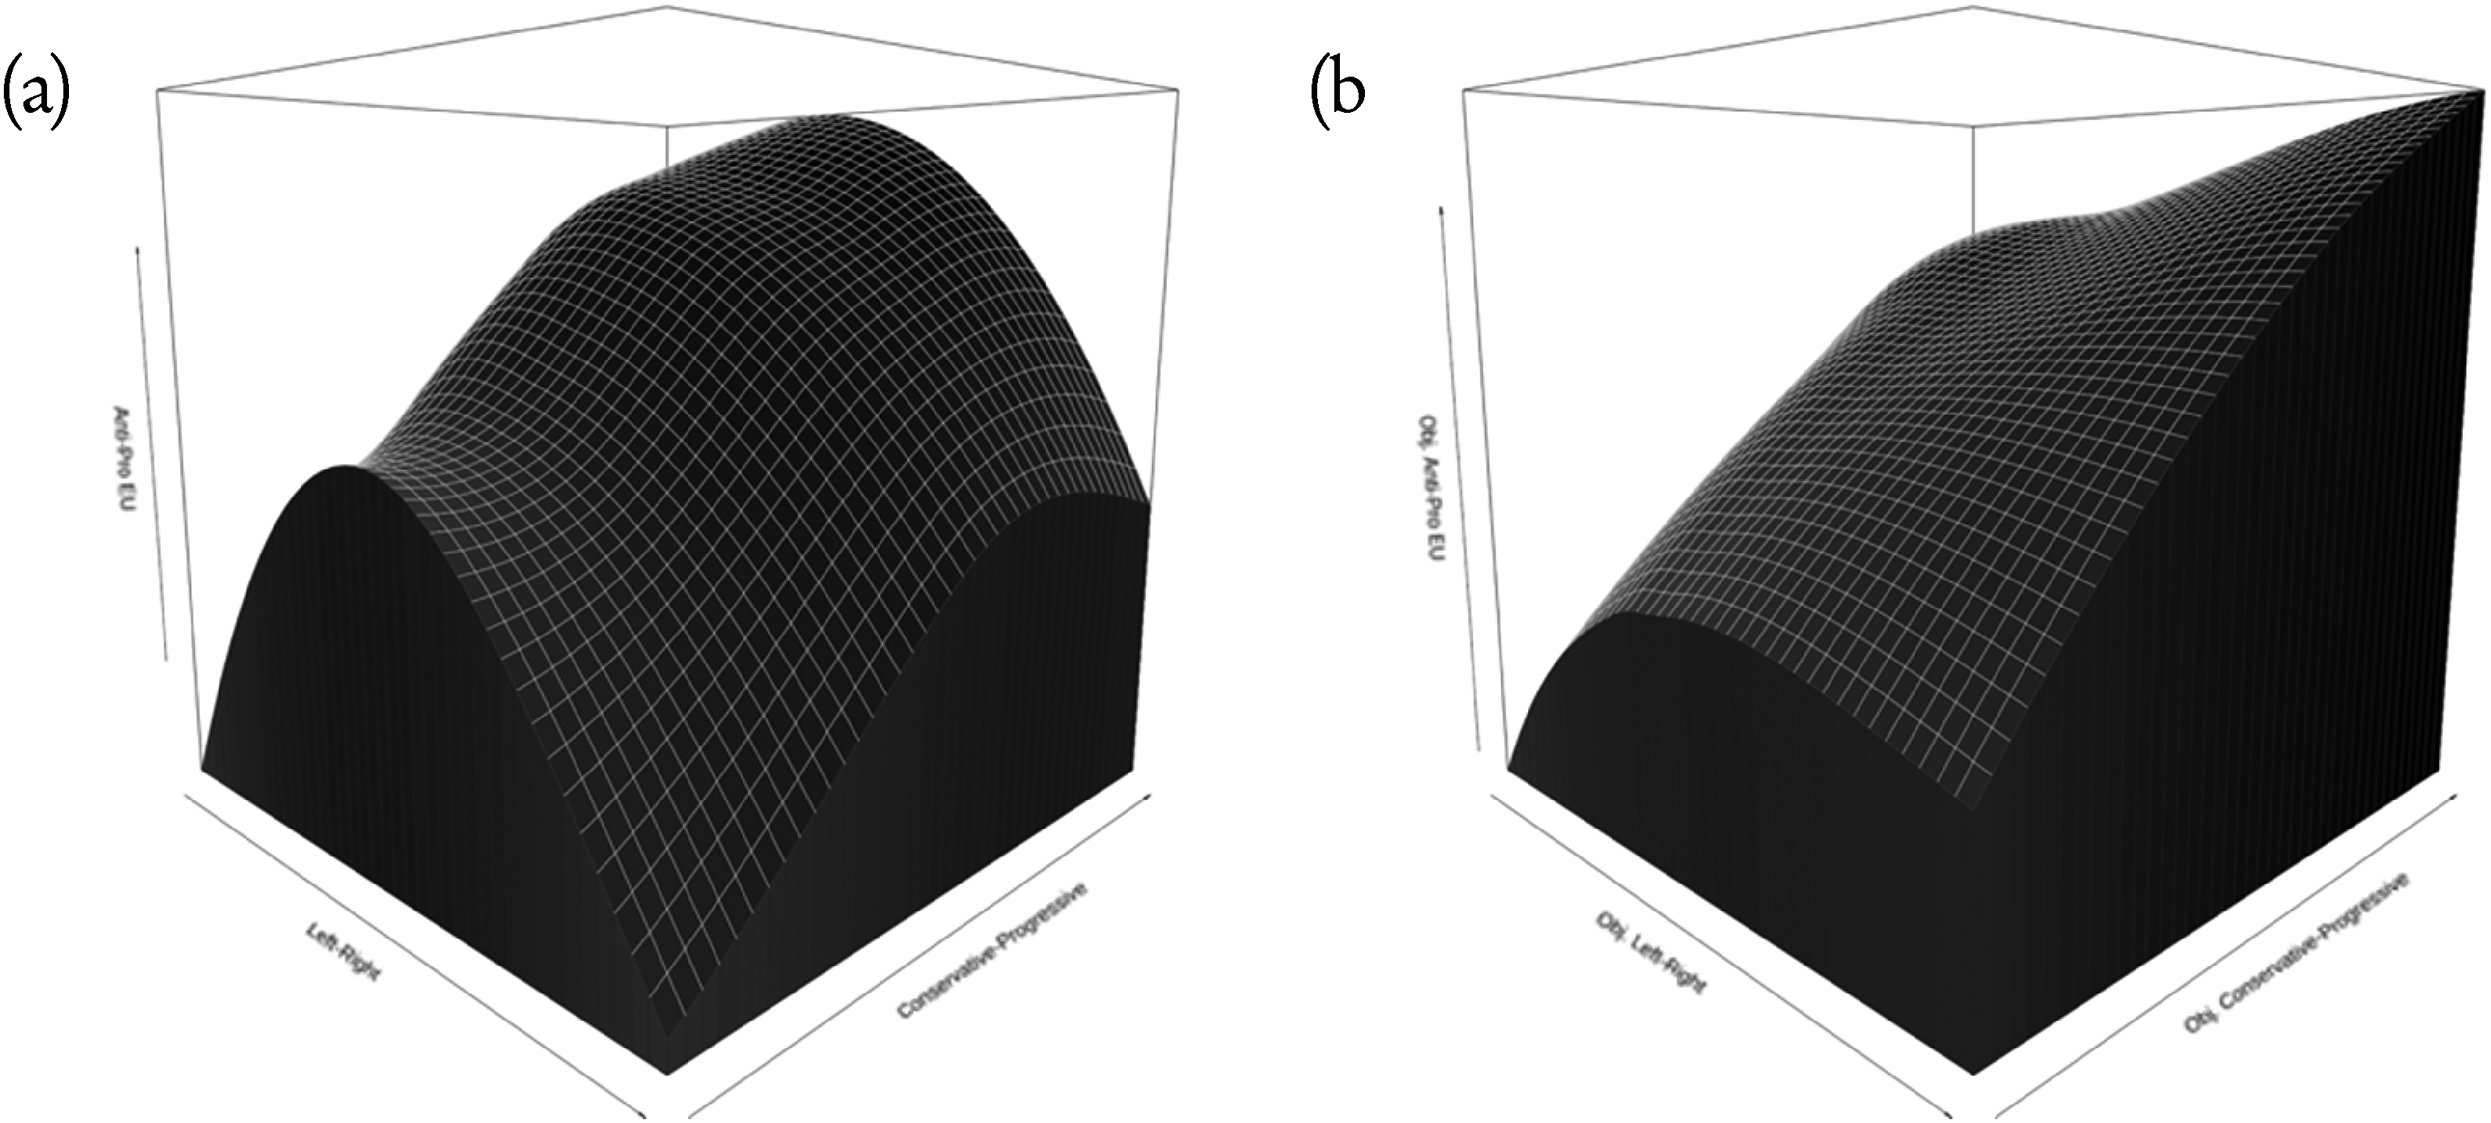
Average positions on the anti-pro EU scale (mapped to height) as a function of positions on the left-right and conservative-progressive scales: (a) self-placement on ideological scales; (b) ‘objective’ positions aggregated from policy preferences; Italy, 2019.
The peak of EU support is slightly off the center on the left-right dimension and at the progressive extreme. There is a clear curvilinear (inverted U-curve) for conservatives, as one moves from the left to the right, and a slightly less pronounced one for progressives. For right-wingers, the progressive extreme is associated with lower levels of EU support than a bit more moderate positions, but this could be an artefact of the low number of observations in that corner of the political space.
When we measure the positions of citizens based on their responses to the policy questions, the correlations with the self-placements that should be related to these responses are not very high: 0.46 for left-right, 0.60 for conservative-progressive, and 0.69 for the EU one (Figure 5). Again, actual positions on issues that experts consider should be related to the conservative-progressive dimensions correlate just as highly with the self-placements on the left-right scale (−0.65) as with self-placement on the conservative-progressive one. ‘Objective’ left-right positions do not correlate at all, but ‘objective’ conservative-progressive positions correlate at 0.4 with positions on the EU scales.
According to Figure 6(b), which uses measures based on concrete policy positions, there is much less evidence for non-linear dependence of EU support on the two other scales (perhaps only for extreme conservatives along with the left-right axis). The values of EU support are highest at the right-progressive corner of the space and lowest at the left-conservative corner (but all these outer regions of the political space are not densely populated).
When analyzed inductively, the structure in the policy positions data is complex, with the scree plot suggesting to extract seven factors. The rotated factor analytical solution is only marginally more interpretable than the PCA results (see the Online appendix). The first factor is related most strongly to the moral permissiveness items and progressive positions on immigration, naturalization and Islam (Table 3).
Factor analysis results from Italy, 2019.
Note: Loadings smaller than ±0.27 are not printed.
The second factor has a very clear EU profile. Unlike in other countries, there does not seem to be a differentiation between items that call for expansion of the EU and ones that call for rollback of European integration: they all load on the same factor. Interestingly, the question about the independence of the judiciary loads (somewhat weakly) on this factor as well. The third factor has a ‘nativism’ profile: against immigration and multinationals.
It is noteworthy that support for an EU army, reform of the EU asylum policy to help Italy, relaxing the EU rules for national aid to companies, and even for an elected president of the EU Commission are positively related to this factor. So, the nativism items do not go together with unambiguous Euroscepticism in Italy. The underlying idea is more about making the EU work in a way that supports Italy. The fourth and fifth factors are the ones capturing the socio-economic items (but not the proposal for a flat tax, which one would expect to load highly here as well). Unlike in other countries, these items are split into two factors: the first one is more about deregulation and getting the state out of the economy, while the second one is about redistribution, supporting the poor and protecting the environment.
France
The data for France are not entirely comparable to the Dutch, German and Italian datasets. The number of policy statements is only 19 rather than 30, and there are no statements that clearly relate to issues on the conservative/progressive dimension (such as moral permissiveness, immigration and refugees, privacy, etc.). In addition, self-placements are not provided on the conservative-progressive scale, but only on left-right and anti-pro EU. In the graphs below, we substitute the conservative-progressive scale with a question related to anti-pro-immigration positions (but the item relates to Europe as well, which complicates the interpretation).
Figure 7 shows the cross-correlations between the self-placements on the three scales. There is a very weak correlation between left-right and EU support and strong evidence of an inverted U-curve relationship. Pro-immigration is related more strongly and monotonically, if not entirely linearly, with EU support, and there is a moderately strong and rather linear relationship between left-right and anti-pro-immigration positions.
Distributions and cross-correlations of citizen positions on three self-placement scales (note that anti-pro-immigration attitudes are used instead of a conservative-progressive scale) and two ‘objective’ a priori defined scales; France, 2019.
The 3D landscape of French politics resembles much more the Italian one than those found in the Netherlands and Germany (Figure 8). There is a clear inverted U-shaped relationship between left-right and EU support for people with strong anti-immigration positions, as well as for people with very immigration-friendly positions. Interestingly, for people at the extreme right, the peak of EU support is reached before the end of the pro-immigration scale, while for people at the extreme left, EU support rises monotonically as one moves from anti- to pro-immigration positions.
Average position on the anti-pro EU scale (mapped to height) as a function of positions on the left-right and pro-anti-immigration scales; France, 2019.
As mentioned above, the French VAA does not feature statements related to the conservative-progressive scale, so we cannot estimate positions on this scale from the data. Figure 7 shows the cross-correlations of the remaining ‘objectively’ defined positions and the self-placements. Correlations between ‘objective’ left-right and the EU scales are close to zero; yet, this is not due to a lack of relationship but the fact that it is curvilinear. ‘Objective’ left-right is correlated at 0.66 with the self-placement on the same scale and at −0.43 and linearly with pro-immigration positions.
As we move towards the inductive analysis of political positions in France, we should remind that the data features a smaller number of issues and no conservative-progressive ones. Perhaps for that reason, the PCA and factor analyses uncover a smaller number of components and factors that are important. The factor-analytical solution with oblique rotation is similarly parsimonious (relatively to the ones observed in the other countries). Three factors are extracted that mirror the ones found by the PCA. It is regrettable that no statements related to the conservative-progressive scale are included in the VAA so that we can conclude whether the differences in the structure of political preferences we find in France are ‘real’ or an artefact of discrepancies in measurement (Table 4).
Factor analysis results from France, 2019.
Note: Loadings smaller than ±0.31 are not printed.
Discussion
As De Vries and Marks (2012) remind us, both the a priori and a posteriori methods of assessing the dimensionality and nature of political preferences rely on theoretical assumptions. We should not attempt to conclude which of the methods provides the ‘true’ map of political preferences, because they might serve different purposes (cf. Benoit and Laver, 2012). We can conclude from this study, however, that the maps we obtain based on self-placement on ideological scales, on ‘objective’ a priori policy positions assigned to scales and on a posteriori inductively derived dimensions are quite different and reveal very heterogenous landscapes. One possible explanation for this is that the meaning of left-right and conservative-progressive varies not only with the national context but for different people as well, for example, due to different political socialization experiences or political priorities. The meaning of these terms shifts with time as well, so it becomes an important empirical question to study how actual preferences over policy relate to these labels, for citizens and parties alike.
Political space appears much more fragmented based on the preferences and positions of voters rather than parties and political elites (cf. Lupton et al., 2015). The VAA data suggest that more dimensions need to be extracted before a relatively good representation of the underlying policy preferences of the voters is achieved, especially in the Netherlands, but to a smaller degree in Germany and Italy as well. This is even though VAA users are, on average, younger, more educated and more politically interested – hence, having more ‘enlightened’ policy preferences – than the general population. The fragmentation of political preferences observed in the data is also not driven by users with fringe or unusual combinations of preferences, because the patterns persist even for the restricted sample of voters who know with certainty for which party they will vote (see the Online appendix).
We should remind that citizens with higher political knowledge and interest, which are likely over-represented in our samples – likely have more consistent sets of preferences. This implies that the structure of citizens’ political positions in the entire population (or the subset of all voters) will be likely even more complex, possibly with more dimensions. Fishman and Davis (2022) find that the density of the belief network related to political and policy preferences increases asymmetrically among people with high relative to low knowledge in the context of electoral campaigns. So relevant information leads to a more structured set of preferences only for those who already know more about politics. However, recent research suggests that voters might hold on to ideologically inconsistent preferences knowingly, which suggests that their lack of ideological constraint results from pragmatism (Groenendyk et al., 2022).
Why is the political space derived from citizen positives more complex than the political space derived from party positions? One potential answer points to the strategic constraints that parties face – and voters do not – to coalesce their positions on a small number of dimensions. Proportional representation systems, as in the Netherlands, also encourage the appearance of new parties that focus on a small number of current issues, which acts against the consolidation of the political space into one or two dimensions.
We find intriguing differences between the political landscapes of countries, but we should not take the evidence for these as conclusive, because by construction VAAs are designed to reflect national context to a greater extent than standardized comparative surveys of public opinion. Still, as expected by existing theoretical arguments, the landscapes in the Netherlands and Germany are much more alike than those in France in Italy (cf. Otjes and Katsanidou, 2017). We find more differences between Germany, on the one hand, and Italy and France, on the other hand, than other analyses of VAA data (Wheatley and Mendez, 2021) or data based on the salience of the campaign issues of political parties (Kriesi et al., 2006). The country differences that we document within Europe relate to findings on a global scale showing that a dominant left-right organization of political attitudes is not very common, or universal, and that economic left-right and socially conservative-liberal attitudes tend to correlate negatively more often than not (Malka et al., 2019).
Why do different issues cluster together in various countries? We can hypothesize several reasons based on dissimilarities in social cleavages, in party systems and in political socialization. The data at hand does not allow for testing these hypotheses, but the geographic clustering that we observe suggests that more fundamental forces than the tactics of political competition shape the preference landscapes. Yet, given the similarity in social cleavages in Western Europe, they are unlikely to be the main explanation of the differences. At the same time, the variation we observe underscores the contingent, context-dependent nature of how political ideology is structured, which goes against universalist arguments about political ideology being deeply rooted in human psychology (Jost, 2009) and strongly shaped by evolutionary forces.
Our analyses show that the issue of European integration has been emancipated from left-right and conservative-progressive preferences. The positions of citiznes on issues, such as the expansion of the EU or the creation of an EU army are not highly predictable from their positions on issues around which many other policy preferences coalesce, such as Islam, immigration, or the role of the state in society. It also becomes increasingly difficult to talk about preferences over the EU as a single dimension (anti-pro Europe), as these preferences have complex structures themselves: for instance, in the Netherlands opinions over the EU are not highly correlated with preferences about further expansion of the EU.
Conclusion
This article analyzed the structure of political attitudes of European citizens with a focus on positions towards issues of European integration and the EU. Based on VAA data, we found that support for European integration increases as one moves to the left and to the progressive ends of the scales, but the peak is not necessarily at the left-most corner. In fact, the resulting pattern is quite complex and is best summarized visually. In the Netherlands and Germany, EU support decreases monotonically as one moves from left to right, while in France and Italy it peaks in the middle of the scale, most pronouncedly for people with conservative positions. Overall, the findings suggest that European integration preferences can be considered a separate dimension than both left-right and conservative-progressive, which comes closer to the three- rather than the two-dimensional models in the literature (i.a. Kitschelt, 2013).
Second, when we examine citizen positions on concrete issues that are then aggregated and connected to the general scales, we note only moderate correlations between these positions and the respective self-placements on the scales. Measured in this way, in Germany and the Netherlands support for European integration exhibits a faint inverted U-shape but only for conservative citizens, while for progressive citizens support rises monotonically as one moves to the left. Yet, the gradient remains steeper along the progressive dimension compared to the left-right one. In France and Italy, there is stronger evidence for an inverted U-curve link between left-right and EU support at different values of the conservative-progressive scale, but again the pattern is most visible for conservatives.
Third, when we examine the structure of citizen positions inductively, we find a more complex space than the one embedded in the three scales discussed above. The main dimension is one that bundles issues related mostly to immigration, Islam, security and opposition to cross-national solidarity. The traditional left-right dimension, centered around redistribution, and the conservative-progressive one, centered around issues of moral permissiveness, are discernable in the data, but account for small parts of the overall variation and, even more importantly, do not bind with other issues, including those related to European integration (France appears as an exception to this pattern, yet, this may be due to the fact that the data are not quite comparable). Some EU positions on actions and spending in particular policy areas bundle with substantive dimensions (e.g. anti-immigration or pro-environment) whereas others form dimensions on their own. Importantly, the dimension that captures radical opposition to the EU is separate from the one that captures support for the expansion of the EU powers (in the Netherlands and Germany). This implies that strong Euroscepticism and support for EU expansion are not everywhere two poles on the same dimension but relatively separate bundles of issue positions.
Several limitations of the analysis need to be noted. To start with, the use of non-probability samples is a challenge for generalizability, although the concerns about representativeness might be alleviated from a large number of responses. It can be argued that because VAA users (and especially those who answer the optional modules) are more educated, younger and interested in politics, the political space for all citizens would be even more fragmented. Yet, extensive additional analyses we performed on the Dutch case show that the same conclusions appear when we focus on more politically engaged respondents, on voters with clear and stable political preferences, and when we weigh the VAA sample to resemble the general population of citizens.
More critical is the limitation related to the selection of statements included in the analysis. A different selection might emphasize other dimensions or even result in other structures being uncovered. Although it is possible that a different selection of issues would change the relative ranking of the dimensions, it is less likely that it will result in a simpler space with fewer dimensions.
We should note that there is an imperfect overlap of statements across the four countries we study, but this is less of a limitation than in other types of comparative research on public opinion. This is because each statement can be considered a sample from a potential population of policy-relevant statements related to a smaller number of underlying dimensions. Hence, if the structure is strong so that the latent dimensions strongly influence the concrete policy preferences, variations in the wording or even the substantive focus of the statements should not matter that much. Furthermore, as the political situation in each country is context-specific, a standardized questionnaire is not recommended.
More generally, this study leads us to conclude that analyzing citizen positions on concrete policy issues is more informative about their political and policy preferences than the information contained in self-placement, general “ideological” scales. According to the self-positons, almost everyone is a centrist, although the reality is much more complex, as we discover once we examine what positions citizens actually have on concrete issues.
Supplemental Material
sj-docx-1-eup-10.1177_14651165221080316 - Supplemental material for Beyond the U-curve: Citizen preferences on European integration in multidimensional political space
Supplemental material, sj-docx-1-eup-10.1177_14651165221080316 for Beyond the U-curve: Citizen preferences on European integration in multidimensional political space by Dimiter Toshkov and André Krouwel in European Union Politics
Supplemental Material
sj-R-2-eup-10.1177_14651165221080316 - Supplemental material for Beyond the U-curve: Citizen preferences on European integration in multidimensional political space
Supplemental material, sj-R-2-eup-10.1177_14651165221080316 for Beyond the U-curve: Citizen preferences on European integration in multidimensional political space by Dimiter Toshkov and André Krouwel in European Union Politics
Supplemental Material
sj-R-3-eup-10.1177_14651165221080316 - Supplemental material for Beyond the U-curve: Citizen preferences on European integration in multidimensional political space
Supplemental material, sj-R-3-eup-10.1177_14651165221080316 for Beyond the U-curve: Citizen preferences on European integration in multidimensional political space by Dimiter Toshkov and André Krouwel in European Union Politics
Supplemental Material
sj-R-4-eup-10.1177_14651165221080316 - Supplemental material for Beyond the U-curve: Citizen preferences on European integration in multidimensional political space
Supplemental material, sj-R-4-eup-10.1177_14651165221080316 for Beyond the U-curve: Citizen preferences on European integration in multidimensional political space by Dimiter Toshkov and André Krouwel in European Union Politics
Supplemental Material
sj-R-5-eup-10.1177_14651165221080316 - Supplemental material for Beyond the U-curve: Citizen preferences on European integration in multidimensional political space
Supplemental material, sj-R-5-eup-10.1177_14651165221080316 for Beyond the U-curve: Citizen preferences on European integration in multidimensional political space by Dimiter Toshkov and André Krouwel in European Union Politics
Supplemental Material
sj-R-6-eup-10.1177_14651165221080316 - Supplemental material for Beyond the U-curve: Citizen preferences on European integration in multidimensional political space
Supplemental material, sj-R-6-eup-10.1177_14651165221080316 for Beyond the U-curve: Citizen preferences on European integration in multidimensional political space by Dimiter Toshkov and André Krouwel in European Union Politics
Supplemental Material
sj-RData-7-eup-10.1177_14651165221080316 - Supplemental material for Beyond the U-curve: Citizen preferences on European integration in multidimensional political space
Supplemental material, sj-RData-7-eup-10.1177_14651165221080316 for Beyond the U-curve: Citizen preferences on European integration in multidimensional political space by Dimiter Toshkov and André Krouwel in European Union Politics
Supplemental Material
sj-RData-8-eup-10.1177_14651165221080316 - Supplemental material for Beyond the U-curve: Citizen preferences on European integration in multidimensional political space
Supplemental material, sj-RData-8-eup-10.1177_14651165221080316 for Beyond the U-curve: Citizen preferences on European integration in multidimensional political space by Dimiter Toshkov and André Krouwel in European Union Politics
Supplemental Material
sj-RData-9-eup-10.1177_14651165221080316 - Supplemental material for Beyond the U-curve: Citizen preferences on European integration in multidimensional political space
Supplemental material, sj-RData-9-eup-10.1177_14651165221080316 for Beyond the U-curve: Citizen preferences on European integration in multidimensional political space by Dimiter Toshkov and André Krouwel in European Union Politics
Supplemental Material
sj-RData-10-eup-10.1177_14651165221080316 - Supplemental material for Beyond the U-curve: Citizen preferences on European integration in multidimensional political space
Supplemental material, sj-RData-10-eup-10.1177_14651165221080316 for Beyond the U-curve: Citizen preferences on European integration in multidimensional political space by Dimiter Toshkov and André Krouwel in European Union Politics
Supplemental Material
sj-RData-11-eup-10.1177_14651165221080316 - Supplemental material for Beyond the U-curve: Citizen preferences on European integration in multidimensional political space
Supplemental material, sj-RData-11-eup-10.1177_14651165221080316 for Beyond the U-curve: Citizen preferences on European integration in multidimensional political space by Dimiter Toshkov and André Krouwel in European Union Politics
Footnotes
Acknowledgements
The authors would like to thank Liesbet Hooghe, Lisanne de Blok and the audiences at the EUI EGPP Annual Conference (February 2021) and the Amsterdam INDIVEU Workshop (October 2021) for useful comments. Yordan Kutuyski, Oscar Moreda Laguna, Jeroen van Lindert, Tom Etienne and Kyra Bos in the Netherlands, Norbert Kersting and Jan Philipp Thomeczek in Germany, Eugenio Pizzimenti, Enrico Calossi, Beniamino Masi and Luciano Bardi in Italy, and Thomas Vitiello, Bruno Cautrès and Cevipof in France helped with collecting the VAA data.
Declaration of Conflicting Interests
The author(s) declared no potential conflicts of interest with respect to the research, authorship, and/or publication of this article.
Funding
The author(s) received no financial support for the research, authorship and/or publication of this article.
Supplemental material
Supplemental material for this article is available online.
Notes
References
Supplementary Material
Please find the following supplemental material available below.
For Open Access articles published under a Creative Commons License, all supplemental material carries the same license as the article it is associated with.
For non-Open Access articles published, all supplemental material carries a non-exclusive license, and permission requests for re-use of supplemental material or any part of supplemental material shall be sent directly to the copyright owner as specified in the copyright notice associated with the article.