
Abstract
The use of automation in news content creation is expanding from the written to the audio-visual medium with news organizations including Reuters turning to video automation services provided by companies such as Wibbitz. Although researchers have explored audience perceptions of text-based news automation, to date no published study has examined how news consumers perceive automated news videos. We conducted a between-subjects online survey experiment to compare how a socio-demographically representative sample (n = 4200) of online news consumers in the UK perceived human-made, partly automated, and highly automated short-form online news videos on 14 different story topics. Our findings show that human-made videos received on average more favourable responses on some evaluation variables, although the differences were not large. We also found some significant differences in the relative evaluation of automated and human-made news videos across different individual stories. For practitioners our results suggest partly automated news videos with post-automation human editing can be well received. For researchers our results show the need to use reasonably large sets of experimental stimuli, and suggest that ensuring socio-demographic variation within samples of respondents is worthwhile.
Keywords
Introduction
The use of automation in journalism is encroaching more and more on what many would consider to be journalists’ core professional practices, such as the identification of story leads, verification, and decisions about which stories are shown, and with what prominence (Thurman, 2019). Over the past few years, automation has increasingly been used for the creation of written news texts too, and more recently the production of news videos has also become more automated (Fanta 2017). News organizations including the BBC, Reuters, and The Economist have turned to video automation services provided by companies such as Wibbitz, Wochit, and Synthesia. Broadly, such services can be driven by textual natural language or structured data as inputs, or can automatically summarize longer video segments, for example whole sports matches (Merler, 2019).
This rise of automation in journalism has been linked to changes in audience demand for content (Dörr, 2016), and the consumption of online news videos has been growing rapidly. While about 24% of news consumers across 40 countries watched online news videos on a weekly basis in 2016, this proportion had increased to 67% in 2020 (Newman et al., 2016, 2020). Video automation has helped to meet this growing demand, and significant time and resources are being invested in the development of applications that introduce elements of automation into the production of audio-visual content, including news. For example, Wibbitz—whose clients include Reuters, Condé Nast, USA Today, TMZ, and NBC—has raised over US$40 million, including from the Associated Press (Crunchbase, n.d.), to develop products that, it says, allow the production of video “at unprecedented scale with the power of automation” (Wibbitz, n.d.).
An important aspect of understanding the impact of these new algorithmic tools within journalism is how audiences perceive news produced using automation. Although some progress has been made in exploring audience perceptions of text-based news automation (see Graefe and Bohlken, 2020; Wang and Huang, 2024 for overviews), as of February 2024 no known study has examined how news consumers perceive automated audio-visual news. We discuss in the literature review how the visual language of videos, in contrast to written texts, does not follow precise linguistic or widely agreed upon syntactic rules. It would therefore be unwise to assume that the findings of studies on the perception of automated news texts also apply to automated news videos.
Furthermore, many of the existing studies on the perception of automated journalism have been limited by small and unrepresentative samples of respondents, questionable measures of the dependent variables, and a quantity and quality of experimental stimuli that have made the isolation of authorship (automated or human) as an independent variable problematic. These limitations make it difficult to know how news consumers really evaluate automated news in comparison with human-made equivalents, and to what extent those judgements might be generalizable.
This study attempts to help fill this twin research gap in two ways. Firstly, we design and conduct a between-subjects experiment to compare how online news consumers in the UK perceive human-made, partly automated, and highly automated short-form online news videos. Secondly, we employ a more rigorous methodology than has been seen in the literature to date. Our choice of country for this study aligned with the authors’ expertise, but we believe that news video consumption habits elsewhere are sufficiently similar (see, e.g., Newman et al., 2020) that our findings will be of wider interest.
Literature review
“Automated journalism” is largely concerned with the production of news content and may be seen as a sub-category of computational journalism (Thurman, 2019).
Carlson’s (2015) definition of automated journalism as “algorithmic processes that convert data into narrative news texts with limited to no human intervention beyond the initial programming” has been widely adopted but is no longer strictly accurate. Firstly, automation, as discussed, is now being used to create audio-visual news as well as textual news. Secondly, journalists have begun to post-edit automated outputs prior to publication. Although this post-editing is not currently, or ever likely to be, universal, it is happening with increasing frequency (Thäsler-Kordonouri and Barling, 2023). Thirdly, automated journalism is now working with inputs—like moving images—other than the numeric “data” that Carlson’s (2015) definition implies. For example, there now exist forms of automated video journalism that, taking raw video footage as input, use artificial intelligence to create highlight videos suitable for broadcast (Merler, 2019). Other video automation technologies, such as those offered by Synthesia and Wibbitz, can turn text into news videos.
For these reasons, and building on Carlson (2015), we define automated journalism as: “Algorithmic processes that convert numerical data, images, or text into written or audio-visual news items with various levels of human intervention beyond the initial programming”.
Research into the perception of automated journalism has, at the time of writing in February 2024 and as far as we are aware, focused solely on written news texts. Broadly, these studies have one or both of two main aims. Firstly, to compare the perceptions of news texts actually or purportedly generated by humans or machines, and, secondly, to explore factors, mainly psychological, that may explain any variance in these perceptions. These factors have included audiences’ expectations of journalists and automated systems (Waddell, 2018); the credibility of the news brand carrying the texts (Liu and Wei, 2019); the level of transparency given about how the news item was automated (Graefe et al., 2017); and the cultural (Zheng et al., 2018), professional (Jung et al., 2017; Van der Kaa and Krahmer, 2014), or other demographic (Melin et al., 2018) characteristics of the respondents.
A meta-analysis (Graefe and Bohlken, 2020) of 12 of the studies published up to October 2019 found that there were no differences in readers’ perceptions of “credibility” between the human- and machine-written news articles. However, human-written news was perceived as being of slightly higher “quality” and much more “readable”. Together, the studies also found that people rated articles more highly across these three criteria if they were told the article was written by a human, even if it was not.
This analysis might suggest that the present study may find some differences in the perception of news videos made manually and with machine assistance, but that those differences may not be great. However, this may be a simplistic expectation given that the automated production of textual and video news differs a great deal.
Machine-written news texts rely primarily on natural language generation (NLG) systems that are able to manipulate both the semantics (content) and syntax (arrangement) of a written text, according to the linguistic norms and standards of a specific language.
In contrast to written texts, the visual language of videos does not follow similarly precise linguistic or widely agreed upon syntactic rules. While videographers and filmmakers follow certain conventions in visual storytelling (such as the use of wide shots that provide a sense of location), these conventions can be relatively freely employed. The lack of strict visual rules means that the algorithmic production of videos takes a different approach to that used for text. For one variant of algorithmic video production—text-to-video automation—the narrative structure of words (spoken or used as captions) is the starting point, with the algorithm matching the words with the metadata that classify images within a data bank.
The fundamental differences between news texts and videos also mean that the criteria by which they are judged will differ. Some of the criteria used to compare human- and machine-written news texts, like “pleasant to read” and “well-written” (for an overview see Stalph et al. 2023), simply do not apply, while others that have not been used, such as how well images match the captions or the use of audio, may. Another reason why the results of this study may differ from the findings of prior studies on the perception of automated text journalism is that the quality of the experimental stimuli used in some of those studies has made the isolation of authorship (automated or human) as an independent variable difficult. For example, Clerwall’s (2014) study compared the evaluations of an automated factual report on an American football game against the evaluations of a human-written opinion column about the prospects of three quarterbacks. The differences he found between the evaluations of the automated and human-written stories could, therefore, have been partially, or even fully, a consequence of their genre (match report vs opinion) and not wholly or even partially a consequence of their authorship (automated vs human).
Because our object of study differs from previous perception studies of automated journalism, we considered that developing a set of hypotheses from previous literature, using measures that might not be relevant, and setting any expectations about effect sizes, would be premature, and that we needed to adopt a more open, inductive, exploratory approach for this study. However, since our interest was fundamentally a comparative one, this still indicated an experimental design, in the sense of randomly allocating participants to watch and evaluate differently authored videos, but not in a traditional hypothetico-deductive framing. Instead of posing hypotheses loosely derived from a slightly different field of enquiry, we decided not to develop and test hypotheses but rather to ask this general research question:
Many of the existing studies on the perception of automated journalism use small samples of stimuli. For example, the studies by Clerwall (2014) and Jung et al. (2017) each used one pair of stories (on sport), while Wölker and Powell (2021), Graefe et al. (2018), and Li et al. (2022) each used two pairs of stories. At the time of writing in February 2024, we are aware of just four studies that have reported experimental results on variations (if any) by story topic in the relative perceptions of automated and manually produced news articles. The results are somewhat inconsistent. Jia and Gwizdka (2020: 106), Jia (2020: 2624), and Wölker and Powell (2021) found some significant differences, but Haim and Graefe (2017) did not. As a result, it is far from clear how much a story’s topic will influence the relative evaluations of human and automated news. Therefore, our second research questions asks:
Prior studies on the perception of automated journalism have often used samples of college students that skew young and female. For example, the respondents in Clerwall’s (2014) and Jia’s (2020) studies had a mean age in the 20–29 range and were predominantly female. There are some indications, however, that socio-demographic characteristics can make a difference. For example, Melin et al. (2018) found that young women in their small sample (n = 152) liked automated news articles significantly less than older men did. There is, however, a lack of robust evidence about the variability in how individuals of different socio-demographic groups evaluate automated news. Comparing how, if at all, our results from RQ1 differ across socio-demographic groups would not only increase the external validity of our findings but could also contribute, more generally, to the evidence about the extent to which, if at all, differences in evaluations of automated and human-made news vary along socio-demographic lines. Therefore, our third research question asks:
Methodology
Experimental design
A 14 (story topic) × 3 (level of automation) between-subjects population-based online survey experiment was conducted, with each participant viewing a single video (n = 100 for each video). A between-subjects design was considered preferable to a within-subjects design (where participants would watch and evaluate several videos) to avoid results being potentially affected by learning or priming effects. Given that the sample was drawn from survey panels that included wider ranges of individuals than just engaged college students, 1 we also wanted to set a very low threshold for respondent fatigue. Keeping the task very short was therefore important. Since this was an exploratory study, and given the lessons learned from Graefe and Bohlken (2020, described above), we had no prior information on what effect sizes should be considered noteworthy, which made it impossible to conduct a meaningful power calculation to specify our sample size. We arrived at n = 100 per video largely pragmatically, choosing a larger sample size than typically used in relevant literature described above. The study was approved by the Ethics Committee of the School of Arts and Social Sciences at City, University of London.
Stimulus materials
Human-made videos
The human-made videos were sourced from PA Media (PA), the UK’s national news agency. The PA “consumer-ready” videos used in this study were captioned, featured no voice-over or presenter, and had been created without the help of automation (Alex Rothwell, PA’s Head of Video, personal communication).
Videos produced using automation
The partly and highly automated videos were created by the present study’s researchers using the Wibbitz platform. At the time the videos were produced, the Wibbitz production process started with text; we used the captions from the human-made videos as our input. Operators of the platform could decide whether the text should appear as captions or be used as a script for a voice-over. We chose the former to match the style of the human-made videos. The platform automatically tried to find media—both video clips and still images—that matched the captions by searching media databases, including those provided by Getty, Reuters, Pond5, and WENN. Background music was chosen by the researchers.
Although the Wibbitz platform could produce videos of an acceptable quality “out of the box”, with no human intervention beyond the initial text input, most of the videos, in our experience, needed some further editing before they were consumer-ready.
Because the aim of this research project was to compare UK citizens’ evaluations of short-form news videos (1) made by journalists and (2) made using automation, a key issue was the degree of automation used. The videos produced on the Wibbitz platform could range from the highly automated (relying only on an initial text) through the partly automated (those that have undergone some further human editing) to the minimally automated (those that have undergone heavy further human editing). Typical use of Wibbitz involved partial automation, rather than high automation, of video production.
In order to reflect the different degrees of automation with which videos on the Wibbitz platform can be produced, we created both highly and partly automated videos. The process we used is described in the Supplemental Material. An important point to note is that our post-editing of the highly automated videos to create the partly automated videos mainly involved manually replacing still images and video clips that did not match the captions. Across the 14 partly automated videos used in our experiment, an average of 55% of the scenes were edited (SD = 12.5) (see Table A in the Supplemental Material).
Because the independent variable in our survey experiment is the degree of automation used to create short-form news videos, it was important to try to minimize the extent to which other variables could have an effect on evaluations, with these variables including the story topic and stylistic elements such as music, editing transitions, and captions. One way we did this was to use 14 sets of videos covering topics—royalty, sport, celebrity, business, politics, crime, technology, and culture—familiar to UK audiences. Each set contained a human-made, a partly automated, and a highly automated video on the same story (see Table A in the Supplemental Material for further descriptive information about the videos). Furthermore, we made sure that both the human-made and automated videos did not differ in their resolution and contained nothing (e.g. logos) that would give away their authorship. In addition, we made sure that the human-made and automated videos did not differ significantly stylistically (see Supplemental Material).
Not all of the PA videos used music: six of the 14 used background sound instead. The equivalent partly and highly automated videos used music, as no suitable background sound was available. The length of the videos averaged 63 seconds (SD = 21.8). The human-made videos were, on average, slightly shorter (M = 56, SD = 16) than the automated videos (M = 66, SD = 24). The human-made videos relied more on moving images, with eight of the 14 PA videos featuring all moving images and six a mixture of still and moving images. By contrast, 57% of the automated videos contained just stills and the other 43% a mixture of stills and moving images (see Table A in the Supplemental Material).
Survey development
Mindful of Sundar’s (1999) warning about the validity of the dependent variables used in prior news perception studies, we undertook a major project with an inductive (rather than theory-driven) approach to better understand the criteria with which online news consumers evaluate online news videos and to use these findings to develop this study’s survey instrument. Nine in-depth group interviews—each 2 hours long—were held with a socio-demographically diverse sample of 22 online news video consumers in the UK (recruited via a market research agency). Each group was shown an average of 4–5 online news videos, both human-made and made with the help of Wibbitz’s automation platform. Subsequently, interviewers facilitated discussions about participants’ reactions to and perceptions of the videos, which were recorded and transcribed verbatim. The resulting 145,000 words were analysed using thematic analysis. The results (Koliska et al., 2021) show the complex and interwoven set of criteria used to evaluate online news videos. For example, one of the criteria that emerged from the group interviews was narrative flow. One respondent talked about videos “having flow” and another liked videos that had “a beginning, a middle and an ending”. So, the final survey included two questions on narrative flow using these semantic differential scales, where respondents were asked to place a slider towards the statement that best described their opinion of the video: the story had a structure [slider] there was no structure to the story the story flowed [slider] the story was disjointed
A close study of human-made and partly and highly automated videos also informed the development of the survey. For example, we noticed differences in how well illustrative images matched captions; the proportions of still and moving images used; the proportions of speech and (non-musical) background audio used; the range, quality, and specificity of the illustrative imagery used; the use of background music; and the use of captions. Therefore, questions were included in the final survey on such themes, which had also been discussed in the group interviews. For example, one question asked “How well or badly did the still images and/or moving footage match the words in the captions?” The response scale for this question—as was the case, where possible, with all the questions in our survey—explicitly displayed the evaluative dimension (e.g. “They all related well to the story”) to avoid the reliability and validity problems, now extensively documented (see, e.g., Krosnick and Presser, 2010: 275–278), that are caused by defaulting to the application of Likert-type agree–disagree response scales for all items.
The items used as our dependent variables are given in Tables B, C, D, and E of the Supplemental Material, where the full survey is also included.
Expert- and respondent-driven pretesting
Following expert-driven pretesting by survey experts at Ipsos MORI, cognitive pretesting of the first draft of the survey was carried out with 10 participants. Respondents were recruited via a market research agency to ensure a mix of genders (40% were female), ages (M = 45.5, SD = 15.4), ethnicities, socio-economic backgrounds, and professions (see Supplemental Material).
Survey scripting
The survey was scripted by Ipsos using their proprietary online survey platform. Multiple steps were taken to ensure that respondents watched, listened, and paid attention to the stimuli and that response order effects were countered (see Supplemental Material).
Sample recruitment and composition
Respondents were recruited by Ipsos using a blend of its own panel of online survey respondents, and those of an approved partner provider. Quotas were employed so that in each cell of the experiment the sample provided a close match to the wider online UK population (those who use the Internet at least once a week) in terms of distributions of gender, age band (18–34, 35–54, 55–75), and region of residence (North, Midlands, and South) (see Table F in the Supplemental Material). A screening question was used to select into the sample only those who consume online news at least once a month.
Each of the 42 videos was watched by a different group of 100 respondents, giving a final sample size of 4200. The 100 respondents in each group were randomly allocated to each condition using a least fill function on the three quota variables to reduce any skew on these characteristics occurring by chance, and it was ensured that fieldwork for each video topic was conducted over the same precise period in order to avoid introducing any bias from the time of day or day of week when participants engaged with the survey (this was judged by Ipsos to be the main potential bias across cells).
Data analysis
For RQ1 and RQ2 we employed one-way ANOVAs and independent samples t-tests to compare mean scores for questions with a continuous answer scale between the experiment conditions, and independent samples z-tests to compare proportions of responses to the categorical items between experiment conditions. For RQ2 and RQ3 we focused on the continuous dependent variables. For RQ2 we split the data by video topic and repeated the t-tests within each of the 14 sets. This is tantamount to allowing, in each analysis, an interaction between video authorship and video topic (i.e. allowing the association between video authorship and evaluation variable to be different across different topics). For RQ3 we modelled this more formally in a series of linear regressions, with video authorship, content, and socio-demographic items as explanatory variables, testing interaction terms between video authorship and each of the other explanatory variables. We analysed all evaluation variables individually rather than combining them into indices because we wanted to retain the granular detail of the separate characteristics studied. Exploratory factor analyses suggested some intuitively plausible underlying dimensions in the data, but with a few anomalies. 2
Limitations
Our chosen research design has some inevitable limitations. For example, although our sample is much more demographically varied than in typical, similar experimental studies, it is not a probability sample of our target population of online news consumers (in practice it would be very difficult and expensive to draw such a sample, given the lack of an obvious sampling frame). In choosing a between-subjects design (for the reasons presented above) we sacrificed the statistical power that a within-subjects design would provide. In choosing to analyse survey items separately to retain granularity, rather than merge them into composite indicators, we consequently carried out more significance tests, thus increasing our risk of Type I errors (falsely rejecting a true null hypothesis). This, combined with our open research questions (rather than hypotheses), means that we need to be careful not to over-interpret our results.
Results
To summarize our results broadly: we found, on a number of evaluation items, that respondents on average gave more positive ratings to human-made than to automated videos. No differences were very large, however (the largest mean difference was 0.25 on a scale with range 7), and not all were statistically significantly different from 0 (at a conventional 5% level). Figure 1 (and Table G in the Supplemental Material) summarizes these results for items that used continuous answer scales across (pooling data from) all of the 14 sets of news videos. It shows, for example, that average scores for overall liking of the videos were 0.13 points lower for highly automated videos than for human-made videos, which is a statistically significant difference (p < .05). However, there was no statistically significant difference in overall liking scores between partly and highly automated videos, nor between partly automated and human-made videos. We found that liking of audio track, music (where used), and still images/moving footage was significantly lower for the partly and highly automated videos than for human-made videos. In a result that reflected how the automated videos in our experiment were created, the only significant difference between the highly and partly automated videos in the liking measures was the liking of images/moving footage. (The partly automated videos were versions of the highly automated videos that had been post-edited by a human to replace any images that did not match the captions.) Although liking of captions was significantly higher for human-made than for highly automated videos, we did not find significant differences for either of the other two comparisons.
For the items that asked about characteristics in terms of pairs of opposing evaluations (e.g. “engaging – boring”, “professional – amateur”), we also found very few significantly different ratings between the partly and highly automated conditions (full details are given in Table G in the Supplemental Material). Our focal interest, however, was the comparison between partly automated and human-made videos, given that, in practice, automated videos are rarely used without some element of human editing (see Figure 1 and the first column of results in Table G in the Supplemental Material). In comparison to the human-made videos, the partly automated ones were, on average, rated significantly more amateur than professional; more boring than engaging; and more limited than comprehensive. They were also rated as more understated than sensational; more fact-filled than opinion-based; more serious than light; and more dry than emotive. Arguably these qualities could be thought of as relating to subtle qualities of human editing, so these contrasts make intuitive sense.
We found no significant differences in terms of evaluations of subjectivity/objectivity; clarity; accuracy; informativeness; relatability; bias; presentation of relevant facts; and story structure. We might expect most of these to be judged on the basis of caption content (which was constant within each story topic), so non-significant differences make intuitive sense here. Relatability would likely be judged in relation to the story topic, which again was constant over experimental conditions.
Lastly, we found a couple of counter-intuitive contrasts, with partly automated videos (compared with the human-made ones) being rated as having a story more flowing than disjointed; and telling respondents things that they didn’t know rather than things they knew already. We would note, however, that there were no significant differences between highly automated and human-made videos on these two characteristics, so would caution against making too much of these apparent anomalies. Differences in mean scores of liking and semantic differential items for highly automated (square) and partly automated (diamond) videos compared to human-made videos; 95% confidence interval in whiskers; scales each have a range of 7.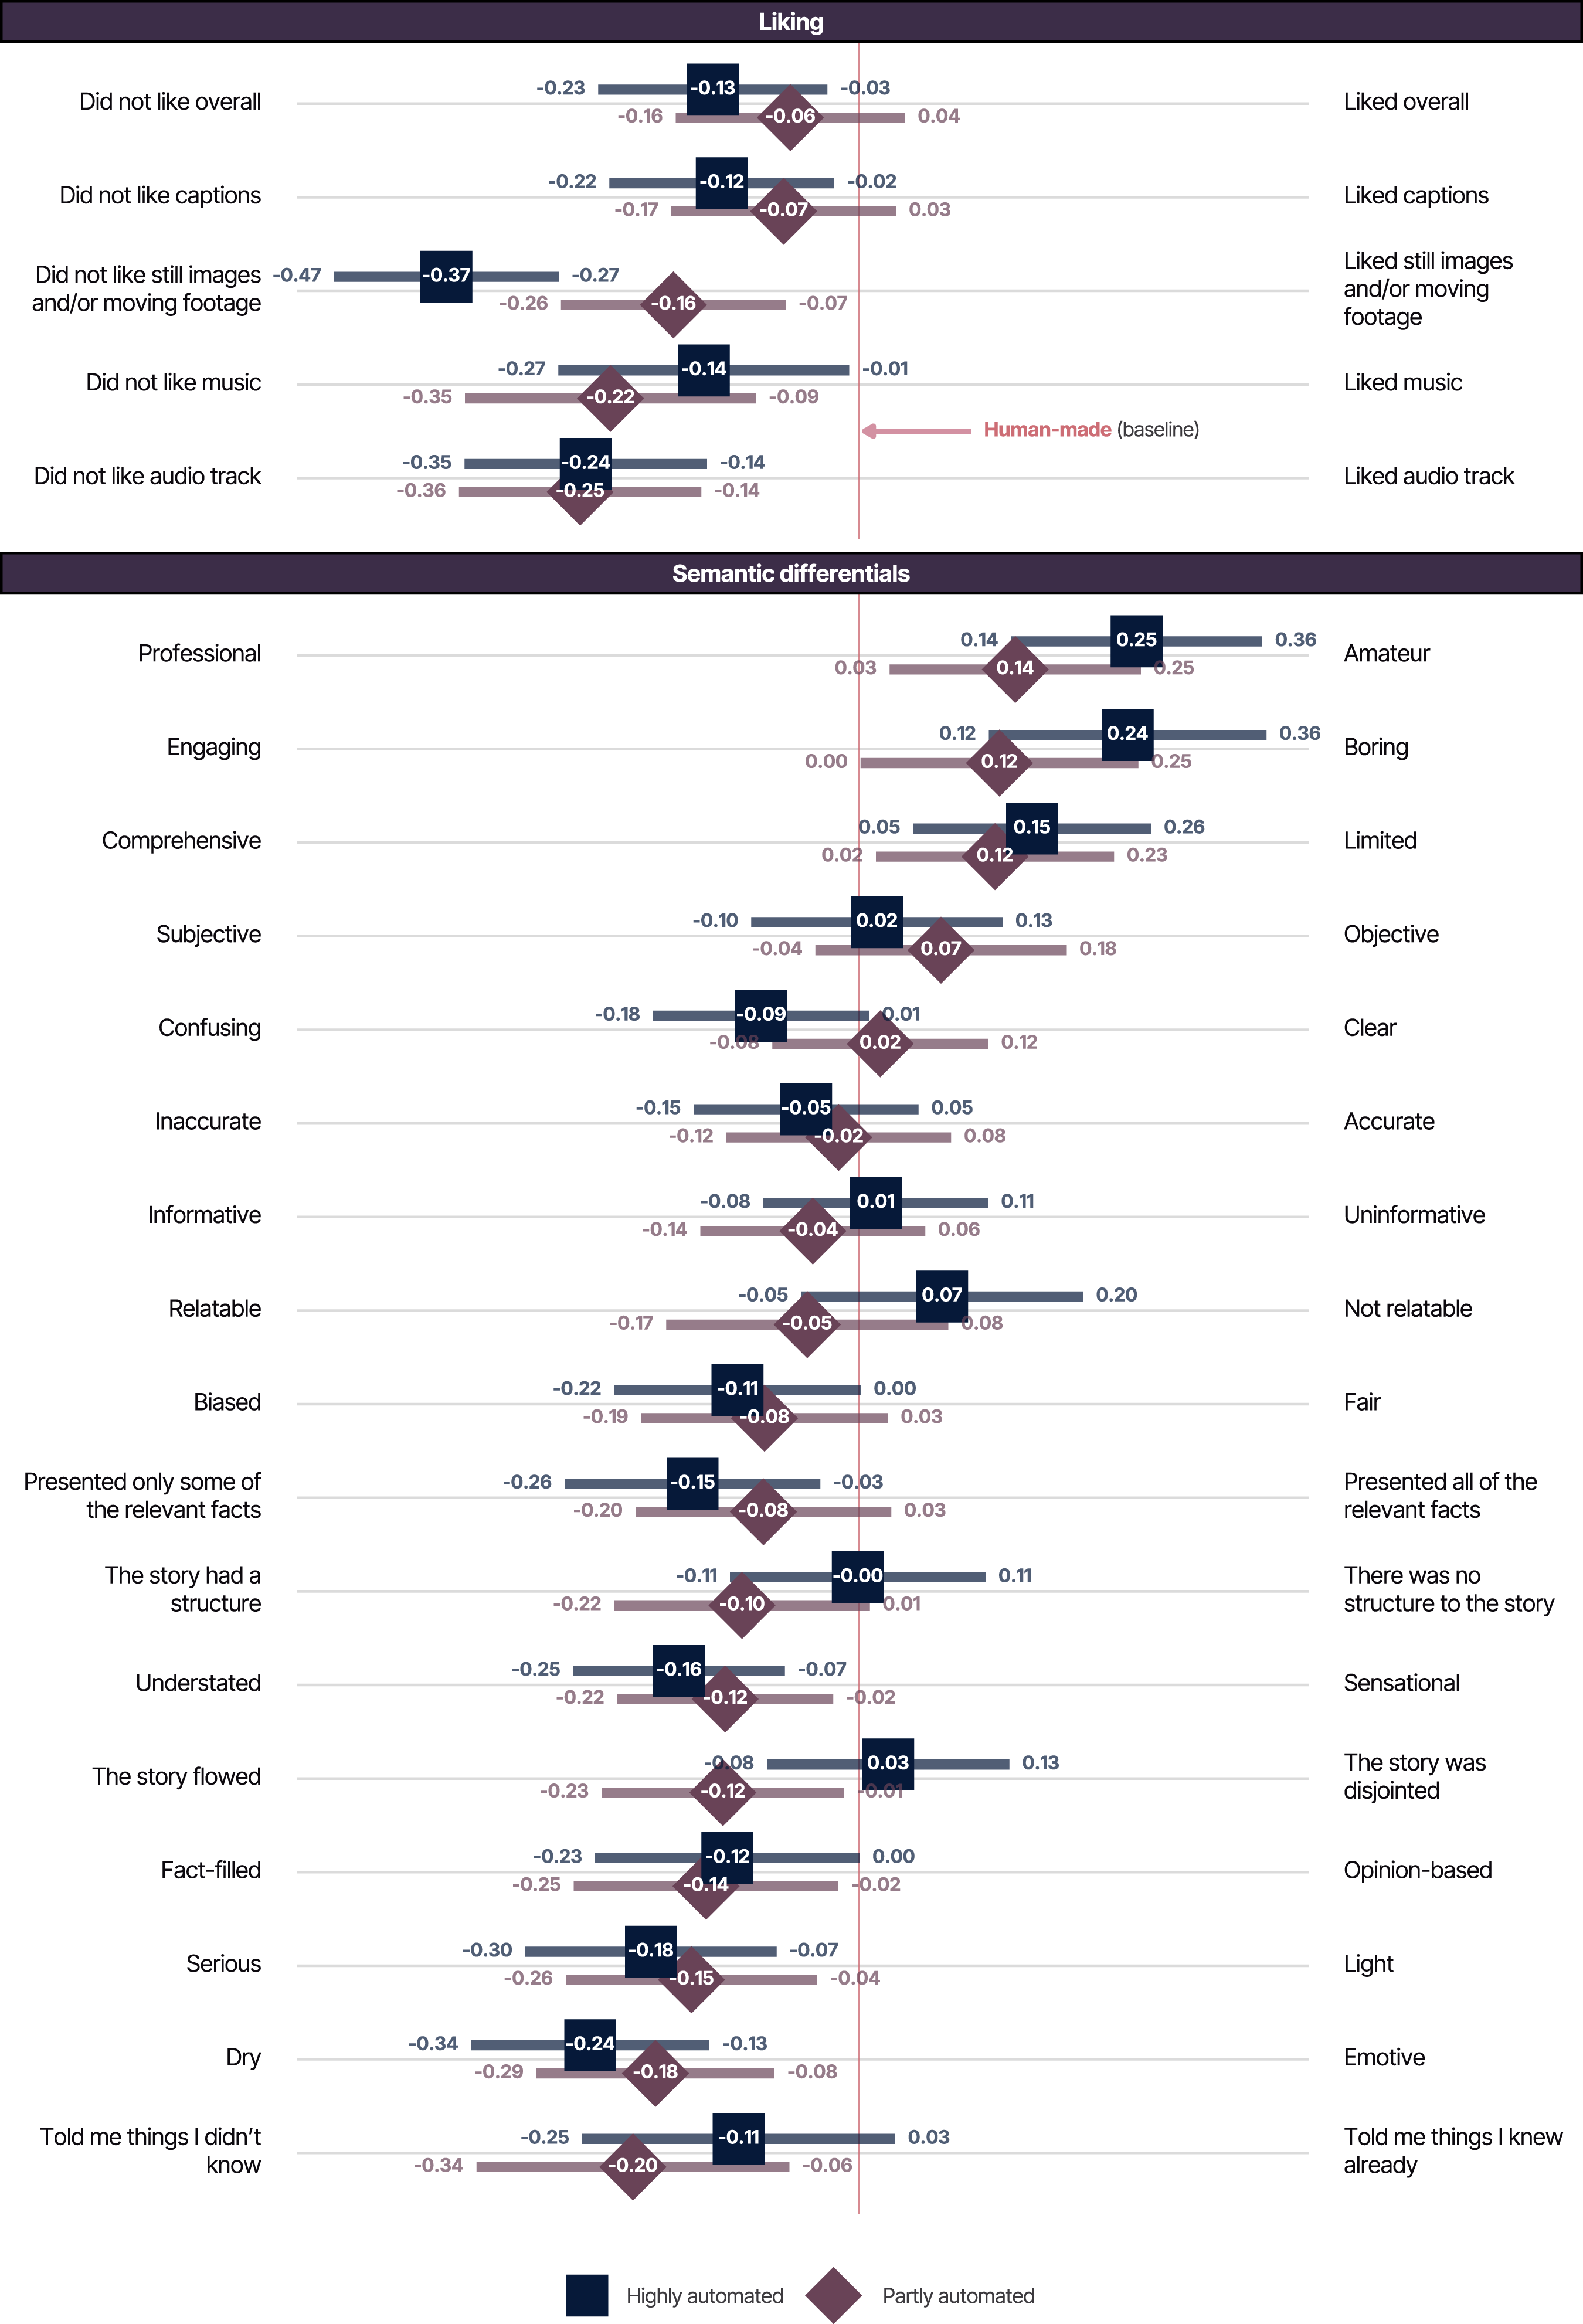
Figure 2 summarizes differences in ratings for the categorical survey items (see Table H in the Supplemental Material for further detail). Comparing ratings related to captions, we found no significant differences between automated and human-made videos in terms of readability of captions or text size, but the amount of text and the speed of movement/transition of captions was less likely to be judged “about right” in automated videos than human-made ones.
In terms of images, automated videos were rated less favourably for variety of images, their match to the captions, their quality, and how well they related to the story. For this last item the contrast between partly automated and human-made videos was marginally non-significant. For all items in this section we note the much worse ratings for highly automated videos. This makes intuitive sense, as the main adjustments made to the highly automated videos to produce the partly automated videos were the correction of gaps in images or of egregious mis-matches of images.
In terms of audio, we found respondents watching automated videos were significantly less likely to say that the audio was “fine as it was”, and for those with music, less likely to say that the music was suited to the story. By contrast, there was no significant difference between automated and human-made videos regarding whether the use of music enhanced the experience of the story. Those watching highly automated videos were significantly more likely (than those watching human-made videos) to say that they would have liked more music and location sound, but the corresponding contrasts between partly automated and human-made videos were either borderline or non-significant. We found those watching both types of automated video significantly more likely to say that they would have liked a journalist voice-over.
At the end of our questionnaire we included an item to gauge the extent to which, at an aggregate level at least, differences in authorship were identifiable. We placed the question at the end of the survey (with no option to change earlier answers) to ensure it would not prime responses to the other questions. Respondents were asked to guess whether the video they had watched was human-made, partly automated, or highly automated. Predictably, having been presented with the possibility of automated authorship, a majority (60%) guessed “partly automated”, regardless of experimental condition. However, the judgement of “human-made” was more likely for the human-made videos than for the automated ones, and the judgement of “highly automated” was more likely for the highly automated videos than for the human-made ones. Differences in percentages of answers to selected response options of the categorical survey items, for highly automated (square) and partly automated (diamond) videos compared to human-made videos; 95% confidence interval in whiskers.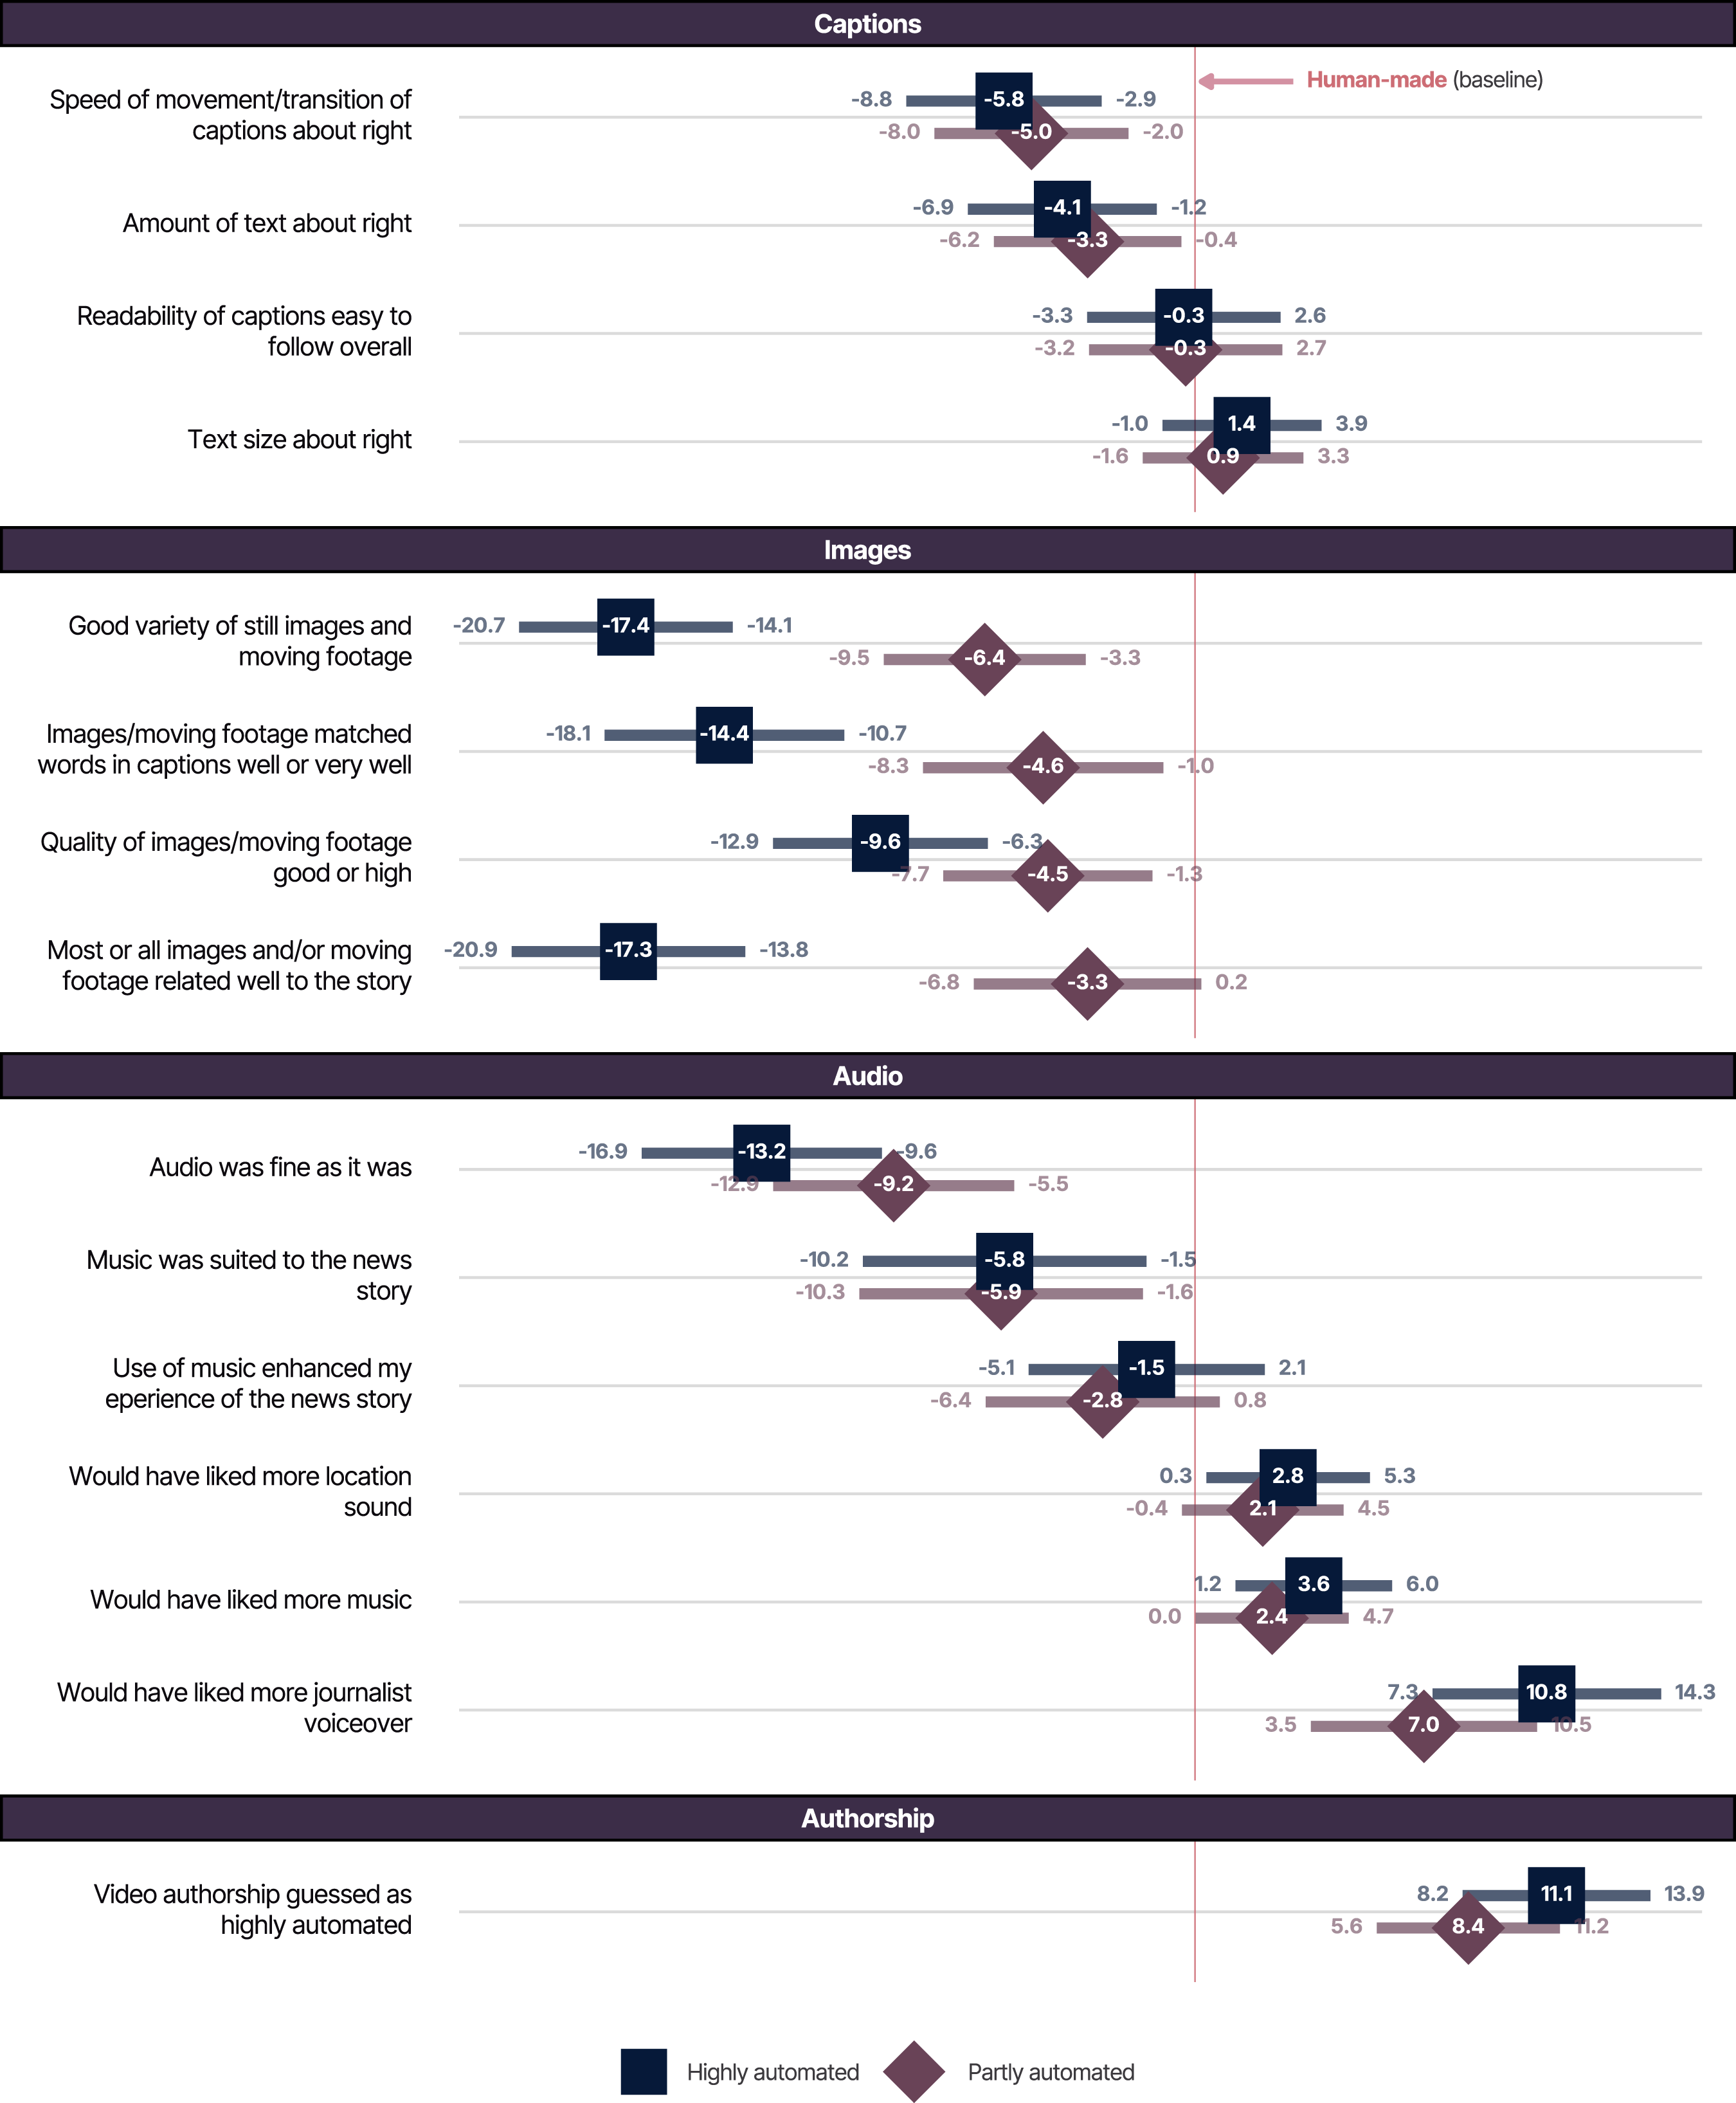
Figure 3 in this article and Table G in the Supplemental Material show the results of one-way ANOVAs within each of the 14 topic sets of videos, presenting the topic sets in order from those returning the largest number of contrasts—the set of Donald Trump videos, with statistically significant (at p < .05) contrasts for 10 evaluation items—to the smallest number (the Elon Musk and 5G sets with none). The patterns of where (i.e. for which questions/dependent variables) such differences are and aren’t found broadly mirror the global tests, inevitably—but with at most half of the topic sets (seven) returning significant results for any one question/dependent variable, and sometimes (e.g. for “told me things I already knew”) only one. The set of Trump videos is of particular interest in returning several significant differences between the differently authored videos (for clarity/confusion, bias/fairness, relatability, informativeness, and accuracy) that are diluted by the other topic sets of videos in a way that means there are no global significant differences on these criteria when topic sets are pooled. We note that increasing the sample sizes (in our study a reasonable but not terribly large n = 300 per ANOVA) might identify more contrasts as “significant”, but also that with multiple tests, some apparently significant contrasts could be false positives. Substantively, we conclude that differences found in RQ1 do vary by video topic. In terms of how they vary, we do not see any particular pattern by broad content area—it does not seem to be the case, for example, that videos on political subject matters systematically return more significantly contrasting evaluations than those on celebrity news. There is a clear methodological take-home message, however: using a range of stories for a study of this type is essential. If, for example, we had used only the set of Trump videos, or only the set of 5G videos, for our experiment, we would have arrived at quite different conclusions. p-values for statistically significant differences <0.05 from one-way ANOVA tests conducted separately for each of 14 video topics. Dependent variables are continuous evaluation items; independent variable is video authorship (human-made, partly-automated, and highly-automated); darker shading indicates smaller p-values.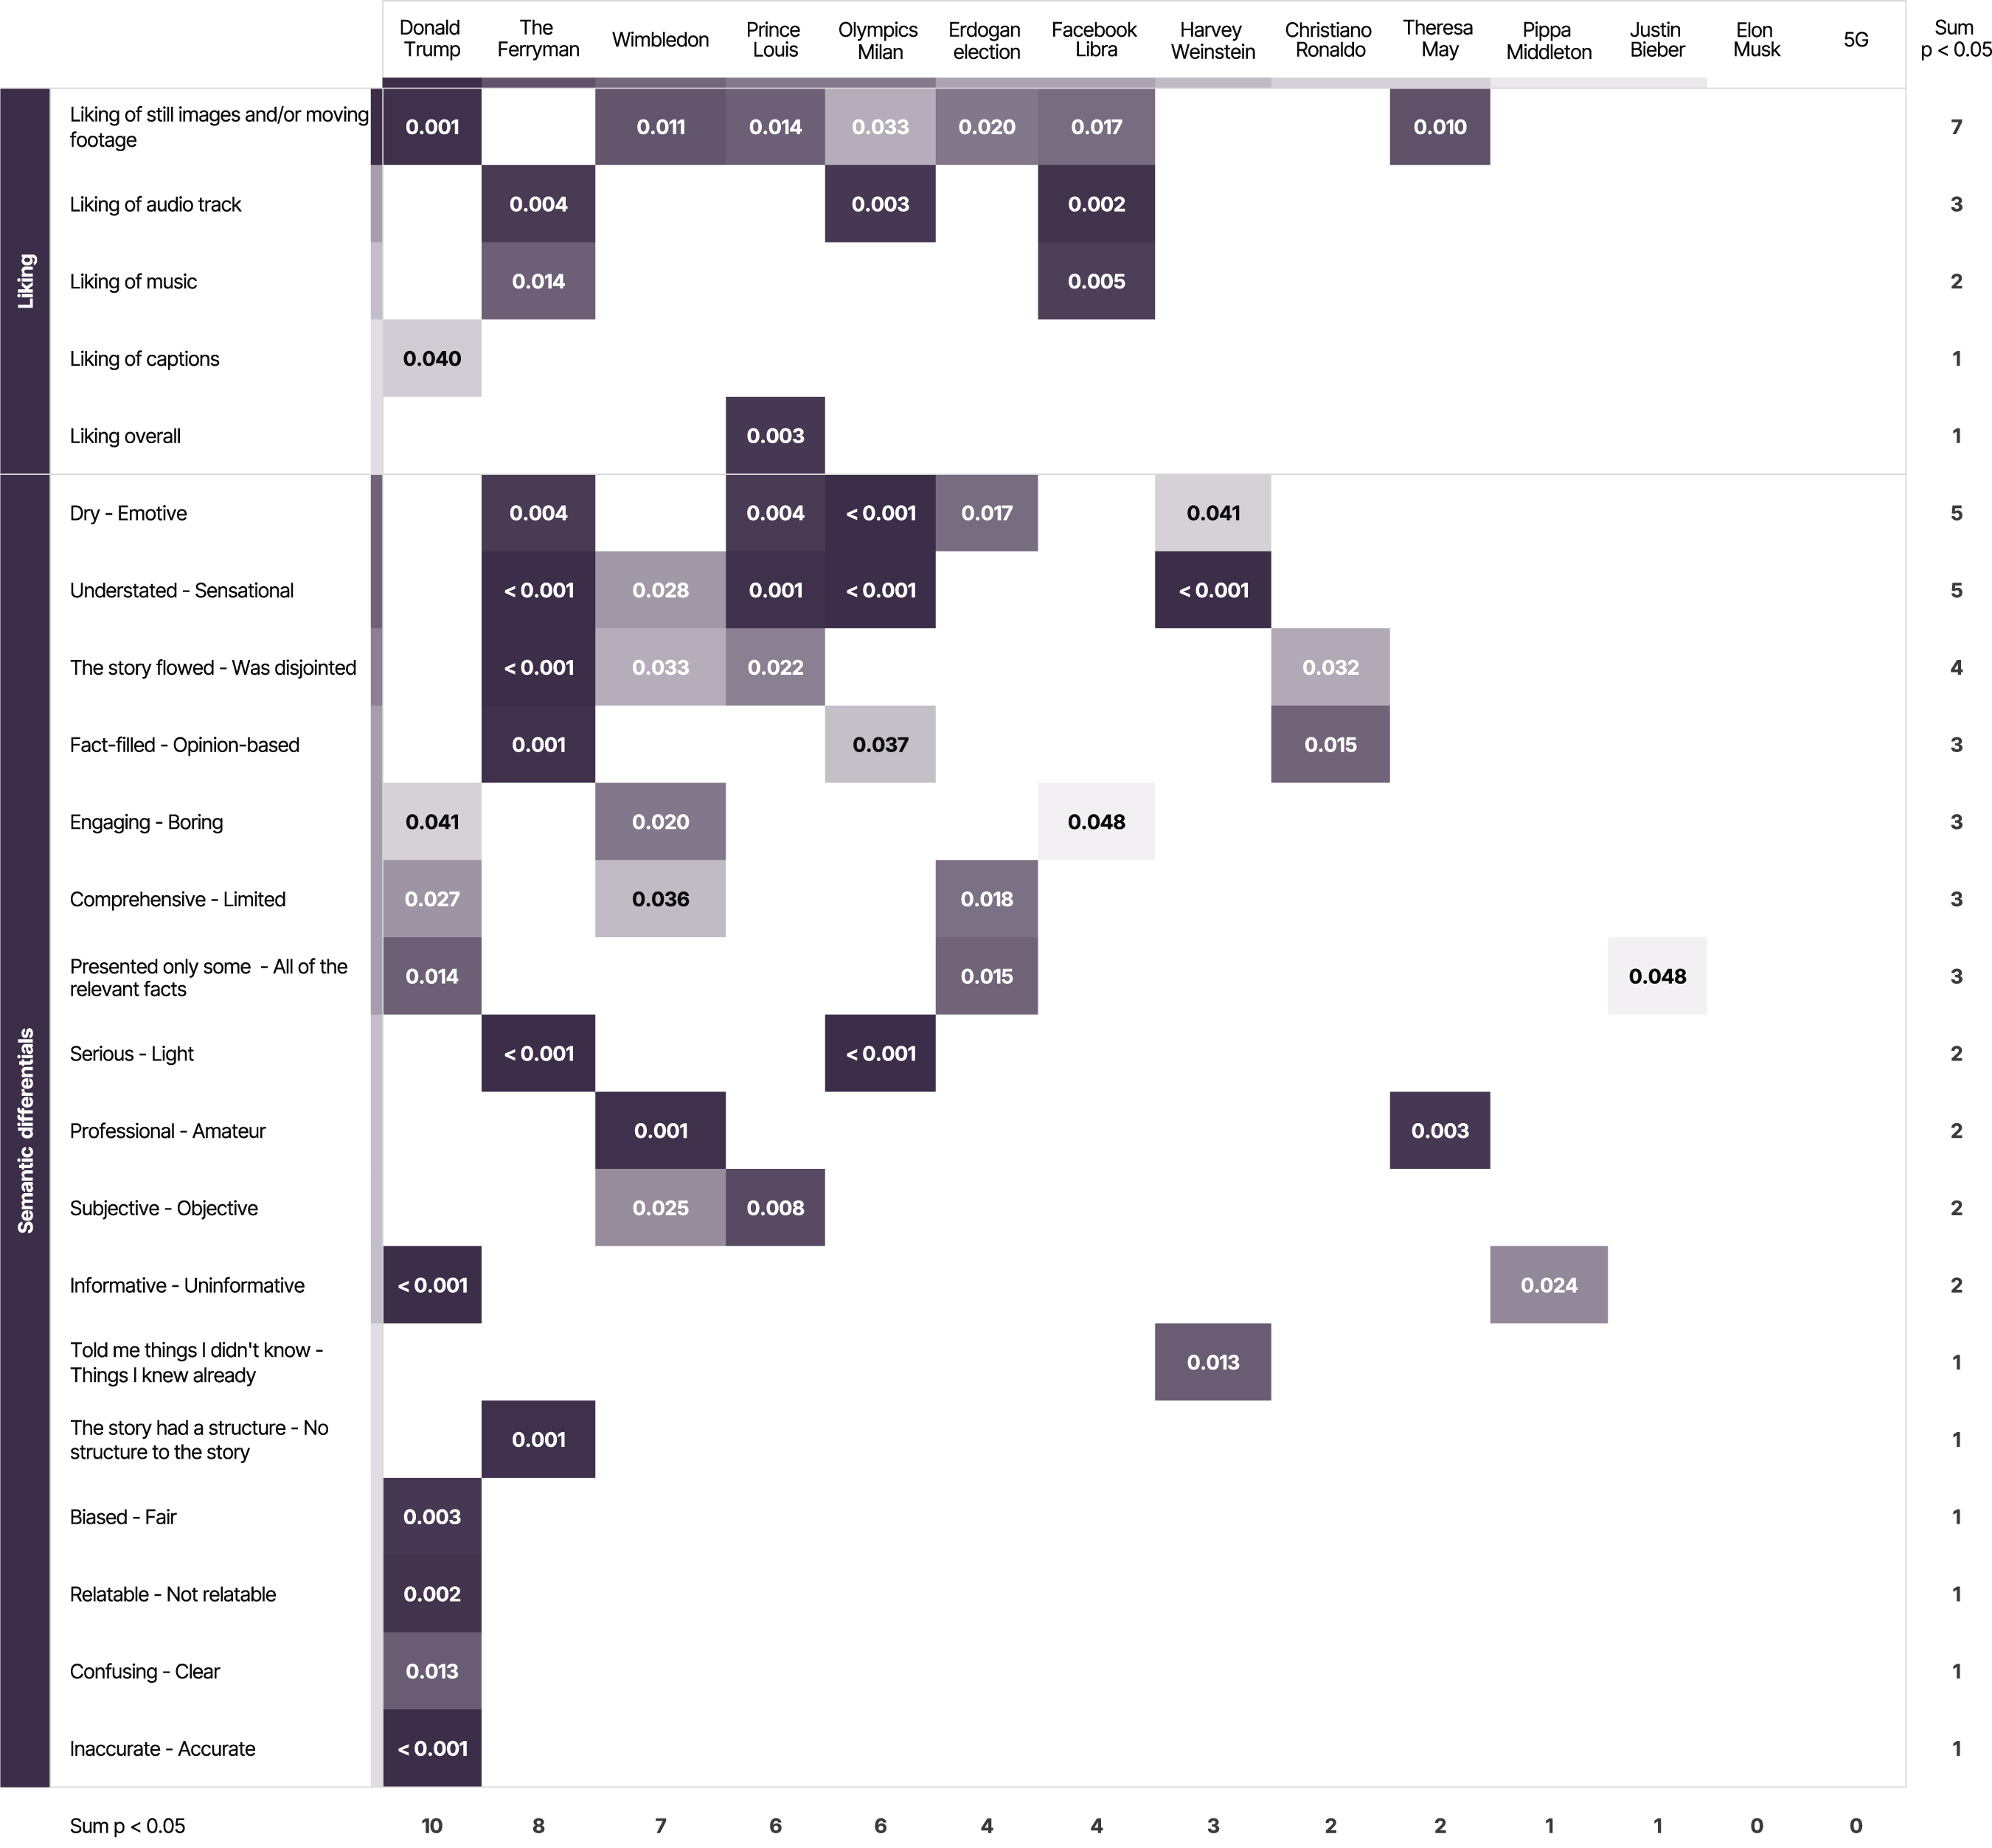
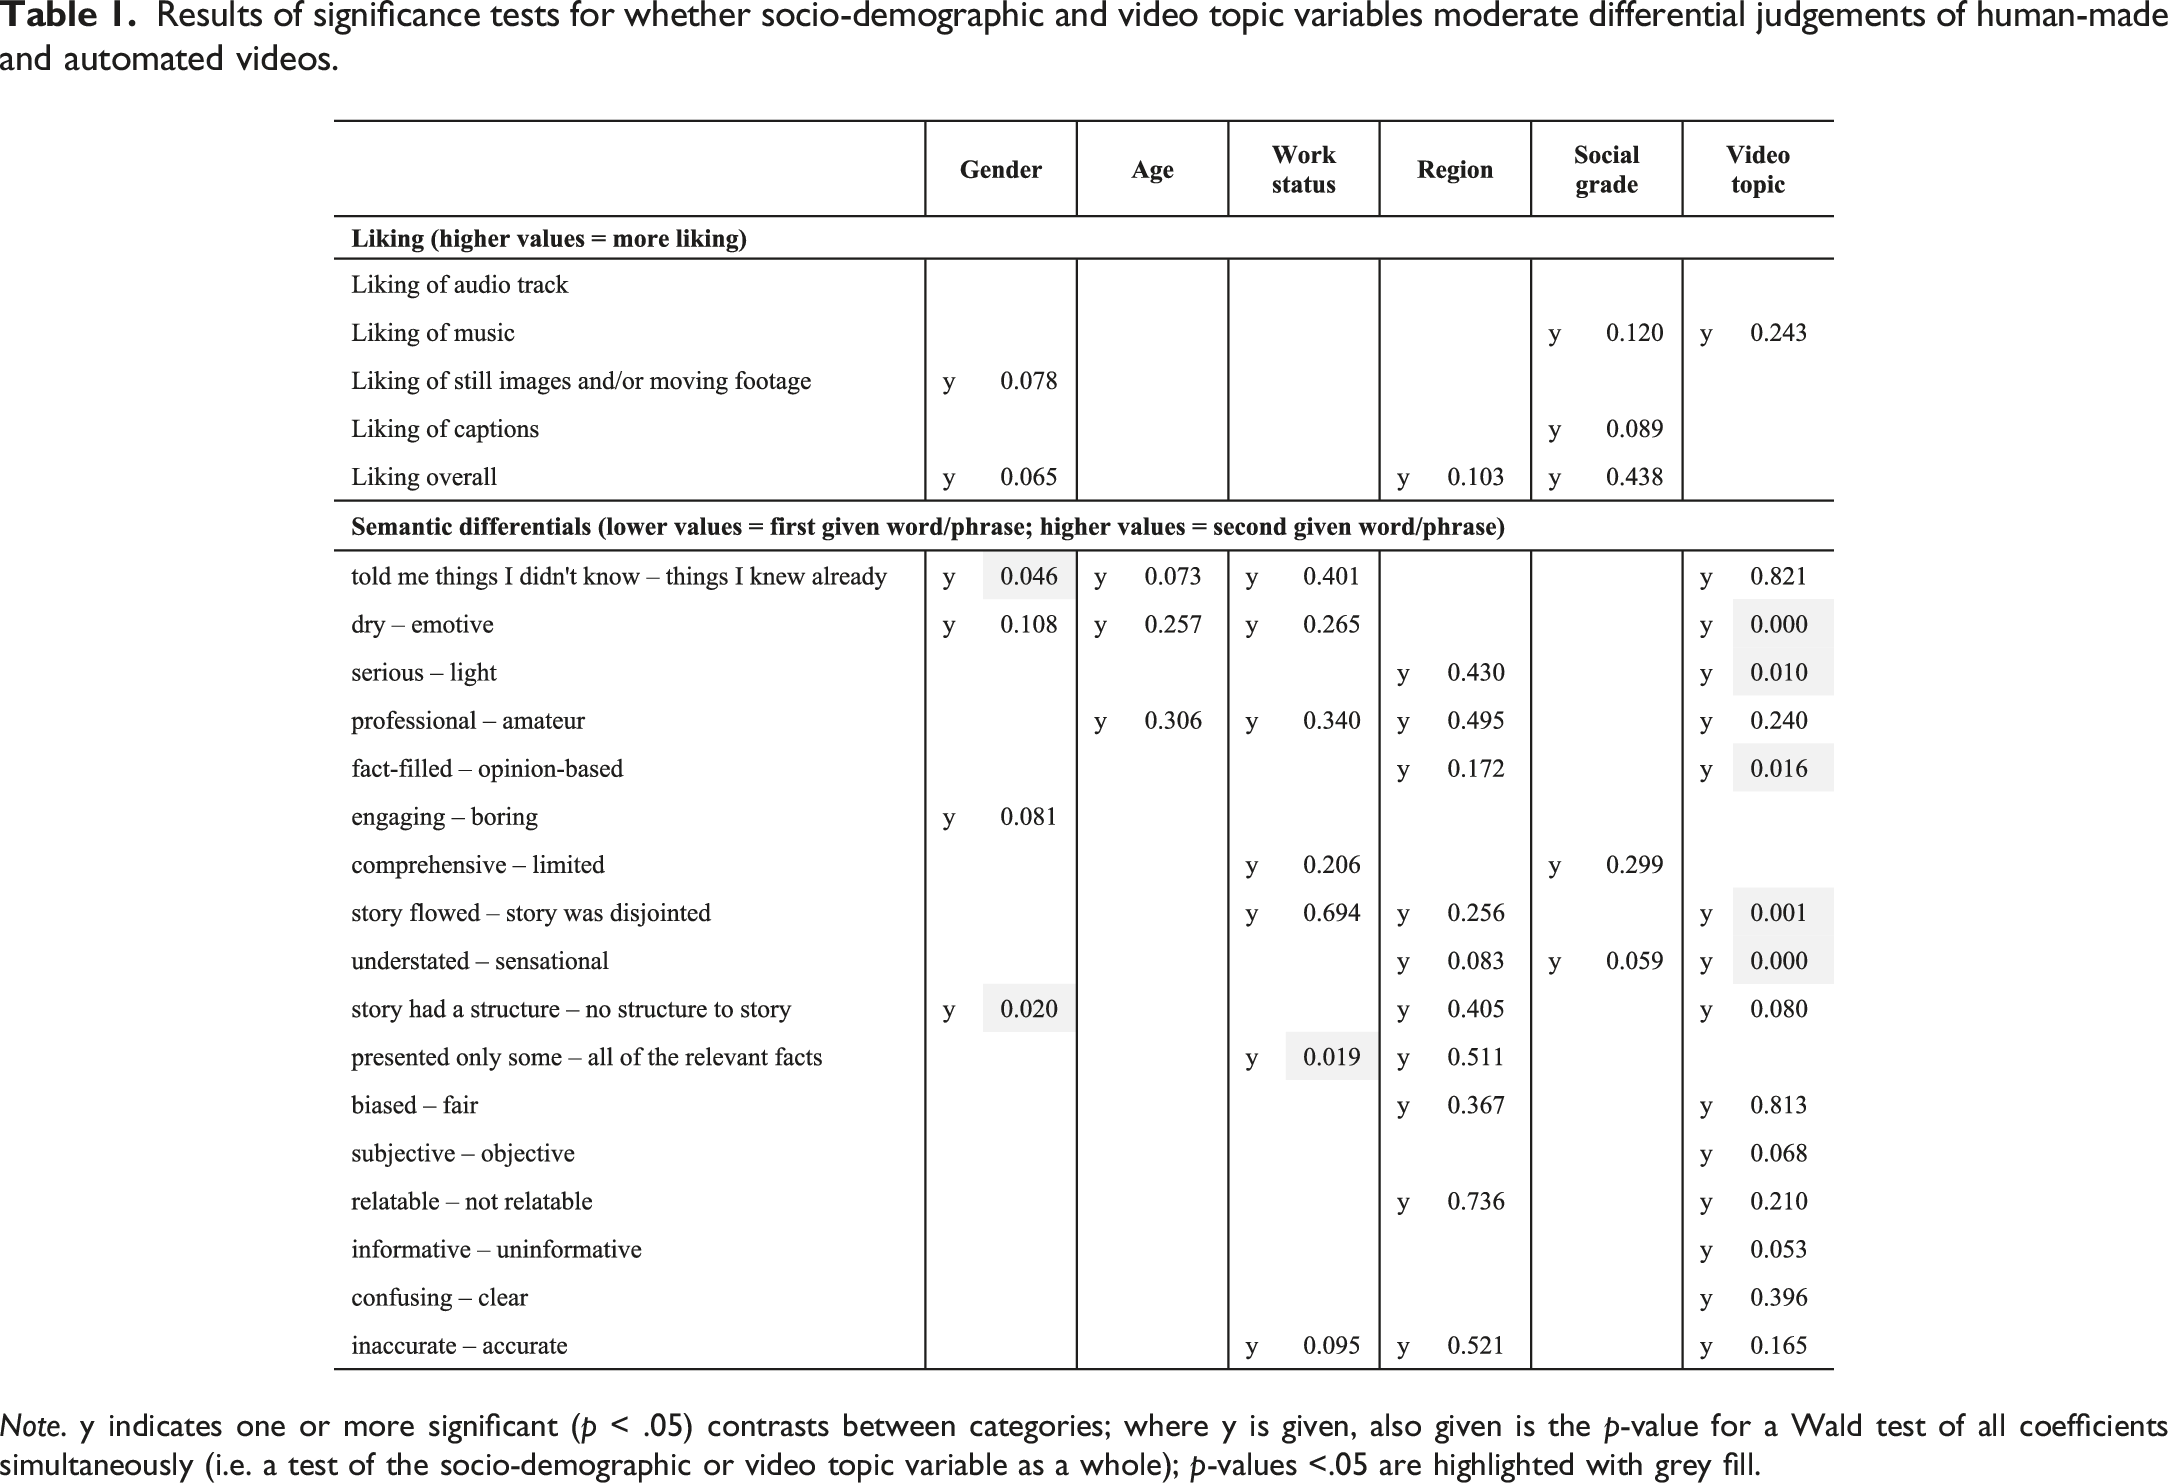
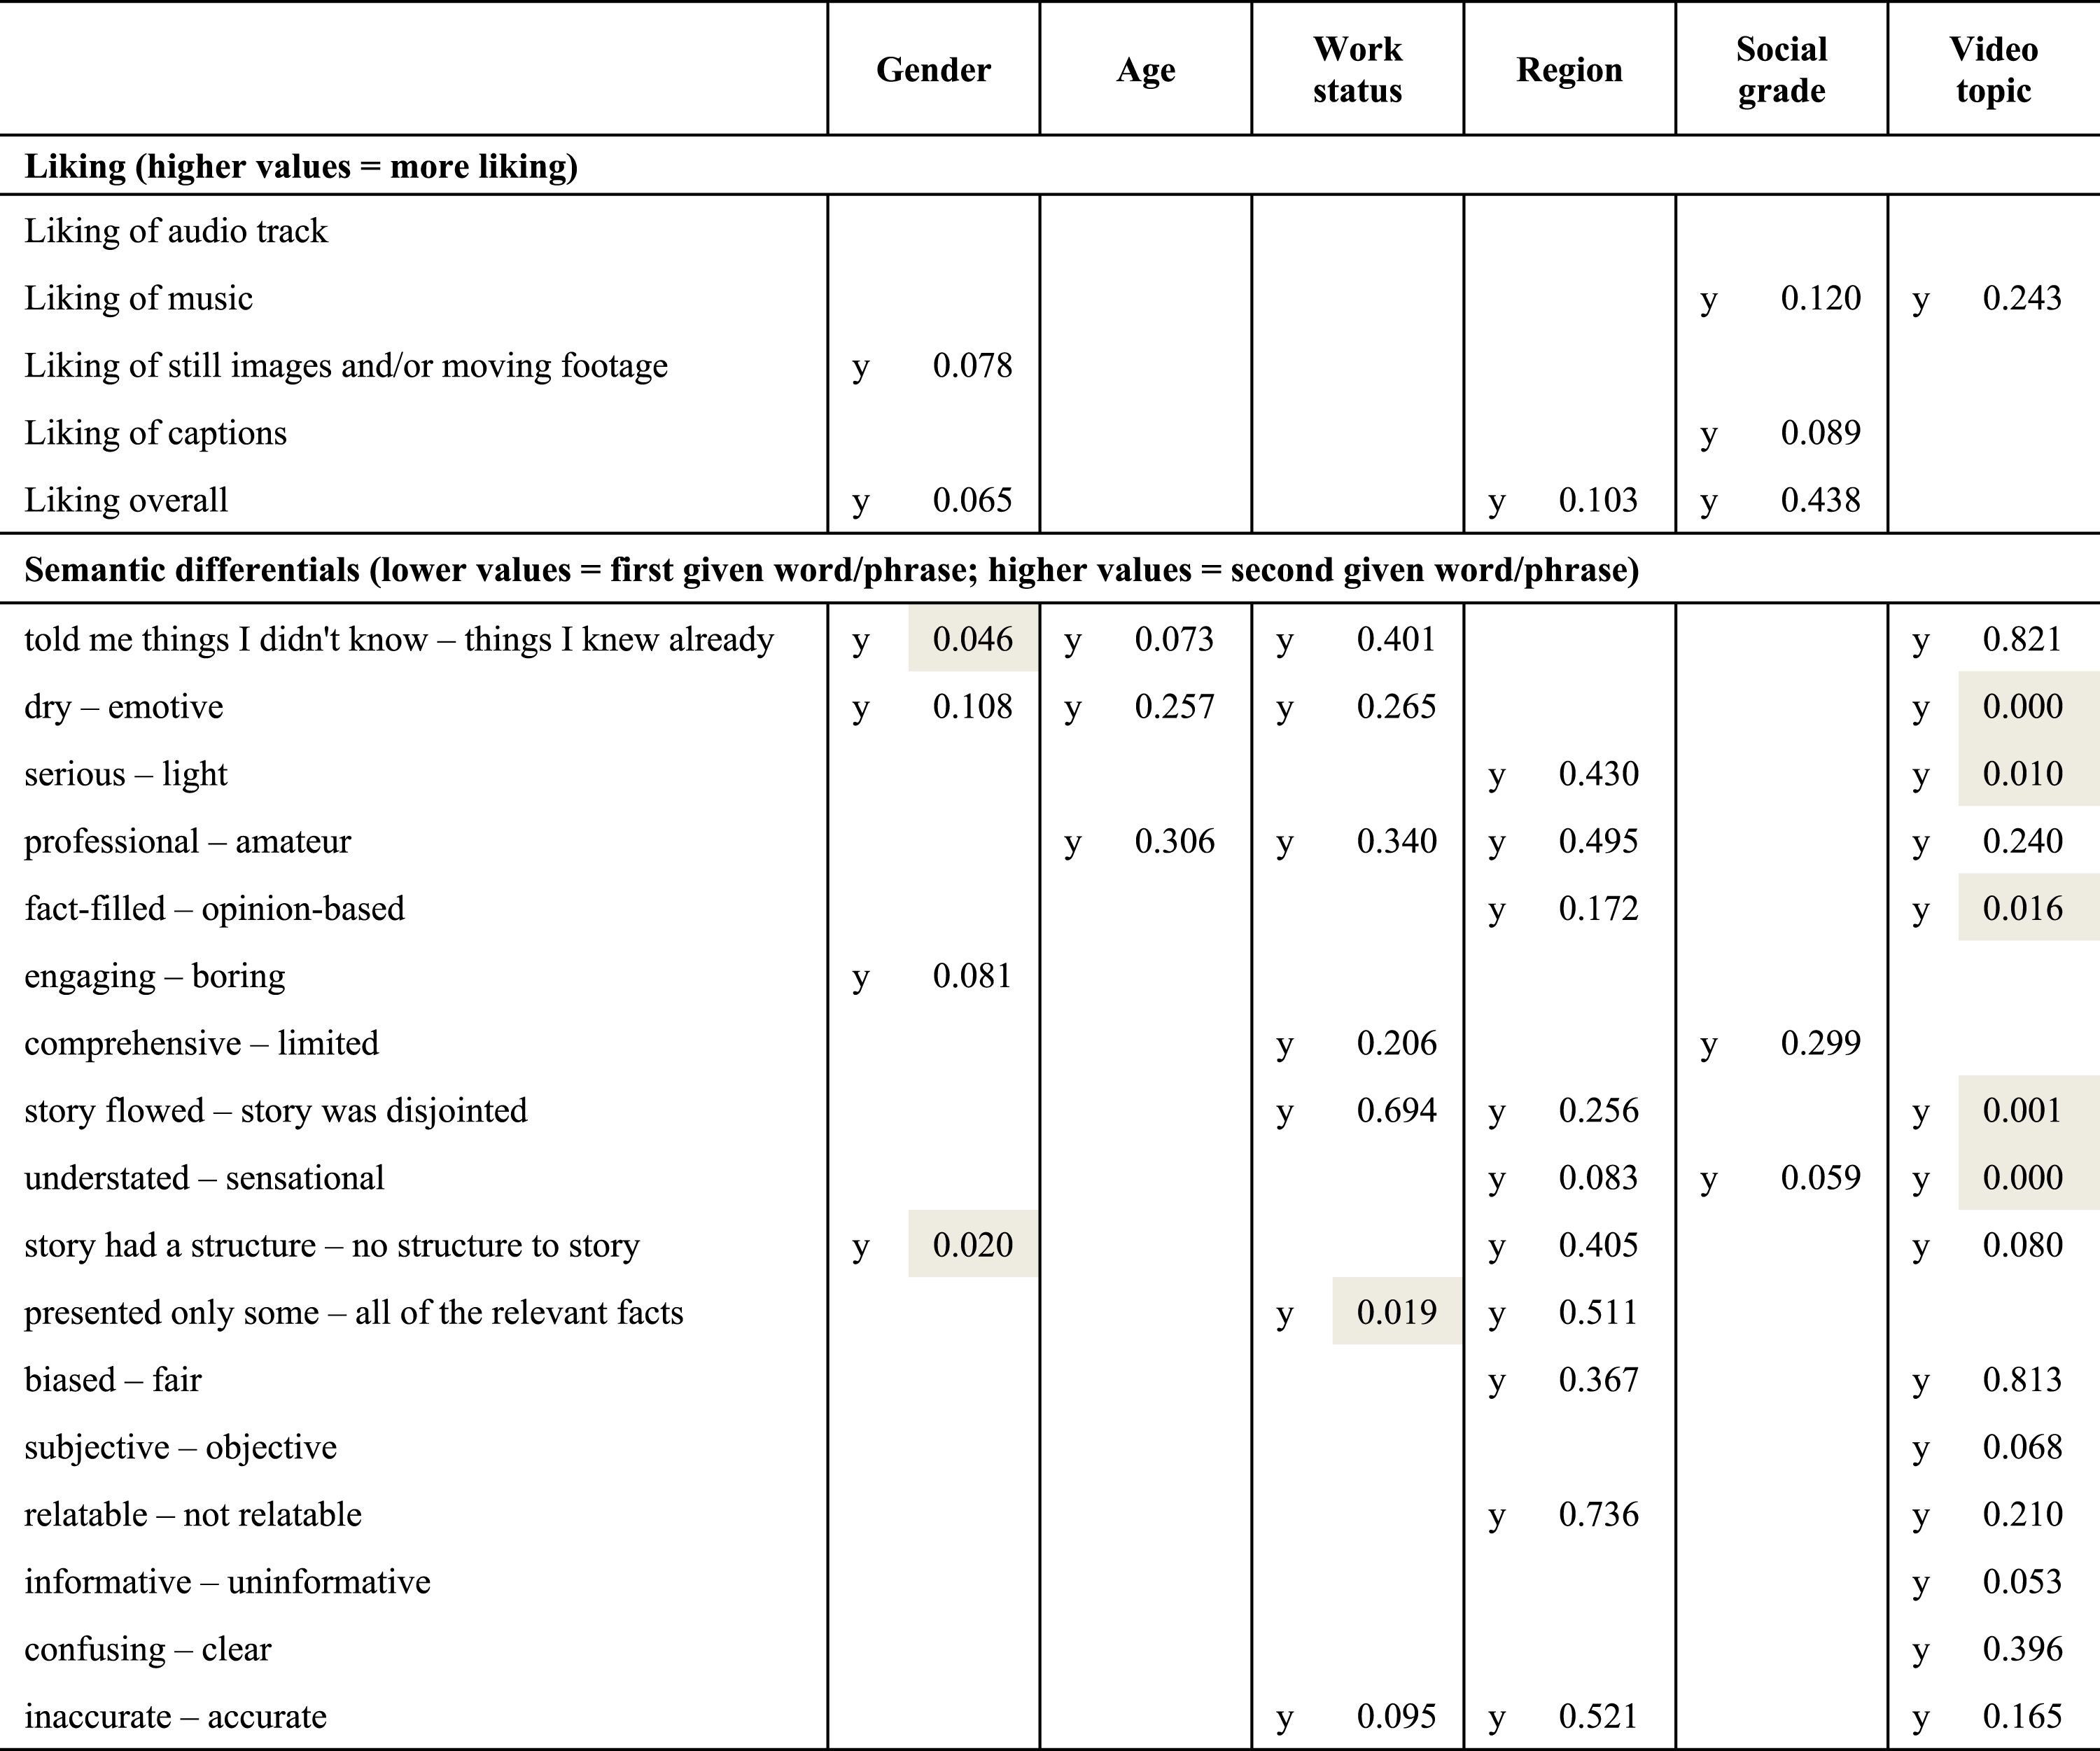
To answer this question we ran multiple linear regressions with each of our continuous evaluation variables as dependents, regressing on: the level of automation of the video; respondents’ gender, age group, occupational status, region of residence, and social grade; and the video topic. We included interaction terms to test whether the way people evaluated the differently authored videos was moderated by any of these variables—in other words, whether any differences in perceptions of human-made versus partly or highly automated videos varied systematically between socio-demographic groups, and/or by video topic. Figure 4 illustrates such an association: male respondents tended to rate human-made and automated videos as similarly dry or emotive, but females tended to rate human-made videos as more emotive than the automated ones. Table 1 summarizes our results overall. The number of analyses makes it unfeasible to describe directions of association; instead, we simply highlight for which variables we found any evidence of interaction terms between video authorship and socio-demographic or video topic variables being statistically significantly different from 0. A letter “y” indicates that one or more individual coefficients were statistically significant (at p < .05). Where these were found, we also provide the p-value for a joint Wald test for all coefficients for that interaction term. In several instances only one or two coefficients were significant, and the Wald test result was insignificant. In these cases, especially where the interaction involved a large number of categories, we would not want to read very much into just one or two parameter estimates being significant. Further analysis is needed to offer a detailed evaluation of these effects, noting also that with so many comparisons being tested here, some of the significant effects may be simply due to the play of chance. In that sense, it would be beneficial if future studies were able to ensure socio-demographic variation with samples in order to add to the evidence base on this issue. Alongside these somewhat indeterminate results for socio-demographic variables, however, it is notable that interactions involving video story topic are far more often statistically significant. The results suggest that variation in video topic has a greater impact on variability of results than does socio-demographic variation, and that (all else being equal) maximizing the former rather than the latter would be more beneficial to future studies. Illustration of interaction between level of video automation and gender of respondent in predicting extent to which video was evaluated as dry (lower scores) or emotive (higher scores); whiskers show 95% confidence intervals. Results of significance tests for whether socio-demographic and video topic variables moderate differential judgements of human-made and automated videos. Note. y indicates one or more significant (p < .05) contrasts between categories; where y is given, also given is the p-value for a Wald test of all coefficients simultaneously (i.e. a test of the socio-demographic or video topic variable as a whole); p-values <.05 are highlighted with grey fill.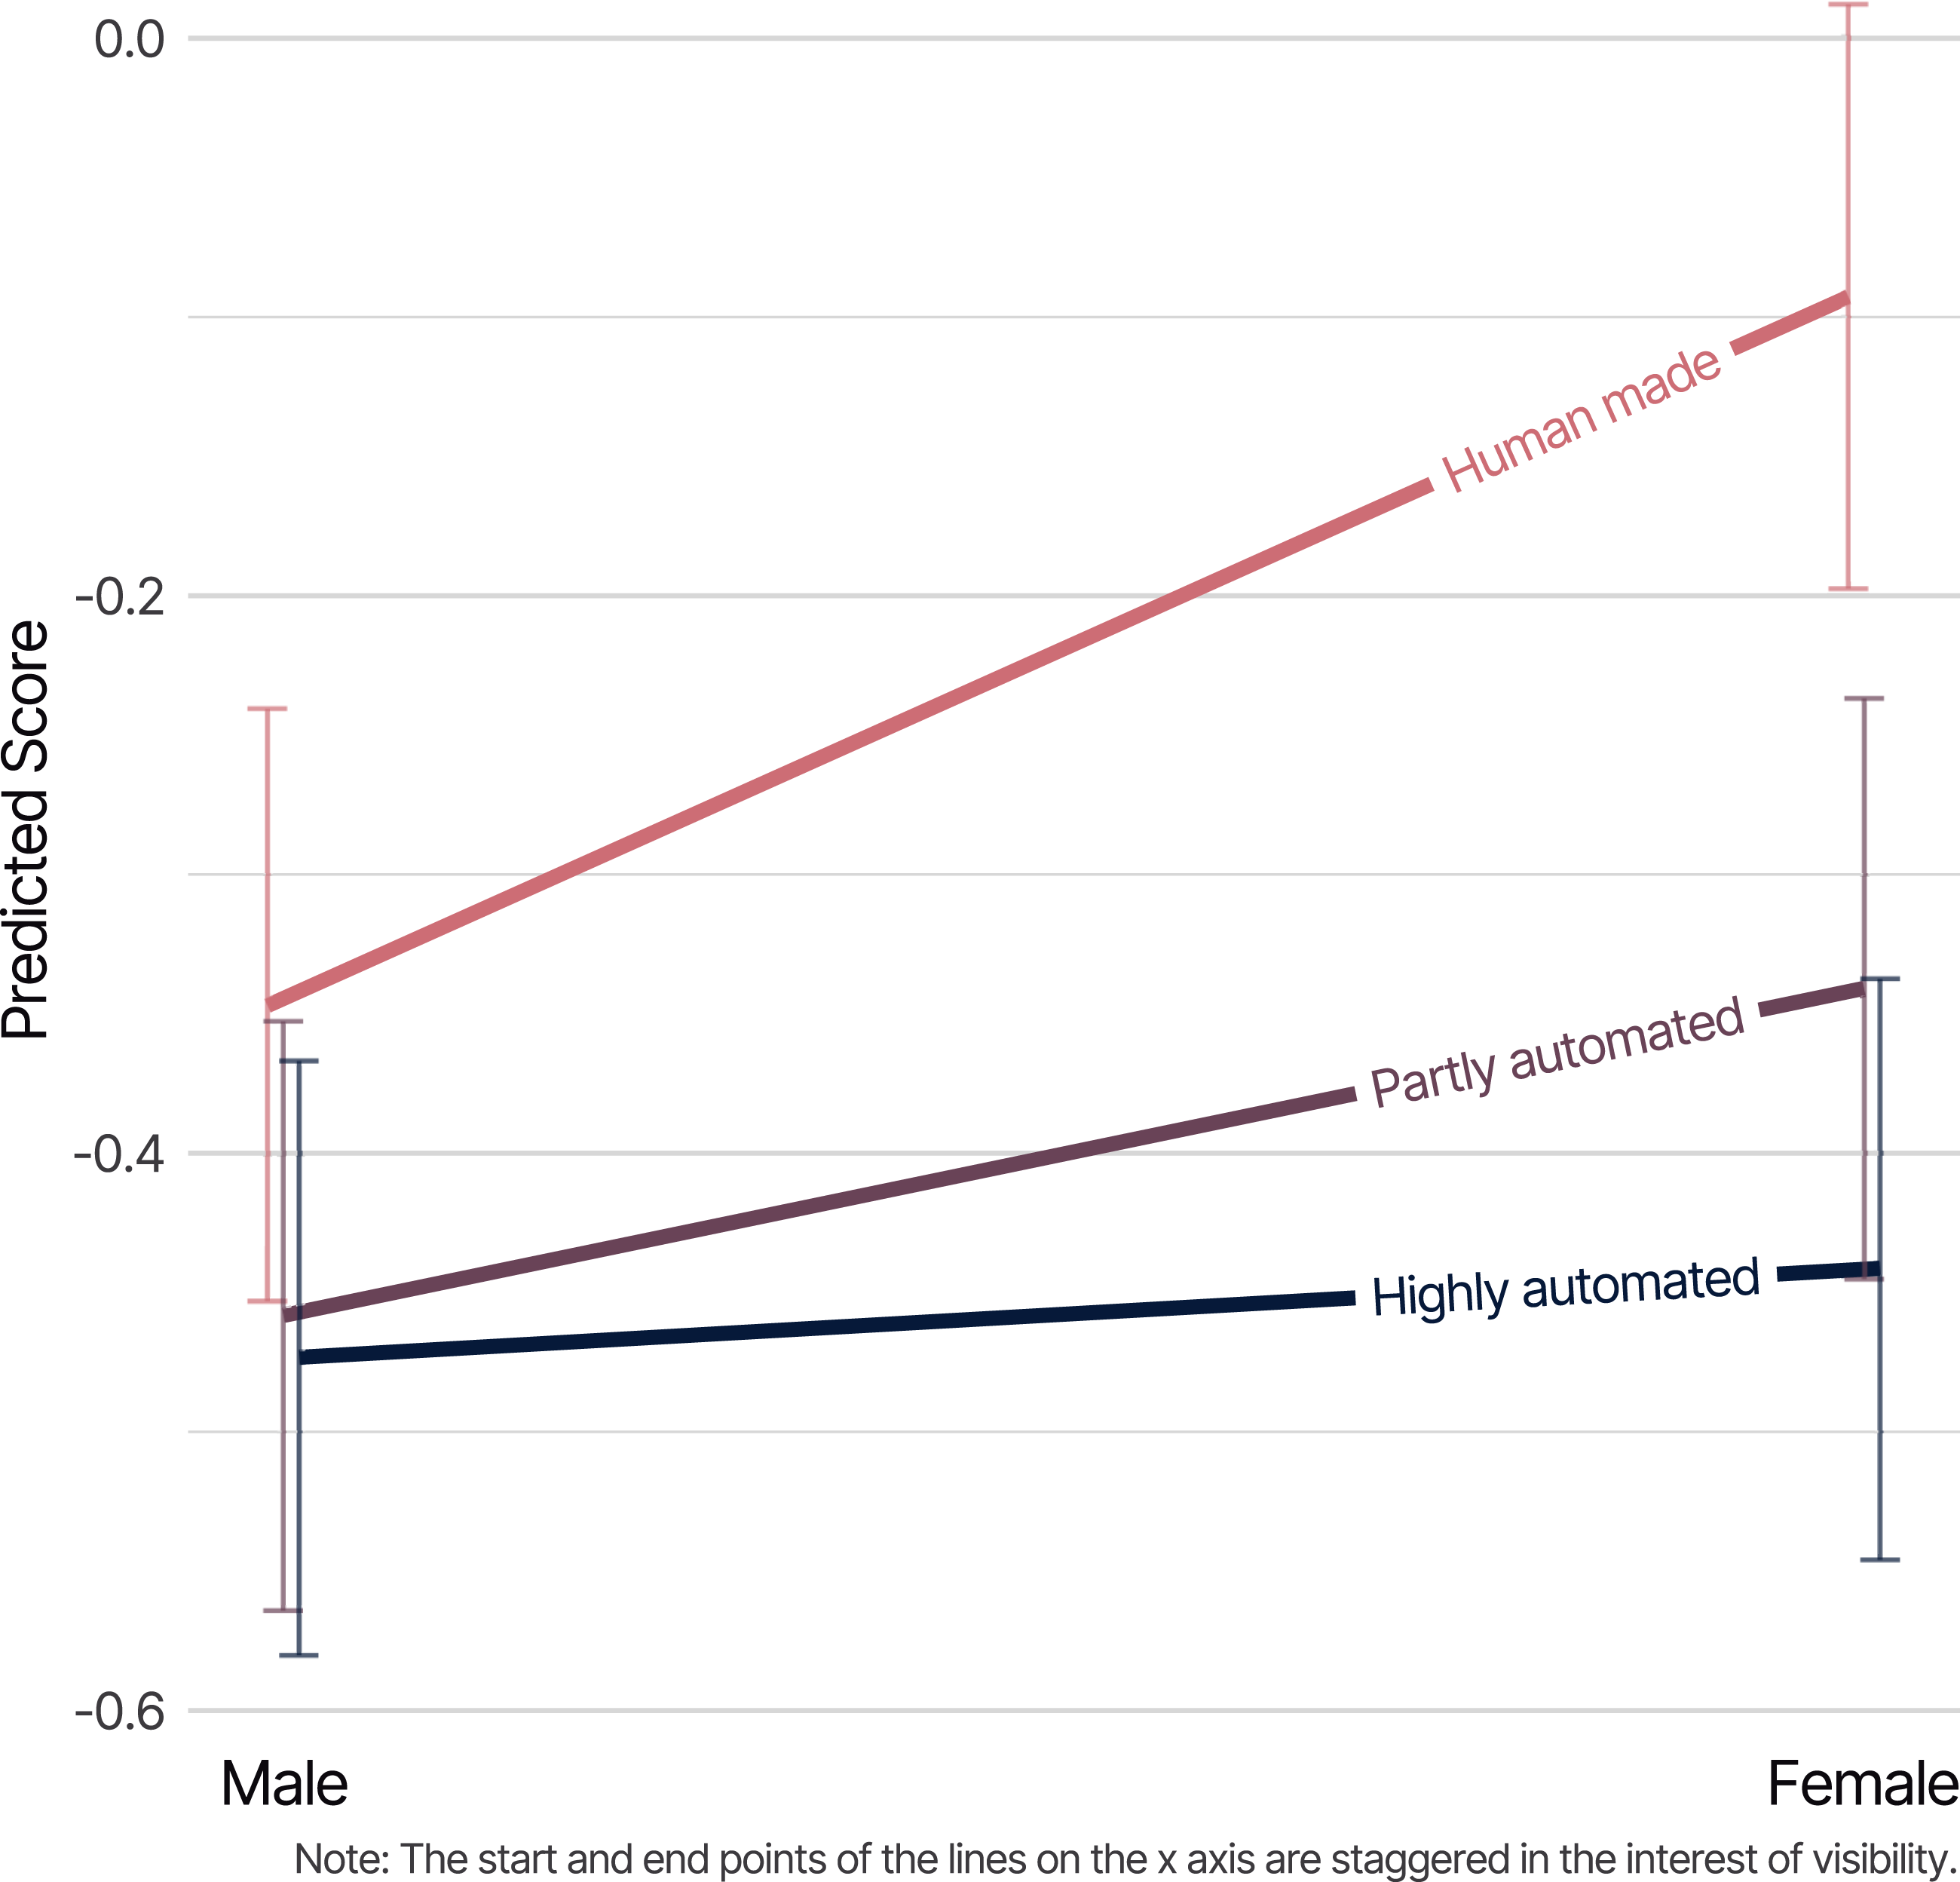
Discussion and conclusion
This article advances knowledge about the perception of automated journalism in several ways. Firstly, and in general terms, we explore an apparently unresearched manifestation of the phenomenon, news video automation, and provide a starting point for further research on audiences’ reactions to the expansion of automation into audio-visual news formats.
Secondly, we employ a more rigorous methodology than has been seen in the literature to date. Consequently, our results have unprecedented validity and are also able to provide methodological guidance for future studies on the perception of automated journalism. Specifically, in our use of a 14 (story topic) × 3 (level of automation) experimental design we were able to include an unusually large range of stimuli, enabling us to examine variations by story topic—potentially a confounding variable. The variation that our results show by topic—for example, our set of Donald Trump videos had statistically significant contrasts between the highly automated, partly automated, and human videos for 10 evaluation items, while the sets of videos on the Elon Musk and 5G stories had none—carries a stark take-home message for other researchers. Relying on one or two sets of stimuli, as some other studies (see, e.g., Clerwall, 2014; Graefe et al., 2018; Jung et al., 2017; Li et al., 2022) have done, is highly problematic. If we had used only the set of Trump videos or only the sets of 5G and Elon Musk videos for our experiment, then our study would have arrived at quite different conclusions. Our results are, therefore, an important reminder that, as Jackson and Jacobs (1983) pointed out 40 years ago, “generalization about a whole category of messages [such as automated or human journalism] requires careful analysis of multiple members of the category”, because “any particular message chosen to represent any message category must be assumed to differ from other members of the category in unknown and indefinitely numerous ways” (171).
Thirdly, our results contain lessons for those making short-form news videos with—and without—the assistance of automation. The characteristics of the automated videos included in our experiment were influenced by both the developers of the automation software’s backend and the operators of its frontend. Relevant to both are the lessons to be learned about: (1) matching videos’ textual content—in our case the captions—to its visual context and the importance of the (2) relevance, (3) quality, and (4) variety of the images included in the videos. Our results show that, in the eyes of our respondents, the automated videos performed significantly worse than the fully manually made ones in these four areas. However, our results suggest that one of these deficiencies was eliminated by human post-editing. Specifically, a significantly higher proportion of respondents thought that “Most or all images and/or moving footage related well to the story” in the fully human-made videos than they did in the highly automated videos. However, for the partly automated videos (which were created by post-editing the highly automated videos) that difference disappeared.
Other deficiencies with the automated videos, such as the quality and variety of images they included, were not eliminated by post-editing. This may have been because the quality and variety of images that appeared in the automated videos were, in part, determined by the particular image libraries the software had—or did not have—access to.
The influence that the frontend operators of automation software can have on how its output is evaluated is hinted at elsewhere in our results. A significantly higher proportion of respondents thought that the “music was suited to the news story” in the fully human-made videos than in the ones made with automation. The software used to produce the automated videos required the frontend operator to manually choose music to accompany the videos from the tracks made available within the interface. Our results suggest that our selections of music to accompany the automated videos may have been inferior to those of the professional journalists at PA Media behind the human-made videos.
Overall, our results demonstrate how audiences’ relative evaluations of news produced with and without automation are influenced by design decisions taken by backend software developers (e.g. the algorithms that match images to text), the data that the software can draw on (e.g. the quality and variety of images available to be matched to text), parameters set by the software’s frontend operators prior to the automation (e.g. the choice of music track to accompany the video), and human post-editing of the automated output (e.g. changing images contained in an automated video to make them more relevant to the story).
The influence of such post-editing on the perception of automated news has barely been explored by researchers (for an exception, see Wölker and Powell, 2021). Our results confirm the importance of such explorations and extend them from the textual to the audio-visual. Furthermore, our results lead us to encourage future researchers to also consider the ex ante decisions taken by frontend operators and backend developers. By doing so, research on the relative perceptions of automated and human-made journalism can move beyond reporting how perceptions differ on comparisons of generic measures like “quality”, “expertise”, “likeability”, “coherence”, and “clarity” (for an overview see Stalph et al., 2023) and start to investigate evaluations (and the effects thereof) of the results of specific steps taken in news workflows. By doing so, researchers will be able to provide a more nuanced understanding of the nature and effects of news automation and make suggestions for how its developers and operators can better meet the needs of their audiences. We hope this study has contributed to this endeavour.
Supplemental Material
Supplemental Material - Audience evaluations of news videos made with various levels of automation: A population-based survey experiment
Supplemental Material for Audience evaluations of news videos made with various levels of automation: A population-based survey experiment by Neil Thurman, Sally Stares, and Michael Koliska in Journalism
Footnotes
Acknowledgements
The authors would like to thank the staff of Wibbitz, PA Media, and Ipsos—especially Pete Clifton, Peter Cooper, Zohar Dayan, Sonia Gupta, Hilary Kay, Daniel Marshall, Joe Pickover, Alex Rothwell, and Steven Watt—for their support and Ina Schulte-Uentrop at LMU Munich, Dr Ricky Wong at the University of Hertfordshire, Professor Jouni Kuha at the London School of Economics and Political Science, and Dr Cara Thompson for their assistance.
Declaration of conflicting interests
The author(s) declared no potential conflicts of interest with respect to the research, authorship, and/or publication of this article.
Funding
The author(s) disclosed receipt of the following financial support for the research, authorship, and/or publication of this article: This work was supported by the Volkswagen Foundation (88171-1).
Supplemental Material
Supplemental material for this article is available online.
Notes
Author biographies
References
Supplementary Material
Please find the following supplemental material available below.
For Open Access articles published under a Creative Commons License, all supplemental material carries the same license as the article it is associated with.
For non-Open Access articles published, all supplemental material carries a non-exclusive license, and permission requests for re-use of supplemental material or any part of supplemental material shall be sent directly to the copyright owner as specified in the copyright notice associated with the article.