
Abstract
Creep failure poses a potential risk in dissimilar welded joints between aluminum and titanium alloys, potentially compromising the joint's integrity. This study utilizes laser beam welding (LBW) to achieve dissimilar joining of AA7075 and Ti6Al4V by incorporating an Ag interlayer. The role of Ag interlayer for dissimilar joining of AA7075 and Ti6Al4V alloys and its impact on the microstructure and nanocreep behavior of joints is examined. The findings showed that the use of Ag decreased the interaction of Ti/Al considerably with each other which led to a reduction in the formation of brittle intermetallic compounds. The nanohardness and atomic force microscopy (AFM) results indicated that the Ti6Al4V HAZ exhibited the highest hardness and least plastic deformation, owing to the formation of α′ martensite. The nanoindentation creep analysis revealed the highest stress exponent value in Ti6Al4V HAZ, pointing to a dislocation climb creep mechanism. Additionally, the results also suggested that the observed creep mechanism might be attributed to both diffusional creep and dislocation climb for other zones.
Introduction
The current industrial trend is moving toward the manufacturing of multifunctional components through the integration of various similar and dissimilar materials.1–4 This has brought a significant focus on the welding and joining of dissimilar alloys, which is essential in the fabrication of hybrid structures.5,6 These attributes make the combination of titanium- and aluminum (Ti/Al)-based dissimilar alloy joints particularly advantageous in various industrial applications.7–13 For example, in the design of aero-engine compressors, using a transition joint between titanium alloys and aluminum alloys is a strategy to reduce overall engine weight.14–16 These joints utilize the strengths of both alloys to enhance equipment performance, save material costs, and improve design efficiency. However, a general challenge arises from the formation of brittle Al-/Ti-intermetallic compounds (IMCs) when directly joining these two alloys.17–20 This issue can be addressed by selecting an appropriate welding process, adjusting the input process parameters, and incorporating a suitable metallic interlayer between the base alloys.21–23
Failures in dissimilar alloy joints during service are common and can be attributed to various factors. Differences in microstructural and mechanical characteristics at the weld joint, combined with varying coefficients of thermal expansion (CTE) between the alloys, can lead to creep at the interface. Additionally, the presence of significant residual stresses, arising from disparities in chemical composition, thermal conductivity, and melting points, as well as metallurgical incompatibility, can adversely affect the creep behavior of these joints. 24 Creep resistance is critical for the proper performance of a structure; if creep deformation surpasses the critical failure deformation outlined in the design specifications, the component may no longer operate safely. 25 Therefore, it is of utmost importance to conduct thorough investigations into the creep deformation behavior of dissimilar welded joints. Creep refers to the deformation of a material that occurs over time when it is subjected to a constant stress, which is below its yield strength, and maintained at a steady temperature. Li et al. 26 observed that during nanoindentation tests, a phenomenon known as indentation creep can occur. This type of creep is noted to happen at temperatures ranging from room temperature up to half the melting point of the metallic materials, denoted as 0.5 Tm.
The nano-indentation experiment is a widely recognized nondestructive testing method used to measure the mechanical properties of various materials, including bulk materials, coatings, thin films, and others. A notable application of this technique is in performing indentation creep testing. 27 Unlike traditional macroscopic creep deformation tests, which typically involve uniaxial compression or tension, nanoindentation creep testing is considered a quick, reliable, convenient, and nondestructive method for examining the micro- and nanomechanical properties of different materials.28,29 In these tests, the creep properties of a small volume of material near the indenter tip are analyzed. The loading rat development of laser beam welded aluminum drill pipe for drilling applications in nanoindentation is significantly faster than micro- and macro-indentation, typically two to three orders of magnitude, and the stress experienced beneath the indenter is much more complex compared to that in conventional creep tests. 26
The mechanical strength of welds is closely linked to the diverse microstructures that develop across various metallurgical and welding zones. To explore the creep resistance of welded alloys, where the microstructural variations are more distinct, the nanoindentation technique has been employed. Nguyen et al.30,31 utilized the rate-jump method in their study of the strain rate sensitivity in welded joints of SM 490 and SS 400 structural steels. They conducted this study through nanoindentation under low-cycle fatigue loading conditions. Their findings indicated that an increase in strain rate during indentation correlates with an increase in both yield strength and indentation hardness. In a separate study, Gao et al. 32 examined the creep behavior of P92 steel weld joints after creep–fatigue loading using nanoindentation. They observed that the fine-grained heat-affected zone exhibited lower hardness and creep resistance compared to other areas of the weld joint. Similarly, Song et al. 33 applied nanoindentation to assess creep deformation in various zones of SA508Gr3 steel-welded joints. Notably, the application of nanoindentation to study weldments of titanium and aluminum-based alloys has yet to be explored.
In the current study, nanoindentation is applied to the weld joint consisting of AA7075 BA (base alloy) and Ti6Al4V BA with a Silver (Ag) interlayer, to reveal the complex metallurgical reactions occurring. Using Ag as an interlayer in the laser welding of Ti6Al4V and AA7075, instead of other metals, offers specific advantages due to its unique properties. The exceptional thermal conductivity of Ag ensures efficient heat distribution, reducing thermal gradients that can cause weld defects. Unlike other metals that might react unfavorably with either Ti or Al, Ag minimizes the formation of brittle IMCs, enhancing weld quality. Its relatively low melting point allows for better welding process control, facilitating the formation of a robust joint without excessive heat input that could degrade the base materials. Additionally, the good electrical conductivity and corrosion resistance of Ag are beneficial in applications where these properties are critical. In comparison, other metals might not offer this balanced combination of thermal properties, compatibility, and performance, making Ag a preferred choice for achieving high-quality welds between Ti6Al4V and AA7075. This study involves conducting nanohardness line scans and creating nanohardness maps, along with measuring the creep behavior in these specific regions through nanoindentation. This approach is designed to provide detailed insights into the localized mechanical properties and creep resistance of the materials in the vicinity of the weld joint.
Materials and methods
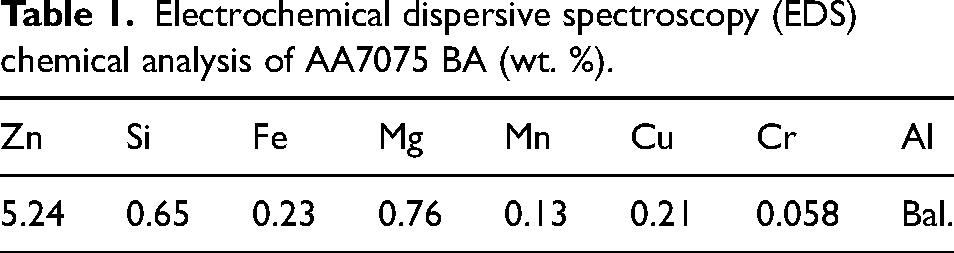
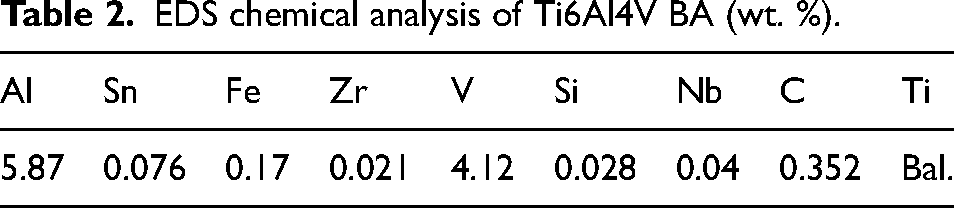
AA7075 and Ti-6Al-4V annealed sheets were joined through the LBW technique. These sheets had dimensions of 80 × 50 × 1.6 mm. A silver (Ag) foil interlayer, approximately 380 µm thick, was utilized between the sheets of AA7075 and Ti-6Al-4V. The chemical compositions of these alloys, determined by EDS, are displayed in Tables 1 and 2. Figure 1 illustrates that the welding was performed in a butt configuration. For this study, the optimal parameters for the laser welding process were established through initial experiments, and the optimized parameters are shown in Table 3. For reproducibility and reliability of the findings, three specimens were manufactured. These samples were used in order to validate the consistency of the mechanical properties.
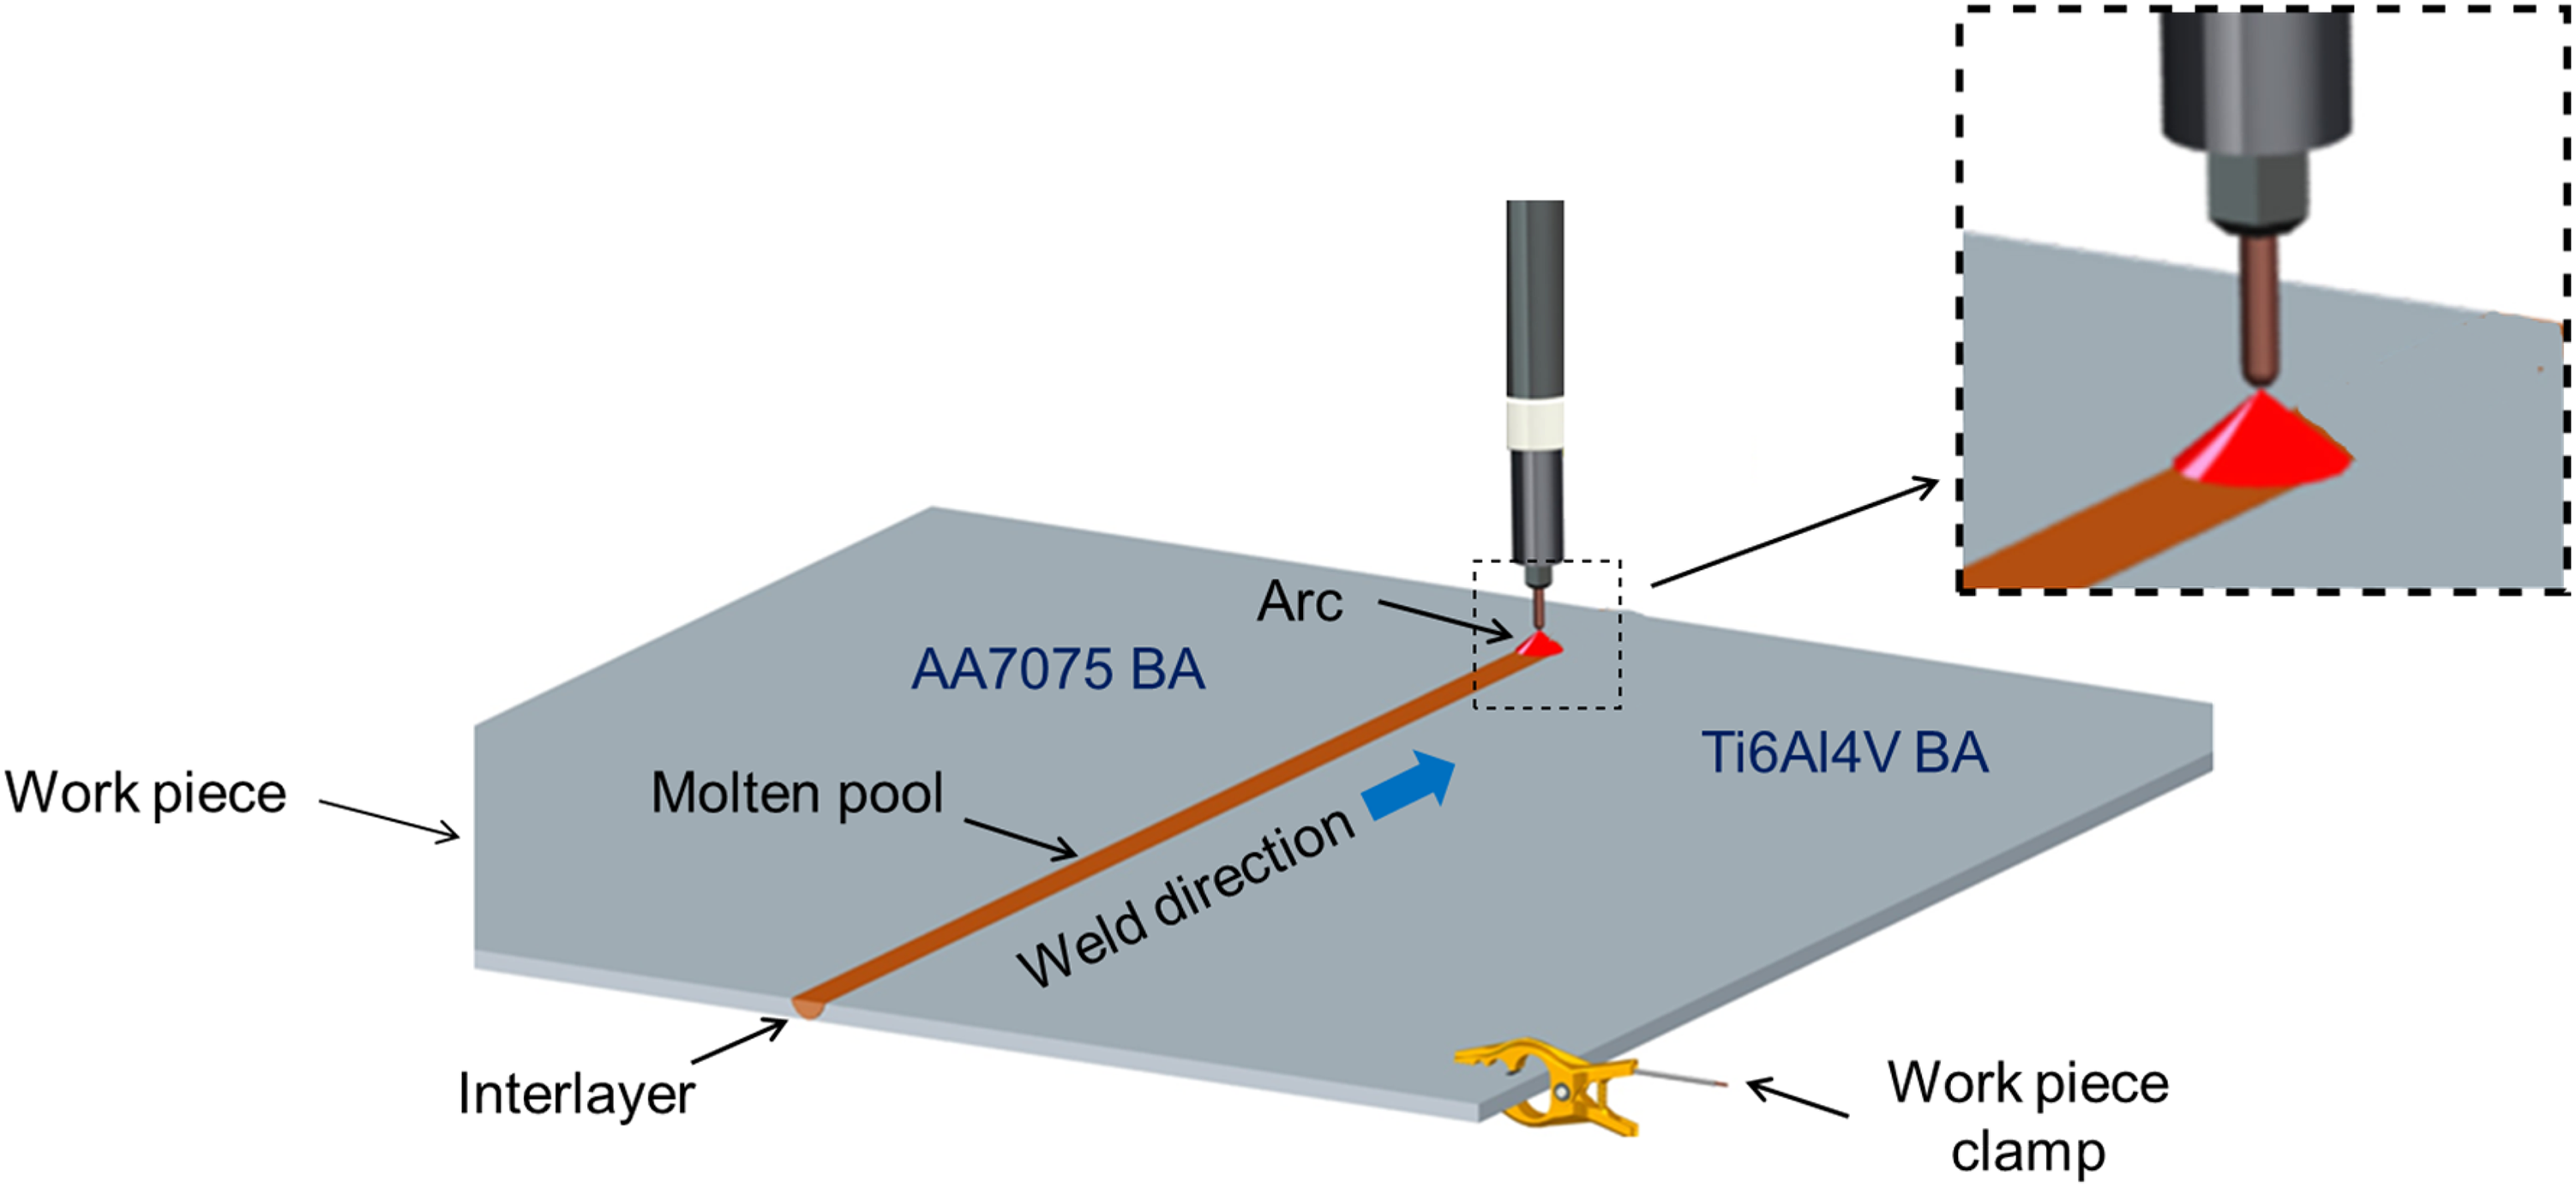
Schematic diagram of laser welding of AA7075 BA and Ti6Al4V with Ag interlayer.
Electrochemical dispersive spectroscopy (EDS) chemical analysis of AA7075 BA (wt. %).
EDS chemical analysis of Ti6Al4V BA (wt. %).
Optimized laser welding parameters.
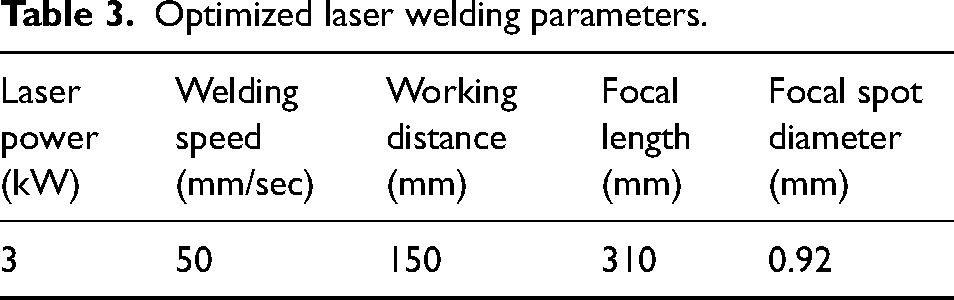
The welding was conducted using a fiber laser, specifically the IPG Photonics Ytterbium Laser Systems model YLS-3000-ST2. This class 4 laser can produce 3 kW of peak power. It functions by producing continuous wave emissions at a wavelength of 1070 nm. The connection between the laser source and the BIMO HIGHYAG laser head is established through advanced optical fibers with a 600 µm diameter. The laser head is equipped with a lens of 310 mm fixed focal length and includes a focusing module with a Mfoc value of 1.50, along with an adjustable zoom collimator. This setup results in a circular laser focus, varying in diameter from 0.3 to 1.53 mm, based on the interaction of the focusing module, collimation module, and the fiber's diameter. This interrelation is quantitatively explained in equation (1).
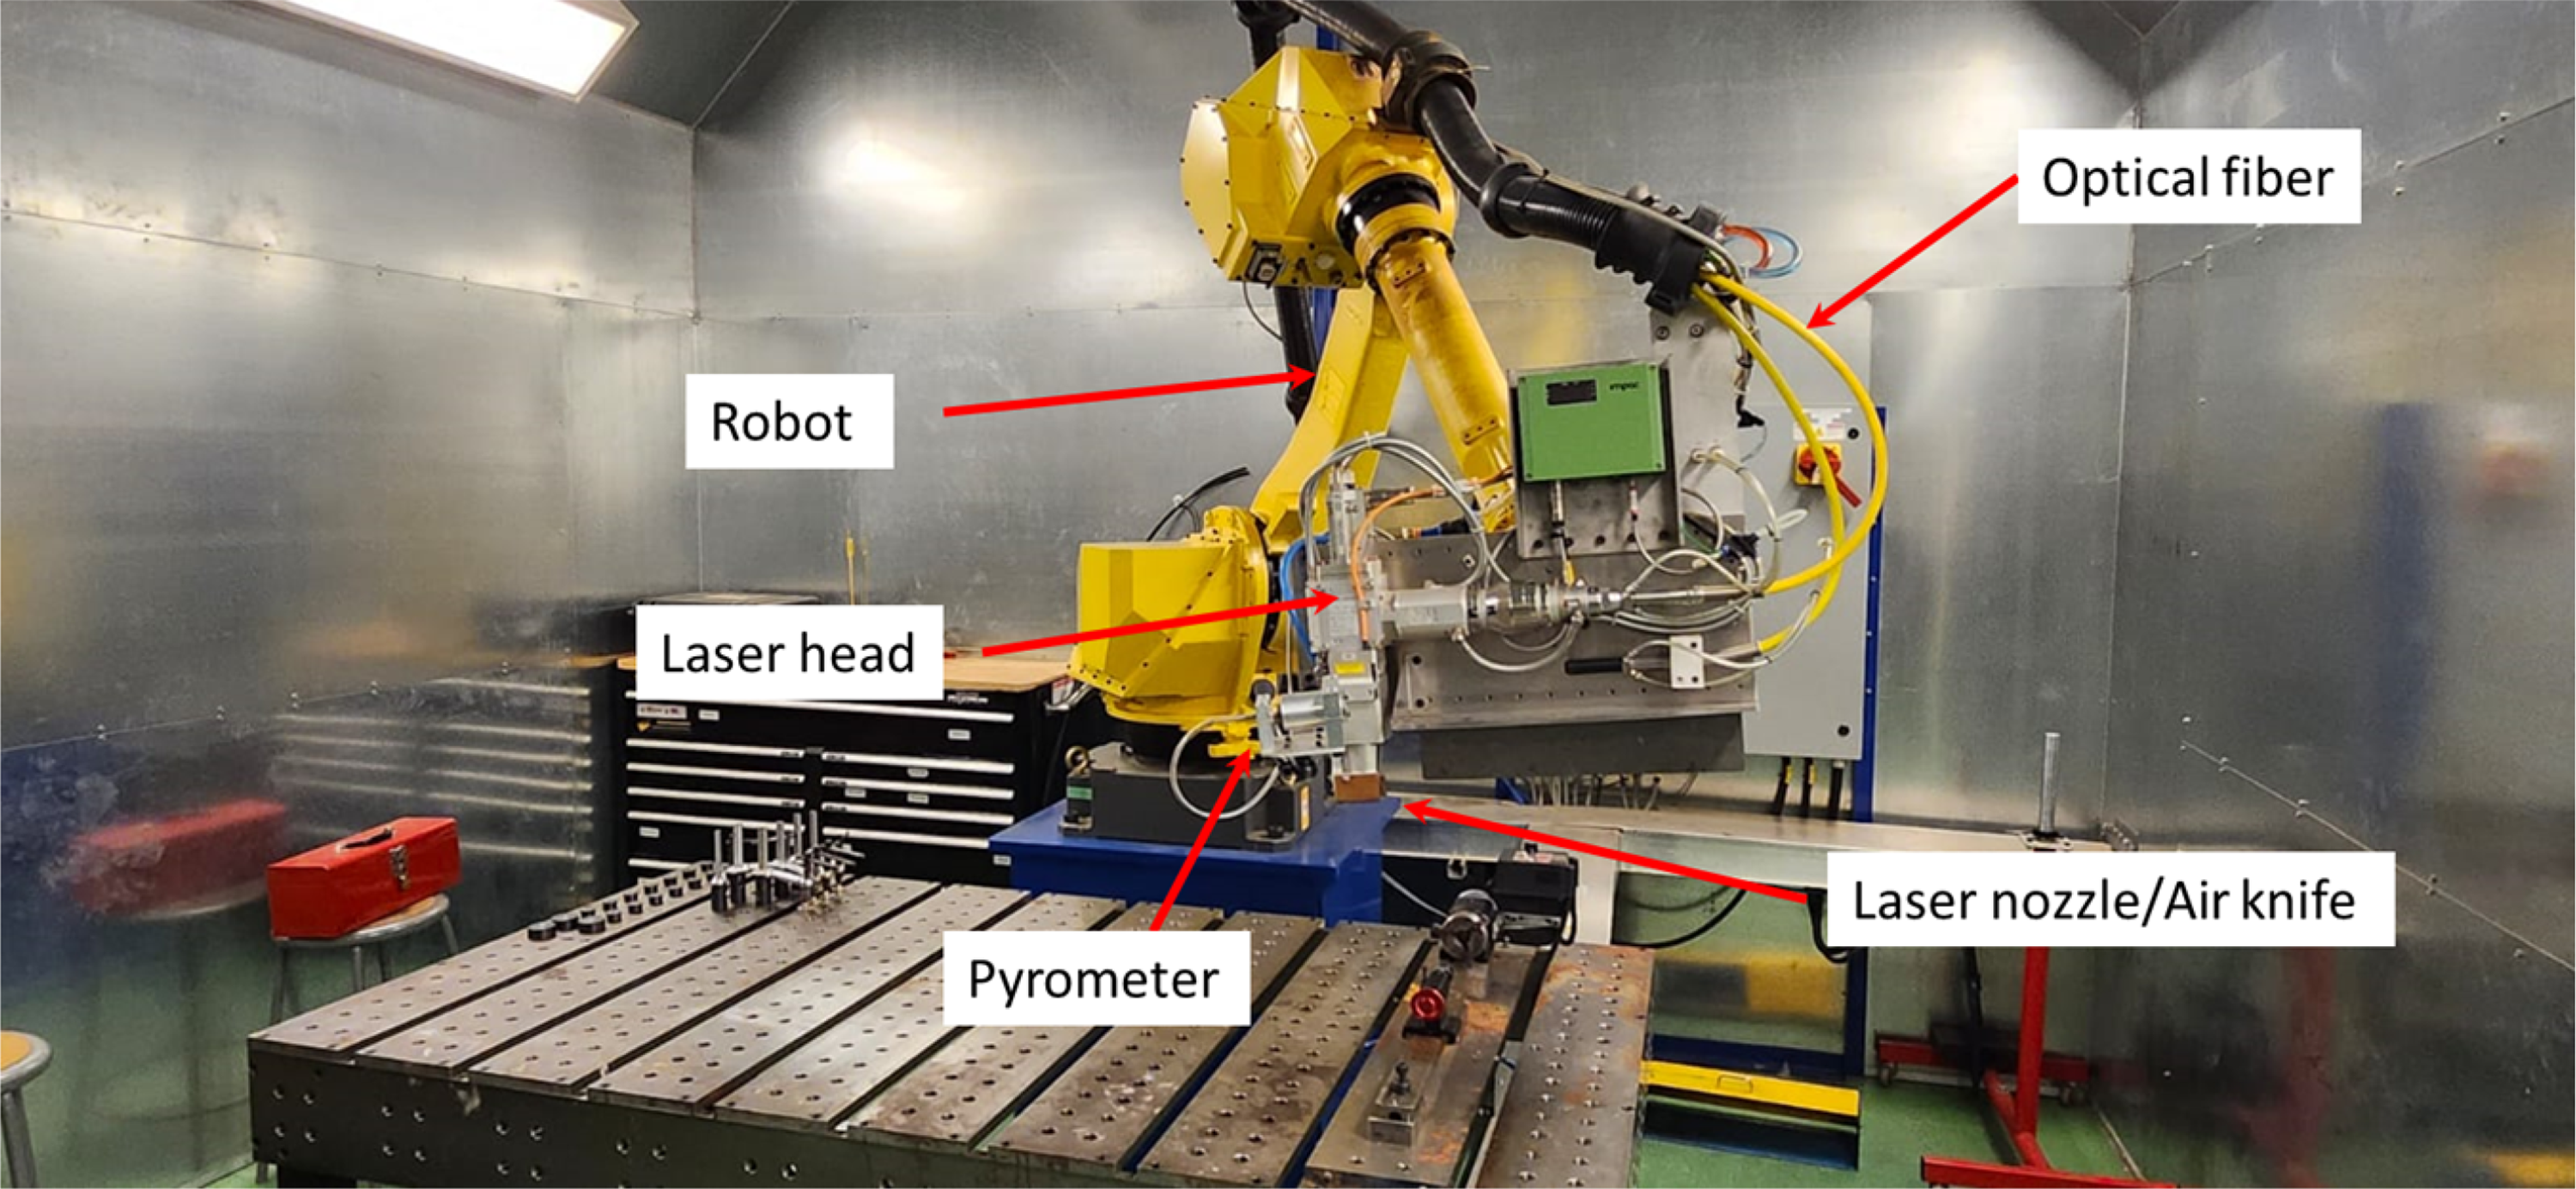
Laser unit (3000 W: model YLS-3000-ST2) installed on a six-axis FANUC robotic arm.
Wire electrical discharge machining (EDM) was employed for preparing samples for microhardness testing, nanoindentation, and metallography study. The weldments for microstructural examination and nanoindentation assessments were mounted, then subsequently abraded using SiC paper ranging from 220 to 4000 grit sizes. A final polish was achieved using 0.25 mm diamond paste on a microcloth. These prepared samples were then analyzed using an Olympus BH2-UMA optical microscope to assess grain morphology in the microstructure. Microhardness profiles were recorded using a Tukon-300 microhardness tester, applying a 200 gf load, and a 10 s dwell time.
Room temperature nanoindentation tests were conducted using a nanoindenter in a load-controlled mode. The specimens’ elastic moduli and nanohardness were determined by applying a 200 mN constant load with a Berkovich tip, with the maximum load and strain rate set at 200 mN and 0.1 s−1, respectively. To assess creep depth changes over time, the indentation tip was held in place for 200 s. Drift velocity was then monitored by decreasing the load to 90% and shortening the hold time to 40 s. After unloading the indenter from the sample surface, nanohardness and elastic modulus values were calculated using the established.
34
Additionally, the nanoindentation strain rate was determined following the approach outlined by Reference
35
as expressed in equation (2).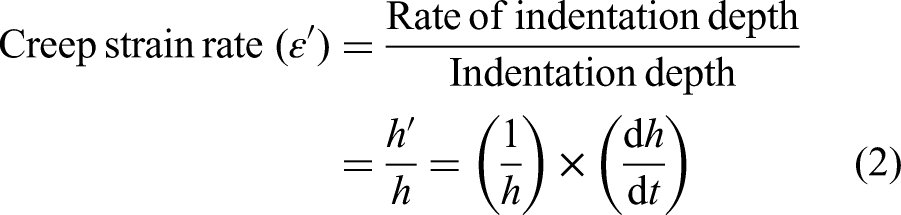

The power–law relationship is employed specifically for estimating the creep stress exponent during the stable or secondary creep phase. This relationship between stress and creep strain rate is documented in the literature as an effective method for analyzing creep behavior at room temperature. The expression for the power–law relationship is given in equation (5) as detailed by
37
:
Results and discussion
Physical appearance of weldment
Figure 3 displays a representative image of the top and bottom surface of the weld bead, revealing that the weld bead was free from contamination and had a bright appearance. Titanium and aluminum alloys are known for their tendency to react with atmospheric oxygen at high temperatures during welding, leading to oxide formation that can degrade weld joint quality, as referenced in the literature.39–41 The degree of oxidation in the weld pool can be inferred from the bead's color. 39 The bright silvery appearance of the weld bead in Figure 3, in contrast to blue and purple, indicates minimal contamination in the weld pool.42,43
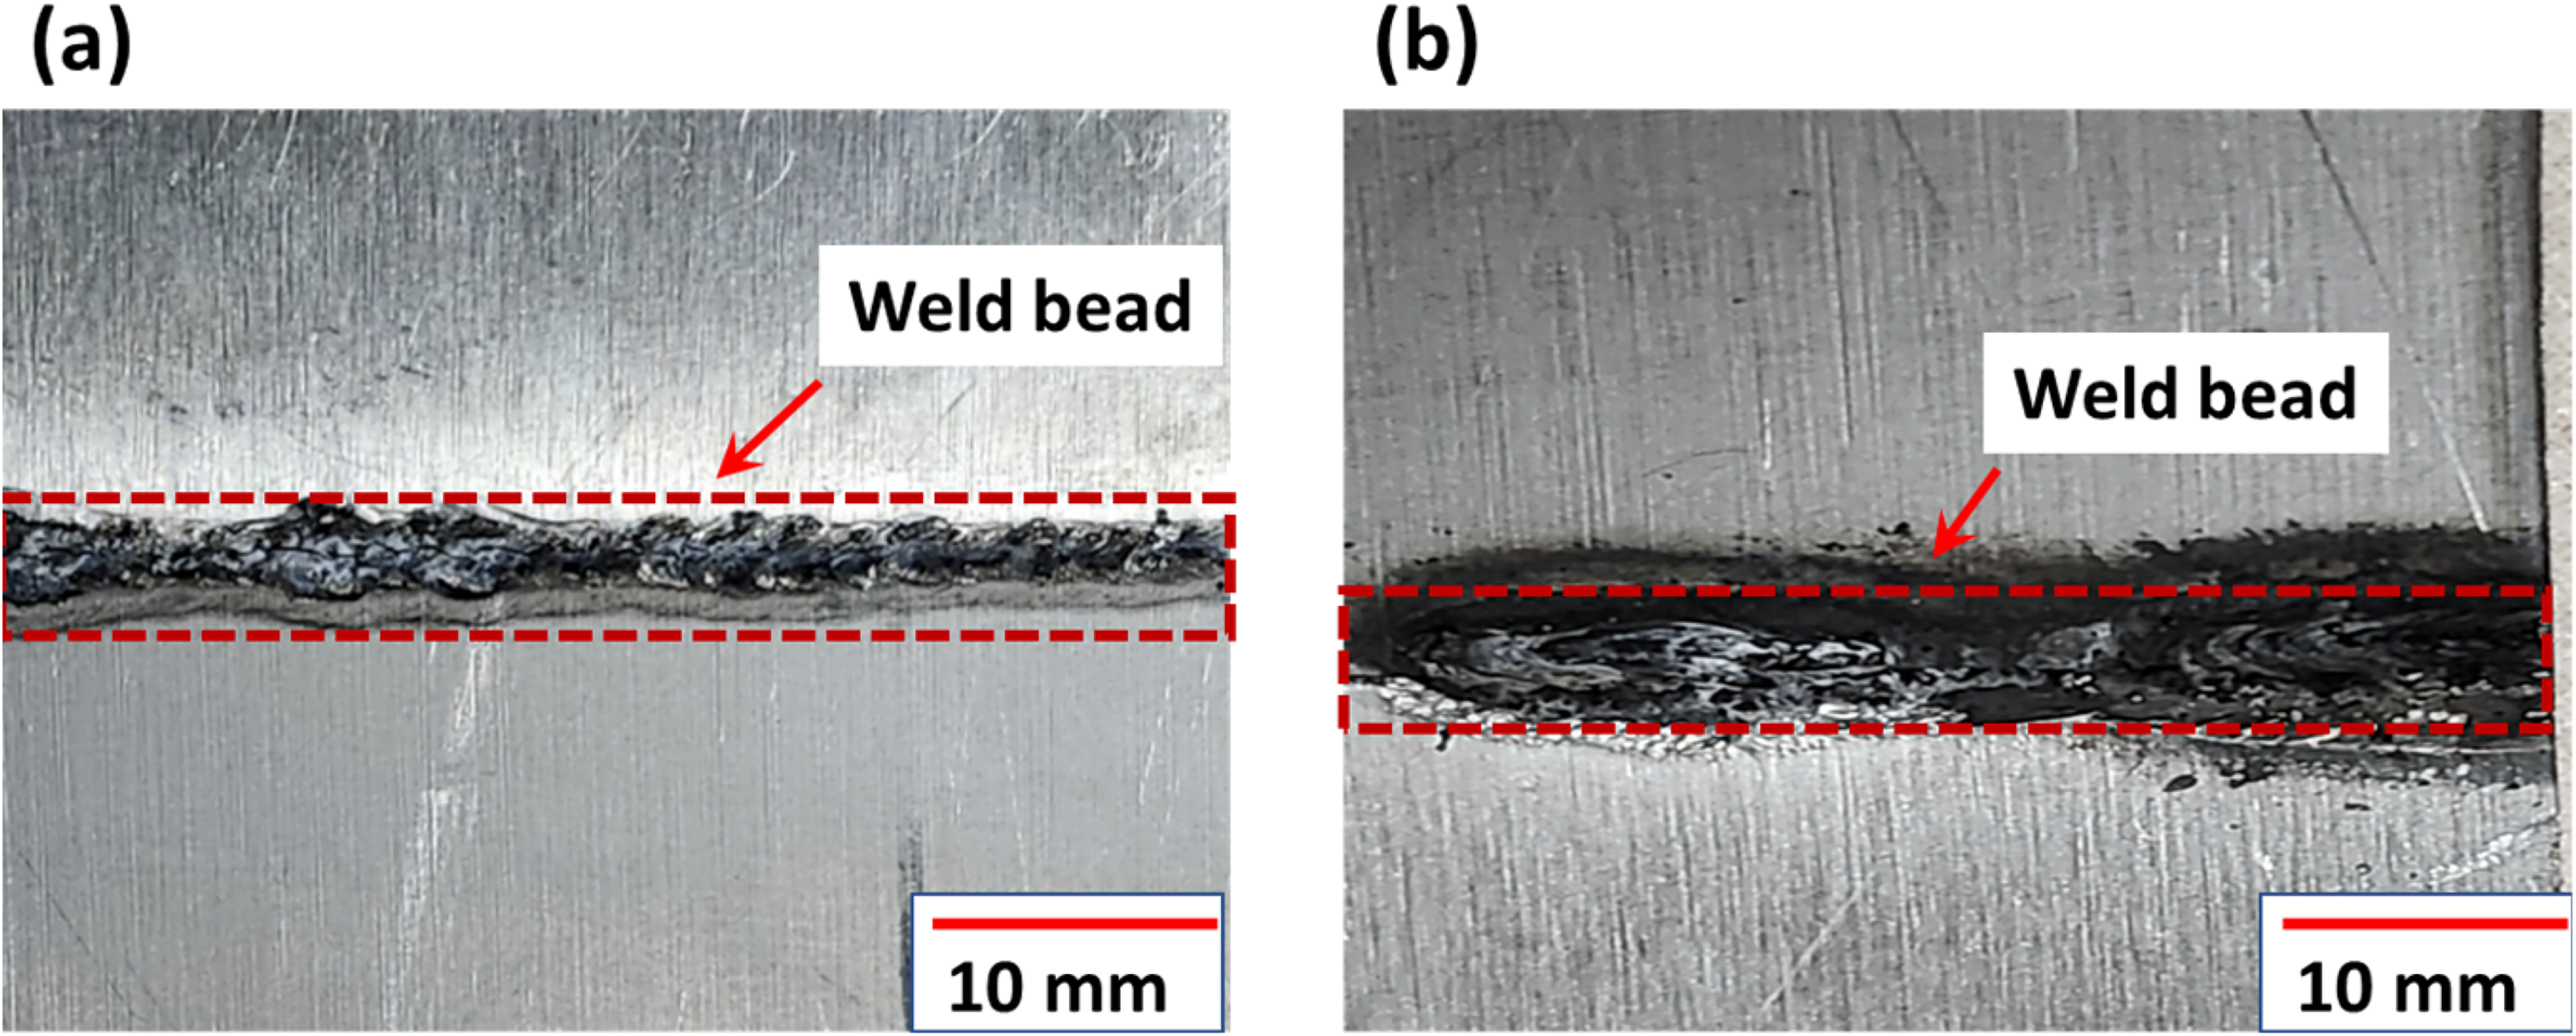
Surface appearance (a) top surface of the weldment and (b) bottom surface of the weldment.
Microstructural analysis
In this study, 1.6 mm thick Ti-6Al-4V and AA7075 aluminum alloy sheets were welded, incorporating a 380 µm thick Ag interlayer. The AA7075 alloy's microstructure is predominantly a globular aluminum cubic (fcc) phase with minor pits, likely from MgZn2 precipitate removal during etching, as seen in Figure 4(a). Figure 4(a) shows a micrograph of AA7075 BA, and as indicated by the label “Precipitates,” it is meant to show areas where precipitates are present within the metal's matrix. As mentioned earlier, the aluminum alloy showed minor pits from precipitate removal, suggesting that during the preparation or etching of the sample for microscopy, some precipitates may have been dislodged, leaving behind small pits or voids. Figure 4(a), therefore, shows the actual precipitates rather than the pits left by any removed ones. This indicates that there are both intact precipitates within the material as well as areas where precipitates have been removed, although only the former is labeled in Figure 4(a). The Ti-6Al-4V alloy primarily consists of equiaxed hexagonal close-packed (hcp) α-phase grains with some intergranular cubic body-centered cubic (bcc) β-phase, as illustrated in Figure 4(b). Figure 5 shows the overall microstructural changes due to the dissimilar welding of Ti-6Al-4V and AA7075. Using Ag as an interlayer modified the alloy composition during welding, minimizing crack susceptibility. The partly melted Ti-6Al-4V area near the fusion zone, depicted in Figure 6(a), shows distinct microstructural and property differences, termed macrosegregation. This phenomenon relates to the base materials’ liquidus temperature and the weld pool. The laser beam's high energy density partially melts the Ti-6Al-4V, causing it to flow toward the melt pool due to Marangoni effect-driven convection, solidifying into partly melted Ti-6Al-4V islands. After welding, rapid cooling forms a modified α-phase with needle-like morphology on the Ti-6Al-4V side. Rapid cooling also produces fine acicular α, resembling needle-like martensite in the Ti-6Al-4V's heat-affected zone (HAZ). Figure 6(b) shows IMC layers and dendrites at the Al/Ti interface. During cooling, Ti atoms solidify on the dendrite surfaces, forming Ti-enriched IMC dendrites. Figure 6(b) displays IMCs in the fusion zone (FZ), likely from disrupted columnar dendritic IMCs in the melt pool. Si-segregation near grain boundaries forms Al-Si eutectics, seen as dark lines in Figure 6(c), where small black Mg-Zn particles along α-Al grain boundaries enhance AA7075's mechanical properties through precipitation strengthening. The weld's thermal cycle dissolves precipitated phases in the HAZ into the aluminum alloy matrix, as observed in Figure 6(c).
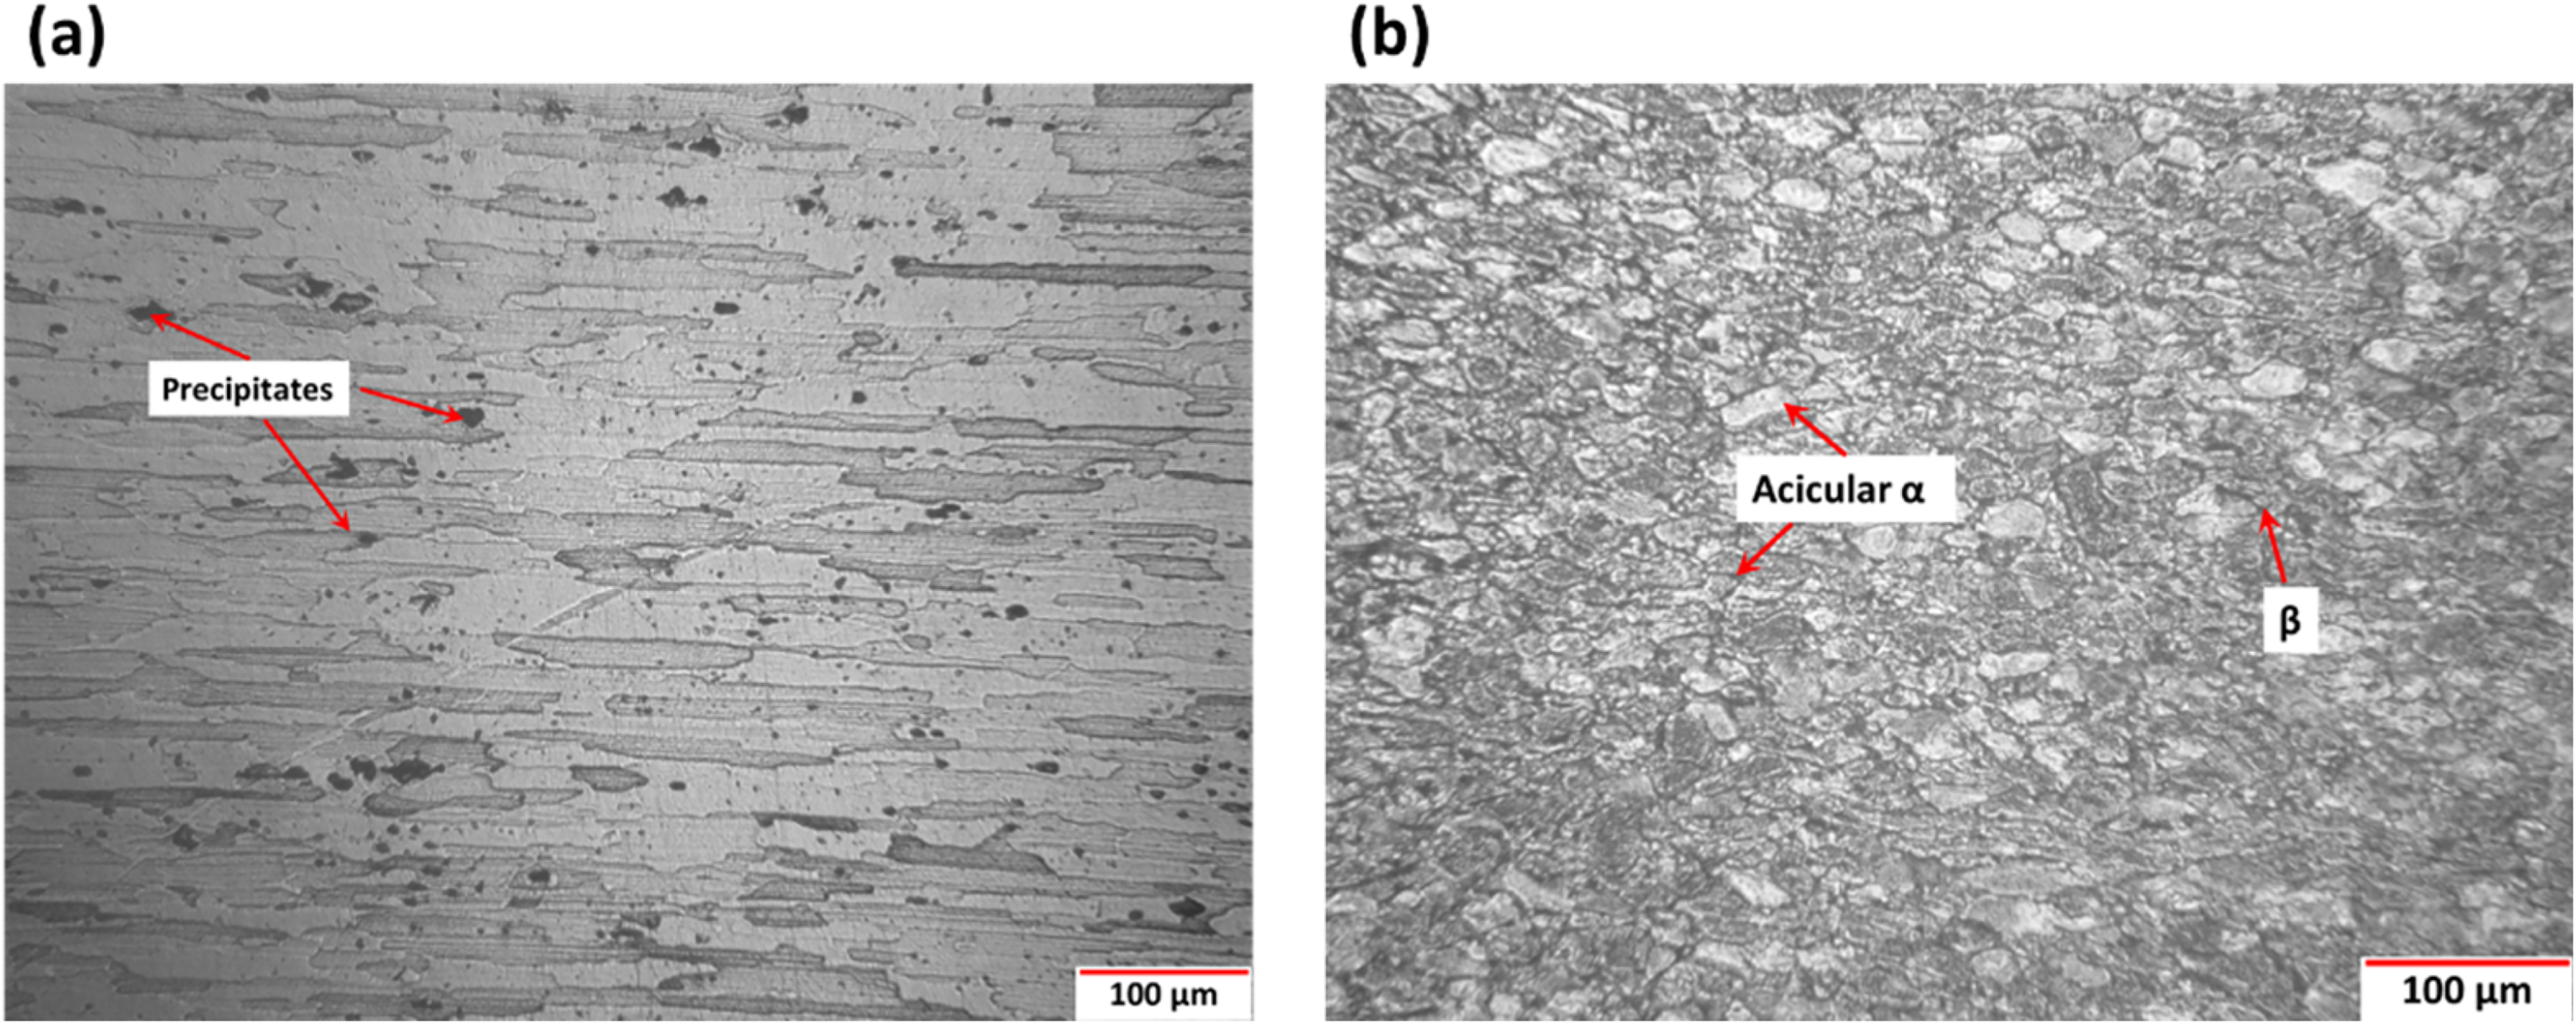
(a) Microstructure of AA7075 BA, (b) microstructure of Ti6Al4V BA.
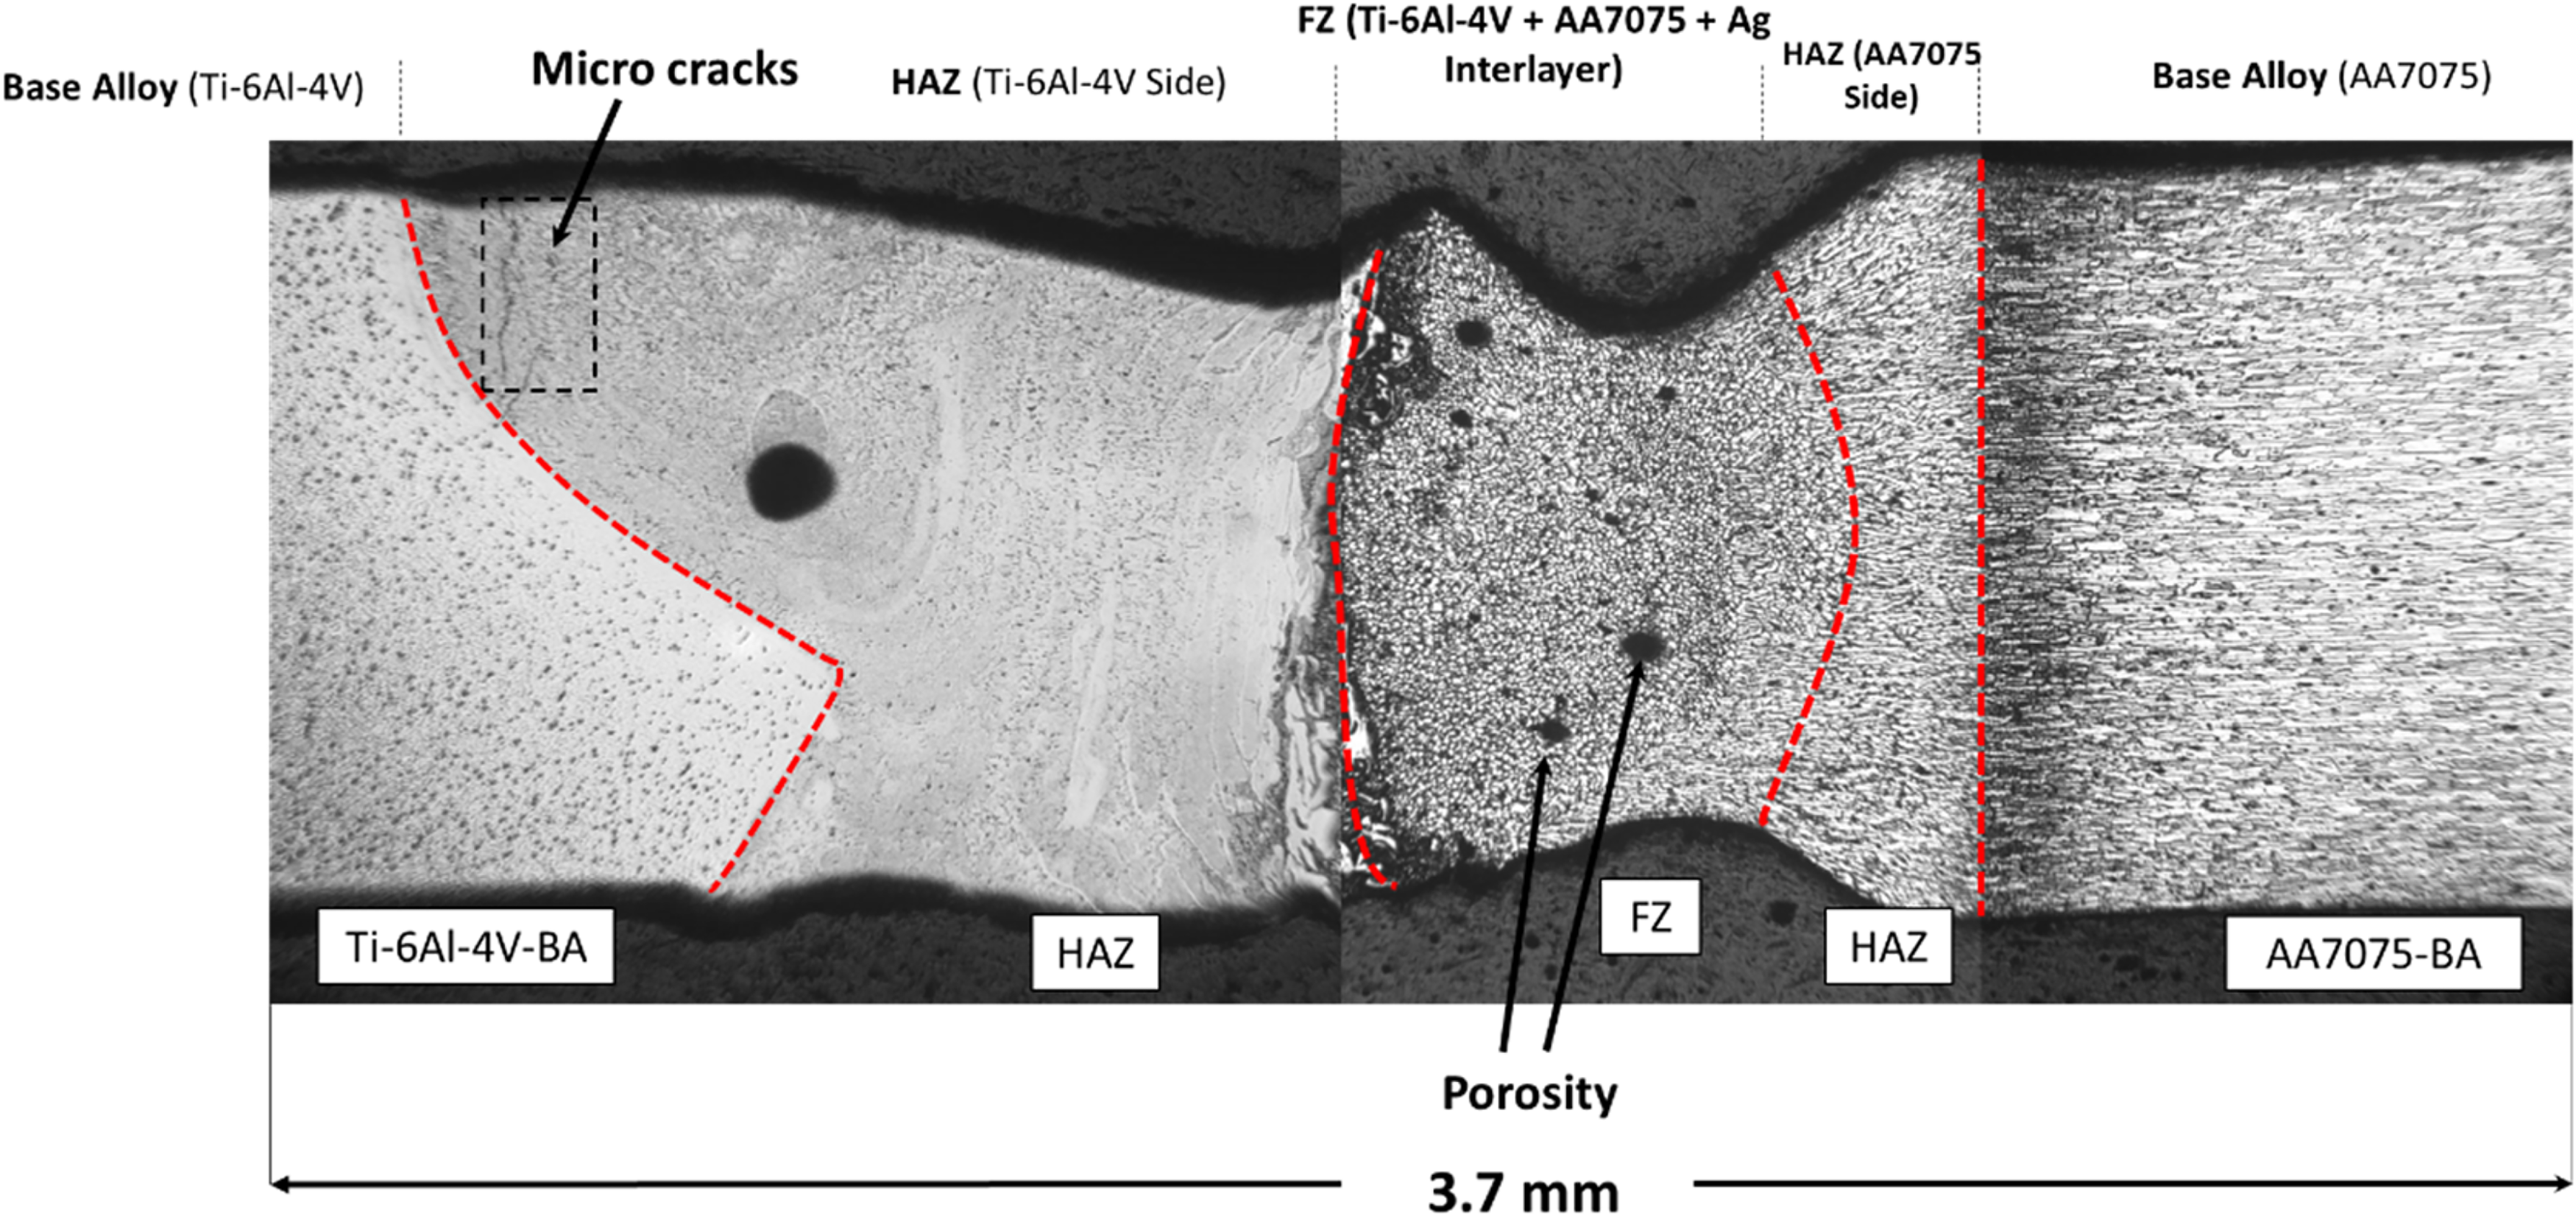
An overall view of the weldment showing all the zones in the joint.
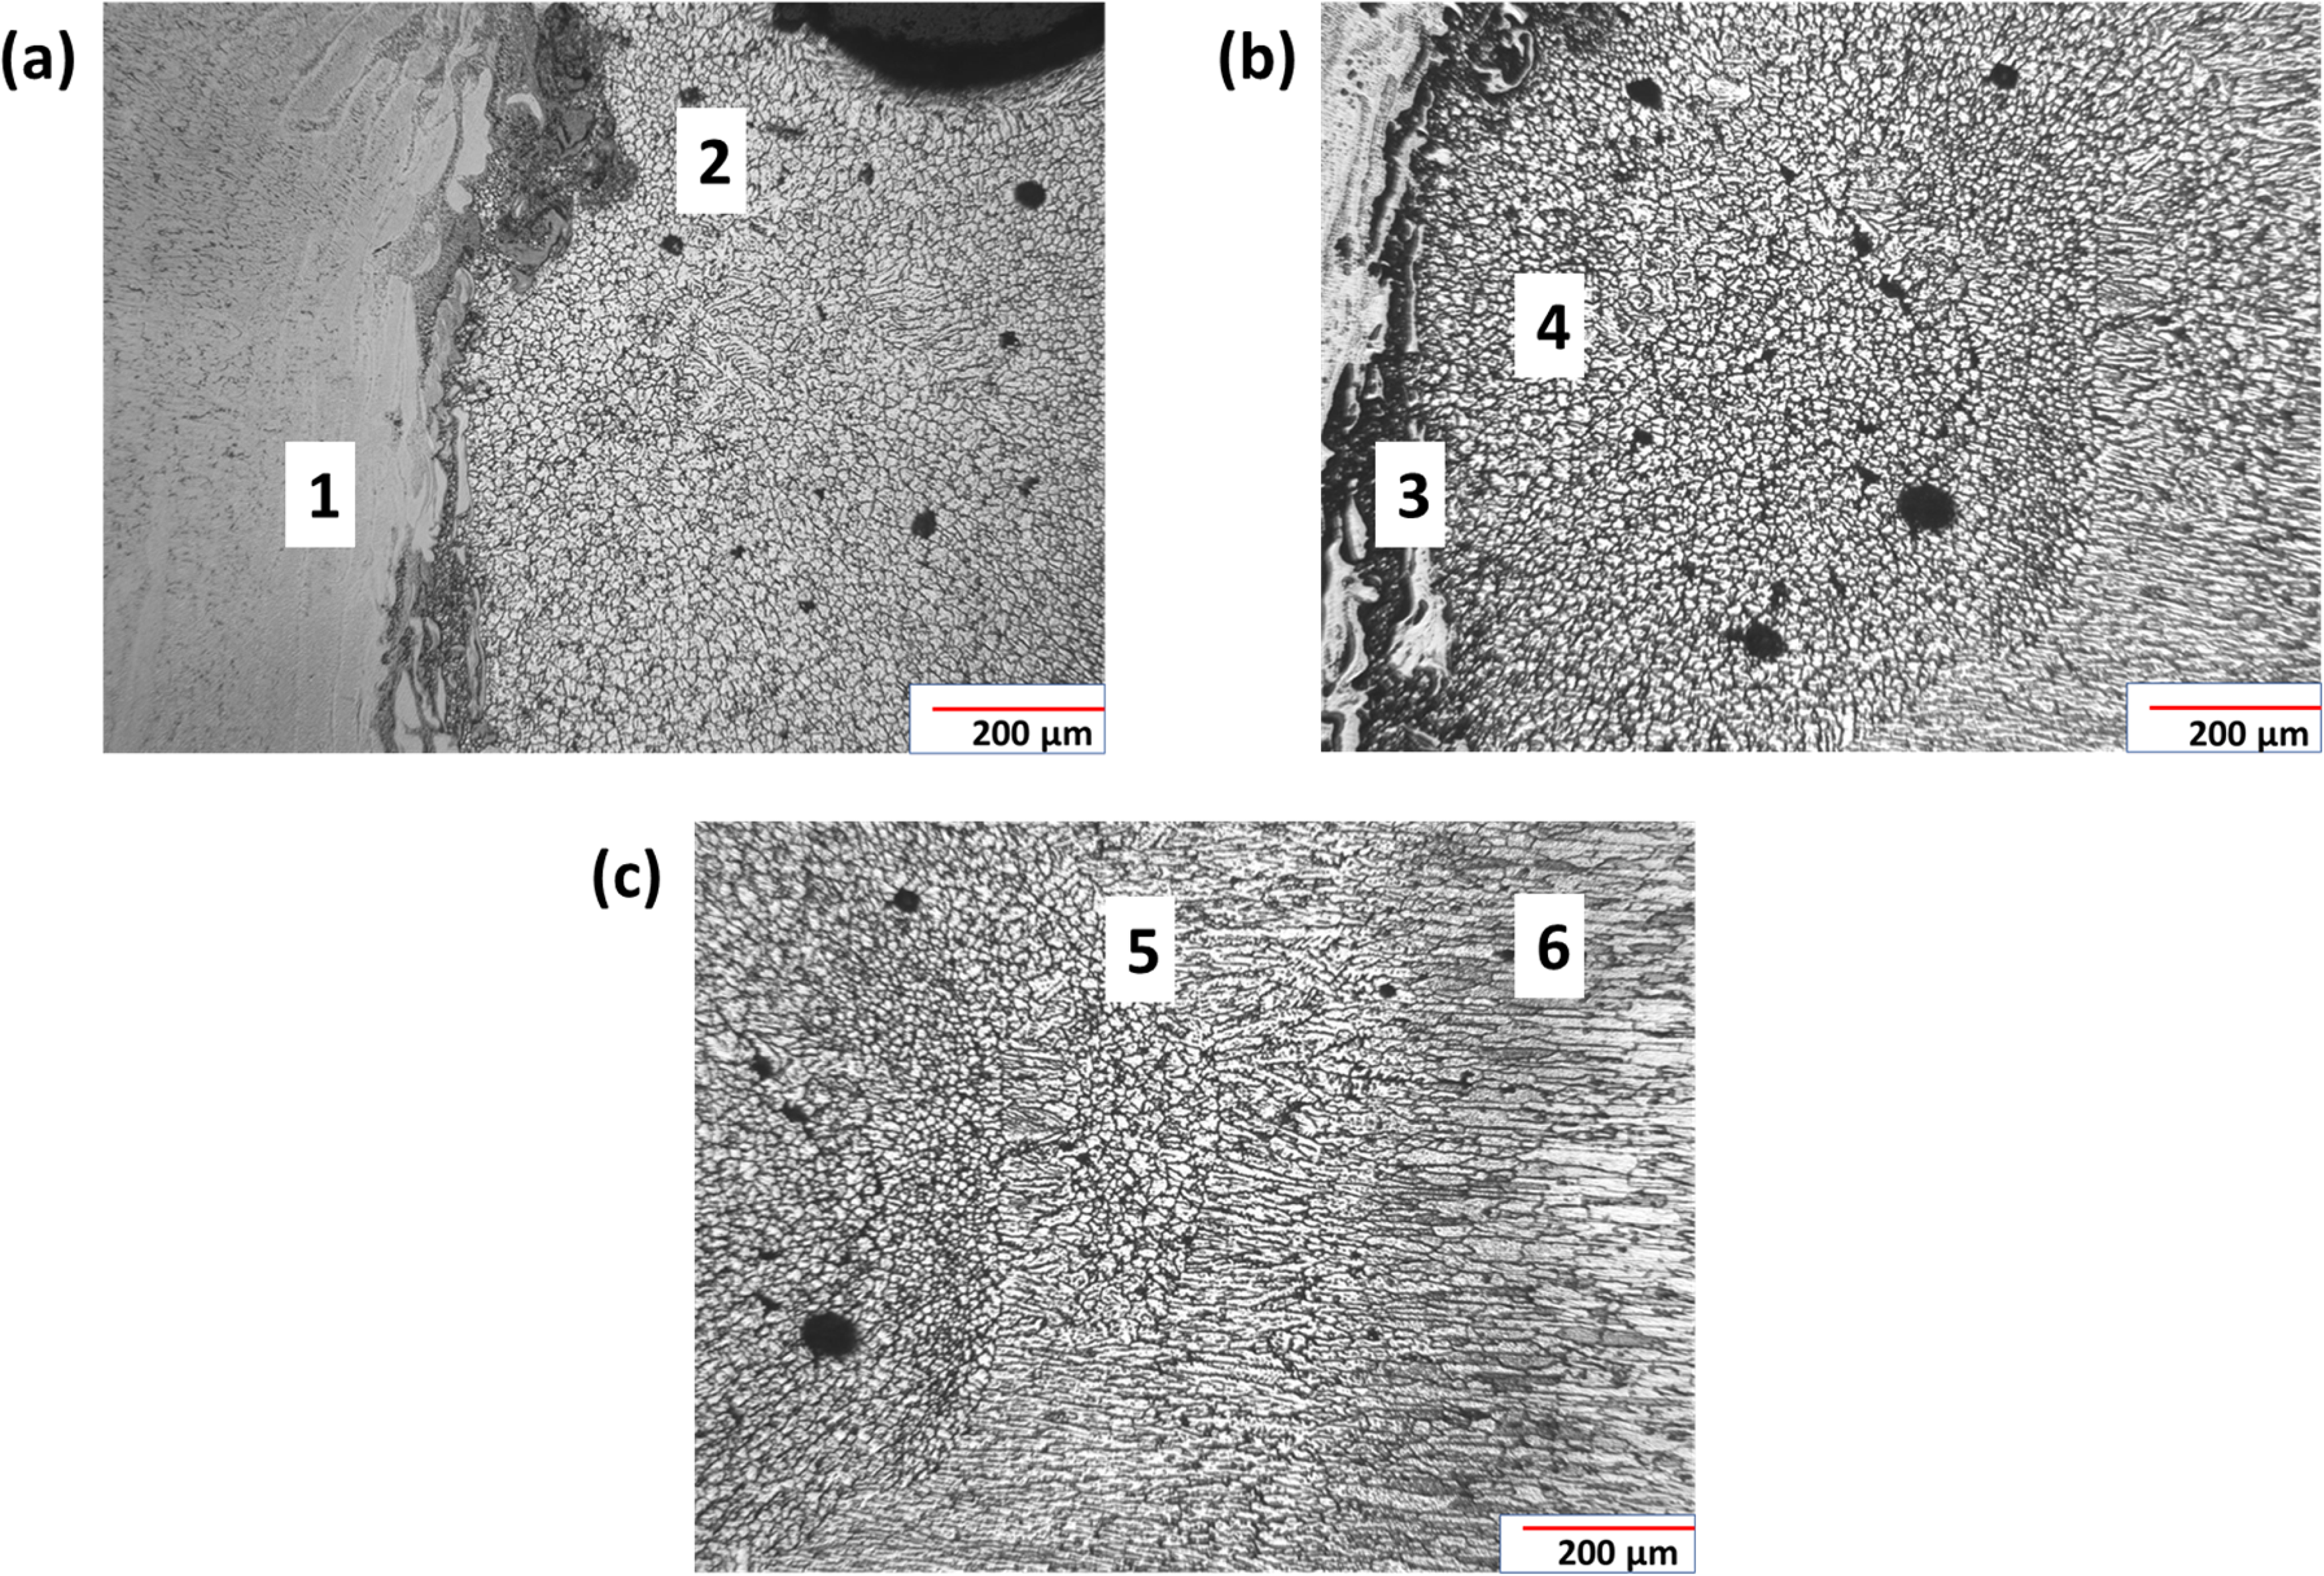
(a) Ti6Al4V side microstructure including HAZ, (b) FZ containing AA7075 + Ti6Al4V + Ag, and (c) AA7075 side microstructure including HAZ.
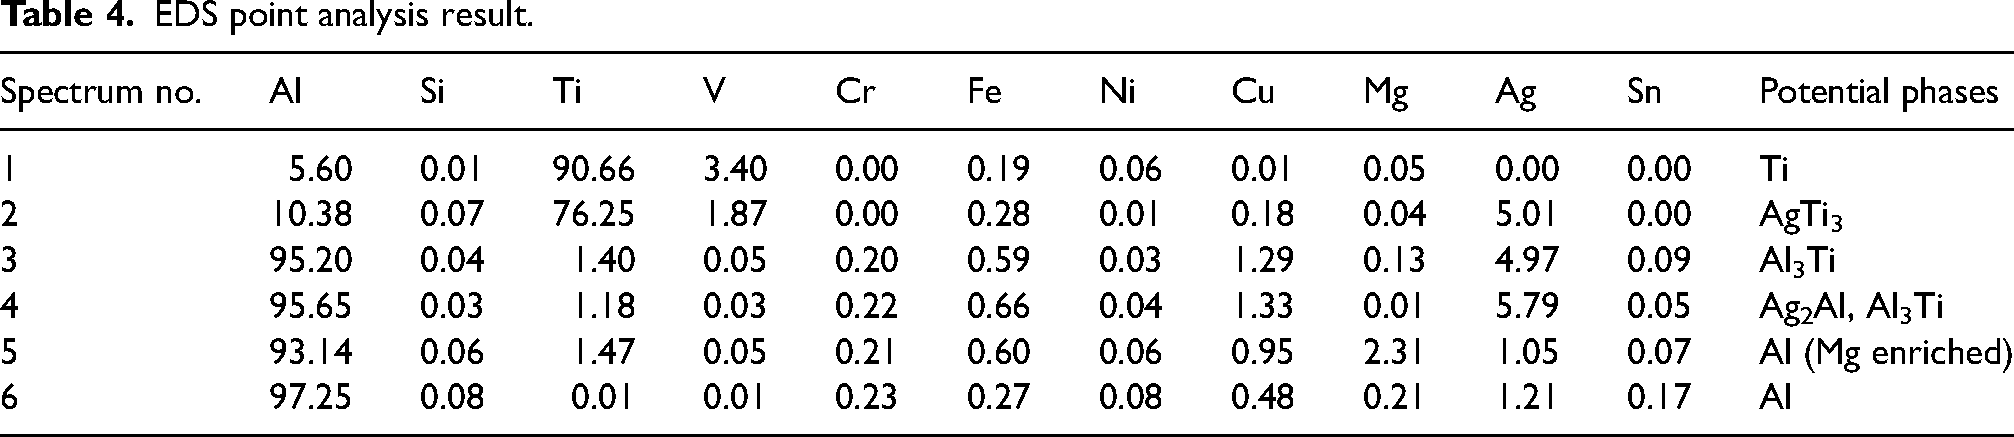
Elemental composition analysis of specific points across weld zones is revealed as shown in Figure 7. The Ti-6Al-4V/HAZ interface and subsequent FZ regions show microstructural relevance as detailed in Table 4. The chemical composition of specific points mentioned in Figure 6(a)–(c)) is shown in Table 4. Table 4 indicates abrupt Al and Ti composition changes at this interface, but stability elsewhere, except near titanium aluminides and Al–Si eutectics. Lighter grey particles, composed of Ti, Al, and Si, and Al–Si eutectics with less Al and more Si, are present in the FZ. Figure 6(b) shows the IMC layer at the Ti-6Al-4V/FZ interface, with IMC dendrites extending into the FZ. EDS identified IMC layer and segment compositions (Table 4, points 3 and 4). The Al3Ti IMC layer's high aluminum content suggests its formation over AlTi3 and TiAl due to lower Gibbs free energy. Al predominates in regions near the Ti-6Al-4V and AA7075 sides and the HAZ of AA7075 (points 4–6). Al3Ti particles, formed at the Ti/Al interface, either flow with the molten pool or are extruded by nearby grains, increasing weld joint strength. However, excessive Ti/Al reaction can thicken the Al3Ti IMC layer, risking joint failure. Controlled Ti/Al interaction is therefore very crucial.
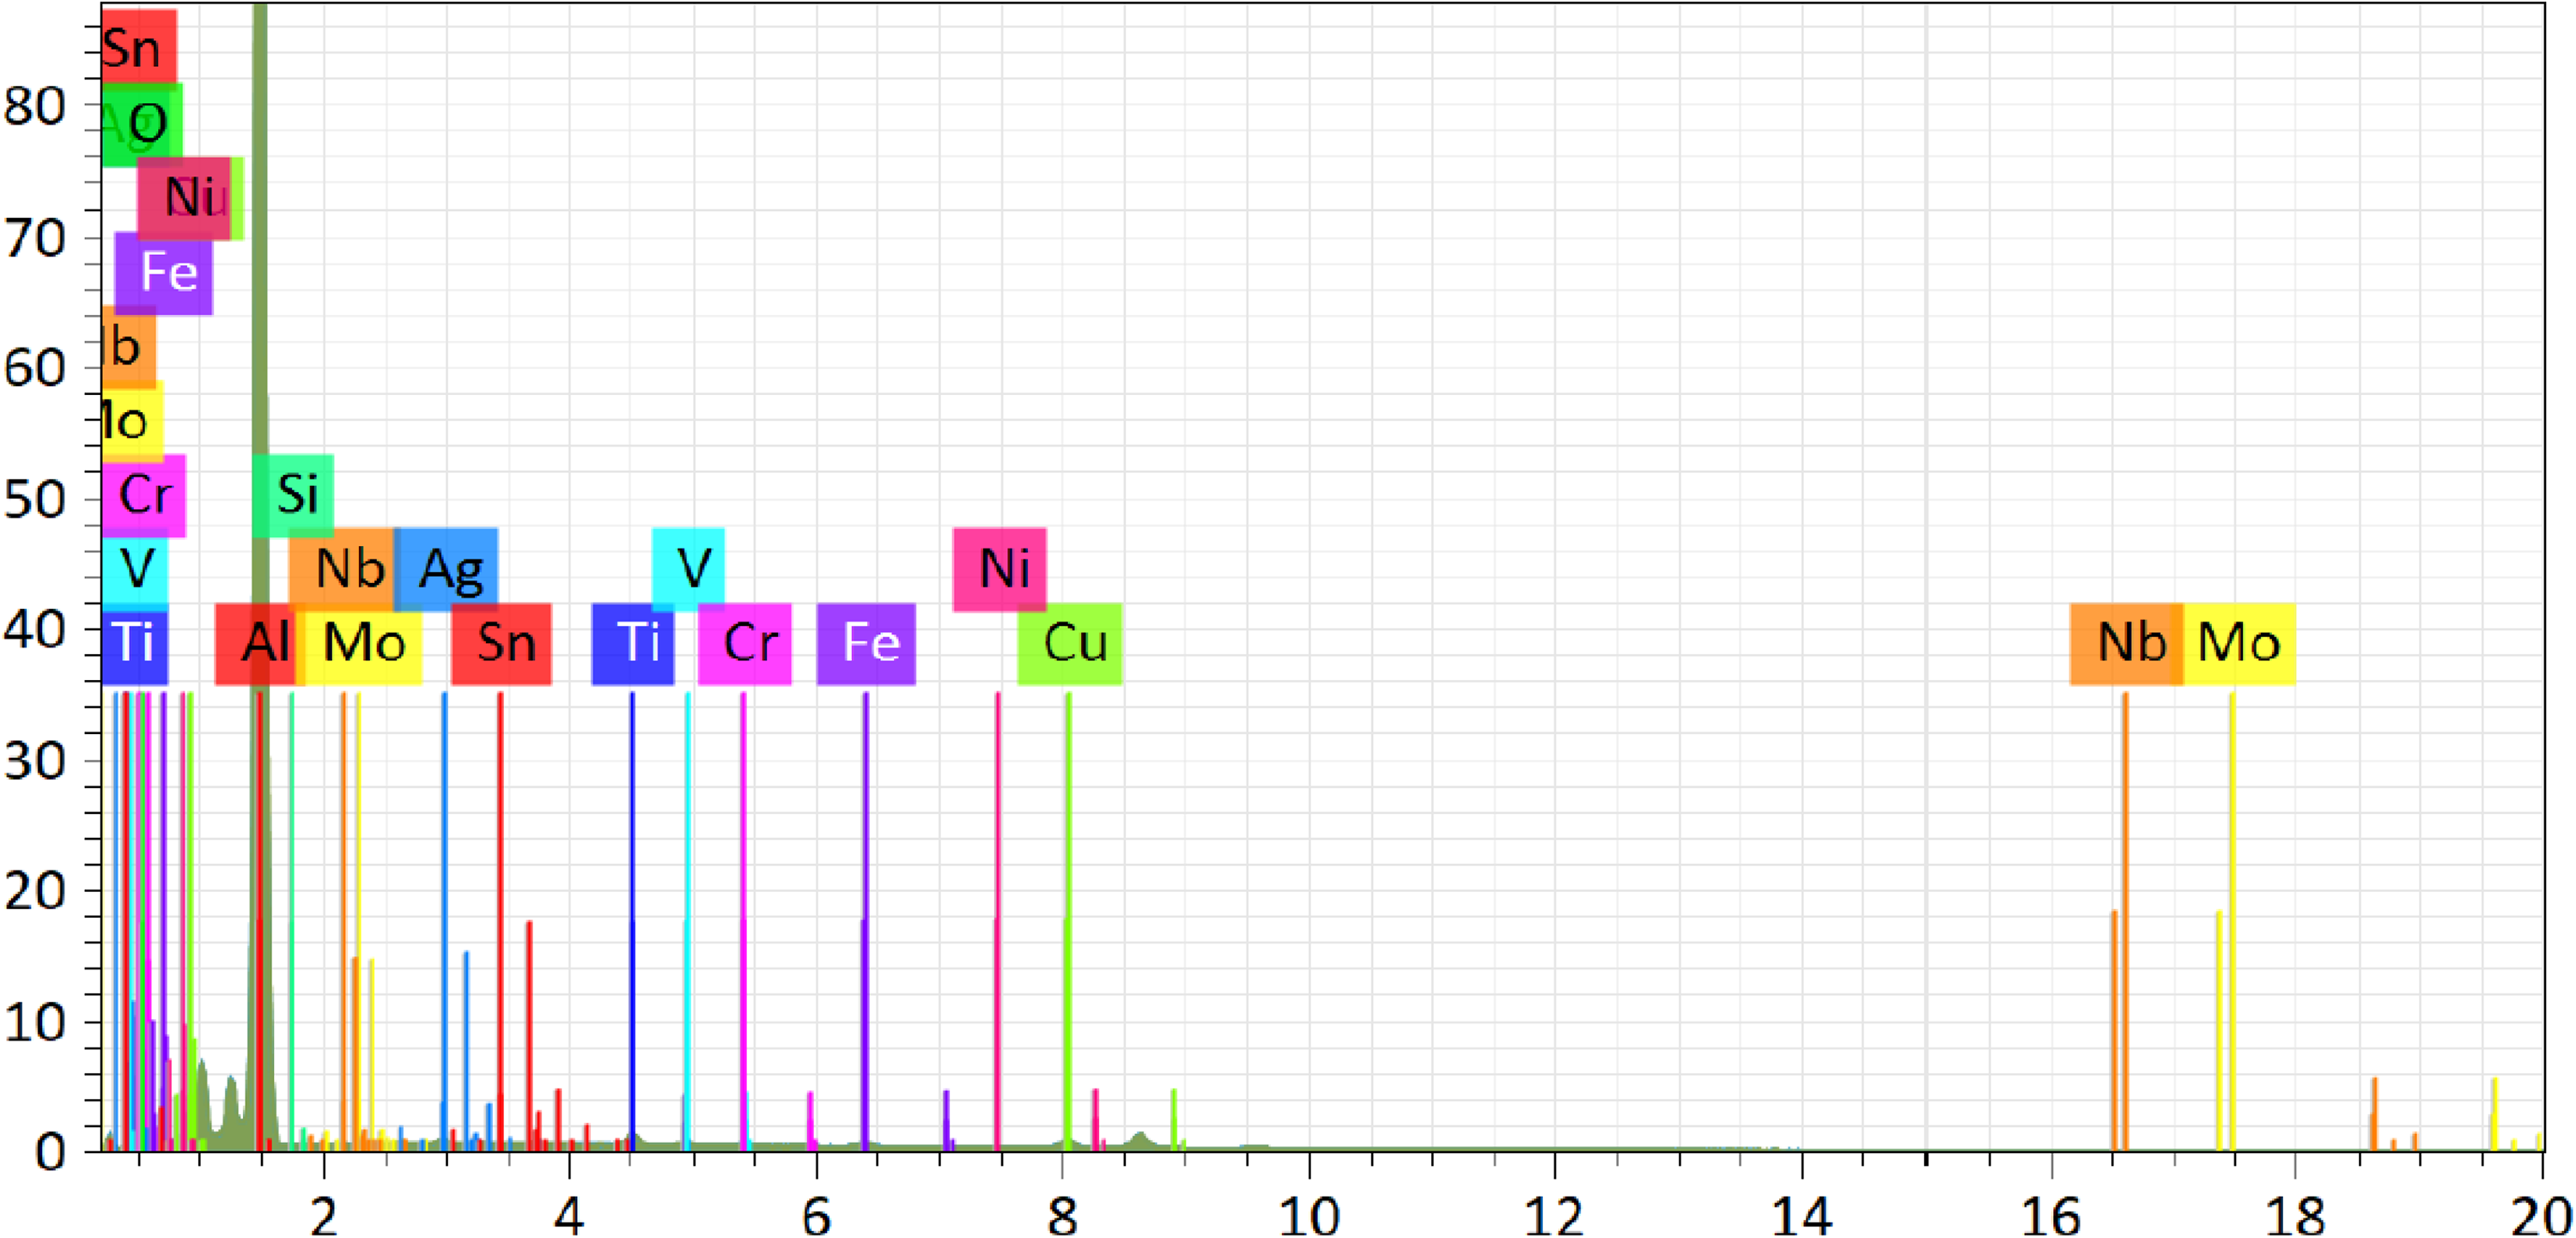
EDS spectra result of point analysis.
EDS point analysis result.
Microhardness analysis
As illustrated in Figure 8, the microhardness profiles of all weldment zones and BAs were measured, showing an increase in microhardness within the fusion zone as compared to AA7075. The FZ exhibited higher microhardness, approximately 55% greater than that of the AA7075 base alloy. The lowest microhardness was observed in the AA7075 BA. The temperature influences IMC formation at the interface, affecting material hardness. High temperatures promote consistent, gradual IMC formation, enhancing hardness, while low temperatures limit atomic diffusion and lower hardness. Ag interlayer use reduces brittle IMC formation but may lead to AgTi3 formation on the Ti-6Al-4V side. Ti-Ag intermetallics have a lower embrittlement impact than Al-Ti intermetallics, decreasing FZ bond strength. AgTi3 IMC formation also reduces FZ porosity, as evident in Figure 5. Ag use thus improves joint quality by mitigating brittle IMC and void formation. The Ti-6Al-4V HAZ on the side showed greater microhardness measurement compared to AA7075 BA, AA7075 side HAZ, and FZ. This is attributed to the presence of hard phases; acicular α and α martensite.
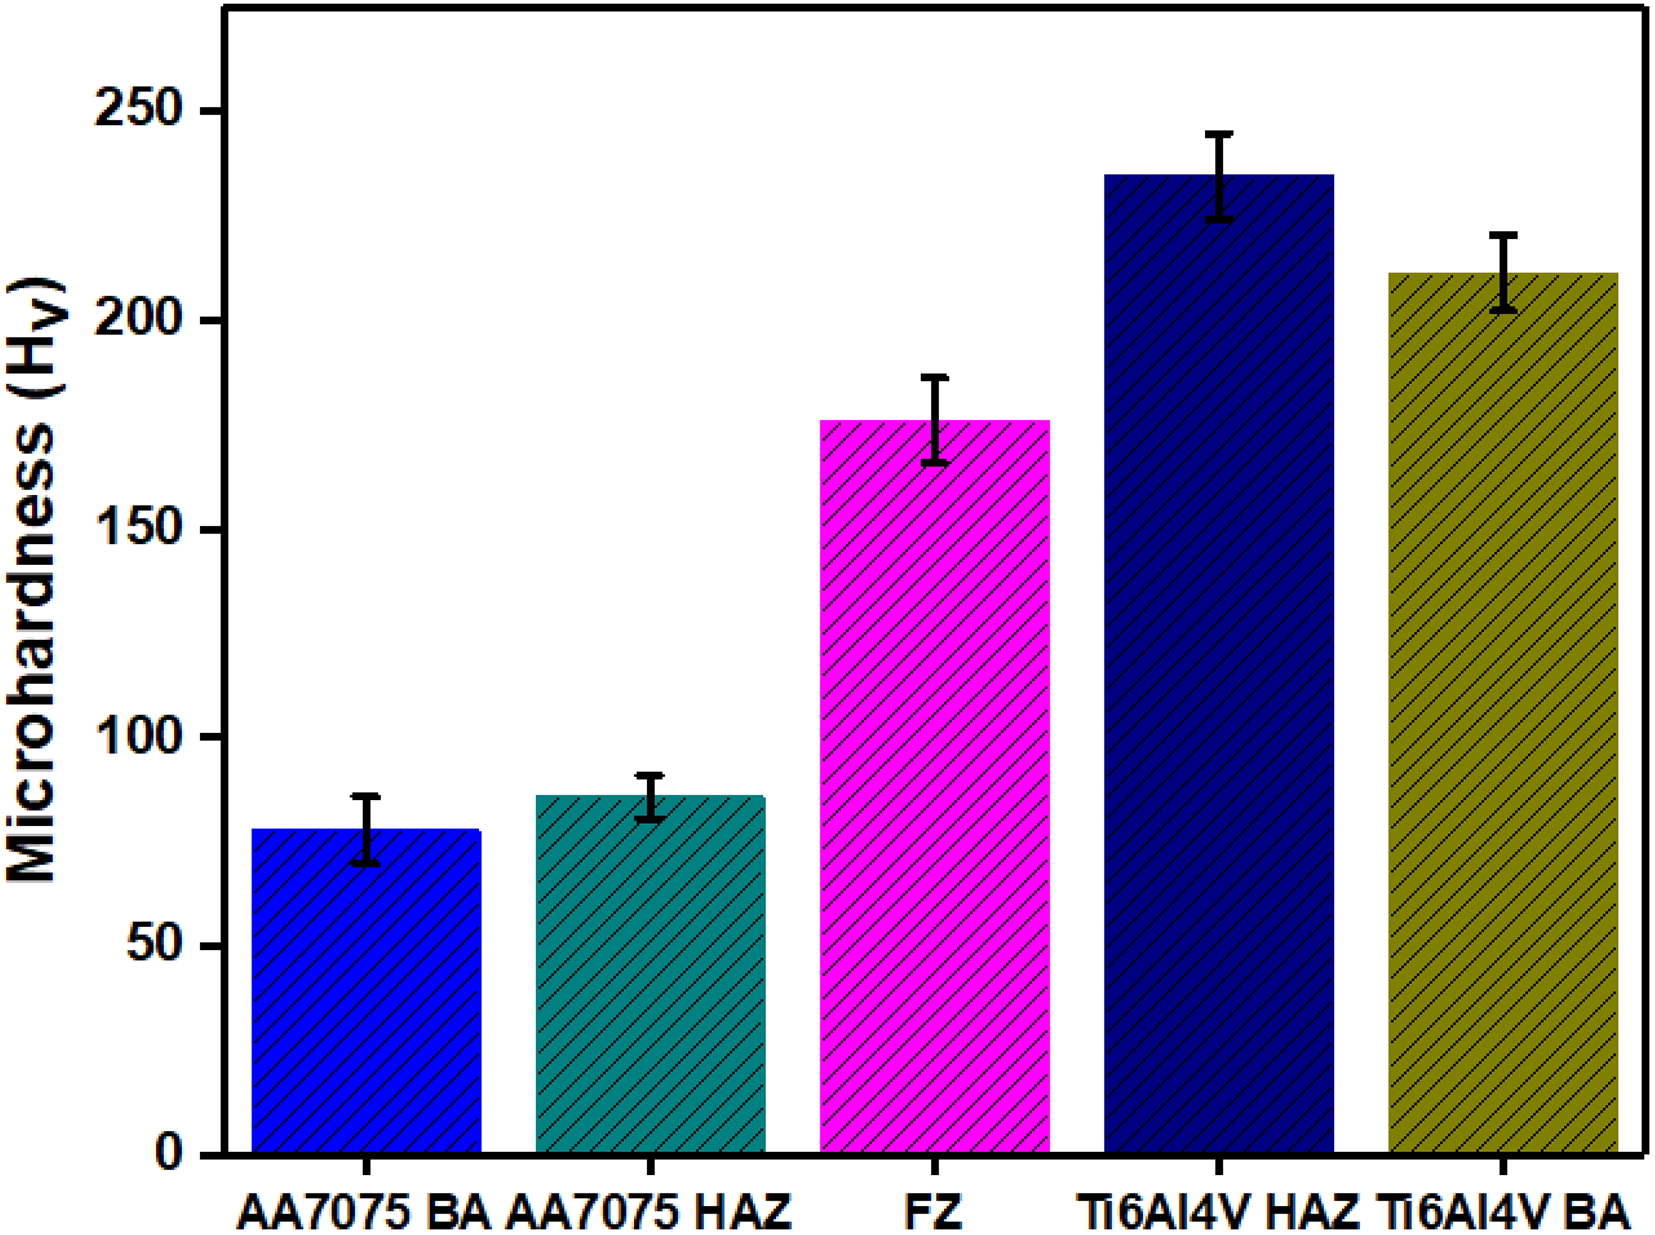
Microhardness profile of the joint zones including base alloys.
Nanoindentation characterization
The nanomechanical properties of all the joint zones and BAs were evaluated using nanoindentation at room temperature. Figure 9 illustrates the load–displacement (P–h) curves under a constant load of 200 mN, showing the nanohardness and elastic modulus of the weldments. The load–displacement loading curve is influenced by both elastic and plastic deformation, as per Kick's law (P = Ch2, where C is a constant), as explained by Hainsworth et al. 44 The indentation process results in a combination of elastic-plastic loading and purely elastic unloading deformations, with variations in penetration depth likely due to microstructural changes during the solidification in the LBW process. 44
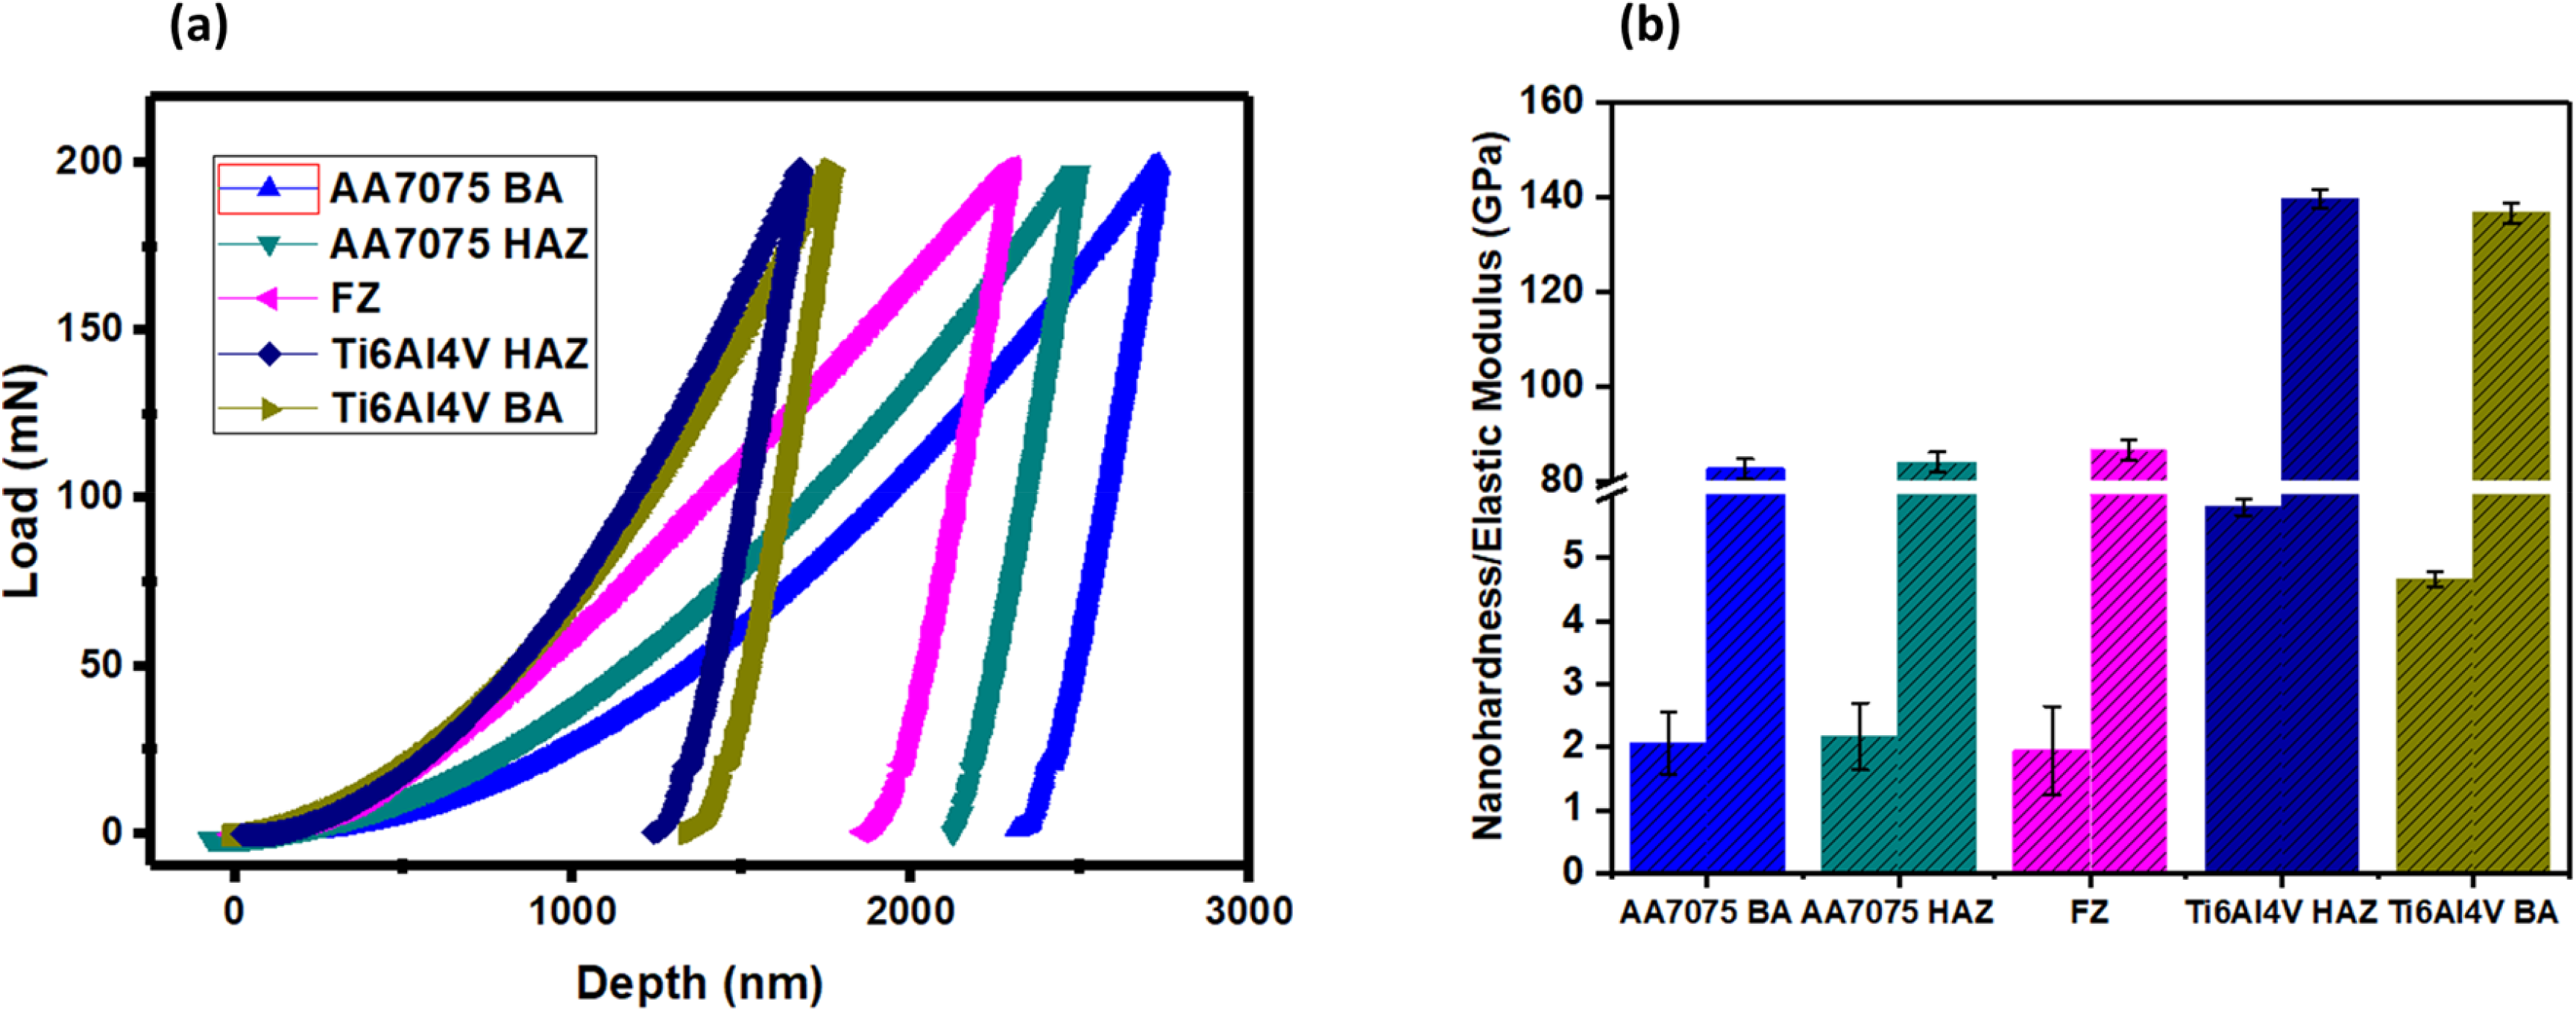
(a) Load-displacement (P−h) curves and (b) nanohardness and elastic modulus measurements for all the zones, including the base alloys.
From the P–h curves in Figure 9(a), the AA7075 BA and AA7075 HAZ showed the highest penetration displacement, approximately 2726 and 2491 nm, respectively. Among all the zones and both BAs, the maximum displacement was noted at AA7075 BA (∼2726 nm), whereas the minimum penetration occurred at Ti6Al4V HAZ (∼1674 nm). This difference in penetration depth may be linked to the indentation effect at the grain boundary microstructure variation as explained in Microstructural analysis section.
Figure 9(b) presents the nanohardness and elastic modulus data, calculated using the Oliver and Pharr method. Moving from AA7075 BA toward the Ti6Al4V BA led to a rise in nanohardness from 2.06 to 5.80 GPa in the Ti6Al4V HAZ. The lowest values were observed in FZ (1.94 GPa) owing to the use of an Ag interlayer as it reduces brittle IMC formation but can form AgTi3 on the Ti6Al4V side. Ti-Ag IMCs are less embrittling than Al-Ti. Furthermore, an increase in indentation depth at constant load implied lower nanohardness due to reduced dislocation density, as per Gale and Achuthan. 45
Regarding elastic modulus, as shown in Figure 9(b), an increase from 82.62 to 139.55 GPa was observed from AA7075 BA to Ti6Al4V HAZ. However, there was a slight increase from AA7075 BA (82.62 GPa) to 86.55 for the FZ. This reduction might be attributed to the formation of less brittle AgTi3 IMCs as evident from Table 4. EDS point analysis result. This fluctuation in the elastic modulus values can be linked to the varying microstructural variations influenced by the use of Ag interlayer, which affects the material's response to indentation forces.
Nanocreep evaluation
Figure 10(a) presents the load–displacement curves for all the zones, including both base alloys. It shows an increase in indenter penetration depth from approximately 1512.71 nm in the Ti6Al4V HAZ to around 1775.87 nm in the FZ. Figure 10(b) displays the depth–time (h−t) curves, using nanoindentation data gathered during a 200 s holding period for all the weldment zones and both alloys. These curves show an initial rapid increase in penetration depth as the maximum load of 200 mN is reached in about 40 s, followed by a decrease in penetration depth after reaching this maximum load.
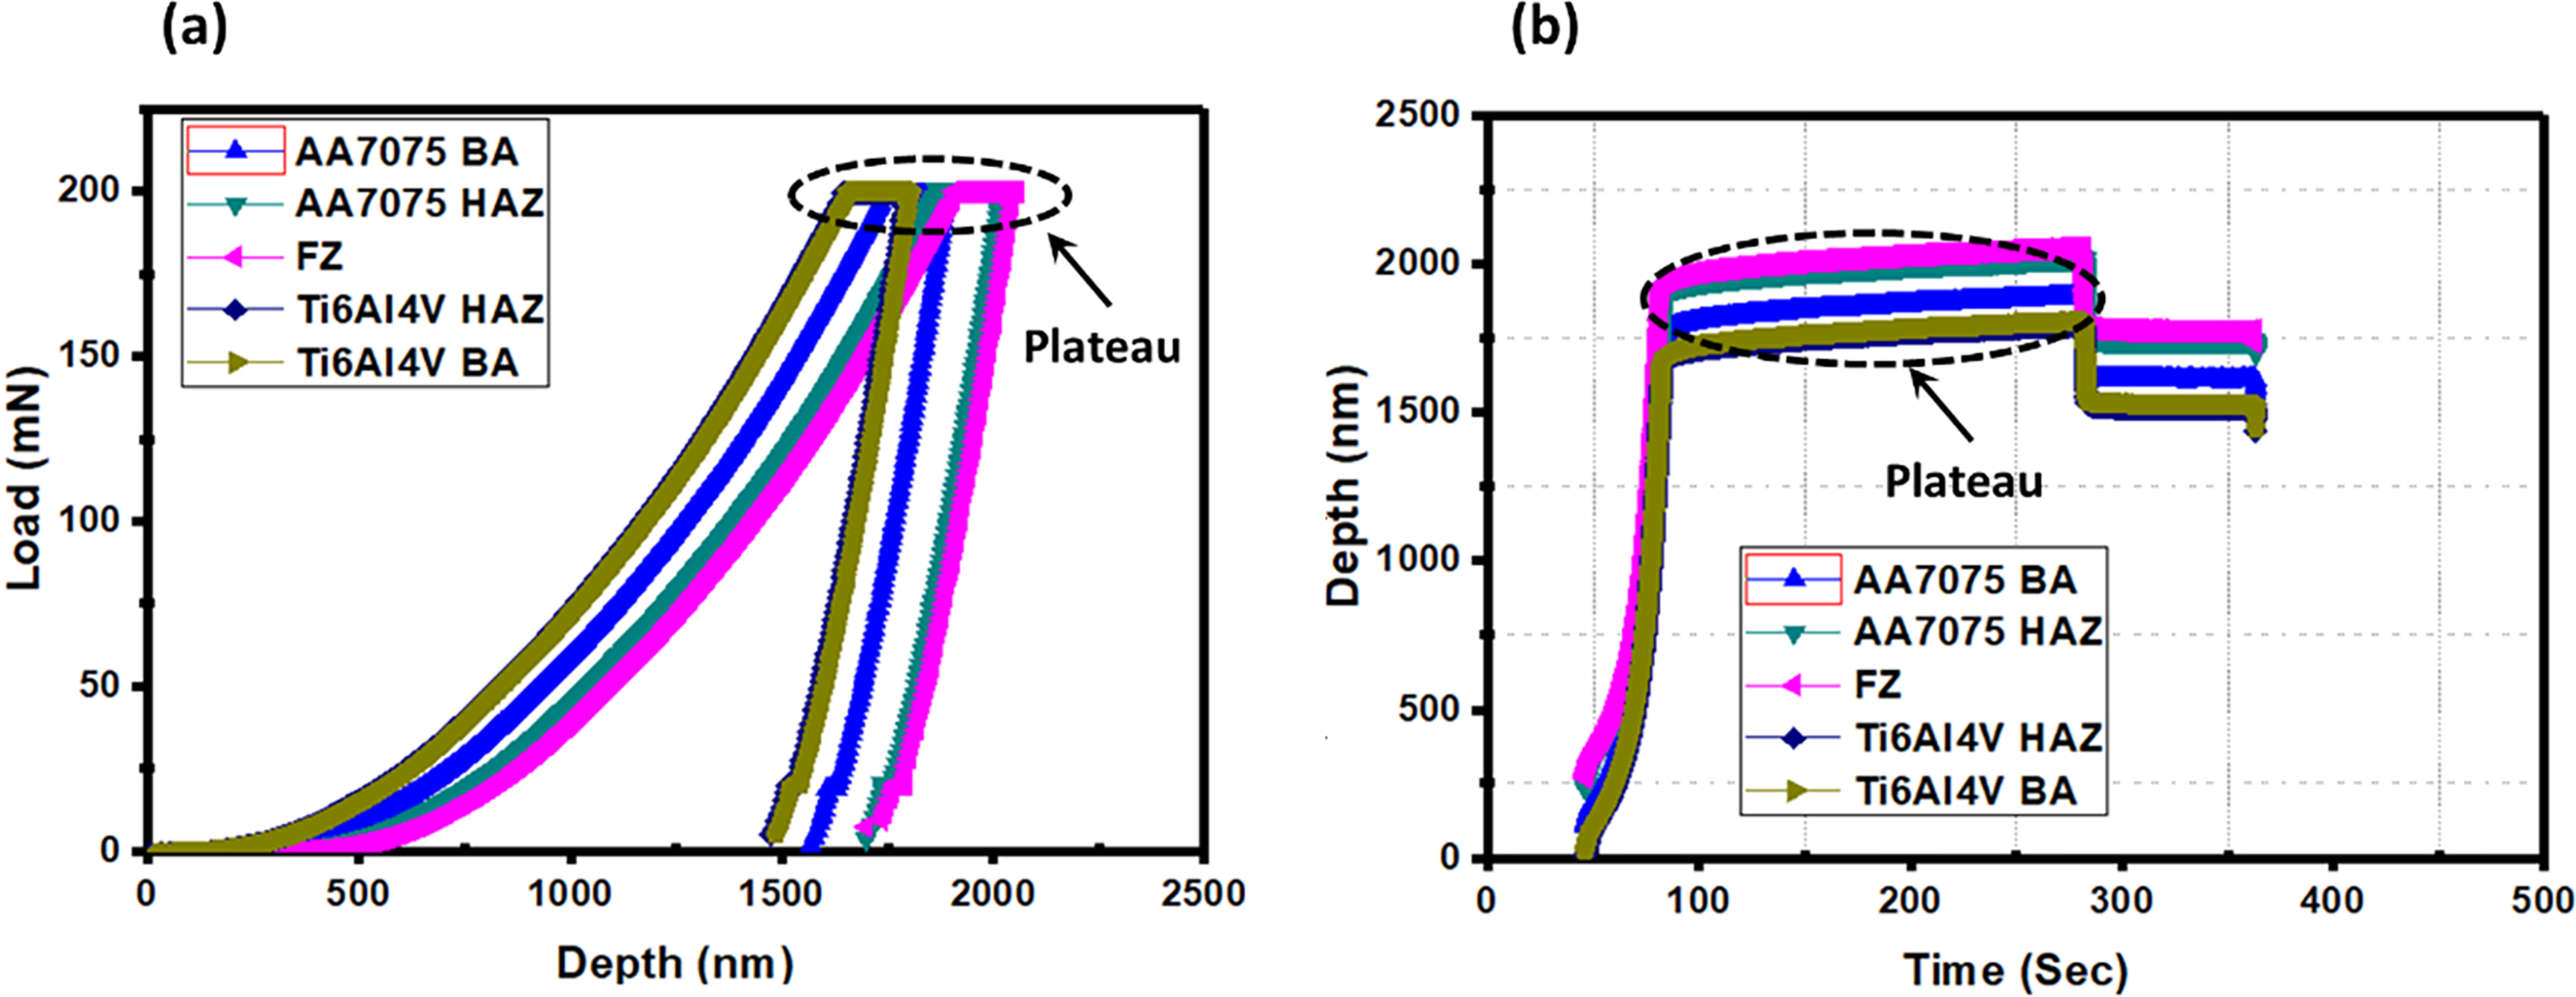
(a) Load–displacement curves from nanoindentation and (b) depth–time curves for each zone including base alloys.
Throughout the 200 s holding period, significant depth plateaus were observed in each zone and the base alloys. Creep displacement versus time (h−t) curves, derived from these plateaus, are shown in Figure 10(b).
The depth plateaus during the holding stage (200 s) as shown in Figure 10(b), suggest an initial increase in penetration depth before reaching maximum load (200 mN). The initial increase in penetration depth is illustrated in Figure 11. Figure 11 displays the depth versus time (h−t) curves of all weld zones along with the base alloy from Figure 10(b). The maximum creep displacement was found to be about 184.35 nm in the FZ, while the minimum, approximately 145.64 nm, was observed in the Ti6Al4V HAZ. The creep displacements in Ti6Al4V BA, AA7075 BA, AA7075 HAZ, and 400 W were about 155.11, 165.30, and 175 nm, respectively, indicating that they were lower than the FZ by 15.86%, 10.33%, and 5.07%.
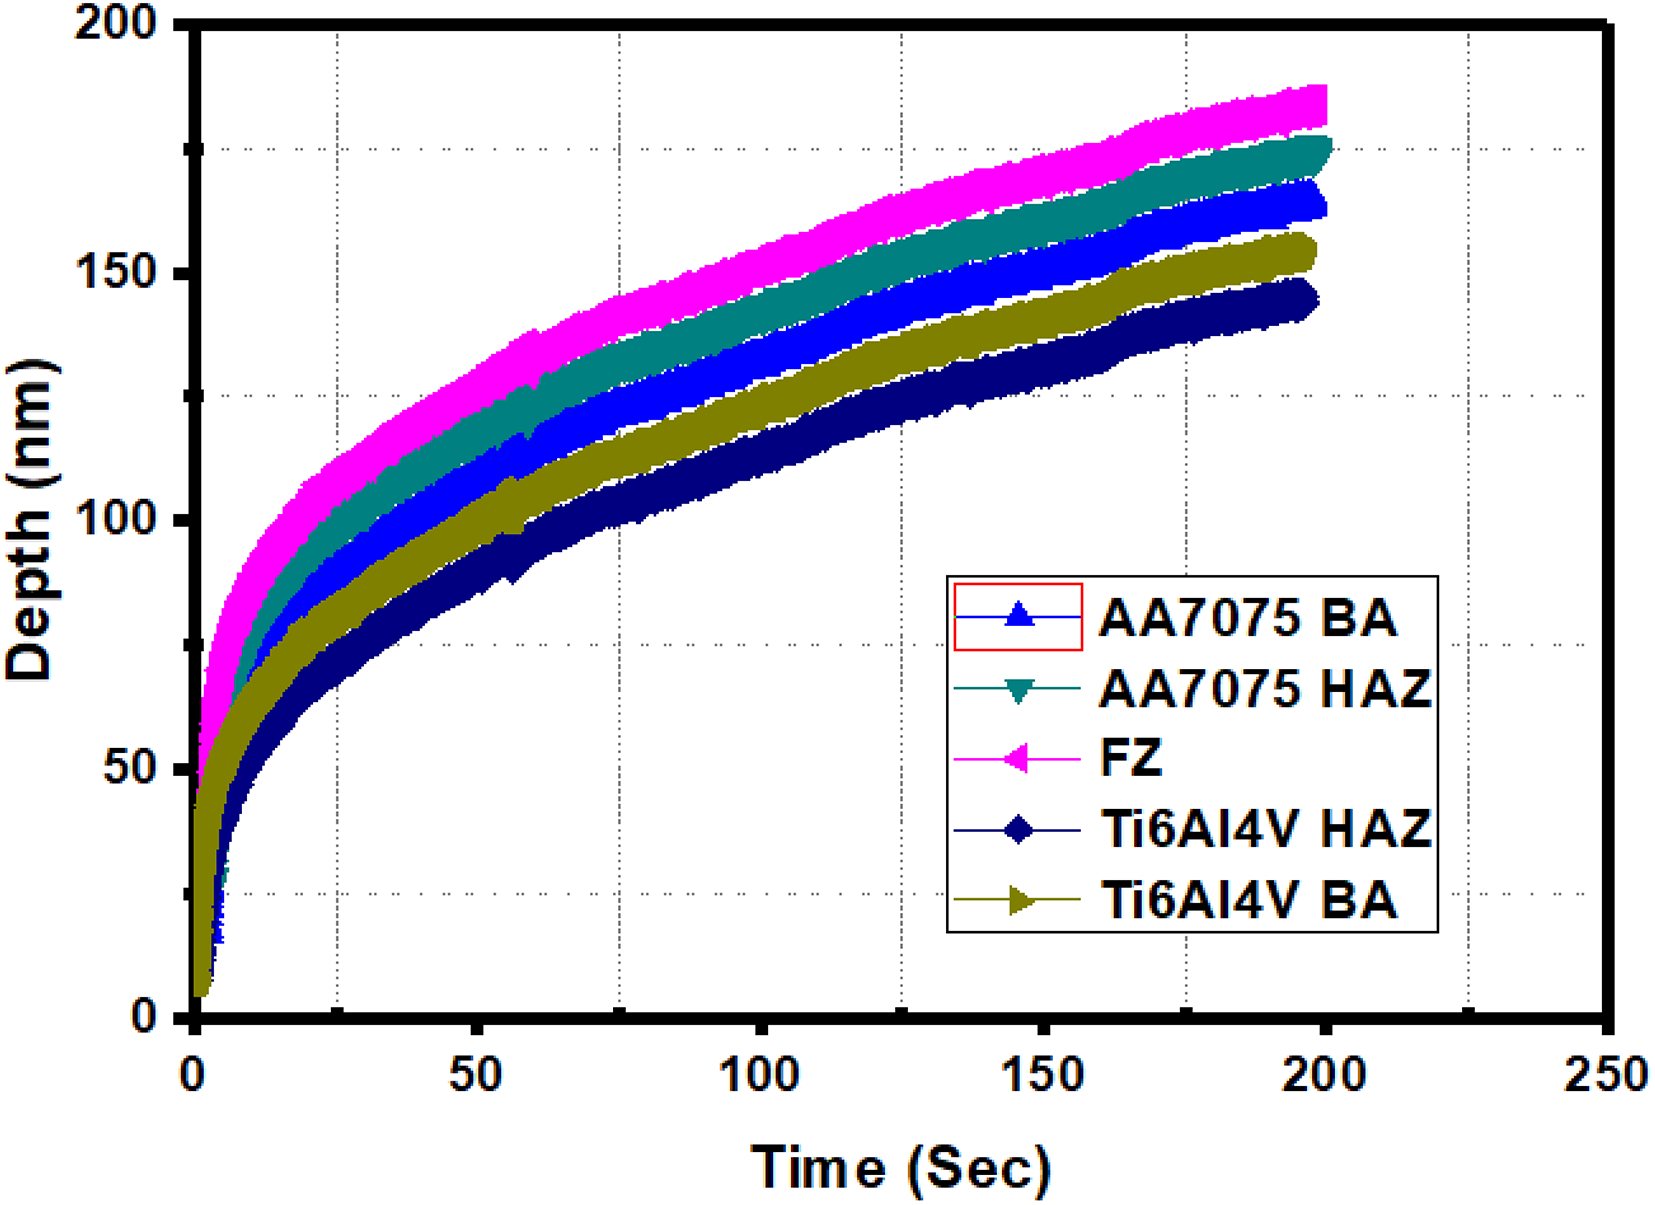
Curves representing the depth penetration for each zone and the base alloys.
Using equation (3), the fitted curves were plotted (represented by a red line), while the black line indicates the experimental data, as seen in Figure 12. These fitted curves closely match the experimental results for all zones and both base alloys. During the primary creep stage, as shown in Figure 11, indentation depth increased rapidly withholding time for each weldment zone and the base alloys. During the secondary creep stage, the penetration depth increased linearly over the 200 s holding time. Tertiary creep, commonly observed in conventional creep tests, does not occur in indentation creep, as the hardness test is a compression test, and the specimen does not fracture. 46
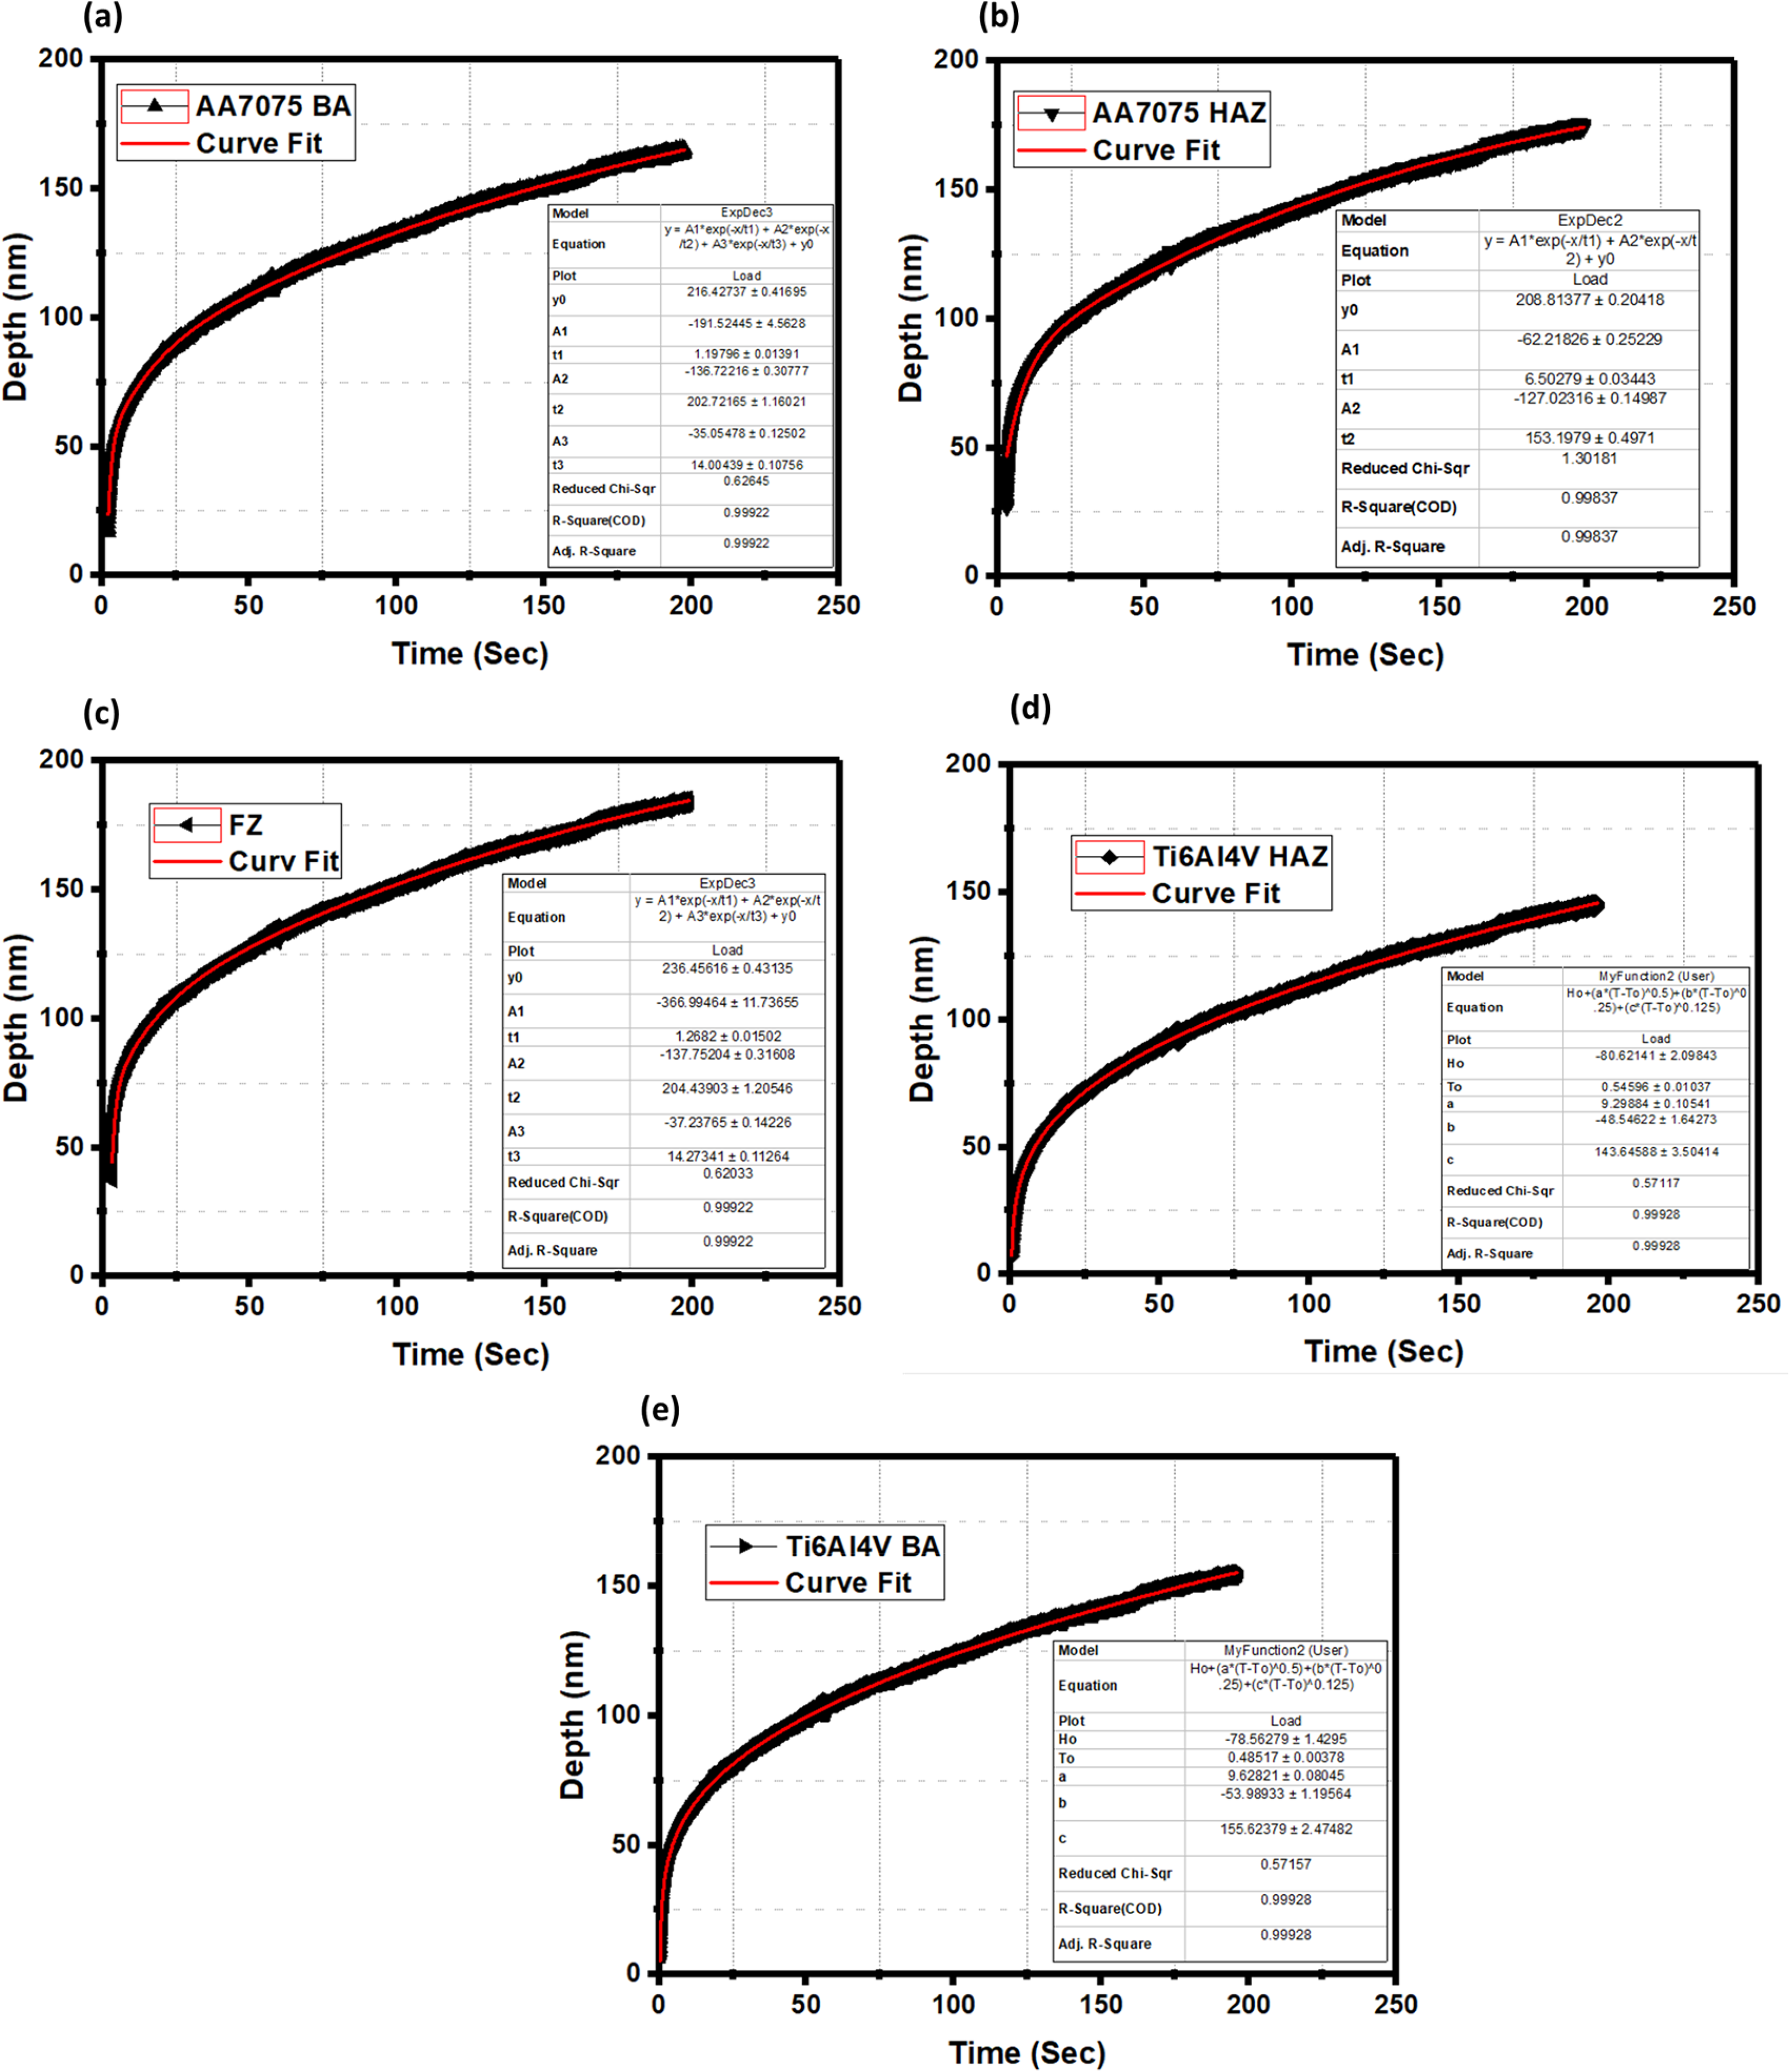
Comparative data showing fitted (red line) and experimental (black line) results for, (a) AA7075 BA, (b) AA7075 HAZ, (c) FZ, (d) Ti6Al4V HAZ, and (e) Ti6Al4V BA.
In a creep test, elastic deformation refers to the initial, reversible strain a material undergoes when stress is applied, which is instantaneous and follows Hooke's Law, governed by the material's elastic modulus. This phase is typically short-lived and does not permanently alter the material. On the other hand, plastic deformation is the subsequent, irreversible strain that occurs under sustained stress, leading to permanent changes in the material's structure. Initially, plastic deformation causes an increase in strain rate due to dislocation movement, but over time, it reaches a steady state where strain hardening, where the material becomes stronger and more resistant to deformation and recovery processes where the material's structure rearranges to relieve stress occur simultaneously, stabilizing the strain rate. The creep strain rate of all weld beads and the base alloy was calculated using equation (2), as shown in Figure 13. The results indicate a sharp decrease in creep strain rate at a constant load for each weldment zone and both base alloys, attributable to strain hardening caused by plastic deformation. Following this initial decrease, as observed in Figure 13, the creep strain rate gradually declined and stabilized, characteristic of secondary or steady-state creep, due to strain hardening and simultaneous recovery within the joint and base alloys. 34
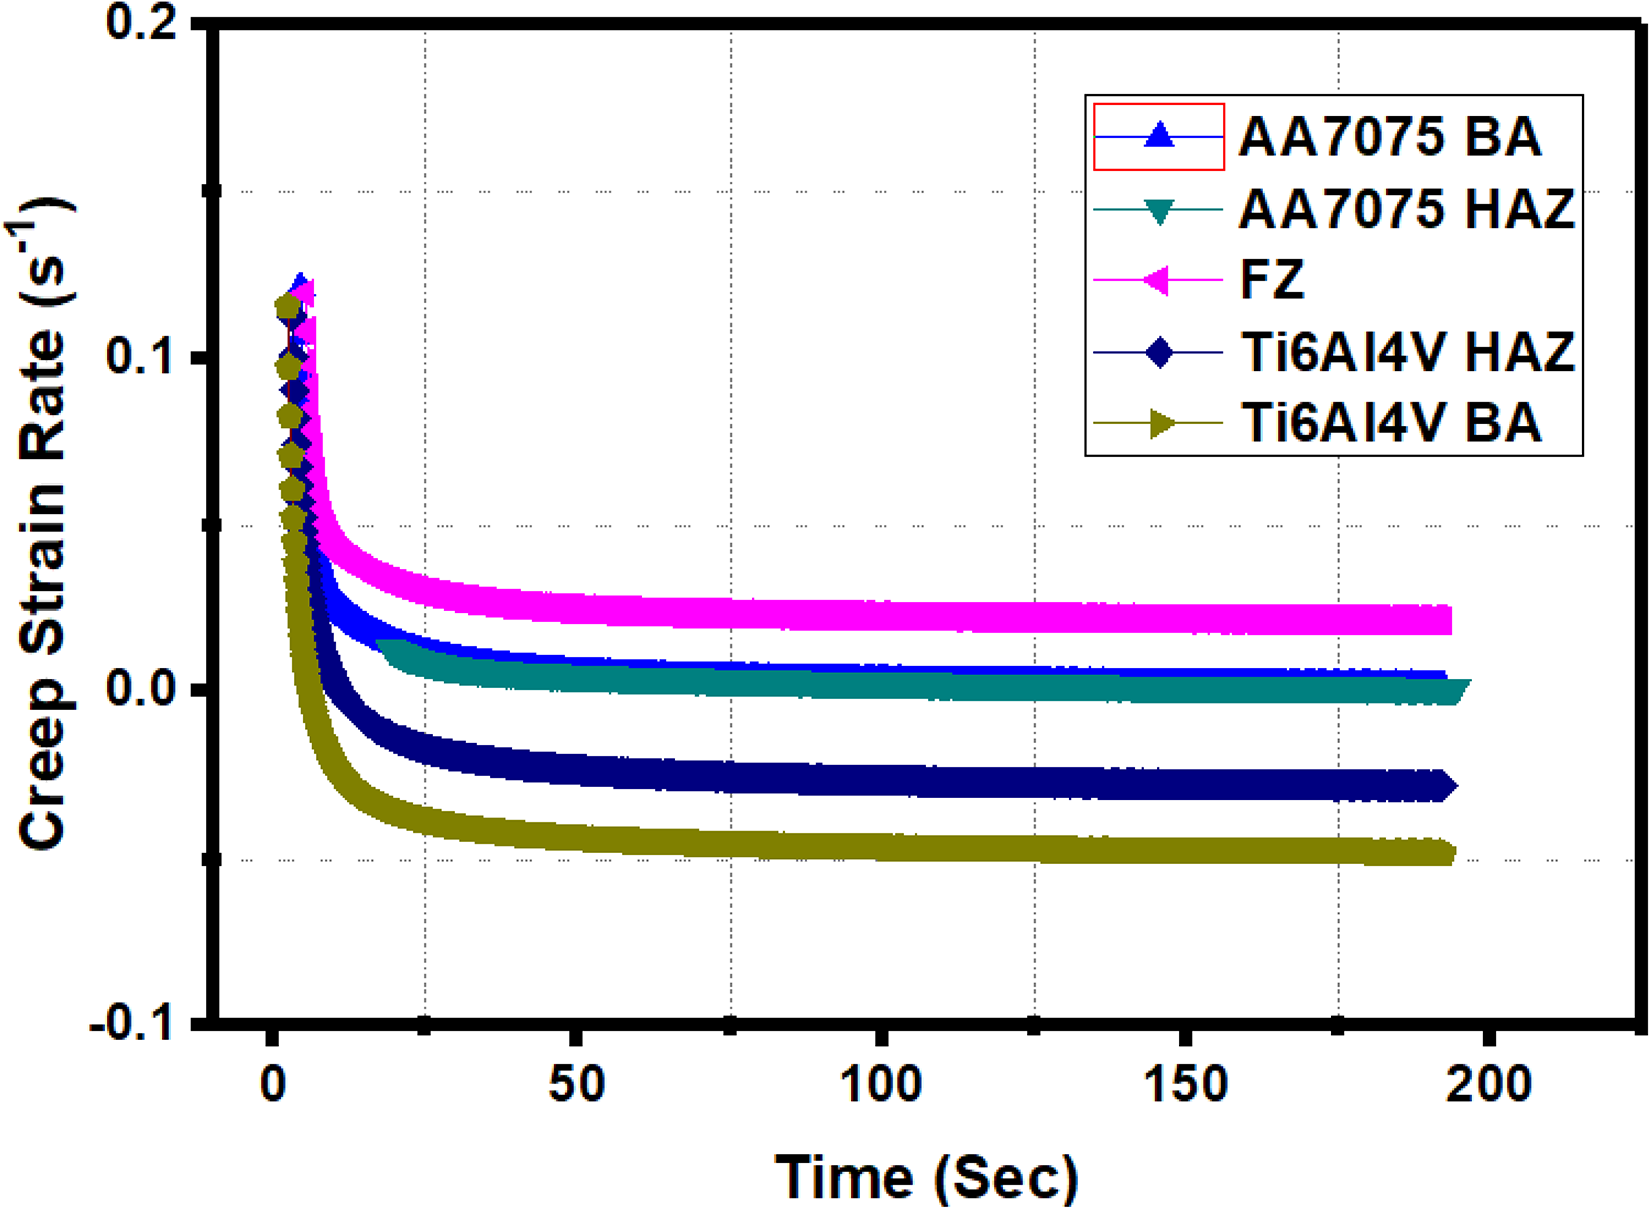
Graphs depicting the relationship between creep strain rate and time for all the weldment zones including base alloys.
Figure 14(a) illustrates the relationship between stress and creep strain rate in indentation for the base alloys and all weldment zones. The slope of the linear fit in this graph represents the creep stress exponent, which provides insights into the material's creep resistance and the creep phenomena. Higher values of the creep stress exponent, as noted in Table 5 indicate better resistance to creep, following the findings of Van Swygenhoven and Derlet. 47
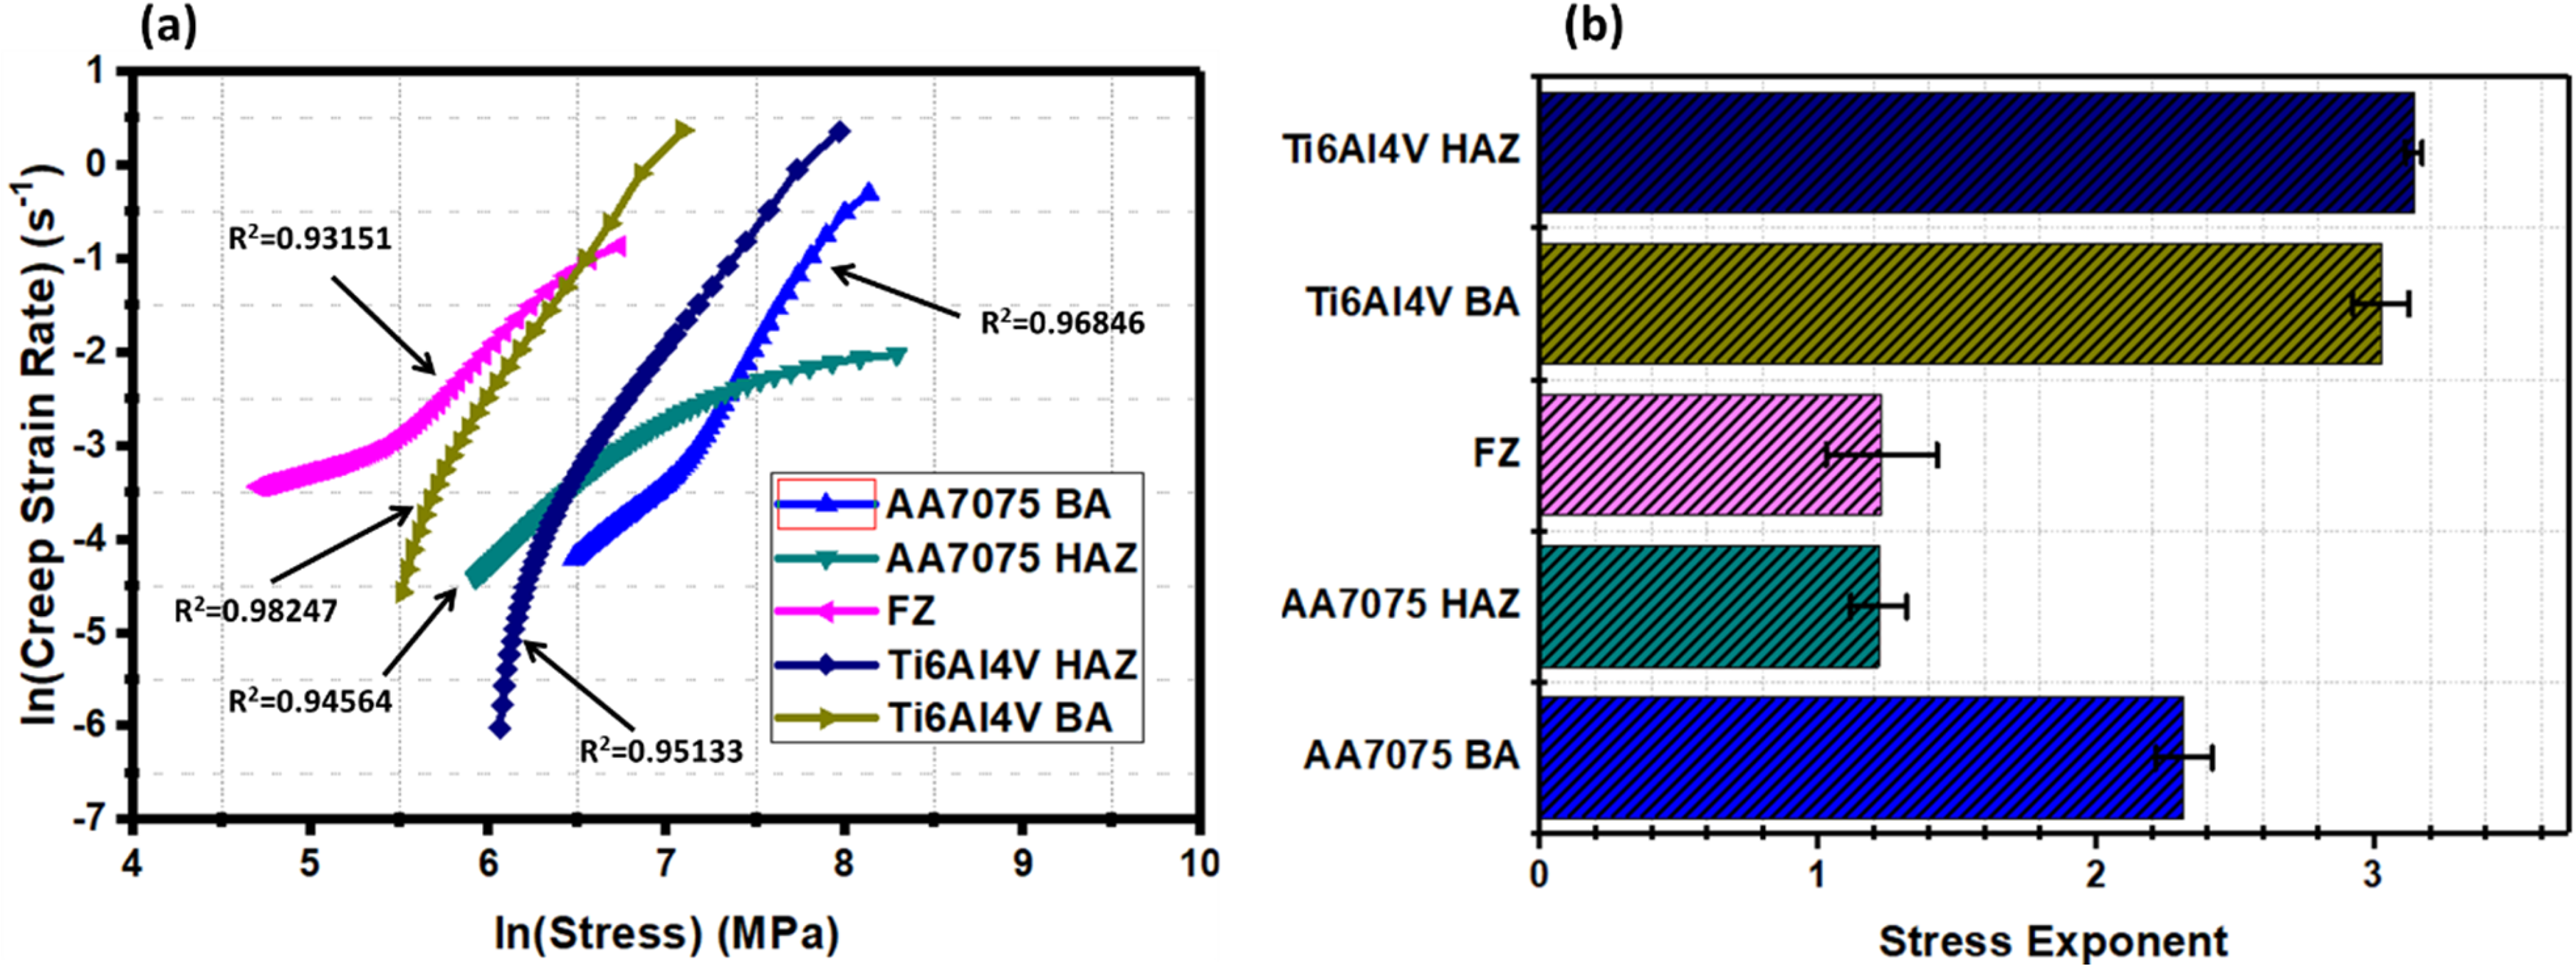
(a) Curves showing the creep strain rate versus stress, and (b) Creep stress exponent values for each zone including base alloys.
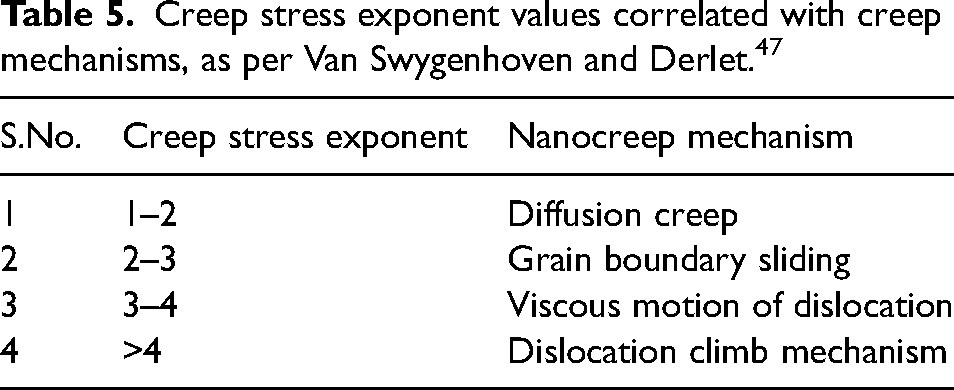
Creep stress exponent values correlated with creep mechanisms, as per Van Swygenhoven and Derlet. 47
It was found that the diffusional creep mechanism was predominant only in the FZ and AA7075 HAZ as shown in Figure 14(b). Additionally, the grain boundary sliding mechanism was observed in the AA7075 base alloy. In contrast, the dislocation creep mechanism was evident in the Ti6Al4V BA and Ti6Al4V HAZ, as their stress exponent values were slightly higher than 3 (Table 5). This higher stress exponent implies an increased generation and involvement of dislocations in the deformation process during the 200 s holding time under constant load, as explained by Zhang et al. 48 The generation of dislocations during loading is proportional to the applied load or indentation depth, and these dislocations form in the plastically deformed region beneath the indenter, as discussed by Almasri and Voyiadjis. 49
The Ti6Al4V HAZ, owing to the formation of the martensitic α phase, resulted in a high dislocation density beneath the indenter. Consequently, this bead exhibited a higher stress exponent compared to the other weld beads. This finding emphasizes the intricate relationship between microstructural characteristics (phase transformation in Ti6Al4V HAZ and formation of less brittle IMCs) and the mechanical properties, like nanohardness and creep behavior, in dissimilar weldments of AA7075/Ti6Al4V with Ag interlayer.
AFM analysis
During nanoindentation, material displacement occurs, creating a pile-up around the indent's edges. This phenomenon for AA7075 BA, FZ, and Ti6Al4V BA, through AFM analysis, is shown in Figures 15–17. The 2-D AFM images of them along with their corresponding line surface profiles are also depicted in Figures 15–17. Insets in these figures provide side-view 3D mappings. This is a color-coded topographical map produced by an AFM after performing nanoindentation on a material. The indent is the central feature, shown by a change in color that indicates a variation in height due to the indentation process. The varied colors surrounding the indent suggest a gradient in topography, with red and yellow areas indicating higher regions—these are the pile-ups. The gradient of colors from red to blue illustrates the transition from the raised pile-up area back to the baseline surface level. The uniform background suggests that the surface outside the immediate indentation area is relatively flat and unaltered. The right image with 3-D insets in Figures 15–17 is a cross-sectional analysis of the indentation. The lines represent profiles taken at different points across the indent. The deepest point corresponds to the maximum penetration of the indenter, and the surrounding raised lines show the height of the material that has piled up around it. The Gwyddion software was used to measure the depth of the indent and the height of the pile-up, providing quantitative data on the material's response to indentation. The indentation depth in the FZ (Figure 16) is notably deeper than that in the AA7075 BA and Ti6Al4V BA (Figures 15 and 17), indicating a higher degree of plastic deformation in the former.
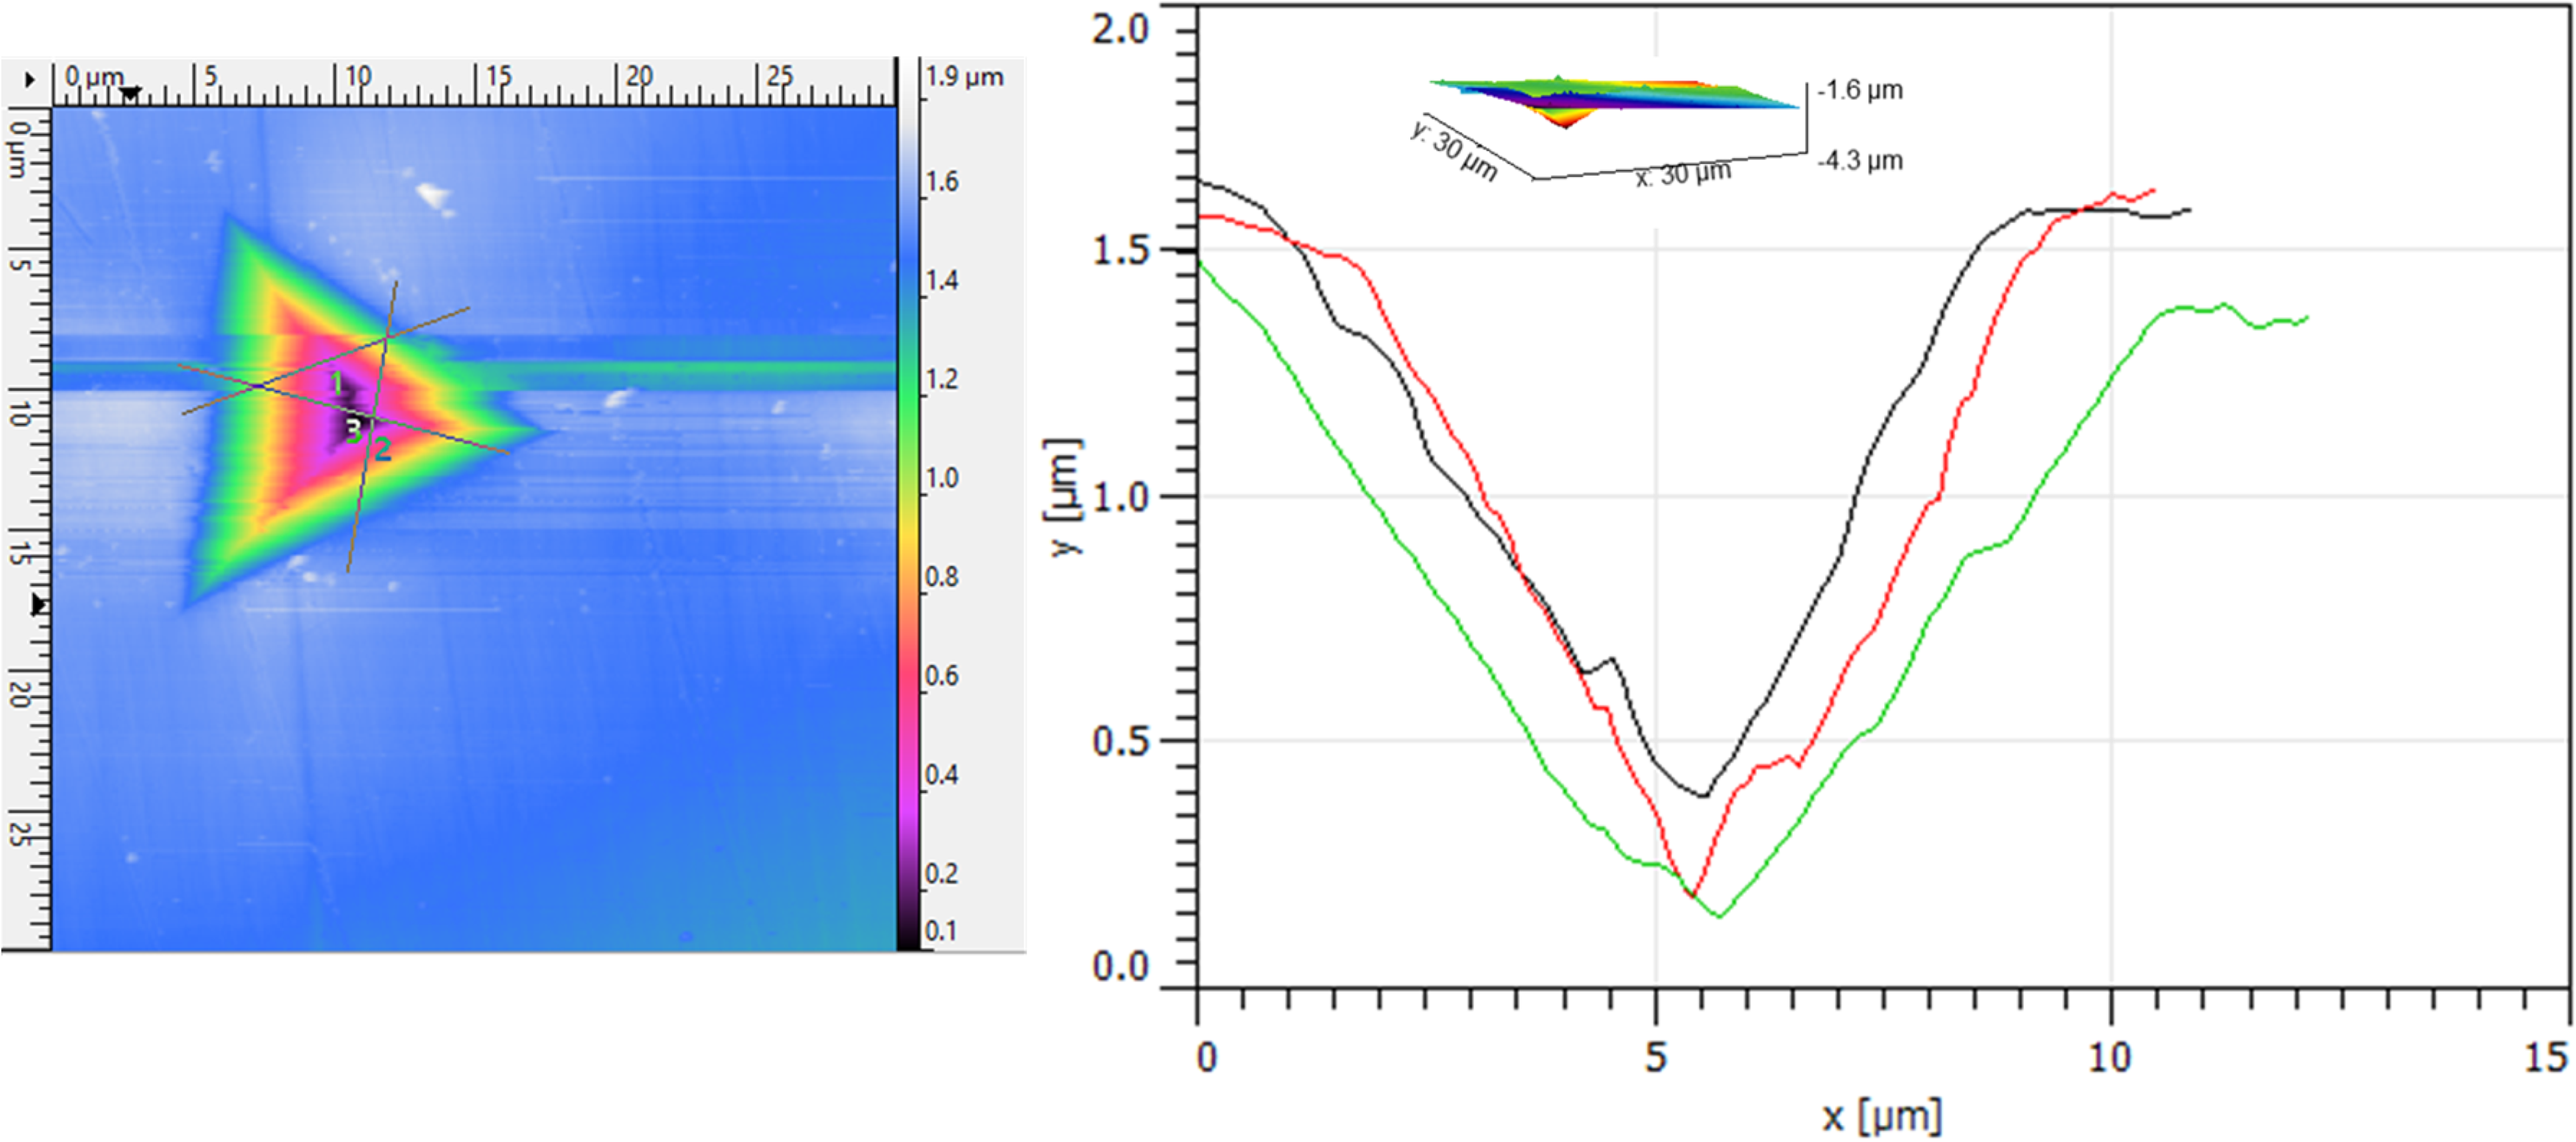
2-D (Left image) and 3-D images (inset in right image) of nanoindentation along with depth measurement profiles of AA7075 BA.
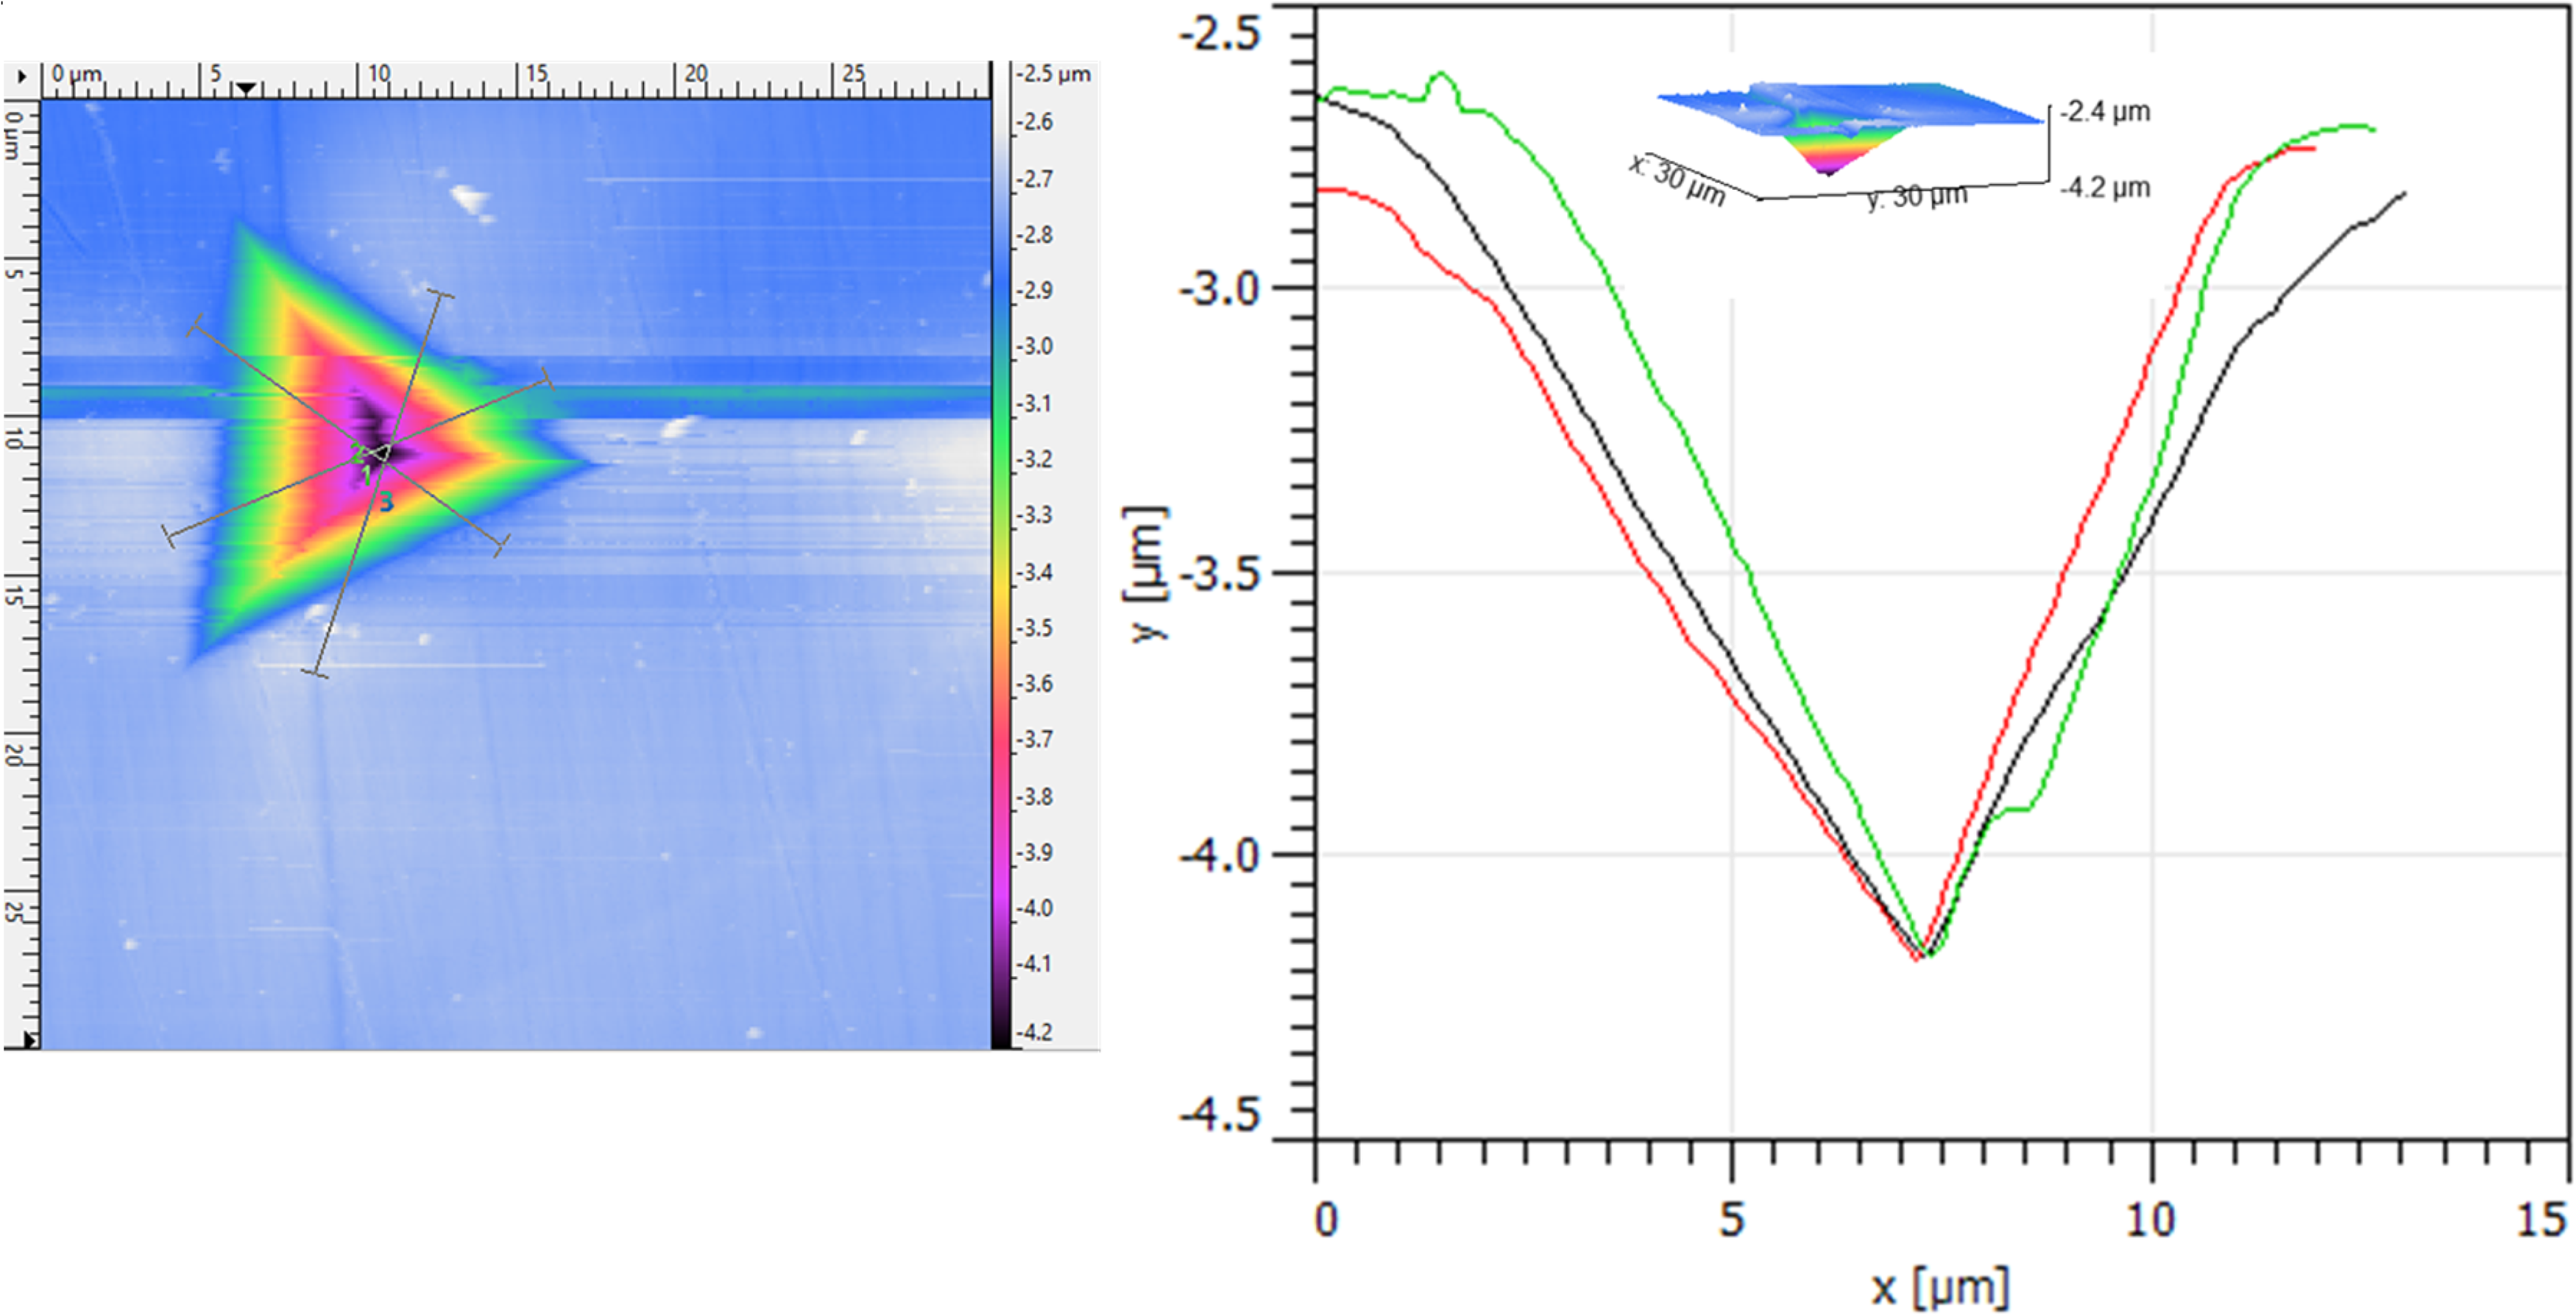
2-D and 3-D images of nanoindentation along with depth measurement profiles of FZ.
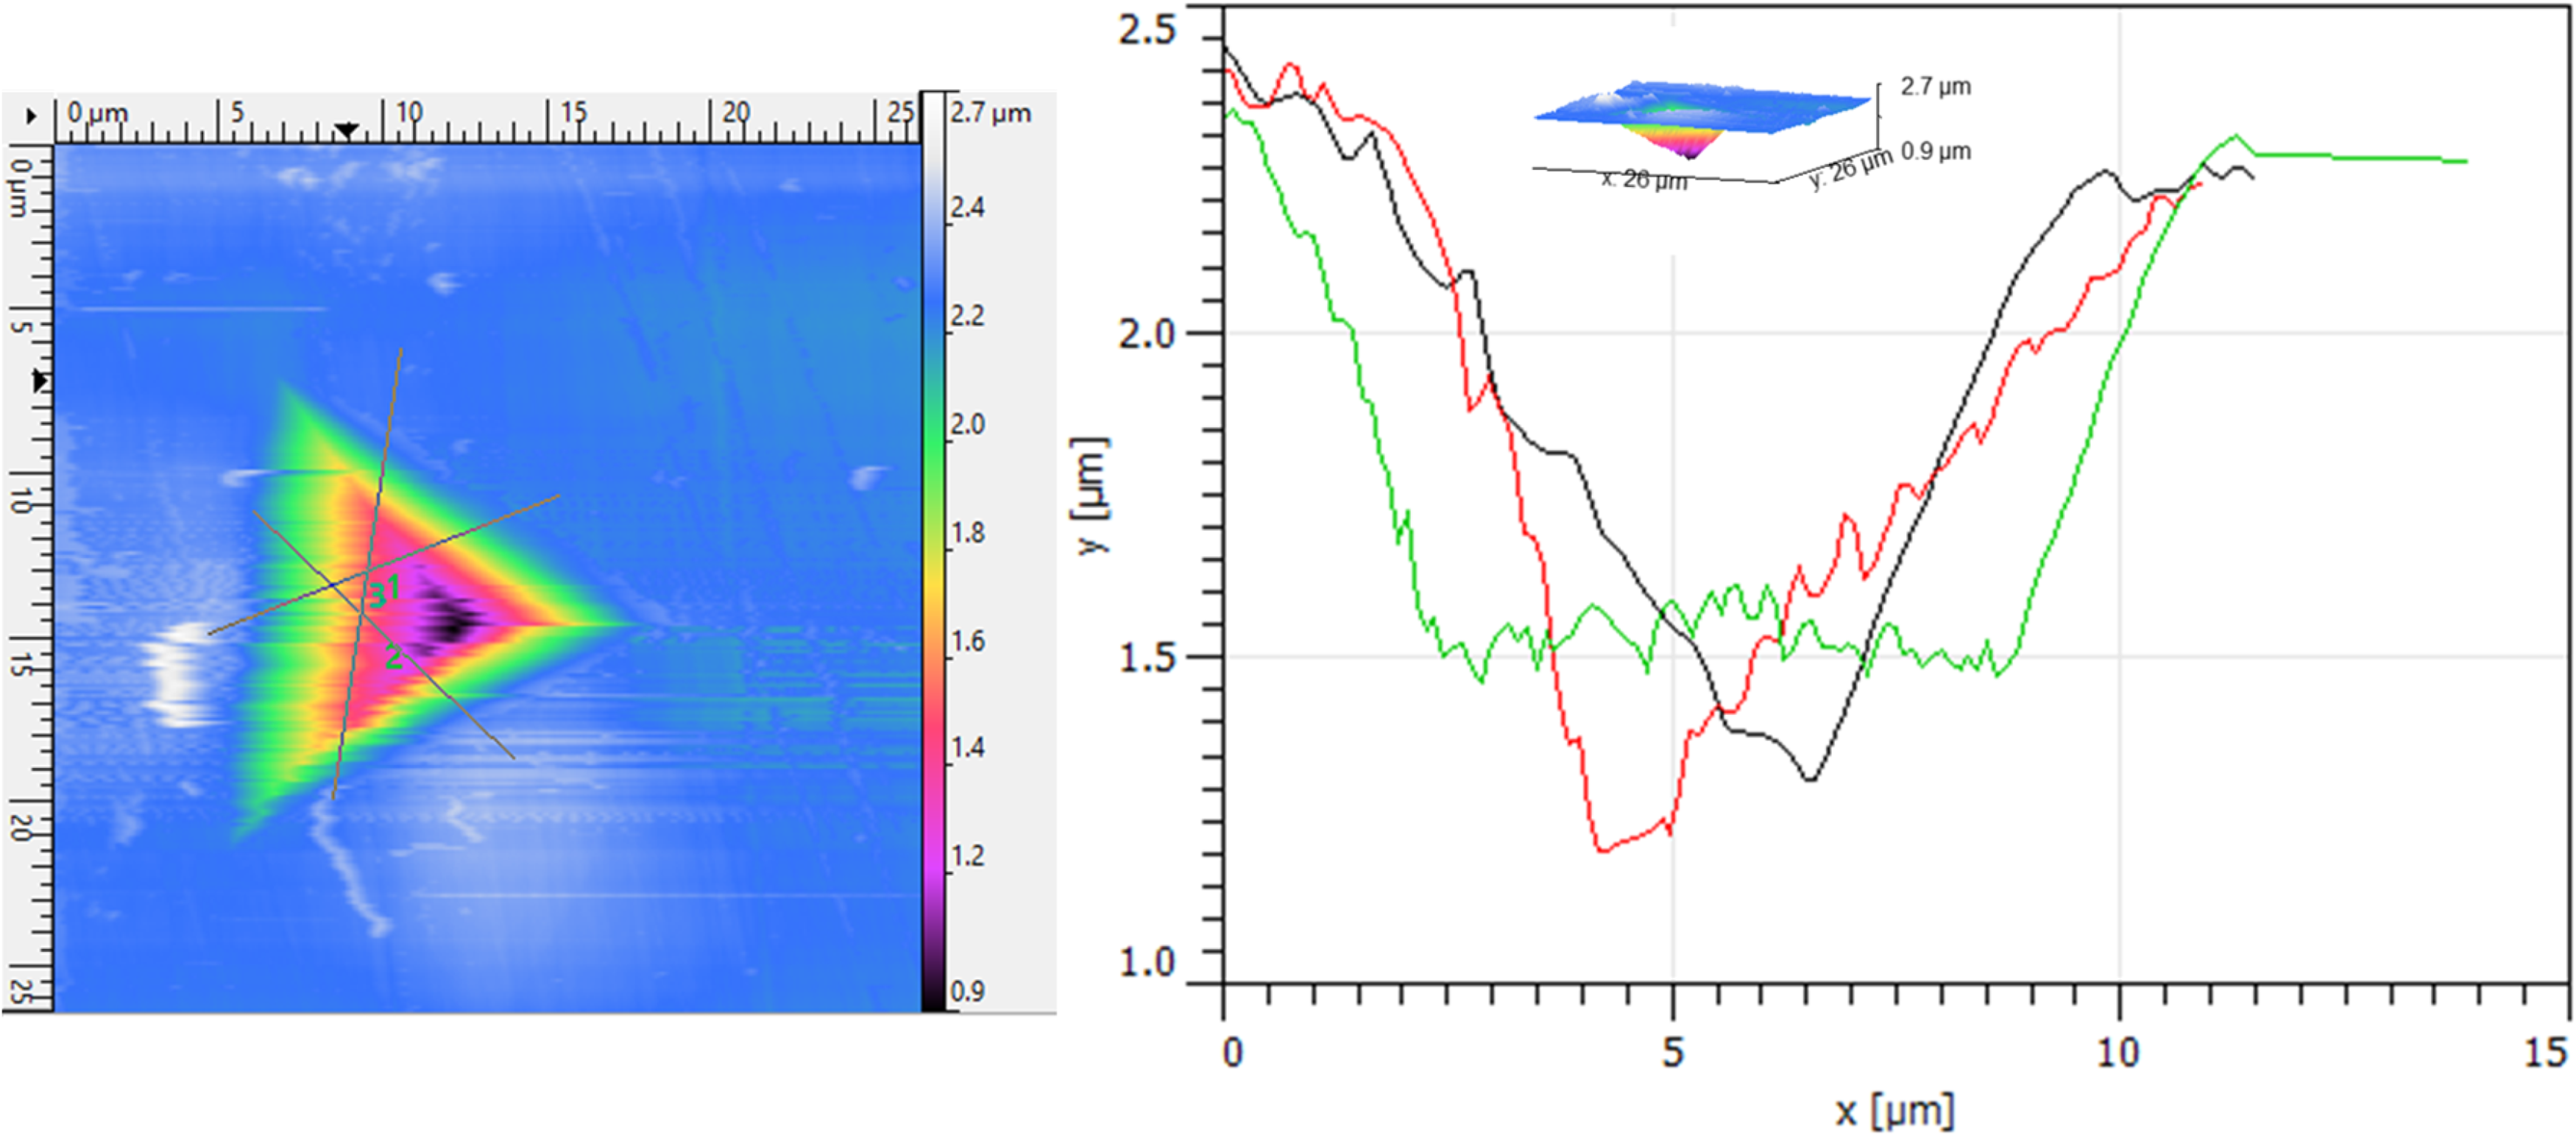
2-D and 3-D images of nanoindentation along with depth measurement profiles of Ti6Al4V BA.
Conclusions
The study investigated a laser-welded joint between AA7075 and Ti6Al4V with an Ag interlayer, focusing on the changes in microstructure and using nanoindentation and nanocreep analysis. The findings led to these conclusions:
Incorporating Ag as an interlayer in the AA7075/Ti6Al4V joint inhibited the development of brittle IMCs like AlTi3 and AlTi, enhancing the joint's quality by minimizing the interaction between Ti and Al. The microhardness results revealed that the FZ had greater values than the AA7075 HAZ and AA7075 BA due to the formation of Ag2Al and Al3Ti phases. Nanoindentation P−h curves revealed that the fusion zone (FZ) had lower displacement depth and greater nanohardness compared to the HAZ and AA7075 BA. Nanoindentation and nanocreep analysis indicated different deformation mechanisms in the base alloys and different zones of the joint. The FZ and AA7075 HAZ showed diffusional creep (lowest stress exponent), the AA7075 BA exhibited grain boundary sliding creep (stress exponent between 2 and 3), and the Ti6Al4V HAZ along with Ti6Al4V BA demonstrated dislocation climb creep mechanism (highest stress exponent). Comparing the joint with Ag interlayer and without Ag interlayer, it can be inferred that the interlayer enhanced the diffusion process in the FZ and HAZ of AA7075, resulting in increasing its creep resistance due to an altered microstructure with fewer IMCs. AFM revealed higher average plastic deformation in the FZ compared to the AA7075 BA and Ti6Al4V BA, owing to fewer dislocations.
The present study examined the microstructure and nanomechanical properties of dissimilar joints with Ag interlayer. Future investigations are needed to understand how an Ag interlayer influences the corrosion resistance of the joint.
Footnotes
Acknowledgments
The authors would like to thank and appreciate Dr Claude Belzile for his assistance in EDS analysis.
Declaration of conflicting interests
The authors declared no potential conflicts of interest with respect to the research, authorship, and/or publication of this article.
Ethics approval
This study follows the ethical standards and corresponding guidelines.
Funding
The authors received no financial support for the research, authorship, and/or publication of this article.