
Abstract
Injection moulding of short-fibre-reinforced thermoplastics opens a new dimension in the field of mass production of complicated net-shaped parts with accurate dimensions and the new challenge is to produce parts with tailored properties. However, the layered structure frequently observed in these composites strongly affects their mechanical behaviour and constitutes the main difficulty in transferring the results of tests performed on standard specimens to actual components and parts. In addition, to use injection-moulded composite materials safely, their mechanical behaviour under different loading conditions must be well understood. In the present work, the effect of microstructure, in terms of fibre length and orientation, on the tensile and impact behaviour of injection-moulded short-glass fibre-reinforced polyamide 6.6 was investigated. Digital reconstruction of the three-dimensional structure of samples, differently oriented with respect to the melt flow path, was obtained by the high-spatial-resolution non-destructive technique of synchrotron radiation micro-computed tomography (micro-CT). Automatic evaluation of the fibre length distribution was developed by a global method based on the mean fibre length distribution, computed from the star length distribution (SLD). The results of uniaxial tensile tests and Izod impact experiments were successfully correlated with morphological analysis of fractured surfaces and the results of SLD. These studies revealed important changes in fibre orientation distribution when the sample orientation is changed with respect to melt flow direction, which also strongly influenced the composite mechanical response.
Keywords
Introduction
The increasing use of short-fibre-reinforced composites (SFRCs) for the production of load-bearing components and parts for many industries and applications, such as in the transportation industry, durable consumer items, and sporting goods, is mainly due to ease of fabrication, reduction in weight and low process costs. In these composites, the mechanical properties depend on several parameters such as matrix properties, fibre/matrix interfacial adhesion, reinforcement volume fraction and fibre structure distribution in terms of position and orientation.1–2 The strengthening effect of fibre is strongly affected by the relation between fibre length and fibre orientation and the direction of the stresses acting in the component. 3
SFRCs can be easily formed into complex-shaped structures through conventional moulding processes such as transfer, compression, and injection moulding techniques. 4 Among these methods, injection moulding is the most widely used, as it allows forming complex shapes at a high production rate due to its cyclic nature. 5 Injection moulding of fibre-reinforced thermoplastics opens a new dimension in mass production of complicated net-shaped parts with accurate dimensions, and the new challenge is to produce parts with tailored properties. 6
By injection moulding, fibre orientation in the component is determined by the dynamics of melt polymer filling the mould cavity and behaving like a viscous fluid. Hence, fibre orientation results from a complex interaction of two main effects. One is the shear flow that tends to align the fibre with fluid velocity vectors, usually in the proximity of the mould walls and in the case of converging streamlines. The other effect is the extensional drift that arranges the fibre perpendicular to the melt polymer flow, usually observed in the case of diverging streamlines and at the flow front under certain conditions such as fountain flow.7–8 These combined effects often lead to the formation of a layered structure. In particular, when plates are injected through an edge gate, a skin–shell–core structure is obtained. Fibre orientation is almost random in the skin layer (usually in the order of 100 micrometers for samples about 3 mm thick 9 ), parallel to the melt flow in the shell layer, and perpendicular to the melt flow in the core layer. The effects of this layered structure on the mechanical behaviour of injection-moulded composites have been already extensively reported.8,10 They constitute the main difficulty in transferring the results of tests performed on standard specimens to actual components and parts. In fact, in order to use these materials safely, it is necessary to determine their mechanical behaviour under different loading conditions. Tests are usually performed on standard injection moulded specimens, which display a high fibre alignment along the specimen axis due to the regular geometry enforcing high shear flow. In real parts, on the other hand, this effect is less pronounced. Moreover, in components of irregular shape, the fibre orientation pattern is very complex and different fibre orientations may be found through the thickness of a specimen at the same location. Thus, in order to transfer test results to any real part, it is necessary to correctly evaluate and account for these differences in fibre orientation and length distributions. 11
Several micro-mechanical models have been proposed to predict SFRC properties, which take into account the fibre geometry and the influence of fibre length on the shear strain distribution at the fibre end. In all models, both fibre orientation and fibre length distribution are fundamental to mechanical properties.12–13
Although the basic flow-induced fibre orientation phenomena are well understood, the details in actual injection-moulded parts are not so easily captured 14 and further research is still required.
Knowledge of fibre orientation distribution in injection-moulded composite parts is of great importance, since the distribution locally affects the mechanical and physical properties of the final part such as its strength, impact toughness, internal stress, and fatigue behaviour. It has been well established in the literature that the mechanical and physical properties are isotropic where fibre is randomly oriented, whereas in case of anisotropic distributions the composites are stiffer and stronger in the direction of alignment of the fibre when compared to the other directions.
Several researchers have been interested in developing useful and accurate techniques for determining fibre orientation in injection-moulded composite parts.
Both destructive and non-destructive techniques have been used to obtain fibre orientation in short-fibre reinforced polymers. Destructive methods generally consist of cutting, polishing, and observing a material sample. Hence, some improved methods have been developed to overcome this difficulty.15–16 However, much more work is still needed in this field.
Standard non-destructive techniques often use 2D analysis to obtain fibre orientation. However, they only capture fibre orientation of planar distribution of fibre rather than the different orientations along sample thickness. A complete spatial distribution of fibre (fibre orientation and length distributions) in short-fibre reinforced polymers can be obtained from non-destructive computed micro-tomography (micro-CT). It consists of the acquisition of a large number of radiographic projections captured at different angular positions of the sample (which is placed on a rotary table) with respect to the source of X-rays, usually completing a 180° rotation. By means of specific algorithms (e.g. those implementing the back-projection method), from the different angular projections it is possible to reconstruct the transverse sections (slices). By stacking the sequence of slices, it can be obtained a volumetric representation of the sample and visualize its internal structure. While conventional micro-CT images are generated from the absorption properties of the sample, phase contrast radiography techniques can be used due to the high spatial coherence of the synchrotron source, enhancing the visibility of the fibre borders, and reducing beam hardening artifacts. The clear definition of the material microstructure achievable with the synchrotron light micro-CT technique is of particular interest for the analysis of fibre orientation in composite materials. Fibre orientations and material layer structure can be detected, as well as the formation of defects during manufacturing and service.17–21 Although micro-CT appears as a powerful non-destructive technique, the correlation between the microstructure of SFRPs obtained by this method and their mechanical response is still a topic of current research.
In the present work, the effect of microstructure (in terms of fibre length and fibre orientation) on the tensile and impact behaviour of injection-moulded short-glass fibre 30% in weight) reinforced polyamide 6.6 (PA 6.6) was investigated. Computed micro-tomography was used to describe the fibre length distribution for samples obtained in different orientations with respect to the melt flow direction (MFD). Uniaxial tensile and Izod impact tests were performed on differently oriented samples and morphological analysis of fractured surfaces was also applied.
Materials and methods
Samples
In this study, a polyamide 6.6 reinforced with 30% by weight short E glass fibre (PA6.6-GF30, manufactured by Radici Group High-Performance Polymers, Chignolo d’Isola BG, Italy) was investigated. The nominal diameter of the fibre was 11 μm, as confirmed by high magnification optical microscopy in a 35% glass fibre-reinforced polyamide 6.6 with fibres of the same nominal diameter, produced by the same manufacturer in Bernasconi et al.. 22 Similar results were also obtained by Thomason. 23
Micro-CT samples
The micro-CT samples were obtained from dumbbell specimens cut from rectangular plates (nominal dimensions 120 mm × 180 mm × 3.2 mm, actual thickness 3.12 mm) and injection moulded through a film gate on the shorter edge. This process ensures a uniform melt polymer flow during the injection process. 24 Thus, the fibres in the shell layer are expected to be oriented parallel to the MFD, whereas fibre in the core is more likely to be oriented perpendicular to the MFD (Figure 1).
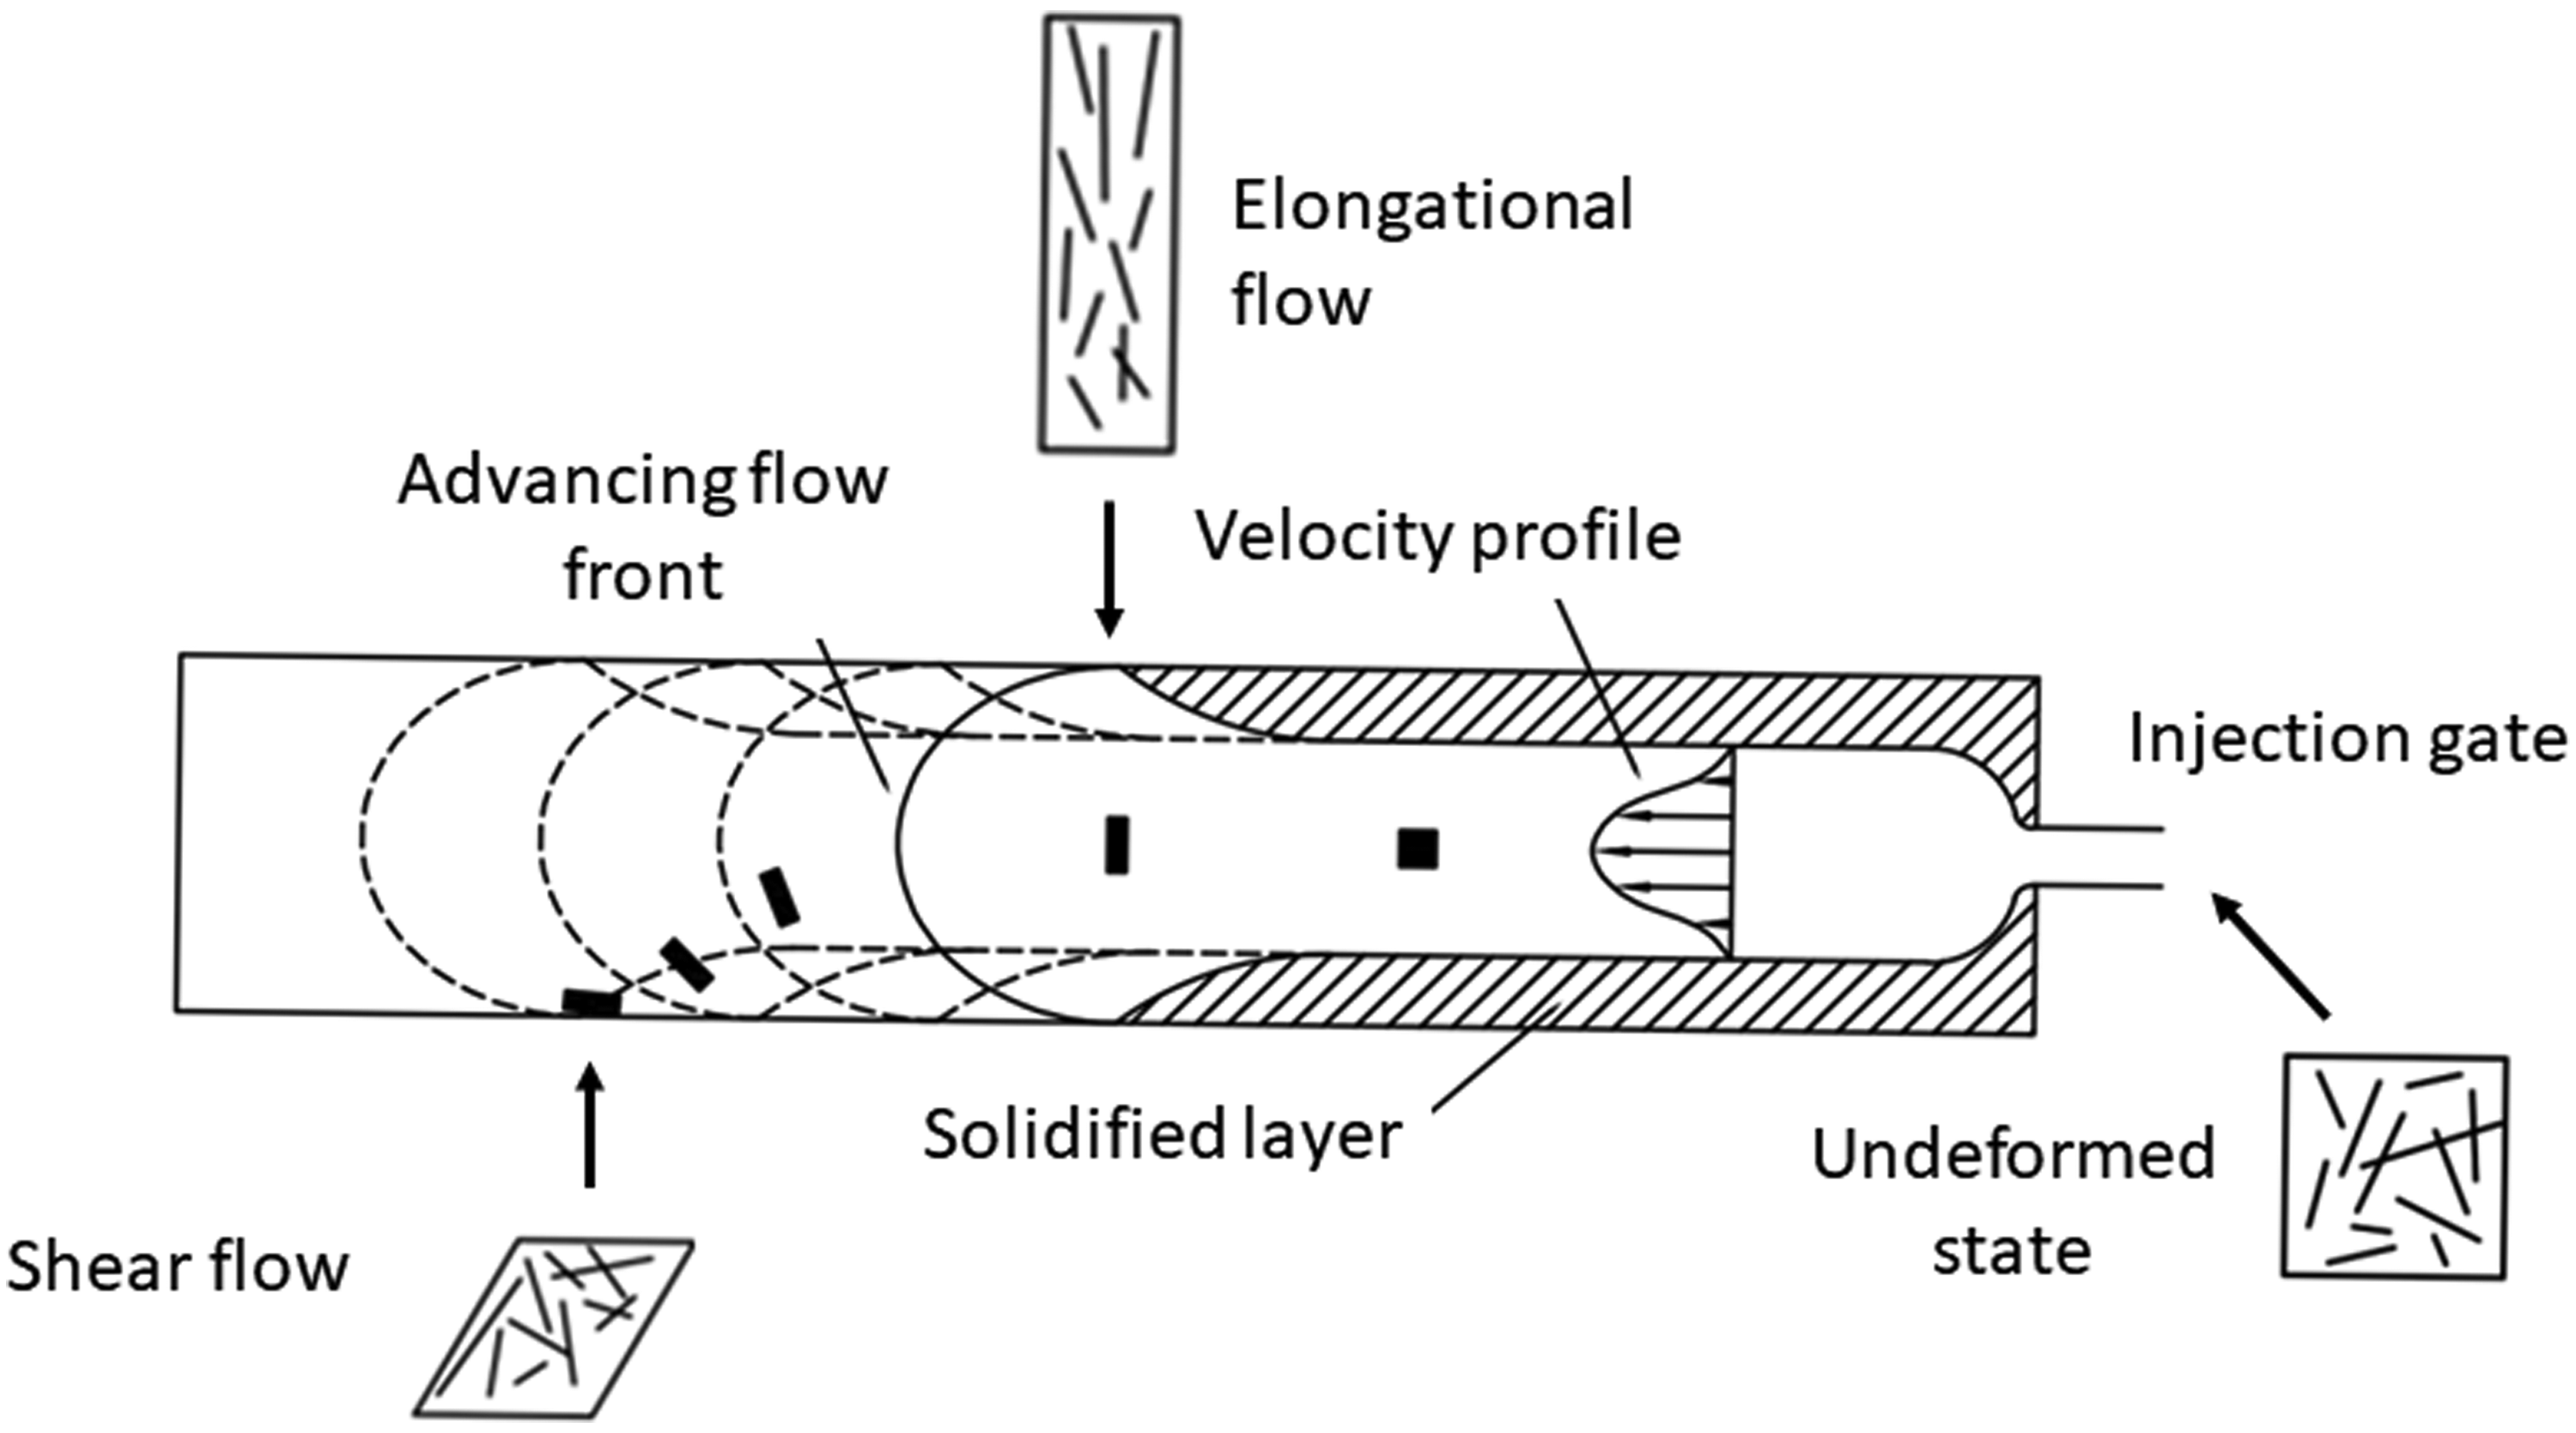
Mechanism of fibre arrangement.
As detailed below, during the micro-CT acquisition the sample is rotated. Given the original plate thickness used in this work, in order to ensure similar RX absorption conditions for each projection, each sample was cut in the shape of a prism of 3.2 mm × 3.6 mm × 5 mm, as shown in Figure 2. The sample was obtained from the central portion of the tensile specimen as this portion was the most loaded in tensile tests.
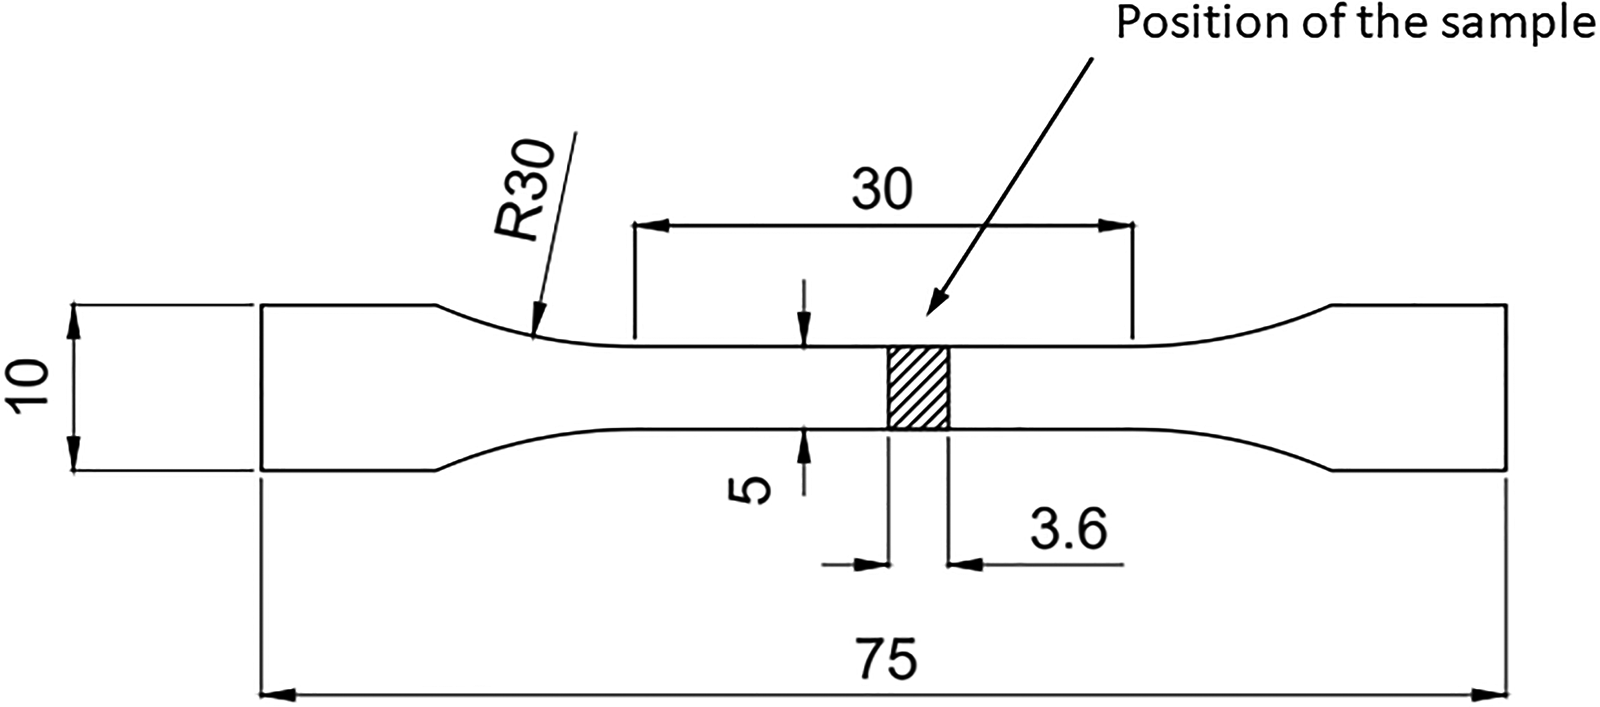
Micro-computed tomography samples obtained from tensile dumbbell specimens with different orientations with respect to the MFD.
Tensile and Izod samples
All samples, tensile dumbbell specimens (type 1BA) and rectangular Izod specimens (notch type A), were machined out by dry milling from the injection-moulded plates in accordance with ISO 527:2019 and ISO 180:2019 standards, respectively, at different orientations with respect to the MFD (0°, 15°, 30°, 45°, 60°, 75°, 90°) as sketched in Figure 3(a) and 3(b).
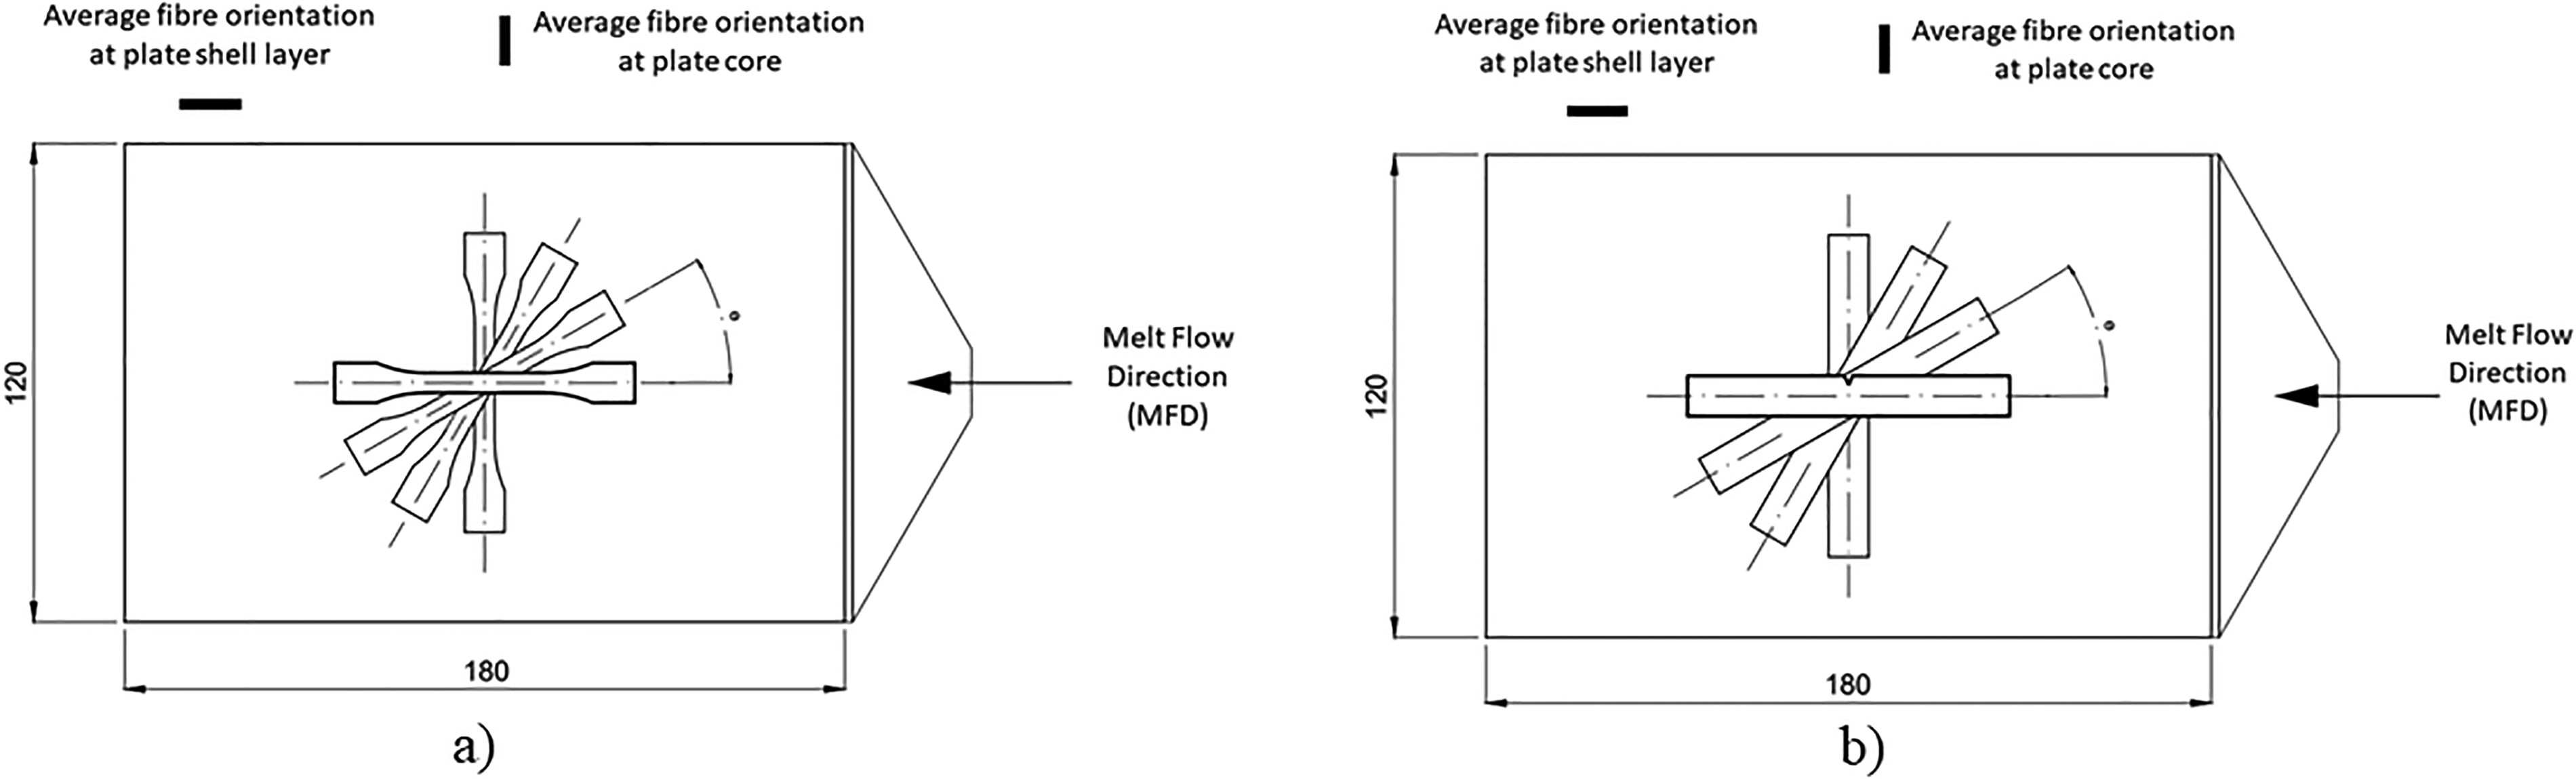
Representation of the samples cut at different orientations with respect to the melt flow direction (MFD). (a) Tensile samples. (b) Izod samples.
Scanning electron microscopy
The morphology of fracture surfaces of differently oriented samples broken in tensile tests was investigated by scanning electron microscopy (SEM). A scanning electron microscope Phenom X at an accelerated voltage of 5 kV was used.
Micro-CT investigation
Micro-CT was performed at the Syrmep beamline of the Elettra synchrotron radiation facility in Trieste (Italy),11–12,24–27 in a white beam, at a detector-source distance of 10 cm, working with an energy of 20 keV. In this work, for each tomography, 575 radiograms were acquired by rotating the sample up to 180 °C with a rotary table and, by applying SYRMEP in-house retro-projection algorithms, different transverse sections (slices) were reconstructed, reproducing the internal structure of the sample at a 9 µm resolution. For each package of 180 slices, the precise centre of rotation was determined. Wrong assessment of the centre of rotation implies the presence of scratches and low-definition zones with the subsequent false image determination.
Given the high spatial coherence of synchrotron light sources, Phase Contrast imaging techniques, which exploit information on phase shifts induced by the sample on radiation field, improving contrast at the edges of details of small dimensions like glass fibre, contributed to improving the visibility of fibre notwithstanding the relatively small pixel size. 28
Digital filters were also applied to eliminate artifacts: the images were preprocessed using an “enhance contrast” filter to improve the definition of fibre. The enhance contrast function introduced a neglectable change in the fibre volume fraction, less than 1%.
To verify that fibre distribution and orientation inside the composite agreed with expectations for injection moulded samples, different zones were analyzed in each sample: the skin zone (random fibre distribution), the shell zone (fibre orientation parallel to the injection flow direction) and the core zone (fibre oriented perpendicular to the flow as a result of shear-flow).
Image processing
Images were processed in specific computer software such as Fiji 29 and Quant3D. 30
Once the images were converted to 8 bits, grey tones between 0 and 255 were obtained (from black to white). The histogram representing the grey scale was the result of the addition of each single histogram relative to each previous phase, derived from the different X-ray absorption from the investigated sample and from possible effects of phase contrast.
Threshold assessment
To identify the different phases within the sample, the digital 3D image was segmented, using the method previously described in Bernasconi A et al., Cosmi and Bernasconi, and Bernasconi A et al.25–27 The aim of the procedure is to assess a threshold, which discriminates the fibre (clearer zone) from the matrix (darker zone). By knowing the weight fraction of glass fibre in the sample (declared 30% by the manufacturer), the reinforcement volume fraction is obtained by the formula: Vf, Vm and Vt: are the volume fraction of fibre, of matrix and the total volume, respectively; Mf, Mm and Mt: are the mass of the fibre, of the matrix and the total mass, respectively; ρm and ρf: are the density of the matrix and the fibre, Kf and Km: are weight fraction of fibre and matrix, respectively,
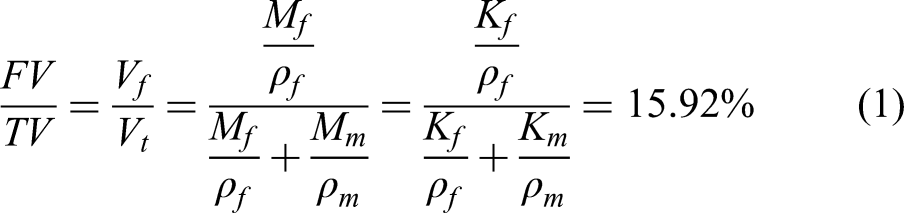
and, for our samples in PA 6.6 at 30% glass fibre, Kf = 30% = 0.3; ρm = 1.14 g/cm3 and ρf = 2.58 g/cm3. With these values, following the procedure proposed in Bernasconi et al. 25 it was possible to calculate the threshold value for each sample in Quant3D, by matching the ratio between the light tones (which represented the fibres) and total tones to the expected value of fibre volume fraction, 15.92%. Grey tones from 0 to the obtained threshold identify matrix and the other tones represent fibres. This procedure was performed for all the samples under investigation.
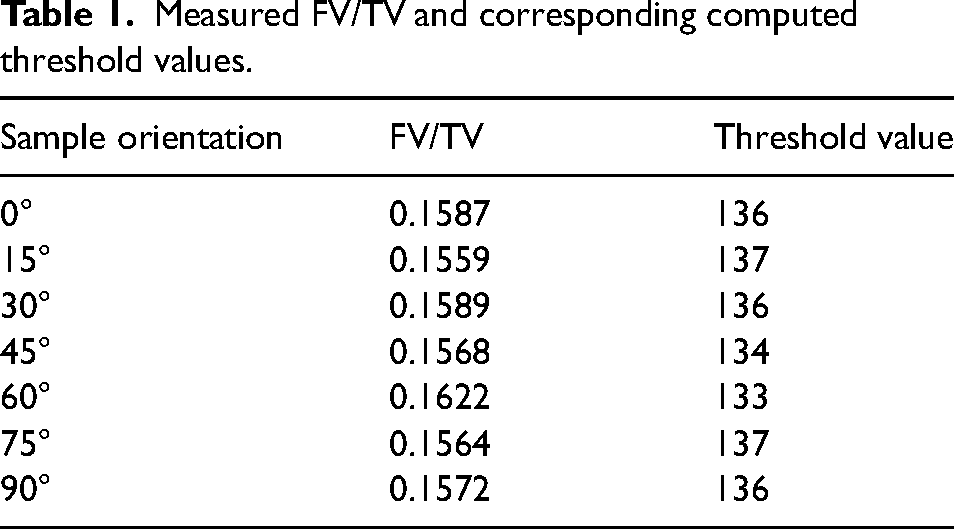
It should be noted that, since any 8-bit image has a discrete 256 range of possible grey-tones, the algorithm sets the threshold to the integer value in the 0–255 range that best approximates the target FV/TV ratio of 15.92%, corresponding to the volumetric fibre fraction in the composite. Moreover, considering the complexity of the melt flow that distributes the fibres in the sample, small local variations from the nominal manufacturer target are also to be expected. The range of the threshold value fluctuations resulting from these effects, reported in Table 1, is less than 1.5% and thus negligible.
Measured FV/TV and corresponding computed threshold values.
Morphological analysis
After segmentation, the shell and core zones of the samples were identified, and star length distribution (SLD) and Fibres Length Distribution were evaluated.
The SLD is a morphological parameter used to investigate structural anisotropy. Anisotropy is frequently described by the main directions perpendicular to the symmetry planes of the structure, and by a number representing the concentration of directions around the main direction. A tensor can provide a concise description of the structural anisotropy by means of a 3 × 3 matrix, where eigenvectors give the main directions, and the eigenvalues represent the concentration degree around these directions. 31
The procedure for SLD computation was carried out by the Quant3D software, by calculating the average fibre length in a fan of 513 directions. 32 For each sample investigated, composed of two phases (fibre and matrix), the SLD value was determined by superimposing a pattern of 2000 points on the reconstructed 3D volume. For each point inside a fibre, the longest segment totally contained in the fibre, sj, was recorded. The points outside the fibre phase are discarded in the SLD determination. Figure 4 shows the SLD concept.
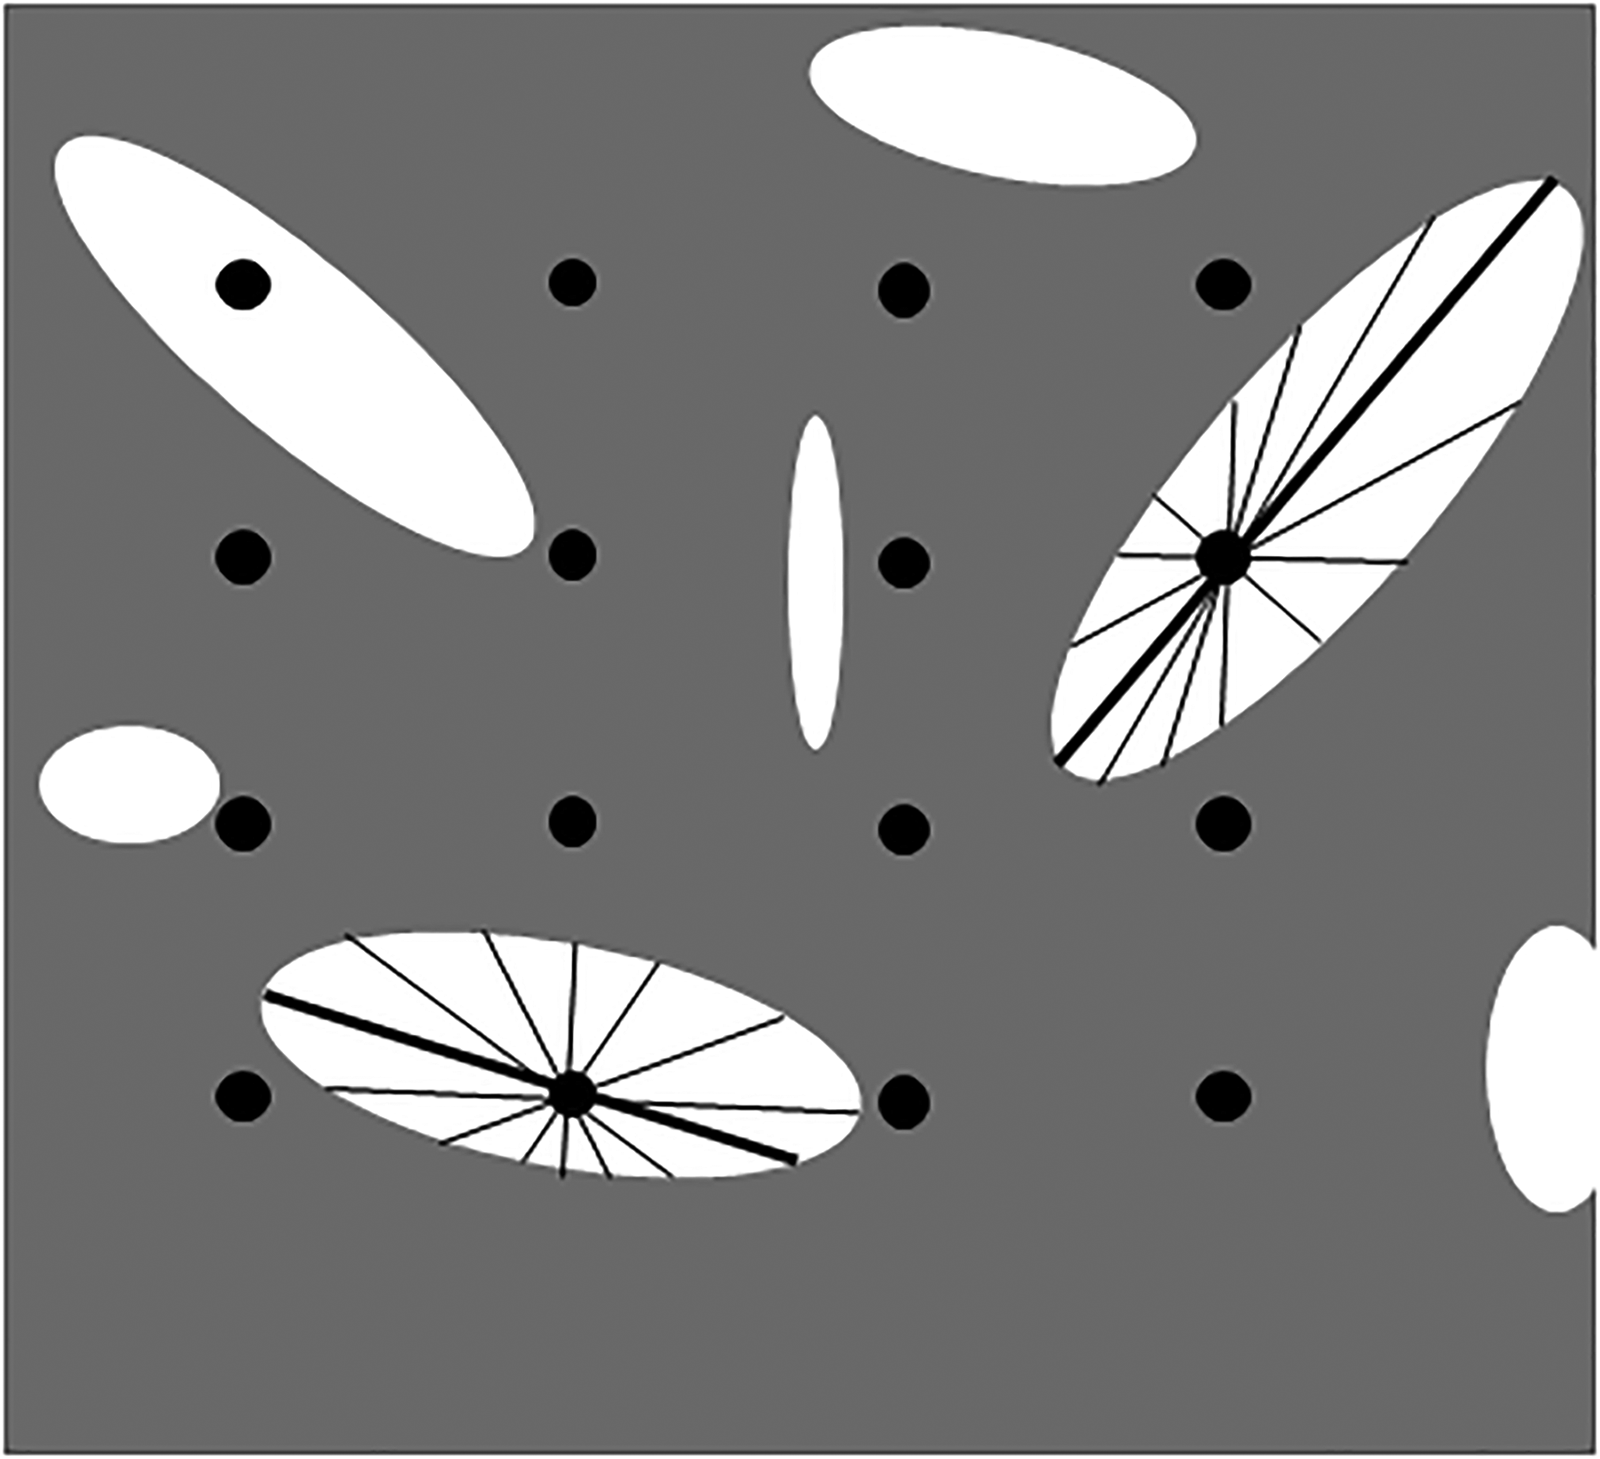
Star-length distribution analysis. Fibres in white against the matrix dark background.
Then, the value of SLD, representing the average sj in each direction ω
29
was determined with the formula: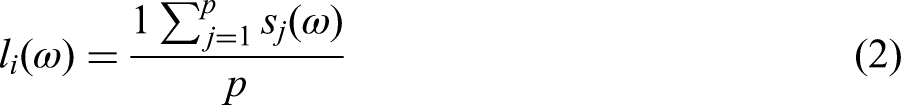
Finally, after length determination for all the orientations, the programme performs a graphic representation of eigenvectors and eigenvalues.
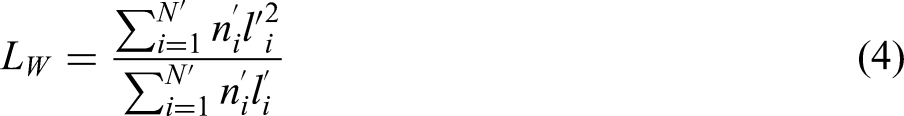
Fibres Length Distribution can be described with the average fibre length (L) and the weight average fibre length (Lw) which are expressed from equations (3) and (4):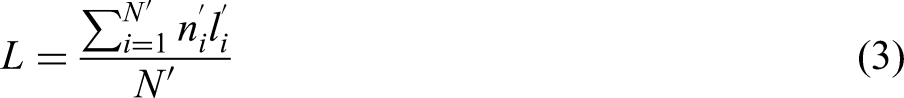
Mechanical characterization
Uniaxial tensile tests were carried out in an Instron dynamometer 5982 at 5 mm/min whereas Izod tests were performed in a CSI (CS-137D-177) Izod pendulum at 3.5 m/s. The material was tested in the conditioned state, i.e. at equilibrium with an ambient at 23 ± 2 °C and 50 ± 10% relative humidity for 48 h in accordance with ISO 527-1 (clausula 8) standard recommendations.
From the uniaxial tensile stress-strain curves, the tensile parameter values (Young's Modulus, tensile strength, and strain at break values), were determined.
From the impact tests, Izod impact strength values were obtained as the total energy absorbed by the specimen until fracture.
The average values obtained from at least five replicates, along with their deviations, are reported for all the mechanical parameters considered.
Results and discussion
SEM analysis
Figure 5 presents the SEM micrographs of the samples cut with different orientation with respect to the MFD, which were broken in tensile tests. As expected, the typical layered structure of injection moulded samples was observed. For samples cut in the longitudinal direction (0° with respect to the MFD), a high fibre alignment along the specimen axis was observed: fibre orientation was found to be perpendicular to the fracture surface at the shell layer and parallel to the fracture surface at the core. As the orientation angle with respect to the direction of the melt polymer flow increased, sample microstructure significantly changed in agreement with expectations. Samples cut at 45° displayed no clear layered structure whereas samples cut perpendicular (90°) to the MFD had an inverse layered structure: fibre orientation was parallel and perpendicular to the fracture surface at the shell layer and at the core, respectively.
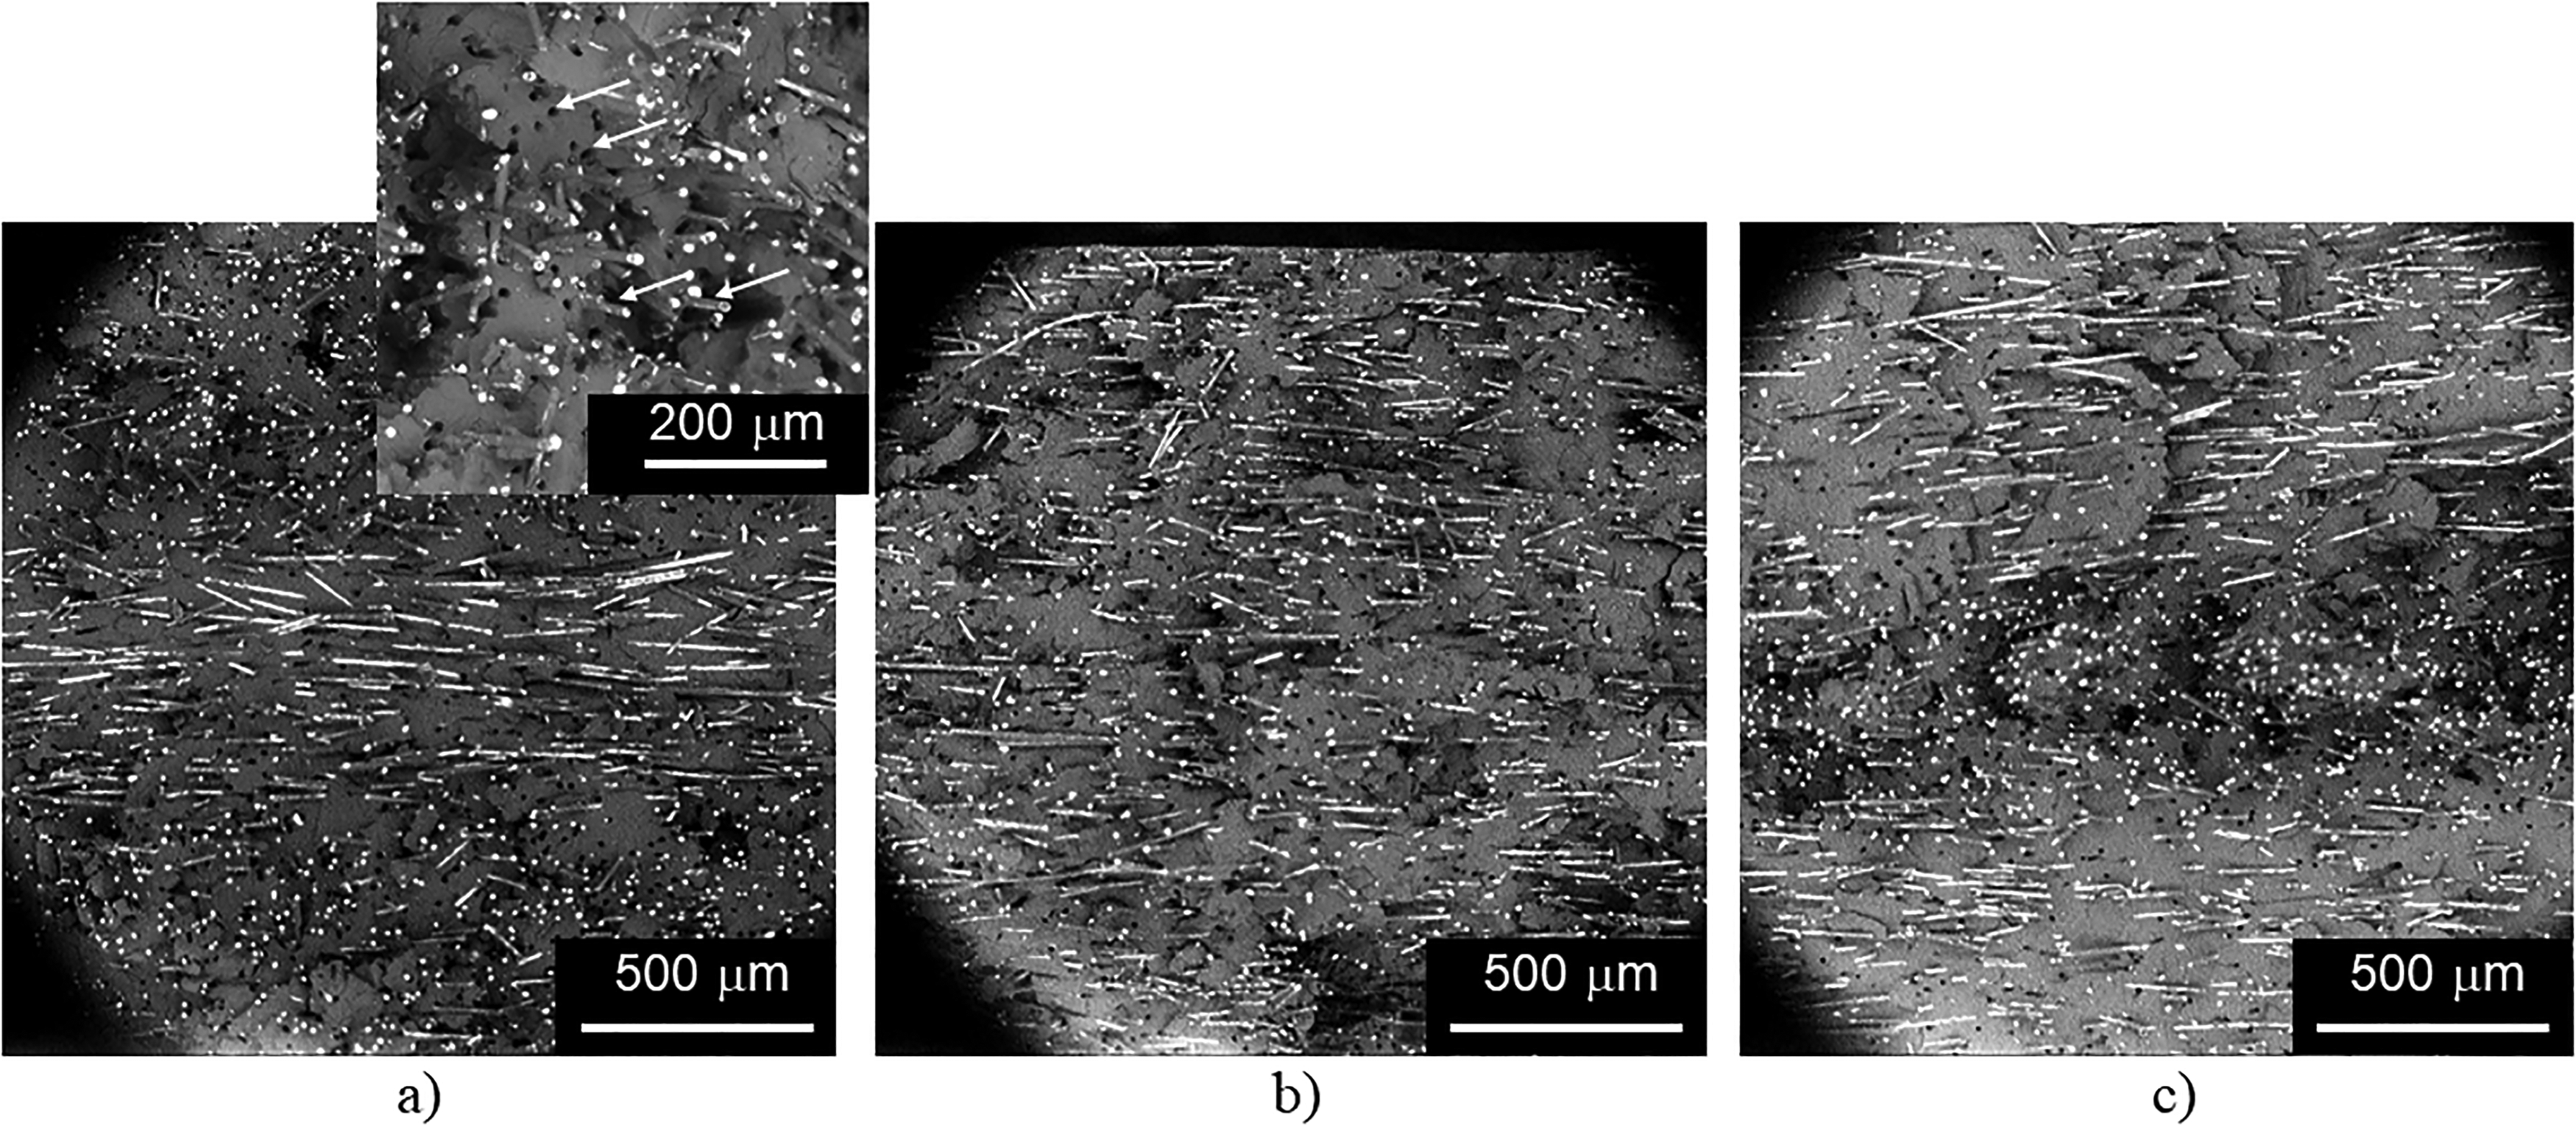
SEM micrographs of tensile samples cut at different orientations with respect to the MFD. (a) Sample oriented at 0°, (b) sample oriented at 45° and (c) sample oriented at 90°.
In addition, the fibre pullout mechanism frequently found in SFRCs is clearly observed in the SEM micrographs of Figure 5 (see white arrows in the insert of Figure 5 a). Properly oriented fibre was found to be pulled out from the matrix as a result of a relatively poor interfacial strength between glass fibre and polyamide 6.6.
Three-dimensional morphological analysis
Fibre length distribution
The polar representation of SLD measurements in each of the 513 orientations investigated is presented in Figures 6(a), 6(b) and 6(c) for samples that were cut at different orientations with respect to the MFD. These polar diagrams can be approximated to ellipsoids, or equivalently, to second-order tensors. 32
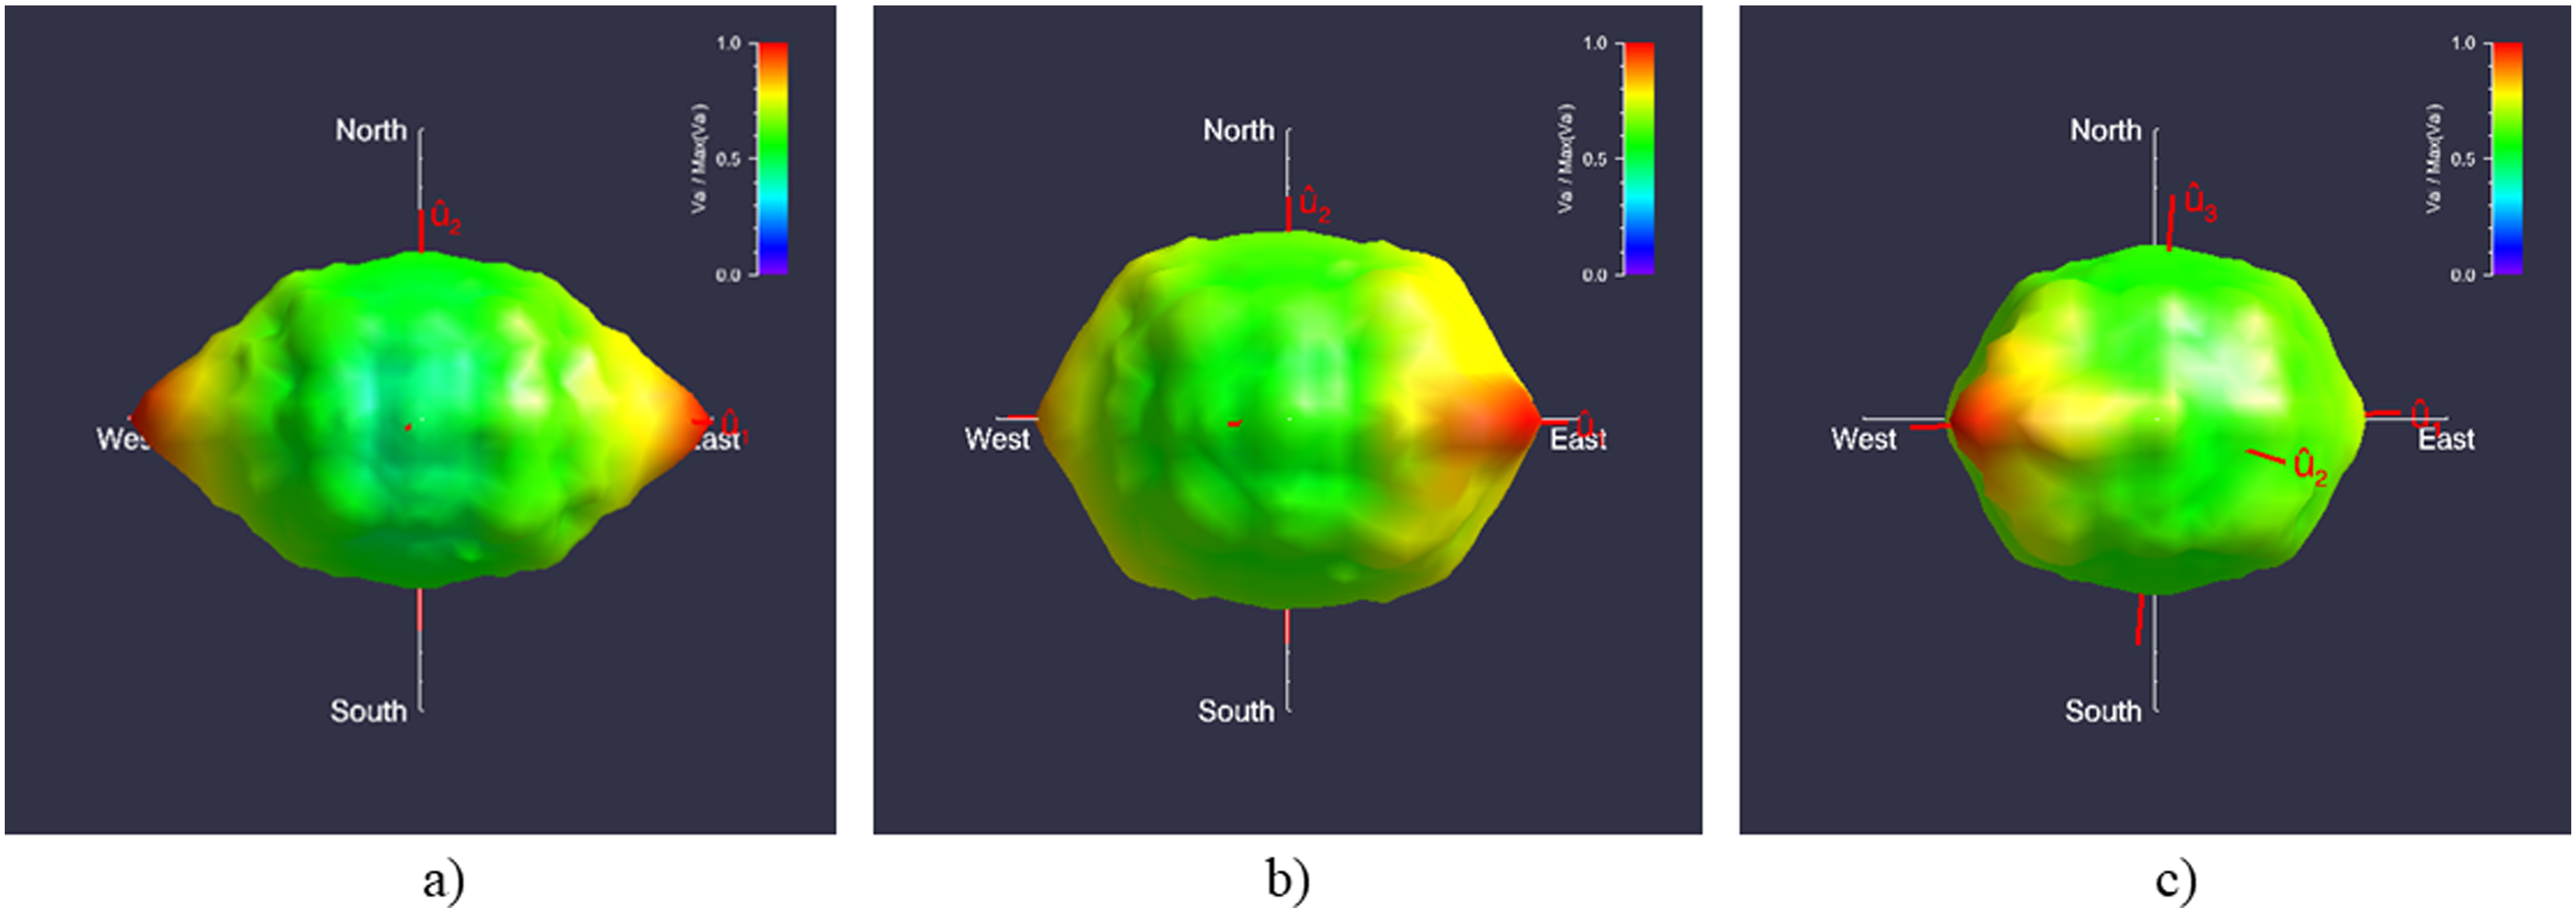
Polar representation of SLD for the differently oriented samples with respect to the MFD. (a) 0°, (b) 30° and (c) 60°.
Although the analysis was performed for seven angles (0°, 15°, 30°, 45°, 60°, 75°, 90°), only the most representative orientations are reported here, which better confirmed the expected results: 0°, 30° and 60°.
In Figure 6, as the orientation angle with respect to the MFD is increased from 0° to 60°, the polar diagrams (ellipsoids) appeared to be more spherical, the fibre orientation becomes more isotropic and no preferred orientation can be detected.
The eigenvalues and eigenvectors of the tensors, which represent the principal axis and directions of the ellipsoids, are reported in Tables 2, 3 and 4, for an orientation of 0°, 30° and 60°, respectively.
Eigenvalues and eigenvectors for the calculation of SLD (0°).
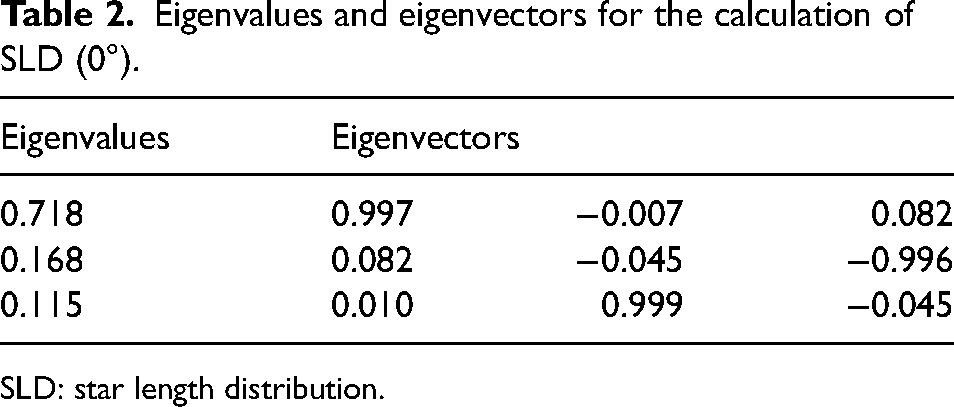
SLD: star length distribution.
Eigenvalues and eigenvectors for the calculation of SLD (30°).
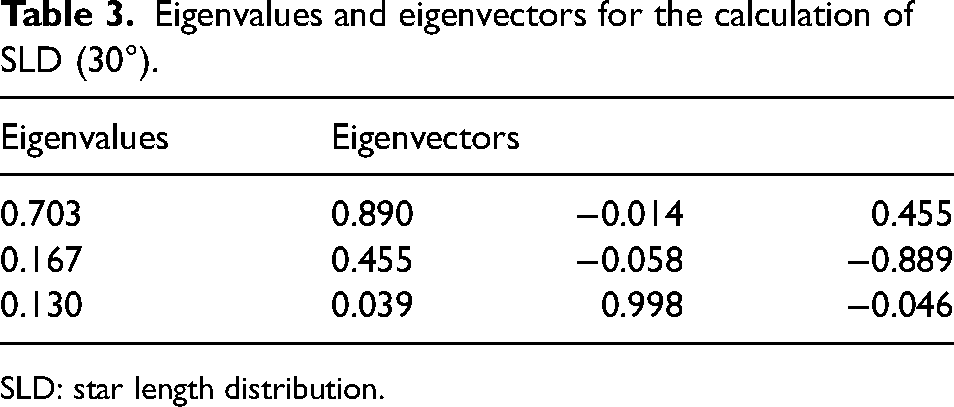
SLD: star length distribution.
Eigenvalues and eigenvectors for the calculation of SLD (60°).
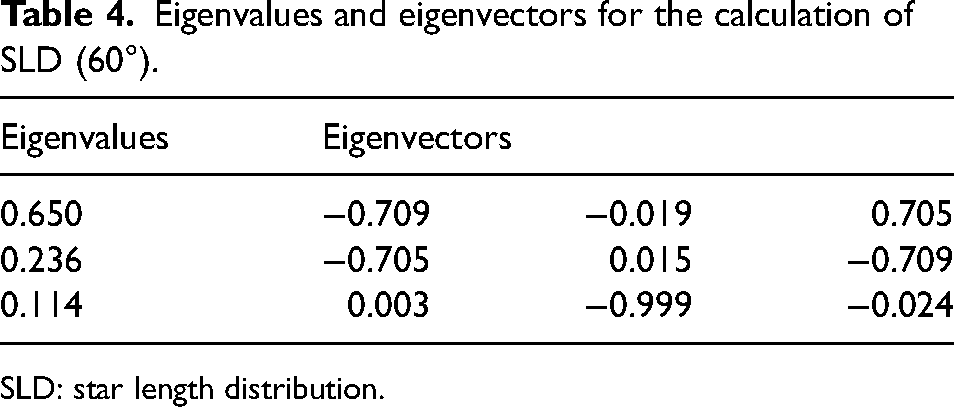
SLD: star length distribution.
Analogously, the fibre length distributions are reported in the histograms of Figure 7 a, b and c for 0°, 30° and 60° respectively.
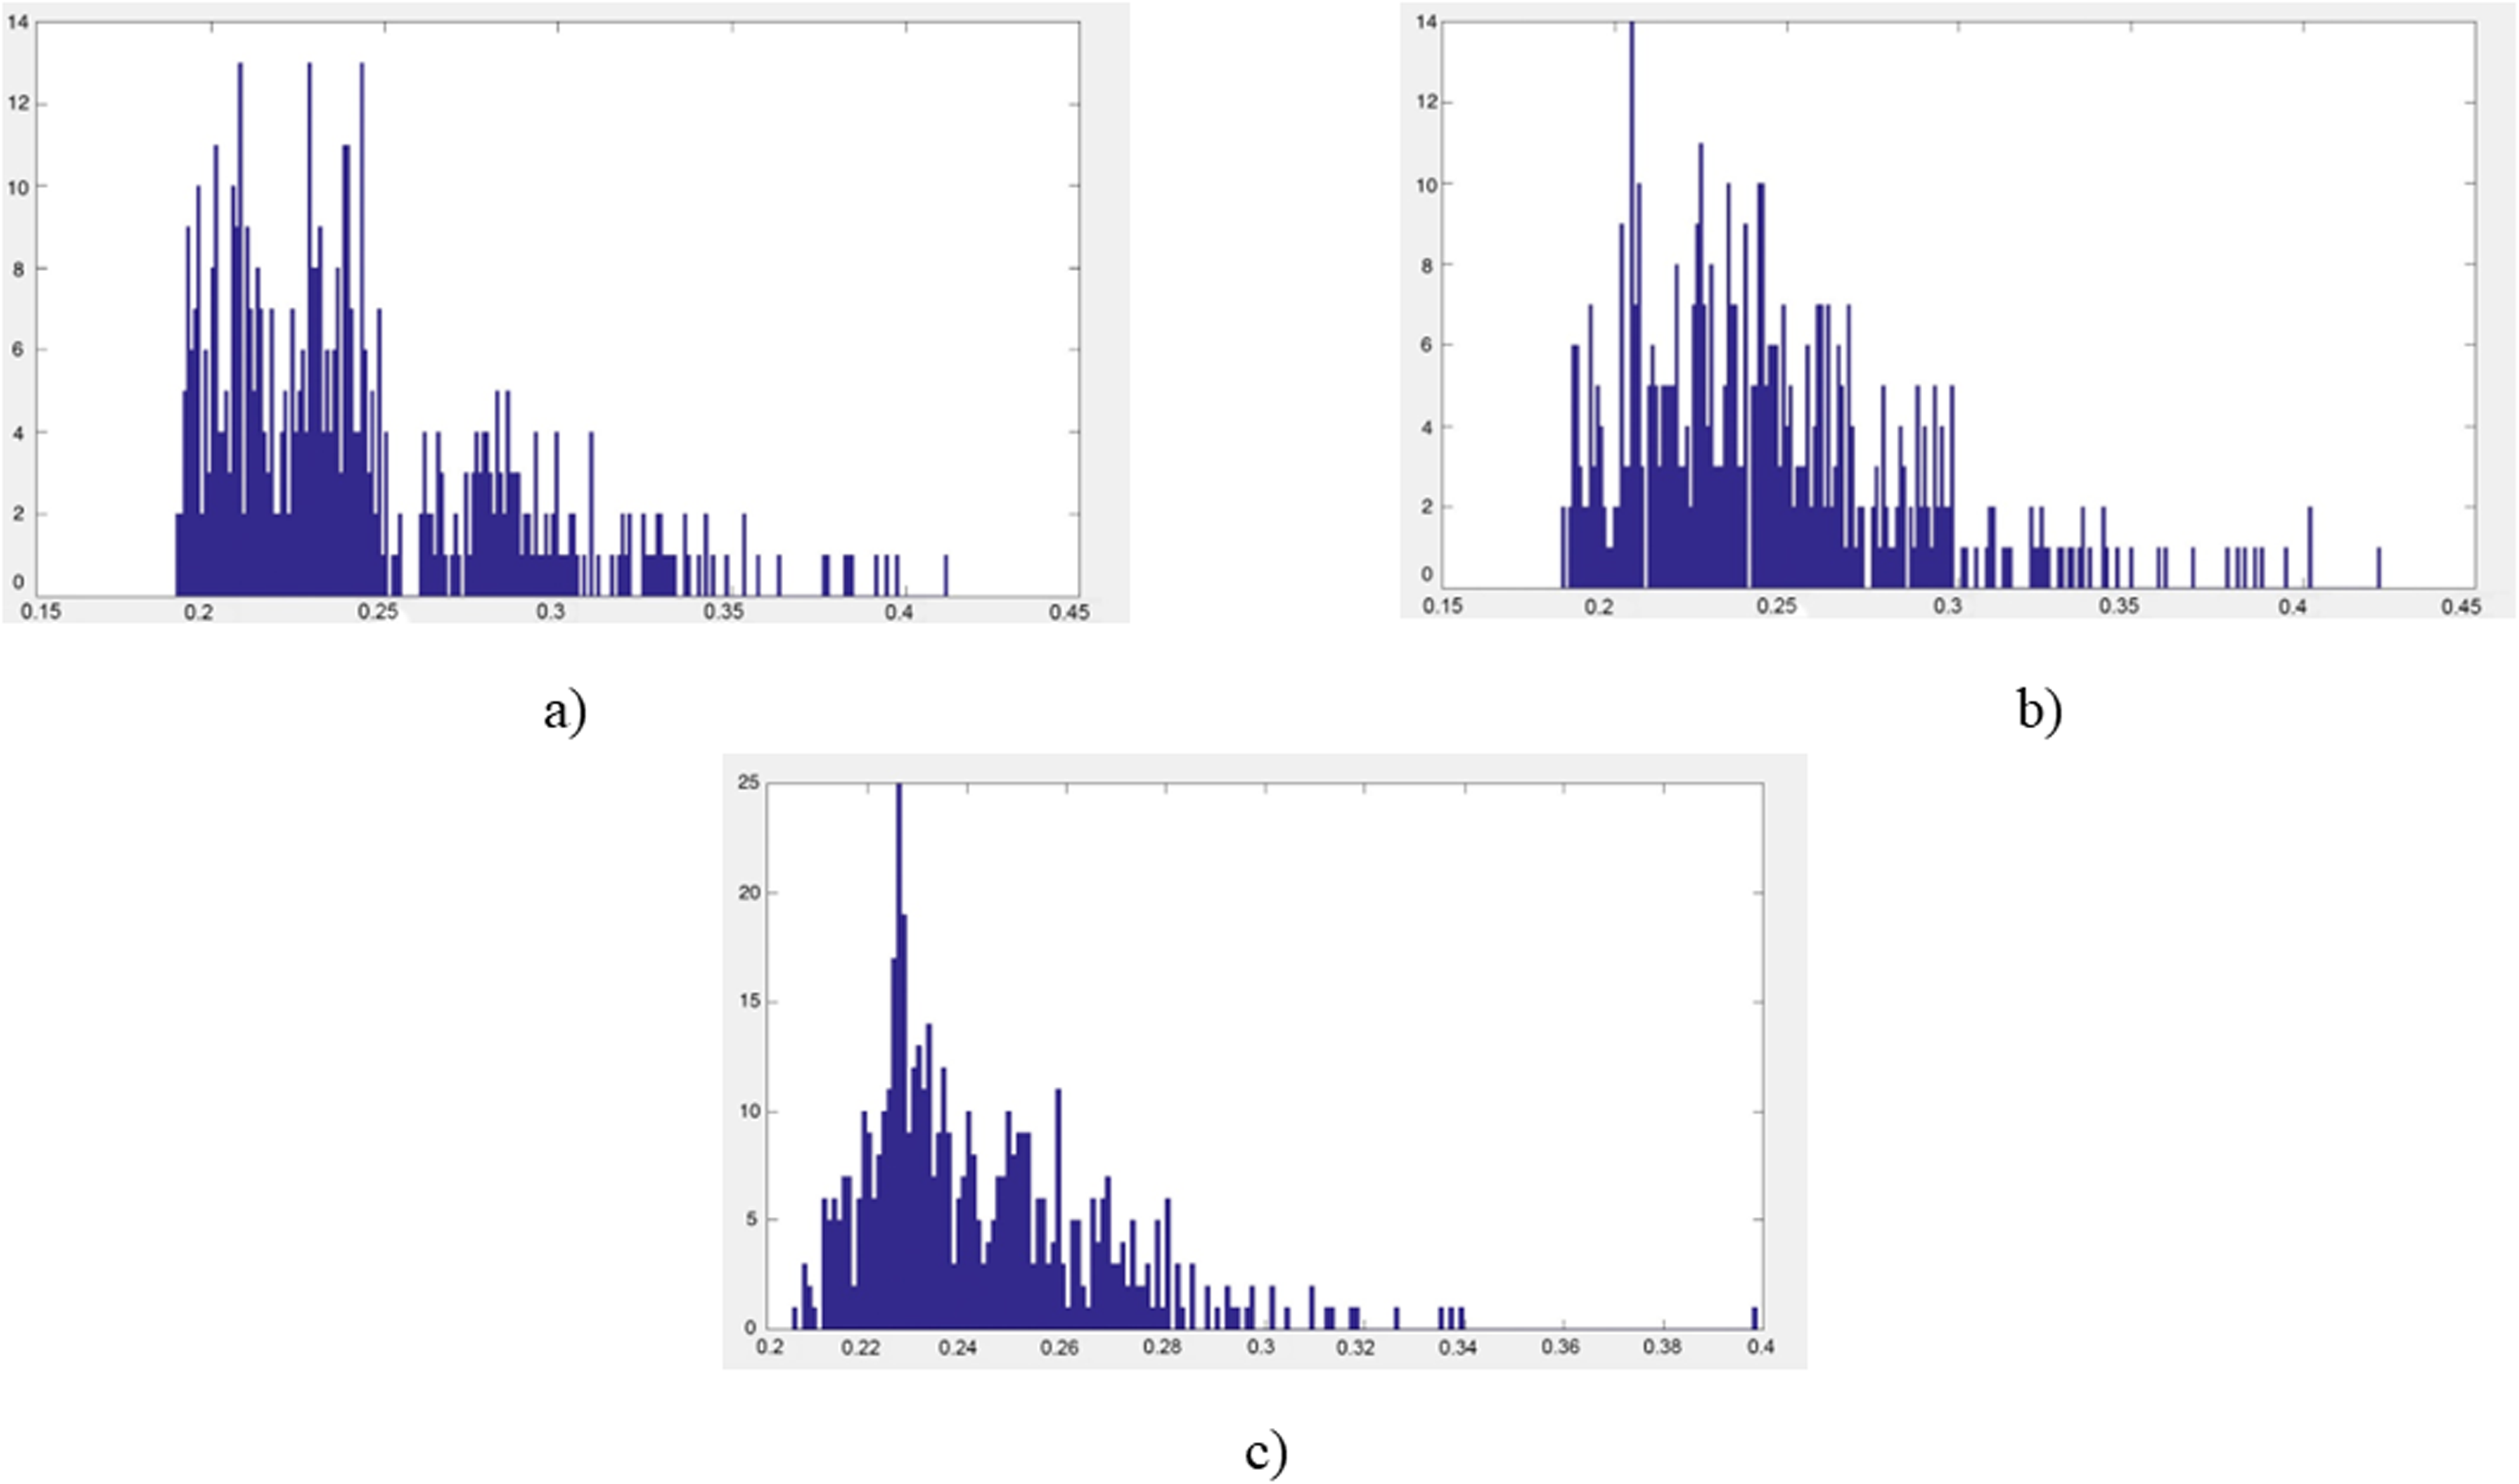
Fibres length distribution for the differently oriented samples with respect to the MFD. Fibres length in mm (x-axis), frequency (y-axis). (a) 0°, (b) 30° and (c) 60°.
Mechanical tests
Figure 8 shows typical stress-strain curves obtained for composite samples with different orientations with respect to the MFD and Figure 9 a–c presents corresponding tensile parameter values along with their deviations.
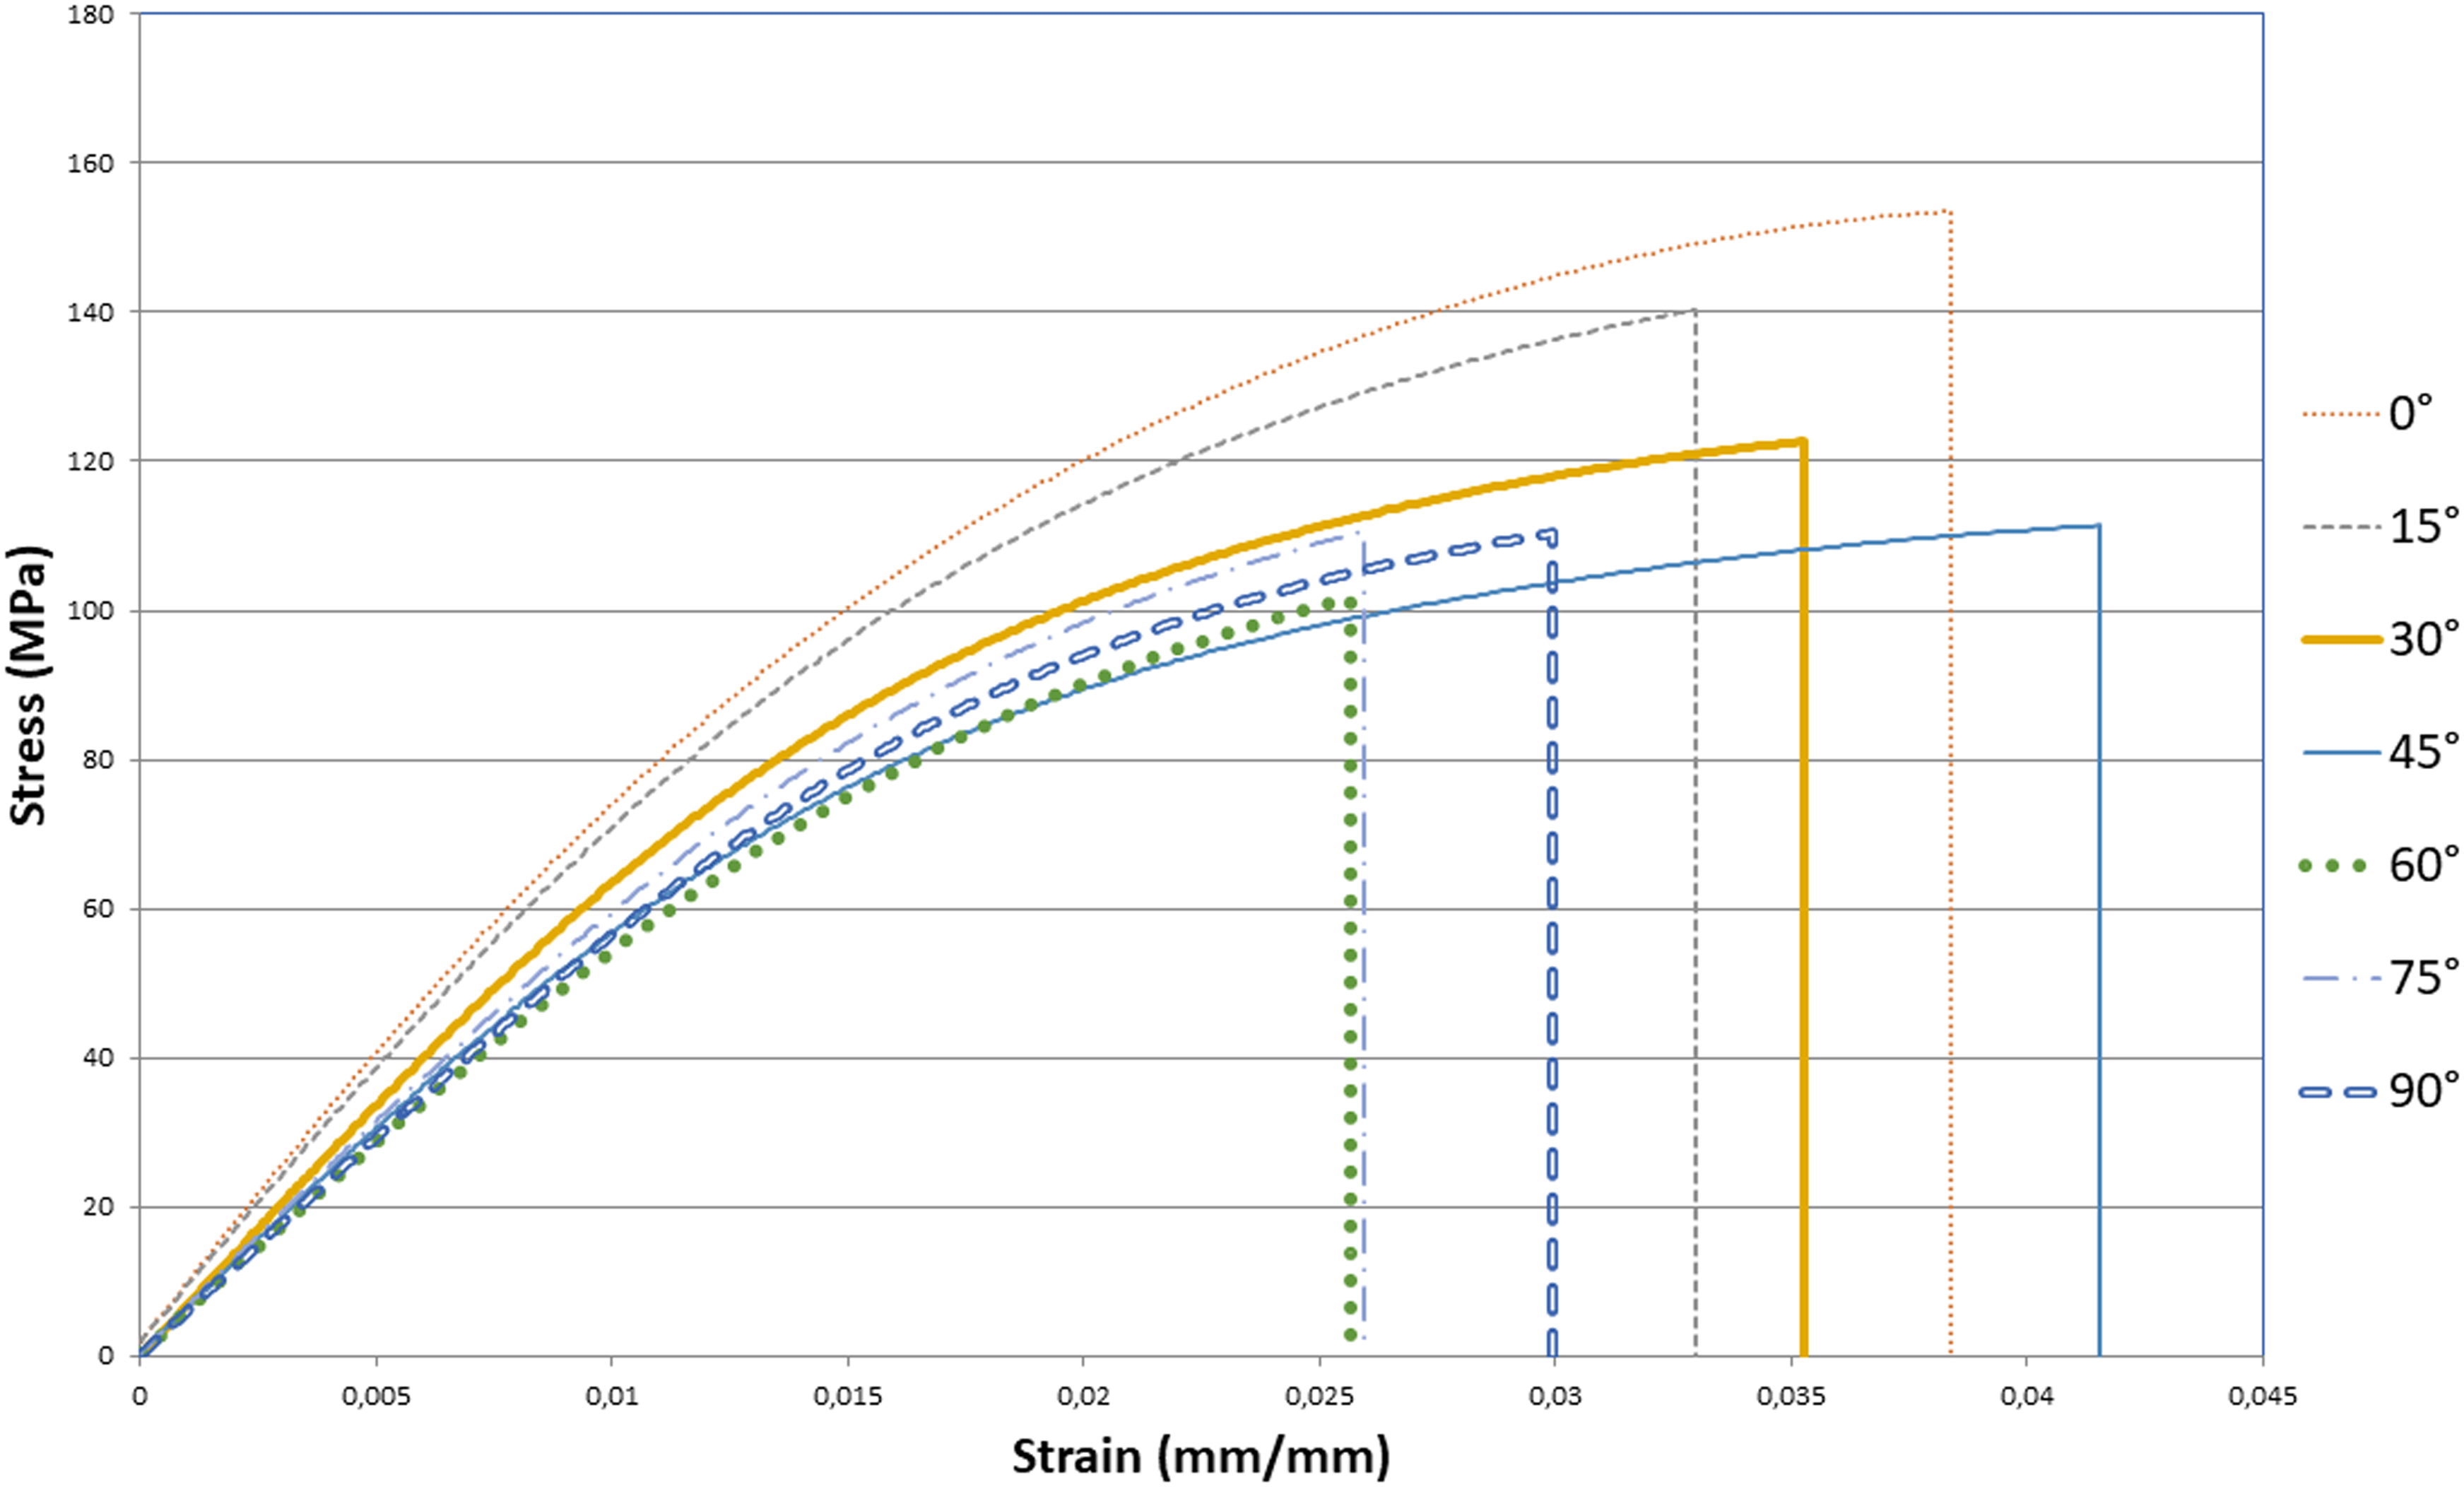
Stress-strain curves for composite samples with different orientations with respect to the MFD.
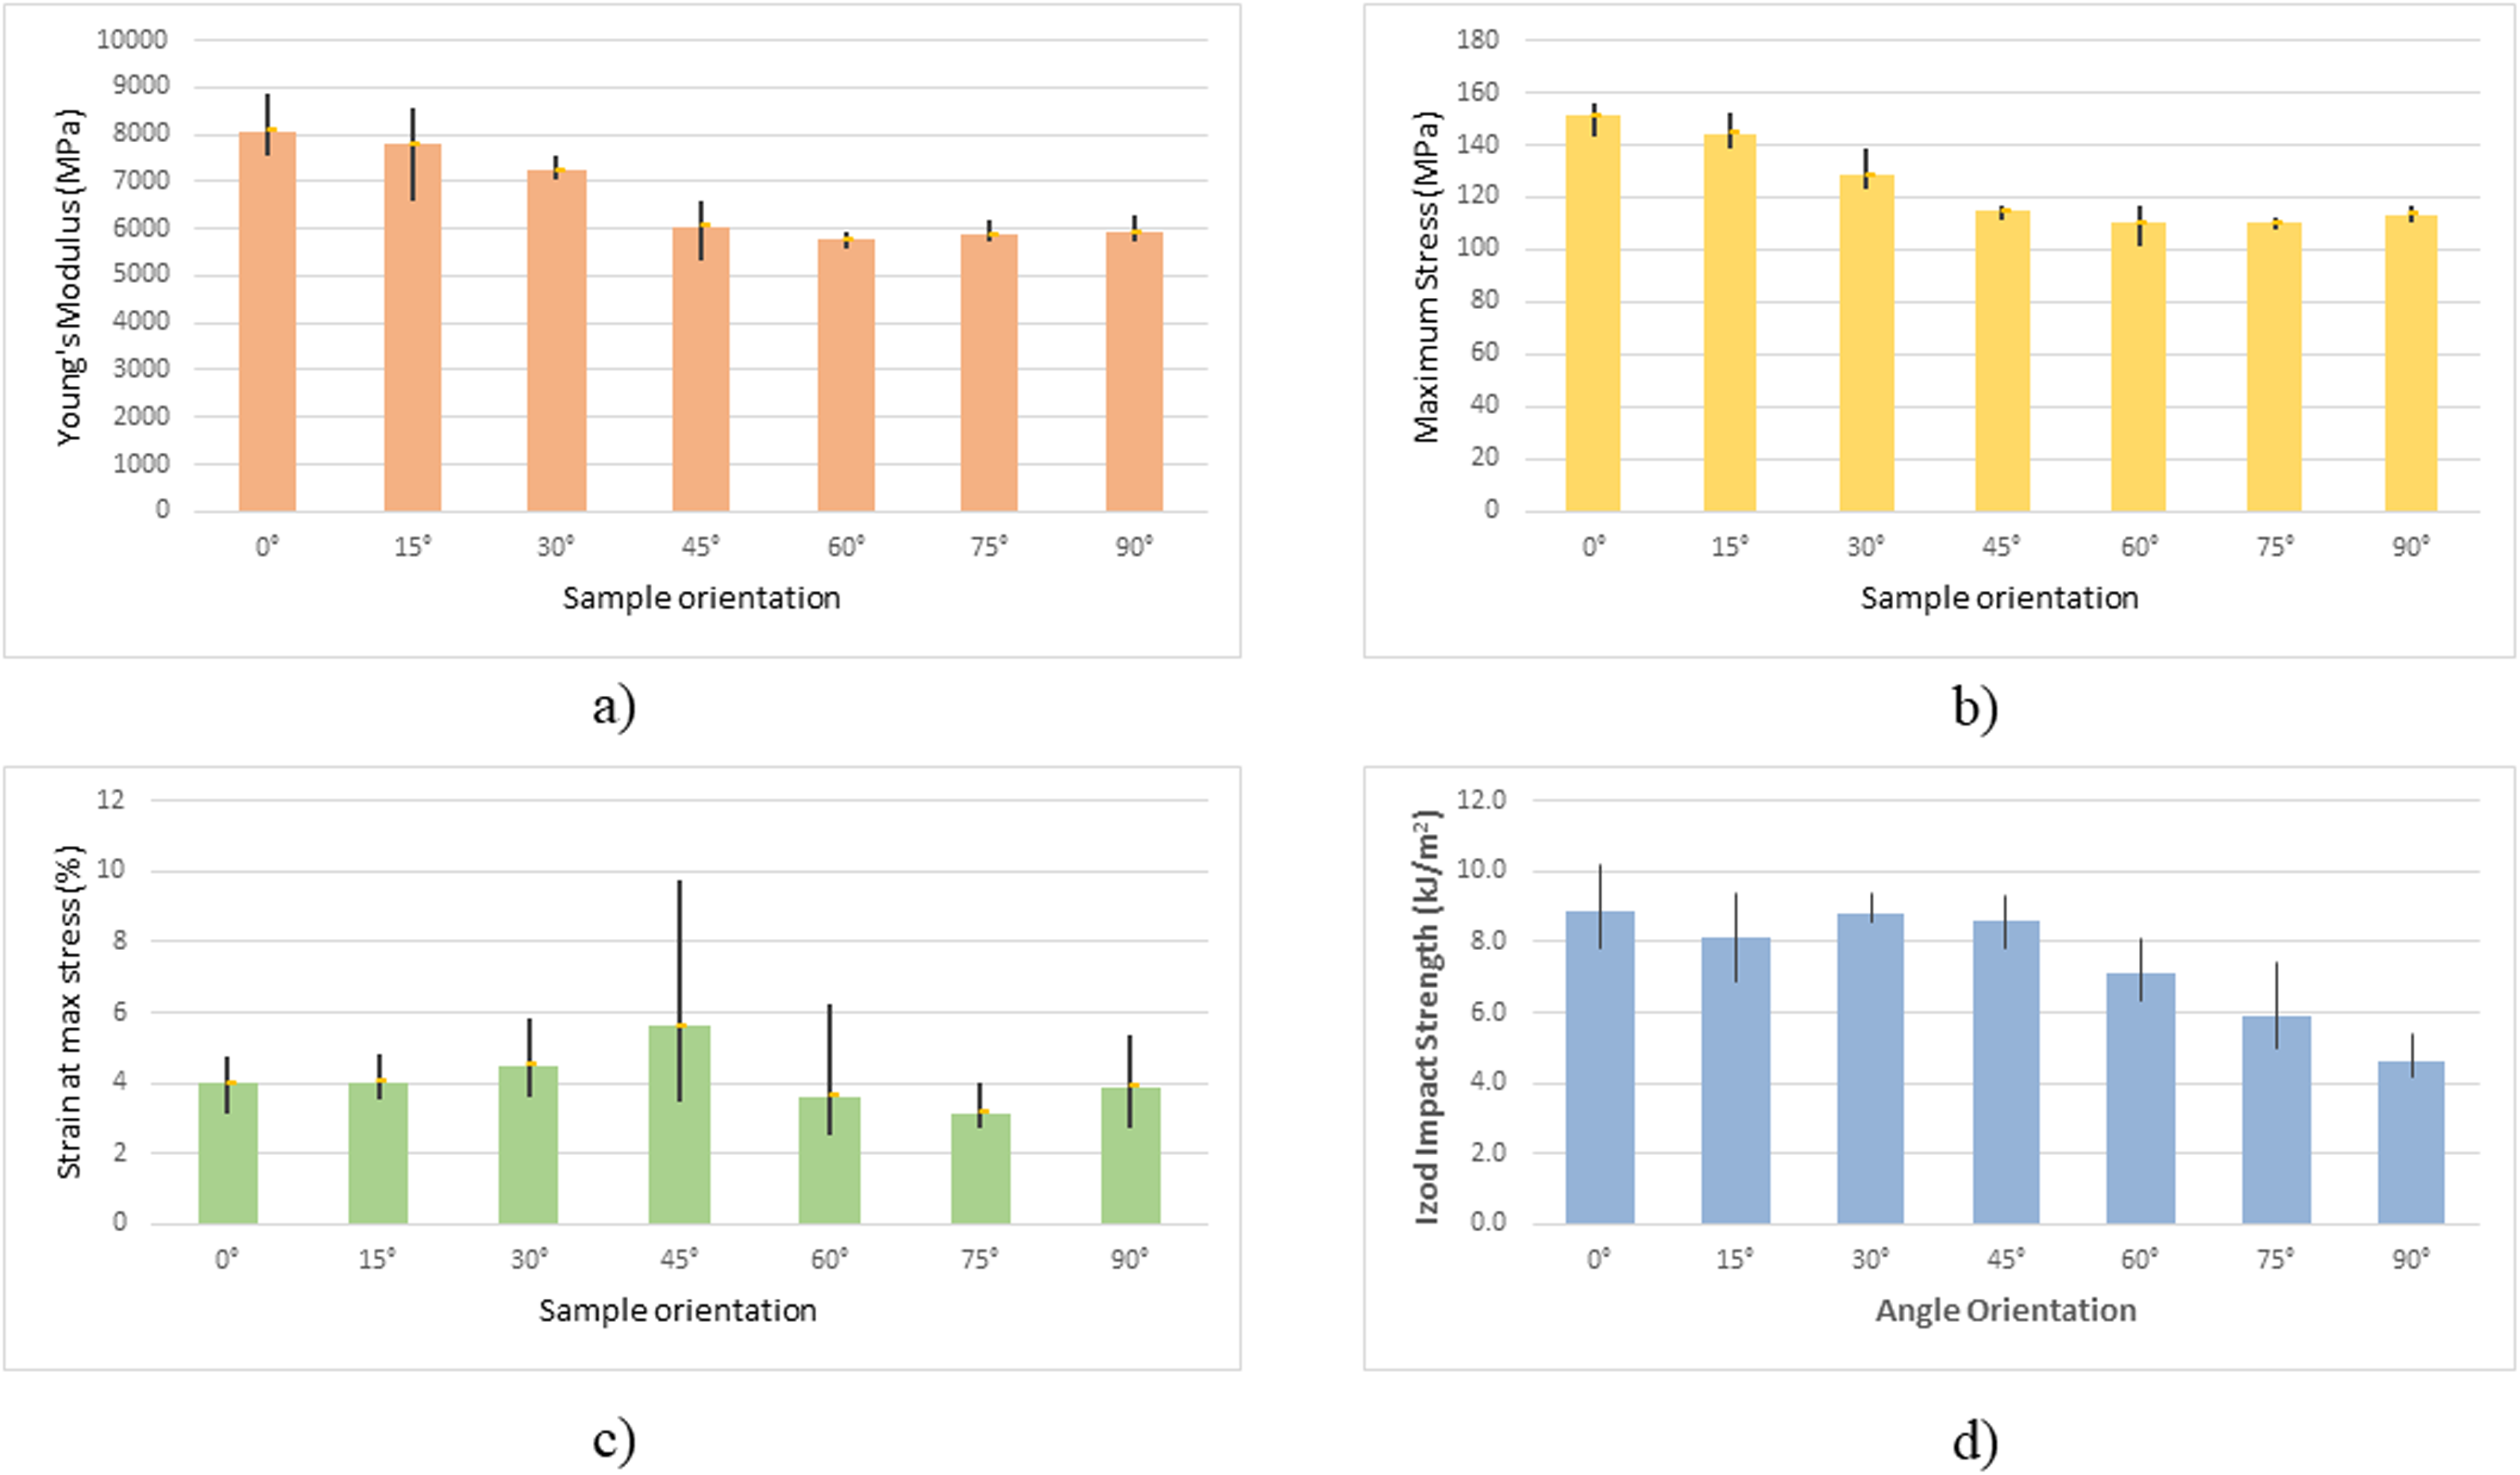
Mechanical parameter values as a function of sample orientation with respect to the MFD. (a) Young's modulus, (b) maximum stress, (c) strain at break and (d) Izod impact strength.
As it can be observed in Figure 8, irrespectively of their orientation, all samples display a non-linear tensile behaviour with a precipitous drop of load at the point of fracture with no signs of matrix plastic deformation (neither necking nor stress whitening). This quasi-brittle behaviour was also confirmed by observing the SEM fractographs of Figure 5, where smooth fracture surfaces were found for the matrix as a result of the development of limited energy absorption mechanisms (more noticeable in the insert of Figure 5a).
As mentioned before, injection-moulded short-fibre reinforced polymer composites usually have a processing-induced layered structure. In the shell layer, fibre is mainly oriented parallel to the mould filling direction, whereas in the core layer, fibre is mainly oriented perpendicular to the mould filling direction. Hence, samples cut at 0° were found to have fibre mainly oriented longitudinal to the loading direction, while samples cut at 90° were observed to have fibre aligned preferentially in the direction transversal to the loading direction. Therefore, tensile properties are expected to improve when the axis of orientation of the fibre is mainly parallel to the loading direction compared to the other two mutually perpendicular directions. The maximum strength and reinforcement are expected to be virtually along the direction of fibre alignment, whereas reinforcement is low in the transverse direction because the fibres act as barriers that prevent the distribution of stresses throughout the matrix.33–34
Stiffness and strength values were found to decrease as the orientation angle increased up to 45° in agreement with expectations (Figure 9(a) and 9(b)). This is because a lower amount of fibre was oriented parallel to the loading direction as the orientation angle was higher due to the processing-induced composite microstructure mentioned before. Hence, load was less effectively transferred from the polymer to the fibre as the orientation angle increased from 0° to 45°. Further increase in the orientation angle, on the other hand, did not lead to any significant change in reinforcement. The lower amount of fibre that appears to be oriented parallel to the loading direction in the core region seemed to be insufficient to counteract the negative effect of the fibre oriented oblique or perpendicular to that direction.
The above results are in agreement with the SEM observations and the SLD results, where an increasingly marked isotropic behaviour was found as the orientation angle changed from 0° to 45° and 60°.
Other authors 35 also found significant differences among the mechanical properties of samples with different orientations with respect to the MFD. They reported stiffness and strength values of specimens oriented parallel to the MFD twice than those of specimens oriented perpendicular to the MFD. In the present work, a decrease of around 25% was observed for both Young's modulus and tensile strength between samples oriented parallel and perpendicular to the MFD.
Strain at break values, in contrast (Figure 9(c)), did not show a clear trend with sample orientation within the high scatter of experimental values that was not surprising for this tensile parameter. However, a characteristic point seemed to exist for samples oriented 45° with respect to the mould filling direction. Ductility (represented by strain at break values) mostly depends on the presence of defects and these samples presented a more homogeneous fibre distribution (Figure 5(b)).
The results of Izod tests are presented in Figure 9(d) along with their deviations for samples with different orientations with respect to the MFD. Impact toughness values were roughly constant up to an orientation angle of 45° and a further increase in the sample orientation, led to a decreasing trend of impact resistance values reaching a critical drop of almost 48% between samples oriented parallel and perpendicular to the MFD. This result could be explained in terms of the pullout mechanism that is frequently found in SFRCs, as mentioned before.
It is well known that for discontinuous fibre-reinforced composites, effective load transfer from the matrix to the fibre is only attained if a strong fibre-matrix interfacial bond and a fibre length longer than a critical value (Lc) exist.
36
Lc can be estimated assuming that Kelly–Tyson's model applies
37
as follows:
In the composites studied here, df was taken as a nominal value of 11 μm, 2 σf is the fibre tensile strength adopted as a nominal value of 3445 MPa, 38 and τi is the interfacial shear stress taken as the half of the nominal matrix tensile stress (61 MPa) 39 assuming perfectly bonded fibres. Hence, the critical fibre length was about 593 μm for our composites.
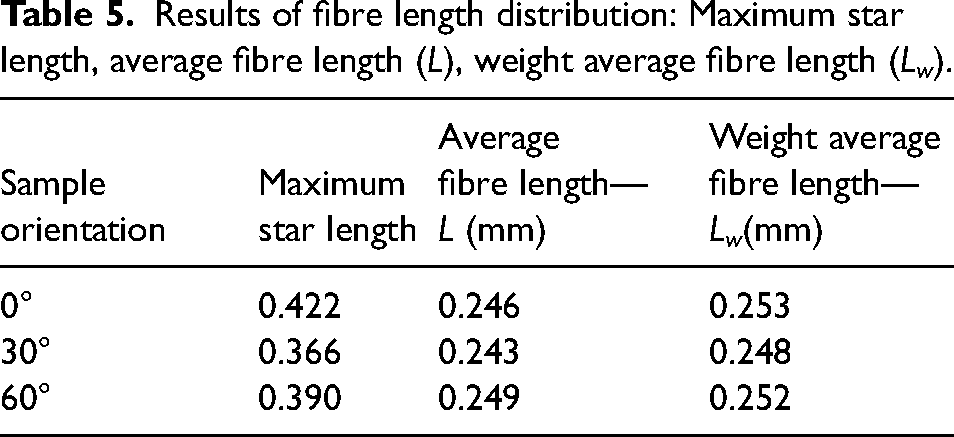
By comparing actual fibre length values (a value of 240 μm was taken from Table 5 in order to be conservative) with the estimated critical length value (593 microns), it was found that most fibres were significantly shorter than this value. Moreover, for weaker interface bond strength, Lc would be even longer. 37 Hence, properly oriented fibre was expected to be pulled out from the matrix rather than break, thus contributing to the material impact toughness.
Results of fibre length distribution: Maximum star length, average fibre length (L), weight average fibre length (Lw).
Izod samples cut at 0° with respect to the MFD had fibres principally oriented perpendicularly to the crack propagation direction and, hence, a high pullout energy was expected for these samples. In addition, it has been already established in the literature 40 that the fibre pullout energy is higher for composites with fibres tilted to the crack propagation direction than for those with fibres oriented parallel to the crack propagation direction. Hence, in our composites, the contribution of parallel fibres to the total composite impact toughness was smaller than that of oblique fibres. When sample orientation increased from 45° to 90°, the amount of fibres oriented parallel to the crack propagation direction is increased, being maximum for Izod samples cut at 90°. Therefore, these fibres did not significantly contribute to the pullout energy and composite impact toughness was much lower in this case.
Conclusions
In this article, the effect of microstructure, in terms of fibre length and fibre orientation, on the tensile and impact behaviour of injection-moulded short-glass fibre-reinforced polyamide 6.6 was investigated.
Digital reconstruction of the three-dimensional structure of samples differently oriented with respect to the mould filling direction was obtained by the high-spatial-resolution non-destructive technique of synchrotron radiation micro-computed tomography (micro-CT). The results revealed significant changes in fibre length distribution with sample orientation.
Automatic evaluation of the fibre length distribution was developed by a global method based on the mean fibre length distribution which was computed from SLD.
Polar diagrams were found to become more spherical as the sample orientation increased with respect to the MFD, indicating that fibre length distribution became more isotropic and consequently, its reinforcing efficiency in the loading direction was lower for these samples.
Uniaxial tensile tests and Izod impact experiments were successfully correlated with morphological analysis of fractured surfaces and with the results of SLD.
In conclusion, this work presents the results of a seldom-found variety of approaches to the problem of SFRP characterization, ranging from classical mechanical tests to more recently introduced synchrotron radiation-based imaging techniques.
It is notable that all these techniques lead to coherent conclusions.