
Abstract
Developing a low-cost medical device requires numerous stages of prototyping, where using traditional manufacturing technologies can increase development costs. The current study presents the development of a critical component for a low-cost microscope whose goal is to confer an inexpensive solution for automated analysis of microscopic smears. A novel design methodology was developed to optimize the achieved solution. During the exploration of this methodology, it is asked: how can an additive-manufactured prototype be cost-effective for accurate examination of cervical cytology smears? To understand the effect on cost and tensile strength that infill density and perimeter wall count, tensile tests were conducted. These results combined with the developed methodology achieved the most cost-effective solution. To achieve this, topology optimization was used to improve the stiffness-per-weight ratio of different parts. Finally, design for additive manufacturing and topology optimization was proven as an effective design tool.
Keywords
Introduction
In 2018, more than half a million women suffered with cervical cancer. With that, cervical cancer is the fourth most frequent type of cancer in women. The high rate of mortality due to cervical cancer can be reduced with prevention, early diagnosis and effective screening. It is estimated that 90% of the deaths occur in low- and middle-income countries. A fast and cheap solution to effective screening could lead to a decrease in the mortality rate of cervical cancer. 1 Automated microscopy solutions commercially available such as ThinPrep Imaging System 2 and BD FocalPoint GS Imaging System 3 brought unquestionable improvements in terms of cytotechnologist productivity and coverage of screening programs, but they are not currently tailored for widespread dissemination, particularly due to their high prices. Thus, new innovative solutions that are simultaneously effective and affordable, have the potential to improve cervical cancer screening, in particular: (i) increase sensitivity and specificity of manual screening; (ii) decrease cytotechnologist workload; (iii) reduce screening programs cost and (iv) reduce the probability of the disease incidence and mortality rate. 4
The revolution of additive manufacturing touched many fields of science. Medical and Pharmaceutical sciences were also influenced with the possibility of using technologies with easy to customize features, typical of 3D printing. In the field of medical devices, additive manufacturing is viewed upon mainly in customized prosthetic and patient-specific drugs. It is proven that with the advances of image-based designs, coupled with a bio-material structure, it is possible to create parts presenting a biomechanical behaviour. The main advantage of 3D-printed implants in medicine is the possibility of creating a product that is customized to the patient’s anatomy. 5
Regarding affordable and automated alternatives to conventional microscopes, Fraunhofer AICOS has been working in the development of a fully automated 3D-printed smartphone microscope, called μSmartScope. 6 This prototype is an affordable and automated alternative to conventional microscopes, tailored to effectively support microscopy-based diagnosis in areas with limited access to healthcare services. Through the usage of a motorized automated stage entirely powered and controlled by a smartphone, the μSmartScope allows autonomous acquisition of microscopic images, with the ultimate goal of decreasing the burden of manual microscopy examination. The μSmartScope also aims at reducing dependence on experts in microscopy diagnosis available on-site, by allowing straightforward integration with AI. The device was already used for automated analysis of malaria-infected blood smears.7,8 The work presented on this paper is directly related with the redesign of the μSmartScope framework for cervical cancer screening, in particular to achieve a solution that fulfils the requirements for the accurate microscopic analysis of cervical cytology smears. The representation of the initial framework of the μSmartScope can be observed in Figure 1.
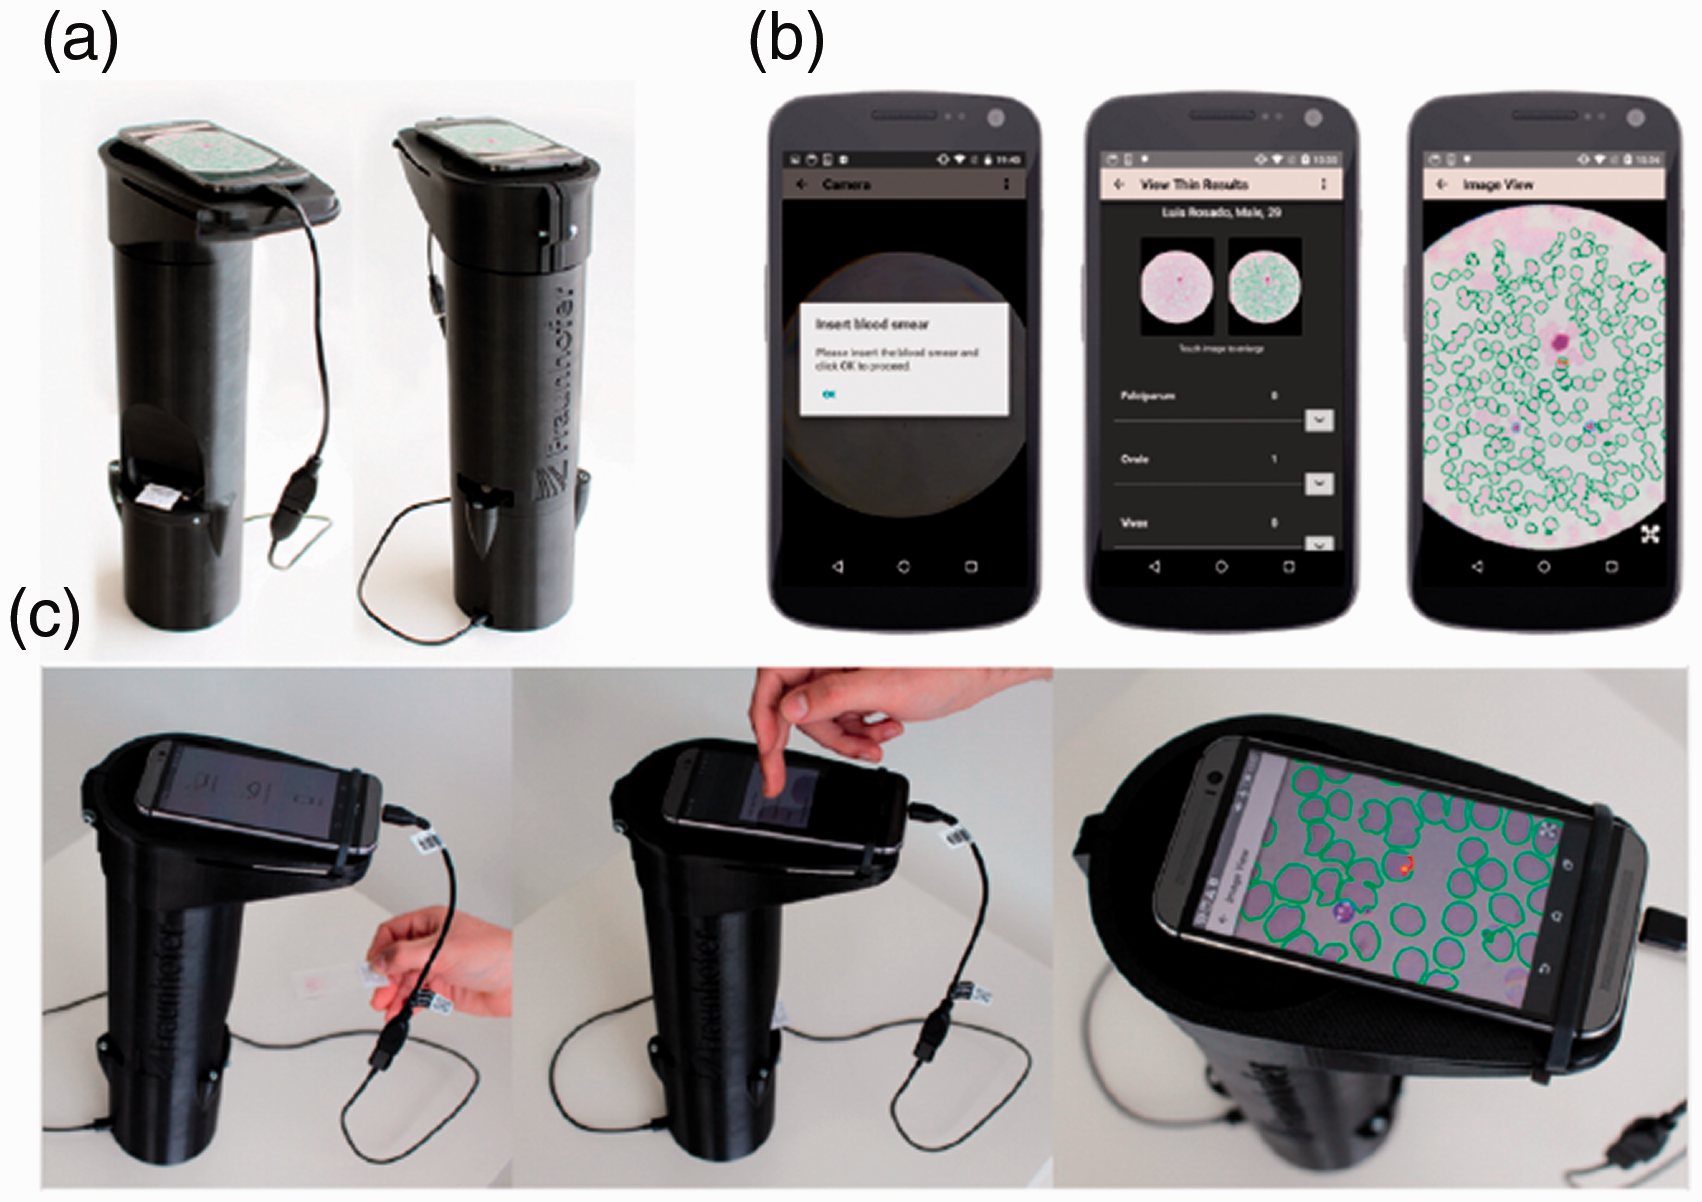
Initial version of the μSmartScope, the mobile-based framework for malaria parasite’s detection. (a) Standard working principle of the μSmartScope with the smartphone attached; (b) developed application for the smartphone; (c) demonstration on how to use the μSmartScope. 8
As such, this study researches if a component designed for additive manufacturing can be applied in the redesign of the μSmartScope framework for cervical cancer screening purposes, with the ultimate goal of optimizing the total cost and mechanical properties of the final product. With optimization of parts for cost efficiency in mind, tensile tests were conducted to assess and evaluate on how infill density and wall counts should be used, considering a defined cost function. This study also delves into novel algorithms that come with design for additive manufacturing. It is fundamental for this device that the components are lightweight and sturdy, so the usage of topology optimization in the developed design process of optimizing parts was explored and validated.
The mindset of design for additive manufacturing has the goal to think additively, reducing the number of components, creating better components while regarding the respective limitations. Prototyping is essential when developing better components, and in this situation, due to complex production constraints, additive manufacturing allows for complex design spaces where form and topology is not a cognitive barrier. 9 This mindset allows for appearance of new schools of thought for the designer helping eliminating manufacturing complexities and reducing costs. 10
Topology optimization is a novel technique that was mainly developed with the appearance of additive manufacturing as way to produce final products. Due to the ability of 3D printing to create complex geometries that are considered impossible in traditional manufacturing processes, topology and shape optimization appear as an important tool for engineer and designer to create better parts. This field looks to structures and products in an objective way. The main goal might be reducing mass, cost, minimizing stress or maximizing stiffness. The topology optimization software will run the simulation, to achieve a certain goal while being constrained by technical considerations. 11 In this study, topology optimization will be used as a tool to optimize the target components of the μSmartScope framework.
Related work
With the increasing importance and availability of additive manufacturing technologies, the optimization of additive manufacturing parameters is currently a very active area of research. As similar as any other manufacturing process, additive manufacturing main cost parameters will relate to time and mass spent.
In a recent work by the Wu et al., 12 parameters such as the layer height and printing time have been tested, concluding that 0.14 mm layer height will ensure an accurate printing quality while maintaining and optimum manufacturing time.
Mostafa et al. 13 ranked seven different parameters on their influence on ultimate tensile strength and total cost. It was observed that infill is the most significant factor in all the studied responses except in time consumed, where it was outranked by layer height. The number of contours is the second most important factor in all responses, expect in the time consumed. The number of shells was also ranked as the fourth most important factor in all responses expect in the time consumed. It was also concluded that infill should be used at a minimum compensating ultimate tensile strength (UTS) with other optimized parameters.
Another study by Mohamed 14 observed that for a specific component, that the air gap diameter, layer thickness and the number of contours were the most important factors. In this study, it was observed that larger air gaps reduced the total cost due to effect on build time and material consumed. Additionally, it was concluded that contours should be optimized to reduce cost of build time and material used. However, this study only focused on the build cost and formulating a formula for the total cost of the print and, not addressing the consequences of the proposed optimizations in terms of mechanical properties.
Regarding new strategies to improve additive manufacturing, topology optimization is a novel tool that uses finite element analysis algorithms that, armed with the possibilities of additive manufacturing, allows customized optimization of parts for a specific goal. The most common goal is to optimize the strength-to-weight ratio of a given part, and it has already been shown how this tool has a deep relationship with additive manufacturing. Additive manufacturing does not penalize the increased topological complexity, and the technology can be improved further by using lattice structures to achieve parts with different densities. 15
As an illustrative example, topology optimization has been used for redesigning cast iron parts. With the decreased cost of 3D-printed sand molds developed by binder jetting process, a new framework of metal castings was developed by Wang et al. 16 This process has three different design considerations: part application requirements, conformance to sand-casting principles and 3DSP processing constraints. A case study of a bearing bracket is presented to illustrate the proposed methodology that despite the reduced 50% of the bracket weight, the mechanical performance of the optimized design is increased by 30%.
The work of Sudin et al. 17 focused on redesigning a brake pedal with the goal to reduce weight. The applied design process used firstly defined the initial design space and finite element model, being only improved the pivot shaft. The following step applied the created topology optimization procedure, and finally, after the part being redesigned, a finite element analysis was done evaluating the final mechanical properties, thus validating the proposed design.
Another design methodology recently proposed by author Gebisa et al. 18 starts with the initial computer-assisted design (CAD) model, being followed by a topology optimization stage that follows the required parameters. Additionally, after the part redesign, another stage of finite element analysis verification is applied. The latter step and the before-mentioned are applied in interactive way, until the best results are achieved. The authors state that this approach reduced 65% of the weight of the initial design space.
Dragoni et al. 19 studied how certain tessellated arrangements, that can only be effectively manufactured with additive methods can be compared to porous materials and honeycombs, in terms of normalized stiffness and density. In this study, hexagonal cells perform better in terms of buckling strength. However, triangular cells perform better in terms of shear strength. All materials testified transverse isotropy.
Lubombo et al. 20 tested five different infills, where it was observed that the hexagonal infill was the one that presented the best mechanical performance in terms of specific flexural modules and strength edgewise and flatwise. This study also showed the using an higher number of perimeter shells also increased the stiffness and strength for all infill structures under uniaxial inplate tensile loading. It was concluded that because the shells were aligned with the loading direction, the perimeter carried most of the load. It was also showed that the square structures exhibit the best performance under uniaxial tensile loading and the square-diagonal structures present the least balance in mechanical performance.
Dave et al. 21 observed that concentric and rectilinear infill pattern show almost similar of tensile strength for 100% infill density and tensile strength increases with infill.
Material and methods
Material, 3D printers and specimen preparation
In this study, different parts were additively manufactured. As such, the influence of printing parameters on the total cost of the part was studied. The tensile test samples used in this study were created with a commercial BQ PLA Ash Gray, manufactured by BQ, with a diameter of 1.75 mm. The samples were created using a low-cost Ender 3 Pro customized with a 32-bit motherboard with a levelling probe. The nozzle size used was 0.4 mm.
The samples and part were modelled using the SolidWorks software and exported as an .STL file. CURA software, by Ultimaker, was used to generate the G-code and control the different parameters. The test method used for the tensile test was the ISO 527:2012, sample 1B. This test method is used by the industry to analyse the tensile properties of polymers. The prototype was printed on the common professional grade desktop 3D printers, Ultimaker S3 and Ultimaker S5 developed by Ultimaker. The material used was Ultimaker’s PLA with a 2.85 mm diameter, and the nozzle size was 0.4 mm.
Process parameters
To observe the impact on cost and UTS on the parts created by FDM, different parameters in this tensile study were tested: infill density, wall count – considering a nozzle of 0.4 mm. The level of the parameters explored used in this processes can be observed in Table 1.
Explored process parameter and corresponding levels.
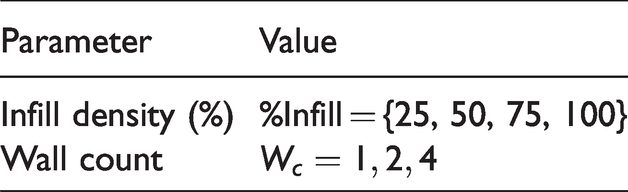
In this study, three different wall counts were considered. The number of walls will consider the perimeter walls and the bottom and top walls as well. Three levels were considered: 1, 2 and 4. The maximum value of four walls was considered, which, for a 0.4 mm nozzle, would cover most of the sample.
The other parameter tested was the infill density %. Four different infill densities were tested: 25%, 50%, 75% and 100%. The different values used allowed to observe the effect of the infill density in the ultimate strength. When doing tensile tests to samples manufactured by the FDM technology, it is commonly used in the literature infill densities of 100%, considering no air gaps.22,23
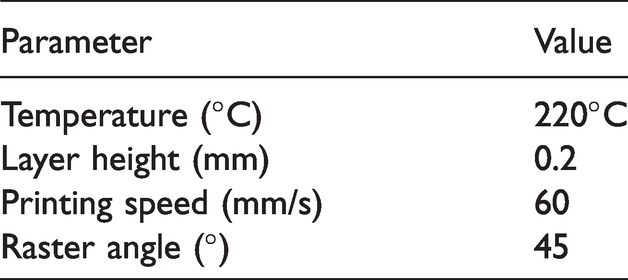
No other parameters were tested to observe the influence on weight of the final part. These were selected for being two parameters that have major influence in the weight of the sample. Other parameters were kept constant to better analyse the influence of infill density and wall counts. The infill used was a cubic infill, allowing for a more isotropic behaviour and because it required less manufacturing time in the CURA simulation. This is an important factor, since the main bottleneck of additive manufacturing as final manufacturing technology is the manufacturing time. The effect of temperature in the UTS and warping has been explored extensively.24,25 The fixed process parameters can be observed in Table 2.
Fixed parameters in this study.
Experimental set-up
Each level group of process parameters consisted of three samples. Thus, 36 total samples were tested for each combination. The duration of manufacturing was measured in minutes to account the energy costs on the manufacturing of the samples. The average strength, Young’s modulus, cost and time were taken as the results to be analysed afterwards. The tests were carried out according to the standards for room temperature. Once the PLA filament was opened to mitigate the effect of moisture absorption, the filament was stored in a box with a silicon bag. Figure 2 shows the different tested samples after the tensile test.
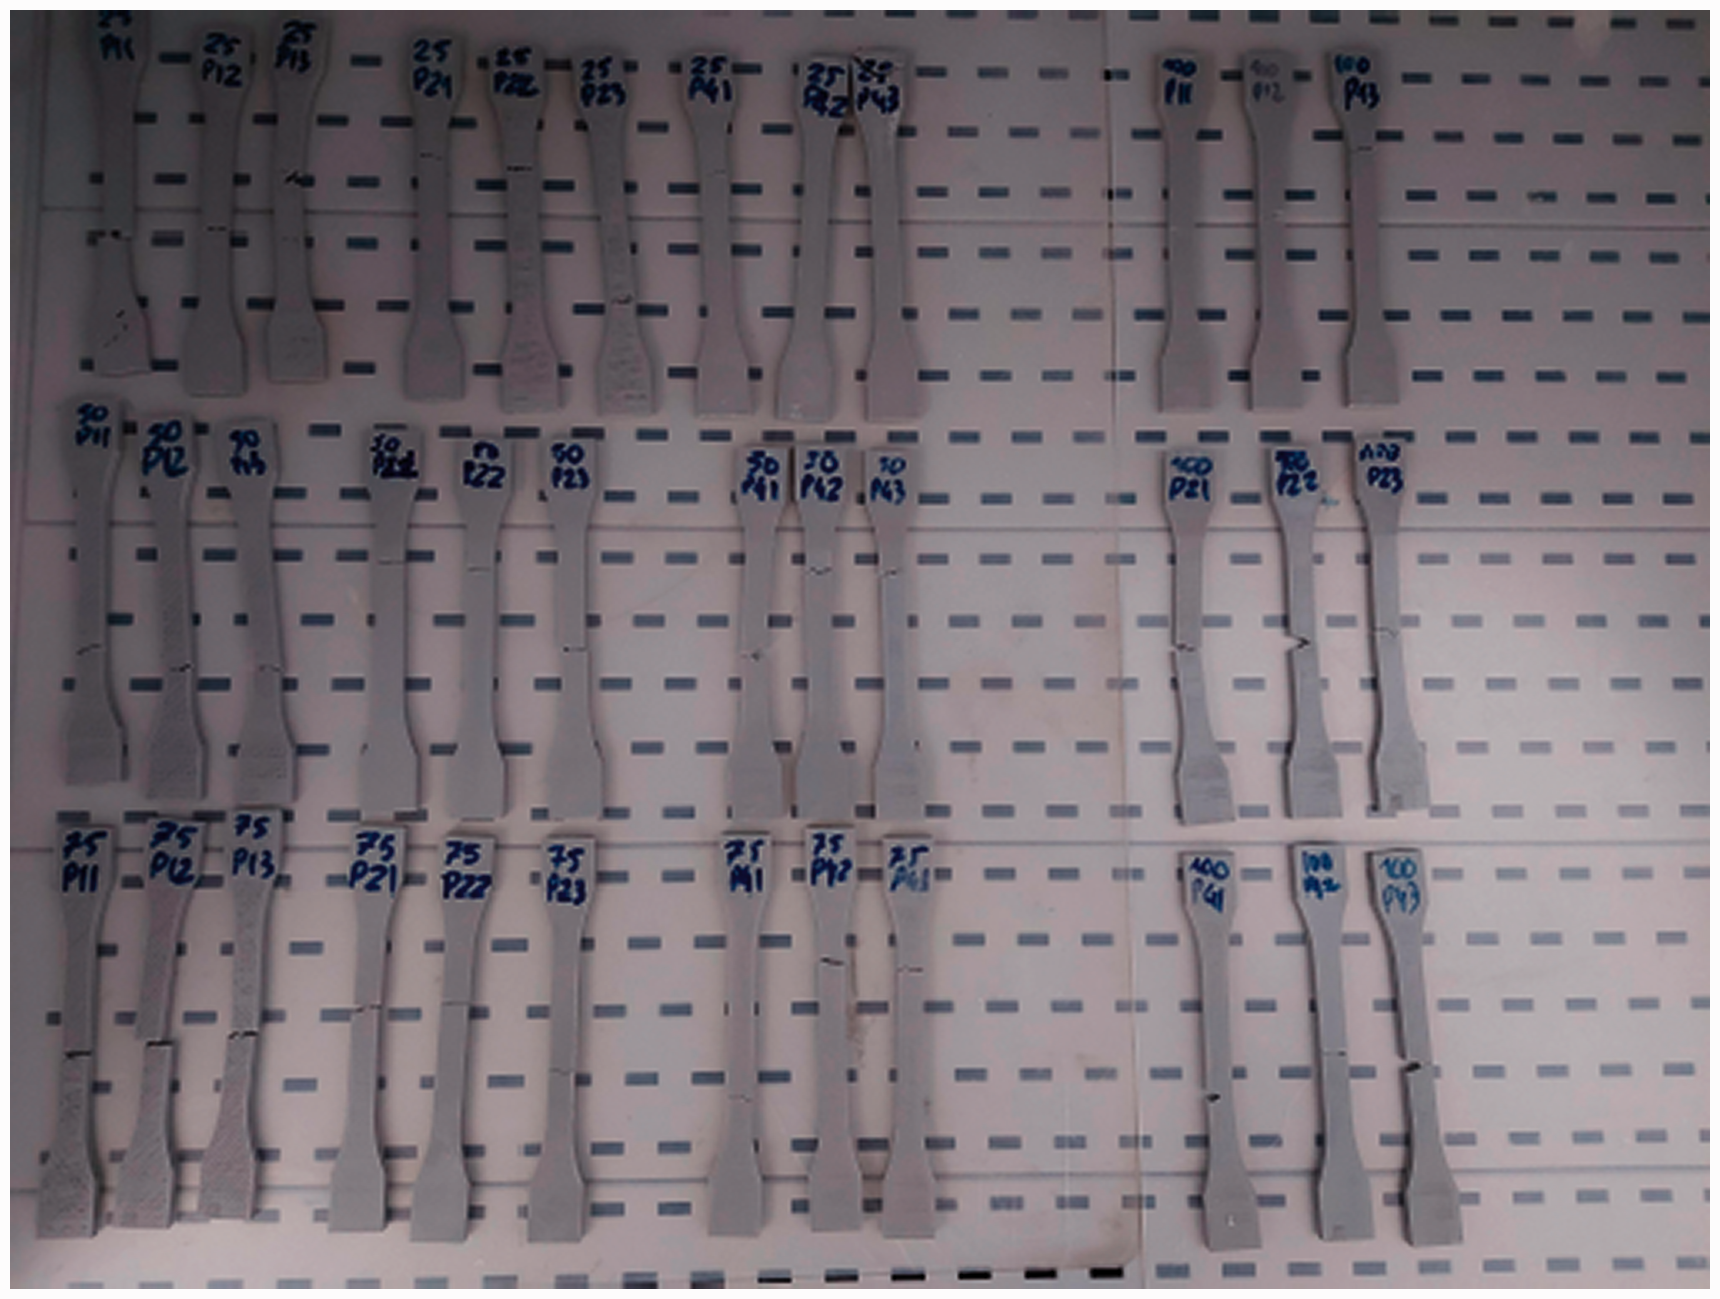
Tested samples after the tensile test under the standard ISO 527:2012 at 5 mm/s.
The samples were tested on a Mecmesin 2.5KN following the standard ISO 527:2012, at a fixed loading rate of 5 mm/min. To obtain the Young’s modulus, it was observed that the suggested formula by the standard might not be accurate for this situation. This is due to the fact that the cross-section of the sample will have void space to some extent. Thus, the reference area is not constant. Infill density will create voids, even parts that are 100% filled can have voids due to under extrusion and other calibration factors. Therefore, it is possible to obtain the cross-section area from geometrical models by using CAD information26,27 or through geometric measurements. In this study, an analytic geometric model that takes into consideration the wall count and width, as well as the infill percentage, was used. It should be noted that some studies use the relevant density of the samples to find the number of voids per area,
28
while other studies have used the 100% sample as the reference area. In the presented article, a geometric cross-section area is proposed. This cross-section area, which is related with the area created by the different perimeters, being the remaining area is affected by a percentage of the infill density. Thus, it is possible to create a relation with


Mesh analysis
In the optimization design process used in this study, an initial part was firstly submitted to a static finite element analysis and topological optimization process. The topological optimization allowed to create a new design space for the same component, having the new topology as a design insight.
As a consequence, it was necessary to undergo two different convergence studies on the chosen finite element mesh. SolidWorks software was used for the design process. Although being less powerful as a dedicated finite element analysis software such as ABAQUS or ANSYS, SolidWorks allowed for a more fluid design process without leaving the same software. This factor is helpful for remodelling the model into a working part.
For both situations where the mesh was studied – before and after the topological optimization – it was used as the algorithm of blended curvature-based mesh. However, this algorithm requires extra computational power, since it compensates the fixed usage of tetrahedron solid elements in SolidWorks. This algorithm also takes into consideration the complex surfaces and creates the most stable aspect ratio, not only in the surface of the design space but as well as for internal elements.
Regarding element-type selection, second-order tetrahedron elements were used, which have 10 nodes and a quadratic formulation. For the mesh study of each model, the minimum element size was fixed at 0.2 mm, allowing for the mesh to be refined in smaller geometries. The study for the initial body to undergo finite element analysis can be seen in Figure 3.
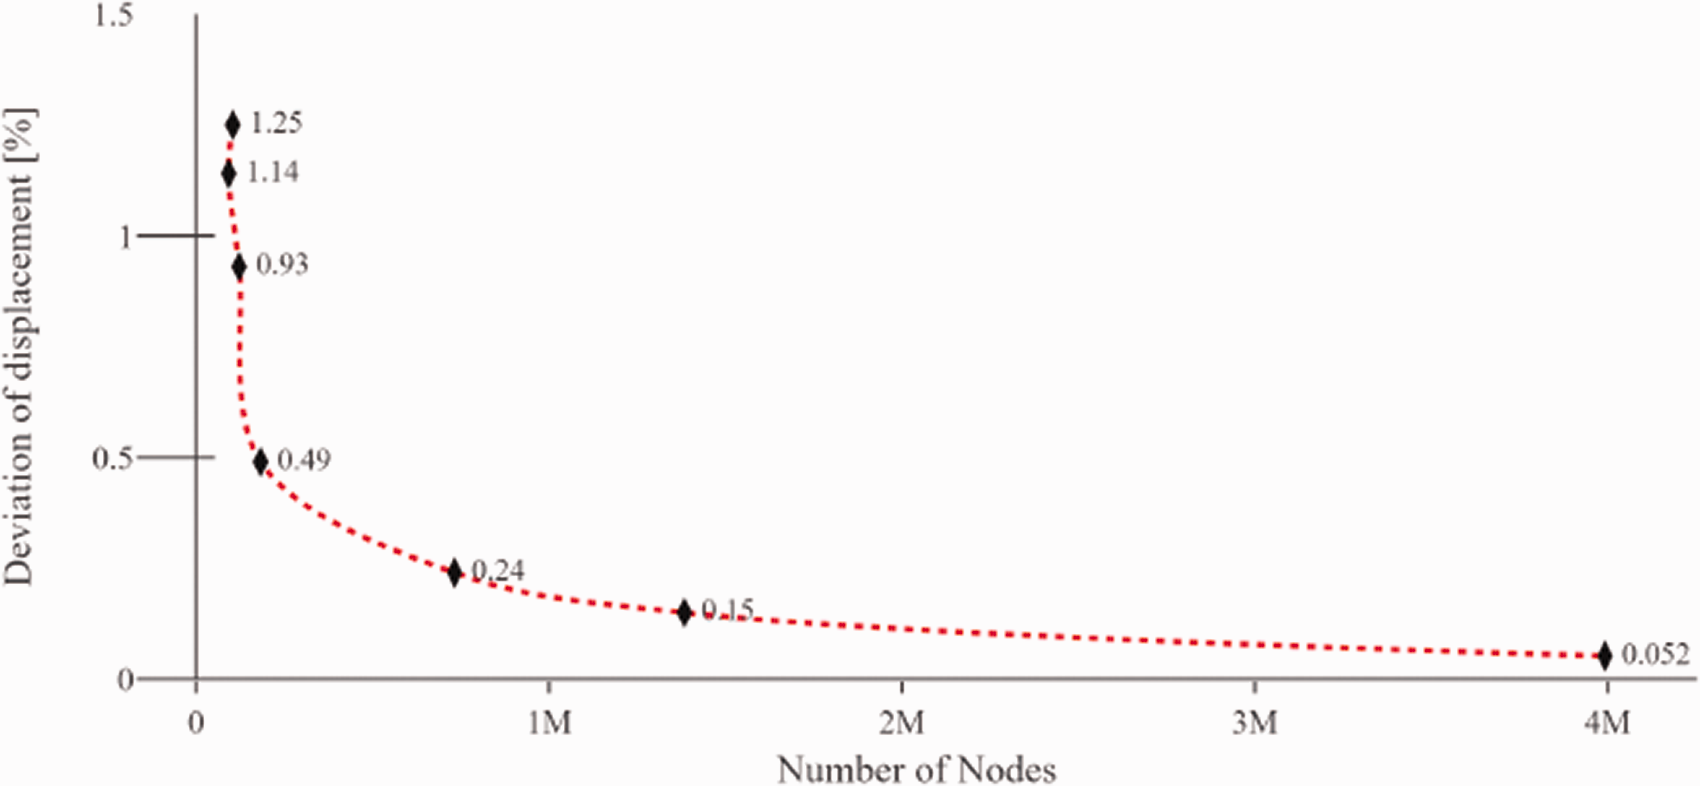
Mesh convergence analysis for the first model. The error observed was determined with the last mesh as reference for a fixed point in a critical area.
As it is possible to observe in Figure 3, the error, by fixing the smallest size of the element to 0.2 mm, will have a maximum deviation of 1.25%. Thus, a mesh with over 1 million nodes was chosen to obtain an expected error of less than 0.2%. Meshes with higher number of nodes were also explored, but since they only added extra computational power without adding significant influence in the results, they were consequently discarded. Regarding the second convergence study, the respective mesh study for the redesigned body can be observed in Figure 4. Once again, a mesh with over 1 million nodes was chosen to achieve an expected deviation of 0.2%.
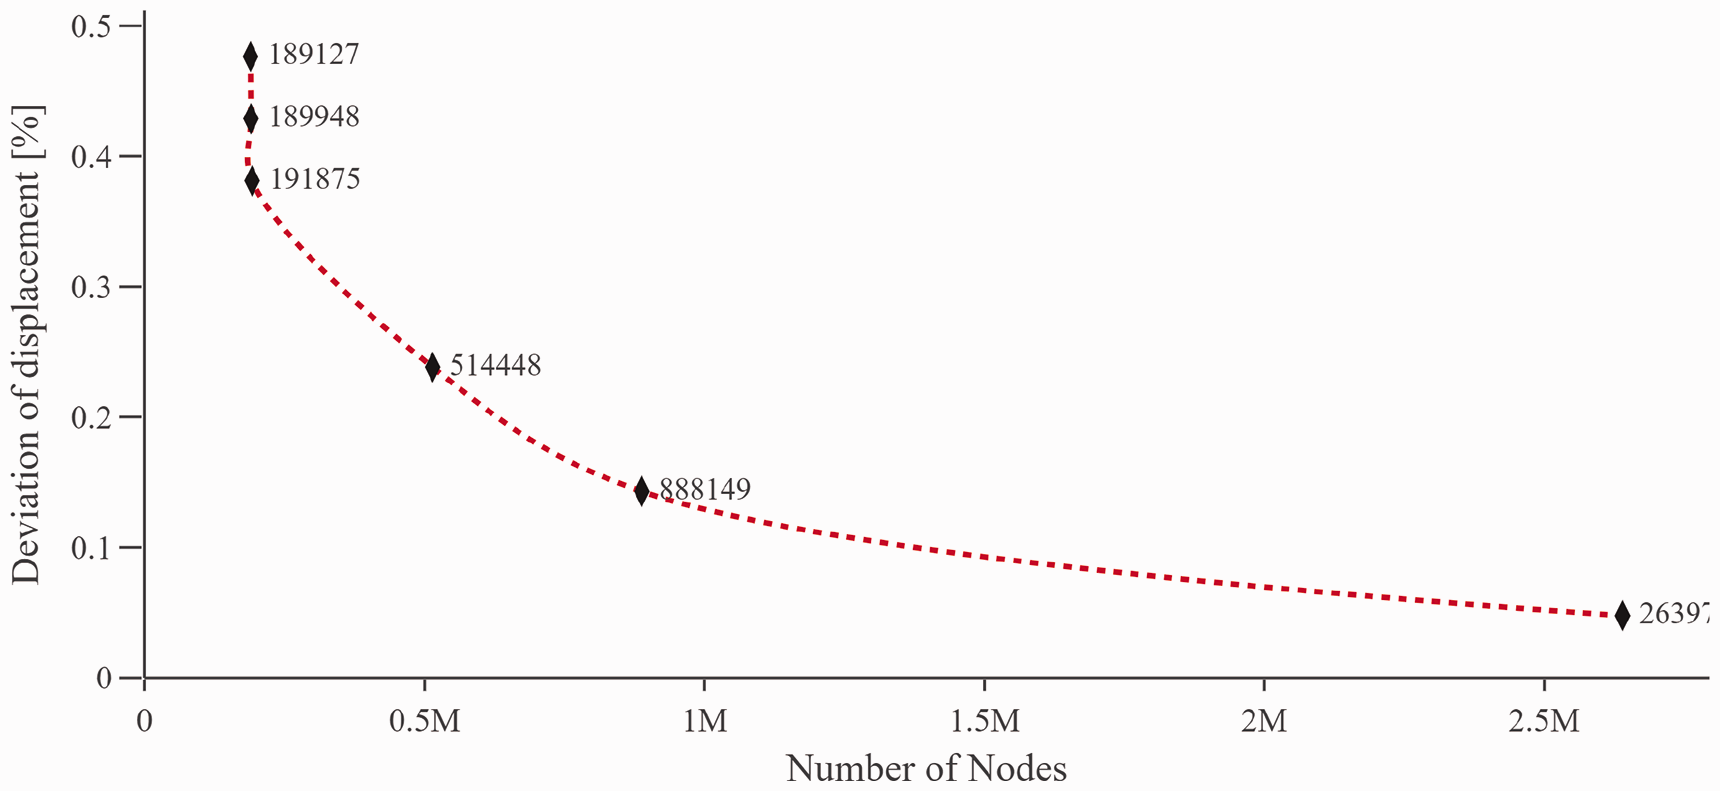
Mesh convergence analysis for the second model. The error observed was determined with the last mesh as reference for a fixed point in a critical area.
Results and discussion
Efficient wall count and infill density
The main goal of performing tensile tests was to understand how infill density (%) and the number of wall influence cost and UTS. The expected output of this study is a region of values that will give a good design insight on a near to optimum values of infill density and wall count. These values will be used as design insight and carefully used when building the prototype, since due to the non-isotropic behaviour of 3D-printed parts, it is complex to predict the mechanical properties in different loading situations. 29
The total manufacturing cost was one of the main factors of the study and it was projected as a combination of two important characteristics: cost of material consumed and the cost of electrical power usage. To complement this formulation, importance factors were added with the goal to better represent situations where the build time is extremely important, or filament usage is more important. For example, during the COVID19 pandemic, the PLA worldwide stock was scarce due to the efforts for the pandemic. Therefore, this is a situation where material cost importance factor would be non-unitary. The formulated cost equation was inspired by the study from the reference,13 and it was adapted into the following equation (6).

During the tensile tests, force and displacement over time were taken as the work variables. When calculating Young’s modulus, it was expected that the formulation given in equation (2) has a given error that does not consider or predict extrusion problems, complexity of the geometry of the infill and other situations that commonly arise in FDM, such as warping, feed rate and under-cooling. However, having considered these factors, the determined Young’s modulus for the different parameters groups can be seen in Table 3 with the respective means.
Determined Young’s modulus (GPa).
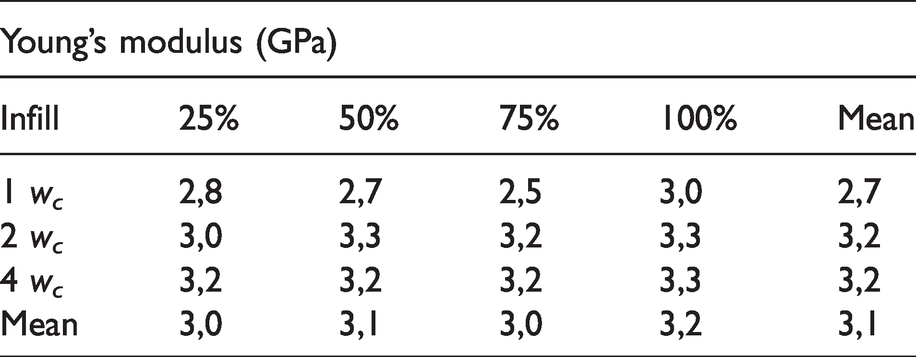
From observing Table 3, it is possible to conclude that the created geometric model of the cross-section area is a good representation of actual manufactured area, being the values determined closer to the ones observed in the literature.22,23,28,30 The maximum error is 17%, which can be justified due possible under-extrusion of the filament in the area affected by the infill. As such, the determined UTS can be seen in Table 4.
Determined UTS (MPa).
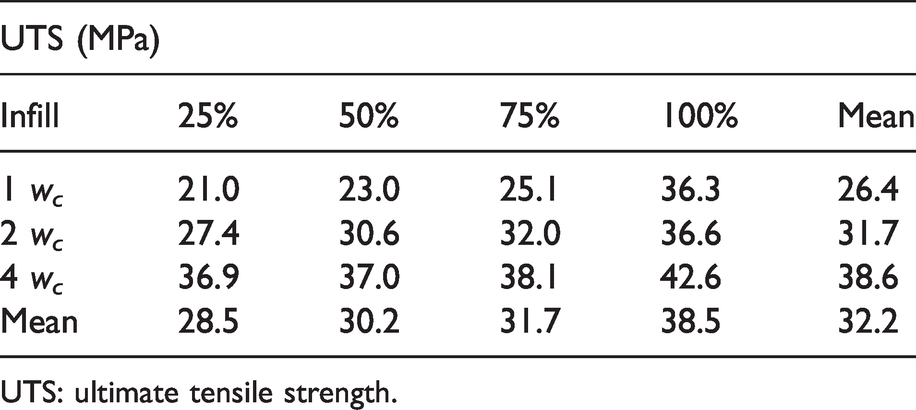
UTS: ultimate tensile strength.
In addition, by studying Table 4, it is easily seen that UTS increases greatly with the addition of wall counts. On the other hand, the increase of infill density will not significantly impact the ultimate tensile strength. The considerable gap between 75% and 100% is due to the fact that a component that has an infill density of 100% presents a theoretical 0 mm3 voids. Another factor worth mentioning is the fact that, as the number of wall counts increases, further increments in infill density will have less impact on UTS.
Before creating a relation between infill, wall count and UTS and cost, it is necessary to understand the effect of each factor in cost and strength-to-weight ratio. The first, allowed to understand how each factor has more influence on the cost. On the other hand, strength-to-weight ratio (or cost) is also a great way to comprehend the behaviour that will give more strength per gram, ergo, and more efficient. As seen above, because the cost of material is 19 times above the cost of time, then in this case in particular strength-to-weight ratio can be considered strength-to-cost ratio as well. Figure 5(a) shows the evolution of strength-to-weight ratio by infill and wall count. Figure 5(b) shows the effect on cost by infill and wall count.
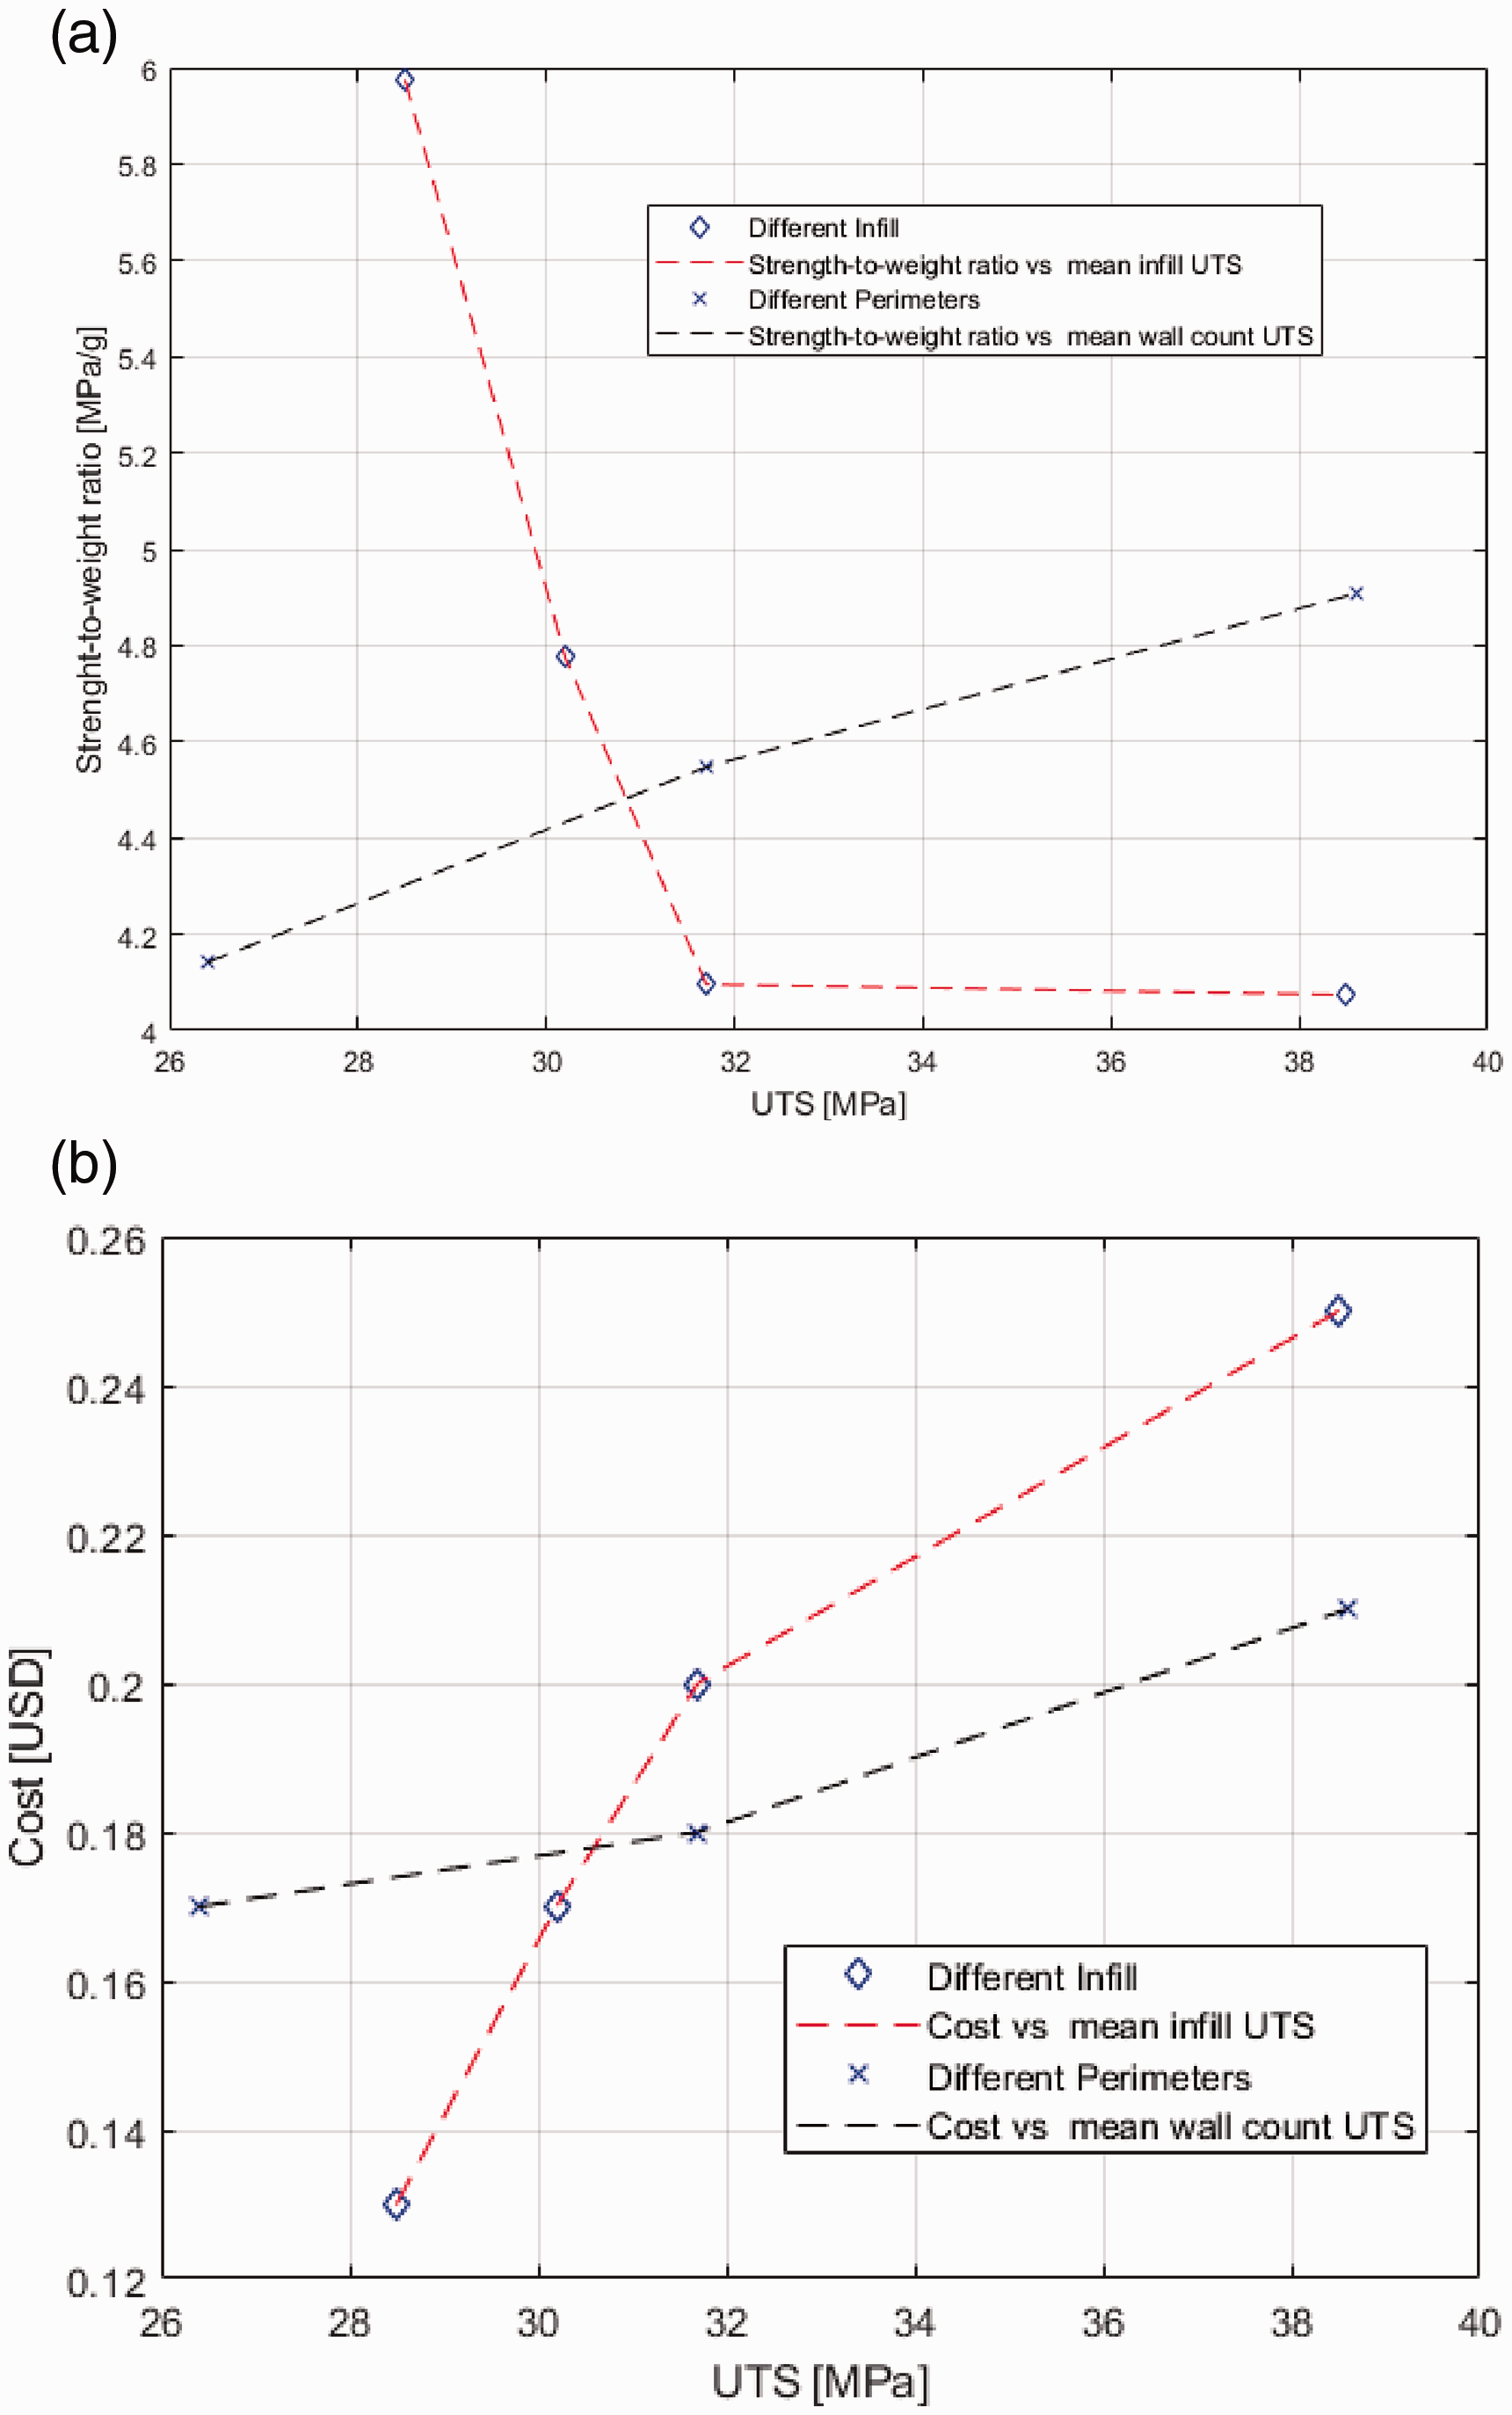
Evolution of different metrics. (a) Evolution of S/W ratio by infill and wall count and (b) evolution of cost by infill and wall count.
As such, it is possible to observe from Figure 5(a) that the relative cost of a sample with over 75% infill will behave very similar in terms of efficiency. Another possible conclusion is that low infills have the tendency to value the most the sample. These results are concurrent with the expected, where the topology of the part is of utmost importance for mechanical properties. Thus, increasing infill will not take a high effect on the UTS.
Finally, it is possible to conclude that increasing infill density between 75% and 100% will not create additional value, confirming what it was observed in the literature. 26 Figure 5(a) also shows the increasing effect of wall count in the ratio. Once again, this proves the effect of the number of wall counts for an efficient design for additive manufacturing, in particular FDM. Thus, it is expected that, to achieve an effective cost, infill should be maintained to a minimum and wall count should be increased instead.
On another term, Figure 5(b) relates the cost with the achieved mean UTS for perimeter and wall count, proving once again that infill density is the one that mainly dominates cost over wall count.
Using the powerful tool-kits provided by MATLAB to create surfaces that closely fit the data set, a script was written to apply a surface that correlates the UTS matrix with the other factors in study. The model surface was achieved by bi-cubic interpolation that closely fits the data set. Bi-cubic interpolations allow to use a third degree polynomial to do the interpolation in a grid-like mesh.
Figure 6(c) is the contour plot that relates the total cost of the sample with the infill percentage and wall count. The contour plot of the Figure 6(b) relates the UTS with infill percentage and wall count. Finally, the contour plot of the Figure 6(a) relates the strength-to-cost ratio with infill percentage and wall count.
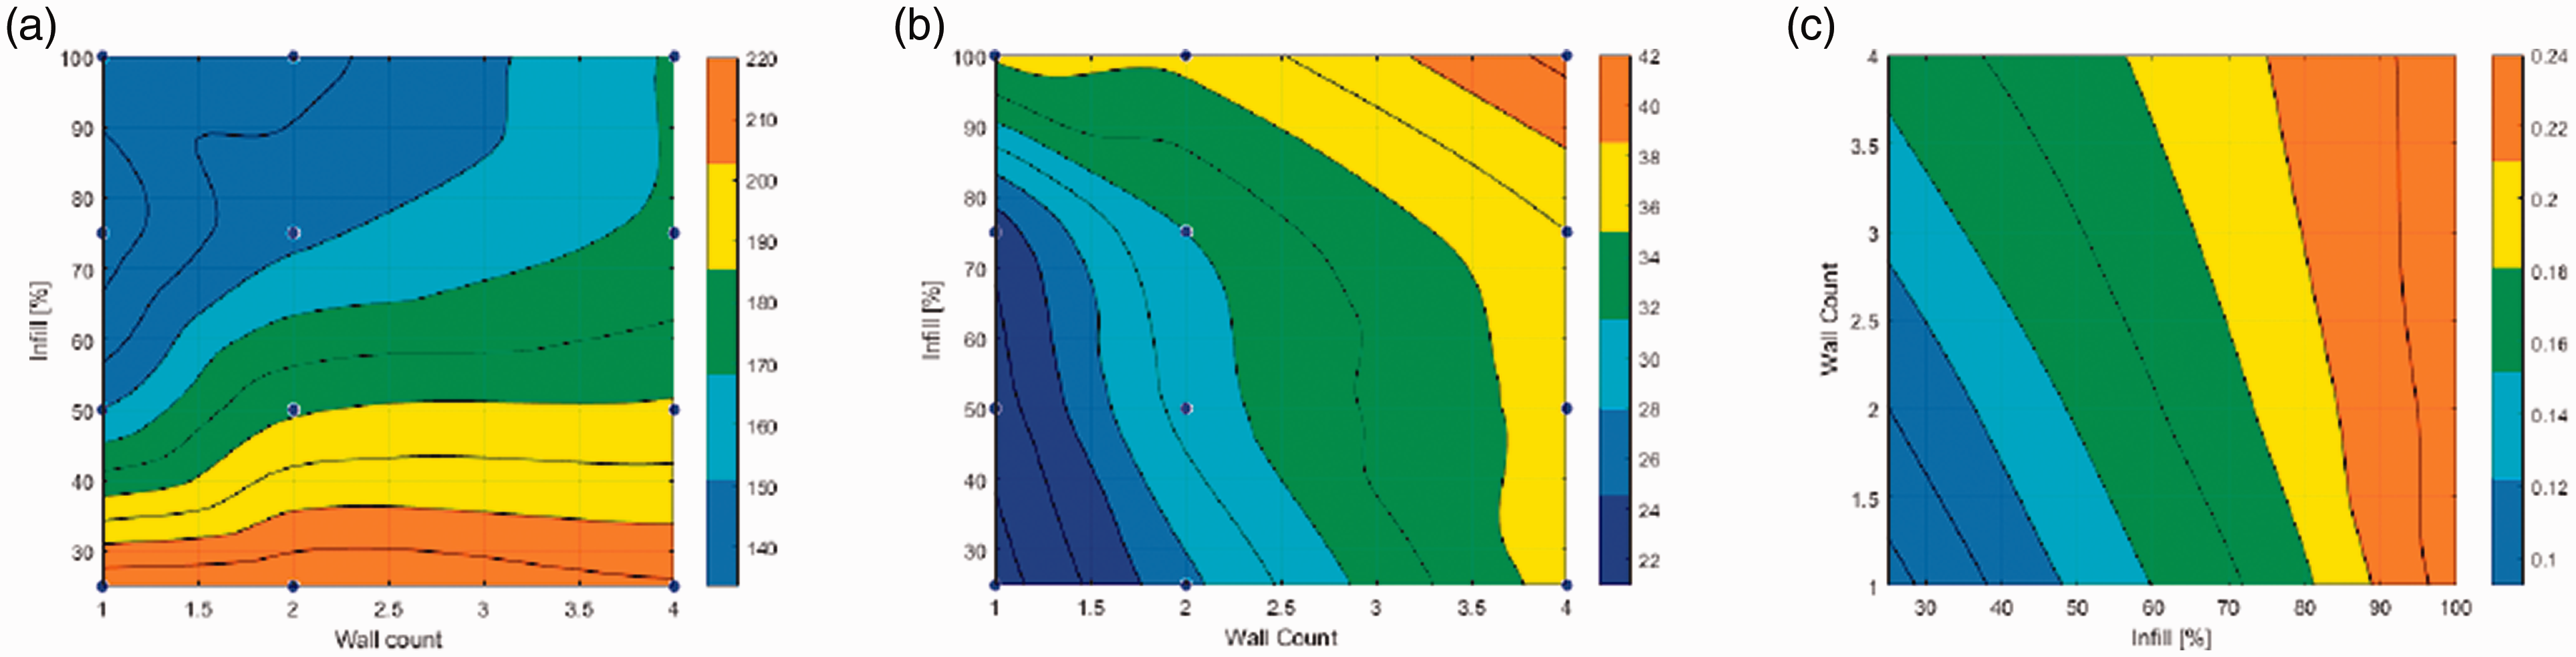
Contour plots of the strength-to-cost ratio (a), UTS, (b) and cost (c).
These plots not only confirm what was expected, but they also have the potential to be used as decision contours. Thus, by observing these figures, one can find the correct region in the data set to decide the best parameters, which fits the inputs required for the component in study.
As a consequence, in the solution of the microscope prototype in analysis, for all parts that will be 3D manufactured, the main goal is to have cost-effective properties, while using the most infill possible as a way to improve strength. Thus, this can be seen in the contour plot of Figure 6(a), where the orange colour is the one that better optimizes our cost. The values of wall counts that use the most infill while still being in the orange areas are 2 and 3. This number of wall count is extremely cost optimal, up to a max of 35% infill. This decision, confronting with Figure 6(b) shows how to decide the wall count. The usage of two walls and 35% infill is located in the light blue area between an UTS of 28 and 30 MPa. On the other hand, the contender, three walls, 35% of infill is in the green area between 32 and 34 MPa. Even though the decision seems obvious by now, it is important to observe the difference in total cost of the same part. As such, observing plot Figure 6(c), it is possible to note that the difference between prices for a 2 or 3 wall count is small, being only two cents different. Having the product some structural features important for the accurate performance of the device, then the small cost difference was sacrificed and the parameters chosen were 35% and 3 wall counts.
The corresponding surfaces to these contour plots can be seen in Figure 7 where the surface of the strength-to-cost ratio can be observed in Figure 7(a). Figure 7(b) displays the surface of the behaviour of the UTS and Figure 7(c) shows the mesh plot of the cost.
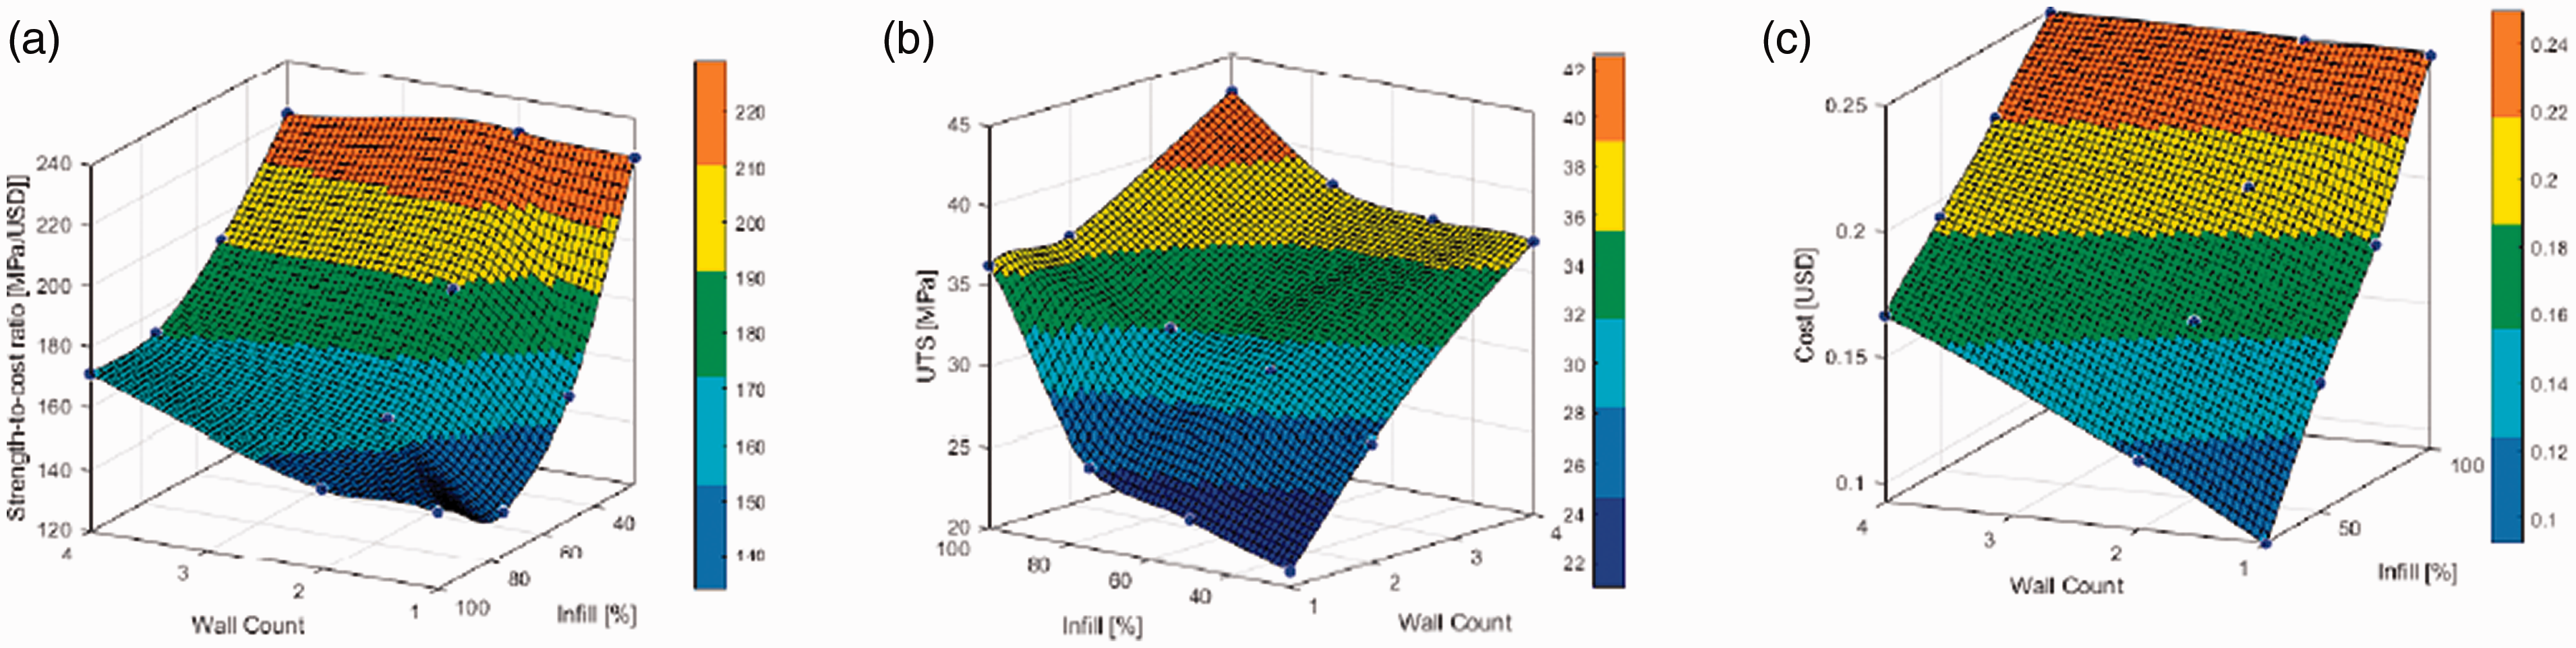
Mesh plots of the strength-to-cost ratio (a), UTS, (b) and cost (c).
These plots not only confirmed what has been observed but also improved the display of the behaviour of each factor. In Figure 7(b), it is possible to observe the higher influence of wall count compared to infill density on the UTS. However, as seen in Figure 7(c), infill density dominates the influence on total cost. This is due to the fact that infill dominates the total weight of the part, as well. Finally, Figure 7(a) confirms what has been shown, infill should be used a less as possible for an extremely effective print.
Design for additive manufacturing
In house prototyping is the most inexpensive and fastest way to test a product before doing major design modifications. Using traditional manufacturing technologies for prototyping often requires the usage of third party suppliers. The main advantages of such endeavour are having a prototype closer to the final product and, as well, the possibility of using a similar material to the final one.
However, the drawbacks of using third party suppliers are many. These drawbacks range from increased cost in raw material, skilled work to expensive machine time. The total cost of prototyping with traditional manufacturing technologies can also be increased by considering the time of manufacturing and the bureaucratic process that companies create to proceed with a purchase order. As a consequence, a part that could be created in house via a desktop 3D printer in just a few hours, can actually take weeks due to the previously referred time overheads. To avoid these drawbacks, having a nearby capable workshop for product conception, or even having in house not only the required machinery but also skilled workers is a good alternative. However, this is a scenario that is not feasible for most medium companies, due to economic and/or geographical factors.
In these situations, additive manufacturing becomes very appealing. The main problem of technologies such as FFF/FDM or SLA are the final piece mechanical and geometrical properties, build size and being constrained mainly to the usage of only polymers. During the pandemic of COVID19, additive manufacturing presented itself as the only way to evolve the product development process by prototyping. As such, the question of creating this complex prototype while using additive manufacturing technologies emerged. FDM is not well known for the dimensional accuracy and roughness. It is also a process that suffers from many flaws that can lead to a considerable material waste. As such, different parts were redesigned with additive manufacturing in mind.31,32 Structural parts were redesigned as well, considering the fact that now they would be built as a polymeric lattice structure.
Component optimization pipeline
To explore further the principles of design for additive manufacturing for optimizing components, in this section, a critical part of the μSmartScope was studied. In particular, this part is responsible for the correct guidance and stability of the translation of the optic tube, thus needs to be a complex three-dimensional shape. Therefore, this part will be considered as one of the most expensive non-standard parts of the device, being of high importance for the correct performance of the microscope prototype. In this section, the used optimization pipeline will be demonstrated using the optic tube holder component as example.
Finite element analysis is applied to understand the behaviour of the part for different load conditions. In addition, topology optimization will be used as a way to reduce as much mass possible and still maintain the necessary stiffness to resist displacement.
As such, it was developed as a component optimization pipeline, which diagram can be seen in Figure 8. This pipeline begins, firstly, from a rough and simple CAD model. Afterwards, a static finite element analysis (FEA) verification is done to observe if the initial model can withstand different load conditions. After this stage, if positive, the topology optimization algorithm is undertaken with a table of load conditions taken into consideration. Models originated from this routine are usually a non-parametric model, as such, they usually present sections and geometries that are impossible to create in a traditional manufacturing process. Complex geometries are also prone to high concentration factors that will lead to residual stress and locations where fracture occurs, and as such, redesigning the part is essential. The redesign of the part uses the mesh body from the routine as design insight, guiding the designer where to remove mass. The main advantage of this step is the fact that the designer can have a specific manufacturing process in mind as well.
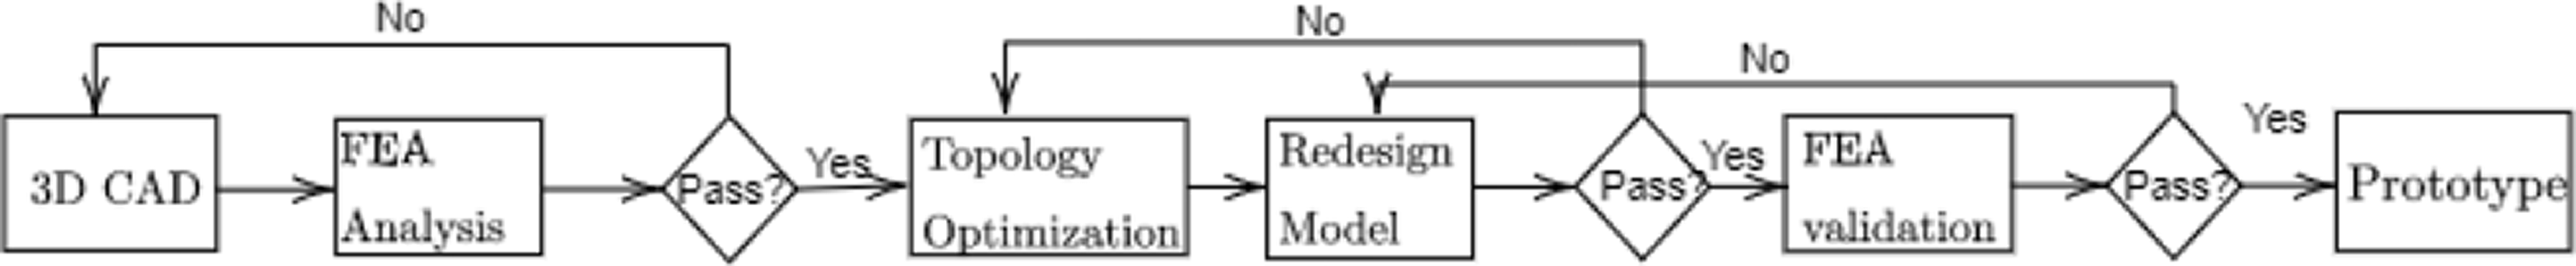
Part design sequence.
After redesigned, the part can be submitted again for the topology optimization, if required to reduce the weight of the new geometry. The final digital stage is to validate again, by FEA, the mechanical results.
Finally, a prototype of the part is created to observe the final piece and respective geometry, allowing to validate the part and the mechanical behaviour and assembly complexity.18,33
Optic tube holder
In order to evaluate the proposed component optimization pipeline, the optical tube holder of the μSmartScope was selected as the case study part. The main goal of this component in a microscope is to allow for the translation of the optic tube without considerable radial misalignment. This part requires high strength and to be lightweight, and in addition, the high stiffness is necessary so that the optic tube does not suffer any misalignment due to inertial efforts in any direction. In particular, a misalignment would greatly compromise the precision and speed of the focusing process.
To achieve this, the topology of the optic tube was changed to allow fastening. In the initial model of the component, two cylindrical features were added with the goal to restrain the optic tube in place, in all directions.
However, it has been seen that one point of fixation is more than required to “bond” the optic tube with the rest of the mechanism. Some aftermarket products do present this geometry. 34
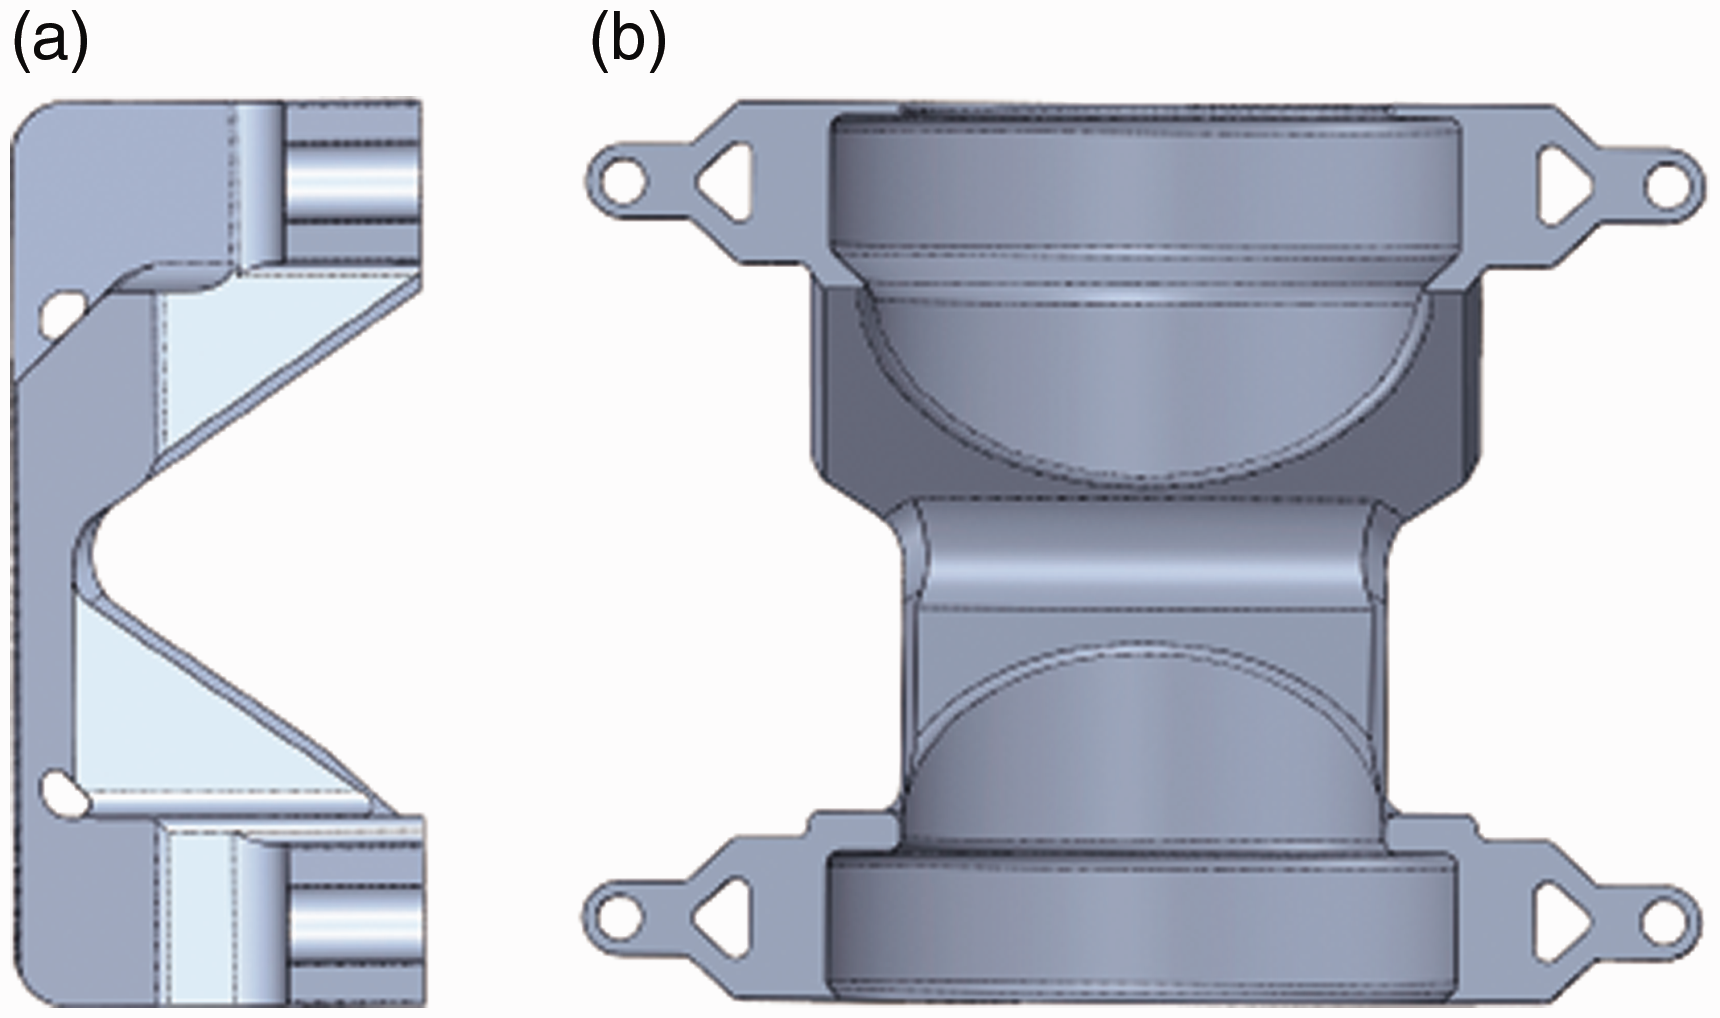
On the other hand, to mitigate misalignment problems and use polymers-based products that are extensively lighter than the metallic counterpart, two support points were used. This way, it is possible to guarantee that no parasitic motions occur that could lead to misalignment. The initial design space can be observed in Figure 9.
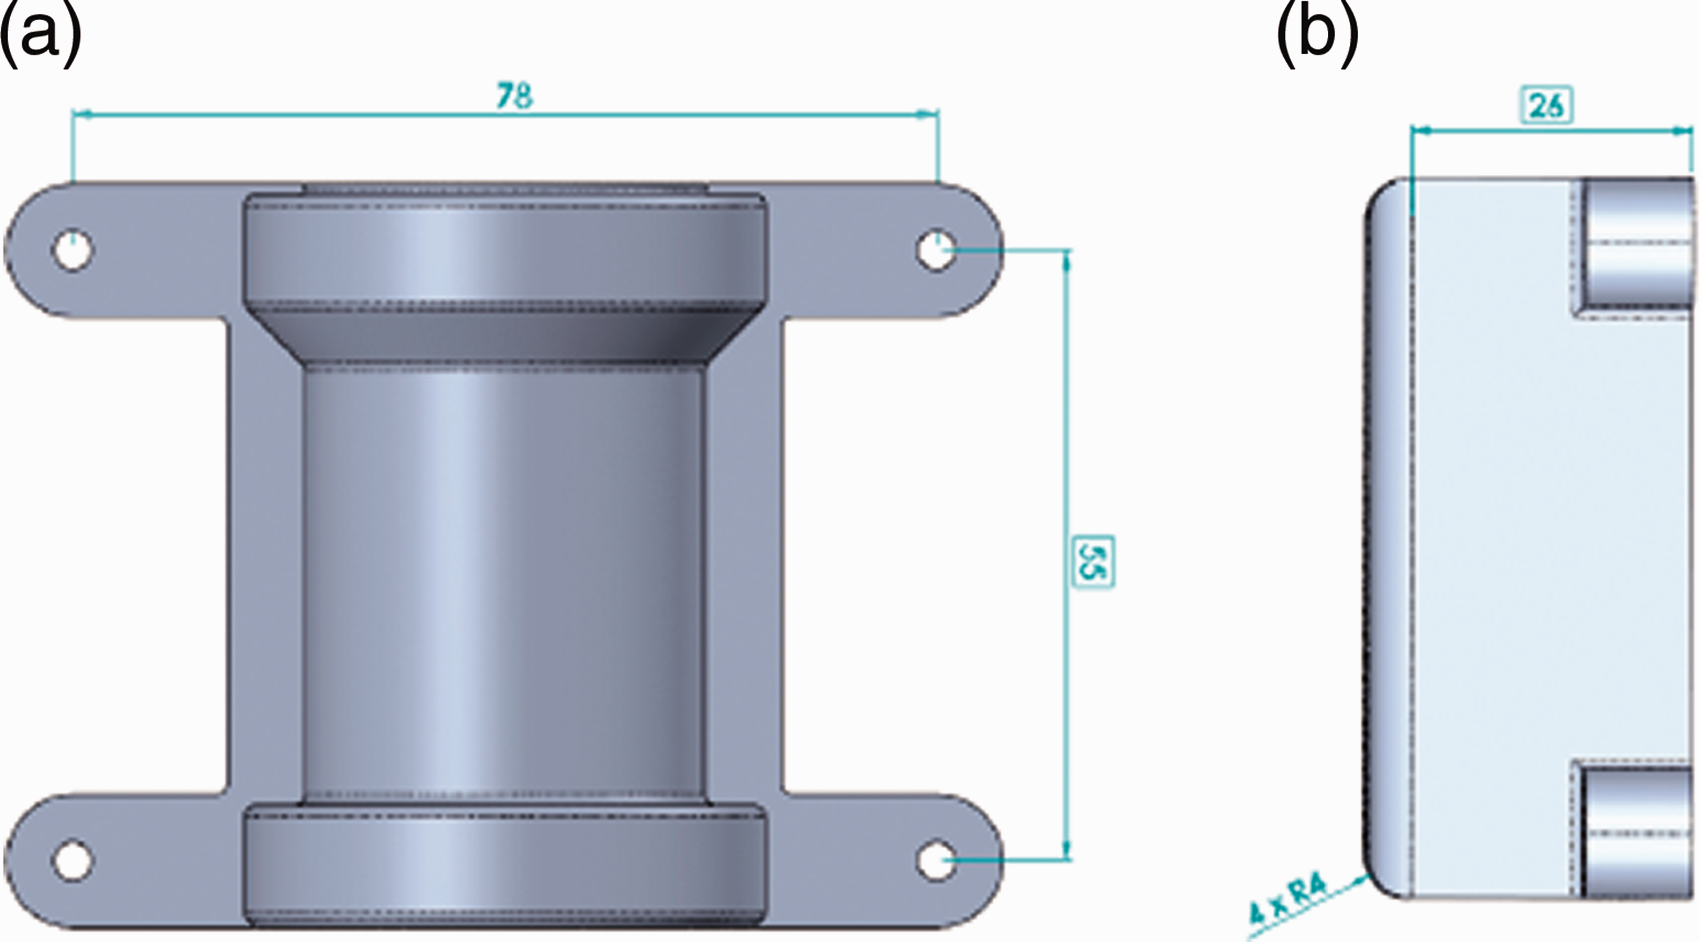
Front view of the initial design space (a) and the respective side view (b).
Static simulations
The optic tube holder starts as a block that can hold the required part. Before proceeding with the topology optimization verification, a first static analysis was made, being considered two load scenarios: (i) the engine and the weight of the components above it are being displaced in the same direction and (ii) the engine pulls the components towards it. The load conditions can be observed in Figure 10. The components that will be assembled to the optic tube holder include the optic tube, the respective optic and other important parts, such as the smartphone and the component that will hold it in place. The maximum thrust of the engine for the respective weight is 45 N, and the total weight of the components was 20 N. As such, when the thrust of the actuator and the weight of the bodies are in the same direction, a force of 65 N will be pushed against the cylindrical faces. In this part, the total weight is divided into two different surfaces where the loads will be divided equally. It is expected that the smaller surface will achieve higher displacements and stress. In the case where thrust is opposing gravity, the resultant force of 25 N is applied in the top surface.
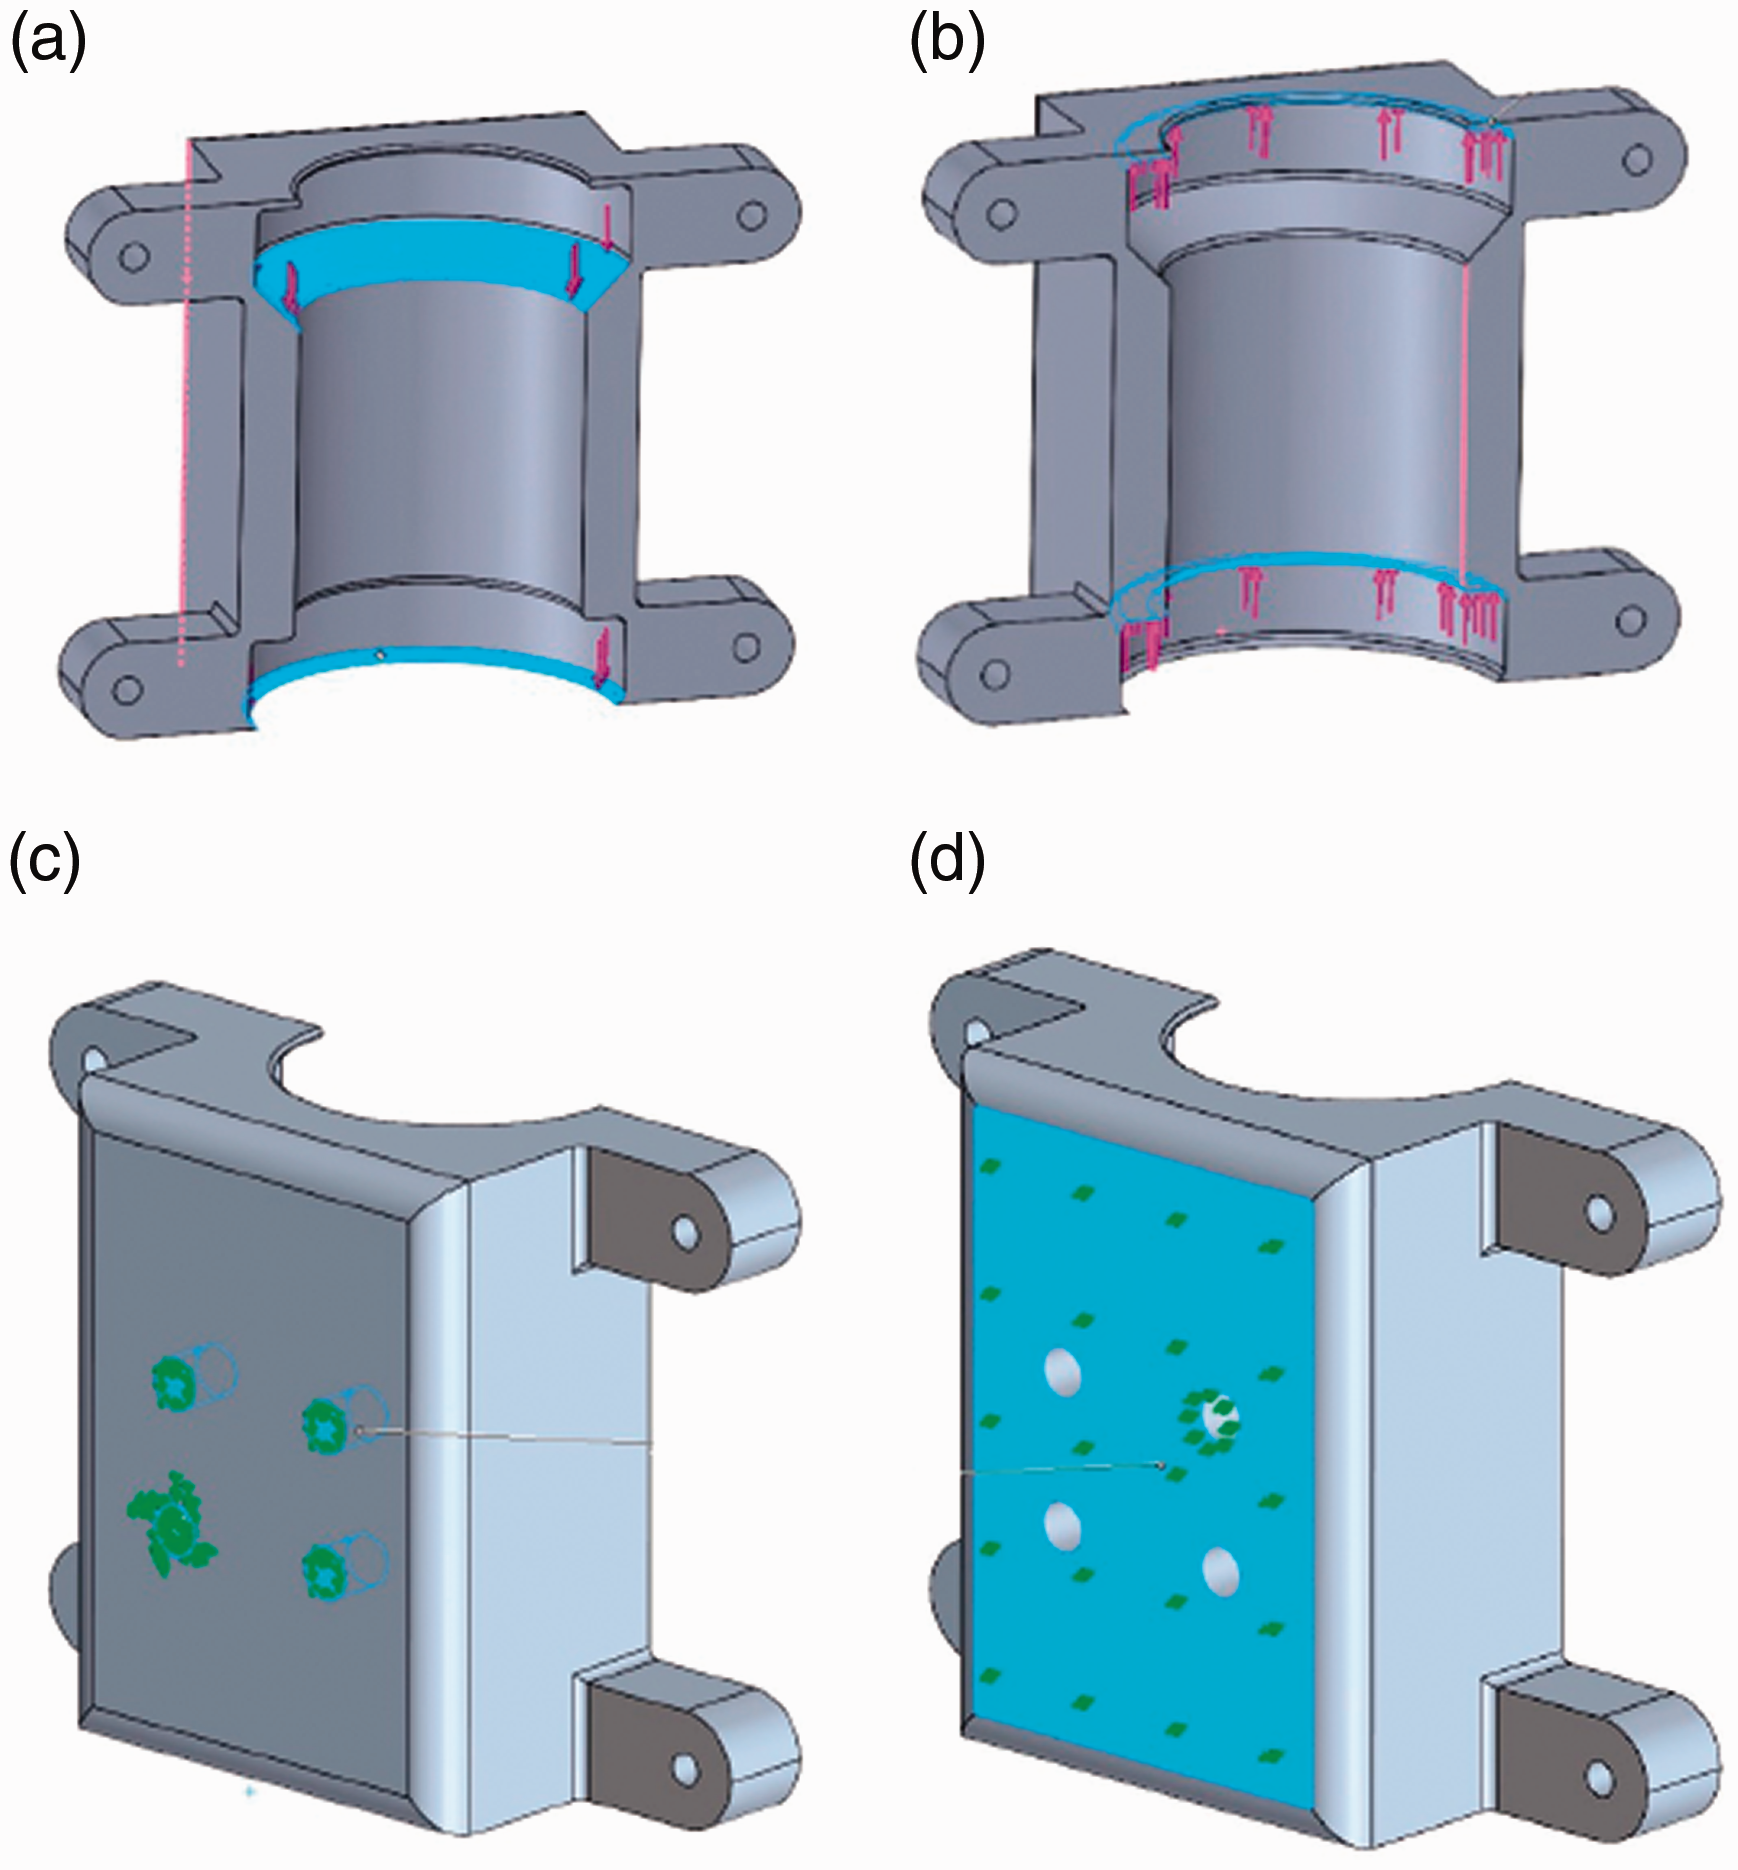
First load case (a), second Load case (b), fastener fixtures (c) and simply supported (d).
After analysing both static cases, it was concluded that the displacement would not be an issue in this part. Due to the high stiffness of the model, the displacement was in a sub-micron range. However, it was observed that stresses can be problematic. Even though magnitude is low, it is concentrated in places where area and thickness are very small (both load cases stress can be observed in Figure 11). At this stage, it was concluded that these features needed extra improvement – an attention to guarantee a more evenly stress distribution over the body. However, the expected maximum stress that the body achieves in a given moment is
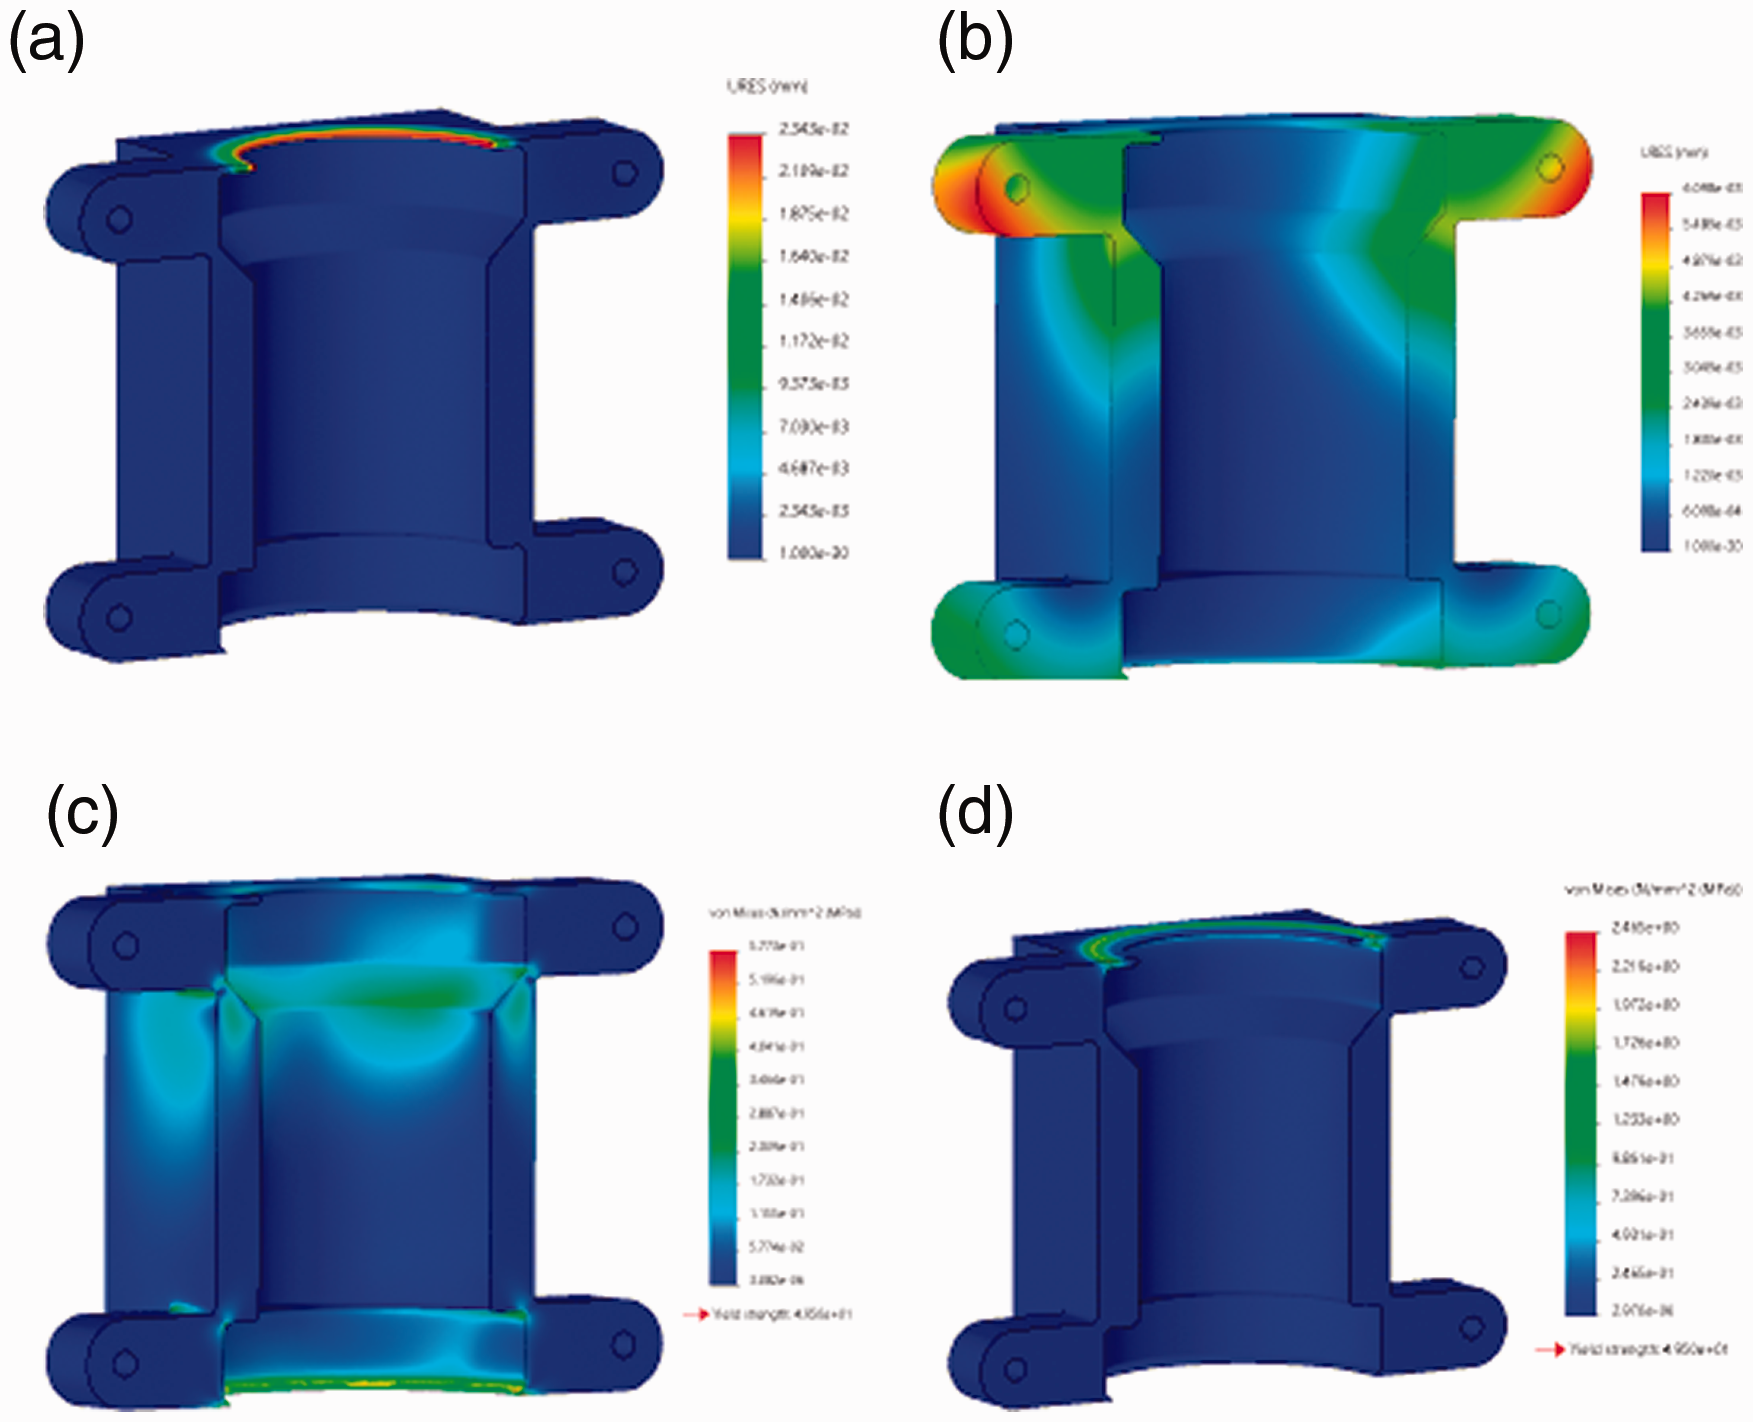
Finite element analysis validation for the initial design space where displacement for the minimum load case (a), displacement for the higher load case (b) stress for the maximum load case (c) and stress for the minimum load case (d).
Topology optimization stage
Once the target part was validated through static simulations, the multiple load case topology optimization algorithm was undertaken. In this case of topology optimization, it was used as a table of load cases, optimizing the part for different situations. In this component, manufacturing controls were added to guarantee that the algorithm does not remove important features, e.g. the place where future brass inserts will be placed.
The next step was the creation of goals. The initial part started with an initial mass, by the CAD information, of around 80 g. The main goal of this algorithm is to optimize stiffness per gram, as it is necessary to have the maximum stiffness possible. Thus, it was set as goal to remove a minimum of 60% of mass, to a more tolerable 32 g. The goal is to reduce half the weight. However, it was given a safety margin of 10% in the topology optimization to take into consideration the future redesign of the part. This weight guarantees a faster and cost-effective performance. Another advantage of topology optimization is that it also optimizes the amount of material consumed. This factor, in particular with additive manufacturing, is vital, since one of the main drivers of cost is the price of filament. Figure 12 shows the final mesh body obtained rounding around the 44% of the initial mass.
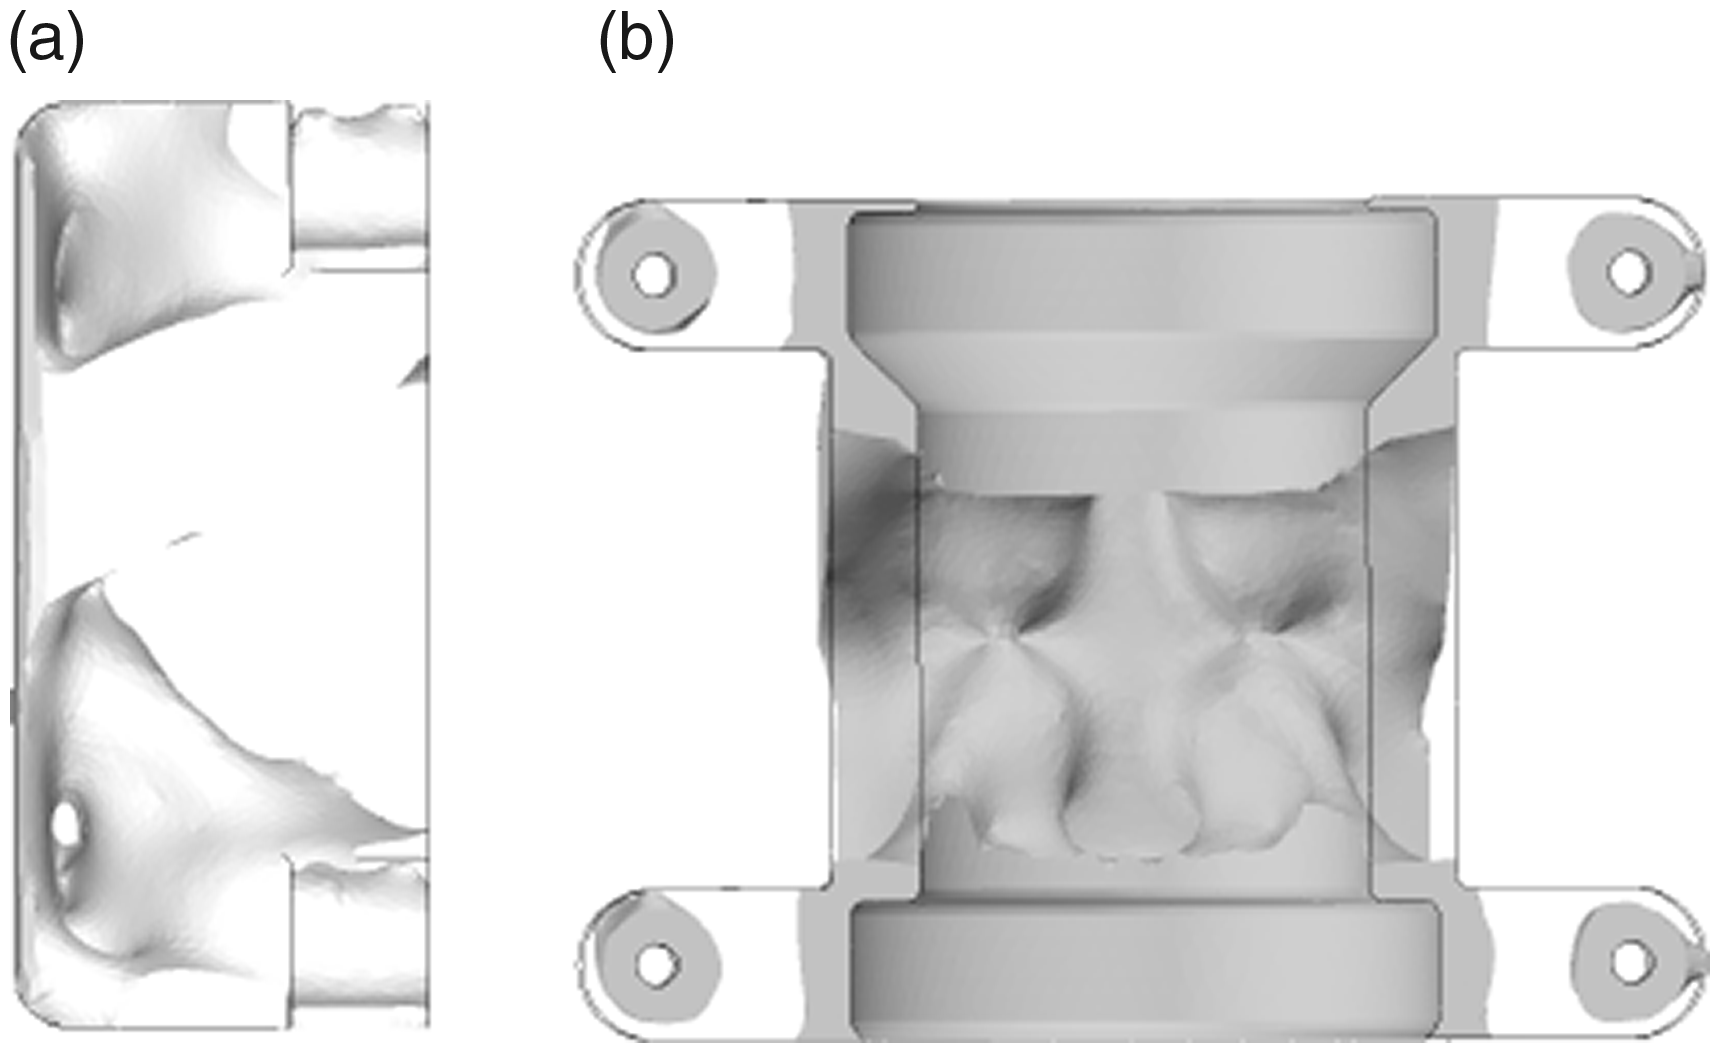
Side view of the final mesh body obtained (a) and the respective front view (b).
The obtained mesh body is certainly interesting. The prominent feature is the creation of triangular shapes from the cylindrical features to the back of the body. This triangle shape is expected to work as a truss structure, leading efforts in a fast way to the connection with the exterior. Another interesting feature is the overall truss structure near the circular features guiding the efforts to the base. The final redesigned part can be observed in Figure 13. Finally, the component after being redesigned weighs 42 g, around 52% of the initial mass. It is important to notice that this weight can be further reduced with the usage of lattice structures typical of additive manufactured components, as it was explored in section efficient wall count and Infill density.
Side view of the final redesigned component obtained (a) and the respective front view (b).
Final validation with finite element analysis
After having the part redesigned and achieving the desired weight, it is important to submit this component to a last FEA validation. It was observed that the maximum displacement achieved was in the decimal units of the micron. The maximum resultant displacement determined was 0.026 mm. As a consequence, it was expected that misalignment will not be a problem. It is important to observe that the determined displacement magnitude was mainly focused on the thin section similar to initial design space. The resultant displacement of the rest of the body was around 6 µm. The maximum stress determined was
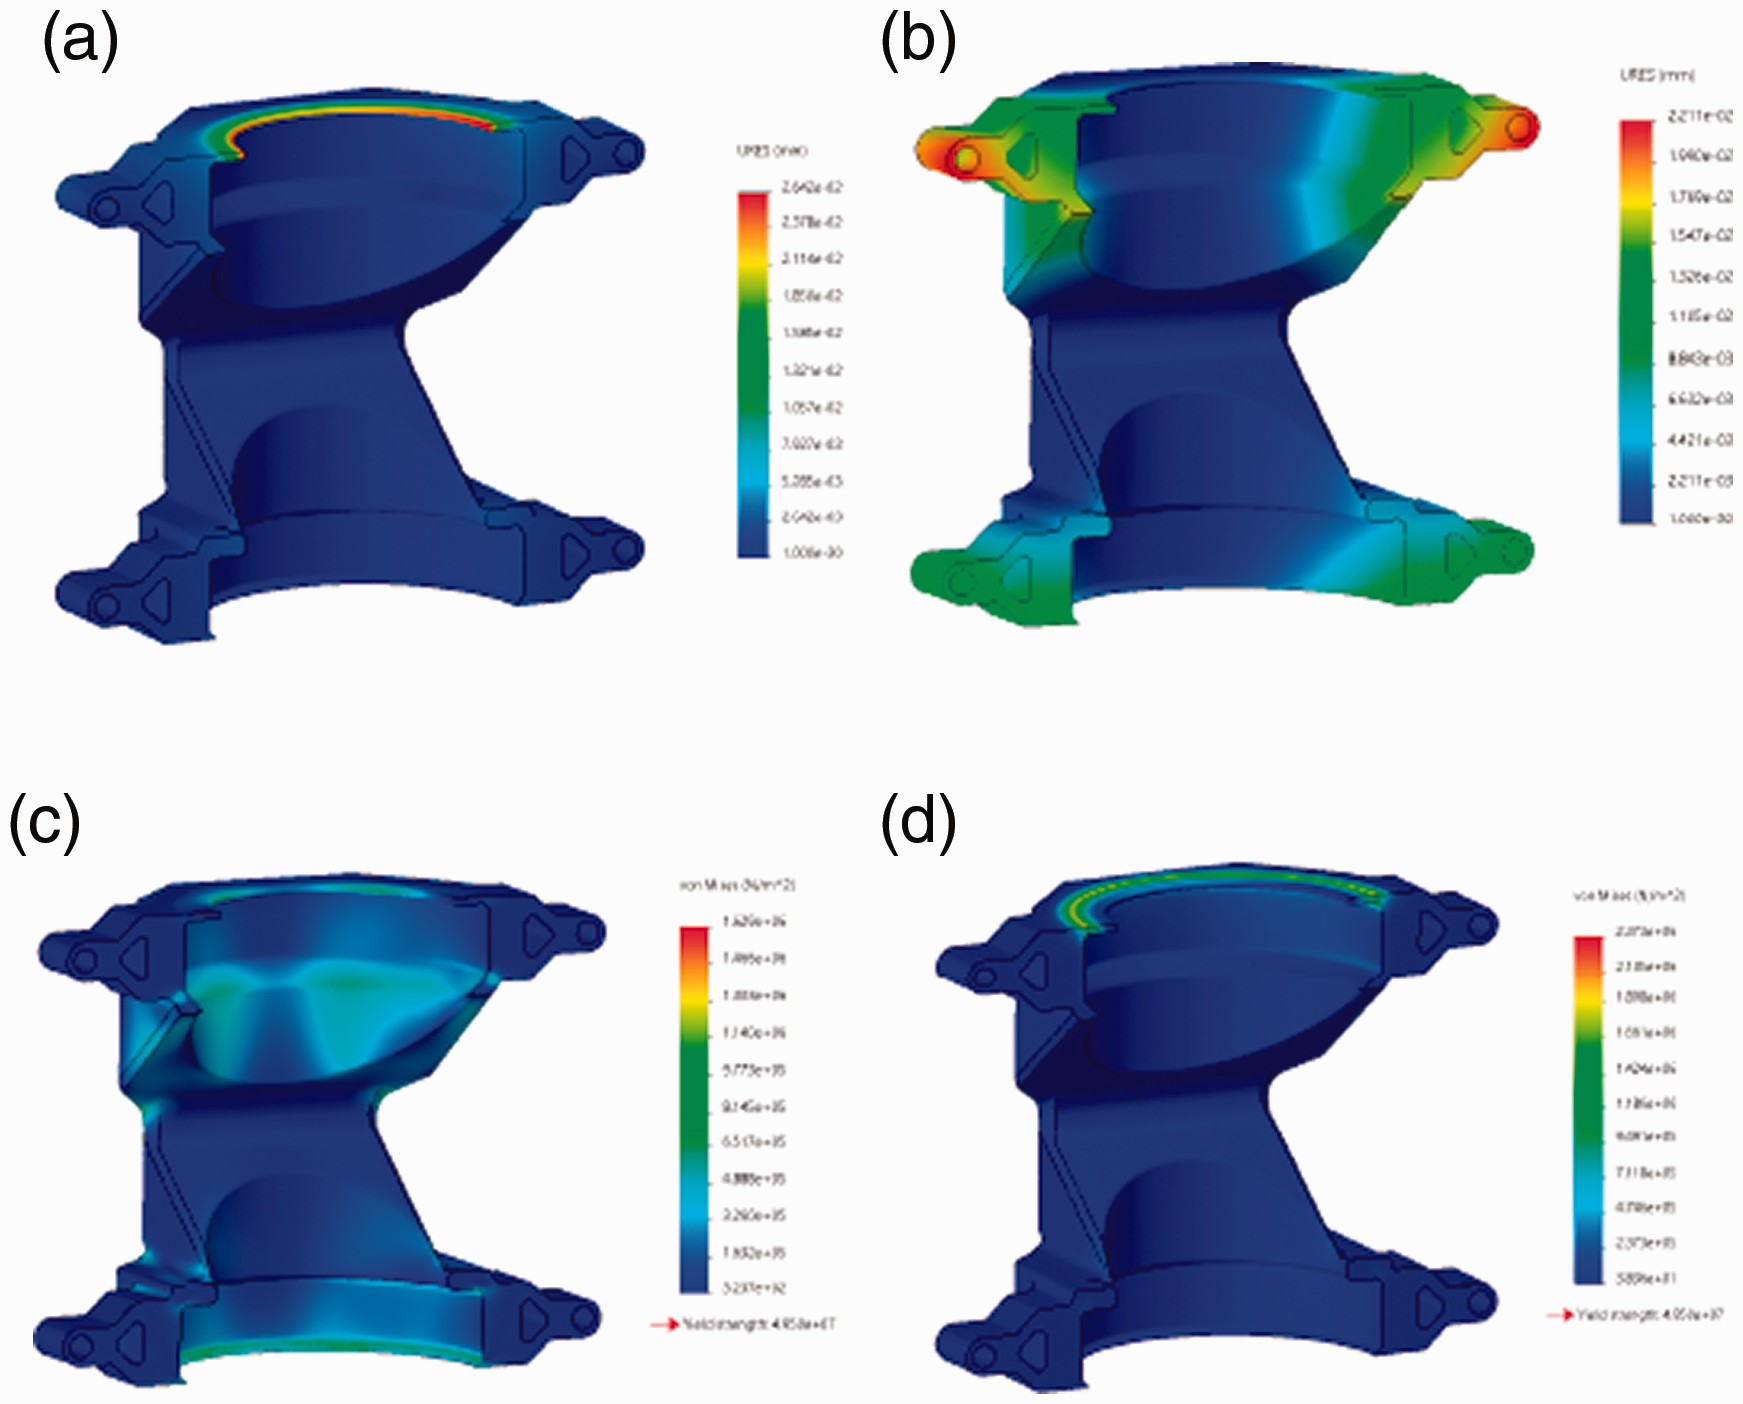
Finite element analysis validation for the redesigned component where displacement for the minimum load case (a), displacement for the higher load case (b) stress for the maximum load case (c) and stress for the minimum load case (d).
After this process, the part is considered optimized. The next step of the process is to manufacture it with the selected parameters, using the most efficient topology.
Conclusion
To optimize cost in additive manufacturing, different tensile tests were conducted. The influence of the number of walls and infill density on UTS was studied. It was concluded that, for a same importance factor, the cost of material, at the time of this study, is 19 times more important than the time consumed in manufacturing. It was also observed that the infill density is the main driver of cost for the created samples, and as such, it is a good design insight to reduce is usage as must as possible.
Decision contours were plotted to better understand the behaviour of different parameters in the strength-to-cost ratio, UTS and cost, in order to decide the parameters that will be used as guideline. For the part being designed, an infill density of 30–35% and 3 wall counts were chosen.
These parameters were used as design insight in the prototype of the component in study. A design process was created to represent how this part was optimized, reducing approximately 50% of the total weight without losing features. This process begins with an FEA validation of an initial simple design space. In the situation where this part passes the necessary restrains, it is subjected to an topology optimization process, where manufacturing constraints are added. Finally, the part is redesigned from the smooth mesh obtained from the mass plot. If the desired weight is achieved, the redesigned part is once again submitted to a new FEA optimization, validating the new topology.
In this study, the component that suffered this design process had an initial maximum Von Mises stress of 2.465 MPa and resultant displacement of 0.023 mm. The part was submitted to a multiple load case topology optimization part, with the redesigned part achieving a total weight of 44% of the initial mass. This optimization process was a success, as the redesigned part achieved a maximum displacement of 0.026 mm and maximum stress of 2.373 MPa. Thus, the similar values achieved validate the proposed topology optimization technique as an effective design process to optimize components.
Footnotes
Acknowledgment
The goal of this project is to provide automatic tools for cervical cancer screening based on cytology and colposcopy images.
Declaration of Conflicting Interests
The author(s) declared no potential conflicts of interest with respect to the research, authorship, and/or publication of this article.
Funding
The author(s) disclosed receipt of the following financial support for the research, authorship, and/or publication of this article: This work was done under the scope of “CLARE: Computer-Aided Cervical Cancer Screening”, project with reference POCI-01-0145-FEDER-028857 and financially supported by FEDER through Operational Competitiveness Program – COMPETE 2020 and by National Funds through Foundation for Science and Technology FCT/MCTES.