
Abstract
Data-driven streamers like Netflix and Amazon Prime Video have expanded into the European screen landscape with a significant appetite for locally produced content. These players leverage advanced data analytics to gain deep customer insights, but they prefer to keep a lid on their algorithmic operations. This article examines how screen workers interact with streaming data despite widespread secrecy. Drawing on interviews and an interface ethnography, I explore the ways these workers access, sense, generate and resist streaming data throughout their creative process. As such, the article provides a framework for understanding the subtle and sometimes contradictory ways that screen workers engage with such data practices. I also demonstrate how researchers can circumvent and lower barriers to access in an industry marked by data secrecy. As a result, this article contributes to discussions about the datafication of cultural production, and it does so with novel insights from the European screen context.
Keywords
Introduction
Streaming services like Netflix and Amazon Prime Video (hereafter ‘Amazon’) have wielded increasing power in the European screen landscape in recent years. Hailing from the United States, these streamers are on a quest to bring European storylines, locations and languages to their global networks. For that reason, they have enlarged their European slate considerably, so much so that Netflix became the largest single commissioner of new European scripted content in 2020 (Dziadul, 2021). In addition, their physical presence on European soil has grown in recent years with both Netflix and Amazon opening offices and production hubs in key locations. Their localisation strategy illustrates how they see ‘Europe’ as an umbrella market that comprises regional and national markets with distinct cultures, tastes and storytelling traditions. It also unveils how these streamers view themselves as major producers of European screen content (Afilipoaie et al., 2021: 320).
Global streamers combine geographical breadth with analytical depth: With the help of massive datasets fed into sophisticated algorithmic systems, streamers can match individual titles with personal taste around the world. Insights from viewing data play a vital role in the battle for eyeballs, but this information is kept under lock and key in a way that sustains fundamental power imbalances. Data secrecy takes different forms, including the lack of viewing metrics shared with the public and creators as well as the strict non-disclosure agreements (NDAs) these workers must sign. Gaining access to industry insiders is tricky, and empirical studies on the datafication of screen production are naturally scarce. This article therefore offers unique insight into the ways screen workers experience their own creative labour in a data-intensive environment. I focus on their collaborations with different global and regional streamers, but the analysis leans heavily towards Netflix as the market leader in the early 2020s. My findings arise from interviews with 30 screen workers (primarily screenwriters, directors and producers), which I combine with what Ortner (2010) calls an ‘interface ethnography’. It is an interdisciplinary pursuit at its core, borrowing ideas from media industry studies, production studies, creative labour studies, critical data studies and critical algorithm studies.
As we will see, streamers do share some data, especially with showrunners who have proven their worth. Screen workers also sense data in multiple ways, for instance through the feedback provided by streaming executives. What is more, a number of participants generate data themselves: Some workers conduct qualitative interviews with members of their target audience, while others design social media campaigns to assess audience interest. Finally, I illuminate how screen workers actively resist data in their creative work. It is important to note that these interactions are not either/or. Some creatives may find value in certain kinds of data while resisting others. At the same time, it is worth remembering that a company like Netflix has been a shapeshifter over the past 25+ years, which means that interactions with data have evolved as well. As Lobato (2019) reflects, Netflix ‘should not be seen as a static cultural object or one that is consistent from market to market. It is constantly evolving, acquiring new layers of use and association’ (p. 14). Streamers like Netflix furthermore sit within a broader media ecosystem with long-standing traditions for quantifying audience preferences. For that reason, contextualisation is important if we want to decode what is ‘new’ about data-driven screen production in a streaming era.
Capturing audience taste
Historically, quantifiable benchmarks have played a prominent role in how the screen industry has gauged audience success. Audience data in the form of ratings, opinion surveys, advertiser revenue and box office figures have helped the industry ‘predict the unpredictable’ (Gitlin, 1983) and manage risk within an inherently risky business. As a result, these types of data also contribute to the many ways the screen industry imagines and constructs its audiences (see Ang, 1991). Consider ratings, for example: Carah (2021) notes how this particular form of audience measurement has attended to the number of viewers, their location and their demographic characteristics with the goal of ‘creating the audience as a reliable and quantifiable product that could be sold to advertisers’ (p. 222). Emerging measures of audience behaviour put this so-called ‘exposure model’ under pressure. Traditional sampling methods no longer provide an adequately fine-grained picture. As Johnson (2019: 138) argues, they fail to account for niche channels and cross-media viewing behaviour, which undermines the reliability and accuracy of ratings as useful market information for the industry.
The 2010s introduced new modes of visibility and feedback that supplanted traditional audience measurement methods. This development exposes a pervasive ‘metric logic’, which Poell et al. (2021: 143) define as ‘the proliferation of platform-based measures in all aspects of cultural production and distribution’. Now, all the data we generate with our actions online can be used to identify patterns of behaviour and make predictive assessments, even in real time. This development follows on from the advent of Web 2.0, which meant that ‘many aspects of social life were coded that had never been quantified before’ (van Dijck, 2014: 198). This is sometimes referred to as ‘datafication’, which describes the process of converting a phenomenon into a quantified format that can be tabulated and analysed (Mayer-Schönberger and Cukier, 2013: 78). The ongoing datafication of social life has accelerated with the rise of ‘big data’, defined as ‘data sets characterized by huge amounts (volume) of frequently updated data (velocity) in various formats, such as numeric, textual, or images/videos (variety)’ (Kaplan and Haenlein, 2019: 17). Companies like Netflix and Amazon feed this continuous, fast-flowing stream of data into various machine learning algorithms. These algorithms ‘learn’ from a corpus of data, enabling them to make specific kinds of decisions without being explicitly coded to do so (Bucher, 2018: 24). With all these audience insights at their fingertips, streamers can target individual subscribers on the basis of their viewing habits. For instance, the Netflix Recommender System combines various machine learning techniques to curate a hyper-personalised viewing experience (Pajkovic, 2022).
Lotz (2022) usefully points out how transnational subscription video-on-demand (SVOD) services can target heterogeneous tastes while reaping the benefits of scale: ‘In some ways SVODs with general libraries paradoxically can blend the two strategies typical of television competition before their arrival: mass scale of broadcasting and niche segmentation of cable/satellite channels’ (p. 46). Netflix introduced these global niche segments as ‘taste communities’ back in 2016. As Gaw (2022) reflects, Netflix collapsed its national audiences into one global entity, instead favouring ‘clusters of viewers with similar tastes, agnostic of their demographic backgrounds’ (p. 713). Shifting the focus away from audience demographics to audience behaviour is significant because of the precision afforded by behavioural data. Instead of basing programming decisions on estimated viewing habits, streamers like Netflix can capture true viewing behaviour in real time (Adalian, 2018). For Lotz (2022), this means that ‘the days of the excuse “nobody knows” that has been used in television and film to explain unexpected hits and failures are numbered’ (p. 88). However, I would argue that this oft-quoted maxim – coined by Hollywood screenwriter William Goldman in 1983 – still holds true for large parts of the screen sector. This is due to extensive secrecy surrounding streaming data.
Data secrecy
Back in 2014, Timothy Havens identified a shift from what he called ‘an era of scarcity of audience data to an era of overabundance’ (p. 8). As I show in this article, screen workers’ interactions with data take different forms in the age of overabundance, as big data insights are often proprietary. In some ways, lack of access is not new: For instance, ratings companies such as Nielsen in the United States and the United Kingdom’s Barb Audiences (formerly Broadcasters’ Audience Research Board) have always restricted access to their data to a limited number of paying customers (Kelly, 2019: 126). Executives and creators would previously compensate for a paucity of data by relying on ‘gut instincts, industry lore, and complicated power plays among creators and gatekeepers that often deployed different conceptualizations of the audience’ (Havens, 2014a: 8). Screen workers still utilise such strategies in an era of overabundance, but the growing importance of big data analytics creates new digital divides in the screen industry (Kelly, 2019: 126).
Today, ownership of data, access to it and the techniques to make sense of it all are ‘key sources of competitive advantage in the television industry, and they are resources that can be monopolized’ (Doyle, 2018: 60). Players that can leverage advanced data analytics hold enormous potential in terms of not just gaining competitive edge but also in defining what constitutes ‘streaming success’ and ‘popular television’ more generally (Wayne, 2022). Although a streamer like Netflix has begun to release selected viewership metrics in dribs and drabs (see e.g. De Rosso, 2021), the amount of data shared publicly remains scant. Like all companies, however, streamers can be vulnerable to internal leaks. Some of the most telling insights have been found in documents leaked to the press, detailing how metrics like Netflix’s ‘adjusted viewer share’, ‘impact value’ and ‘efficiency score’ along with Amazon’s ‘cost per first stream’ factor into the way streamers separate hits from misses – or have at least done so at some point (Dastin, 2018; Shaw, 2021).
These success metrics have transformed over the years and will likely continue to do so. What remains consistent, however, is streamers’ preference to keep viewership figures secret, even from the creators they collaborate with. The screen workers Navar-Gill (2020) interviewed for her study of American television (TV) production even spoke about seeing less data in their day-to-day work than they were used to. She suggests that ‘siloing’ data and creative functions apart from each other enables streamers to ‘maintain control over the narrative about how data and creative practices interact’ (p. 5). This strict information control exposes a fundamental power asymmetry (Idiz, 2024: 2138). For that reason, different industry stakeholders have demanded greater data transparency, also as a way to ensure that screen workers’ renumeration matches the performance of their productions. For instance, film and TV trade unions in Denmark have proposed basing residual payments on viewership numbers (see e.g. Wallestam, 2022). This has also been a core issue in the 2023 Hollywood strikes. The Writers’ Guild of America (WGA) has managed to secure a success-based residual and more data transparency as part of their deal with streamers and studios. WGA gets confidential access to the total number of hours viewed for original streaming programmes, but the union can only report this information to members in aggregated form (Kilkenny and Goldberg, 2023). As such, the outcome of the writers’ strike signals that streamers still prefer to keep a tight grip on their big data operations.
Since screen workers face considerable restrictions when it comes to these insights, it can be tempting for researchers to accept this barrier to access at face value. Yet the anthropologist Nick Seaver (2017: 7) reminds us to ‘attend to the texture of access’. Challenges to gaining access reveal the cultural life of algorithmic systems and how knowledge circulates. As he writes: ‘If our interest is not in the specific configuration of a particular algorithm at one moment in time, but in the more persistent cultural worlds algorithms are part of, then useful evidence is not bounded by corporate secrecy’ (p. 7). In a similar vein, Taina Bucher (2017) focuses on people’s affective encounters with data and algorithms. Her term ‘the algorithmic imaginary’ encapsulates how ‘people imagine, perceive and experience algorithms and what these imaginations make possible’ (p. 31). Other scholars offer similar approaches to explore how people and algorithms entangle in everyday life (e.g. Lomborg and Kapsch, 2020).
It is worth looking ‘sideways’ to findings in other areas of cultural production, as these insights illuminate how workers in other sectors negotiate data secrecy. For instance, Poell et al. (2021) explain how limited access prompts social media creators to depend on ‘folk theories’ to understand the underlying algorithmic systems that control the visibility of content (p. 145). Similarly, Sophie Bishop (2019) has introduced the term ‘algorithmic gossip’ to convey how beauty vloggers hone their algorithmic expertise by drawing on ‘communally and socially informed theories and strategies pertaining to recommender algorithms’ (p. 2589). Empirical findings like these elucidate how people draw on a range of tools, skills and insights to attain visibility within opaque algorithmic systems. For workers in film and TV, such tactics intersect with sector-specific industry logics, rituals and practices. As my study shows, we can detect a lot about the role played by streaming data by examining how screen workers understand and encounter them in their everyday production practices.
Method
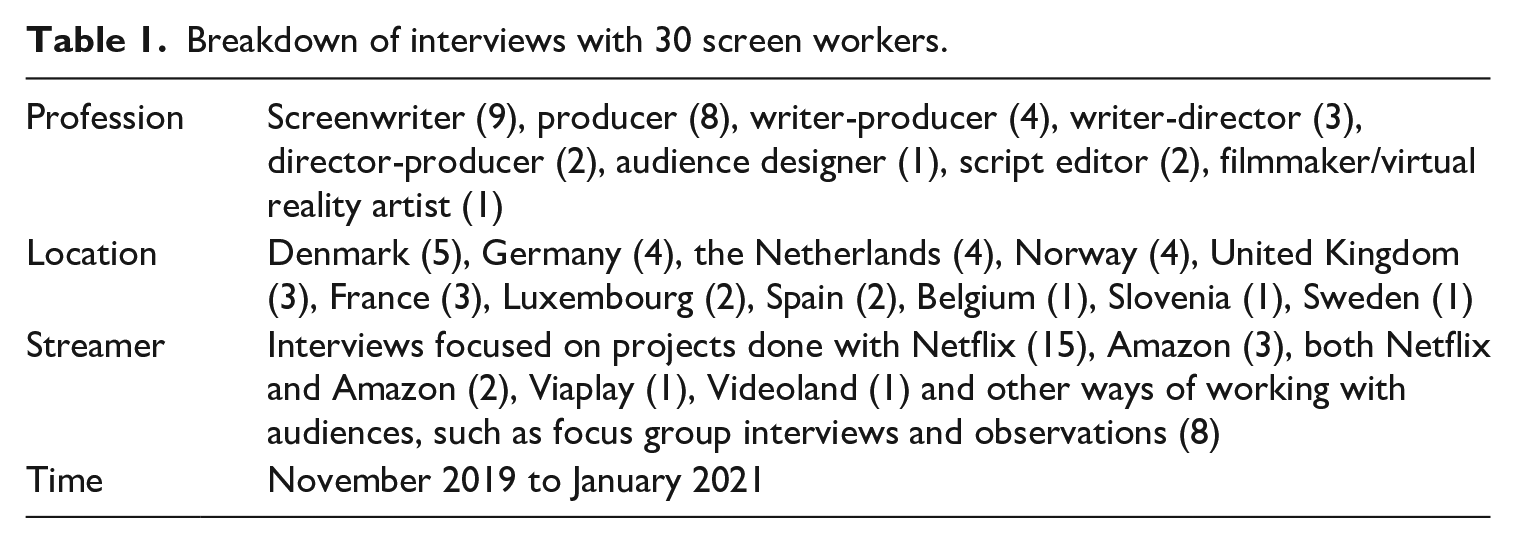
As Herbert et al. (2020) point out, research on production cultures takes an interest in media workers’ meaning-making activities: that is, their beliefs, values, priorities, practices and rituals (p. 49). This study examines the experiences of 30 European screen workers in 11 different countries. The participants occupy a variety of roles in film and TV production, but most work as either screenwriters, producers or directors – a group of professionals I refer to as ‘screen workers’. Due to a limited number of industry contacts, I relied on an inductive and experimental recruitment strategy. The selection criteria were flexible, but participants had to tick two boxes: They worked as screenwriters, producers or directors in Europe, and they had collaborated with a global or regional streamer. By utilising snowball sampling, I furthermore accessed participants who worked with audience data in a slightly different way, which greatly enriched the project (see Table 1 for a detailed breakdown). My study adopts a pan-European approach, but my interviews have also attended to distinct production ecologies across Europe. Despite obvious diversity, however, the accounts shared by screen workers have been remarkably consistent across national borders.
Breakdown of interviews with 30 screen workers.
There is much to gain from applying what Bishop and Kant (2023) call a ‘craft-based framework’ to creatively convey ‘the multifaceted ways in which digital technologies shape social life’ (p. 1012). Towards the end of every interview, I invited participants to draw their creative process, which allowed them to consider their practices in a different light. Zuboff (1988: 141) observes how such participant drawings can elicit feelings that verbal expression fails to capture. After completing the exercise, my participants often said something surprising that pointed in new directions.
Following Seaver (2017), I have also paid close attention to various barriers to access in the field and treated them as empirical data. For instance, I managed to schedule an interview with two global streaming executives, but they cancelled upon receiving a consent form. They were worried about how ‘official’ the conversation would be and referred to the ‘very unique and specific processes’ within the company. According to Sundet (2021), one central explanation for this unwillingness among streaming executives is that many global streamers ‘are stock companies, meaning they carefully monitor and control information flows’ (p. 457). In addition, my study hinges on acquiring information that is legally locked in NDAs between screen workers and streamers. Some workers did not feel comfortable breaking these NDAs. Of the workers who did agree to an interview, many wanted reassurance that their contributions would be kept confidential, which is why I use pseudonyms in this article.
The ‘closed’ nature of this industry has required me to generate empirical data in a variety of ways. Ortner (2010) has outlined a useful method called ‘interface ethnography’, which involves attending events where the screen industry presents itself to ‘the public’. Attending more than 20 industry events has allowed me to identify broader sense-making and storytelling rituals in this particular production culture. Although this article highlights the responses of my interviewees, this broader ethnographic fieldwork also informs my analysis. There is a significant body of scholarly work that dissects such organisational common sense, including in the form of ‘trade stories’ (Caldwell, 2008) and ‘industry lore’ (Havens, 2014b). Like most discourses, these sense-making rituals often take a tacit, taken-for-granted form. However, times of change and transition push industry discourses to the fore. Introducing the term ‘streaming lore’, Burroughs (2019) suggests that we should regard streaming ‘as a force that is fracturing existing industry lore and pushing nascent organizational principles to the surface’ (p. 4). My study investigates some of the frictions inherent in emergent streaming lore.
Juxtaposing interviews with an interface ethnography has been essential to understand these frictions: In interviews, some screen workers would make candid comments about the negative impact of streaming. The narrative presented at industry events, on the other hand, tended to celebrate the upsides associated with global streaming. This discrepancy demonstrates the importance of triangulating multiple data sources when dealing with a topic like data-driven screen production. It furthermore calls for a robust analytical strategy. I followed Braun and Clarke’s (2022) framework for ‘reflexive thematic analysis’, which offers specific tools to identify, analyse and report patterns across qualitative data sets. The rest of this article presents my results by detailing how my participants access, sense, generate and resist streaming data.
Interacting with streaming data
I use the term ‘streaming data’ to describe a patchwork of insights: the performance of specific titles; how audiences engage with these titles and the service more broadly; the value generated from specific productions and, lastly, streamers’ strategic and practical use of big data analytics more broadly, including outside of its own service (e.g. social media data). In short, ‘streaming data’ refers to an umbrella of interrelated insights that streamers collect, analyse and utilise. My study confirms that a key category of ‘streaming lore’ (Burroughs, 2019) revolves around lack of access to such data. The interviewed screen workers both internalise and contribute to this lore. This section charts some of the direct and indirect ways screen workers interact with streaming data despite widespread secrecy.
Interactions with streaming data sometimes involve what I call ‘counter-data’, which I define as insights that screen workers place in opposition to the big data analytics deployed by streamers. I draw inspiration from what Kazansky and Milan (2021) call ‘counter-imaginaries’. They explain that civil society builds counter-imaginaries to resist dominant imaginaries of datafication as articulated by corporate and state agents. As they ask: ‘What alternative values, practices, and tactics emerge from the grassroots which point toward other ways of being in the datafied society?’ (p. 363). To answer this question, they highlight projects that ‘try to bulwark autonomy, increase agency, and provoke critical inquiry into new ways of being and doing amid the threats of pervasive datafication’ (p. 376). In a similar vein, the term ‘counter-data’ signals how screen workers resort to alternative insights to increase their sense of agency when encountering data secrecy. These counter-data can include everything from past experience, gut instinct, personal taste, informal networks and streaming lore. Such insights can be employed in more or less systematic ways. The central point is that many screen workers rely on counter-data to respond to datafication from the bottom up.
Screen workers are acutely aware of the way data secrecy permeates the entire streaming machine, from the local offices in Europe all the way back to the headquarters in the United States. This secrecy is more prevalent in a streaming context compared to what workers have experienced in collaborations with ‘traditional’ players like national broadcasters and film institutes. Upon getting the question ‘what data does the streamer share with you?’, most participants respond with a simple ‘nothing’. Many of the interviewed screenwriters, directors and producers experience restricted access to specific forms of streaming data, even when they explicitly request such insights from executives. Later in my conversations with them, however, some of these workers would offer examples of situations where they did access various forms of streaming data. Screen workers’ accounts are rife with ambiguity. This ambivalence is mirrored in their interview drawings. For instance, the producer Alex has drawn the development process as a slide with some ‘spiky, uncomfortable bits’ at the bottom (Figure 1). Commenting on the drawing, Alex says that audience metrics come in twice: ‘First, they dictate which slide you’re getting on – the audience you’re targeting will influence which projects you pursue’. At the same time, audience metrics form at least one of the spikes at the bottom of the slide along with budgetary constraints, commissioners’ opinions and so on. ‘It’s one of the considerations that forces you to compromise on the original idea that excites you’, Alex says. Many workers reiterate this argument and see collaborations with data-driven streamers as a trade-off: You win some, you lose some. Screen workers also disagree about how extensively streamers utilise their data. While some participants claim to have not seen any streaming data whatsoever, a closer look reveals that such insights often linger in the background.

The rollercoaster of screen production (Alex, development producer).
Accessing data
My findings indicate that access to streaming data is stratified by workers’ previous experience, achievements and commissioner relationships. In a way, this is not new: The importance of networks has been raised in much of the literature on creative labour (see e.g. Conor, 2014: 106–107). Who you know inevitably influences what you know. Even so, my study shows that access to audience insights becomes increasingly splintered in the age of streaming. Whether or not the streamer ends up commissioning another project offers the only solid parameter for ‘success’ according to some workers. Several participants recognise that streaming executives have legitimate reasons for keeping this information black-boxed, for instance due to the importance of stock market results. Yet some participants feel the secrecy keeps them in the dark about their worth, giving streamers the upper hand in negotiations of rights and payments. This view echoes the broader industry debates around the relationship between opaque viewership metrics and residual payments mentioned earlier.
Although streamers guard their data carefully, they do disclose snippets of streaming data. Some screen workers have requested metrics in the creative process and received them. One producer, Chris, recalls asking Netflix for guidance on how to address a particular issue relating to the opening credits of a show, adding that ‘there are people analysing this stuff all the time’. The producer was put in touch with an Los Angeles-based expert who provided some metrics and suggestions for ways to solve the problem. However, Chris immediately clarifies that ‘it’s not something they have shoved down my throat’. Like many other workers, this producer accentuates their agency and workplace autonomy, that is ‘the degree of self-determination that individual workers or groups of workers have within a certain work situation’ (Hesmondhalgh and Baker, 2011: 40). This account exemplifies how many screen workers regard their agency and autonomy when it comes to data-driven insights: They are neither required to implement changes nor force-fed data.
Another illuminating example comes from Mattis, a showrunner based in a large European country. Mattis identifies three times ‘data were put together with what we did directly’, namely: the first brief, the kick-off meeting before the first day of shooting and the few performance figures provided by Netflix after the launch. Such performance figures include the number of viewers worldwide approximately 28 days after the launch date, but usually not on a country-by-country basis. In other words, data appear before, while and after a project is underway. Other participants confirm this point and especially highlight the kick-off meeting as a crucial milestone in the process. In this meeting, Netflix executives signal how they view the film or show by breaking down the genre, key elements and similar productions. If the story of a show changes somewhat from season to season, the streamer modifies which taste communities they target accordingly. In these meetings, Netflix executives will also disclose the most popular thumbnails and banners. They specify which pictures have the best click-through rates and how these rates evolve over time. Importantly, access to these meetings and ‘learnings’ depends on the screen worker’s role and how long they have collaborated with the streamer (see also Idiz, 2024: 2138). Showrunners often gain more insight into ‘the Netflix machine’ than others. Being let in on ‘the secret’ functions as a reward after at least a year of hard work, Mattis explains: You’ve been through the Netflix process, the Netflix machine. You managed to deliver as a screenwriter and as a showrunner, and they greet you into the machine by giving you more insight, and a few numbers and stuff like that. They explain to you a little bit more how the service works: How many pages they edit every day. How many taste communities they have, like the clusters for their viewers. How they will position the show and try to make it shine for the audience. (Mattis, showrunner)
Workers who are granted this level of access have to sign an agreement stating that they will not disclose these figures to anyone, sometimes not even to their closest co-creators. Other screen workers are conscious of the fact that they have not been invited to such meetings. For some, the lack of data transparency feels frustrating and disappointing, especially when a project gets cancelled with no explanation. In the words of Sam, a screenwriter who worked on an Amazon show that never got produced: ‘That’s the thing that hurts so much. Because if you knew what was wrong, you could handle it. But you don’t’. Like many of the interviewed workers, this screenwriter believes there are benefits to increasing creators’ access to streaming data, especially because these advanced analyses outperform the ones conducted by public and private TV. However, interacting with streaming data does not always depend on having access to facts and figures. Streaming data make indirect appearances in screen production too, which means that everyone has access to some data.
Sensing data
This type of interaction often appears via conversations with streaming executives. In other words, streaming data often pass through a number of human filters before they reach screen workers. The producer Alex puts it this way: ‘It’s rarely explicit data. We don’t see charts and are not handed figures, but it’s more a sense of each network’s identity and an awareness of sort of targets that those networks need to hit’. These commissioners have a good idea of their audience, ‘because they are seeing all the data’. Several workers maintain that while they rarely see explicit data, they encounter executives who consult data. Many of my participants are fascinated by the granularity and precision of streamers’ use of behavioural data, which they believe trump more ‘old-fashioned’ metrics like ratings data. Despite limited access to the inner workings of the streaming machine, many participants use their experiences to imagine what their data operation looks like, as this account shows: I think what they have is . . . This is of course something I’m imagining. I imagine like a secret closet. [Laughter] These documents pile up with all the series that they have, and they go to the folder of [my production] or whatever. And they of course have a lot of research of what they were expecting. (Simone, showrunner)
Screen workers base such interpretations and theories on actual experiences with streamers. My participants primarily communicate with one or two streaming executives based in Europe, but they also receive comments from executives in the United States. This is the case for both Netflix and Amazon: ‘You always get a filtered version of what the feedback is from America’, the screenwriter Sam explains. This feedback is often referred to as ‘notes’, a process that sees an executive or producer suggesting ways to ‘improve’ the project to screenwriters, producers and directors (Caldwell, 2008: 217). Streamers provide notes throughout the entire process: from the development stage through pre-production, production and post-production. According to my participants, Amazon executives commit less to extensive note-giving overall, whereas Netflix executives are more ‘hands-on’. For full originals, Netflix executives read more drafts than some participants are used to – almost on a weekly basis. Among other things, they provide detailed feedback on scripts, the recruitment of cast and crew and the editing.
Many screen workers refer to feedback from streamers as ‘traditional’ and almost identical to that of other commissioners. For other workers, however, streaming executives’ use of imperative verbs like ‘must’, ‘want’ and ‘need’ signal their data-driven approach. Prior to our conversation, the showrunner Mattis skimmed through the notes from past meetings with Netflix and saw them in a new light: When I replied to your email, I said I had no access at the time to data. And I had no access, but I had access to the thought process, to a whole paradigm that was informed by these kinds of data, or learnings or algorithm compilations. (Mattis, showrunner)
The showrunner places data, learnings and algorithms at the heart of Netflix’s methods and sees them as part of a specific ‘thought process’ and ‘paradigm’. This example demonstrates how workers sometimes detect filtered insights long after the actual interaction took place. However, screen workers also sense streaming data that are more readily available. One screenwriter, Gerry, was not invited to meetings with Netflix after the launch date. This lack of access pushed Gerry to estimate performance a different way: In the time following the show’s release, Gerry would monitor the position of the show on the personalised Netflix homepages of friends and family. In other words, this worker resorted to a kind of reverse-engineering, that is ‘speculative experimentation and playing around with algorithms to figure out how they work’ (Bucher, 2018: 60). As Gerry explains: Without knowing much about the Netflix algorithm, I saw how quickly it disappeared from the Netflix feed. . . . Every time I visited someone, I just had to check on their Netflix: ‘How far down is it now?’ And it was gone! . . . You only have three to four days to see if it engages the audience, and then pssst, it just disappears. It was a bit shocking to see. (Gerry, screenwriter)
In this account, we also see a distinct ‘algorithmic imaginary’ at play (Bucher, 2017). Based on the interaction with ‘the Netflix algorithm’, Gerry infers different things about how Netflix defines success and how it relates to the algorithmic logics of the recommender system. The main takeaway is that competition for audience attention is extremely fierce. Gerry goes on to mention that failing to achieve metric visibility means that executives will turn down another season and lose contact with the writer. Other participants describe the link between performance metrics and commissioning decisions as far less straightforward. According to the screenwriter Sam who collaborated with Amazon, streamers realise that the number of seasons indicates whether or not the show has been a hit. Consequently, they order a second season as a ‘publicity tool’ with the goal of driving subscriptions to their platform: ‘There are a lot of shows with two seasons. I think that’s a quite good indicator that it was working very badly on the platform’. The primary goal of streamers is to grow their pool of subscribers. According to the analysis offered by this writer, streamers play around with various marketing techniques to accomplish this goal. However, they can only rely on this method because they keep their viewing data away from public scrutiny.
These examples illustrate how screen workers draw on a range of tactics and algorithmic imaginaries to navigate collaborations with data-driven streamers. Sensing streaming data requires extensive knowledge of the broader streaming landscape, commissioner strategies and the algorithmic logics that underpin recommender systems. This section has presented individual workers’ observations, but several screen workers have told me how they have set up networks with colleagues to pool experiences and informal data, which represent a form of ‘counter-data’. A number of workers also generate their own quantitative and qualitative data to analyse and connect with audiences.
Generating data
Screen workers use a range of data generation methods themselves, sometimes as a way to circumvent barriers to accessing streaming data. Social media play a particularly important role. Some workers use their own social media campaigns to connect with audiences, create buzz and harvest insights about their target groups. Jo, a director-producer, explains that social media can be used to get funders on board: ‘I use that data to show financiers or broadcasters: Look, we already have this audience. They are waiting. Check out how they are reacting, how they are sharing, what they are saying’. Reach on social media sparked Netflix’s interest in Jo’s project, which suggests that speaking the ‘data language’ pays off. Other screen workers also use such data to verify the relevance and appeal of a project to commissioners. In addition, social media campaigns offer a way to take promotion into one’s own hands. A short clip shared on social media may inspire people to watch an entire episode on the streaming service, which is the ‘conversion’ screen workers strive for. This method can ultimately lift a show to the top of audiences’ streaming homepage, again demonstrating some of the ways screen workers attempt to decode the underlying logics of recommender systems: Which shows do you put [at the] top of your page? And how do you control that? I don’t know. . . . That was one of my reasons I started my own campaign: to get that attention, so I can be [at the] top of that page. So people can start looking at my content, and hopefully I get a new season. (Luca, producer)
In this producer’s view, there is much to gain from fine-tuning content to social media comments. On past productions, they used Facebook to ask for audience feedback: ‘A lot of people liked that we asked them, and we used that information when we wrote a new season’. Modifications might involve tweaking the ‘tone’, adjusting the length of episodes and allocating more screen time to popular characters. As these accounts indicate, social media can be used to generate quantitative data (e.g. likes, views and similar metrics) as well as qualitative data (e.g. audience opinions). Some of the interviewed screen workers especially accentuate the benefits of generating qualitative data, which represent a different take on ‘data-driven screen production’. For instance, the director-producer Blake argues that interviews and observations can help ‘fill up the characters’ and avoid stereotypes in the idea generation process (Figure 2).

Assembling and filling up ideas (Blake, director-producer).
While streamers can track trends in audience behaviour in great detail on a global scale, the qualitative approach outlined here focuses on audience opinions. Several workers find value in these audience opinions, whether they take the form of social media comments, focus group interviews or informal conversations. Being ‘in sync’ with one’s audience is key, especially as streaming competition intensifies. While some screen workers see huge potential in creating content on the audience’s terms, others warn that this can be a slippery slope. This point leads me to the final type of interaction I have identified in my interviews.
Resisting data
As previously mentioned, many screen workers declined my interview request, which signals a resistance that also saturates some of the interviews that did take place. This resistance corresponds to a broader feeling of ambivalence, distrust and anxiety towards audiences that are often rendered distant and mediated (Hesmondhalgh and Baker, 2011: 200–201). Screen production is described as a kind of vocation driven by idealistic goals, and relying on streaming data therefore threatens to corrupt the integrity of a project: ‘I think as an artist, I’m afraid to look at statistics, because I’m afraid that it will sway my honesty’, the writer-director Ollie says and adds: ‘If you make something that just goes against all statistics, but it works, then the statistics will sway because you made that’. On top of this internal opposition to streaming data, some screen workers actively resist data-driven insights when presented with them. One screenwriter recalls discarding an audience survey they received from a regional streamer: For us, it was kind of like: ‘No, that’s not something we want to think about’. It feels like more of a producer’s dream. . . . It’s like if you make music: Would you just write something that you want to talk about in your song, something you want to get off your chest? Or would you go: ‘Okay, so we need more Latin flavour because that’s more popular with kids’? (Elliott, screenwriter)
The writer suggests that there is no formula for a hit because you cannot predict what will strike a chord with audiences. Tweaking content to match audience opinions is seen as the opposite of being creative. Consequently, a number of workers even prefer to be shielded from this kind of information. This sentiment resonates with Navar-Gill’s (2020) study of American TV writers who regard the culture of data secrecy as ‘freeing’ and ‘liberating’, because it eliminates the risk of becoming ‘overly invested in ratings at the expense of storytelling’ (p. 5). In addition, some of my participants argue that audience tastes are constantly in flux. Any kind of data will therefore merely reflect a snapshot of a moment in time, and audience preferences might shift moments after.
For some participants, detecting trends therefore depends less on data and more on a sense of the zeitgeist. That involves predicting where audiences might go next without necessarily consulting data. Relying too much on streaming data risks homogenising content, participants claim. Audiences are only going to say what they want by providing an example of what they know. ‘It’s the Henry Ford quote: Ask the people what they want, and they would have said a faster horse’, as the producer Nicola says. Gut feeling and craft play a fundamental role in how screen workers approach their creative work and, by extension, streaming data. Many screen workers mention these informal insights as a form of ‘counter-data’ that contrast with the big data analytics deployed by streamers. They draw on experience and carefully developed skills and remain sceptical of any ‘quick fixes’ to complex creative problems.
Some of my participants even detect a resistance among streamers themselves, explaining that Netflix executives ‘hate’ any mention of algorithms. As one showrunner points out, these executives stress that people work in this ‘special performance department’ and evaluate the predicted performance of a show. This people-centred rhetoric marks a departure from the way the company previously promoted its use of big data analytics to inform commissioning choices (e.g. Curtin et al., 2014). Karin van Es (2023) calls this a ‘strategic repositioning of Netflix from technology company to entertainment company’, which allows them to be perceived as both ‘data’ and ‘gut’ (p. 656). In other words, we can clearly see how the ‘gut instincts, industry lore, and complicated power plays among creators and gatekeepers’ mentioned by Havens (2014a: 8) persist in a streaming era. Not everything is new, and we should remain sensitive to the ways nascent technologies map onto long-standing industry practices.
Discussion and conclusion
This article has drilled down into different ways European screen workers experience and engage with streaming data, especially those of Netflix. Very few studies analyse the datafication of screen production in depth (e.g. Navar-Gill, 2020), and fewer still do so from a European perspective. My project benefits from mixing ideas and tools from several academic fields, and it therefore offers both an empirical and a theoretical contribution to existing research. By highlighting four types of interactions with streaming data, the article has provided a framework for understanding how screen workers navigate an opaque data environment.
Although streamers hold viewership metrics close to their chest, their data-driven tactics reveal themselves in direct and indirect ways to the screen workers interviewed for this study. Being let in on ‘the secret’ is seen as a reward after at least a year of hard work. Having been through the streaming machine enables some workers to make sense of a paradigm and thought process informed by data. Sensing streaming data therefore requires extensive knowledge of the broader streaming landscape, commissioner strategies and the algorithmic logics of streaming services. At the same time, many screen workers also generate data in qualitative and quantitative forms. These tactics advance their understanding of target audiences and help them speak the ‘data language’ of streamers. Finally, some workers insist that targeting a specific audience crushes their creativity. Sometimes these workers actively resist data to protect their creative vision and avoid formulas. Throughout all these interactions, screen workers rely on what I term ‘counter-data’, which are insights that workers place in opposition to the big data analytics deployed by streamers. The reliance on counter-data indicates how several screen workers respond to datafication from the bottom up.
Taken together, this study invites a more expansive consideration of what counts as ‘data’, both conceptually and empirically. This has important implications for future scholarly and industry analyses of a streaming environment marked by data secrecy and power asymmetries. As shown in the analysis, lack of access to streaming data emerges as a key category of what Burroughs (2019) calls ‘streaming lore’. Screen workers internalise and contribute to this lore, which adds a layer of complexity to their accounts. Attending to the frictions and nuances inherent in their experiences allows us to better grasp how streamers’ data practices and screen production intertwine.
In closing, this article confirms the benefits of anchoring industry-level changes in local experiences ‘on the ground’. At the same time, the pan-European focus constitutes a limitation of my study: While this project portrays a wide array of experiences from several countries, I sacrifice the depth that could be achieved with a narrower focus. Future research could adopt a case study approach, for instance by zooming in on distinct national sectors or even a single company or production. Finally, this article has approached streaming data as ‘a patchwork of insights’, but screen workers’ interactions with individual pieces of this patchwork also warrant closer critical attention in future studies. Barriers to access will likely continue to produce tensions in such studies. Lowering these barriers is crucial if we want to understand the lived realities of screen workers in all their complexity.
Footnotes
Correction (June 2024):
The Data Availability section and grant number in the Funding section have been added to the article since its original publication.
Data availability
The participants of this study did not give written consent for their data to be shared publicly. Due to the confidential nature of the research, supporting data is not available.
Funding
The author(s) disclosed receipt of the following financial support for the research, authorship, and/or publication of this article: This work was supported by the Arts and Humanities Research Council [grant number AH/L503873/1].