
Abstract
This article investigates the changes in the use of traditional and new media by different technology generations. Focusing on the changes in the use of Email, Chat and Social Network Sites by older people, it explores the process by which new media become ‘old’ and reach a saturation point. Collected survey data suggest differences in media use between the three technology generations distinguished in this study: the ‘mechanical’ generation (born in 1938 or before), the ‘household revolution’ generation (born between 1939 and 1948), and the ‘technology spread’ generation (born between 1949 and 1963). This longitudinal and transnational study provides evidence of media saturation, showing that an increase in both the availability of and access to media does not lead to an increase in use, even in older adults who are behind in the adoption of the new media. Finally, the article discusses the findings, arguing for an interplay between individual and structural lag in later life.
Keywords
Introduction
The importance and relevance of understanding the intersection of ageing and media use, both for academia and for society in general, is higher than ever. As the world’s population ages and life expectancy increases, we face a proliferation of technologies and media formats, of new systems of communication that network the population globally. As people age, it may become difficult to keep up with the rapid pace of change in media formats. Investigating the way older people deal with emerging new media is therefore best approached from a longitudinal perspective. In the current research, we investigate changes in the use of traditional and new media on the basis of data from the ageing, communication and technologies (ACT) cross-national longitudinal study, which, to our knowledge, is the only longitudinal and cross-national empirical survey targeting older people (60 years and older) and their use of different media. The study explores the potential displacement of traditional dominant media use by older Internet users by more innovative communication modes.
When investigating changes in media use, researchers have used media displacement theory (Lee and Leung, 2008; Newell et al., 2008; Nimrod, 2019), which suggests that the use of traditional media will decline over time and be replaced by new media, as people have only a limited amount of time to spend using different media formats. The theory envisages either a total displacement (Kim et al., 2020) in which one media format would replace another one (e.g. replacing the use of TV sets to watch television with Internet devices that are able to access TV programmes) or a partial replacement in the functionalities of a medium. The latter case would result in the co-existence of various media formats whereby the traditional media are not necessarily vanquished by the pervasiveness of the new media. Also, there is evidence in the literature for media generations – a cohort effect explaining the differences in the adoption of the new media between generations (see Taipale et al., 2021). Instead of using the media replacement theoretical framework, the present article proposes the concept of ‘technology generations’, introduced by (Sackmann and Winkler, 2013) to explain media changes. In this context, we are not referring to the concept of ‘generations’ from a life course perspective, but instead to groups of birth cohorts with a ‘conjunctive experience with technologies’; these groups used certain media forms during their formative years (Sackmann and Winkler, 2013: 493) and this will mark their media use later in life. We believe that the concept of ‘technology generations’ has the potential to explain stability in media use and a type of saturation effect possibly encountered in the adoption of the newest media formats.
Studies have so far rarely focused on how ageing digital technologies are used by the ageing population, although there are exceptions, such as the studies by Bolin (2016a, 2016b) and Bolin and Westlund (2009). We first discuss the characteristics of older people’s use of new media in the light of the concepts of ‘saturation’, ‘technology generations’, ‘individual lag’ and ‘social-structural lag’, after which, based on data from the ACT longitudinal study, we analyse changes in traditional media use (TV, radio and printed newspapers/magazines) and in the use of new media (digital media). We also investigate the way the different technology generations use a relatively old new medium such as Email compared to their use of Chat and Social Network Sites (SNS). The three media analysed here have a different history: Email was introduced in the 1970s, but only took off in the late 1980s with the emergence of Microsoft email; Chat was launched in the1980s and had achieved widespread use by 2000, especially in the business sector; SNS was introduced in the 1990s, and was being used on a large scale by 2010 – when Facebook was the most popular social media platform.
Note that we refer to older people in the sense used in the ACT longitudinal study, as people aged 60 and above. In the present study, we examine how different traditional and new media are used by the following technology generations: the ‘mechanical’ (people born in 1938 or before), the ‘household revolution’ (people born between 1939 and 1948), and the ‘technology spread’ (people born between 1949 and 1963). The three technology generations have been analysed in previous studies (Ivan et al., 2020; Sackmann and Weymann, 1994; Sackmann and Winkler, 2013).
Our analysis will focus on the changes occurring over a period of 2 years (from 2016 to 2018) in the way the three technology generations used different types of media. We analyse changes in traditional media use (TV, radio and printed newspapers/magazines) and changes in the use of new media (Internet based). We look for support for the idea that some new media are becoming outdated, even for the group qualifying as laggards (Rogers, 2003) – in this case, older Internet users. We are aware of the fact that a 2-year period could limit our ability to generalize the findings. Still, the current study offers supporting evidence for the intertwinement between ‘individual lag’ and ‘social-structural lag’. To explore potential changes in the media use of Internet users belonging to different technology generations, we formulated the following research questions:
RQ1a. How has traditional media use changed over a period of 2 years for the three technology generations: the ‘mechanical’ (born in 1938 or before), the ‘household revolution’ (born between 1939 and 1948) and the ‘technology spread’ (born between 1949 and 1963)?
RQ1b. How has the use of new media changed for the three technology generations?
RQ2. What differences could be observed between the three generations regarding their use of media introduced at an earlier versus a later date in history?
Media saturation
One day, even new technologies get old (Park et al., 2011; Marvin, 1988; Winston, 1998). Media technologies are no exception. In his seminal work Mass Media in the Market Place, which appeared in 1972, McCombs already discusses the fate of existing media when he predicted the end of mass communication:
Many of the current technological barriers to information-seeking and divertissement-seeking should dissolve with the event of new communication media. Video cassettes, cable television and computer home communication centres each promise that a wealth of material now packaged for disparate media will become available in a single media that is receiver-controlled. Prime time can be individually determined. It will depend on the schedule of each individual and when he wishes to use mass communication (p. 60).
This is exactly what has happened. Today, l’histoire se répète as McCombs’ (1972) ‘new’ media have started to age and become outdated: most video cassettes have been replaced, first by digital video disks (DVDs), then Blue Ray and now digital video broadcasting. Although cable television still exists, other options such as satellite TV receivers and digital TV featuring a plethora of receiver-controlled functionalities have become available. Computer home communication now includes, next to the ‘traditional’ personal computer (PC), also laptops, iPads and smartphones. According to Newell et al. (2008), ‘media saturation’, which he viewed as a process dictated by availability and the competition between different types of media (Newell et al., 2008: 133), could explain changes in media use in different segments of the population over an extended period of time. The concept of ‘saturation’ in social sciences has been borrowed from chemistry, where a saturated solution refers to a solution that contains the maximum amount of solute that is capable of being dissolved, thus reaching a saturation point. In media studies, the concept of ‘saturation’ describes situations in which media exposure becomes overwhelming and continuous (Gitlin, 2007). Thus, media saturation is seen as a direct effect of media pervasiveness and the competition between different media formats, which will eventually create exhaustion in the audience. In this way, media saturation is considered to be a natural effect of the variety of media use and media availability. However, other communication domains, for example, the field of persuasive communication, hold to the original meaning of the concept of ‘saturation’ as used in the natural sciences (to refer to a certain point at which a solution is unable to hold any more of a given substance) and define saturation as a process during which certain communication stimuli no longer produce the looked-for effect (see, e.g. Eisend and Tarrahi, 2021). We believe that such an approach is useful for understanding the changes over the time in the media use of different social groups. We follow Newell et al. (2008), who claim that saturation is a suitable concept to describe trends in media consumption and that we should focus more on a meaning of saturation that approaches the way it was originally used in the social sciences. Overexposure to certain media does not necessarily mean increasing media consumption. It might be that certain groups of people reach the saturation point after a while without a significant increase in the media use accompanying the increase in media access and availability.
In our article, we aim to provide insight into the impact of the advancing age of users in different countries and eventual differences related to the use of older and younger new media applications, during their life course. Before we present the results of our longitudinal and cross-national study, we examine the role of so-called ‘technology generations’ (Ivan et al., 2020; Sackmann and Weymann, 1994; Sackmann and Winkler, 2013), ‘individual lag’ and ‘social-structural lag’.
Technology generations
Following the seminal work of Riley and Riley (1994), Lawton (1998) makes a distinction between ‘individual lag’ (people not being able to cope with the changes in their environment; e.g. not being able to use new technologies) and ‘social-structural lag’ (e.g. complex technological advances assuming information-processing capacity). Although there are exceptions, such as in the case of e-bikes use where older adults became early adopters (Peine et al., 2017), older adults are among those that may be affected by individual lag (De Waal and Schoenbach, 2010; LaRose, 2010; Nimrod, 2019) as they are often later in adopting new (technological) products (see Rogers, 2003, for the distinction between early adopters and laggards – a term which introduced a stereotypical vision on how we treat older people in relation with technology adoption). The reasons behind their slow adoption or non-adoption of new media technologies are more complex and the use of such terms as ‘laggards’ does not capture the complexity of the phenomena. The current literature offers various explanations for the occurrence of ‘individual lag’ – including, for example, a lack of interest, perceived need and utility, available support and previous experience, as well as physical and cognitive decline related to ageing (see Ma et al., 2021, for a meta-analysis). Another point to consider is that older people are rarely involved in the design of new media devices; as a result, these are generally not very age-friendly to use (see Fischer et al., 2020).
A possible explanation, which takes both individual and structural factors into consideration, is provided by the concept of ‘technology generations’: ‘groups of birth cohorts whose conjunctive experience with technology is differentiated by social change’ (Sackmann and Winkler, 2013: 493). Ivan et al. (2020) reviewed empirical studies in this field and provided evidence for the ‘technology generations’ concept using a longitudinal study on older people’s media use in seven countries: Austria, Canada, Denmark, Israel, the Netherlands, Spain and Romania (see also Ivan et al., 2020). Ivan et al. (2020) argued in favour of a nuanced view in testing for a generational effect on media use, taking into account contextual factors (e.g., media history in different countries).
Throughout their life course, users come into contact with new media formats and new applications. However, the media that people learn to use during their formative years are what stay with them the rest of their lives. Van de Goor and Becker (2001) point out how important this so-called ‘formative period’ in life is, in most of the publications about the formative period, the apex of that period is situated at about the age of seventeen and its end at about the age of twenty-five [ . . . ]. As there is considerable country and cultural variations about the age younger people get social independence, the concept of <<formative years>> could be generally understood as the time period marked by the passage from adolescence and early adulthood. (p. 136)
Although we are never too old to learn how to use new media (Loos, 2010, 2012; Van de Goor and Becker, 2001: 137), not having experienced the introduction of new media during the formative period could impact later media use to a certain extent and result in the avoidance or lesser use of a medium with new functionalities. Apart from the difficulties associated with learning how to use new media formats, combined with an unwillingness both to spend money on a new media technology if the old one still works and to abandon old media habits (LaRose, 2010), feelings of nostalgia could explain why even older people who are capable of using a new media format decide not to do so (Bolin, 2016b: 250): One component in the generational experience strongly related to media is the intimate and often passionate relation that is developed towards media technologies and content from one’s formative youth period: musical genres and stars, as well as reproduction technologies such as the vinyl record, music cassette tapes, comics and other now dead media forms.
In other words, when it comes to adopting new media, older people often need more time to accept and use new technologies (De Waal and Schoenbach, 2010; LaRose, 2010; Nimrod, 2019).The percentages presented in Table 1 are an example of the slower pace at which older people have become Internet users compared to younger people, in the European Union area.
Percentage of young and old people with Internet access in 2010 compared with 2019, in the EU28 area (Eurostat, 2021).
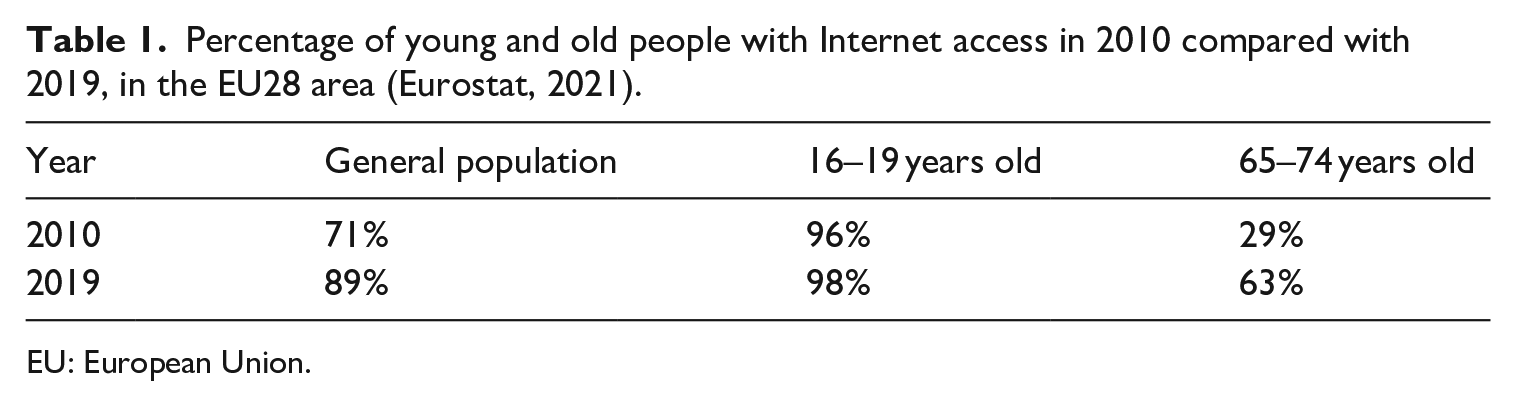
EU: European Union.
The concept of ‘technology generations’ was introduced by Sackmann and Winkler (2013). They explained it as follows: Fast technological change, especially a change of basic technology, enlarges inter-cohort differences and raises the likelihood of a conscious perception and description of differences as generational difference. By their contemporary technological actions, people reproduce or dissolve technology generations technological practice = doing and undoing generation. The likelihood of the adoption of an innovative technological practice in later adult life (‘undoing generation’) is higher if the expected remaining years of active life increase (for instance, by postponing retirement). (p. 493)
We refer here to Ivan et al. (2020) for a review of the studies in this field providing empirical evidence for the existence of technology generations. Still, we agree with Sackmann and Winkler (2013) that ‘they are not deterministic and that not all older people in a specific technological generation necessarily have the same characteristics. Generational differences in technological practice are probabilistic relations’ (p. 16).
Finally, we should note that even if a person was not exposed to a specific new media technology during her or his formative period, compensation is eventually possible by learning to use this media at a later age (Loos, 2010, 2012). Enhanced user friendliness (e.g. the iPad) can also help its acceptance and use. This means that ‘after the innovation phase, intra-cohort development leads to a decrease in the distinctions between generations’ (Sackmann, 1996: 306).
Intertwinement between individual lag and social-structural lag
We could explore the differences in older people’s use of relatively old media – such as TV, radio and printed newspapers/magazines – and that of relatively new Internet-based media, such as Email, Chat and SNS, using a cross-sectional approach. It is much more interesting, though, to investigate the changes in media use by older people over the course of a period of time. On the one hand, people might still be able to master a new media format later in life despite not having learned to use this in their formative period. On the other hand, age-related cognitive decline (view and hearing, see Cutler et al., 2021; Loos and Romano Bergstrom, 2014) could lead to the avoidance or reduced use of new media. We would specifically like to gain insight into changes (1) in traditional media use and (2) in the use of new media formats, by the three technology generations over the course of time. It is also important to underline that we do not suggest that there is a dichotomy between users and non-users, respectively, often called digital natives and digital immigrants (Prensky, 2001a, 2001b), see Bennet et al. (2008) for a critical review.
To understand the interplay between age and time, we make use of the seminal work of Riley and Riley (1994), who explain that there are two dynamisms at work: these dynamisms are schematized roughly in Figure I-I [numbered Figure 1 in our paper], which is a social space bounded on its vertical axis by years of age; an on its horizontal axis by dates that index the course of history, past and future. Within this space, two sets of bars, vertical and diagonal, are continually crisscrossing each other. These bars refer respectively to our dual focus on changes in age-related structures and in people’s lives. (p. 19)
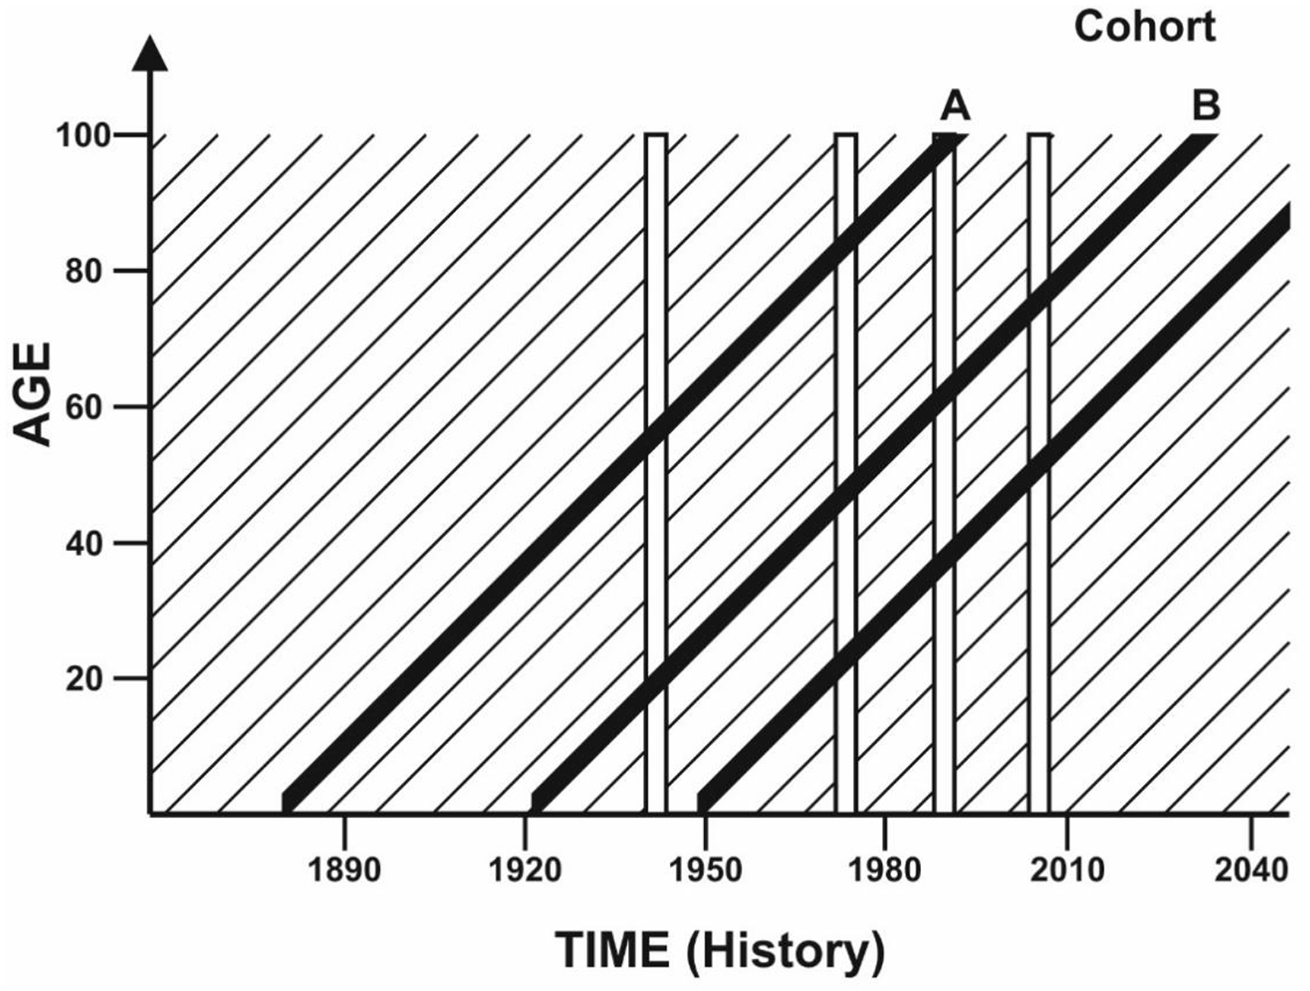
Changing lives and structural change (Riley and Riley, 1994: 19).
Lawton (1998) applied the insights developed by Riley and Riley (1994) to technology use from a gerontechnological perspective to make a distinction between ‘individual lag’ (people not being able to cope with the changes in their environment; e.g. not being able to use a new technological device) and ‘social-structural lag’ (e.g. complex technological advances assuming information-processing capacity – see also Peine and Neven, 2011 – who revisited the concept). We agree with Peine and Neven (2011) that ‘gerontechnology should address both individual and social-structural lag’ (p. 137). Therefore, in this article, we examine the intertwinement between ‘individual lag’ and ‘social-structural lag’ in a group of older people in which all three technology generations are represented. To that end, we assess their use of both old and new media over a 2-year period of time (2016–2018). An increasing use of new media could indicate a diminishing individual lag related to a diminishing social-cultural lag: better digital infrastructure, cheaper uses of some technologies, for example, a smartphone and a perceived accessibility of certain devices (e.g. tablet).
Method
We based our analysis on data collected by the ACT longitudinal study on older people’s media use (Loos et al., 2019), in which the authors of the current manuscript took part and were involved in the data collection process and analysis in Canada, the Netherlands and Romania. The ACT study gathered panel data in three waves (2016, 2018 and 2021). It involved teams from (Austria, Canada, Denmark, Finland, Israel, the Netherlands, Romania and Spain). The aim of the project was to explore possible processes of displacement of traditional dominant media by innovative communication practices among older people. Here, we analyse data from Wave 1 and Wave 2 (from 2016 to 2018) and we limit our analysis to the six countries participating in both waves: Austria, Canada, Israel, the Netherlands, Romania and Spain. The focus is on media changes within the three technology generations: the ‘mechanical’ (born in 1938 or before), the ‘household revolution’ (born between 1939 and 1948), and the ‘technology spread’ generation (born between 1949 and 1963). We used the labels for these technology generations suggested by Sackmann and Weymann (1994: 21–23, 41–43; Sackmann and Winkler, 2013), who based their original study on qualitative interviews, group discussion, surveys and secondary data that they conducted in Western and Eastern Germany in the early 1990s. An important observation from the qualitative interviews was that those born in 1938 or before described how the new technologies of their time – mechanical devices – made manual work less arduous (this group is therefore labelled the ‘mechanical generation’), while those born between 1939 and 1948 praised the support in daily life provided by the various newly introduced household devices, such as the washing machine (this group is therefore labelled the ‘household generation’). For those born between 1949 and 1963, the increasing availability of helpful technological devices that made daily life easier was most significant. This group has therefore been labelled the ‘technology spread generation’ (personal communication with Sackmann, 21 October 2021).
The data collection was performed by local companies, with online surveys being used in all countries, except Romania. There, the survey was conducted using Computer-Assisted Telephone Interviews (CATI), as the percentage of Internet users among older people in Romania was estimated to be below 20 (in 2016 – when the initial wave started). Quota samples (using age and gender quotas) were created in each of the six countries with the aim of producing samples representative of the country’s online older population. In 2016, in Wave 1, the overall sample was N = 10527 (N = 9812 without Denmark – a country which did not participate in the second wave). In 2018, in Wave 2, the overall sample was N = 7940 (N = 6420 without Finland, which did not participate in the first wave). The sample in the second wave was smaller (as some participants from the initial sample could not be found or withdrew from the survey for personal reasons). A separate discussion on the drop-out rates could be found in Ivan et al. (2020).
Participants’ ages ranged from 60 to 101, with a mean of 67.5 years (SD = 6.07), of whom 52% were men; 57% of the participants had attained a higher education qualification or university degree; 45% reported having an income that was higher than the average in their country, while 15% said their income was lower than average. Retirees were of 72% and 13.3% worked fulltime.
Data analysis
The SPSS v24 software package was used to analyse the data: Chi-square analysis for differences in distribution and crosstabs in the case of interaction between the variables. These analyses were applied to the data in Table 2. Two-way analysis of variance (ANOVA) for repeated measures were used to compare results between countries, technology generations and waves. In addition, two indexes that had been created in a previous analysis (see Ivan et al., 2020) were used to investigate the preferences for media use among the members of the three technology generations:
and
Descriptive statistics of technology generations, countries and socio-demographics (Wave 2, 2018).
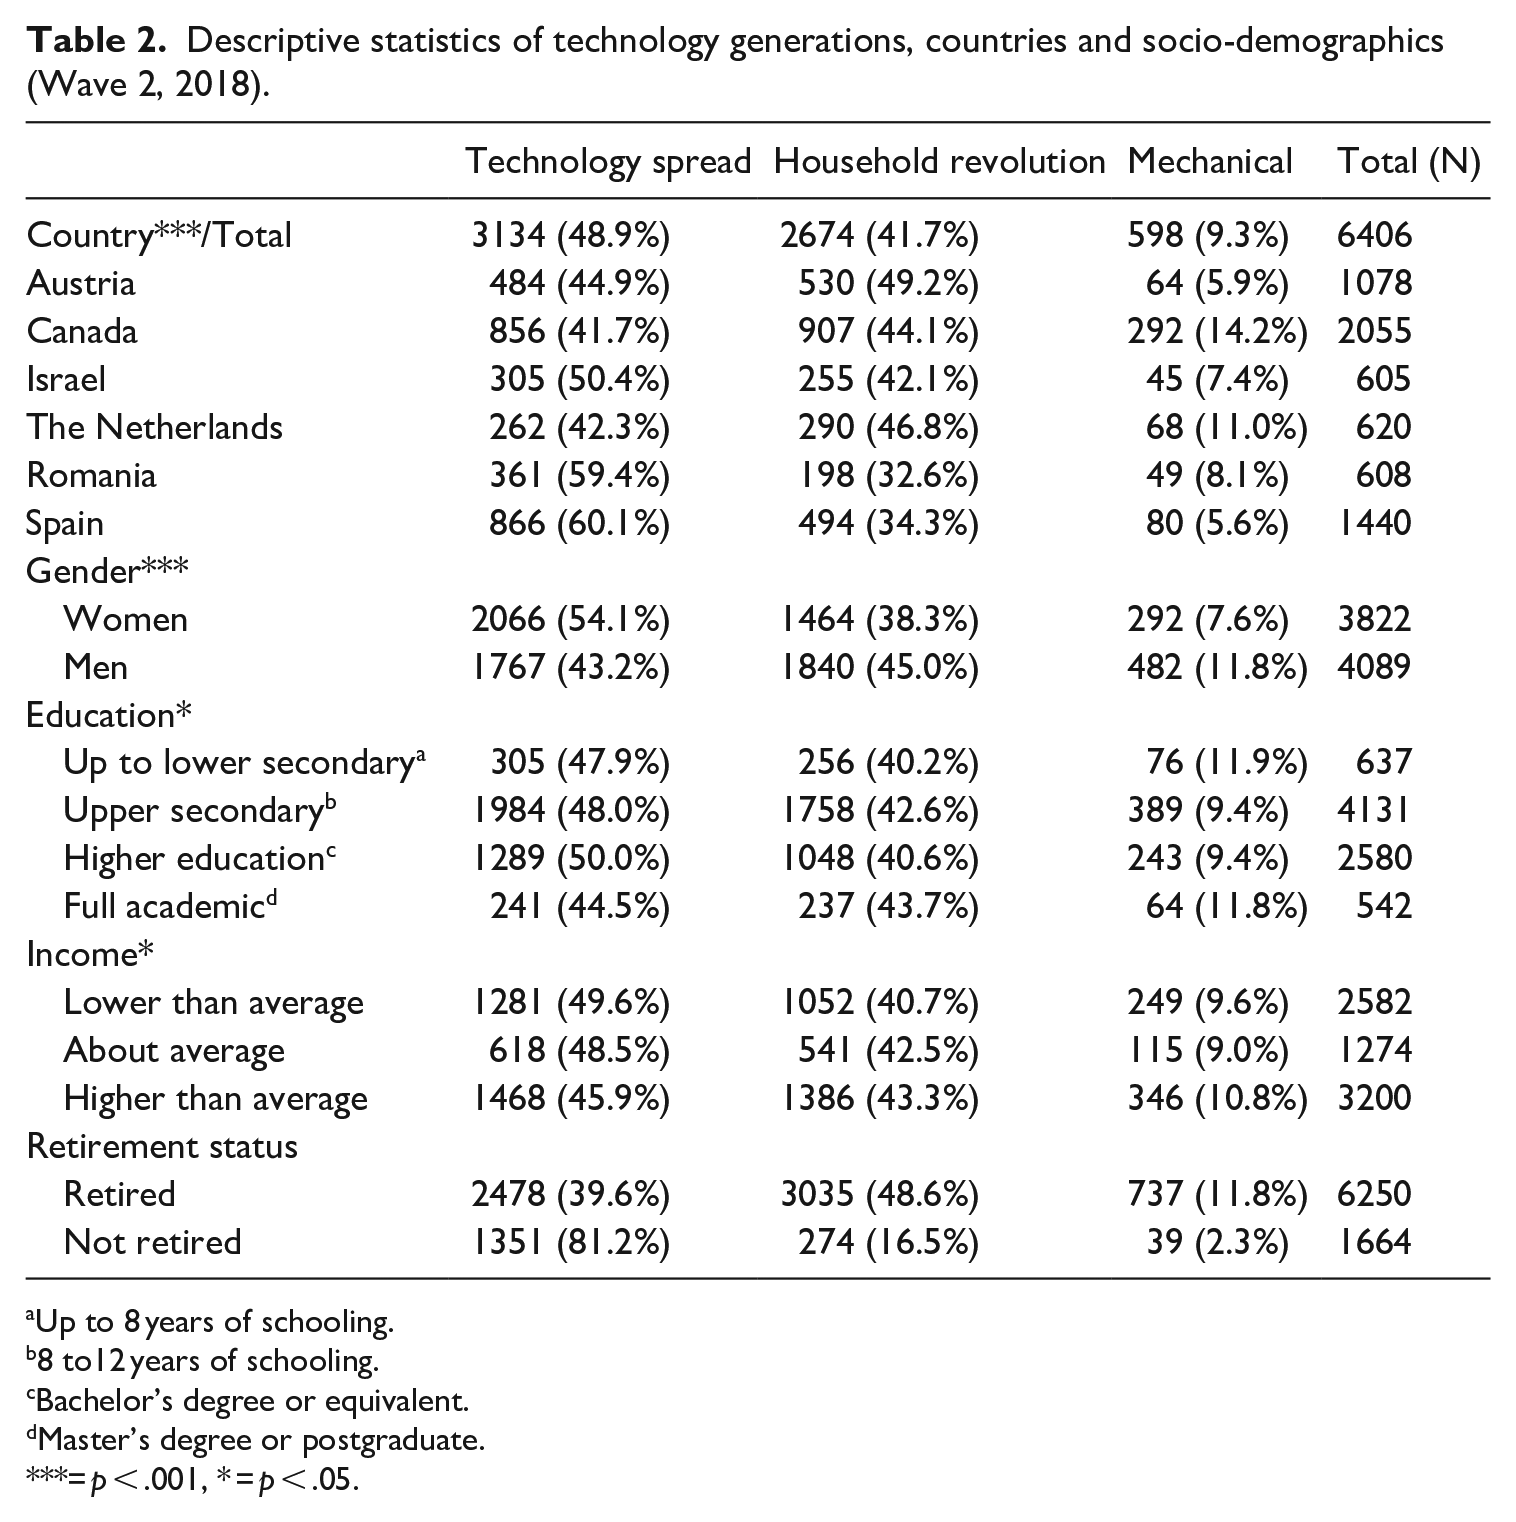
Up to 8 years of schooling.
8 to12 years of schooling.
Bachelor’s degree or equivalent.
Master’s degree or postgraduate.
= p < .001, * = p < .05.
The indexes are reported as the mean of minutes, using participants’ self-reports. Note that participants were asked to log their media use from the previous day and that minutes spent on different media formats were used to calculate the two indexes. We checked the normality distribution in the data set for the two indexes and removed the outliers (people reporting more than 17 hours media use per day were removed to reduce data bias). Also, the indexes were transformed using square root transformation to get a better distribution. Although Levene’s test is not respected, we can assume that performing two-way ANOVAs are robust enough. Repeated measures of two-way ANOVAs were used to reveal the differences between countries, technology generations and waves, in the use of traditional and new media.
Results
Descriptive statistics and differences between countries and technology generations
Table 2 presents the descriptive statistics of the three technology generations for the longitudinal sample analysed here: participants who were part of the study in both waves (N = 6406, after removing the outliers). We then discuss the socio-demographics differences between the two waves (see also Ivan et al., 2020) – where we analysed the data for the first wave of the longitudinal study).
When taking all countries into consideration, the current sample shows significant differences between the distribution of participants among the three technology generations (χ² (2) = 1709.75, p < .001), with the majority belonging to the ‘technology spread’ generation and only a few to the ‘mechanical’ generation. These results are similar to those of the first wave, barring a slight difference in proportion between the number of participants in the ‘technology spread’ generation versus the ‘household revolution’ generation. In the second wave, the difference in the sample seems less salient
In this sample, the distribution of participants is significantly affected by gender and its association with the three technology generations (χ² (2) = 103.86, p < .001, φ = .115). More specifically, overall, there are more men than women; and the women are mainly distributed in the ‘technology spread’ generation, whereas men are more heavily represented in the two older technology generations. Regarding the level of educational attainment, while there is a significant difference in the distribution of participants among all levels of education (χ² (3) = 4485.02, p < .001), the difference is far smaller when taking only the technology generations into considerations (χ² (6) = 13. 07, p = .042, p < .05, φ = .041). In addition, while income categories significantly affect the distribution of participants (χ² (2) = 822.32, p < .001), the impact of income is far less significant when looking only at the technology generations (χ² (2) = 10.24, p = .037, p < .05, φ = .038). These results indicate an uneven distribution of participants reporting higher-than-average incomes within the technology generations, with significantly fewer participants with higher-than-average incomes being found in the ‘mechanical technology’ generation.
When all technology generations are considered, there is a significant difference in employment status, with a higher number of participants being retired than employed (χ² (1) = 2657.49, p < .001). When differentiating between generations, the difference remains significant (χ² (2) = 912.09, p < .001, φ = .339), with more participants being retired in the ‘household revolution’ generation and more employed participants in the ‘technology spread’ generation.
Changes in media use between the three technology generations and country differences
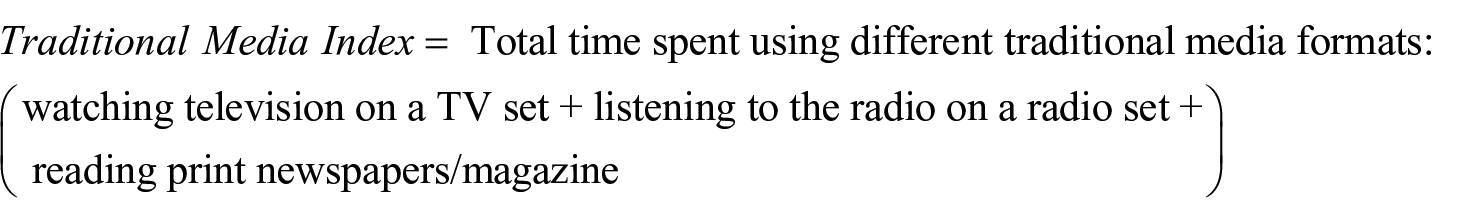
Using the Traditional Media Index described above, we investigated the differences between Wave 1 and Wave 2 on total time spent using different traditional media by the three technology generations and between countries.
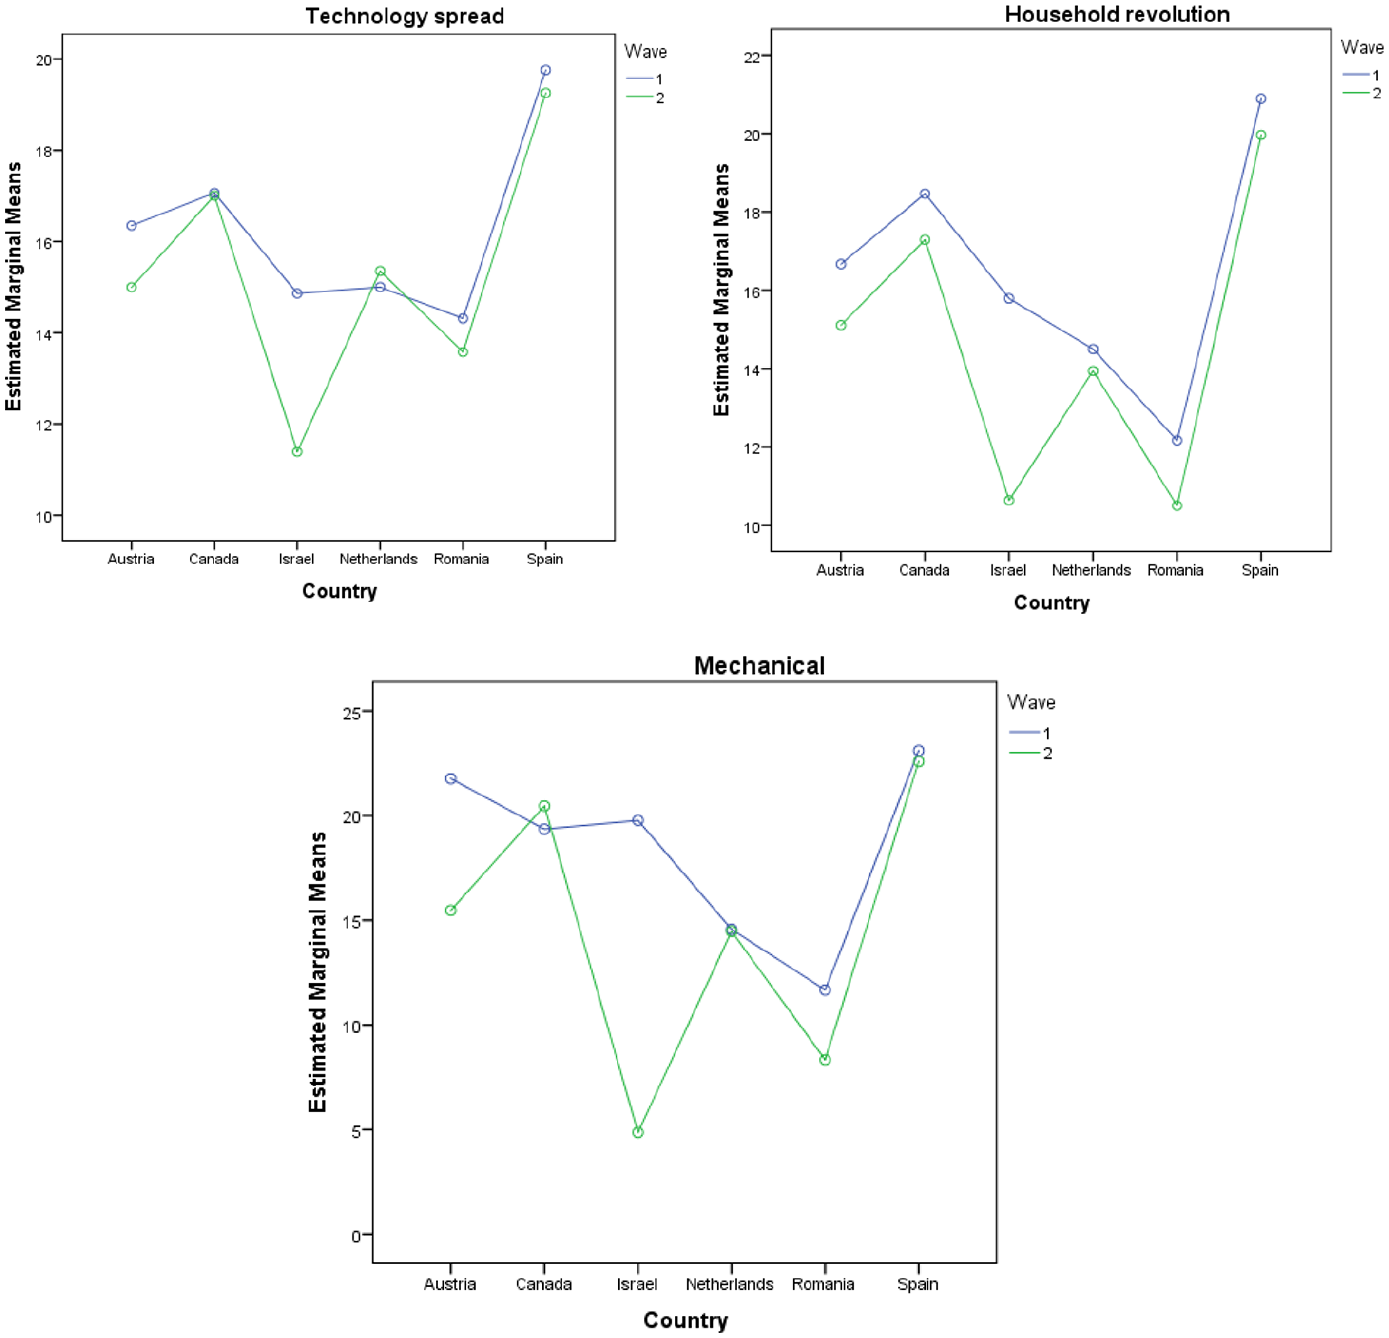
For Wave 1: There is a significant interaction between countries and technology generations (F (10) = 1.87, p = .045, p < .05, η² = .003), but the effect size is small. Post hoc Tukey’s Honest Significant Difference (HSD) indicates more use of traditional media in the ‘household revolution’ and ‘mechanical’ generations compared to the ‘technology spread’ generation. However, this effect depends on the country and is, for example, not seen in Austria. The mechanical generation from Austria spent less time using traditional media, compared with this generation in other countries (Figure 2).
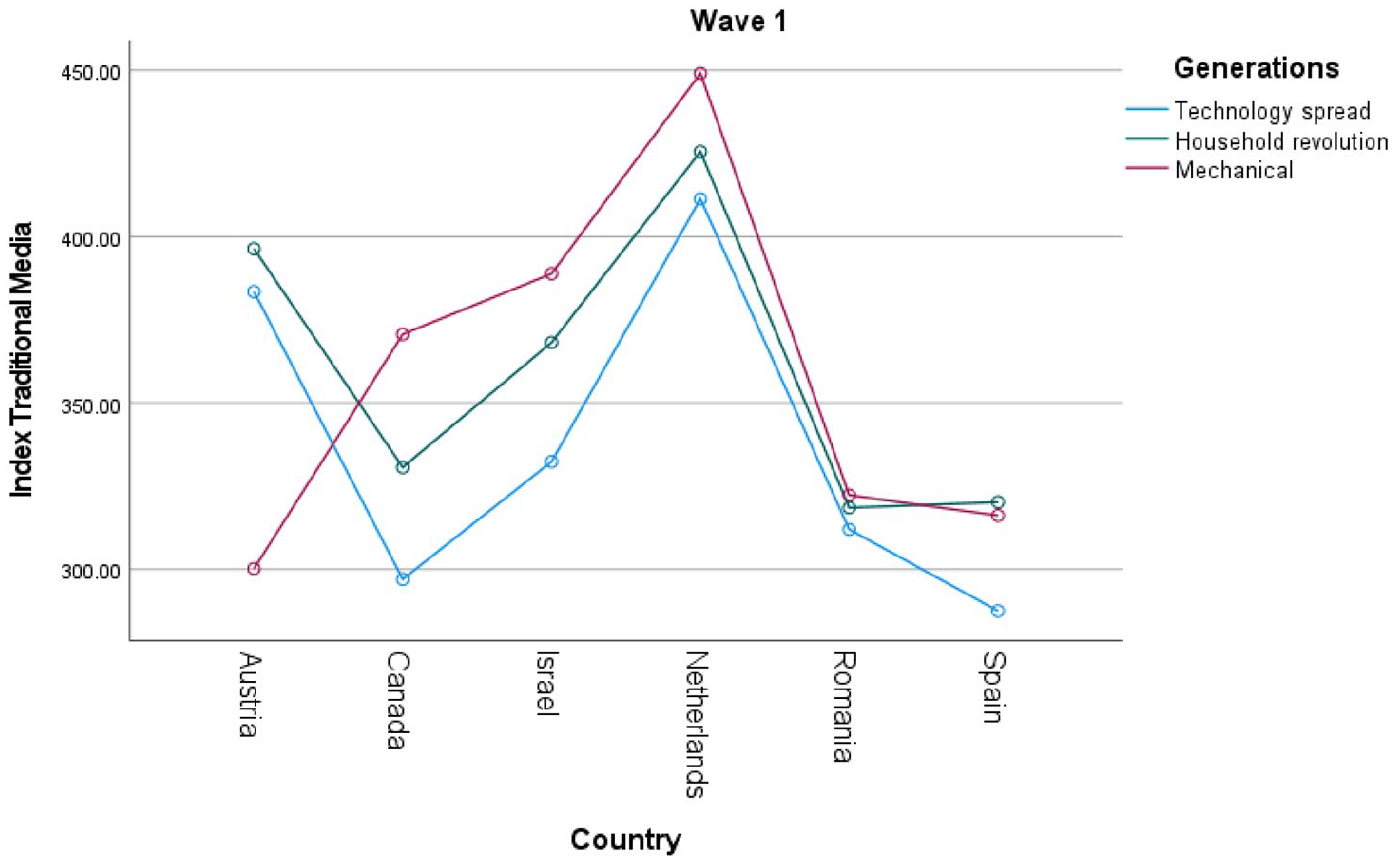
Traditional Media Index, differences between technology generations and countries, Wave 1 (N = 6406).
For Wave 2: There is a significant interaction between countries and technology generations (F (10) = 1.91, p = .039, p < .05, η² = .003), but the effect size is small. Just as in Wave 1, post hoc Tukey’s HSD indicates a greater use of traditional media in the ‘household revolution’ and ‘mechanical’ generations compared to the ‘technology spread’ generation. However, this effect depends on the country, and this time was not found for Israel. It should be noted, however, that Israel had a particularly high number of outliers in the ‘mechanical’ generation that were removed for the analyses (Figure 3).
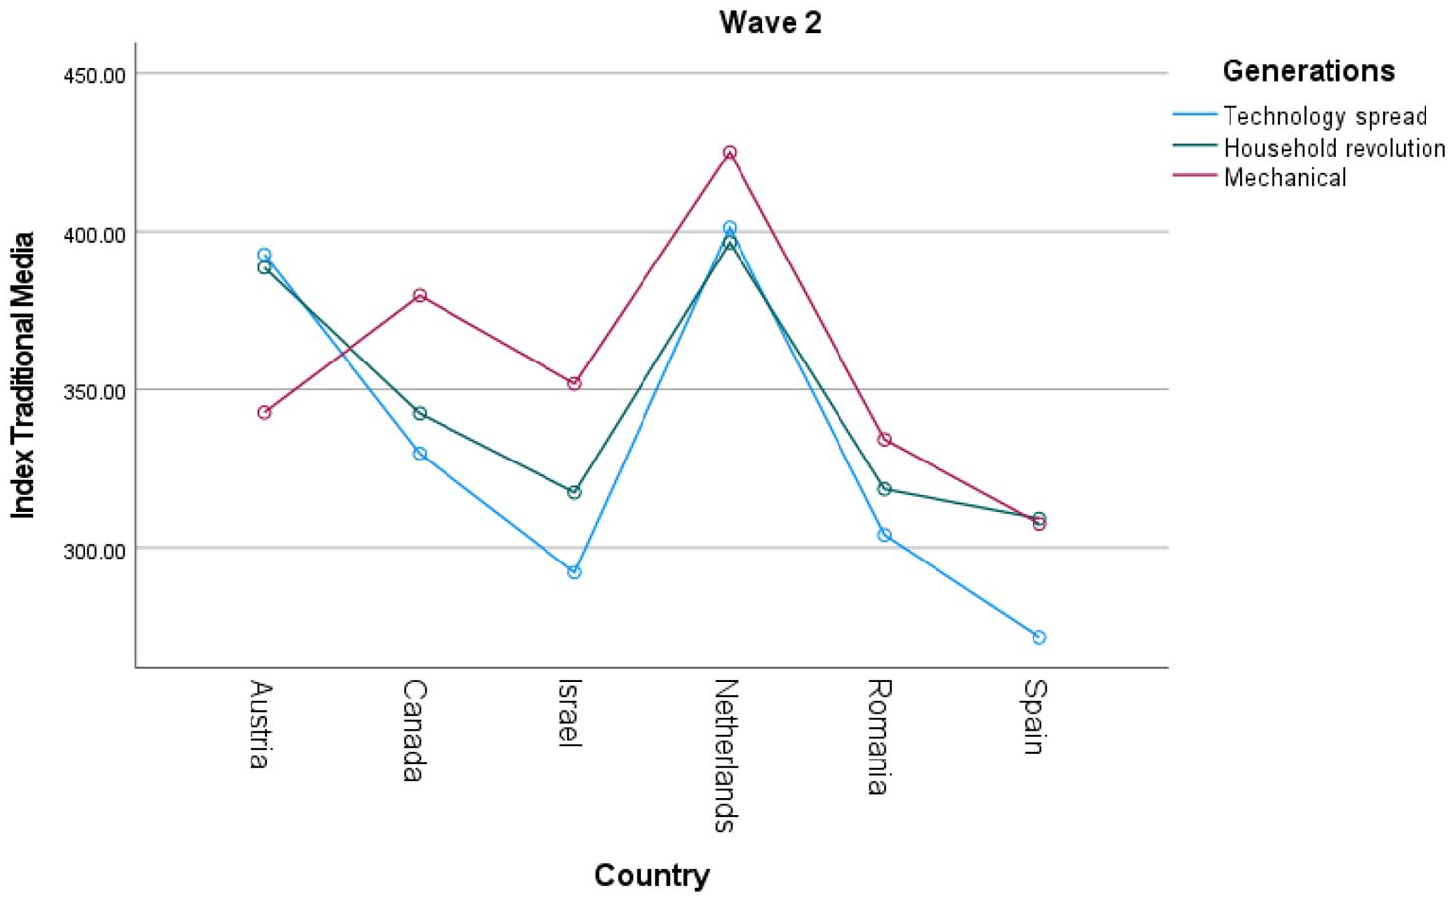
Traditional Media Index, differences between technology generations and countries, Wave 2 (N = 6406).
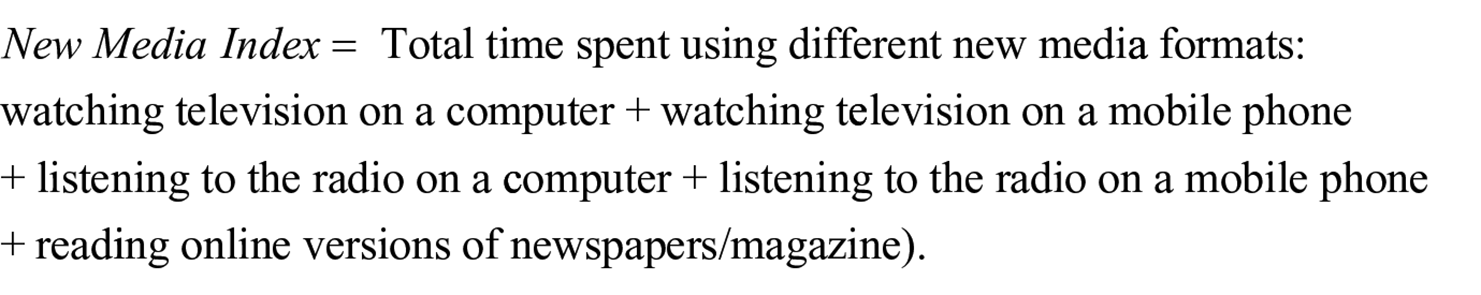
Similarly, using the New Media Index described above, we investigated the differences between Wave 1 and Wave 2 on total time spent using different new media by the three technology generations and between countries.
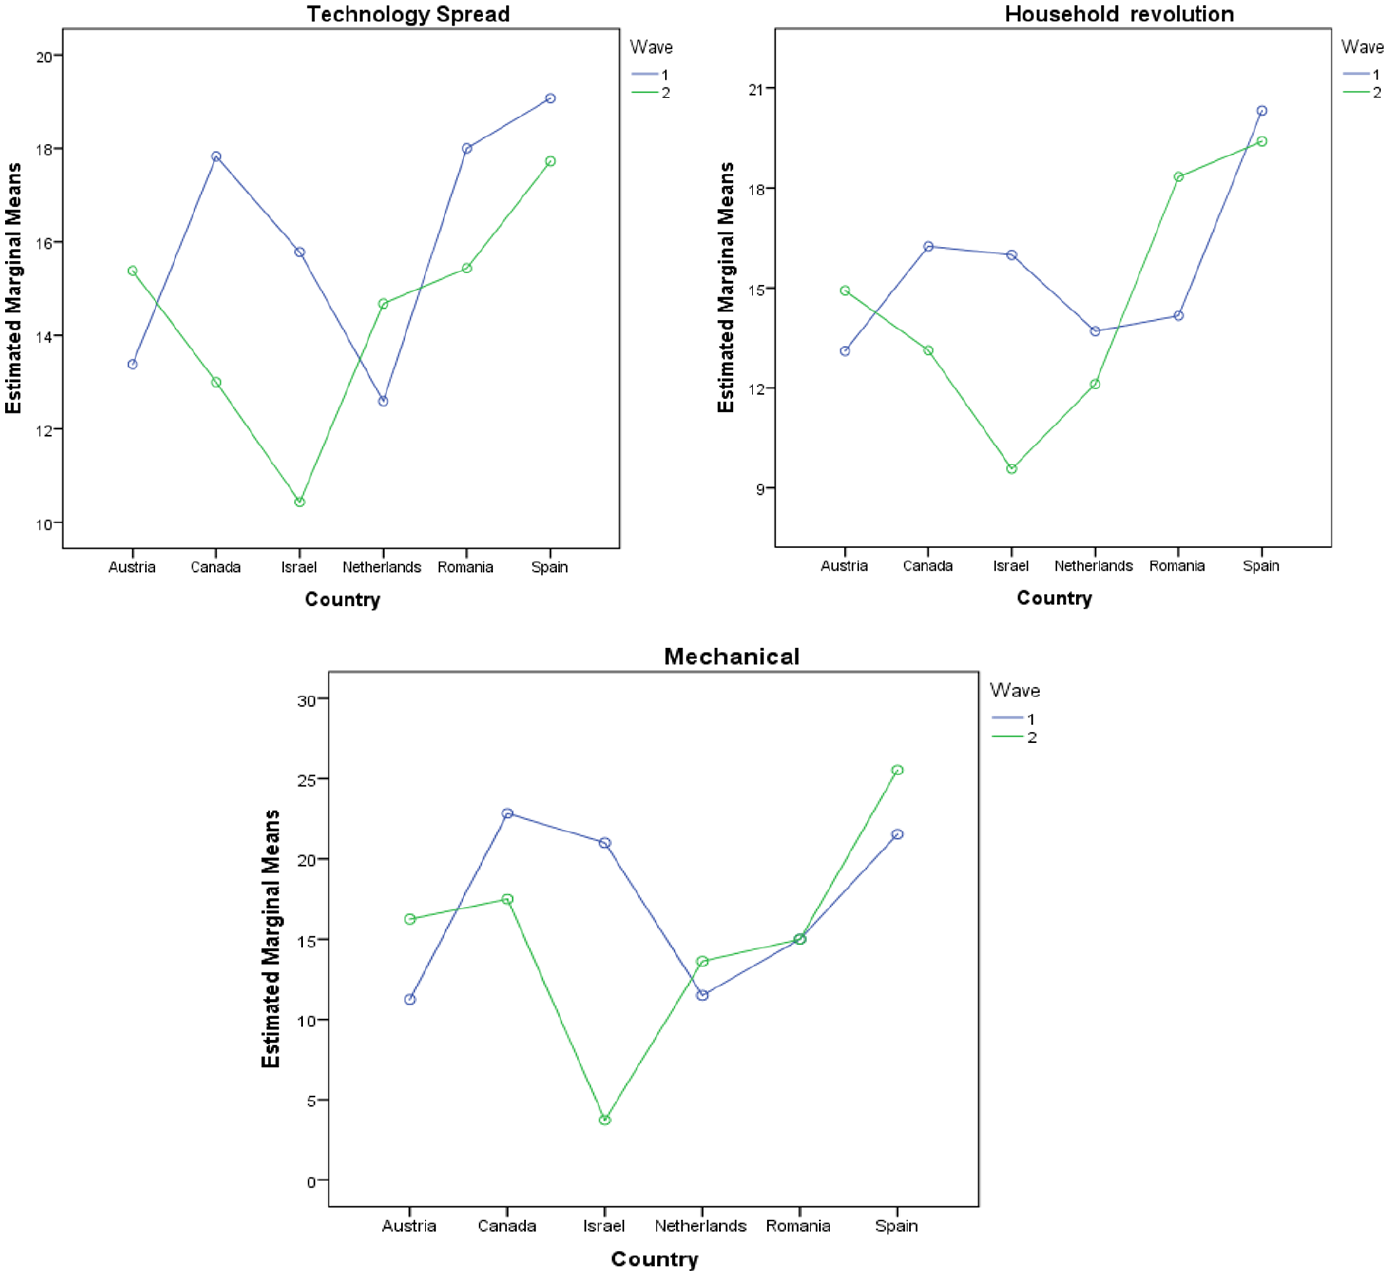
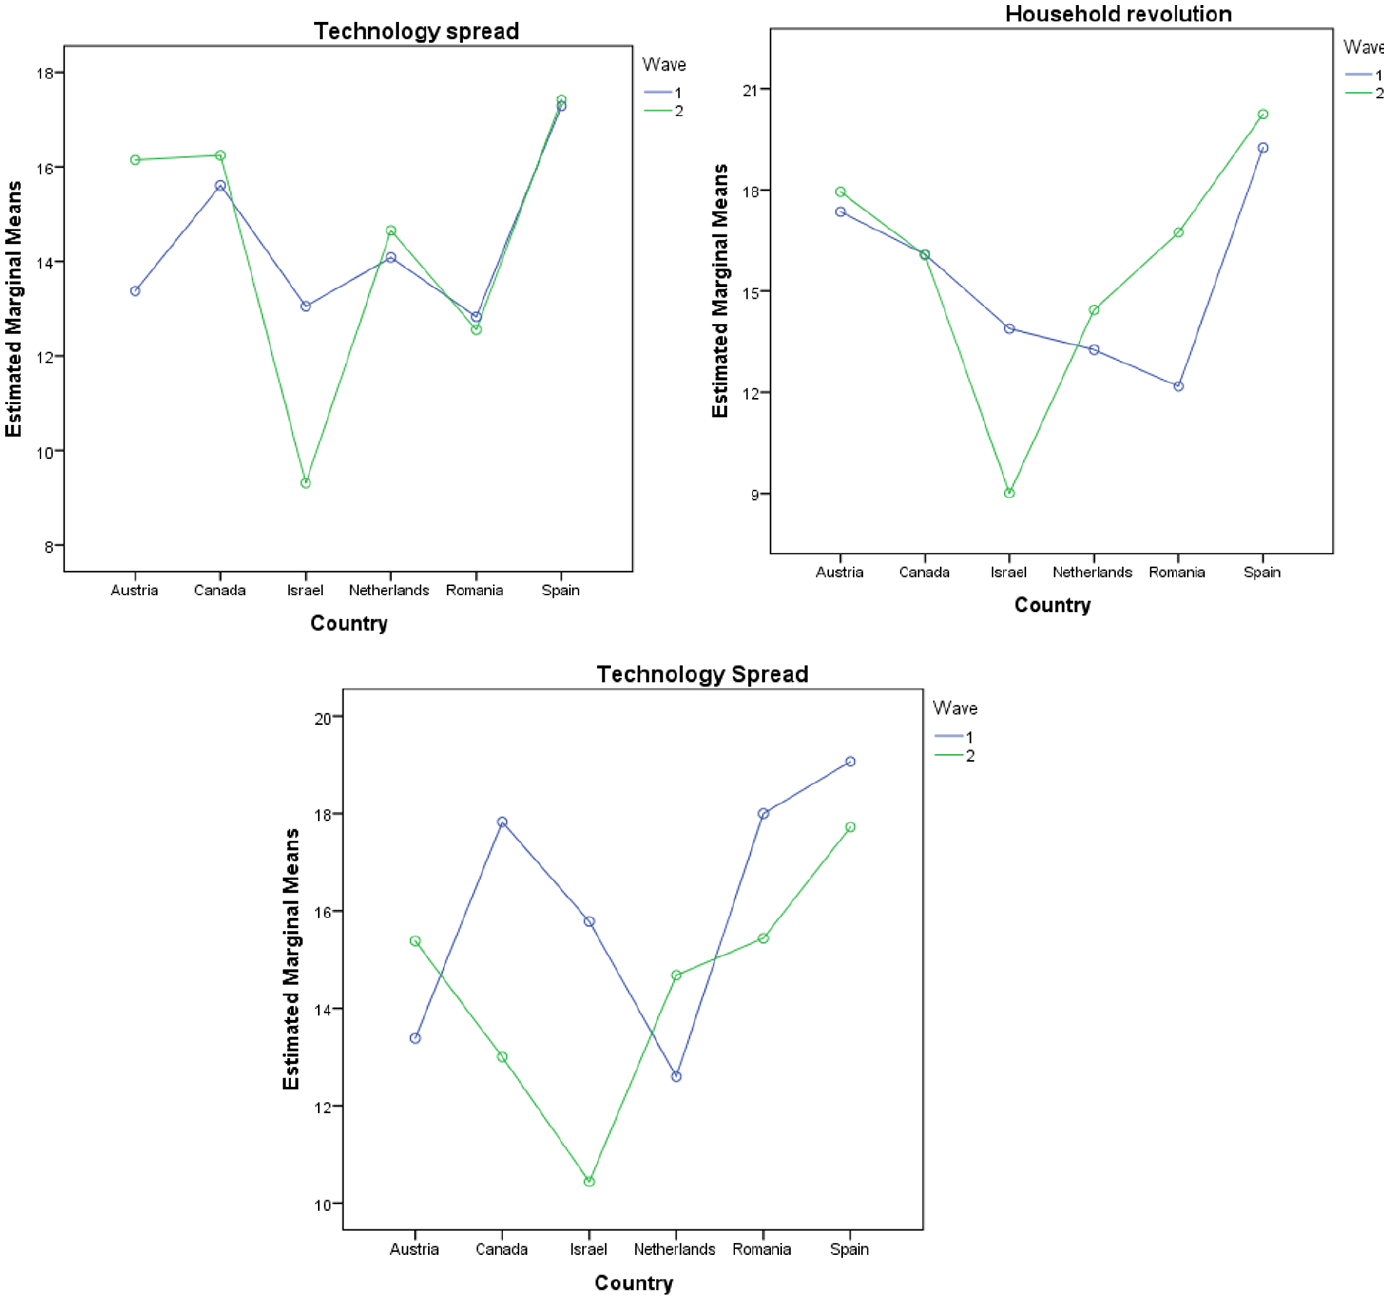
For Wave 1: There was no significant interaction between countries and technology generations (p = .755) and no main effect of the generation (p = .551). However, there was a main effect of the country, but once again, with a small effect size (F (5) = 3.77, p = .002, p < .01, η² = .005). Post hoc Tukey’s HSD showed similarities between the Netherlands, Romania, Canada and Austria, while Spain reported results that were closer to those of Israel (Figure 4)
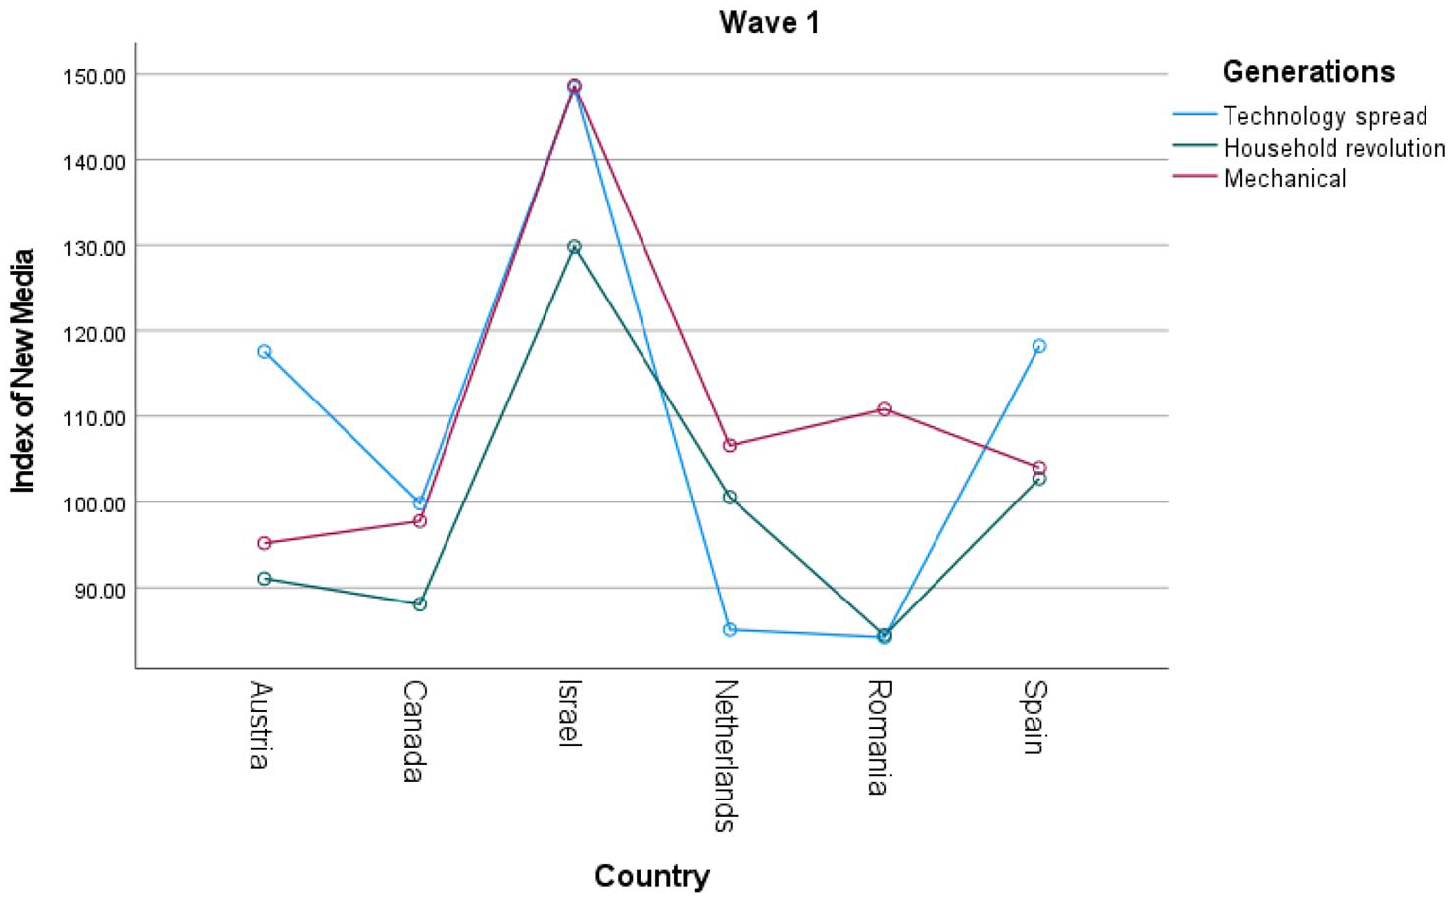
New Media Index, differences between technology generations and countries, Wave 1 (N = 6406).
For Wave 2: The results of the two-way ANOVA are very similar to those of Wave 1 with significant interaction between countries and technology generations (p = .158), no main effect of generation (p = .925) and a main effect of the country with a higher effect size (F (5) = 7.15, p < .001, η² = .010). Post hoc Tukey’s HSD showed similarities between the Netherlands and Romania, while Canada was closer to Austria and Spain. Israel seems different to the other countries, exhibiting a higher use of new media (Figure 5).
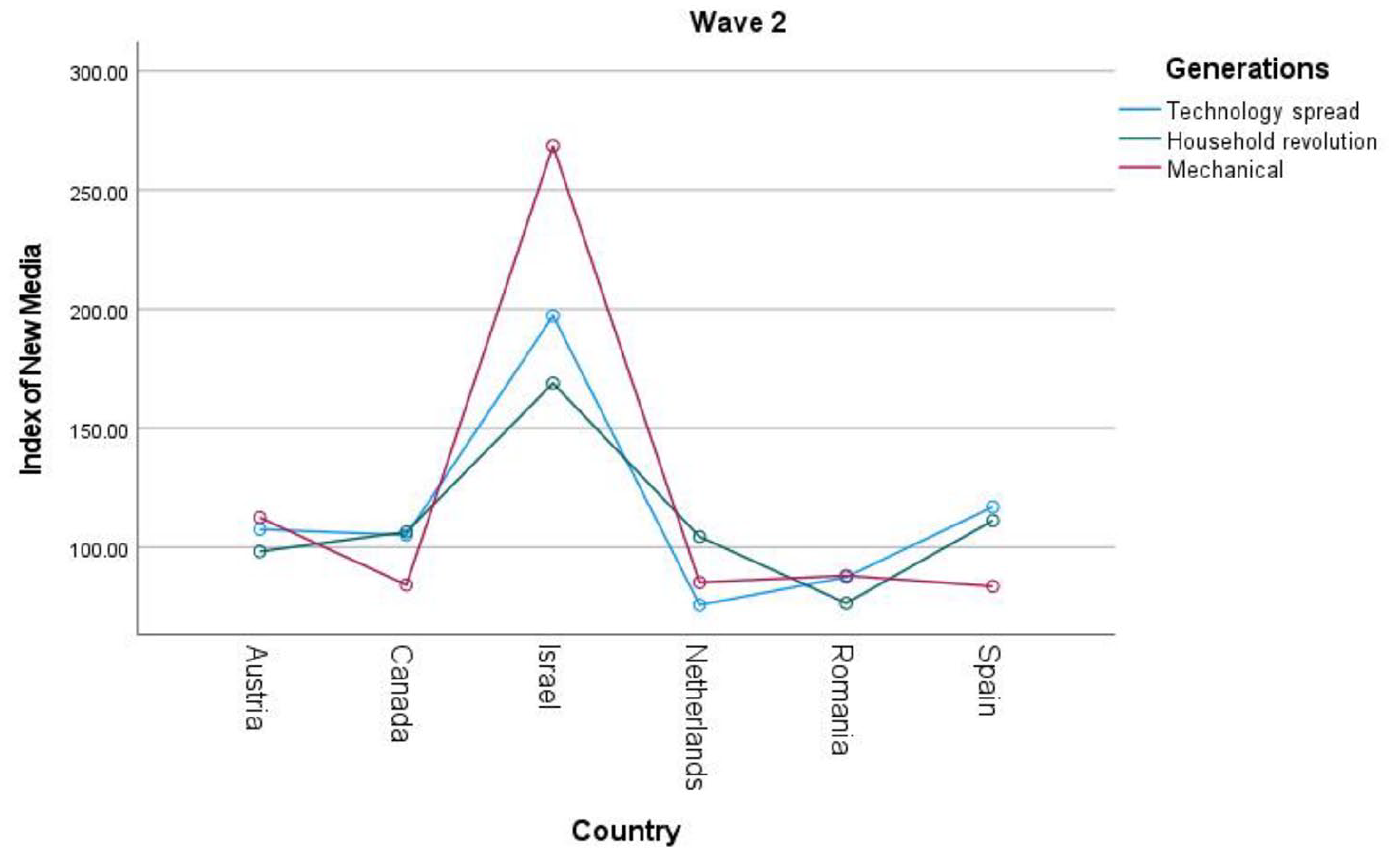
New Media Index, differences between technology generations and countries, Wave 2 (N = 6406).
Changes of media use between the two waves
Traditional Media Index: We tested the changes over a period of 2 years in traditional media use between the three technology generations (RQ1a). Repeated measures ANOVA, using the Greenhouse-Geiser correction since sphericity was not assumed, failed to reveal an interaction between the waves, the country and the technology generations. The only significant interaction was between countries and waves with a small effect (F (5) = 22.60, p < .001, η² = .019), indicating a change in the use of traditional media between waves depending on the country. Within-subjects effects revealed a small effect of the technology generations (F (2) = 6.46, p = .002, p < .01, η² = .002) and the countries (F (5) = 22.09, p < .001, η² = .019). Post hoc Tukey’s HSD test revealed similarities across the waves between Spain, Romania and Israel. Austria was more similar to the Netherlands and Canada was different from all the others, showing a significant increase in traditional media use in all three generations. Regarding technology generations, they were all different from one another, with the mechanical generation showing a more diverse pattern of traditional media use from Wave 1 to Wave 2, compared with the other two generations (see Figure 6).
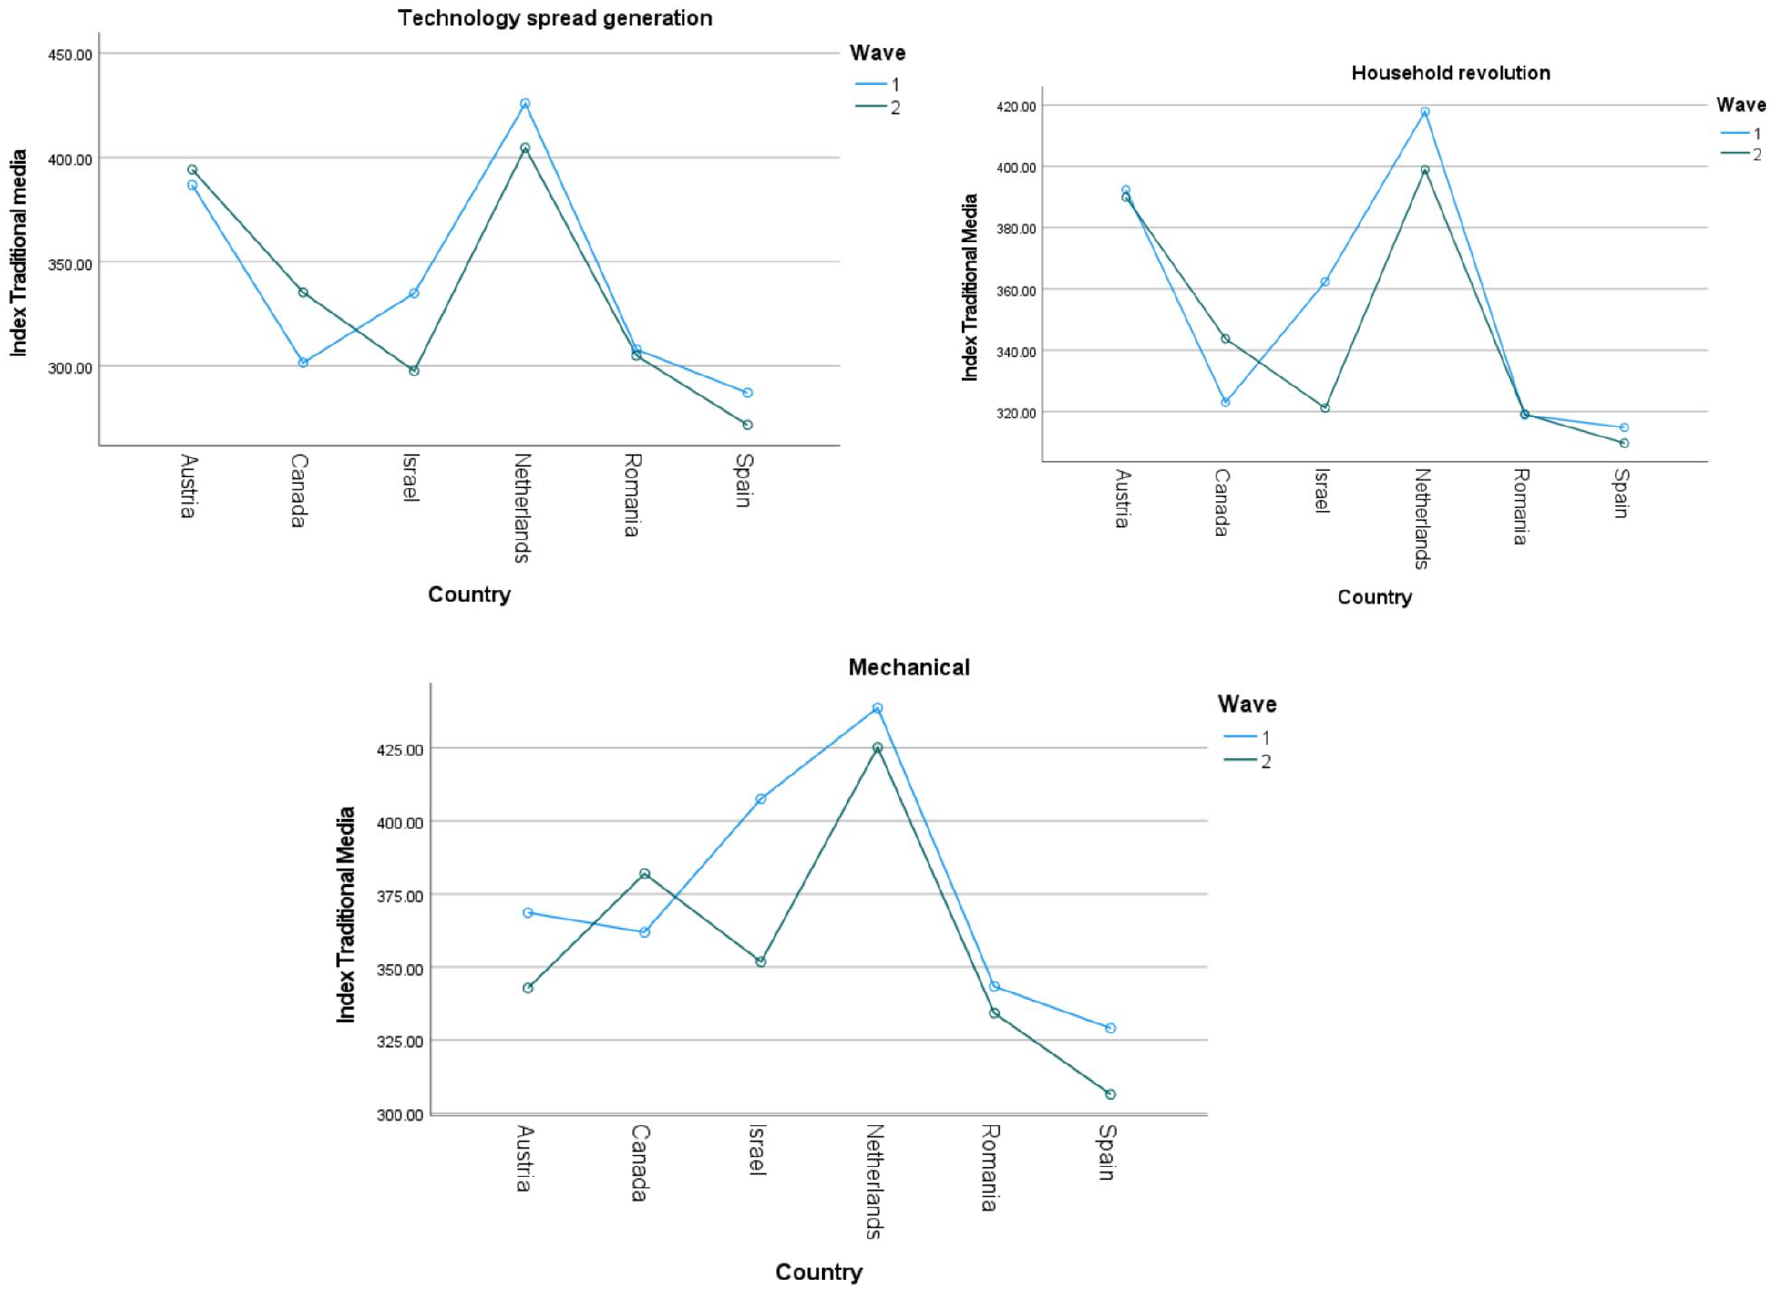
The use of traditional media across waves, per each technology generation (N = 6406).
New Media Index: We tested the changes in new media use over a 2-year period between the three technology generations (RQ1b). There was no interaction or main effect within subjects but there was a main effect with a small effect size of country across the waves (F (5) = 5.40, p < .001, η² = .010). These results indicate that the use of new media is more stable across generations and across waves than the use of traditional media. However, as seen in Figure 7, Israel recorded an increase in new media use compared to other countries, for all generations.
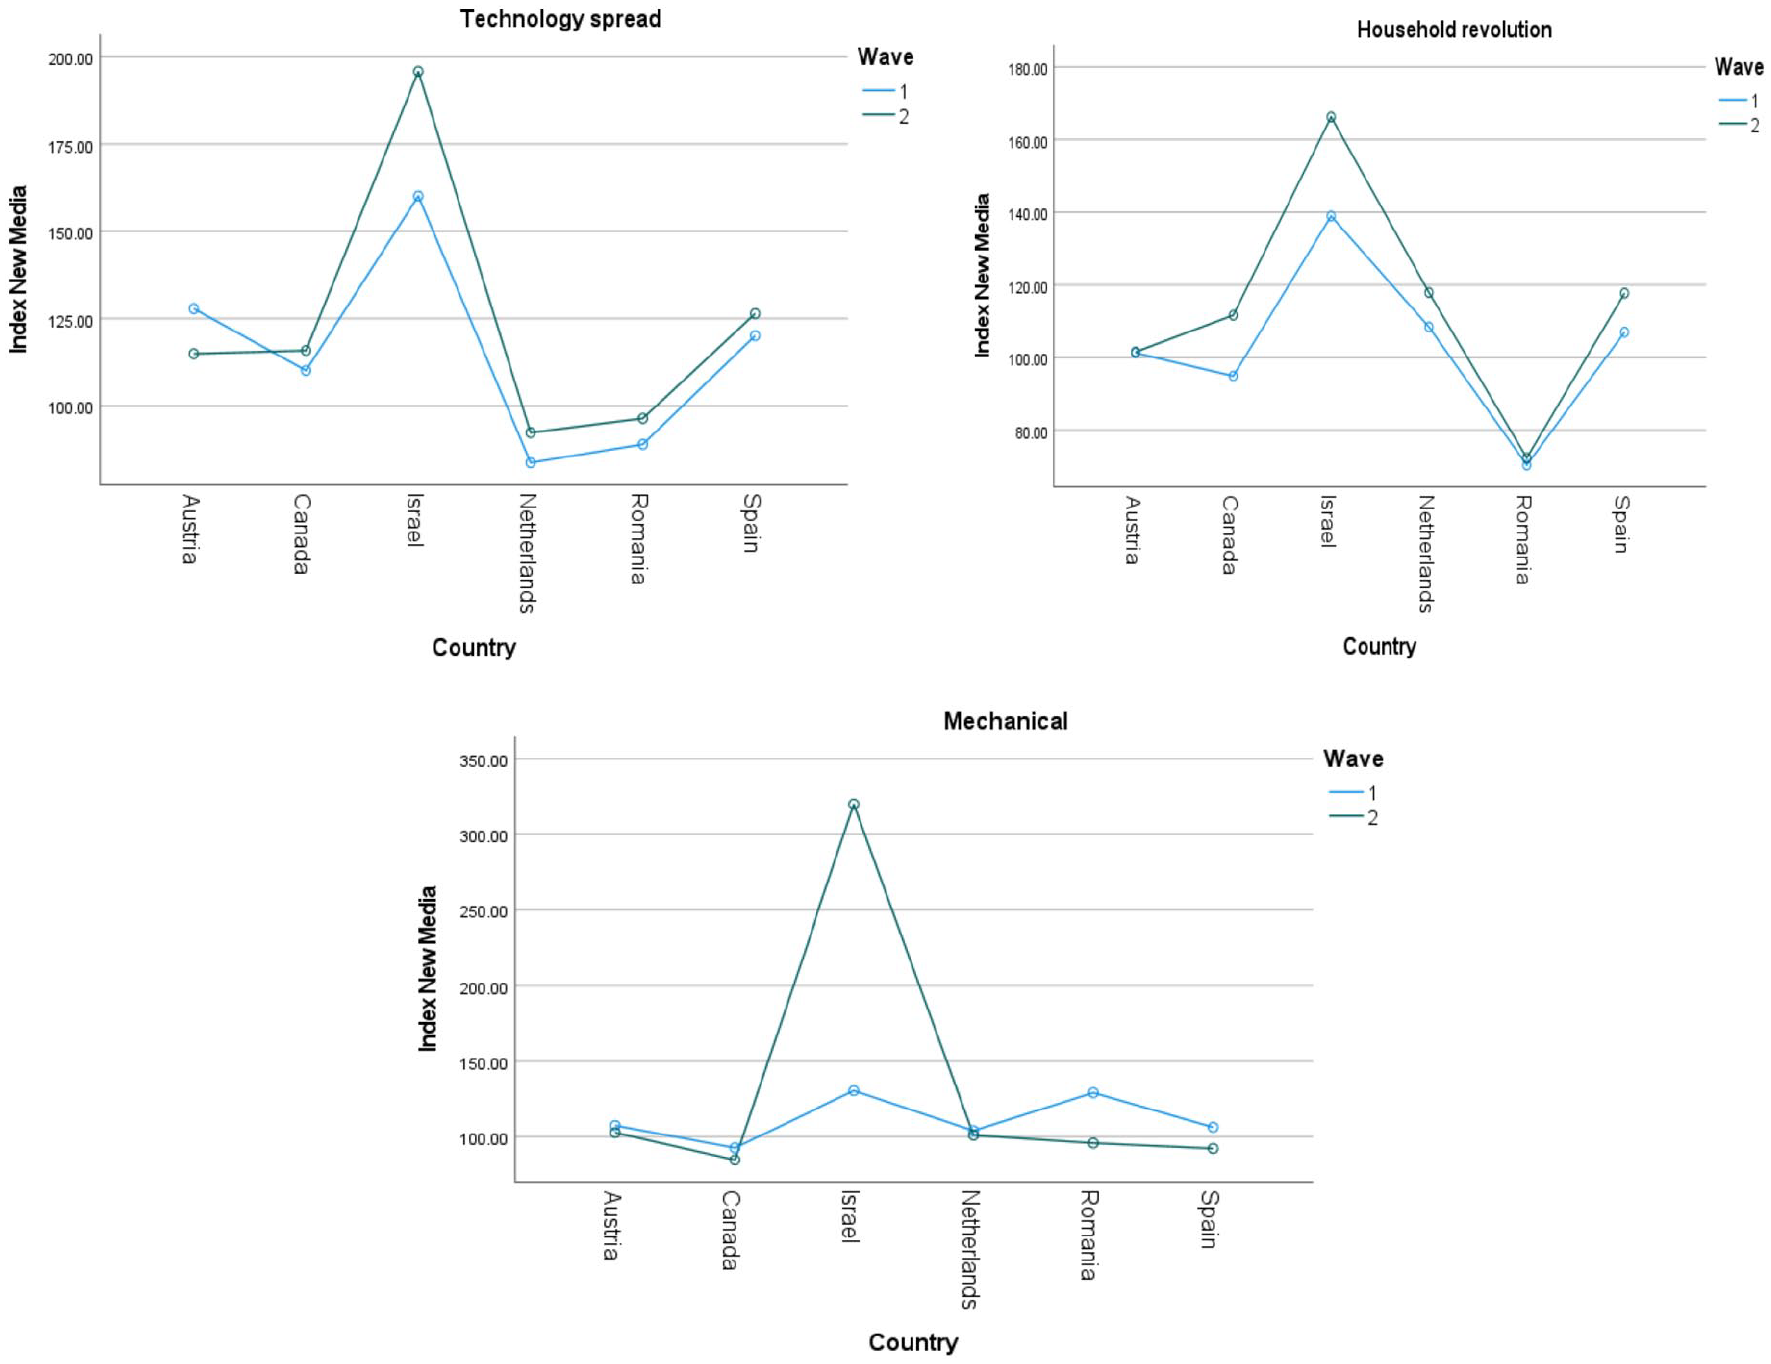
The use of new media across waves, per each technology generation (N = 6406).
Different new media: Email, Chat, SNS and the changes between the two waves
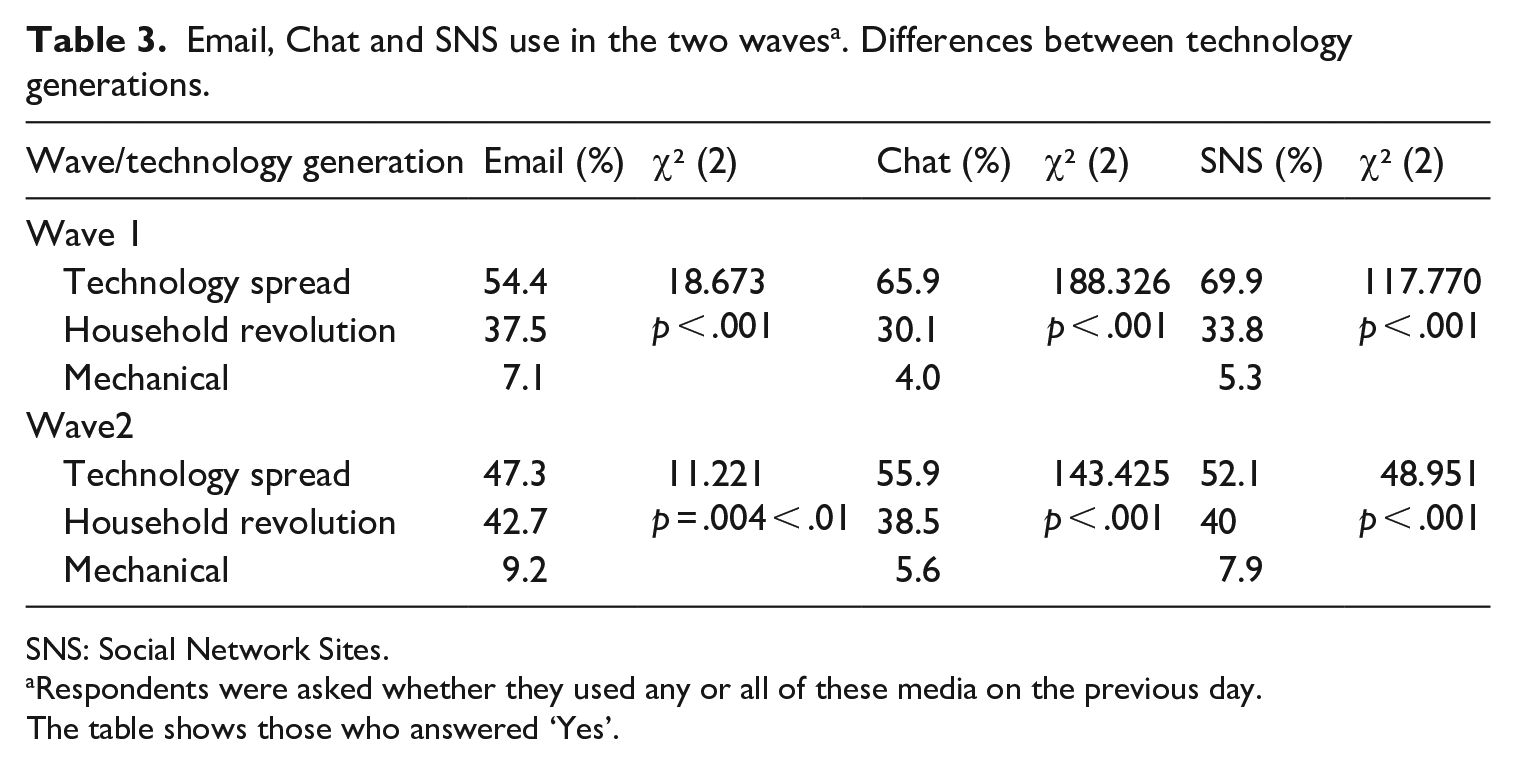
Following RQ2, we explored the changes in the type of new media used, including Email and media that have become more pervasive in recent years, such as Chat and SNS, in the light of the history of use. Table 3 shows the differences in the use of Email, Chat and SNS between the technology generations (chi-square tests were performed for each of the three media and for each wave).
Email, Chat and SNS use in the two waves a . Differences between technology generations.
SNS: Social Network Sites.
Respondents were asked whether they used any or all of these media on the previous day.
The table shows those who answered ‘Yes’.
First, we note that there are significant differences in media use for all three media (Email, Chat and SNS) between the three technology generations (Table 3). In both waves, the ‘technology spread’ generation was found to use more of these media, compared to the other two generations, and the ‘mechanical’ generation was more defined by laggards (Rogers, 2003). Still the differences between the three generations tended to diminish over the 2-year period under review. We found an increase in percentage of people using all three media (from Wave 1 to Wave 2) in both the ‘household revolution’ and the ‘mechanical’ generations. Second, Table 3 shows that in the ‘technology spread’ generation, the percentage of users shrinks between Wave 1 and Wave 2, for all media: Email, Chat and SNS; we will discuss this interesting result further in detail later on.
Repeated measures of ANOVAs were conducted to reveal interaction between the waves, the country and the technology generations in the use of the three media: Email, Chat and SNS.
Figures 8–10 visualize the findings and we summarize the results of the ANOVA with repeated measures below:
Email use across waves, per each technology generation (N = 6406).
Chat use across waves, per each technology generation (N = 6406).
SNS use across waves, per each technology generation (N = 6406).
The use of Email: Within-subjects effects reveal a small effect of the wave (F (1) = 8.82, p = .003, p < .01, η² = .002), and a moderate interaction effect of country and wave (F (5) = 5.79, p < .001, η² = .007). Post hoc Tukey’s HSD test revealed similarities between the waves in Austria, the Netherlands and Romania and differences between these countries and Spain, Canada and Israel. Also, Spain and Canada differed from the other countries in having a more stable use of Email from one wave to the other. In terms of technology generations, differences were seen between the ‘mechanical’ generation and the two other technology generations, but not between the ‘technology spread’ and ‘household revolution’ technology generations. In other words, the respondents belonging to the mechanical generation (aged 78 and above) showed a different pattern of Email use between the waves compared to the other, younger generations. Table 3 shows that the use of Email increased significantly in the ‘mechanical generation’ from Wave 1 to Wave 2.
The use of Chat: Within-subjects effects revealed no main effect of generation or wave, although a large interaction effect of country and wave was found (F (5) = 6.49, p < .001, η² = .021). Post hoc Tukey’s HSD test revealed that Spain was different from the other countries, with a significant increase in the use of Chat in the ‘mechanical generation’, compared to the ‘technology spread’ and ‘household revolution’ generations. In Spain, the difference in pattern of Chat use from Wave 1 to Wave 2 was greater than in the other countries. In Israel and Canada, too, Chat use changed between Wave 1 to Wave 2: in both countries there was a decrease in the use of Chat from Wave 1 to Wave 2, particularly in the ‘technology spread’ and ‘household revolution’ generations (see Figure 9 in the Annex).
The use of SNS: We recorded similar effects as for Chat use: no main effect of generation or wave, but an interaction effect of country and wave (F (5) = 4.10, p = .001 < .01, η² = .008). Again, Post hoc tests showed that Spain deviated from the other countries in the changes in SNS use between Wave 1 and Wave 2. Also, Israel was different from other countries, with the exception of Romania. Note that Israel and Romania showed the strongest decrease in SNS use between Wave 1 and Wave 2 (see Figure 10 in the Annex).
Discussion
The current study investigates the changes occurring in older people’s use of traditional and new media, using the data from the ACT longitudinal study on older Internet users in six countries: Austria, Canada, Israel, Netherlands, Romania and Spain. We explored the intertwinement between ‘individual lag’ and ‘social-structural lag’ (Lawton, 1998), as well as the role of the technology generations (Sackmann and Winkler, 2013). The article explains the changes in media use in terms of different patterns for three technology generations: the ‘mechanical’ (born in 1938 or before), the ‘household revolution’ (born between 1939 and 1948) and the ‘technology spread’ generation (born between 1949 and 1963), in the light of their exposure to different media technologies during their formative period, underlining the role of the country of origin – as the history of traditional and new media followed different routes in various countries. We found that over a period of 2 years, the media preferences of older people in each of the three technology generations had undergone changes and that these changes not only varied by generation but also by country. We also found evidence that the differences seen in the use of early or more recently developed new media become smaller over time and we expect the gaps between the technology generations to eventually close, as even the newest new media will, someday, become ‘old’.
Indeed, being part of a certain technology generation (a cohort that has experienced the availability of the same types of media during the formative period) could be an indicator for what Lawton (1998) termed ‘individual lag’ and ‘social-structural lag’, thus explaining the differences in media use over the years. The original aspect of the present article is the fact that we also investigated how Internet-based media (Email, Chat and SNS) were used over a 2-year period of time. Our point of departure was the observation that the media formats that used to be new media are now also ageing and that this in turn is part of the ‘social-structural lag’ phenomenon: not only do individuals from a certain generation tend to use the new media to a lesser extent, the use of these new types of media will also decline once they, too, start to become old.
First, the changes in the use of traditional media between the two waves were analysed and the effects of both technology generation and country were investigated (RQ1a). We found a small size interaction effect between country and technology generation in both waves (2016 and 2018). In a previous analysis (first wave, see Ivan et al., 2020), we noted an interaction effect between country and technology generation in Wave 1. We could not provide evidence for a main effect of the technology generation on media use. We then postulated that contextual factors played an important role – as, for example, the country of origin of the participants. We got the same interaction effect between country and technology generations in the second wave, strengthening the idea that ‘technology generations’ play a role in explaining differences in media use, but only in relation to other contextual aspects. Being born as part of a certain generation and growing up using certain media during the formative period, especially in conjunction with the media history of the country in question would explain the preferences for using certain media types later in life ( ‘individual lag’ rather than ‘social-structural lag’). New studies should control for the life course effect or the period effect (namely the time at which the different types of media were introduced in the respective countries).
Similarly, we investigated the changes in the use of new media between the two waves (RQ1b). There was a relatively strong interaction effect between technology generation and country of origin in the second wave. Again, there was no main effect of technology generation, but we found a main effect of the country of origin across the two waves. Our data support the idea that contextual factors (structural factors – related to the media specificity in each country) play an important role in explaining media change, compared to other individual variables. Individual lag and social-structural lag are inter-related in explaining the changes in media use by older people.
Overall, both the changes in use of traditional media and the new media are country dependent across the two waves, and we found evidence that those changes are significant from Wave 1 to Wave 2. In other words, within a time span of 2 years, changes were seen in the amount of time older people spent using different media, although these varied from country to country. These data provide evidence for the idea of ‘social-structural lag’ discussed above. Also, our findings suggest that the ‘mechanical’ technology generation (born in 1938 or before) in all six countries is the one most affected by individual lag: the media use in this generation is much lower compared to the other two (younger) generations.
Probably, the most interesting of our findings concerns the changes in type of new media use, particularly when comparing an ageing new media format (Email) with the newer media formats that have emerged in more recent years (Chat and SNS). We explored the idea that in some cases both the media and their audiences are getting old (RQ2). The results show significant differences in the use of Email, Chat and SNS between the three technology generations in both waves. The youngest group in our empirical study, i.e. the ‘technology spread’ generation (born between 1949 and 1963) uses more Email, Chat and SNS, compared to the other two generations. The ‘mechanical’ technology generation (the oldest group in our empirical study) fits the description of laggards presented by Rogers (2003). The differences in using all three media grew smaller over a period of 2 years, providing evidence that the technology generations concept could explain gaps between the generations that might eventually be bridged but that will probably re-appear with the emergent media. This is in line with other recent studies, which found support for aged heterogeneity in connection to digital media use (Taipale et al., 2021). Also, in the case of Email, Chat and SNS, the country effect is salient: changes in the three technology generations follow different patterns depending on the participants’ country of origin. Such findings make sense if we take into account the fact that the spread of Email, Chat and SNS did not occur at the same time around the world.
The most intriguing finding of our empirical study is the fact that in the case of the ‘technology spread’ generation, the percentage of users decreased between Wave 1 and Wave 2 in all three of the media – Email, Chat and SNS – analysed here. For the youngest generation ( ‘technology spread’) in our empirical study (60 to 65 years of age), we observed a decrease in the general use of new media in the years between 2016 and 2018. Israel showed the most prominent decrease in use between the first and the second wave, but a decline in the use of all three media formats by the ‘technology spread’ generation can be observed from Wave 1 to Wave 2 – although to a lesser degree – in all the other countries as well. A possible explanation for these findings is the media saturation phenomenon previously described in this article. Indeed, the decrease is stronger in the use of Email – illustrating the fact that some media are getting old and thus contributing to ‘social-structural lag’. Still, in the ‘technology spread’ generation – the group which in 2016 already had a higher percentage of users compared to the other two technology generations, the decrease in new media use was seen for the emergent media such as Chat and SNS as well – a surprising observation that could be explained by a saturation effect. We presented the concept of media saturation at the beginning of the present article, describing this as the phenomenon whereby any further increase in access and availability of a media type will not be accompanied by an increased use of that media type. Media saturation is what occurred here in the ‘technology spread’ generation – its members reached a certain threshold above which we can no longer expect a significant increase in the use of new media. While this decrease in the use of certain media types revealed in our study was the most dramatic in the ‘technology spread’ generation (the youngest generation), it was also seen, albeit to a lesser extent, in the ‘mechanical’ generation (the oldest in our sample).
Media saturation, like saturation in the natural sciences, might have different levels/thresholds for different social groups. Here, we find some evidence for a possible effect of media saturation in older Internet users. Interestingly enough, the effect occurred in the youngest generation (‘technology spread’), which probably started using the new media quite early. The findings are relevant, given that our cross-country and longitudinal study has representative samples for older Internet users in all six countries. Nevertheless, we acknowledge that the media saturation explanation for our findings might be speculative. In October 2020, we collected the data in the same six countries for the third wave of our ACT longitudinal study and are in the process of data preparation and cleaning, aiming to forge ahead and to explore possible evidence of media saturation using all three waves. One other important point will also be to compare the data gathered in the relatively normal conditions prevailing in 2016 and 2018 with the data gathered in Wave 3 (2020) during the COVID-19 pandemic. The media context has dramatically changed over the past year and a half, and the three waves might be too different to be compared. Still, if we indeed want to explore the saturation effect in the use of new media by older people, the three waves of the ACT longitudinal study are valuable, taking into account that, at least to our knowledge, this study is unique in the way it explores media use by older Internet users and because of its transnational and longitudinal character.
Conclusion
The present article sheds light on the importance of using new theoretical perspectives in studying changes in media use. It suggests the concept of ‘technology generations’ as a possible framework of analysis: if people have grown up with and used certain types of media during their formative years, this might shape the way they use different media formats later in life. Also, we underline the importance of using cross-cultural and longitudinal data in explaining the change in media use. Our data revealed that contextual aspects are relevant and country differences could not be ignored. The media history of each country could explain people’s preferences for certain media types. Indeed, the media use percentages for people born in 1938 or earlier (here called the ‘mechanical’ generation) were lower compared to the other technology generations. These are valuable data for policymakers who should focus more on the oldest adults (aged 78 and above) in actions aiming to reduce the digital divide. More importantly, our study suggests an adoption reverse effect: a decrease in use over a 2-year period of some of the new media, particularly in the ‘technology spread’ generation, among people aged 60–65. Our results urge a more nuanced perspective in investigating how people use the new media formats. Here, we suggest considering the saturation effect as a potential explanation and this will be a new path to follow for policies targeting digitalization and older people: understanding the role and perceived functionality of different media and analysing the reverse effect of adoption – situations in which people have started to use certain technologies less, whether this is deliberate or not. Last but not least, our starting point in this article was the idea that it is not just people who age, new media, too, will inevitably start to get old. Hence, the ‘age’ of different media formats needs to be considered in addition to the age of the users in explaining media saturation, preferences in use and the reverse-adoption effect.
Limitations
Although the approach applied in our empirical study enabled us to gain insight into the dynamics (the changes seen from the first to the second wave) of media use and media preferences (Email, Chat and SNS) between three technology generations (the ‘mechanical’, the ‘household revolution’ and the ‘technology spread’ generation), and provided a better understanding of the differences between the six countries (Austria, Canada, Israel, the Netherlands, Spain and Romania), we are aware of the limitations associated with the present study. The data for the ACT longitudinal study were collected by questionnaire-based surveys making use of self-report in which people report their media use on the day before filling in the questionnaire. To gain more insight into their daily media use, a tracking study should be conducted (see Fernández-Ardèvol et al., 2019 – for a methodological design of such an approach). The 2-year time period should be extended to more years to understand the development of old and new media use over time. This empirical study has been conducted in the above-mentioned six countries; future research should also involve a different range of countries, if we aim to explain country differences in the changes of media use later in life. Also, the article talks about changes in the media use (traditional and new) of older Internet users, without understanding the meanings of such changes for the users, or the contexts in which users are using different media. We believe that such an approach is better captured by the concept of ‘media repertoire’ (see Hänninen et al., 2021) and it would have required a qualitative approach. A mix-method approach would be a normal continuation of the present study.
Footnotes
Author’s note
The two authors confirm that they have agreed to the submission and that the article is not currently being considered for publication by any other print or electronic journal.
Declaration of conflicting interests
The author(s) declared no potential conflicts of interest with respect to the research, authorship, and/or publication of this article.
Funding
Author biographies
![]() .
.