
Abstract
We conducted a scoping review to identify and describe trends in the use of social media images as data sources to inform social science research in published articles from 2015 to 2019. The identified trends include the following: (1) there is increasing interest in social media images as research data, especially in disciplines like sociology, cultural studies, communication and environmental studies; (2) the photo sample size is often smaller than that is typically used in text-based social media analysis and usually is collected manually; (3) thematic coding, object recognition and narrative analysis are the most popular analysis methods that are often conducted manually; (4) computer vision and machine-learning technologies have been increasingly but still infrequently used and are not fit for all purposes; and (5) relatively few papers mention ethics and privacy issues, or apply strategies to address ethical issues. We identify noteworthy research gaps, and opportunities to address limitations and challenges.
Introduction
Web 2.0 technology, which refers to the collaborative or social platform emphasizing user-generated content and participatory culture (O'Reilly, 2005), has continued to advance in recent decades, helping people generate and share their own content on the Internet. As a result, the way people communicate and interact with each other has changed. The most significant of these changes is the increased use of social media, which over the past decade has absorbed many individuals into a chaos of overlapping online communities. Few users are fully aware of how their lives have been shaped by social media. Like its traditional counterparts (e.g. newspapers), social media is ‘designed to record, categorize, store, and rank lived experience’ (Jurgenson, 2019: 24). Increasingly, social media shapes social lives, while also providing a lens through which to view social lives and memories in a way that likely maps closer to social reality than other proxies social scientists typically use.
Crucially, social media is both textual and visual, thanks to the ability for people to document and publish their social experiences in words and images. Before the advent of Web 2.0 technology, published photos were largely considered to be both an art form and a professional skill in traditional media to highlight cultural phenomena and moments of historical importance. The parallel development of Web 2.0 technology and smartphones embedded with cameras and photo editing applications means that photos can also be used to capture and present the details of average people’s daily lives. This trend has led to the democratization of photography on the web and marks a broader development in self-expression, memory and sociality (Jurgenson, 2019).
Social science researchers have always explored different ways to understand human experiences and behaviours. Such research now has access to new data sources and collection methods by leveraging the digital environment. Analysing crowdsourced data, such as that gleaned from social media, has become the most novel and controversial approach in recent years (Ghermandi and Sinclair, 2019). There have been doubts cast about the validity of social media data: critiques of the ‘pointless babble’ on such platforms and the self-centred messages that are seen by some as irrelevant to public issues (Kelly, 2009; Neuman et al., 2014). However, social media has been identified as a promising source for understanding social and cultural discourses (Shah et al., 2015), leading to dramatic growth in scholarly interest. For example, Li et al. (2017) found that the annual number of scholarly social science articles involving social media data had increased from 716 in 2008 to 2509 in 2014.
While both textual and photographic data can be leveraged in social science research, the latter may provide unique values and insights. First, images are more direct and globally understood when language barriers are prominent in texts (Jurgenson, 2019). Second, images are not static representations of objects or events; instead, these formats incorporate dynamism. Not only can an image be decoded based on the moment it captures, but its interpretation can also speculate about what happened before and after that moment, recognizing limitations to the validity of third-person interpretation (Finn, 2012). For example, when a photo posted on Facebook is coded as happy, dogs and hiking, this is not only related to the moment it was captured. The indication may be that outdoor recreational activities like hiking and pet accompaniment are related to positive emotions. Third, what is unseen may be as important as what is, which drives us to ponder not only why particular things have been captured but also why other things have not been (Sturken and Cartwright, 2017). Banks (2018) discusses, for instance, that image interpretation can go beyond the standard figure and ground (focus and background) to include frame (what is and is not included) and external narrative (of what practice is this a part?).
Despite the unique role images play in communication, visual materials are not commonly used in research that strives to understand social issues. Unlike their textual counterparts in social media analysis, images have contributed to a modest (though growing) proportion of studies in the past decade. The metadata of images – such as geotags, image titles and short descriptions – have been utilized more often than the actual content of photos. For example, analysis using image geotags derives meaning from the presence of a photo at a specific place without probing who took this photo, why they took it and what objects are captured in it (Langemeyer et al., 2018). In early work on cultural ecosystem services using social media images, for instance, ecologists tended to ‘assume that a photo posted means a service delivered’ (Sherren et al., 2017b: 289).
This comparatively less frequent use of images by social scientists may be due to limited skills and underdeveloped tools for retrieving and analysing visual data (Ghermandi and Sinclair, 2019). Qualitative data analysis tools are text-focused, and natural language processing has offered textual analysis support for decades. The maturation of image mining, analysis and annotation tools, supported by advancements in machine learning, has been assisting or replacing time-consuming manual analysis (Ashkezari-Toussi et al., 2019; Koylu et al., 2019). Studies that involve some degree of automation are more feasible than the laborious process of manual coding (e.g. Laestadius et al., 2019; Tsou et al., 2016). However, the relatively steep learning curve of developing or learning the tools and techniques for collecting and analysing social science image data beyond metadata may leave many social scientists unable to compete in a field they should lead (Sherren et al., 2017a).
The objective of this article is to review social science research that leverages social media images, examining the current state-of-the-art based on the last 5 years of research and assessing the implications for future research. Specifically, this review will explore these research questions:
The remainder of this article is organized as follows. The ‘Methods’ section explains the research approach, search strategy and the process of analysis and synthesis. The ‘Results and discussion’ section displays the results and discussions related to the research questions, starting with summaries of literature, followed by research gaps. The ‘Conclusion’ section concludes this article.
Methods
Research approach and strategy
This article is a scoping review of peer-reviewed research papers published between January 2015 and December 2019 using Scopus, one of the largest databases of peer-reviewed literature. Scopus has been assessed as a suitable tool for conducting a research synthesis (Gusenbauer and Haddaway, 2020), is among the most comprehensive of the journal-indexing databases while still including only peer-reviewed articles (Martín-Martín, Thelwall and Orduna-Malea, 2021) and supports the sophisticated query and filtering tools required (Gusenbauer and Haddaway, 2020). No database tools completely capture all literature on a subject, but Scopus is more complete in the general disciplines relative to our search (Gusenbauer and Haddaway, 2020), though it is still limited by the decisions of the Scopus Content Selection and Advisory Board, with the potential conflict of interest of being owned by a major journal publisher (Elsevier).
The literature search was completed on 27 April 2020, and 2349 papers in total were identified by using the complete query code with the inclusion and exclusion criteria listed in Table 1. First, only research papers published in English were included, a common decision in literature reviews that rely on databases that are also biased towards English. Second, only research papers published in peer-reviewed journals from 2015 to 2019 were considered. Third, the study had to use social media images as data sources; thus, ‘images’, ‘picture’, ‘photo’ and ‘selfie’ were set as search keywords in titles, abstracts and keywords, and ‘social media’ must be included somewhere in the main text body. Fourth, the study had to be within journals categorized by Scopus in the research area of social science, though likely imperfectly. As such, social science work published in interdisciplinary journals or those from other disciplines may not have been caught. We consider the above search conditions to have provided a reasonable proxy of our domain of interest, balancing the risks of exclusion and subjectivity.
Inclusion and exclusion criteria of the review.
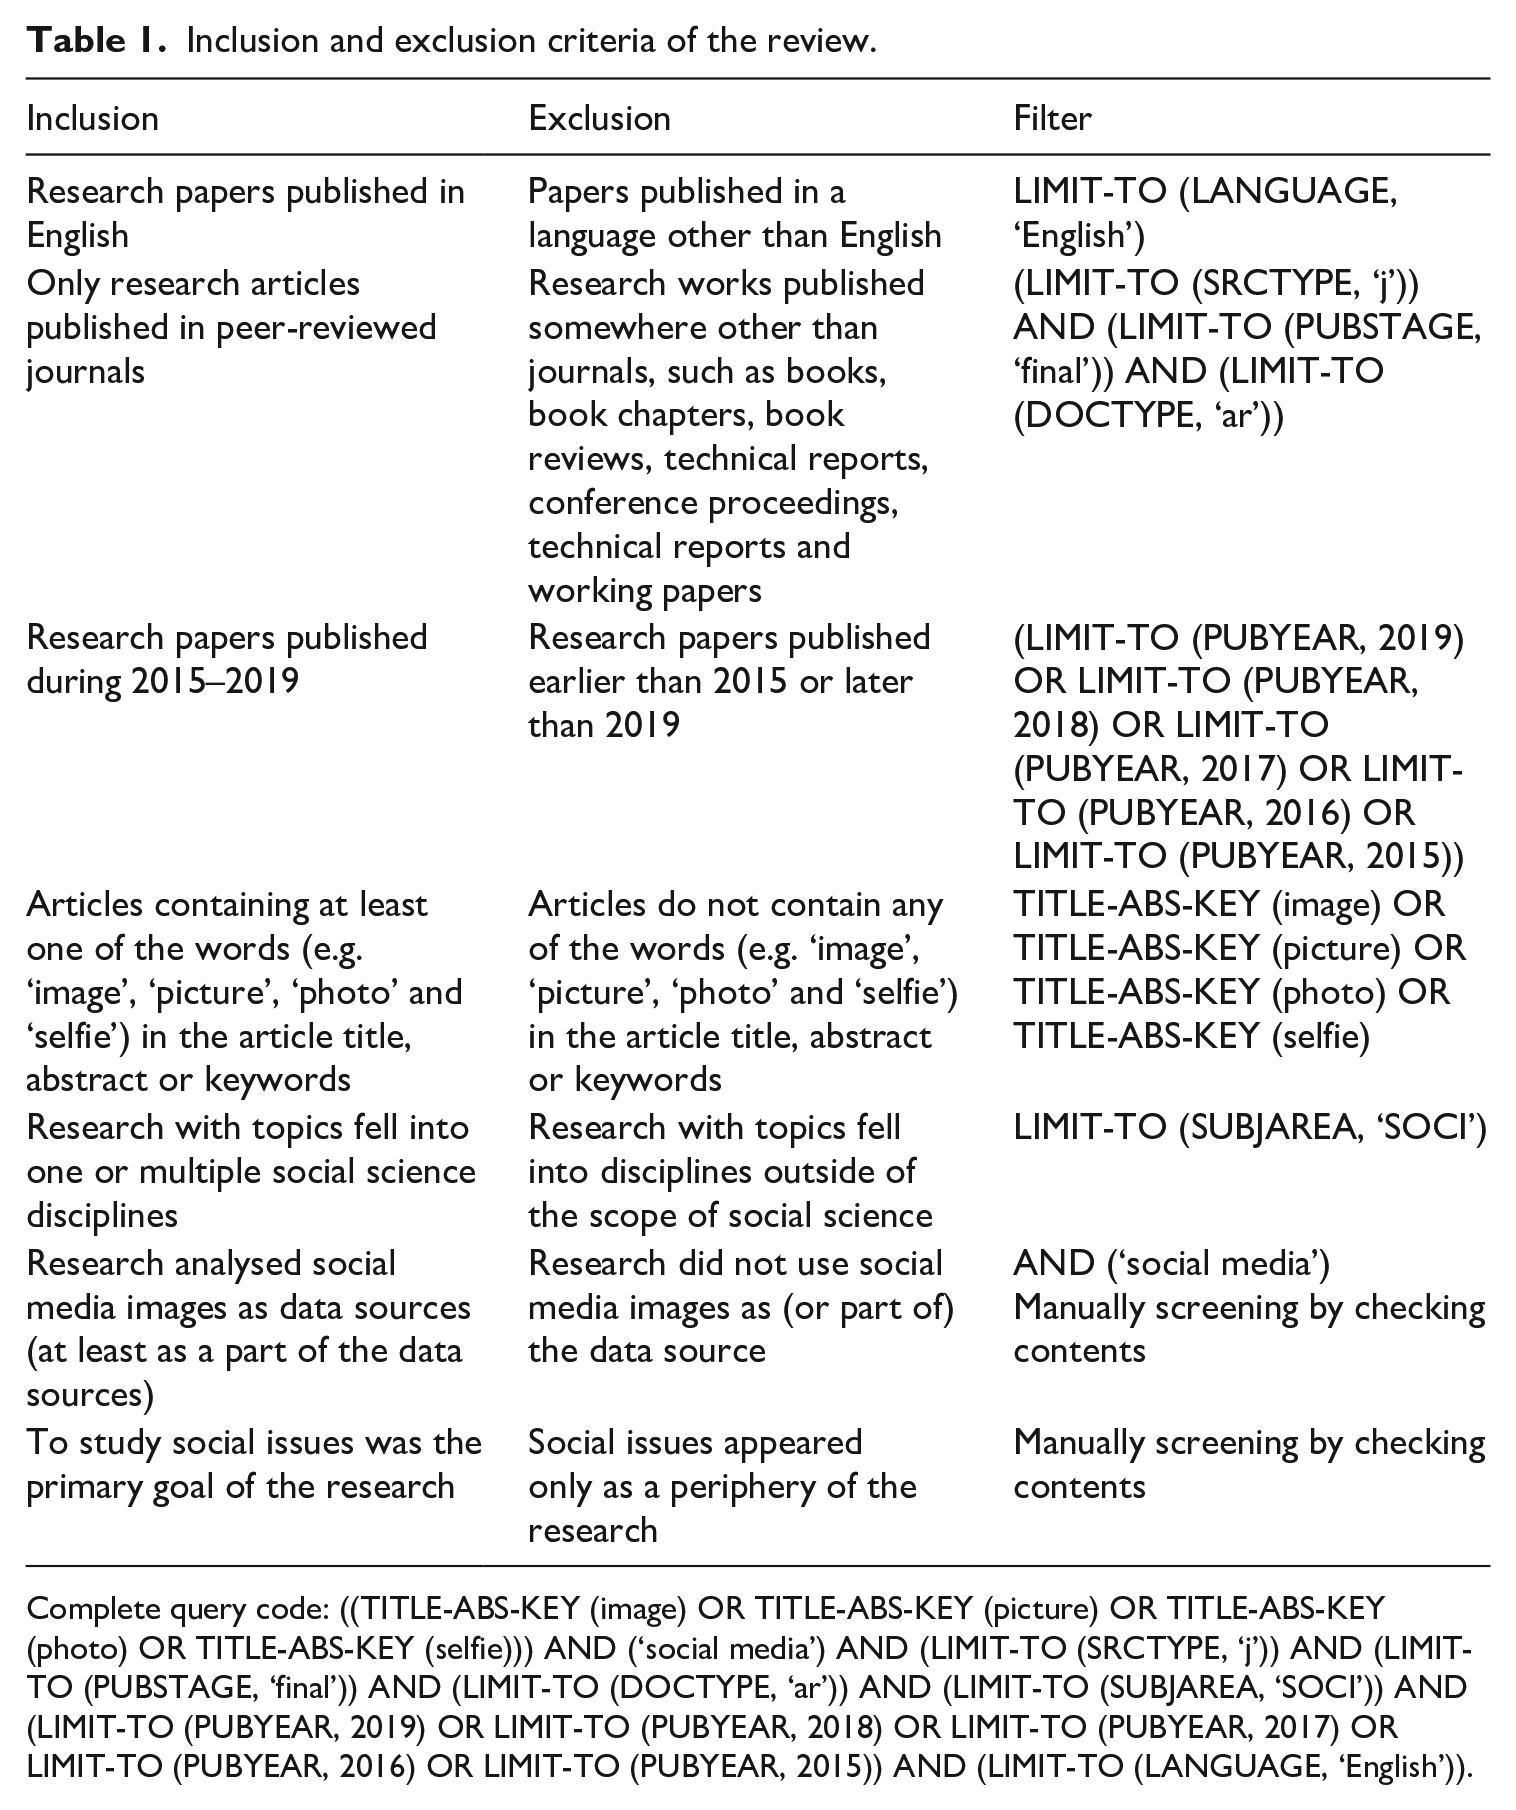
Complete query code: ((TITLE-ABS-KEY (image) OR TITLE-ABS-KEY (picture) OR TITLE-ABS-KEY (photo) OR TITLE-ABS-KEY (selfie))) AND (‘social media’) AND (LIMIT-TO (SRCTYPE, ‘j’)) AND (LIMIT-TO (PUBSTAGE, ‘final’)) AND (LIMIT-TO (DOCTYPE, ‘ar’)) AND (LIMIT-TO (SUBJAREA, ‘SOCI’)) AND (LIMIT-TO (PUBYEAR, 2019) OR LIMIT-TO (PUBYEAR, 2018) OR LIMIT-TO (PUBYEAR, 2017) OR LIMIT-TO (PUBYEAR, 2016) OR LIMIT-TO (PUBYEAR, 2015)) AND (LIMIT-TO (LANGUAGE, ‘English’)).
Data screening, extraction and analysis
We used DistillerSR to conduct the title, abstract and keyword screening for the 2349 papers retrieved. Papers were excluded if they (1) did not use any types of social media images (e.g. photos, selfies, memes, emojis, GIFs) as data; (2) only reported image numbers or identified the presence of images, while not analysing image content or metadata (e.g. geotag, timestamps, tags); and (3) only used a few images as examples but did not analyse them collectively or in terms of detailed narratives, which refers to the annotations or descriptions of images. However, papers were included if images were counted to show trends, or the social media sites were used as the platform to do focus groups or photo elicitations. Also, papers that were not accessible or available at the time when this review was conducted were excluded; 294 papers remained before the second-level screening of the full text. At this phase, papers were excluded if (1) they were not empirical (e.g. literature review papers, methodological or theoretical discussions, editorial articles and editorial introductions to special issues), or (2) there were languages other than English that have not been translated or explained. After the two-step screening process, 233 papers remained from which to extract information in terms of the research background, authors, data collection and analysis methods, biases and ethics issues. Coding results were exported as Excel spreadsheets for synthesis and statistics. The first author did all retrieval, filtering and analysis work (Figure 1) A PRISMA-style overview of the screening process is shown in Figure 1.
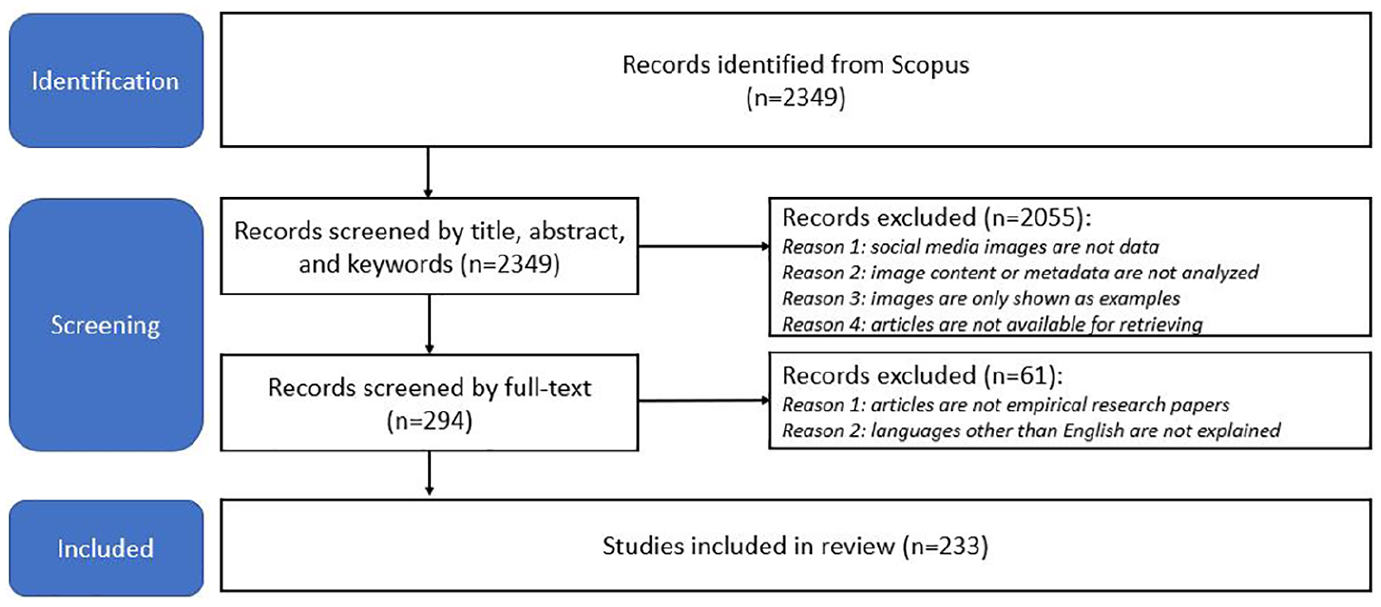
Scoping review flow diagram for screening database search results.
Results and discussion
We discuss the results of this review in three main sections: (1) the scope and trends of research (case study areas, disciplines and topics), (2) collection and analysis strategies and (3) biases and challenges of using such data. The first two sections begin with a summary of the reviewed literature, followed by a discussion of the key research gaps. The last section discusses the biases and challenges most identified when using social media images as data for the current research area.
Research scale and trends
The literature shows an overall increase in the number of research papers utilizing social media image data in social science research from 22 in 2015 to 61 in 2019. The biggest increase was 77% from 2016 to 2017, which after which numbers stayed consistent (a 9% decrease in 2018). Ghermandi and Sinclair’s (2019) systematic review of environmental research based on crowdsourced social media data from 2011 to 2017 also found a dramatic increase in 2017. A decrease in studies meeting the inclusion criteria of this scoping review may indicate a new trend of increasing interest in other visual content such as videos (e.g. Ji et al., 2019; Nur et al., 2019), which merits further study.
The scale at which research is conducted can easily be larger when using social media data than with conventional research methods such as interviews and surveys; in fact, with social media research, it is sometimes difficult to define the boundary of study areas. Not all social media posts are geocoded, for instance. The research scale of most reviewed papers is continental or cross-continental, with Europe and Asia most common (52), followed by North America (44), Australia & Oceania (7), Latin America (5) and Africa (3) (see Figure 2). However, the remaining 71 papers do not clarify their study area, and thus were coded as ‘not mentioned’. Most of them only filter data by keywords instead of locations, and depending on the nature of those keywords, the resulting data could be global or local. For example, Laestadius et al. (2019) collected pins that contain the keywords ‘marijuana recipe’ and ‘weed recipe’ on Pinterest without delineating boundaries for any specific geographic areas. Only nine papers explicitly use global data, based on the criteria if (1) the study explicitly says that the data were collected globally (e.g. Gewirtz-Meydan and Ayalon, 2018, collected data from global dating sites), or (2) there were multiple study areas which were distributed globally (e.g. Ashkezari-Toussi et al., 2019, retrieved geotagged data from 12 cities around the world).
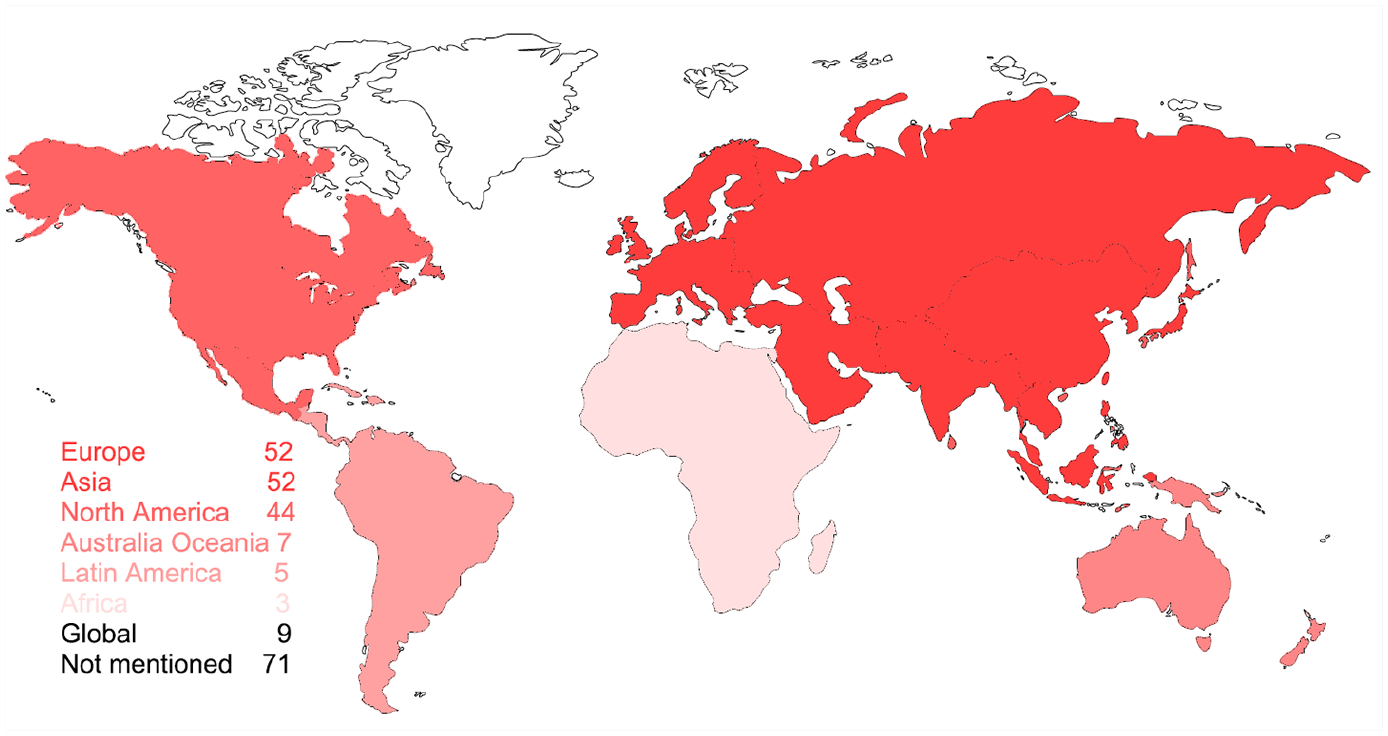
Geographic distribution of study areas.
Scholar distribution aligns with case study areas. Social scientists in Europe (40%) and North America (38%) have been most active in the past 5 years, followed by those from Asia (22%), Australia & Oceania (8%), Latin America (2%) and Africa (1%) (see Figure 3). The number of scholars working in this field has steadily increased in Asia, Australia & Oceania, North America and Europe from 2015 to 2018. These results are consistent with Ghermandi and Sinclair’s (2019) finding of larger contributions by these regions to their upper- and middle-income economies. Figure 3 shows that 14% of European and 16% of North American researchers work with people from other continents, but such cross-continent collaborations are more prevalent among Australian (42%) and Asian (31%) scholars. Instead, in Europe and North America, smaller collaborations were identified among co-authors from adjacent institutions, cities or countries.
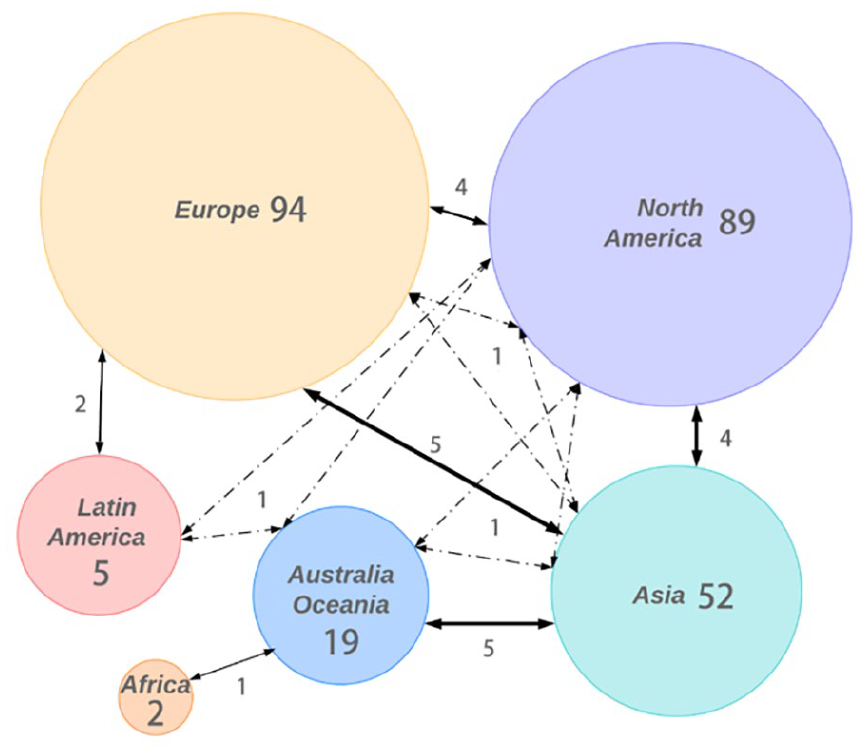
Distribution of scholars and collaboration between continents (line weights indicate the strength of ties, the full lines refer to collaborations between two continents and the dot–dash lines refer to collaborations among three continents).
Social science research using social media image data shows a trend of multi- and interdisciplines and diverse topics (Table 2). Papers in sociology and cultural studies (38%) cover topics on gender (e.g. Kim and Kim, 2018; Xu and Armstrong, 2019; Yockey et al., 2019), ethnicity (e.g. Groggel et al., 2019; Szabo and Buta, 2019), age (e.g. Gewirtz-Meydan and Ayalon, 2018), religious culture (e.g. Baulch and Pramiyanti, 2018), social identity (e.g. Eschler and Menking, 2018) and social relationships (e.g. Serafinelli, 2017). The second most popular discipline is communication (33%), focusing on topics like how image-based information is used and disseminated to facilitate discourses and studies based on communication theories (e.g. framing theory, agenda-setting; Enverga, 2019; Moore-Gilbert, 2019). Landscape and environment papers (18%) include topics on landscape management (e.g. Langemeyer et al., 2018), urban planning (e.g. Figueroa-Alfaro and Tang, 2017), ecology and ecosystem services (e.g. Guerrero et al., 2016), geography (e.g. Levin et al., 2018) and sustainability (e.g. Ghermandi and Sinclair, 2019). Tourism-related articles come in fourth place (14%). Twenty-seven papers (12%) explore political topics like elections (e.g. Hale and Grabe, 2018; Towner and Munoz, 2018) and protests (e.g. Casas and Williams, 2019; Wetzstein, 2017). Papers in the area of health (9%) address issues on drug use (e.g. Laestadius et al., 2019), mental health (e.g. Keskinen et al., 2019), smoking (e.g. Allem et al., 2019), viruses (e.g. Yoon et al., 2019) and fitness (e.g. Webb et al., 2019). The remaining fields (information management, education, business, psychology, history and art) each had fewer than eight papers that met inclusion criteria. Eighty-three papers (36%) in this review conduct research in more than one of the above disciplines.
Distribution of study disciplines.
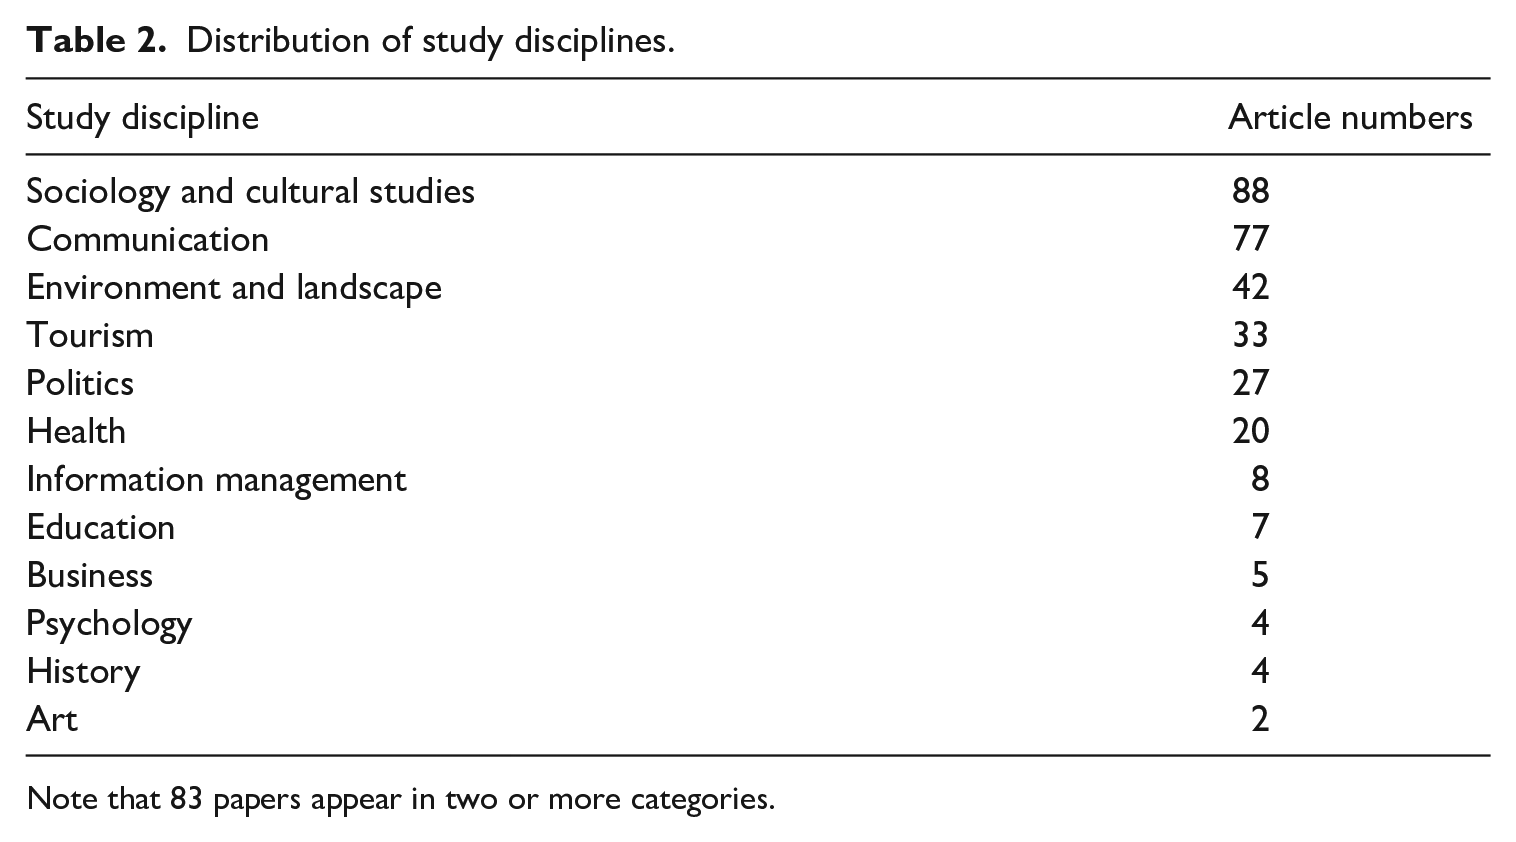
Note that 83 papers appear in two or more categories.
Research gaps
Cultural barriers can be a gap when the data are more globalized than the people who analyse them. The work reviewed here suggests that scholars are more likely to cooperate regionally to understand social issues globally. In such cases, biases may appear, especially when using keywords alone to identify valid data. The aforementioned ‘global data’ are often geographically global indeed but culturally parochial. Using the marijuana research as an example, Laestadius et al. (2019) included only English pins for analysis. This inclusion might reinforce the voices from English-speaking countries but downplay those from other linguistic backgrounds. The popularity and accessibility of social media in a specific area may be a sine qua non for local scholars to do related research but not for their location to be a study area. In this dataset, only two papers had scholars from institutions in Africa; however, areas like North Korea were studied through social media photos (Holiday et al., 2019). Holiday et al. (2019) analysed Instagram images captured in North Korea by an American photographer. These images give us only a glance into this country through a lens filtered by western ideology and stereotypes. The popularity of social media use in different areas may reflect the heterogeneity not only of technology development but also of capacities for social expression. Thus, cross-continent or global collaborations among scholars in the future may help to eliminate such cultural barriers.
Another research gap exists in cross-country and cross-platform case comparisons. In China, for instance, Twitter, Instagram and Facebook are not accessible, but it is not clear how to compare data retrieved from Chinese platforms (such as Weibo and WeChat) with that from international sites. Xu and Armstrong (2019) compared Chinese and US female and male athletes’ accounts on Weibo and Twitter to discuss the gender differences in self-representations. They found that Chinese female athletes posted more personal and beauty images, ascribed to hegemonic gender values in China, than the US female athletes. However, Weibo is the most dominant public social networking and content sharing platform in China, while US athletes may choose Twitter for building professional images but Instagram or personal Facebook accounts to share daily lives. The full awareness of the social media environment on different platforms and in different regions may help avoid misunderstandings of culture and social issues.
Collection and analysis strategies for social media image data
Data collection and processing
Instagram and Flickr are the most popular platforms for photographic data extraction for research in the reviewed papers. We found 31% of the studies use Instagram images and 23% Flickr, followed by Facebook (18.5%), Twitter (17.5%), Tumblr (3%), Panoramio (2.6%), Reddit (2.1%), Pinterest (1.7%), Weibo (1.7%) and other less commonly used platforms. Five percent of these studies collected images from more than one platform (e.g. Salzmann-Erikson and Eriksson, 2018). Flickr and Panoramio images are popular in research areas like landscape, tourism and urban planning (e.g. Figueroa-Alfaro and Tang, 2017; Salas-Olmedo et al., 2018), while Instagram, Twitter, Facebook and Pinterest are more common in sociology and cultural studies, politics, health and communication (e.g. Laestadius et al., 2019; McGarry et al., 2019; Seo and Ebrahim, 2016).
Although utilizing digital data, 43% of the studies rely on manual rather than automated data collection. For example, Lalancette and Raynauld (2019) monitored Canadian Prime Minister Justin Trudeau’s personal Instagram account for 1 year after he was elected in 2015 and manually selected all Instagram posts. Other researchers collected image data from the social media accounts of conventional research participants, such as Kim and Kim (2018) who obtained account information from survey respondents, and Samany (2019) who used a photo-elicitation approach on Telegram (a popular social messaging app in Iran). Other scholars searched keywords or hashtags on social media platforms and then manually downloaded images that reflect their research goals. Automatic image collection tools (using software to retrieve data through Application Programming Interfaces (APIs) provided by social media platform) such as Quintly and Netlytic are also widely used to enable data collection by specifying keywords (hashtags), geographic coordinates, posting time and/or account names.
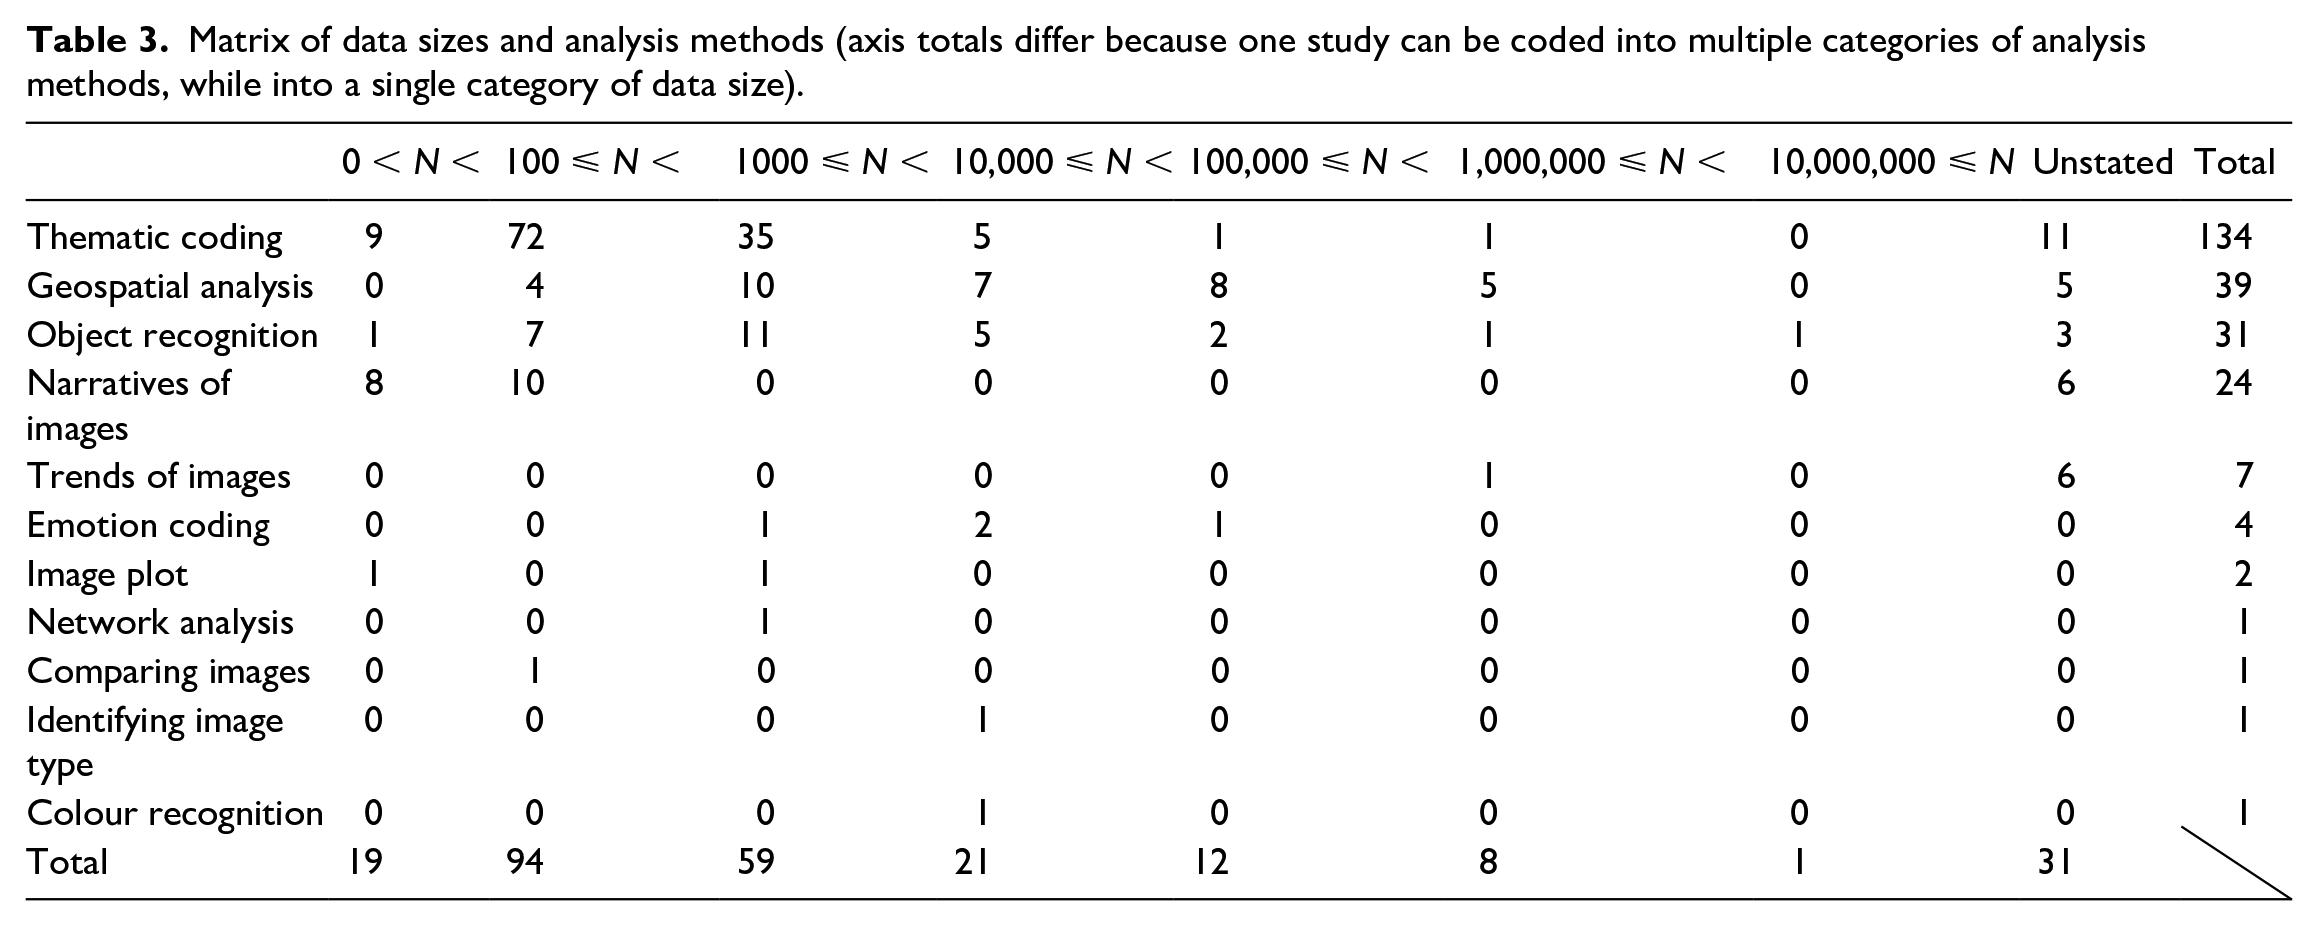
Manual methods of collecting and selecting valid data can limit the resulting data size, though this may be appropriate to many social research questions. Eight percent of the studies in our review analyse fewer than 100 images, and 39% use 100 to 1000 images (Table 3), which runs parallel to data sizes in conventional social science studies. Eighteen percent of the studies process more than 10,000 images, which is closer to common conceptions of Big Data. In between, 23% studies analyse 1000 to 10,000 images. Raw datasets can be huge when collected from social media platforms; thus, subsampling strategies are often used to reduce workload in the later coding and analysis process while reducing bias arising from variations in posting behaviour (e.g. Allem et al., 2019; Neumayer and Rossi, 2018). For example, Basch et al. (2019) retrieved 179,202 Instagram posts but only coded 300 images (the first 100 posts in each of the collection dates). However, 12% of the total 233 papers did not clarify how many images were analysed. This lack of clarity violates standards in conventional research methods, while introducing the new complexities of social media studies: (1) data size can be too large to identify the exact number – instead, an approximation is often considered adequate (Honig and MacDowall, 2017), and (2) scholars may only address how many posts they retrieved or how many users they collected data from (Yildiz et al., 2017).
Matrix of data sizes and analysis methods (axis totals differ because one study can be coded into multiple categories of analysis methods, while into a single category of data size).
Data analysis
Thematic coding is the most popular method used to analyse data sizes between 100 and 10,000 (58%, including deductive and inductive, as well as manual and automated methods), for instance, to understand feelings, values, experiences, emotions and attitudes (Table 3). For example, Carrasco-Polaino et al. (2018) coded Instagram images posted by non-profit organizations to describe the intention and tone of the messages (e.g. happiness, pain, distress, concern) and understand how the non-profits use social media as activism tools. In many cases, textual captions are important supplemental information when the image itself does not sufficiently reveal its message (Carrasco-Polaino et al., 2018) and is especially common for Instagram and Flickr (e.g. Marwick, 2015; Schreiber, 2017; Deng and Li, 2018). Approaches of annotating and describing images (narrative analysis, 10%) are mostly used for small datasets, such as Williams (2017) who read and annotated 639 Tumblr pages related to overweight people regarding their style of writing, clothing choices and references to body size and ethnicity, to understand their counternarratives against normative ideas about white thinness. Thematic coding and narratives of images are most often conducted manually (e.g. Farahani et al., 2018; Ging and Garvey, 2018).
Larger datasets can be noisy but carry important information at a collective level, providing insight on large-scale social issues if properly analysed. To use complete datasets, scholars may have to adopt machine-learning technologies, which are still relatively new to many social scientists and for use in such purposes. In this review, 22% of the studies take advantage of automatic analysis models, including spatial analysis models (e.g. kernel density), existing computer vision models such as Google Cloud Vision and Microsoft Azure Cognitive Service and/or self-built and self-trained deep learning models. However, 78% still rely on manual work. The most widely used method is object recognition (13%, including manually and automatically). For instance, Dávid-Barrett et al. (2016) coded profile pictures based upon the presence of humans and evident gender; the results presented the homophily of social media networks. Manual object recognition may be replaced by computer vision in the near future in social science research (Chen, 2019; Gosal et al., 2019; Koylu et al., 2019). Researchers also use geospatial analysis (26%) to show aggregations of data with which to interpret social issues. Some researchers map coded themes to show geospatial patterns (e.g. Ashkezari-Toussi et al., 2019; Koylu et al., 2019), while others use only the footprints of photos (e.g. Ghermandi, 2018; Sánchez-Querubín and Rogers, 2018). For example, Feick and Robertson (2015) extracted 54,522 geotagged Flickr images of Vancouver, Canada, to explore how citizens felt in urban environments based on whether users use tags of large-scale geographies or more specific local ones without coding themes from photo content. Image trends are explored in seven studies (3%), including (Levin et al., 2018) who charted Flickr photo trends in several countries involved with the Arab Spring conflicts. The trends show a decrease in geotagged images because tourists avoid these areas, indicating that such social media inactivity can help predict intense conflict. Emotion coding, used in four papers (2%), is also applied in large datasets. Ashkezari-Toussi et al. (2019) automatically detected people’s facial features in 56,766 photos to map the cities not only from the perspective of the popularities of a place but also from the evident emotions of people in the place.
Metadata of social media images can be a useful supplementary material, which is widely used and analysed (82% of the studies in our review). Textual data (28%) are most frequently identified such as textual tweets (e.g. Yadlin-Segal, 2017), and textual content of Facebook posts (e.g. Awan, 2017) and Tumblr posts (e.g. Gonzalez-Polledo and Tarr, 2016). Other types of textual material include photo captions (24%) and comments (15%). Textual data often help researchers to interpret photos when information is not obvious from the visual content. For example, Huang and Sun (2019) analysed Facebook posts to explore the risk-taking behaviour of some tourists through photos and written descriptions. They coded ill-advised activities, such as mountain climbing during a typhoon, from textual descriptions, and coded photos with careless behaviours like going near wild monkeys and drinking alcohol while mountain climbing (Huang and Sun, 2019). Seo and Ebrahim (2016) coded comments to Facebook posts by the Syrian President and by the opposition party to understand how the different themes of the posts encouraged audiences’ reactions.
Geographic metadata are utilized in 27% of the studies. For example, Chen et al. (2019) mapped Flickr data geotagged to the Greater London area during a specific time window, 1 January 2013 and 31 December 2015, and the concentration of data in a time series showed the changes of places of interest in the city. Geotags can also be utilized with other data, as demonstrated by Ashkezari-Toussi et al. (2019) who detected people’s smiles to map the emotion of the selected 12 cities around the world. Profile information is used in 24% of the 233 papers. Challenor et al. (2018) analysed adolescents’ profiles on Yellow, Instagram and Snapchat to identify their gender, age, private information sharing and emoji use. Fifteen percent of the studies use timestamps in analysis, such as Lam and Luo (2018) who leveraged timestamps of museum visit photos to analyse tourists’ willingness to revisit museums in Hong Kong, China. Other types of social media metadata identified in this review as used for analysis alongside images are hashtags (9.9%), numbers of likes (9.4%), tags (9%), URLs/hyperlinks (6.9%), videos (6.4%), reposts (5.6%), number of followers/followees (3.9%), status (1.7%) and number of tweets posted (1.3%).
Research gaps
We assume by the fact that the reviewed papers were all peer reviewed and published that the dataset sizes and analysis approaches used in the papers were adequate to meet the researchers’ stated aims, but the paper aims may also be influenced or perhaps limited by the need to reduce data size. Big data, which include not only structured datasets (i.e. cross-tabulated transactional data) but also unstructured datasets (e.g. text, image, audio, video), are widely perceived as more meaningful if it is understood at a collective level. The ability to automatically analyse and gain real-time insight from various types of big data (including image data) would inform many aspects of our lives and organizations (i.e. data-driven decision making; Sheng et al., 2017). However, the frenzied proliferation of social media data has not benefitted image-based research as much as textual, which prevents us from making full use of big social media data. Social scientists are not typically confronting large volumes of social media images, perhaps because it is unnecessary, or perhaps because they are not sufficiently equipped financially or in terms of training. Manual processing is often money- and time-consuming when researchers are dealing with photographic data. Using Cortese et al. (2018) as an example, coding 5721 profile images required six well-trained coders to work for 3 months, even though the categories were mainly judgements with binary answers, yes or no. Thus, many studies reduce data size through approaches such as randomized subsampling, narrowing to a shorter data collection time window or limiting keywords (hashtags) to retrieve data (e.g. Neumayer and Rossi, 2018; Szabo and Buta, 2019). Some other studies processed and analysed big data by leveraging machine power (e.g. Google Cloud Vision), hiring digital labourers (e.g. crowdsourced workers of Amazon’s Mechanical Turk service) or only using the metadata of the images (e.g. Gosal et al., 2019; Tsou et al., 2016). Existing automated tools are not easily designed or trained for the diverse purposes of social scientists.
Although there is an increasing interest in the area of machine learning and computer vision, a steep learning curve is still an obstacle for social scientists to fully leverage the technologies. Machine learning can help to reduce significant manual labour; however, automatic analysis models can have high error rates (Gosal et al., 2019; Kim and Kim, 2018; Redi et al., 2018; Zhang et al., 2019). Errors in analysis are due to multiple causes not discussed in detail here: issues with the training data (e.g. unbalanced, incorrectly labelled, not representative, bias), the algorithm (over-fitting, bias, uncertainty, lack of explainability) or the general challenge of photo quality, in training or sample data (blur, distortion, lighting, cropping).
When a research topic is related to complex social issues, the themes are difficult to symbolize and detect (Zhang et al., 2019). Also, most of the papers in this review either base their auto-analysis method on existing models or do not explain the model-building process in detail, resulting in a ‘black box’ that is difficult to understand or critique. For example, Ashkezari-Toussi et al. (2019) used an existing model EmoDetect to evaluate emotions in photos and applied the Keras library (a popular library in artificial neural networks and convolutional neural networks) to get information about gender and age, but did not fully clarify the mechanism or algorithm. Conversely, a paper that pays much attention to the technical part of the method may also make it inaccessible to many social science audiences. For example, Koylu et al. (2019) provide mathematical formulae and algorithmic detail when using the You Only Look Once (YOLO) network to detect the presence of birds near human activity patterns in 19.7 million Flickr photos. Background knowledge in computer science or more collaborations with computer scientists may help social scientists to leverage machine learning in processing and analysing larger datasets, but this is not intended to dismiss well-designed ‘small data’ methods.
There is also a research gap in ways to reduce data noise, which is a prominent obstacle in collecting valid and relevant data as well as in accurately interpreting them (Qian and Heath, 2019). For example, geotags have been ubiquitously used in geospatial analyses in urban planning, landscape, tourism, ecosystem and environment research but are often not attached to all social media images and can also be tagged incorrectly and imprecisely (Walden-Schreiner et al., 2018). Social media platforms are increasingly privacy-conscious, and searching for social media data based on location is becoming more restricted. The difficulties around distinguishing between locals’ and visitors’ posts on social media have been perplexing researchers and creating new methods for data cleaning (Chen et al., 2019). Lam and Luo’s (2018) study provides a possible solution: the differences in the timestamps of photos geotagged in Hong Kong posted by the same user may be an indicator of whether or not the user is a local. Improvements in such methods, likely also leveraging machine learning, will make it easier to use social media data in social science.
Biases and challenges of using social media image data in social science research
Biases
Sixty-one percent of the studies explicitly discussed the biases involved with using social media data. First, findings from social media research may not apply to the general public (Szabo and Buta, 2019), because the datasets naturally lack information from people who do not use social media (Chen et al., 2019), who set their accounts as private (Huang and Sun, 2019; Nikjoo and Bakhshi, 2019) and who lack Internet access, all the time or under certain circumstances such as when travelling (Paül i Agustí, 2018). User demographic information is often missing, incomplete or feigned, which also limits the capacity for generalization (Chen et al., 2019). Within images, especially selfies, researchers may feel that they can recognize some characteristics such as gender, age, race and ethnicity; however, such personal judgements are highly subjective (Szabo and Buta, 2019). Platform bias is also widely discussed in many papers, noting that different platforms attract different populations, such as Instagram for documenting daily life and Flickr for travelling and amateur photographers (Samany, 2019; Zhang et al., 2019).
Many social topics are quite complex, which challenges scholars to extract meaning from passively sourced data like social media images (Casas and Williams, 2019; Chen, 2019; Holiday et al., 2019). Researchers’ subjectivity and self-selection and other biases can affect the data collection process of social media research as well as conventional research methods such as surveys and interviews (Bergeron et al., 2014; Himelein, 2015). But the biases differ. Conventional methods are biased by who decides to participate and how they respond to the researcher(s), but the researchers can design the methods to get precisely what they need, including asking, for instance, why a photo was taken. Social media images often come without such explanations, but the data are also not influenced by the researcher beyond how they glean them (Keskinen et al., 2019). Either way, when interpreting and reporting the findings, the subjectivity of researchers raises questions: What do they see in the image? What hidden information are they unable to see? What information do they think they have seen but is not there or not deliberately shared by the creator? The process of self-presentation online varies from person to person, making it virtually impossible for researchers to truly understand every individual’s experience, particularly cross-culturally (Qian and Heath, 2019; Redi et al., 2018; Yockey et al., 2019). The solutions to these subjectivity-related biases may point to the use of complementary data embedded in photographic data, such as the metadata of social media images, and/or triangulating with conventional methods. Additional pieces of a photo post on social media – such as its textual caption, geotag, hashtags, timestamp or comments – will tell a more robust story together.
Challenges on ethics, privacy and copyright
Ethics, privacy and copyright issues are controversial when using social media data for research purposes, raising questions of what data to use and how to use them (boyd and Crawford, 2012; Kozinets, 2015). In this review, 50% of the papers present at least one social media image example; however, only 23% of them mention or clarify how they considered and dealt with research ethics. Studies describing ethics approvals typically also directly engaged participants in addition to using social media data, and the review was focused on the more conventional methods (e.g. interviews). Most other studies did not undergo research ethics review on the grounds that the data were retrieved from public accounts or platforms without any direct contact with (or consent from) participants (e.g. Bogolyubova et al., 2018; Ging and Garvey, 2018; Gregory, 2015; Keskinen et al., 2019). This is consistent with current research ethics guidance in most jurisdictions with which we are familiar.
Yet the lack of requirement for research ethics review does not mean there are no ethical concerns. Have participants been fully informed about what information others can access about them, how the information can be used and with what consequences (Acuti et al., 2018)? Social media data can provide access to the public-facing thoughts and perspectives of a community without research ethics review, including historically marginalized groups who would otherwise have specific protections and which may require particular expertise to understand and analyse in context (Hoffmann and Jonas, 2017; Zimmer, 2018). For instance, Bogolyubova et al. (2018) collected Instagram posts related to psychological distress but claimed that ‘the study did not involve contact with human participants, and no personal data were collected’ (p. 3). These posts are coded by categories like human figure, human face, group of people and body part, all of which may be deeply personal. Although the authors do not show any example posts in the paper, claims of ‘no personal data’ may still be problematic in terms of analysis and storage.
A further complicating factor is image-based copyright issues, which create a dilemma: ‘to name or not to name’ (Kozinets, 2015: 145). If the image is intellectual property, users should name the creator (Borges-Rey, 2015); if they treat it as a piece of data, they often avoid mentioning the name in order to protect the user (Cortese et al., 2018).
Reviewed articles do apply strategies to protect users’ privacy by avoiding the disclosure of identifiable details. Anonymizing or deleting personal identifiers are the most common approaches reported (e.g. Barhour and Heise, 2019; Sandel et al., 2019). However, merely implementing this strategy may not completely remove all threats to privacy. Using Sandel et al. (2019) as an example, authors blurred the account names of WeChat users while leaving the names of discussion groups and profile images visible. Some other authors are more cautious by not showing any image examples or hiding profile images and any faces appearing in the photo examples (e.g. Commane and Potton, 2019). Even so, textual contents can also allow a person to identify the original accounts. For example, Kalim and Janjua (2019) show screenshots of several Facebook posts where they cover the users’ names and profile images but present the complete texts and images (without faces). It is possible to trace back to the original users by searching the text. As a solution, some researchers decide not to show any textual content from the dataset and/or paraphrase texts used as quotes in the paper, which may better anonymize users (e.g. Barhour and Heise, 2019; Mayoh, 2019). In addition, concealing the data retrieval location reduces the risk of identifying the source and posters, such as data that are collected from a specific discussion group or page (e.g. Enverga, 2019).
The most cautious way to use social media data is to obtain informed consent from the users, as do Nikjoo and Bakhshi (2019) who asked permissions for all the tourists’ photos used as examples in their paper (as well as in Matley, 2018; Veum and Undrum, 2018; Williams, 2017), an approach that does not scale well to larger datasets. There are other interesting ways to protect users’ privacy. Basch et al. (2019) printed Instagram posts and discarded them after compiling the data; the final paper did not contain post examples or quotes from the dataset. Choi and Lawallen (2018) only collected images without any metadata like users’ names, texts, geolocations, timestamps and so on. Zappavigna and Zhao (2017) applied an image processing filter to produce an outline sketch of the photos to preserve meaning without identifying individuals. The substantial variation in how researchers approached the privacy of social media image data suggests this method merits additional scrutiny from research communities.
Limitations of this review
This review screened 2349 papers for possible inclusion, but there is no guarantee of completeness. We established a protocol for the review a priori and established the data sources, inclusion and exclusion criteria, and the key variables of interest. As a result of these scoping decisions, this review has several limitations: (1) the Scopus database does not include all relevant literature and it may have publisher biases and its own classification system of social science research; (2) since only literature in English is searched, there is an unexplored area of studies published in other languages; (3) the search keywords are limited to ‘picture’, ‘photo’, ‘image’ and ‘selfie’ only, which – while they dominate the kind of research of interest – may reflect our own subjectivity and may exclude relevant papers that do not contain these words in title, abstract or keywords; and, finally, (4) works are excluded from this review if they were not regular empirical research papers. These limitations are inherent to the protocol we established a priori and are designed to ensure transparency and replicability. Scoping review protocol definition is designed to reduce reporting bias but does not ensure completeness. Future reviews could consider broader searches in additional databases, a broader set of search keywords and the use of translation services to identify additional articles from the relevant time period.
Accounting for the limitations, this review achieves its goals of identifying recent developments and trends in social science research when using social media images to understand social issues, describing how scholars collect and analyse social media image data, and identifying the biases and challenges when using social media image data in social science studies.
Conclusion
In this article, we reviewed 5 years of Scopus-indexed social science research done using social media images as data. The results show recent developments and trends in this area. Data are often collected at continental or global scales due to a lack of physical barriers when compared with conventional methods. The most active disciplines to use social media images as data are sociology and cultural studies, communications, landscape and environment, tourism and politics. The most popular platforms for data collection are Instagram and Flickr; however, Facebook and Twitter are also widely utilized though they are not primary photo-sharing sites. A majority of articles rely on fewer than 1000 images. Small collections are preferred, not only because of the difficulties in analysing visual data at a large scale but also because the collection process is often conducted manually. The analytical methods widely identified are thematic coding, object recognition and narrative analysis, which are also commonly conducted manually. Machine-learning and computer vision technologies are also increasingly applied. Other types of social media data are also frequently used in interpretation such as text, geotags and profile information.
Scholars are worried about the generalizability of their research findings because of the bias in terms of the skewed online population, the lack of demographic information, data noise and the inevitable subjectivity when interpreting data. Ethics, privacy and copyright issues are ongoing challenges of social media data used in social science. Strategies applied to minimize the risk of privacy erosion included not showing image examples, anonymizing users’ accounts, hiding IDs and profile images, and paraphrasing text. Future studies may explore how to eliminate cultural barriers when interpreting cross-regional data, fully exploit the content of social media image data, develop better data mining tools and more accurate image auto-coding models, integrate different types of social media data to tell a more complete story to understand social issues, and legally and ethically use social media data.
Footnotes
Acknowledgements
The authors thank Christine Donnelly Moan and Simon Couper for assistance editing this paper.
Funding
The author(s) disclosed receipt of the following financial support for the research, authorship, and/or publication of this article: Funding for Y.C. was provided by the Social Sciences and Humanities Research Council of Canada through Insight Grant 435-2018-1018, 2018–2022 (M.S. and K.S. as investigators), and an NS Research and Innovation Graduate Scholarship (2018–2022).