
Abstract
The article presents the use of selected machine learning algorithms for the detection, classification and assessment of the degree of wear of the main components of an axial multi-piston positive displacement pump. The first part of the article describes current work on diagnostic systems for positive displacement pumps. The authors then present their own diagnostic tests of the object (multi-piston pump), equipped with a damage models of its main components. Based on the obtained signal matrices, the statistical characteristics of the signals are calculated. The next step is to use available machine learning classifiers to detect the type of damaged pump component and assess its degree of wear. Then, using Matlab programme, models are developed to classify the wear condition of the pump. Using the adopted criteria, their effectiveness in recognising the modelled pump damage is assessed.
Introduction
Hydraulic drives and controls are used in many fields of technology.1,2 Hydrostatic drive is used in mobile machines, i.e. in construction and agricultural machinery. In heavy industry, power hydraulics are used in press systems, rolling mills, foundry pressure machines, and mining. Maintaining the operability of hydraulic systems usually requires monitoring of the physical parameters of their main components (including positive displacement pumps). This is the primary task of maintenance engineering. Well-planned and conducted monitoring of machines with hydraulic systems allows for earlier determination of the state of development of system elements, thus facilitating the possibility of carrying out maintenance work in a planned manner, preventing the occurrence of failures and downtime caused by it. In the field of hydraulic drive diagnostics, there are three basic methods. 3
The first method is the model-based diagnosis method. 4 It involves developing a mathematical model of the diagnosed system (e.g. a positive displacement pump), which estimates state variables representing the current technical condition of the system based on known input signals (controls, disturbances) and output signals (measurements). An example of this method in pump diagnostics is the use of a Kalman filter 5 or an extended Kalman filter6,7 as a state observer. In the paper, 7 this approach is presented as an effective tool for detecting leaks in the rotor of a multi-piston pump. In the article, 6 the Kalman filter was used to monitor the efficiency of the triple screw pump. In the works,8,9 the adaptive Kalman filter algorithm was used to monitor the efficiency of the hydraulic manipulator and to detect leaks in the piston of the hydraulic cylinder in its control system.
The second method uses time and time-frequency analysis of signals characteristic of a given process, i.e., pressure signals, flow rates, and/or additional signals from its operation (e.g., vibration signals, thermal signals, or acoustic emission). The paper 10 presents the possibility of using the change in the mean square value (RMS) of the periodic amplitude of the Fourier transform11,12 of the vibration signal in monitoring the development of abrasive wear of the valve plate of a multi-piston pump. On the other hand, the use of the Wavelet transform to detect the modelled hydraulic cylinder malfunction (wear of the seals of the cylinder rod) is described in the article. 13 The issue of using the Hilbert-Huang transform (HHT) to detect internal leakage of a hydraulic cylinder is discussed in 14. In turn, the paper 15 discusses the use of improved adaptive morphological analysis of vibration signals (IAMMA) for the demodulation of damage signals of the piston shoe of a multi-piston pump.
Another (third) group of systems used to diagnose hydraulic systems are systems that use so-called intelligent fault identification methods. These systems use machine learning algorithms and layered neural network algorithms (deep machine learning algorithms), based on calculated features from measured diagnostic signals. In the literature, many articles can be found that describe the use of such systems in the diagnostics of hydraulic systems.16–18 The use of the SVM (Support Vector Machine SVM) algorithm to monitor hydraulic brake condition is described in 19. On the other hand, the paper 20 presents the possibility of detecting abrasive damage to the piston shoe of an axial multi-piston pump using the Extreme Learning Machine (ELM) classifier. In addition, the article describes and compares three methods of obtaining diagnostic features from the measured signals. The effective use of the Nearest-Neighbours K classifier to classify the life condition of a multi-piston pump is described in the article. 21 The use of deep learning to classify faults in axial piston pumps is presented in the papers.22–25 Using the Deep Belief Networks (DBN) architecture, a high accuracy of classification of the four most common axial faults of multi-piston pumps was achieved in this case. The precision of the classification was above 97 %. Device monitoring with a discussion of Deep Belief Network (DBN), Convolutional Neural Networks (CNN) and Recurrent Neural Networks (RNNs) is presented in the paper. 26
The application of a CNN adaptive neural network using features calculated using the continuous wavelet transform of pressure signals in pump diagnostics is presented in 27. According to the authors, the proposed method shows better performance in diagnosing hydraulic pump failures compared to other methods.
One of the most important elements in power hydraulics systems are multi-piston pumps.1,2 This is due to the properties of this type of pump design, i.e. operation at high and very high pressures, a wide range of changes in the output flow rate and the ability to control and regulate the main flow parameters by equipping pumps with appropriate actuators and regulators. The proper functioning of the entire hydraulic system often depends on their proper operation. The wear of individual pump components most often leads to a decrease in the operating pressure of the pump, an increase in volumetric losses, and consequently to a decrease in the overall efficiency of the pump. In our previous publications,21,24,28 we presented the results of tests obtained after many hours of operation of a multi-piston pump operating under static load with low oil cleanliness. This led to natural abrasive wear of some pump components (mainly the swashplate). In fact, the operation of a positive displacement pump very often takes place under the action of dynamic load (which changes in a non-periodic manner), which causes simultaneous wear of many components of the pump. In the research currently presented by the authors, the diagnosis of positive displacement pump failures is based on the use of previously prepared pump components with a known degree of damage. Combinations of the main components, i.e. worn valve plates, swashplates, and rotors (with varying degrees of wear), were models of typical pump failures. In this way, 10 combinations of pump failure models were obtained. The next pump failure models were subjected to bench tests recording signals measured under stationary pump operating conditions (after thermal stabilisation of the hydraulic system). It should be emphasised that the presented research (and its results) only concerns fixed displacement axial multi-piston pumps with a swash plate and cannot be generalised to other types of hydraulic drive pumps, such as gear, vane or gerotor.
The examples of conventional methods of diagnosing objects presented earlier in the article (such as the model-based method and time-frequency signal analysis methods) are usually characterised by insufficient accuracy in assessing the condition of the diagnosed object. In addition, the correct interpretation of the results obtained from time-frequency analysis of measured signals requires a certain amount of experience on the part of the person analysing them and is time-consuming. Another challenge is the need to use specialised and, in many cases, expensive equipment (sensors). Therefore, in this article, authors presented the possibility of using machine learning 21 and the neural network developed by them in their previous work 24 to classify the wear state of a multi-piston positive displacement pump. In engineering applications, machine learning systems have many advantages, including the ability to build a system with good classification accuracy using a reasonable amount of training data and short training times of the developed diagnostic models. From the very beginning, it was assumed that the teaching system would be based on measures (features) from vibration signals measured in characteristic places of the pump casing and additional signals from static and dynamic pressure and flow rate transducers installed in the discharge port of the pump. The selection of features (statistical measures) that were calculated from the measured signals and the subsequent ranking of their significance in the classification of pump wear was carried out using MIMR analysis (minimum redundancy-maximum applicability). 29
Object of research
The object of the study was the design of an axial multi-piston positive displacement pump composed of components with a known degree of damage. The design and operation principle of axial multi-piston pumps are widely known.1,30,31 In this type of pump, the wear of its elements is caused by both the forces that occur during the cooperation of its individual parts forming kinematic pairs (e.g., piston-cylinder, valve plate - rotor, piston shoe - swashplate) and inappropriate operating conditions of the pump, m.in.: exceeding the nominal operating pressure of the pump, operation with too low viscosity of the working medium, lack or insufficient filtration of the working medium. 32
The most common type of wear and tear on positive displacement pump components is abrasive wear. Excessive load on the rotor assembly leads, in other words, to abrasive wear of its components and to an increase in the radial clearance in the piston-cylinder pairs. This results in increased volumetric losses and reduced overall pump efficiency.
The friction between the rotor piston shoes and the front surface of the swashplate,33,34 caused by the loss of the lubricating layer, leads to abrasive wear of their surfaces. This results in the formation of an elliptical groove on the surface of the swashplate (Figure 1) and abrasive wear of the front surface of the shoes. This results in a reduction in the mechanical and hydraulic efficiency of the pump. View of the pump’s swashplate disc: (a) correct swashplate, (b) worn swashplate.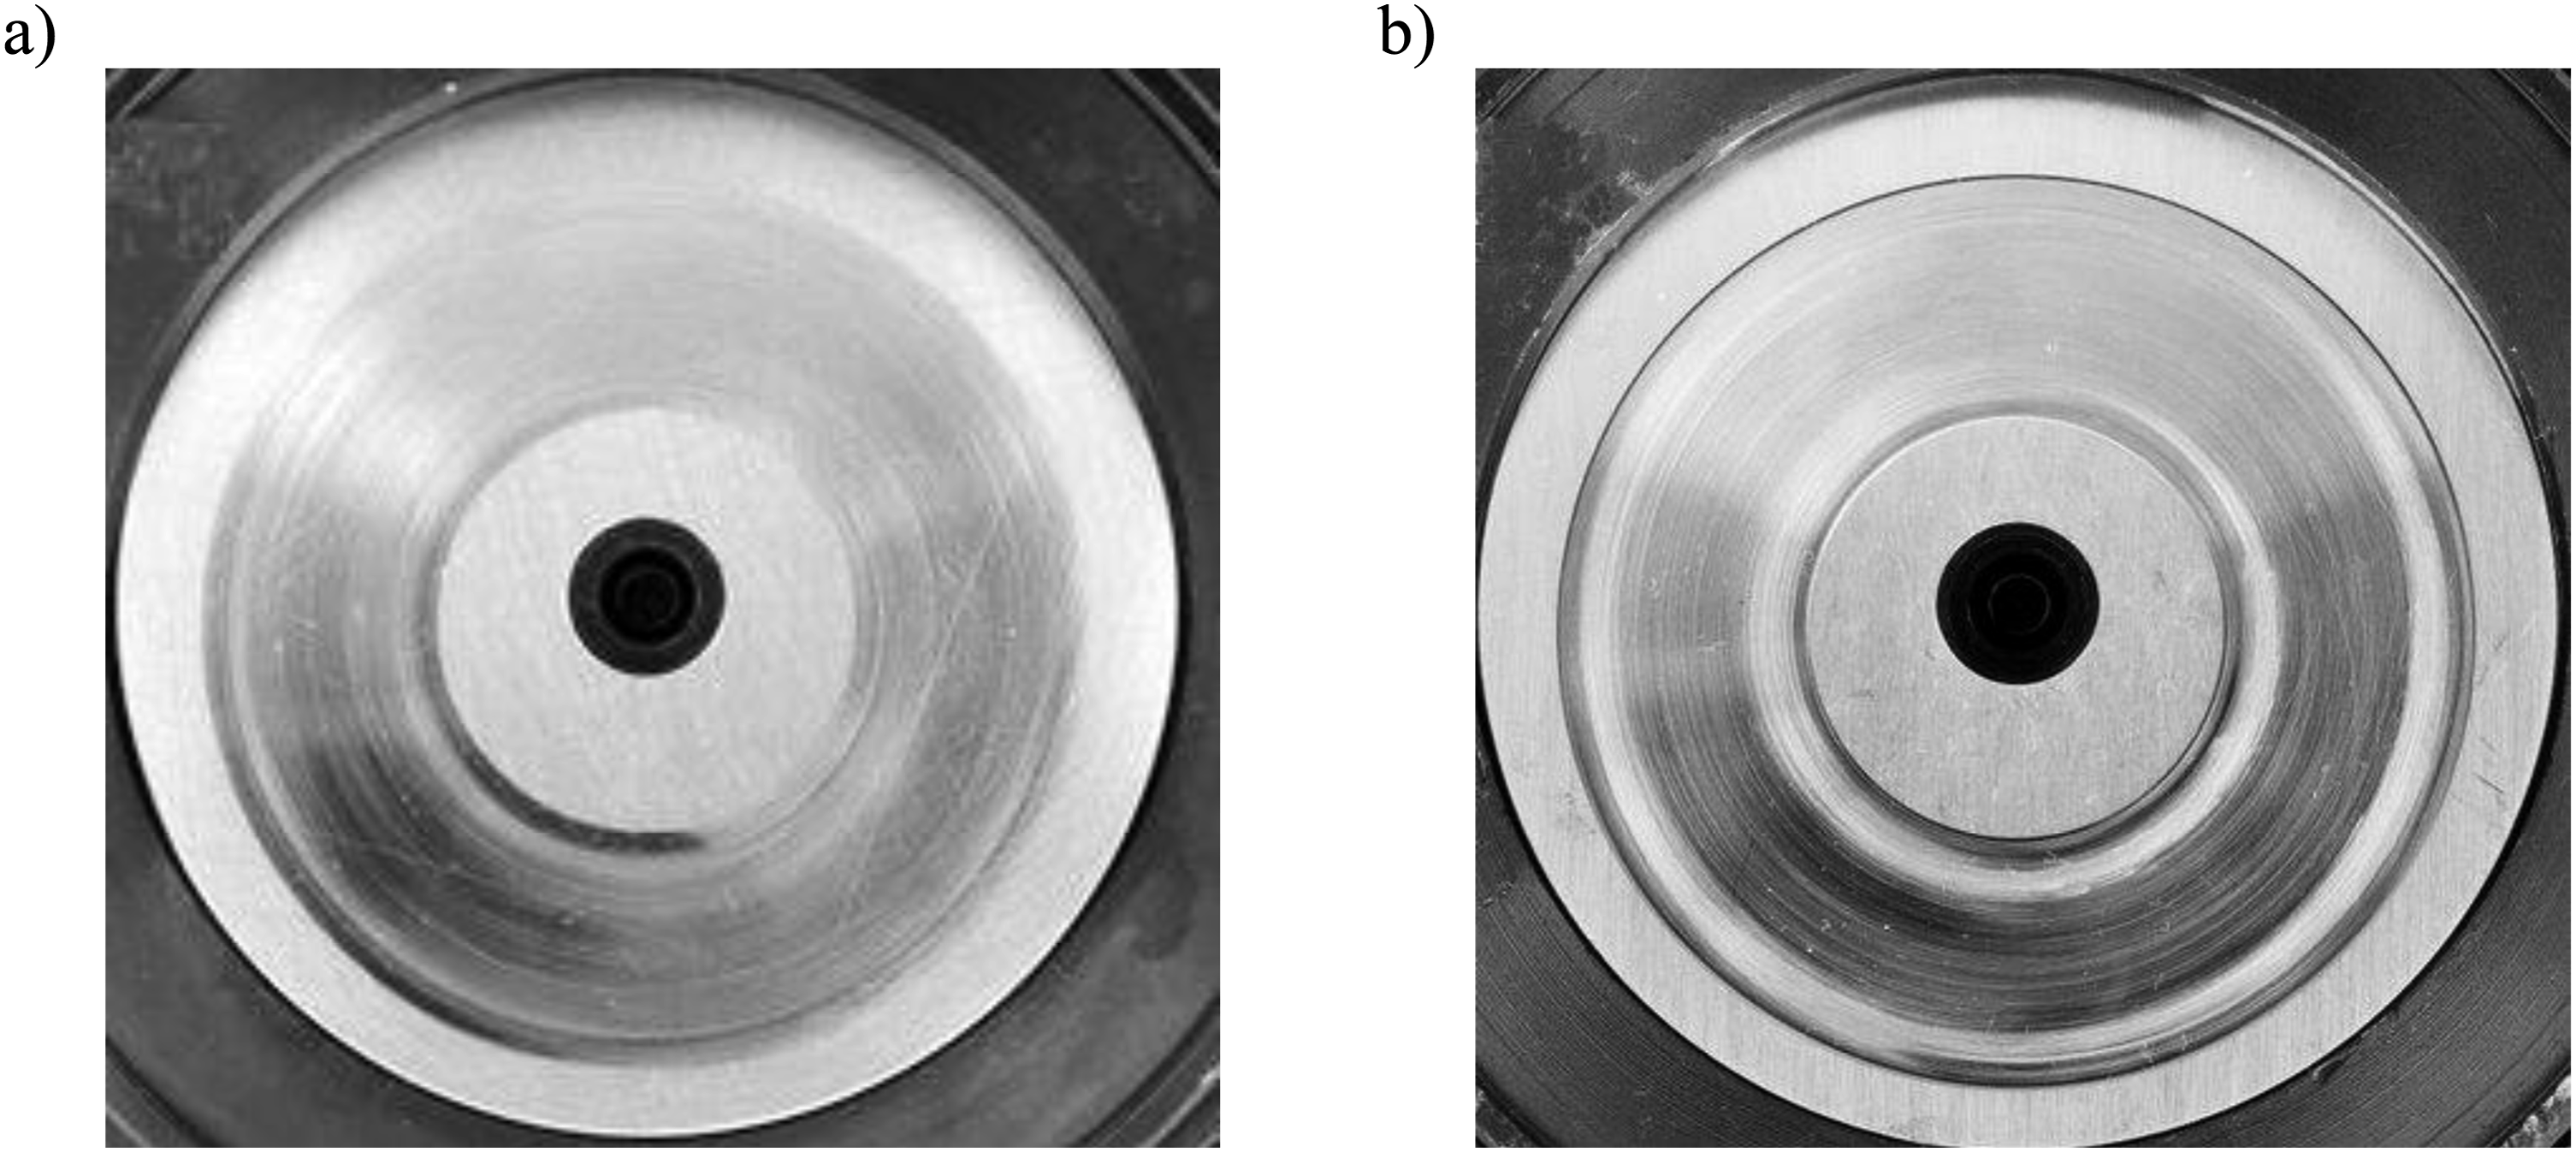
In turn, the development of valve plate wear is caused, among other things, by the disappearance of the lubricating layer between the disc surface and the rotor face surface. The result of this wear is the appearance of micro-flow channels (Figure 2) on the surface of the disc bridge and the rotor face (Figure 3). The resulting ducts cause the flow of the working medium between the suction and discharge zones of the pump, causing a lack of tightness, a reduction of operating pressure, and the volumetric efficiency of the pump. View of the worn valve plate. View of the abrasive-worn rotor: (a) rotor face, (b) view of wear depth.

Course of research
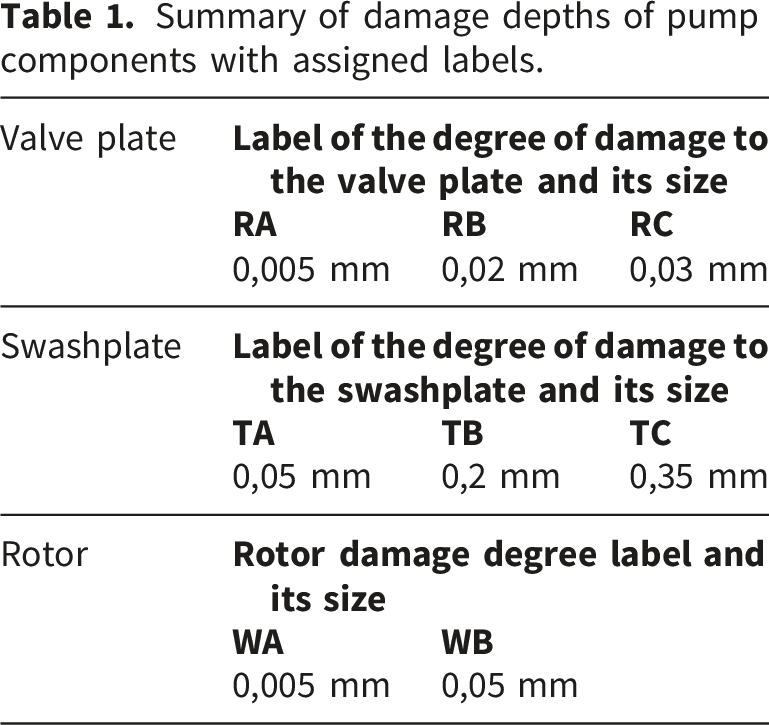
Summary of damage depths of pump components with assigned labels.
List of combinations of damaged components in the tested pump.
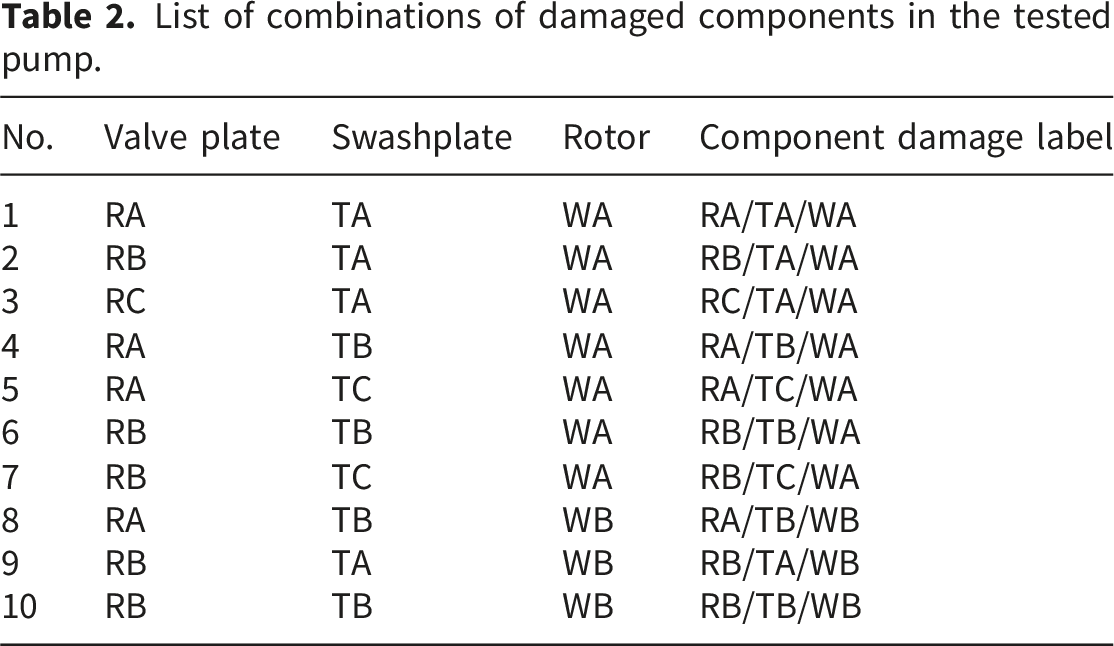
The pump tests composed of elements with a given failure combination according to Table 2 were carried out on a measuring stand. The simplified diagram of the laboratory bench is shown in Figure 4. Experimental tests were carried out under stationary operating conditions of the system, i.e., at a stabilised temperature of hydraulic oil (50 degrees Celsius) at a static pump operating pressure of 70 bar. Simplified diagram of the laboratory bench: P – tested pump with modelled damage, Q – flow meter, Zb – safety valve, Zd – throttle valve, Zo – shut off valve, Fs – drain filter, n – tachometer, Ps – static pressure transducer, Pd – dynamic pressure transducer, Vi – vibration transducers, M – manometer, T-temperature transducer.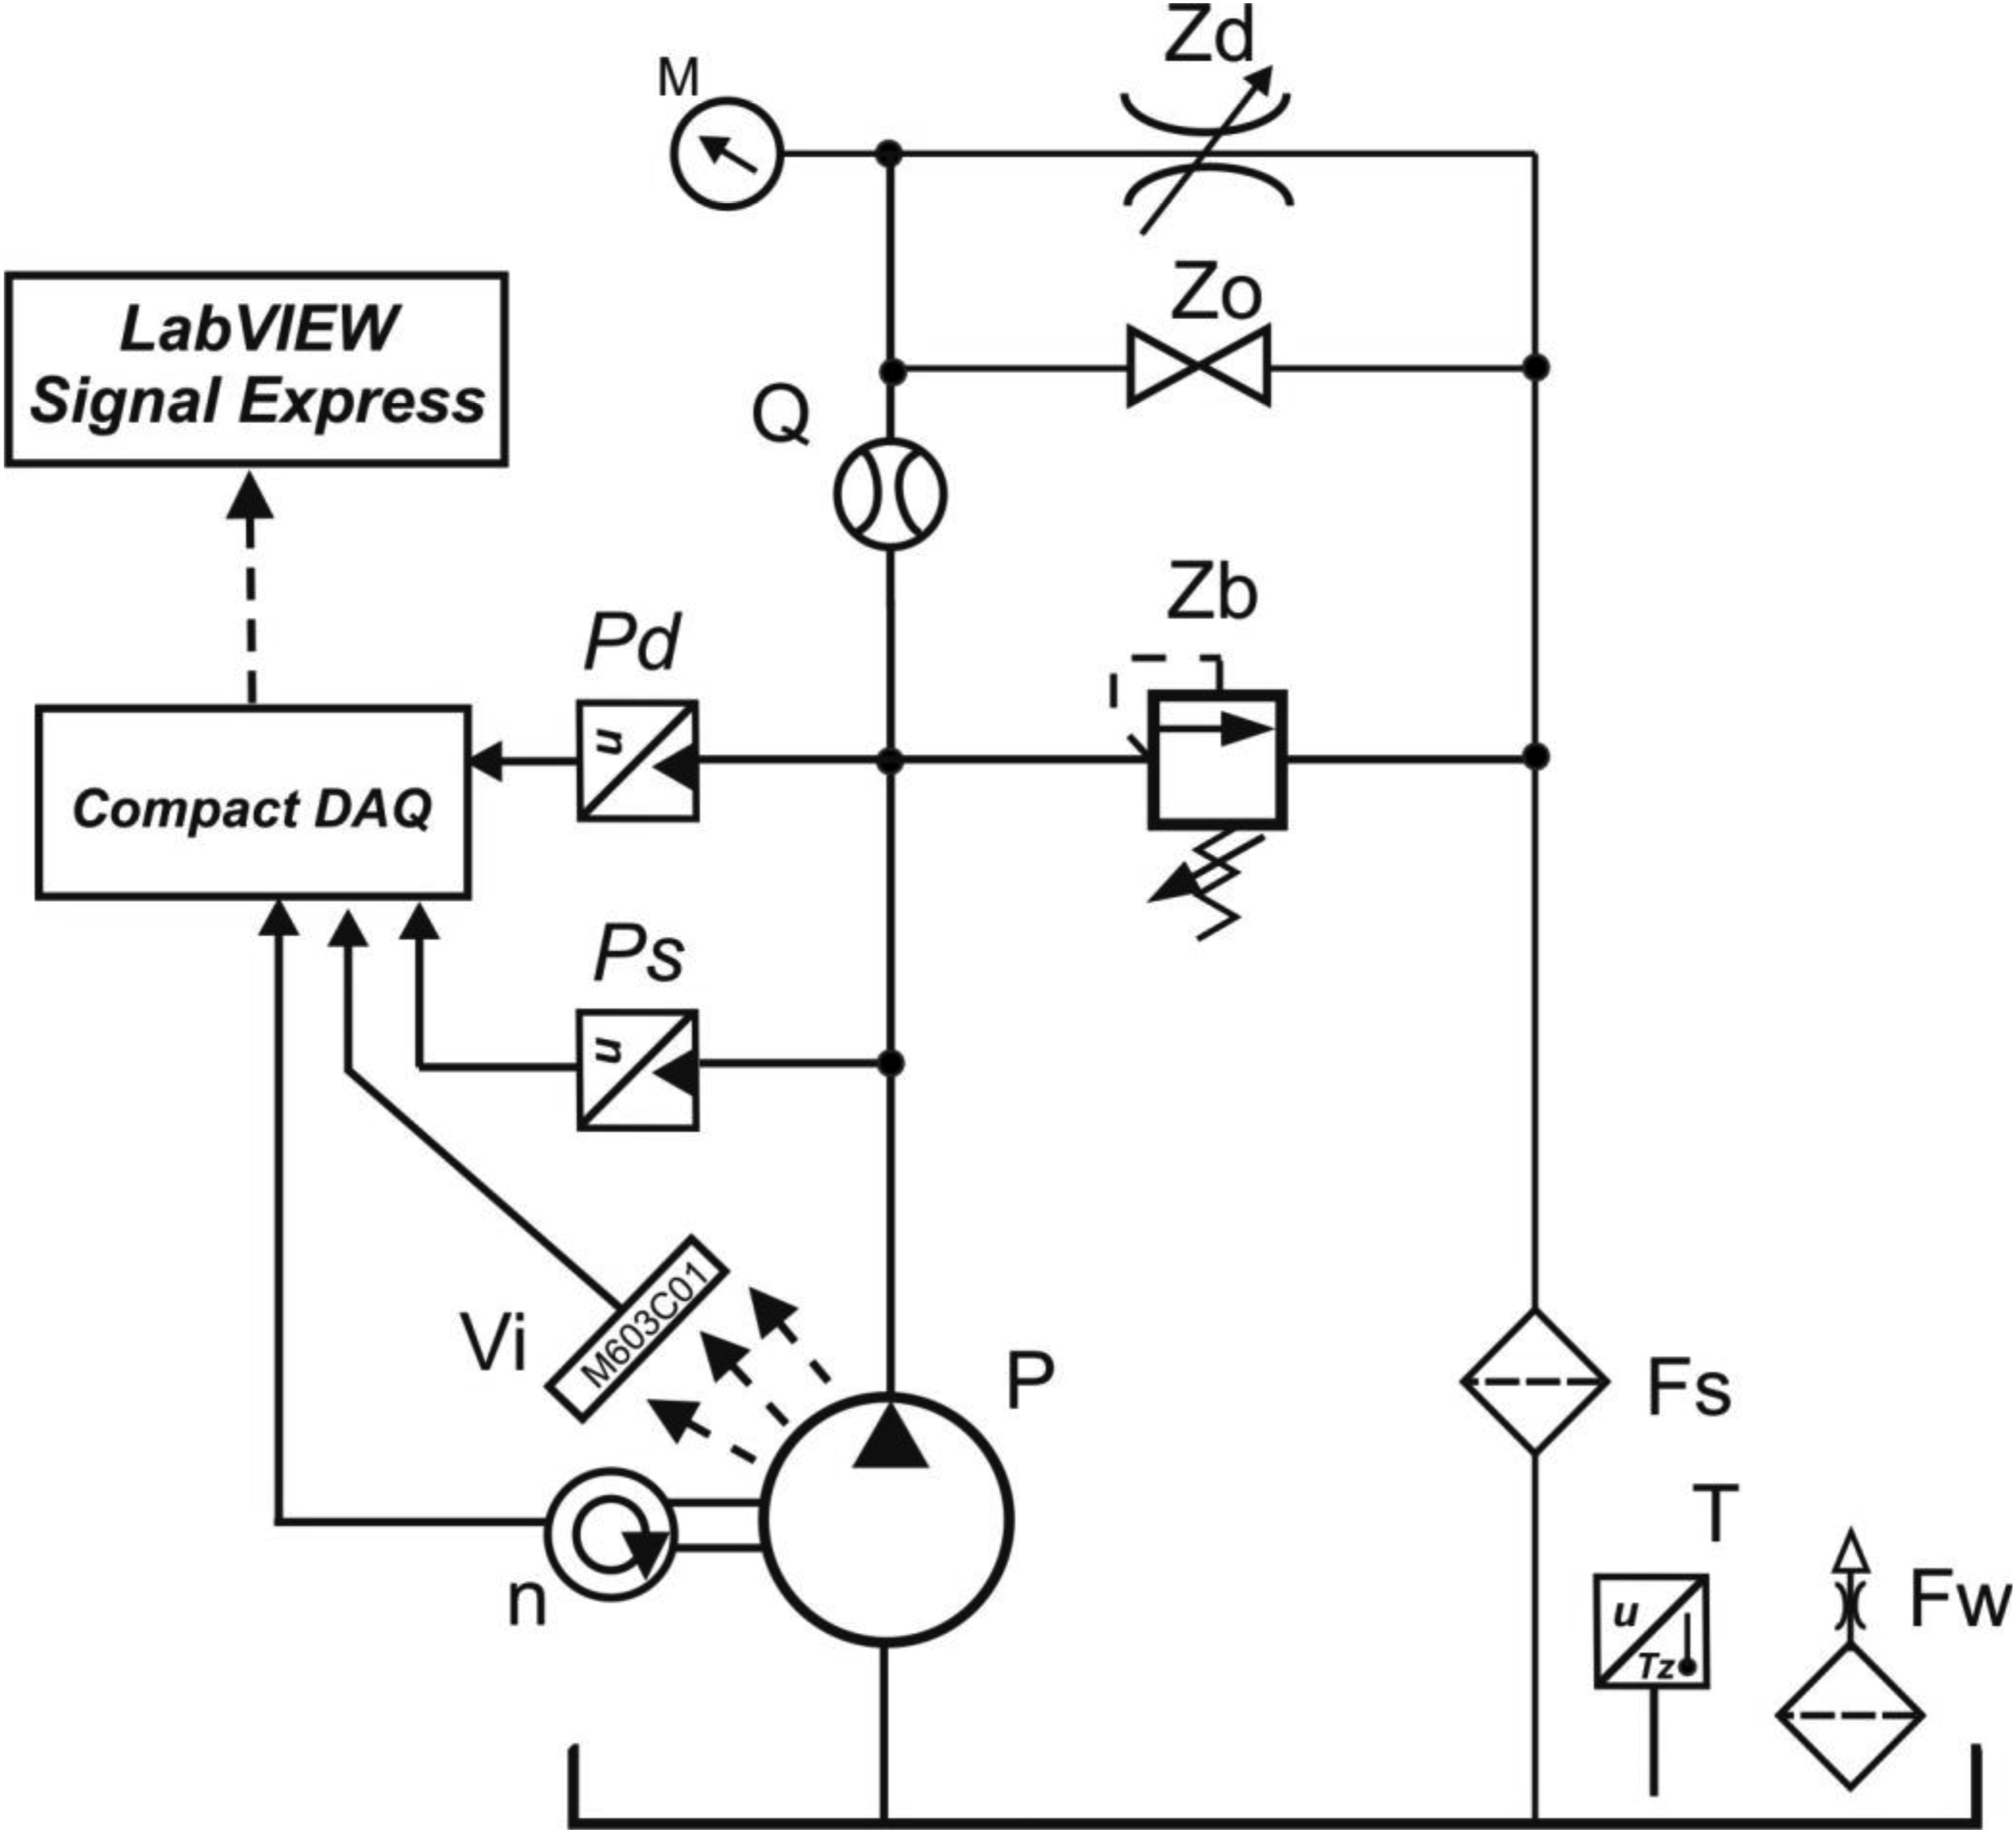
During the research experiment, diagnostic signals were recorded on an ongoing basis, which consisted of operational signals measured in the pump’s discharge connection, i.e., oil flow rates and static and dynamic pressure waveforms. Thanks to the installation of vibration transducers 36 in specific locations on the pump body (i.e., directly where the worn pump components are mounted), the acceleration of the pump body vibrations was also recorded in three measurement directions (X, Y, Z). Displacements and vibration velocities in the axis of the pump shaft (in the Z direction) were additionally measured using a laser vibrometer. The sampling frequency of the signals was 40 kHz.
The block diagram of the measurement signal acquisition system together with the combination of the measurement transducers used is shown in Figure 5. Block diagram of the measurement system with the measurement signal acquisition system.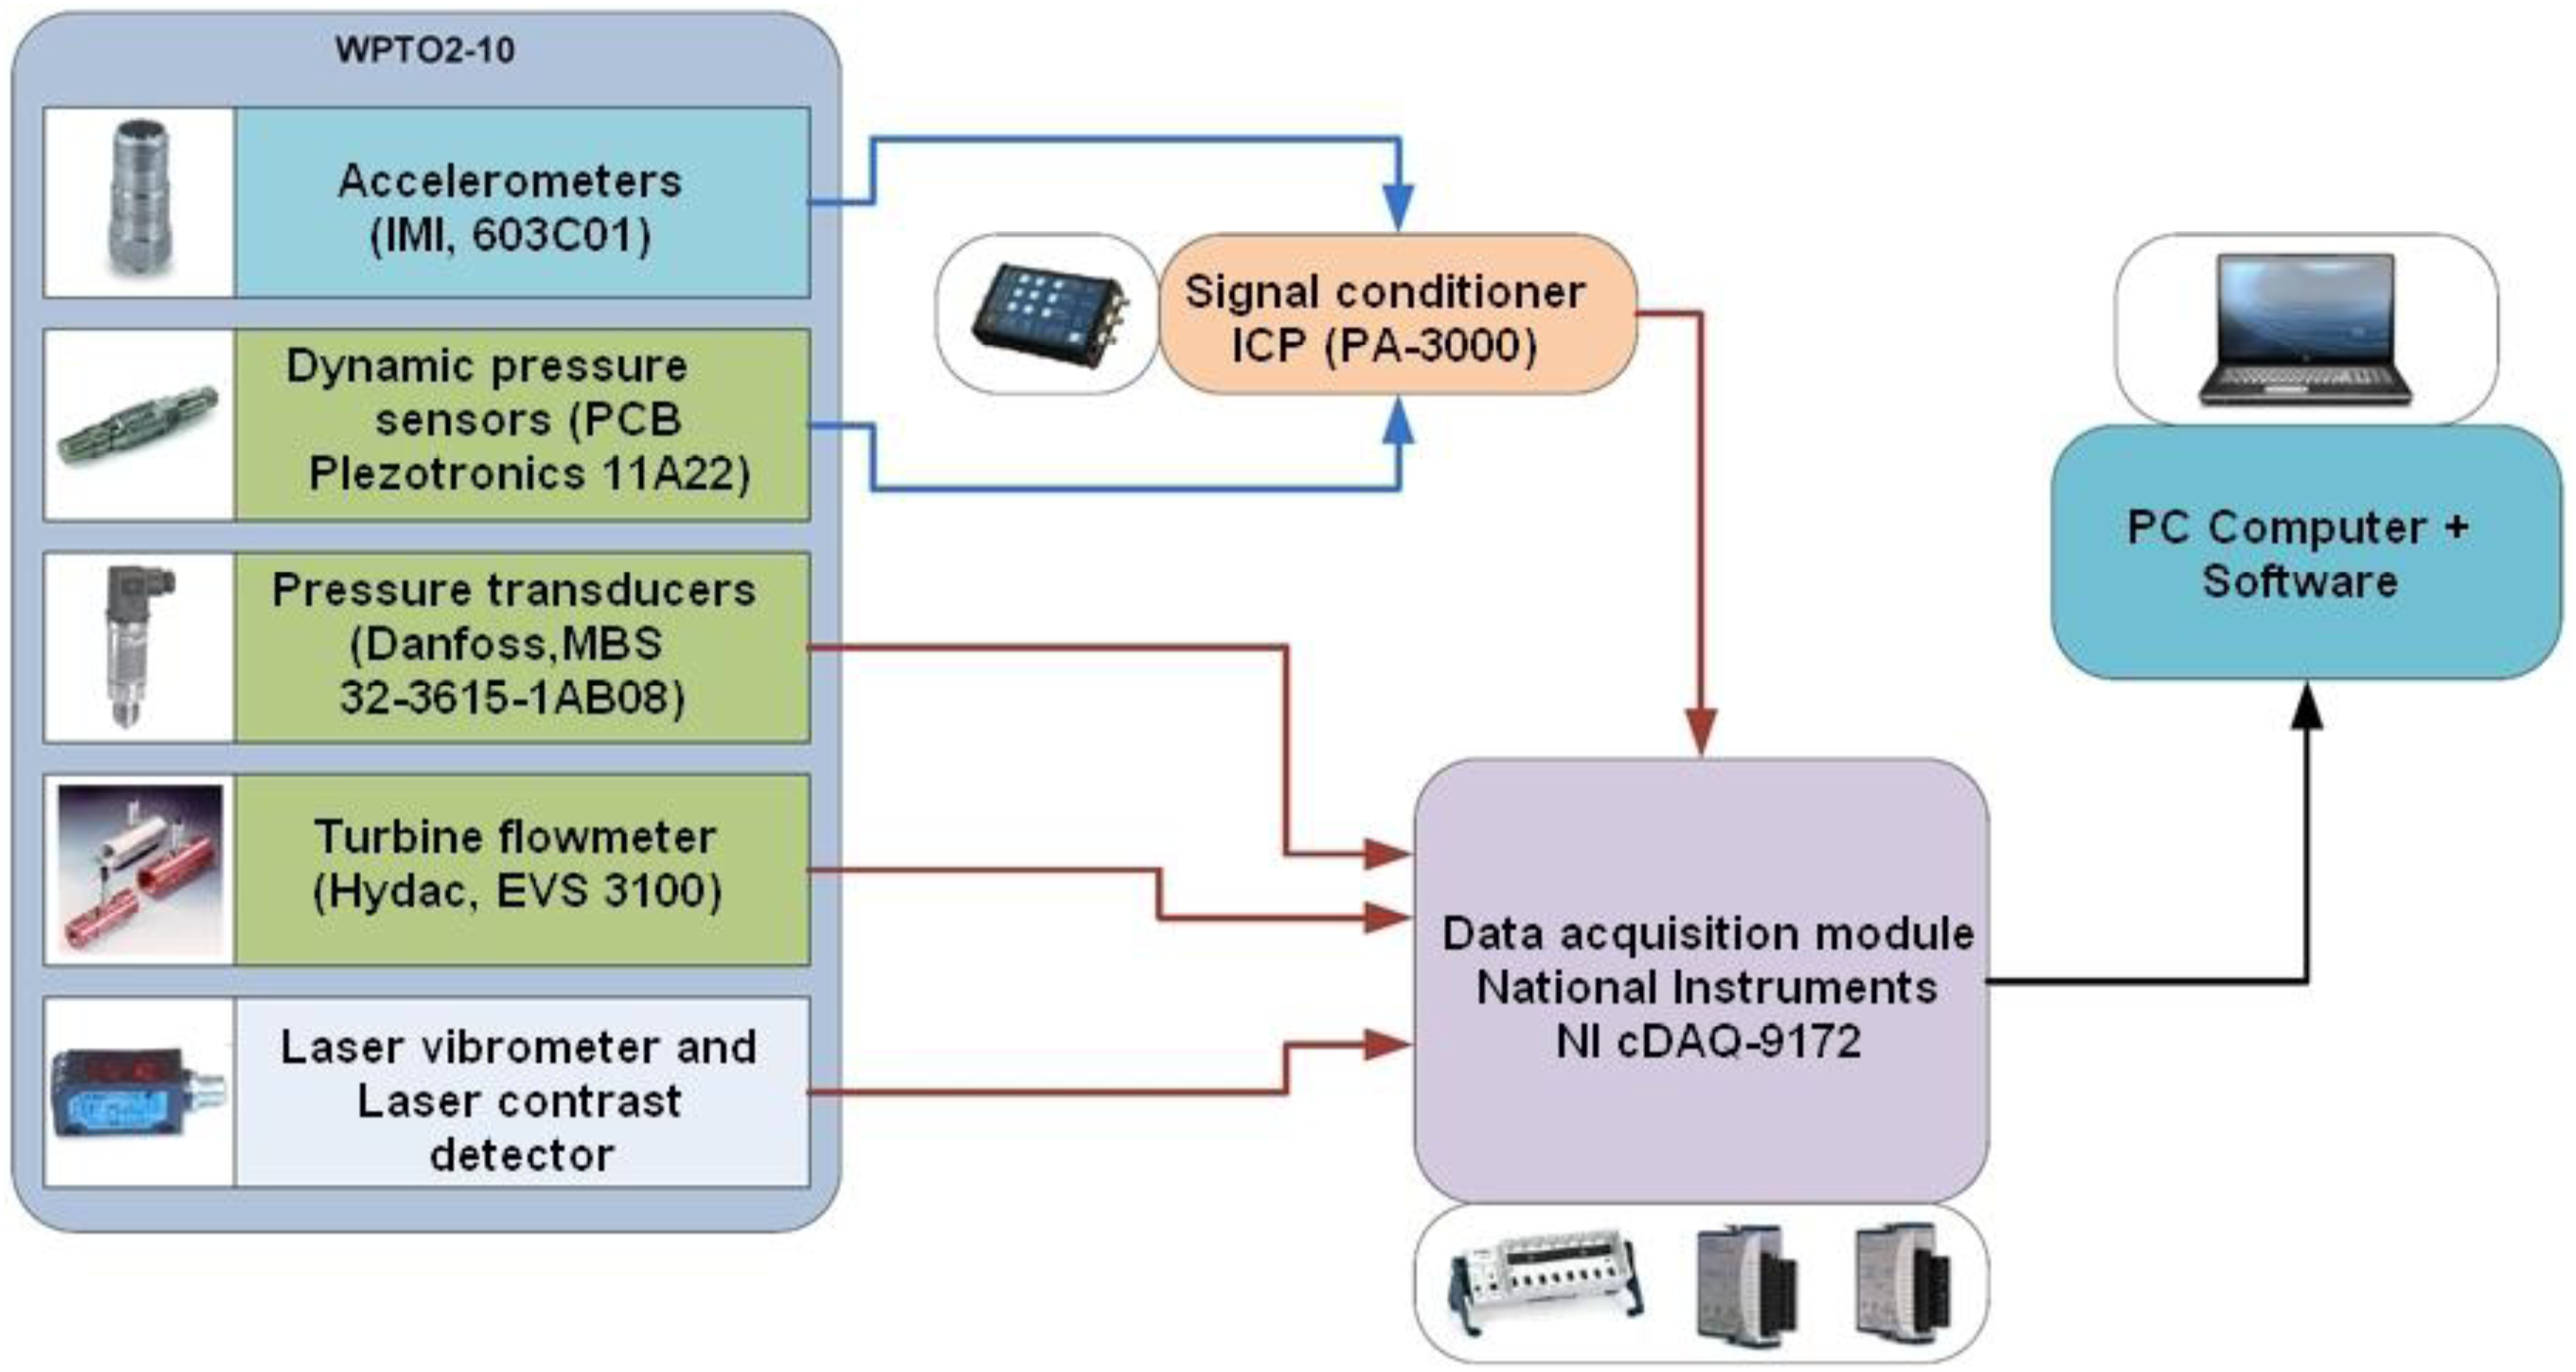
Taking advantage of the fact that during the measurement of the signals, the signal of the pump shaft speed marker was also measured, each of the recorded signals was divided according to it. In the case of pump operation at nominal rotational speed (n = 1500 rpm), 25 divisions were obtained from a signal of 1 second. In this way, arrays of signals with the length of one revolution (i.e. with a duration: 0.04 s) were obtained. During the experiment, signals with a length of 20 seconds were recorded. Which, after averaging them according to one revolution, gave a signal matrix with 500 waveforms for each fault combination planned according to Table 2. In total, for the 10 combinations of pump failure presented in Table 2, a matrix of 5000 signal waveforms was obtained, intended for later analysis.
An example of time-frequency analysis of vibration signals, measured and averaged for one revolution of the pump shaft during the development of damage to the swashplate disc (which is associated with the gradual deepening of the elliptical notch) is shown in the figures below.
The analysis of the short-time Fourier transforms (STFT) images obtained in axes X and Y (Figures 6 and 7) indicates that as the swashplate wear increases, the signal spectrum gradually moves towards lower frequencies, and its amplitude increases. In the case of vibration signals from axis Z (Figure 8), there is no clear shift toward lower or higher frequencies, but there is a tendency to reduce the signal amplitude as the wear develops. STFT time-frequency representation of vibration signals measured on the pump body in axis X for (a) swashplate without the notch, (b) swashplate with notch 0.1mm deep, (c) swashplate with notch 0.5mm deep. STFT time-frequency representation of vibration signals measured on the pump body in axis Y for (a) swashplate without the notch, (b) swashplate with notch 0.1mm deep, (c) swashplate with notch 0.5mm deep. STFT time-frequency representation of vibration signals measured on the pump body in axis Z for (a) swashplate without the notch, (b) swashplate with notch 0.1mm deep, (c) swashplate with notch 0.5mm deep.


The next stage in the preparation of data for the classification system of the type of worn element (and the degree of its wear in the tested pump) was their division into data used in the system training process and data intended for its subsequent validation (testing). It was assumed that a total of 30% of the general data would be used to validate the correctness of the classifier operation. The rest of the data (i.e. 70% of the overall data) will be used in the training process. The data prepared in this way were loaded into the Matlab workspace,37,38 where their further analysis was carried out, consisting of: • selection and calculation of appropriate signal features, • ranking of the enumerated features due to the information contained therein, • adoption of appropriate classifiers, • assessment of the effectiveness of selected classifiers in recognising the type of worn element and the degree of its development in the tested pump.
Selecting the features of the classification system
Another important issue in the construction of the classification system was the selection of the signal characteristics on which the system will be based. Features obtained from time-frequency analysis of the measured signals (e.g. variance, covariance, power spectral density) are commonly used. For each of the vibration signal arrays obtained (measured in the pump casing), the features of the signal in the time-domain were determined.39,40 The same was done in the case of the analysis of signals from pressure transducers (static and dynamic) installed in the pump’s discharge port and the flow rate transducer.
List of mathematical relationships for determining features from measured signals.
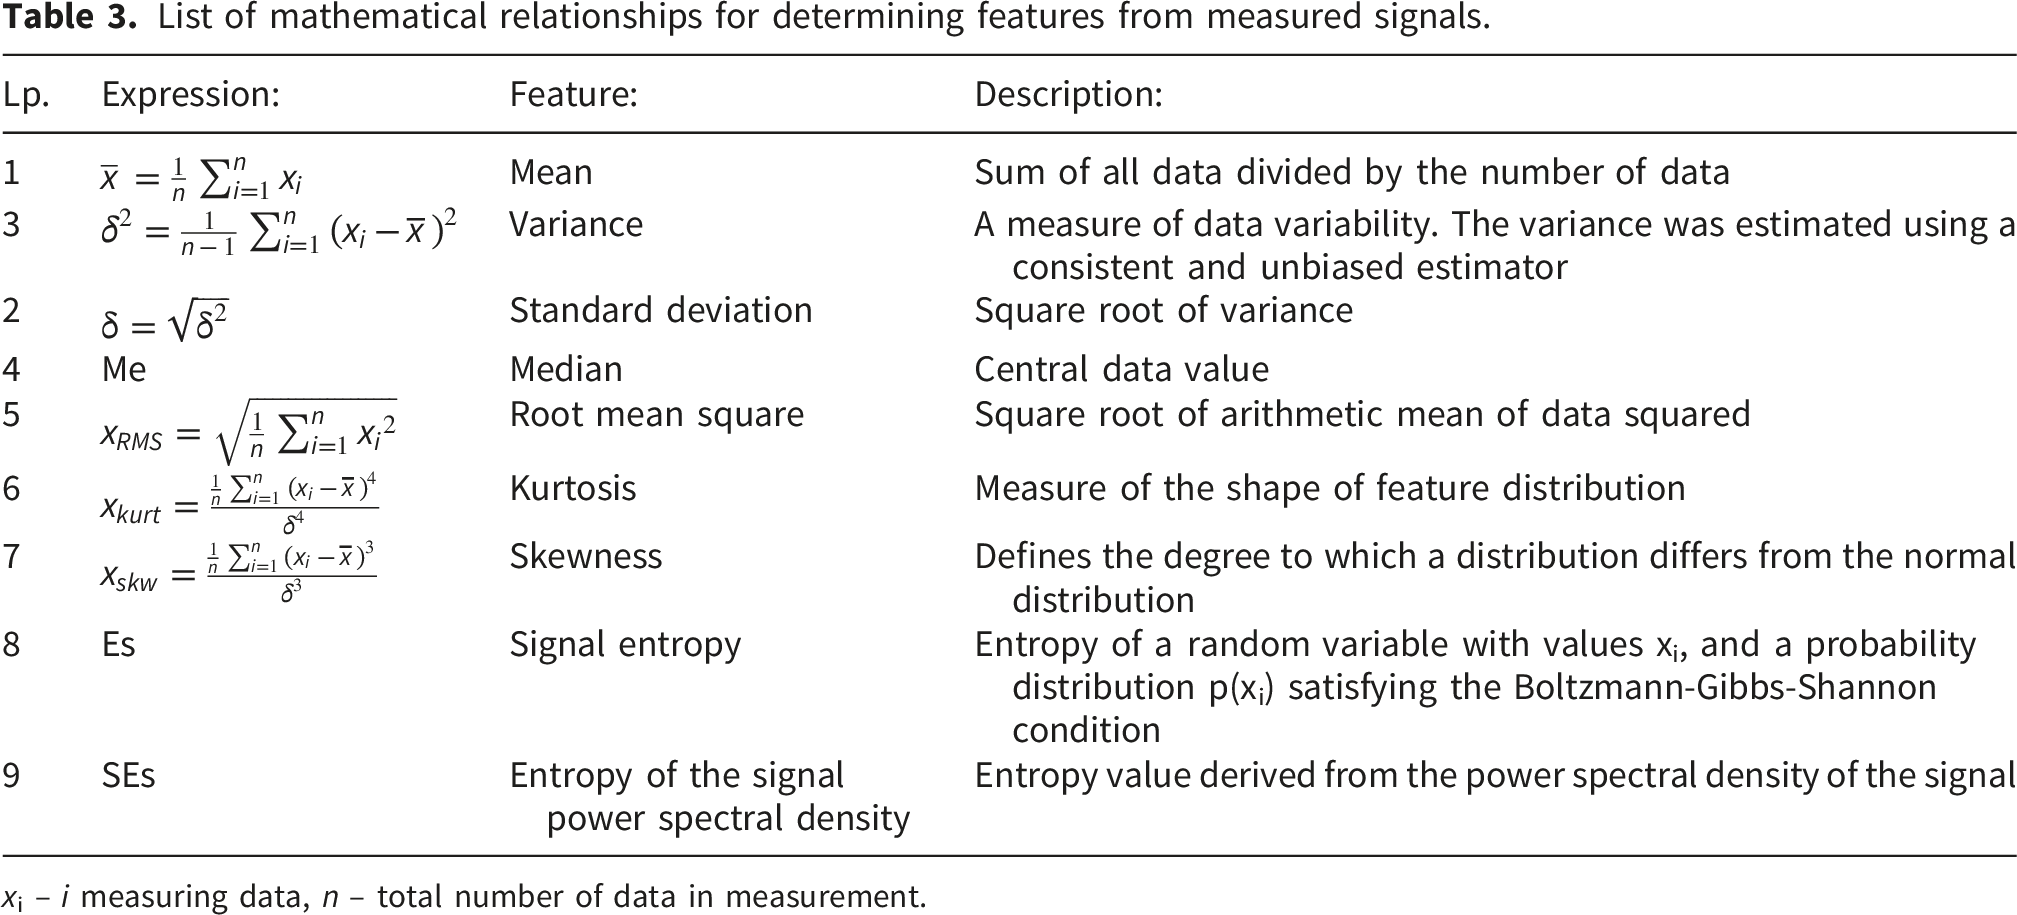
xi – i measuring data, n – total number of data in measurement.
Ranging the features of signal characteristics
The calculated features of the signals are a carrier of information about the type of damaged element in the monitored pump and the degree of this failure. Theoretically, the number of calculated signal features (which are input data for the classifier) is unlimited, but in practice the aim is to obtain a minimum number of features that describe the properties of the tested object well. This helps to achieve a compact model with a good fit.
In order to improve the performance of practical classifiers, it is required to remove correlated or irrelevant features; this leads to a reduction in the dimensionality of the feature matrix and saves computational effort in the creation of classifier models.
Popular algorithms used in ranking signal features include: • minimum redundancy-maximum informationativity MRMR algorithm, • algorithm based on Chi-square Chi2 tests, • algorithm using unidirectional analysis of variance ANOVA,
28
• algorithm based on the Kruskal-WallisTest.
In this article, the MRMR minimum redundancy-maximum applicability algorithm
29
was used as a method to classify the significance of the calculated features (a detailed discussion of the MRMR algorithm with examples of its application to physical problems can be found on the Matlab programme website
41
). This algorithm determines the optimal set of features x and z due to the classification of the pump’s y-state, which maximises their applicability VS, and at the same time minimises the redundancy of WS. The algorithm is based on the mutual information I(x, z) calculated in pairs and the mutual information about the features and condition of the pump I(x, y).

Vs – applicability of features from the set S,
Ws – redundancy of features from the set S,
I(x, y) – calculated value of mutual information of the features x and the state y of the pump,
I(x, z) - calculated value of mutual information of the features x, z from the set S.
The value of mutual information (3) of the features x and z in the set S was calculated based on their common probability distribution p(x,y) and the separate probability distributions p(x) and p(y) of the variables x and y, using the adaptive algorithm described in 29. In the same way, the value of the mutual information I(x, y) of the features x and the state y of the pump was calculated.
p(x,y) - common probabilistic distribution of the feature x and the state y,
p(x) – probability distribution of characteristic x,
p(y) – probability distribution of state y.
Finding the optimal set of S features (out of the full set of Ω of all 72 features calculated from the measured signals) that minimises their redundancy and, at the same time, maximises their applicability requires the use of an algorithm that calculates the value of the MIQX mutual information coefficient (which is the quotient of the applicability of a feature to its redundancy).). The classification of features is based on the selection of those with the highest value of the MIQ
X
coefficient (in practice, higher than the assumed limit value).
Of the 72 features obtained from the signal measurements, the five most important ones were selected to assess the state of pump wear. The MRMR ranking of the ten most important features is presented in the following graph (Figure 9). The values of the first ten futures ranked are listed in Table 4. Ranking the significance of the ten most important features of the measured signals. List of the ten most significant features of the measured signals.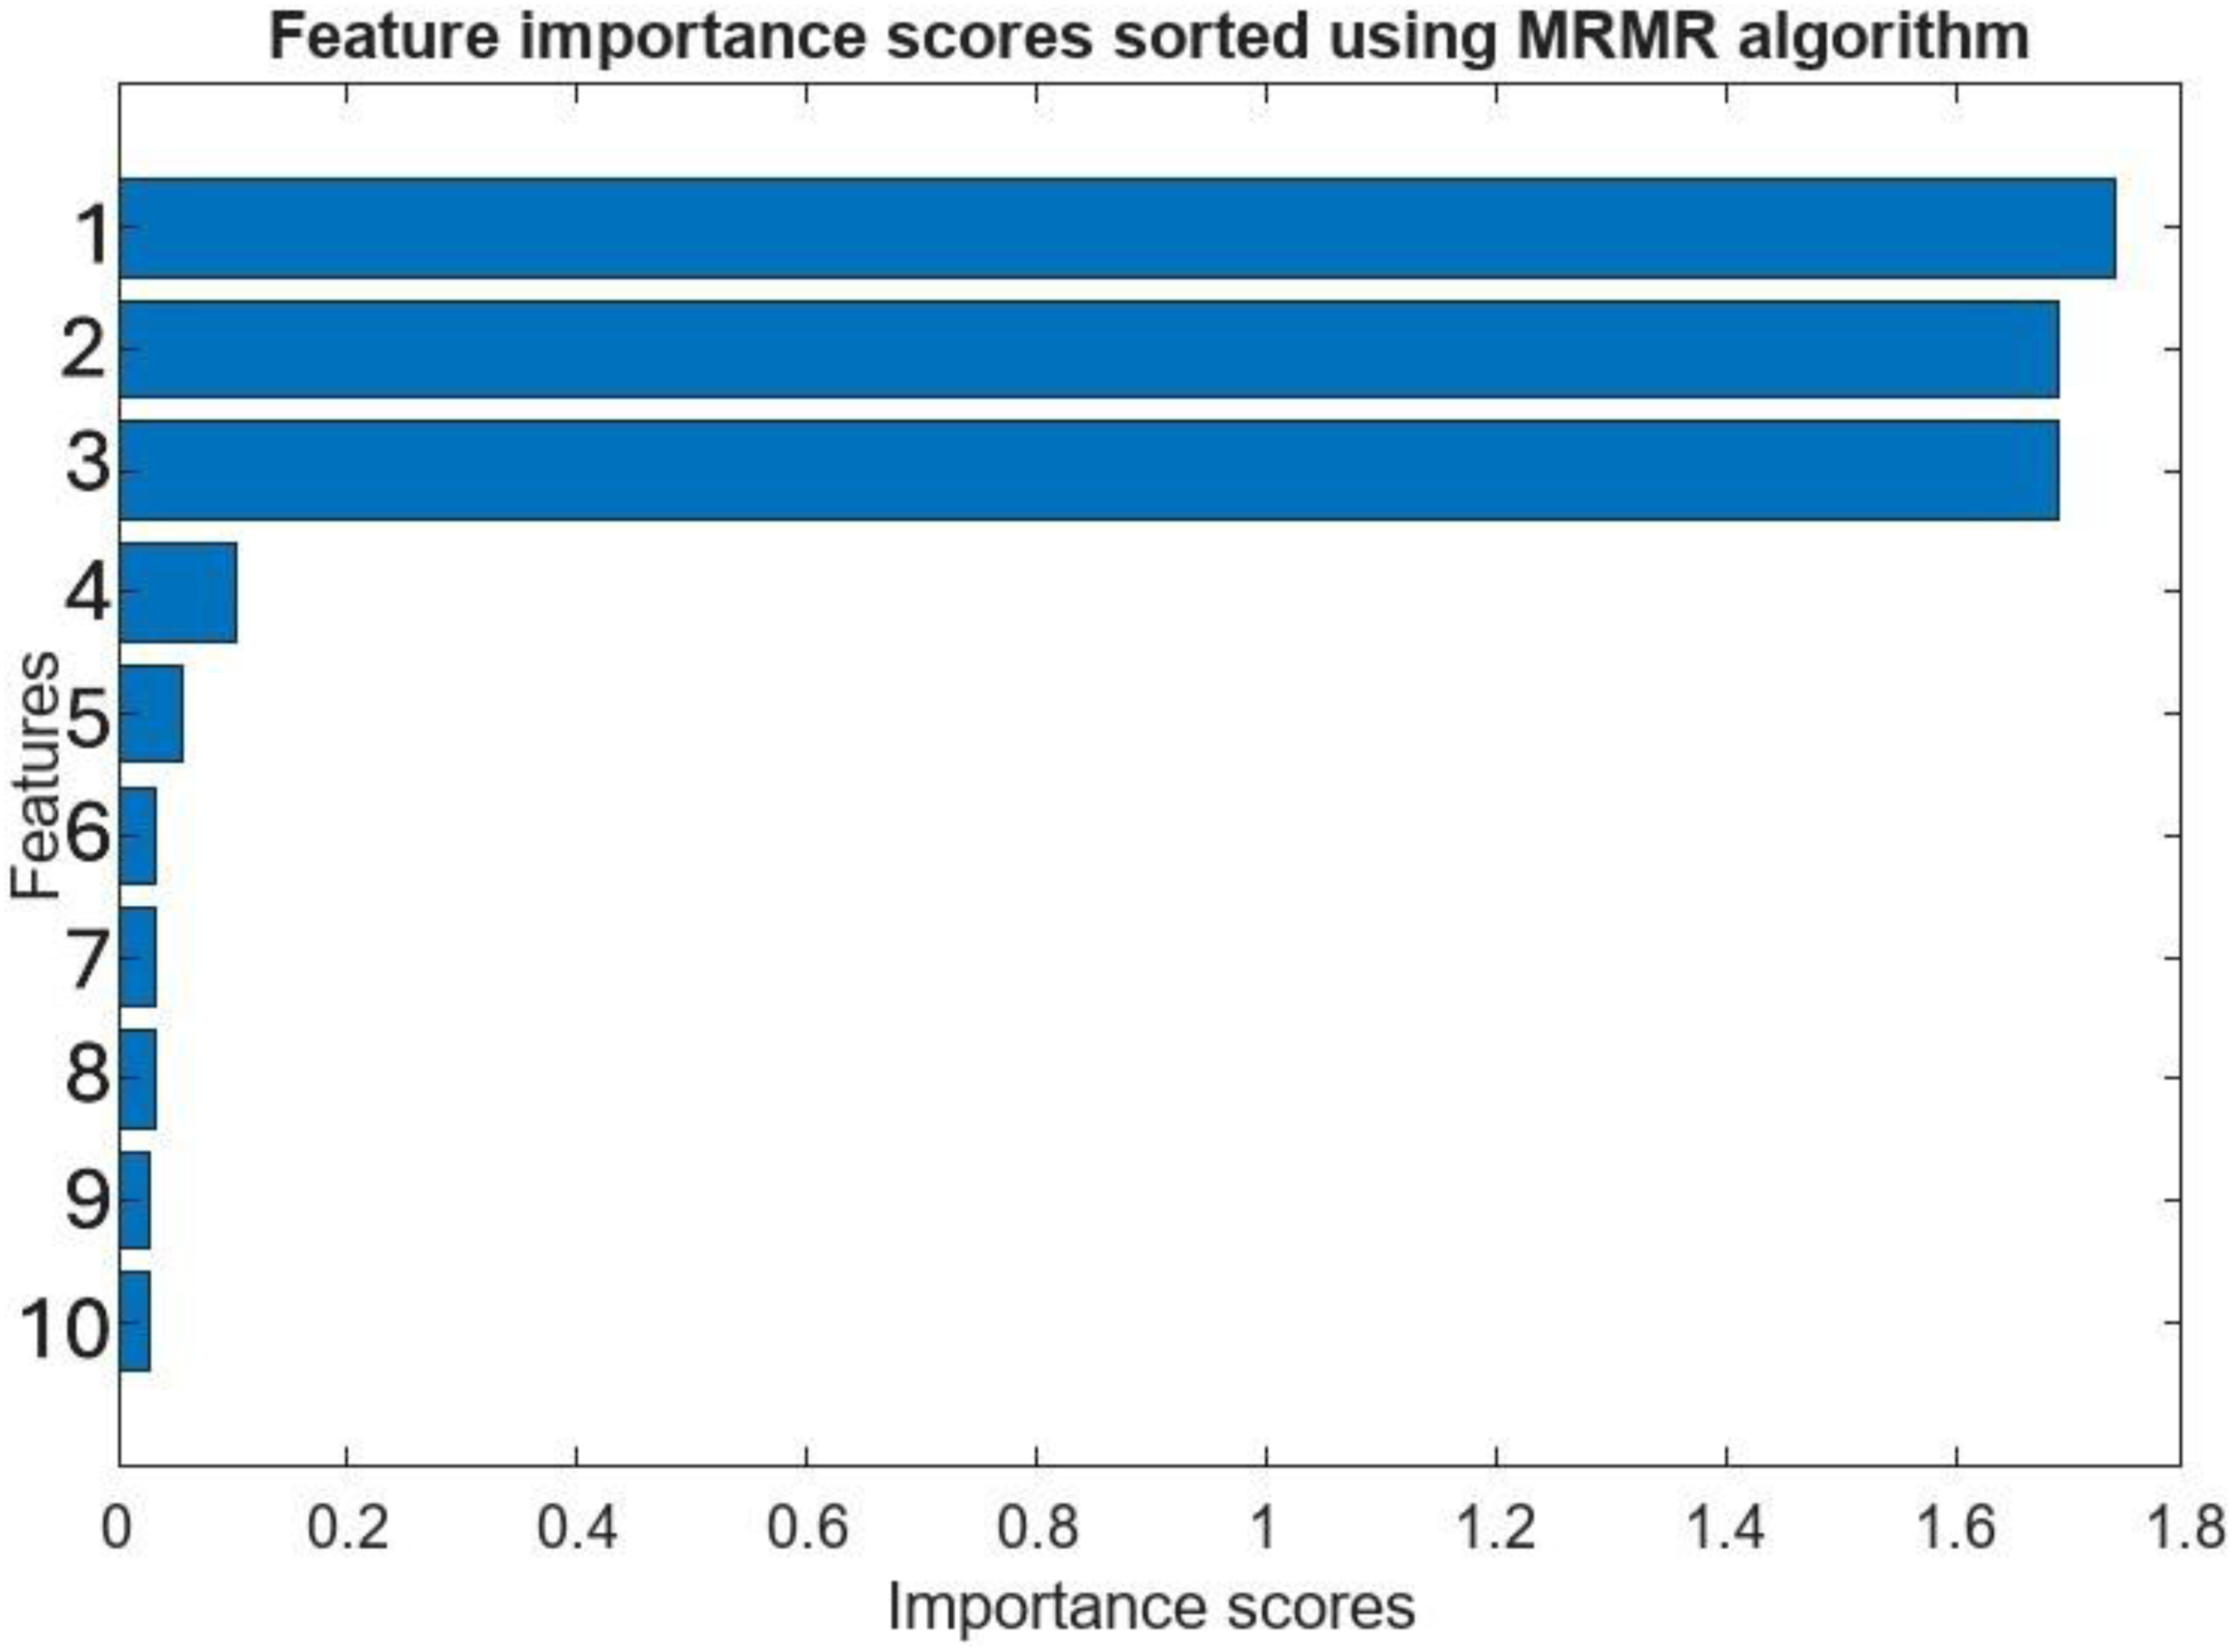
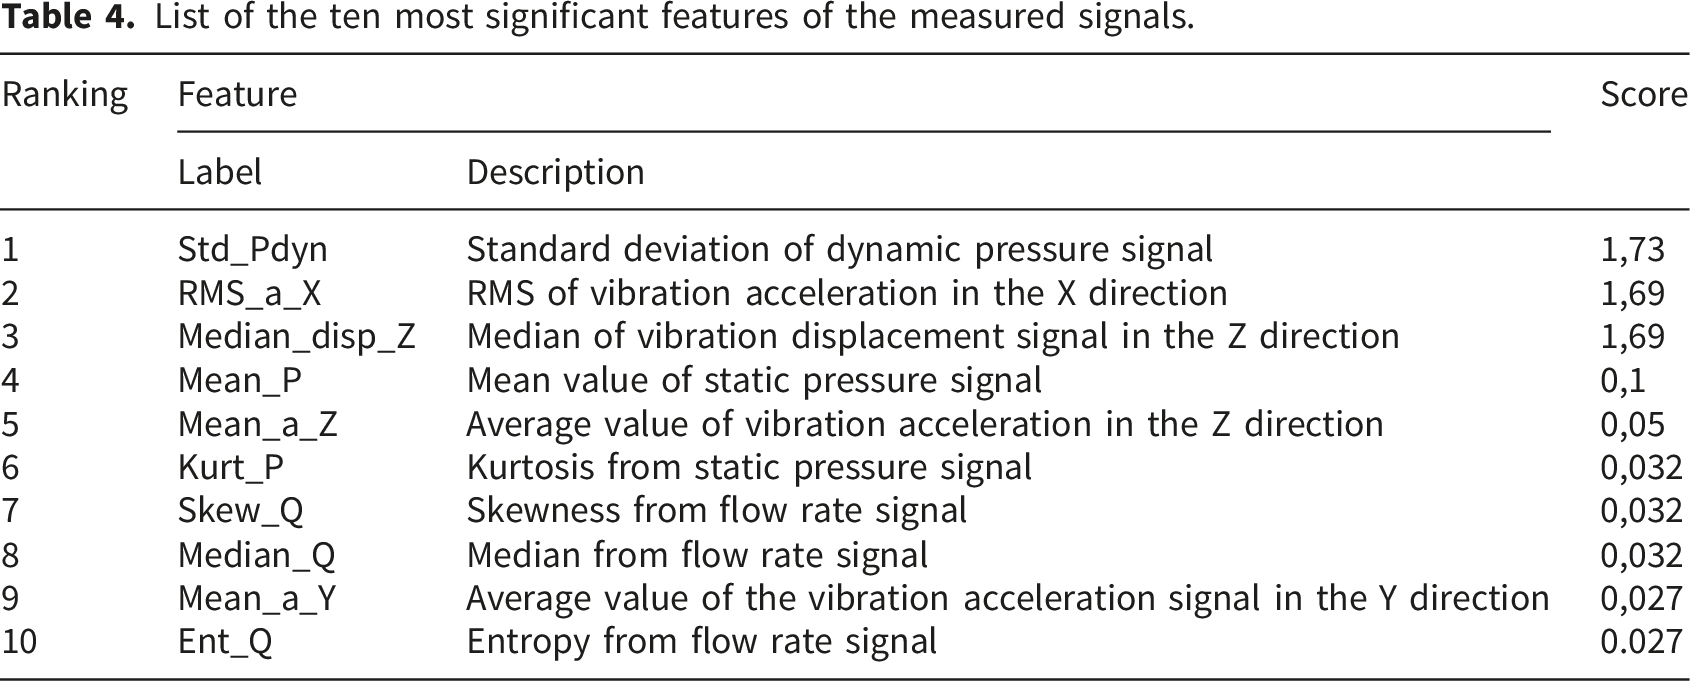
The analysis of the relationship between the first three most important signal characteristics (statistical measures) listed in the table and the progressive wear of the pump components is not clear-cut. The complexity and overlap of phenomena occurring in the pump during its operation concern both changes in its hydraulic parameters (flow rate, discharge pressure) and accompanying processes (body vibrations, noise, temperature). Based on the ranking of features listed in Table 4, the most important feature in terms of pump wear is Std_Pdyn (standard deviation of dynamic pressure). Changes in this value may result from the increasing resistance to movement of components caused by friction between cooperating surfaces, such as the disappearance of the lubricating layer between the piston shoe surface and the swash plate, changes in pressure pulsation (hydraulic hammering) caused by the passage of pistons during the rotation of the rotor from the suction side to the discharge side of the pump through the bridge on the valve plate separating these sides (wear of the front surfaces of the rotor and valve plate).
The other two most important features according to the ranking RMS_a_X (RMS vibration acceleration in the X measurement direction) and Median_disp_Z (median vibration displacement in the pump shaft axis – Z direction) can be associated with increasing clearances between the mating surfaces of the pump components, progressive rotor imbalance and changes in the pulsation of the liquid flow in the pump.
Selection of the classification algorithm
In maintenance engineering, learning systems are increasingly used which model the state of an industrial process or its component (e.g., a machine) only on the basis of available measurement data assigned to the state of the process (e.g., degree of damage). According to learning techniques, machine learning can be divided into supervised learning systems and unsupervised learning systems. 42
For both supervised and unsupervised learning systems, there is a large group of learning algorithms, the most appropriate of which depends on many factors. Firstly, in order to choose the right learning algorithm, it is necessary to define the task that the model is to perform (classification, regression, clustering). Another issue is the type and size of input data, which affects the speed of learning, the load on the computer memory (industrial controller), and the accuracy of prediction of output data (model response). The choice of the right type of algorithm is not unambiguous, and only an experienced user can quickly indicate the right algorithm.
In the group of algorithms that address the issue of classification of the wear condition of a multi-piston pump, we distinguish
43
: • Decision Trees
In this algorithm, the structure of a decision tree based on the starting point and branches, which are a binary decision-making system, the final branches of which are the result of assigning data to a given class, is used to classify the data. • Discriminant Analysis
It is based on the analysis of Gaussian distributions of signals from a set of observations (inputs). The classifier estimates the Gaussian distribution parameters from the observations and assigns them to the appropriate class based on them. • Support Vector Machines
Classifies data by finding the best hyperplane that separates data from one class. The best hyperplane is the one that separates the data by the largest margin. • K Nearest Neighbour Classifiers
It determines the affiliation of a new data from the input set to a specified class based on the position of the assumed number (number K) of the nearest (neighbouring) data of the input set relative to these data. At the same time, the measure of position is the measure of the classified distance given from the neighbouring data. • Naive Bayes Classifiers
It is a probabilistic classifier in which mutual independence of the input variables is assumed (naively). Using Bayes’ theorem, this classifier calculates the probabilities of the input data belonging to a particular class. • Algorithms using the neural network structure
A typical neural network used in classification topics consists of an input layer, one or more hidden layers, and an output layer. The number of neurons in the input and output layers depends on the number of input variables (selected from the signal feature ranking) and the number of classified states. To classify pump failures, the authors used the neural network structure developed in an earlier paper. 24
Verification of accepted classification algorithms
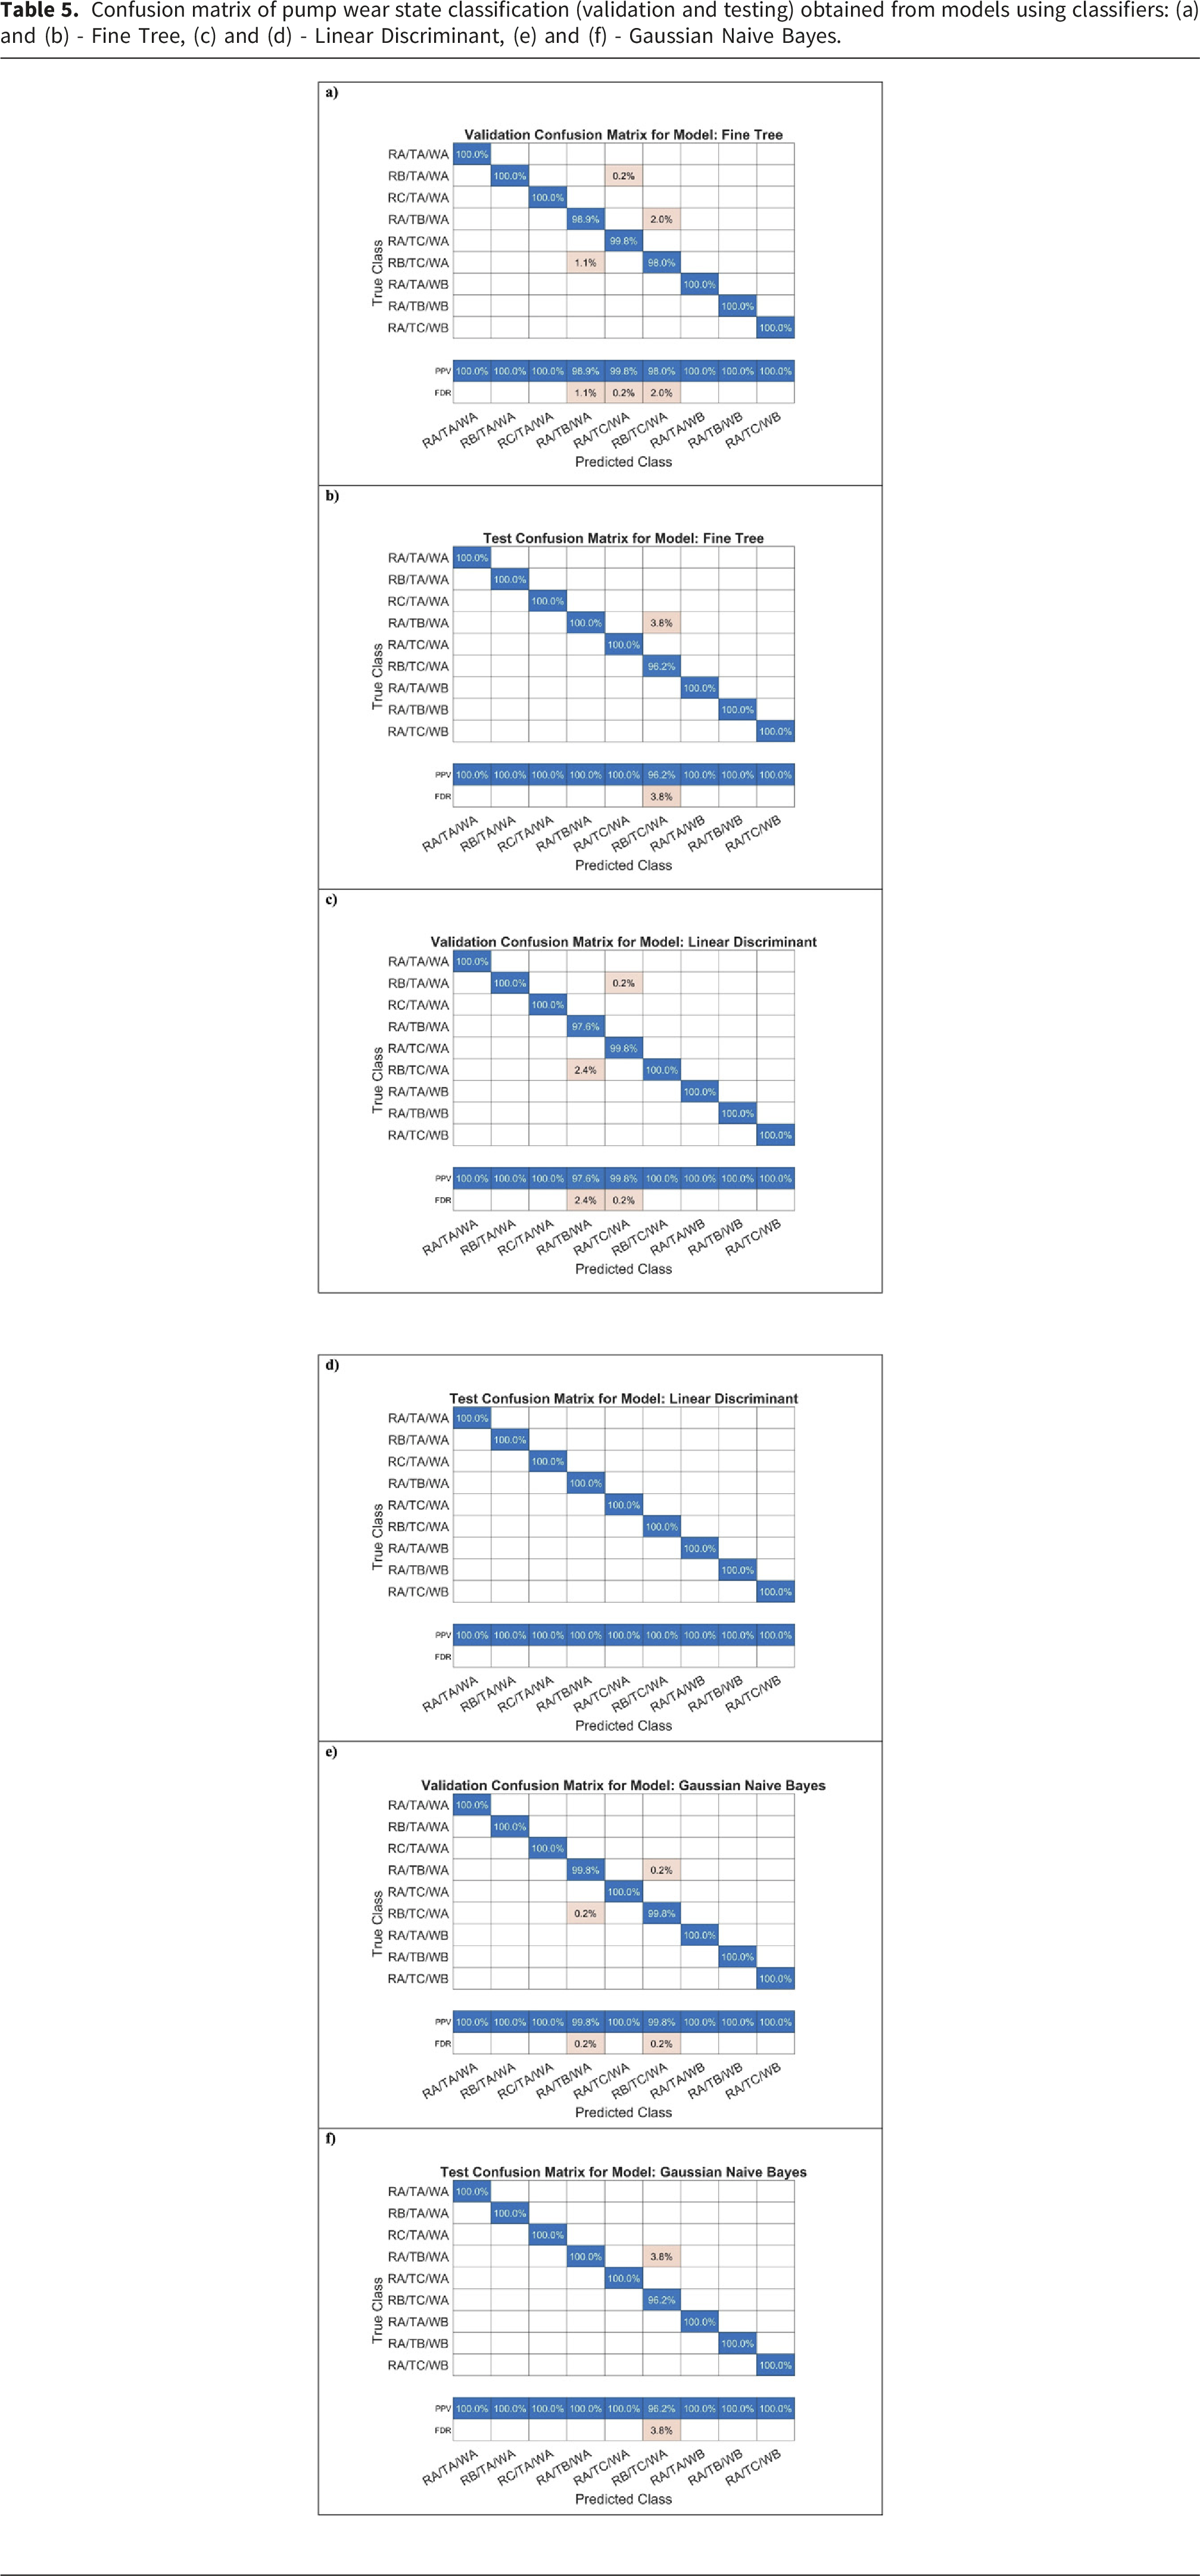
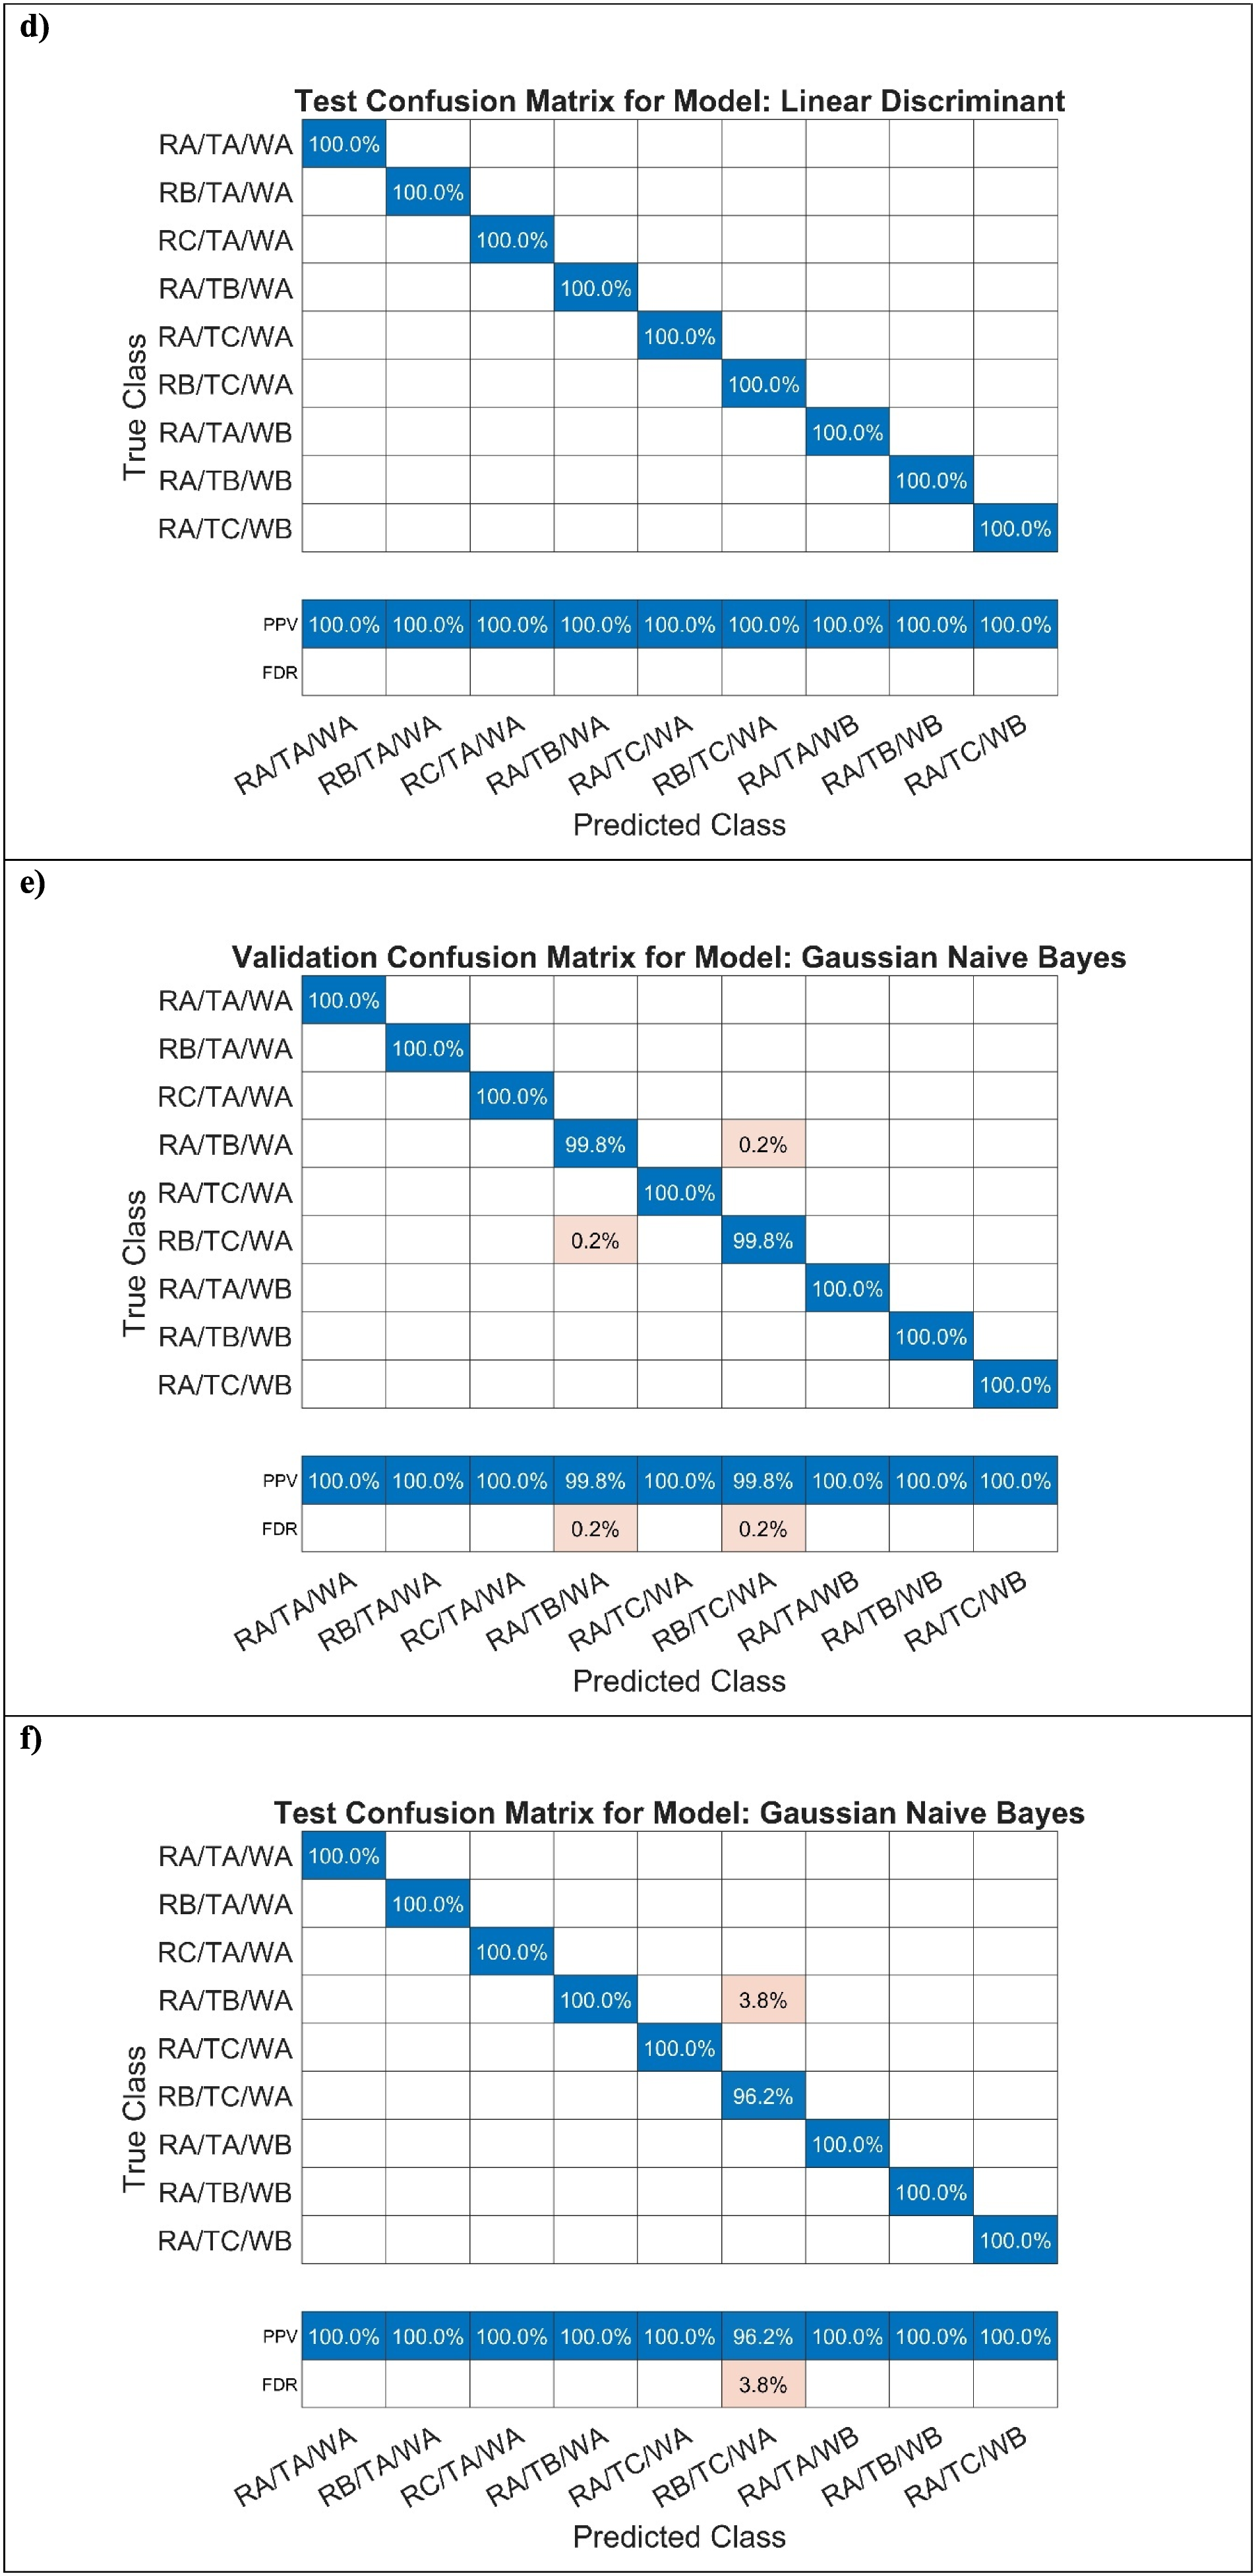
Confusion matrix of pump wear state classification (validation and testing) obtained from models using classifiers: (a) and (b) - Fine Tree, (c) and (d) - Linear Discriminant, (e) and (f) - Gaussian Naive Bayes.

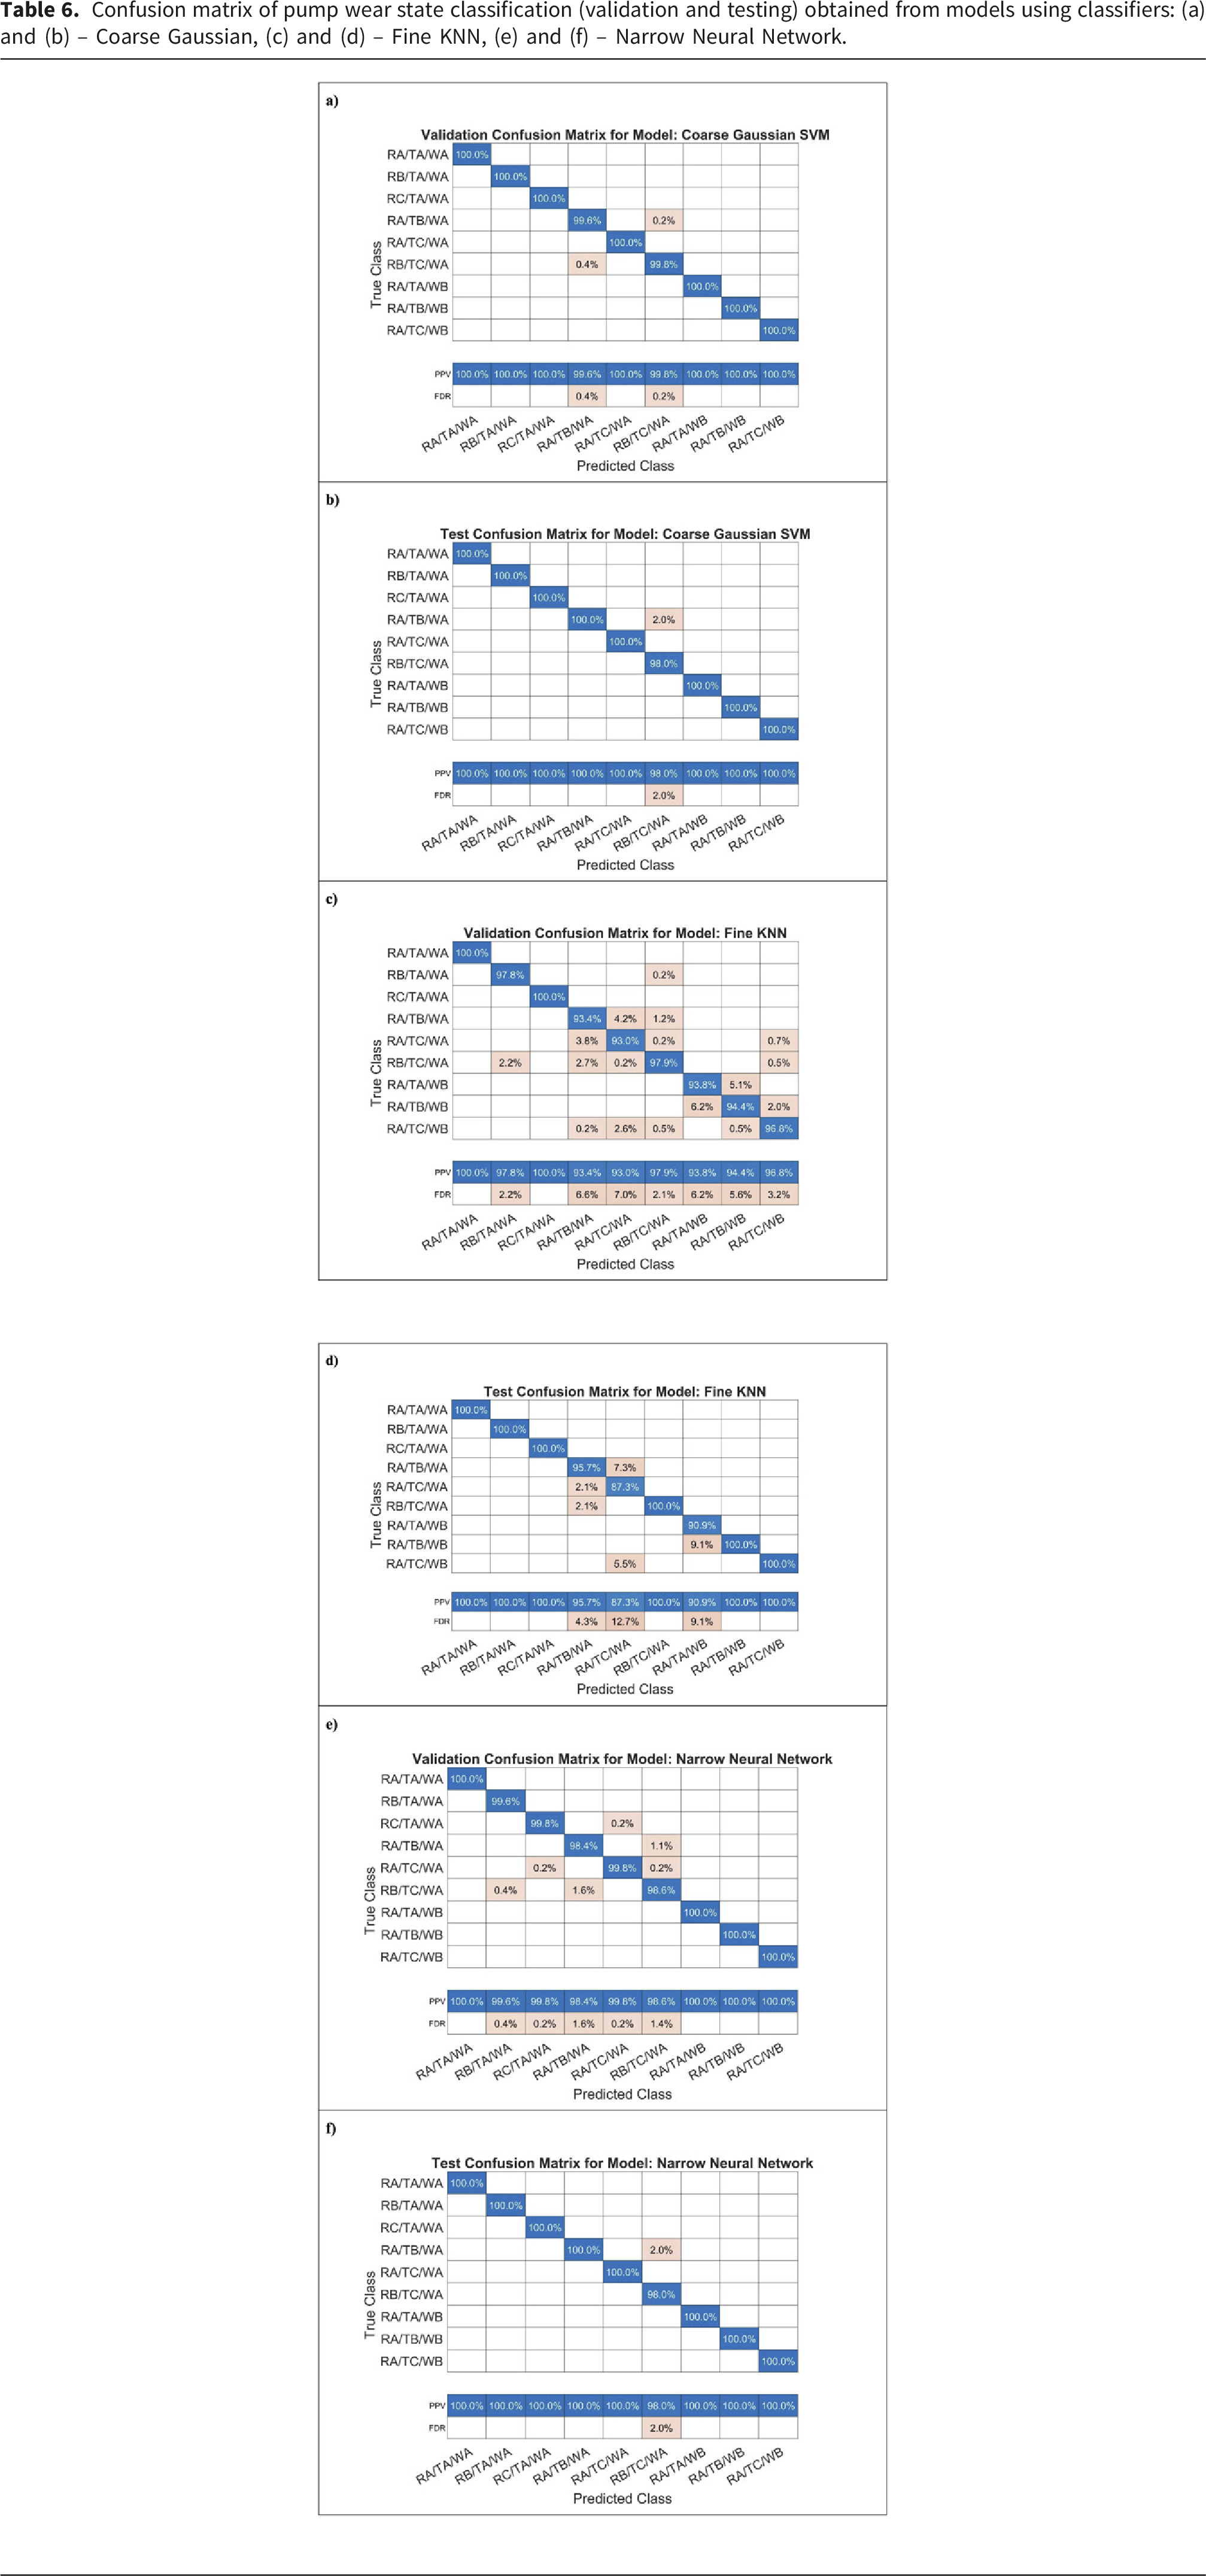
Confusion matrix of pump wear state classification (validation and testing) obtained from models using classifiers: (a) and (b) – Coarse Gaussian, (c) and (d) – Fine KNN, (e) and (f) – Narrow Neural Network.


Evaluation of the usefulness of the models obtained in detecting damaged pump components.
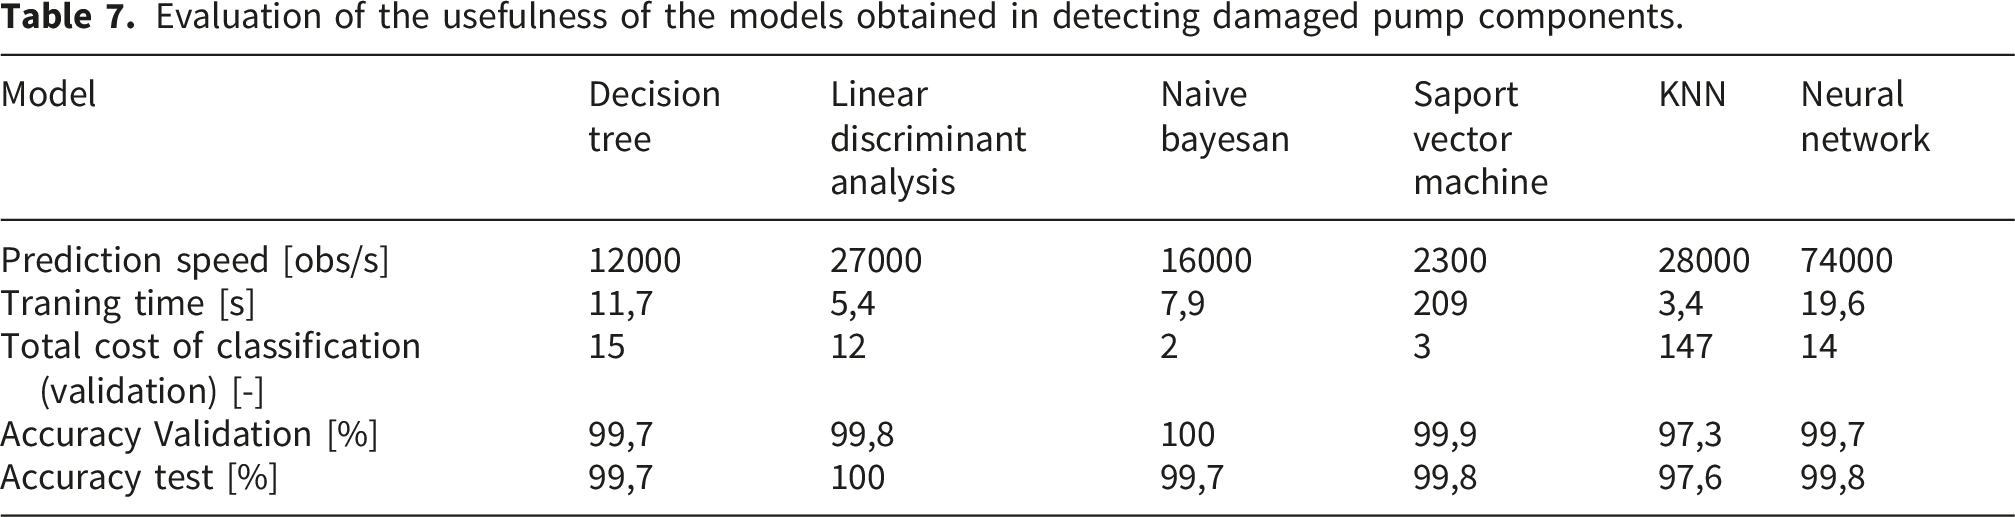
Based on the results presented in Table 7 and using previously determined classification error matrices (Tables 5 and 6), it can be seen that classifiers (models) using Bayesian algorithms (Naive Bayesian model) and Support Vector Machines algorithm have high precision in recognising damage to pump components with the lowest value of classification errors (Total misclassification cost). Subsequent classifiers (Linear Discriminant Analysis, Decision Tree, and Neural Network), despite the high accuracy of pump fault recognition, showed several times higher values of classification errors compared to the previous group. Based on the data obtained from the next criterion, which was the time it took for the classifier to recognise the types of worn elements using the new measurement data, the model with the SVM algorithm showed the shortest prediction time (five times shorter compared to the next in line Decision Tree algorithm). The K classifier also showed high (but lower compared to the classifiers discussed) accuracy in recognition of the damaged element of the nearest KNN neighbours. However, due to the highest classification cost and the long time required to recognise the damaged element, this model is not recommended for physical implementation.
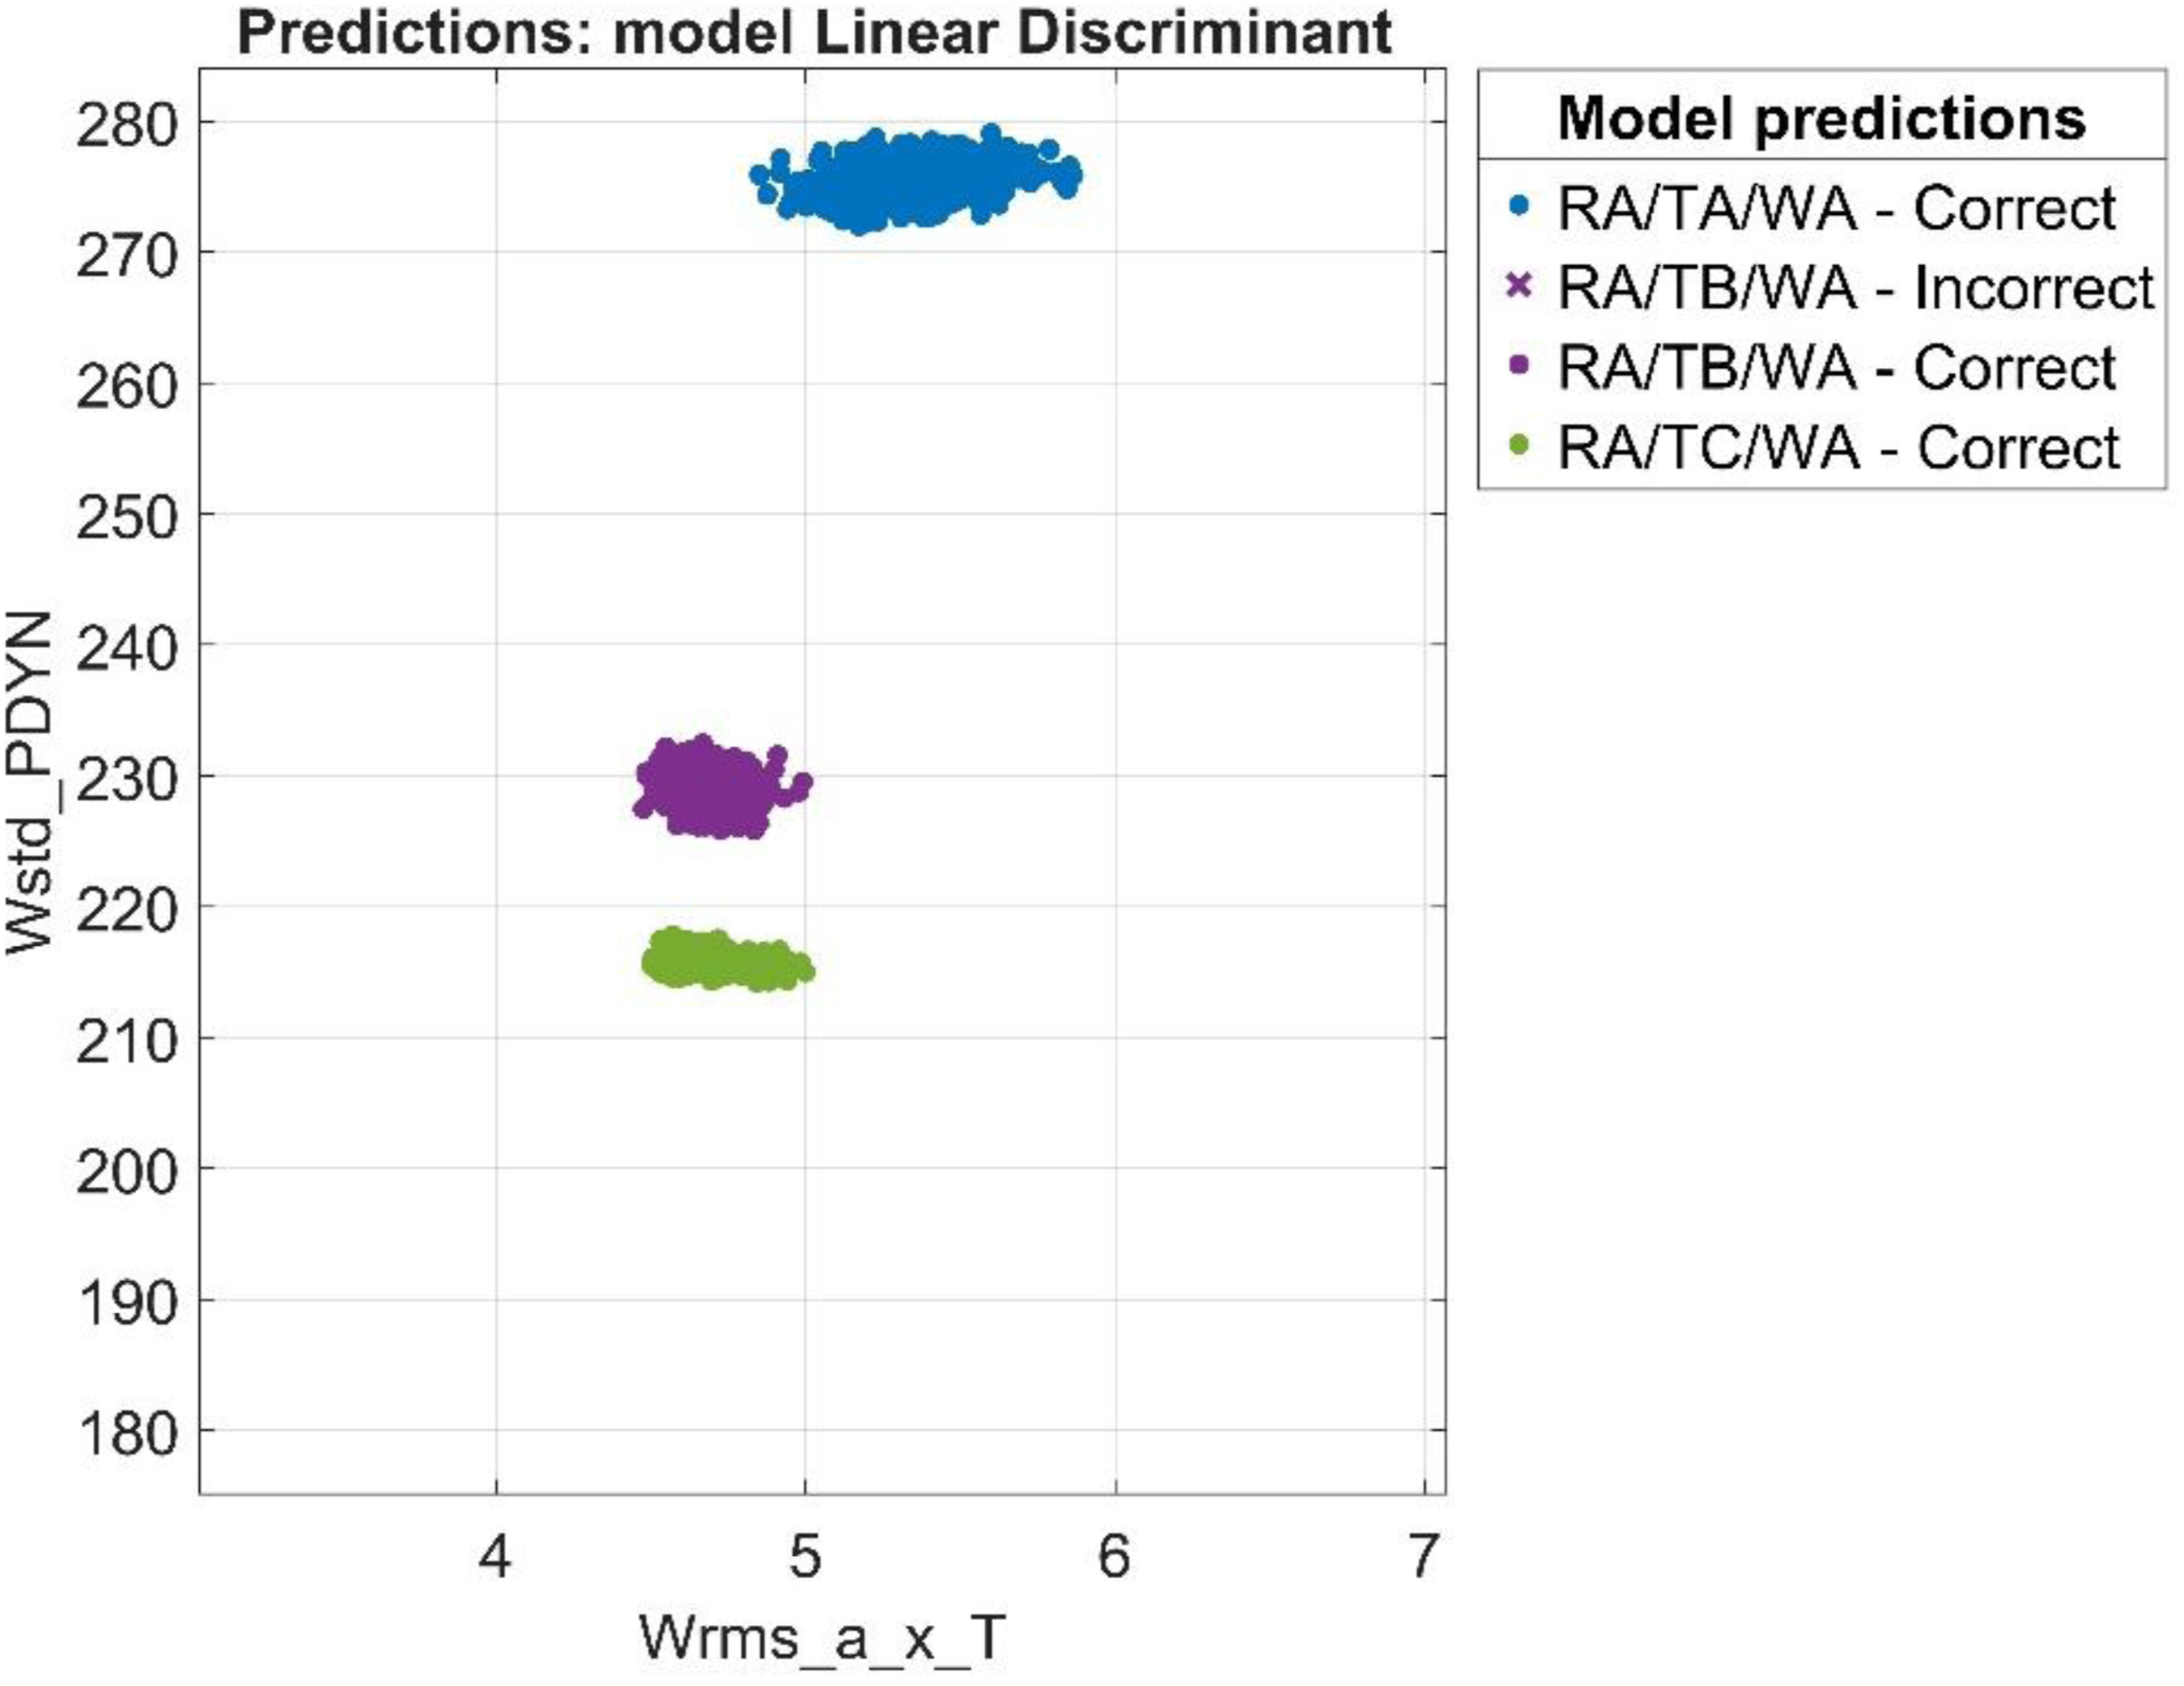
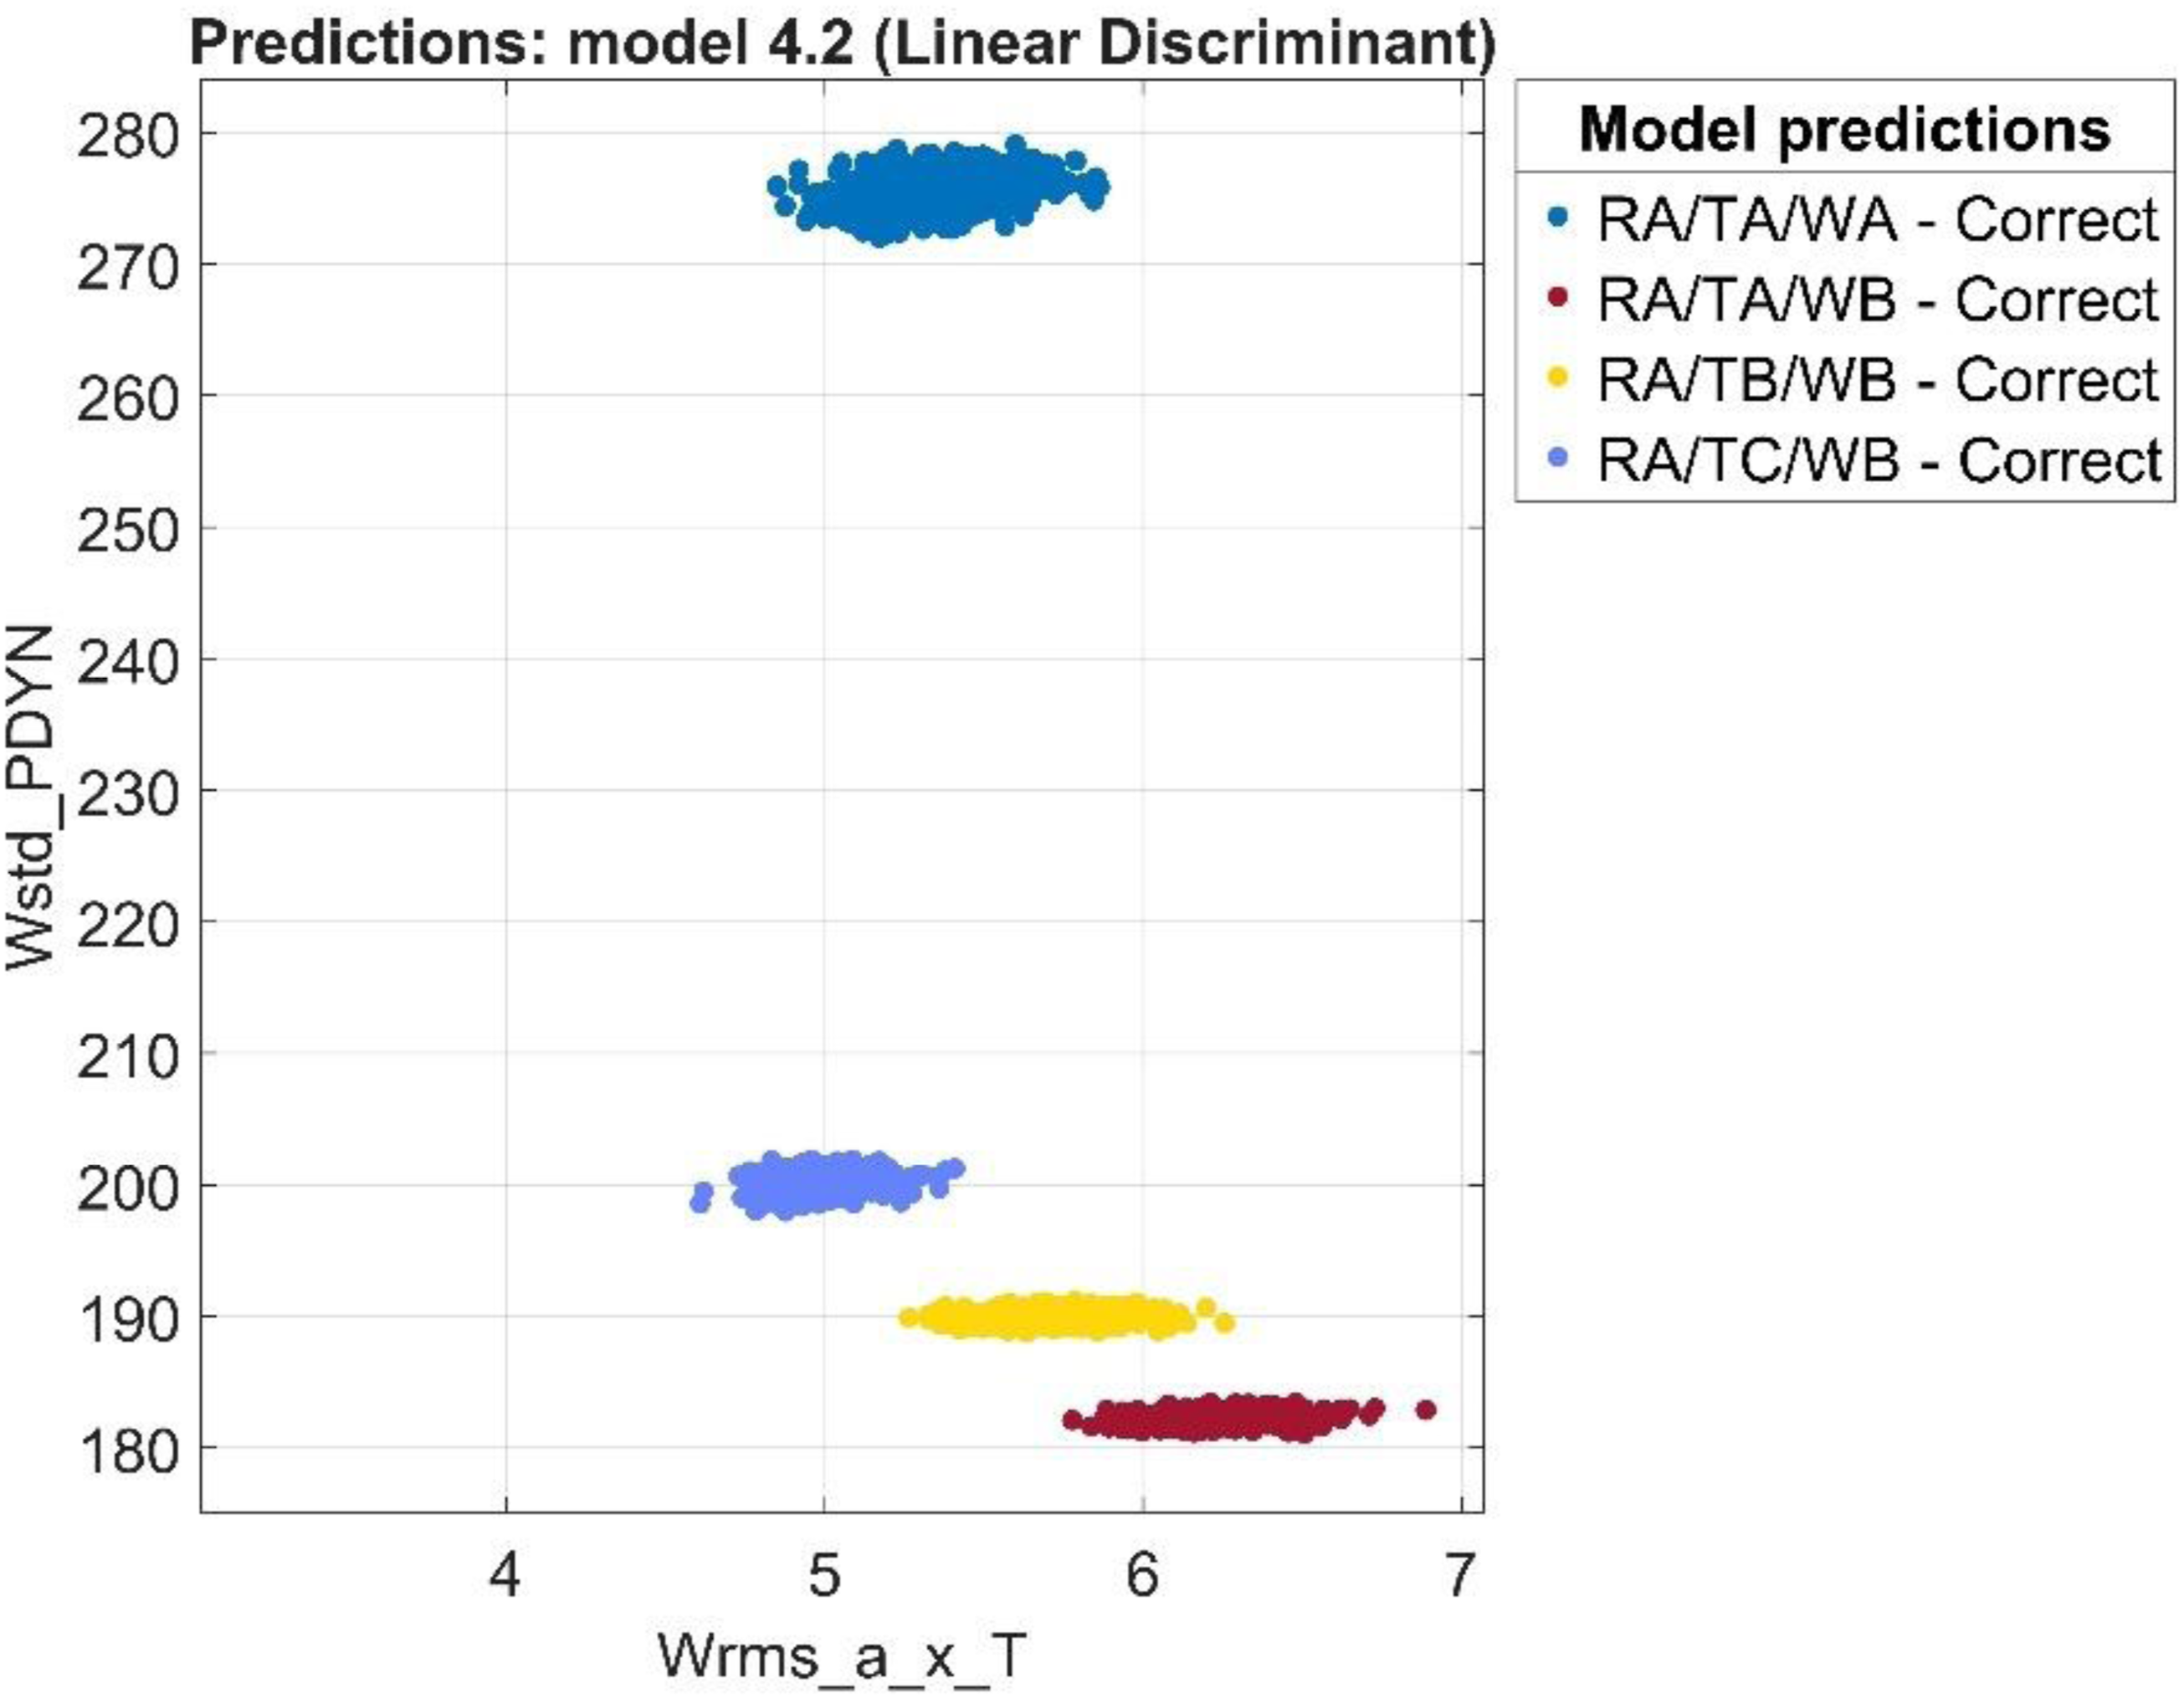
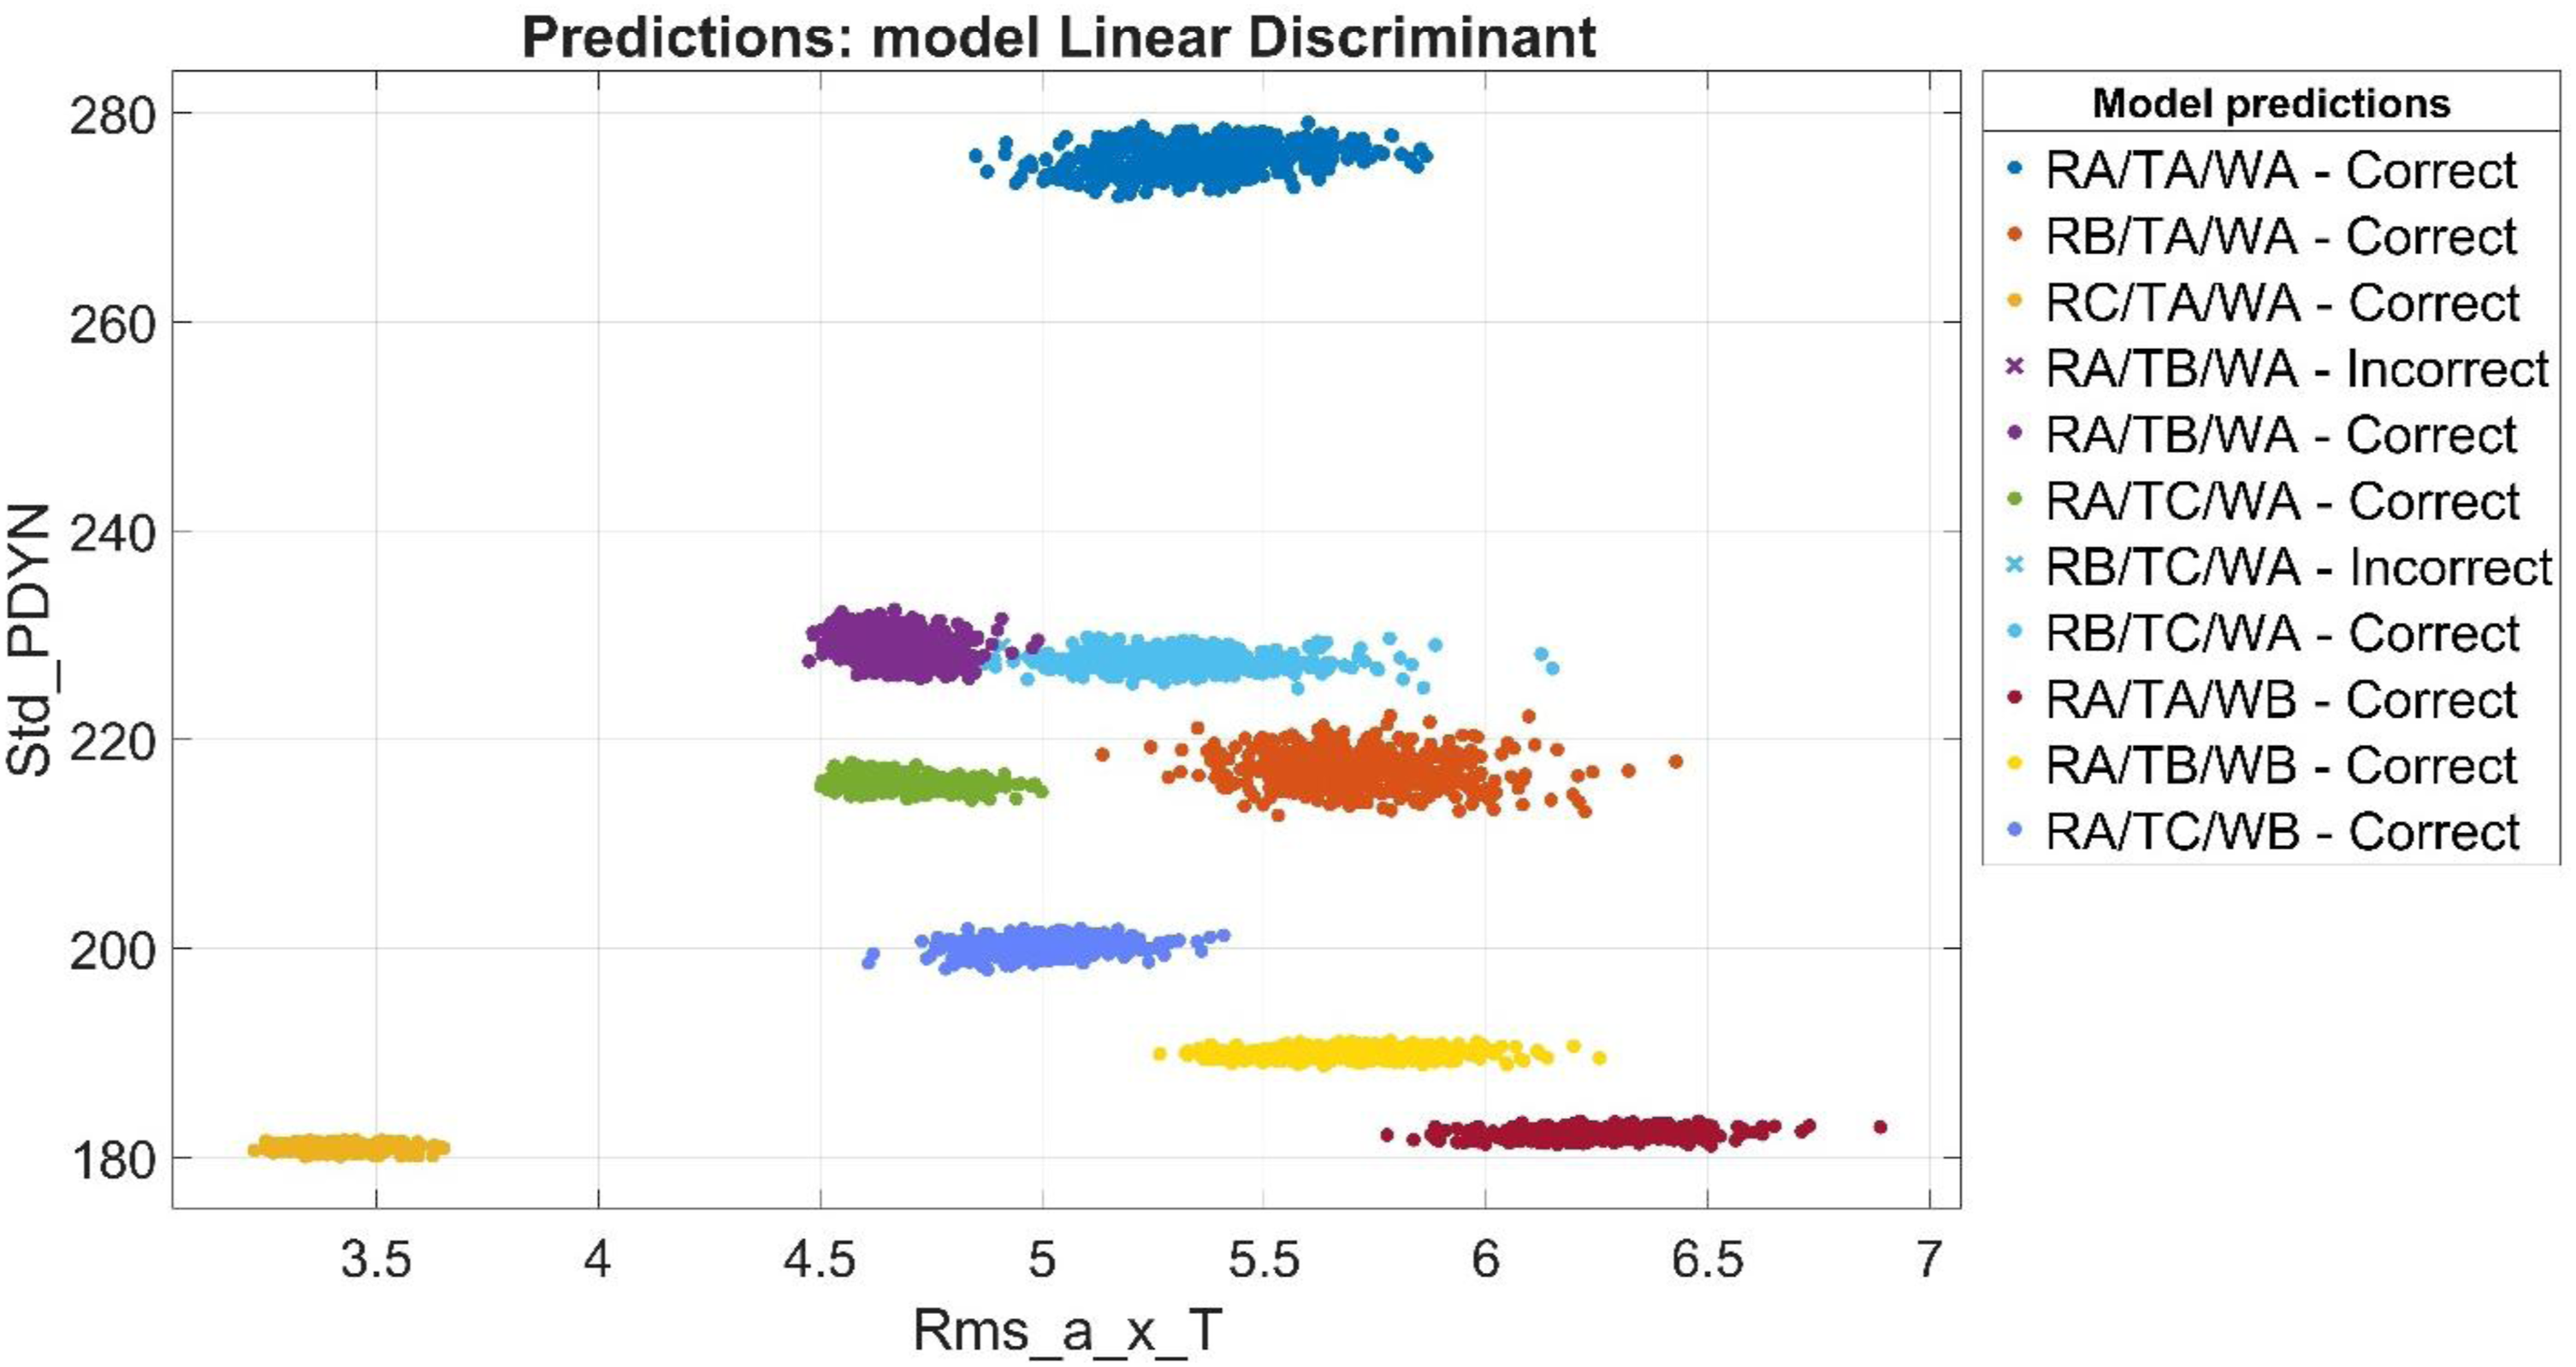
An example of verification of the correct type recognition of defective components inside the pump casing using two most important features (the standard deviation of the dynamic pressure signal Std_PDYN and the mean square value of RMS from the vibration Rms_a_X) by the Linear Discriminant model is shown in Figures 10–13. Example of prediction of the development of damage to the valve plate by a verified Linear Discriminant model. Example of prediction of the development of a swashplate damage by a verified Linear Discriminant model. Example of prediction of the development of damage to the swashplate and pump rotor by verified Linear Discriminant model. Example of predicting the development of damage (swashplate, valve plate, and rotor) in a pump by a verified Linear Discriminant model.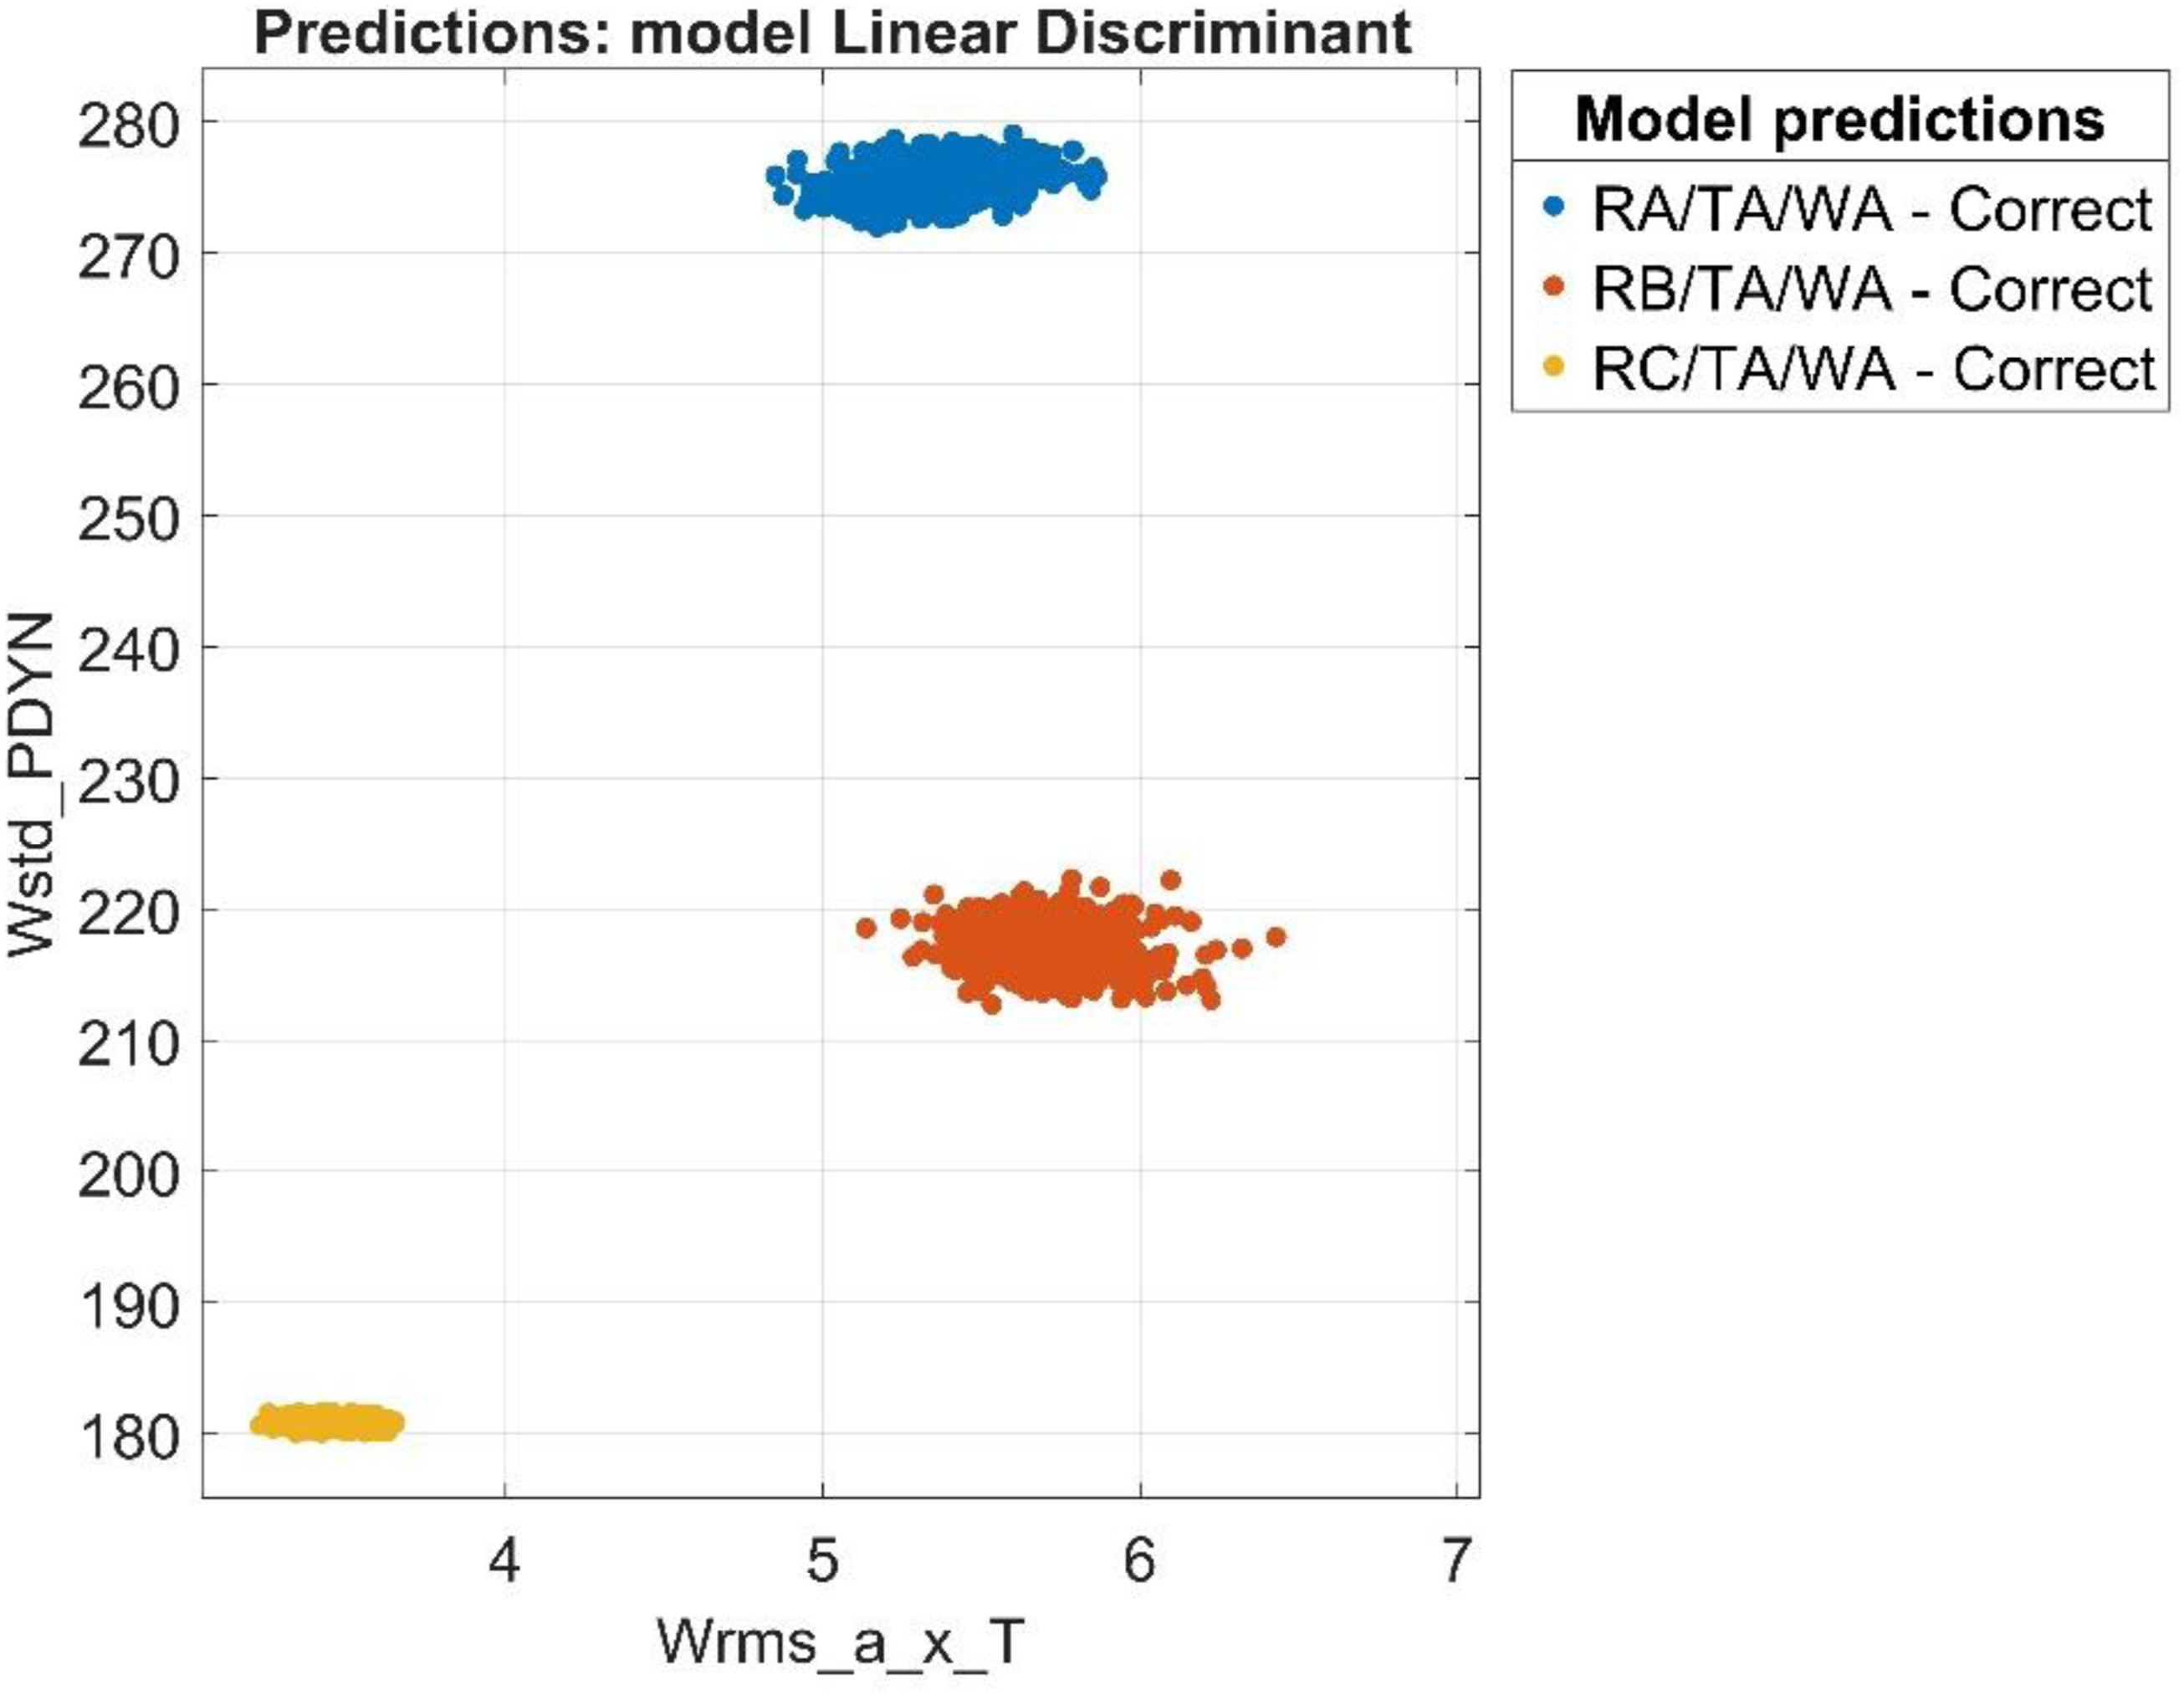
Summary
When designing systems to monitor and control the efficiency of a pump, it is important not only to select appropriate diagnostic signals, but also to determine the appropriate statistical characteristics from these signals, which would enable them to recognise the type of damaged pump component and the degree of its wear.
The operational tests of the axial multi-piston positive displacement pump presented in the article were carried out for known combinations of failures of the main components of the pump. These studies were aimed at assessing the effectiveness of detecting damage (or group of damage) by well-known classifiers using popular machine learning algorithms. When diagnosing positive displacement pumps, it is important to carefully prepare the input data that provide information about the wear status of the pump components. Such data can come from operating signals, such as those measured in the pump’s discharge connection (static and dynamic), as well as additional signals, such as vibration signals, which are recorded in characteristic areas of the pump housing. In both cases, the input data sets that contain the measured signals should be as numerous as possible. This results in better training of the resulting classifier model and the effectiveness achieved in detecting types of worn pump components. Another important issue is the selection of signal characteristics that best separate efficiency classes from pump damage. It is desirable to determine the minimum number of traits that can affect the training time of the classifier in the classification process and prevent him from being overfitted. The MRMR minimum redundancy-maximum informativity algorithm used in the ranking of the determined features effectively ranked the features calculated from the measured signals. The evaluation of the effectiveness of the detection of damaged pump components by the classification algorithms adopted based on the five most important features showed their high precision.
The main differences concern the time it took to train individual classifiers and the time it took the classifier to classify the type of worn element using the new measurement data. Based on the evaluation of individual classifiers according to previously adopted criteria, it was found that classifiers (models) using Bayesian algorithms (Naive Bayesian model) and Support Vector Machines algorithm were distinguished by both high efficiency of recognition of the worn element and the lowest cost of their teaching.
In summary, the classifiers obtained in the machine learning process can be a valuable tool in the diagnostics of axial positive displacement pumps after their implementation in real-time measurement and control systems using fast DSP signal processors. At the same time, however, it is important to carefully prepare the training data, i.e. ensure a sufficient amount of measurement data free from interference and noise, and select a classifier model with a good fit and favourable structure. Next, only those diagnostic features that describe the properties of the diagnosed object well should be selected. The selection of measured signals and their measurement locations (placement of measuring transducers) is also important for obtaining a well-trained (and not overfitted) model. It should also be noted that the high accuracy of pump fault recognition obtained in the testing process by the adopted classifier models was achieved from tests on one of many positive displacement pump designs. Extending the application of the obtained classifiers to the evaluation of pumps of other designs would require their prior training and testing on additional sets of signal features obtained from signal measurements during the operation of these pumps.
Footnotes
Funding
The authors received no financial support for the research, authorship, and/or publication of this article.
Declaration of conflicting interests
The authors declared no potential conflicts of interest with respect to the research, authorship, and/or publication of this article.