
Abstract
This study investigates the feasibility of detecting corrosion-induced defects in tank bottom plates using electromagnetic acoustic emission (EMAE) technology based on high-intensity pulsed current excitation. Experiments employed intact and electrochemically corroded Q235 steel specimens simulating the bottom environment of storage tanks. Key findings demonstrate that EMAE with pulsed current excitation successfully induced distinct acoustic emission signals in corroded specimens, exhibiting significantly higher intensity compared to intact specimens. Crucially, corroded specimens displayed a pronounced Kaiser effect, characterized by rapid attenuation of signal intensity and energy within the characteristic frequency band of 46.875-62.5 kHz upon repeated loading at identical current levels, a phenomenon absent in intact specimens. Time-frequency analysis confirmed that this characteristic frequency band is uniquely present and exhibits Kaiser effect attenuation exclusively in signals from corroded specimens. Parametric analysis further revealed distinguishing waveform features associated with corrosion signals. These results validate that electromagnetic acoustic emission (EMAE) with pulsed current excitation can effectively generate and detect acoustic emissions linked to active corrosion defects. The identified Kaiser effect behavior and the specific 46.875–62.5 kHz frequency band serve as diagnostic indicators for corrosion detection. This study lays the groundwork for applying this EMAE methodology to corrosion detection in tank bottom plates.
Keywords
1. Introduction
Electromagnetic acoustic emission (EMAE) is an emerging non-destructive testing technique. It enables dynamic inspection by applying localized electromagnetic loading to a metal component, thereby inducing internal acoustic emission phenomena. A key distinction from traditional acoustic emission (AE) lies in its loading mechanism: EMAE replaces conventional hydraulic or pneumatic loading with electromagnetic excitation. This localized approach offers significant advantages, including avoidance of potential structural damage from overall loading, concentration of energy on defect areas to enhance signal strength, and on-demand loading capability that significantly reduces the long-term loading time typically required by traditional AE.
Electromagnetic acoustic emission (EMAE) has been widely studied for detecting metal cracks. Early work by Finkel P. et al. in the U.S. induced acoustic emissions at cracks using localized dynamic electromagnetic loading, confirming the technique’s feasibility in thin plates. 1 In China, related research began around 2005. A group at Hebei University of Technology pioneered EMAE studies, achieving preliminary crack localization in aluminum plates and analyzing signals under varying excitation.2–7 Subsequent work included studies on EMAE characteristics for different crack sizes, an improved transducer for ferromagnetic materials, and investigations into the crack response mechanism.8,9 More recently, Chang, Y.Q. et al. proposed a rail crack detection method combining EMAE with the Optimal Local Mean Decomposition algorithm. 10 The application of electromagnetic acoustic techniques is also expanding. Electromagnetic acoustic resonance (EMAR) has reliably measured thickness loss in acid-corroded steel plates, outperforming electrochemical methods. 11 Similarly, guided waves from electromagnetic acoustic transducers have shown promise for detecting corrosion in steel plates, supported by simulations and experiments. 12
Beyond cracks, detecting other critical damage such as corrosion presents a distinct challenge for NDT. While methods like vibration analysis effectively monitor bearing defects13,14 and advanced hybrid techniques (e.g., EMAT combined with eddy current testing) are being developed for various flaws, 15 sensitivity to early-stage or smooth corrosion often remains limited.16,17 In contrast, electromagnetic acoustic emission (EMAE) is well-established for crack detection, leveraging localized current concentration and Lorentz forces at sharp crack tips.18–20 Its potential for corrosion, however, is less explored. Although corrosion lacks sharp features to focus current, its underlying electrochemical processes (e.g., metal dissolution) involve transient energy releases capable of generating acoustic emission (AE). 21 Research on Kaiser and Felicity effects in composites and granular media underscores the value of AE memory effects in characterizing damage progression.22,23 Moreover, correlated Kaiser effects observed in concurrent AE and electromagnetic radiation monitoring reveal a fundamental link between stress memory and electromagnetic-acoustic phenomena. 24 This suggests that the active excitation and response analysis intrinsic to EMAE could be adapted to probe corrosion activity.
To address this gap, this study employs a comparative experiment with intact and electrochemically corroded Q235 steel plates simulating storage tank conditions. This work introduces a novel strategy for detecting active corrosion by combining high-intensity pulsed current excitation with advanced time-frequency analyses like short-time Fourier transform and wavelet packet decomposition. Unlike conventional methods that focus on geometric flaws, our approach investigates the dynamic response of corrosion activity itself. We aim to develop new diagnostic criteria derived from unique acoustic emission signatures, specifically characteristic frequency bands and the Kaiser effect, generated during electromagnetic stimulation. This methodology offers a new means for active corrosion identification and establishes a foundation for a proactive non-destructive testing protocol for tank bottom plates.
2. Method
2.1. Experimental specimen preparation
The experimental material is Q235 steel, processed into a rectangular specimen with the size of 150 ×150 ×15 mm, the blank control group is set up as plate 1, and the experimental group is set up as plate 2. Plate 1 is not subjected to electrochemical corrosion treatment, only PVC pipe is bonded in the center of the steel plate, and 100 mL of deionized water is added to the PVC pipe to simulate the liquid filling situation of the storage tank. A circular area with a radius of 25 mm at the center of the Plate 2 specimen was subjected to constant-current electrochemical corrosion treatment to simulate uniform corrosion on the tank bottom. The specimen served as the anode and was connected to the positive terminal of the DC power supply. A graphite rod acted as the cathode, connected to the negative terminal. Both the specimen and the graphite rod were immersed in a 0.1 mol/L NaCl electrolyte solution contained within a PVC tube. A constant current of 0.001 A was applied for 2 hours to induce galvanic corrosion. A schematic of this electrochemical corrosion setup is shown in Figure 1, while schematic diagrams of the setups for the plate 1 and plate 2 are provided in Figure 2. The electromagnetic acoustic emission experimental system is illustrated schematically in Figure 3. Experimental setup for electrochemical corrosion. Schematic diagram of sample preparation device: (a) Diagram of the experimental setup for plate 1 and (b) Diagram of the experimental setup for plate 2. Schematic diagram of electromagnetic acoustic emission experimental system.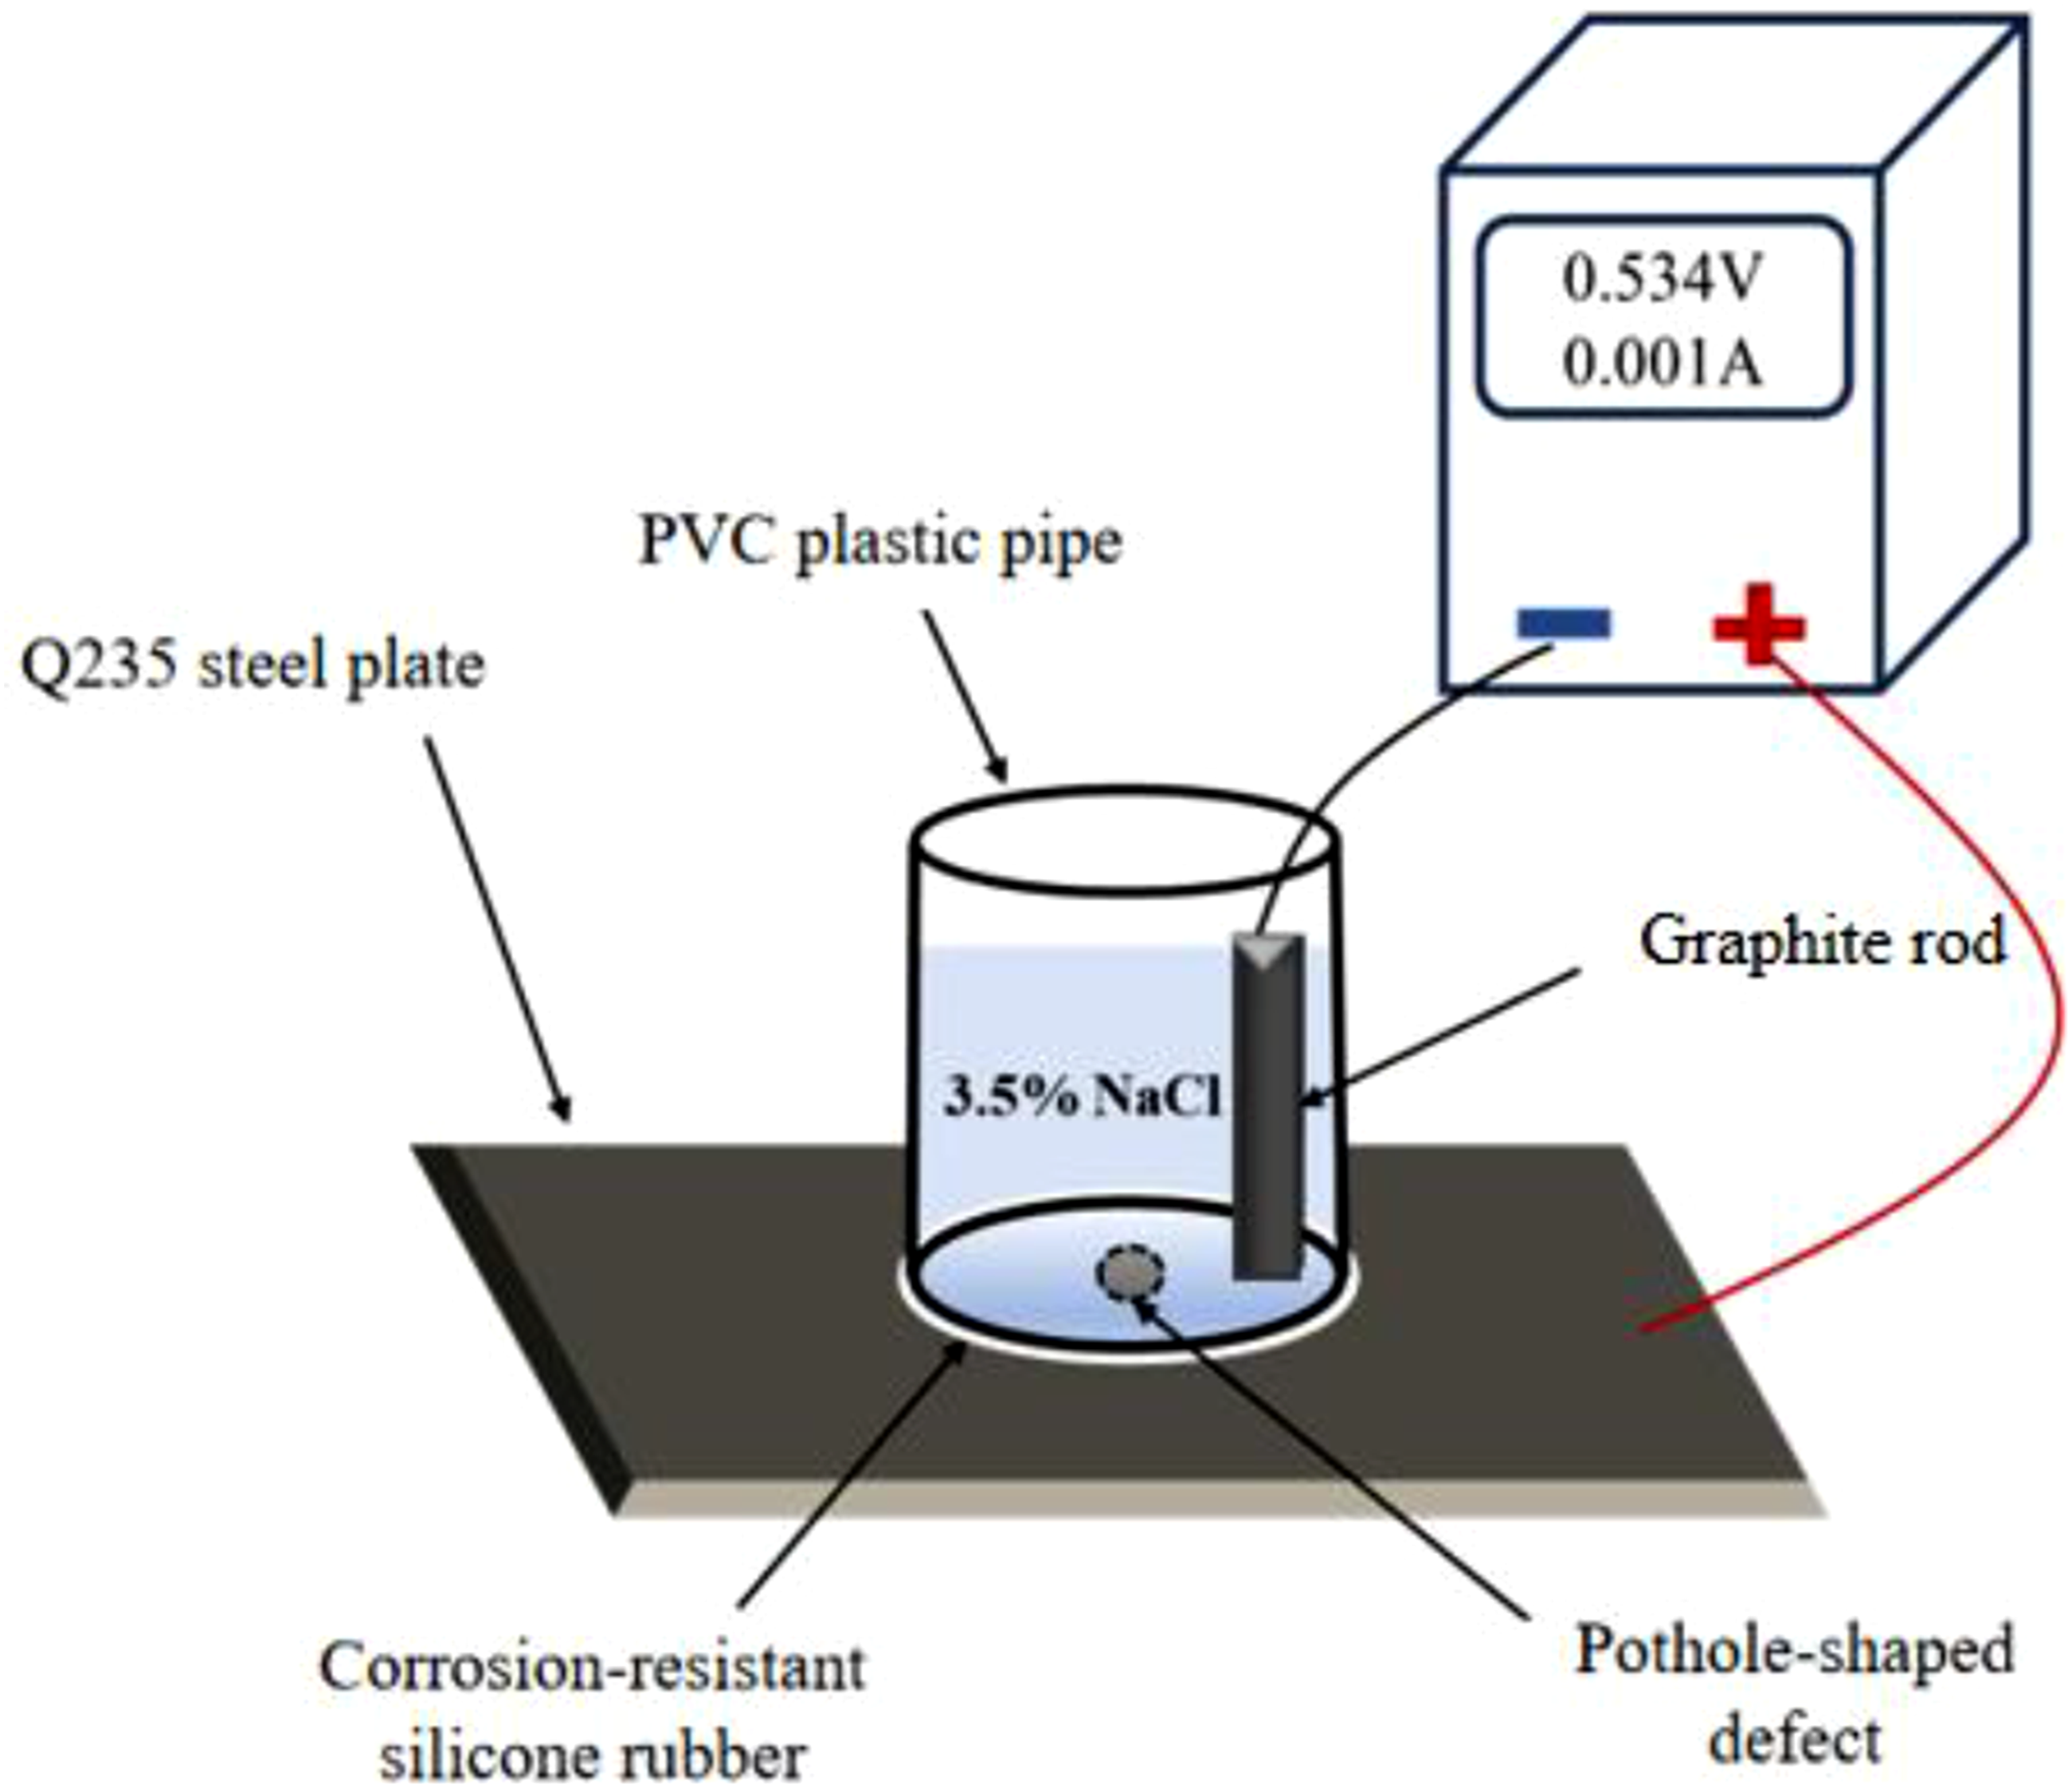

2.2. Experimental system setup
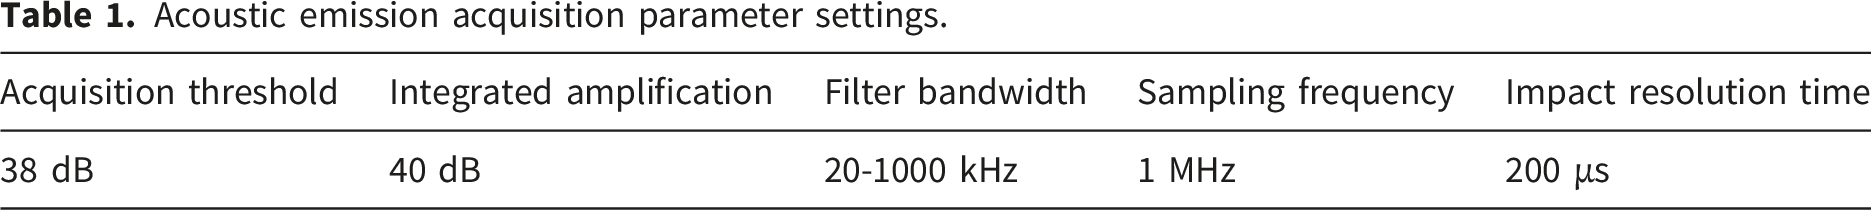
Acoustic emission acquisition parameter settings.
The electromagnetic loading strategy adopted in the experiment is to repeat the current of 1.00 kA, 1.24 kA, 1.44 kA, 1.78 kA and 2.56 kA to the specimens of plate 1 and plate 2 in sequence, and the number of loading times of a single group is four times, aiming at exploring the effects of different current sizes and repeated loading on the electromagnetic acoustic emission (EMAE) signal intensity. During the experimental process, the full waveform was captured by the acquisition system, and the acquired acoustic emission signals were analyzed in terms of waveform characteristics and time-frequency joint analysis, so as to extract the electromagnetic acoustic emission signal characteristics related to corrosion defects.
3. Experimental results and analysis
3.1. Feasibility verification of EMAE detection for corrosion defects based on positioning accuracy
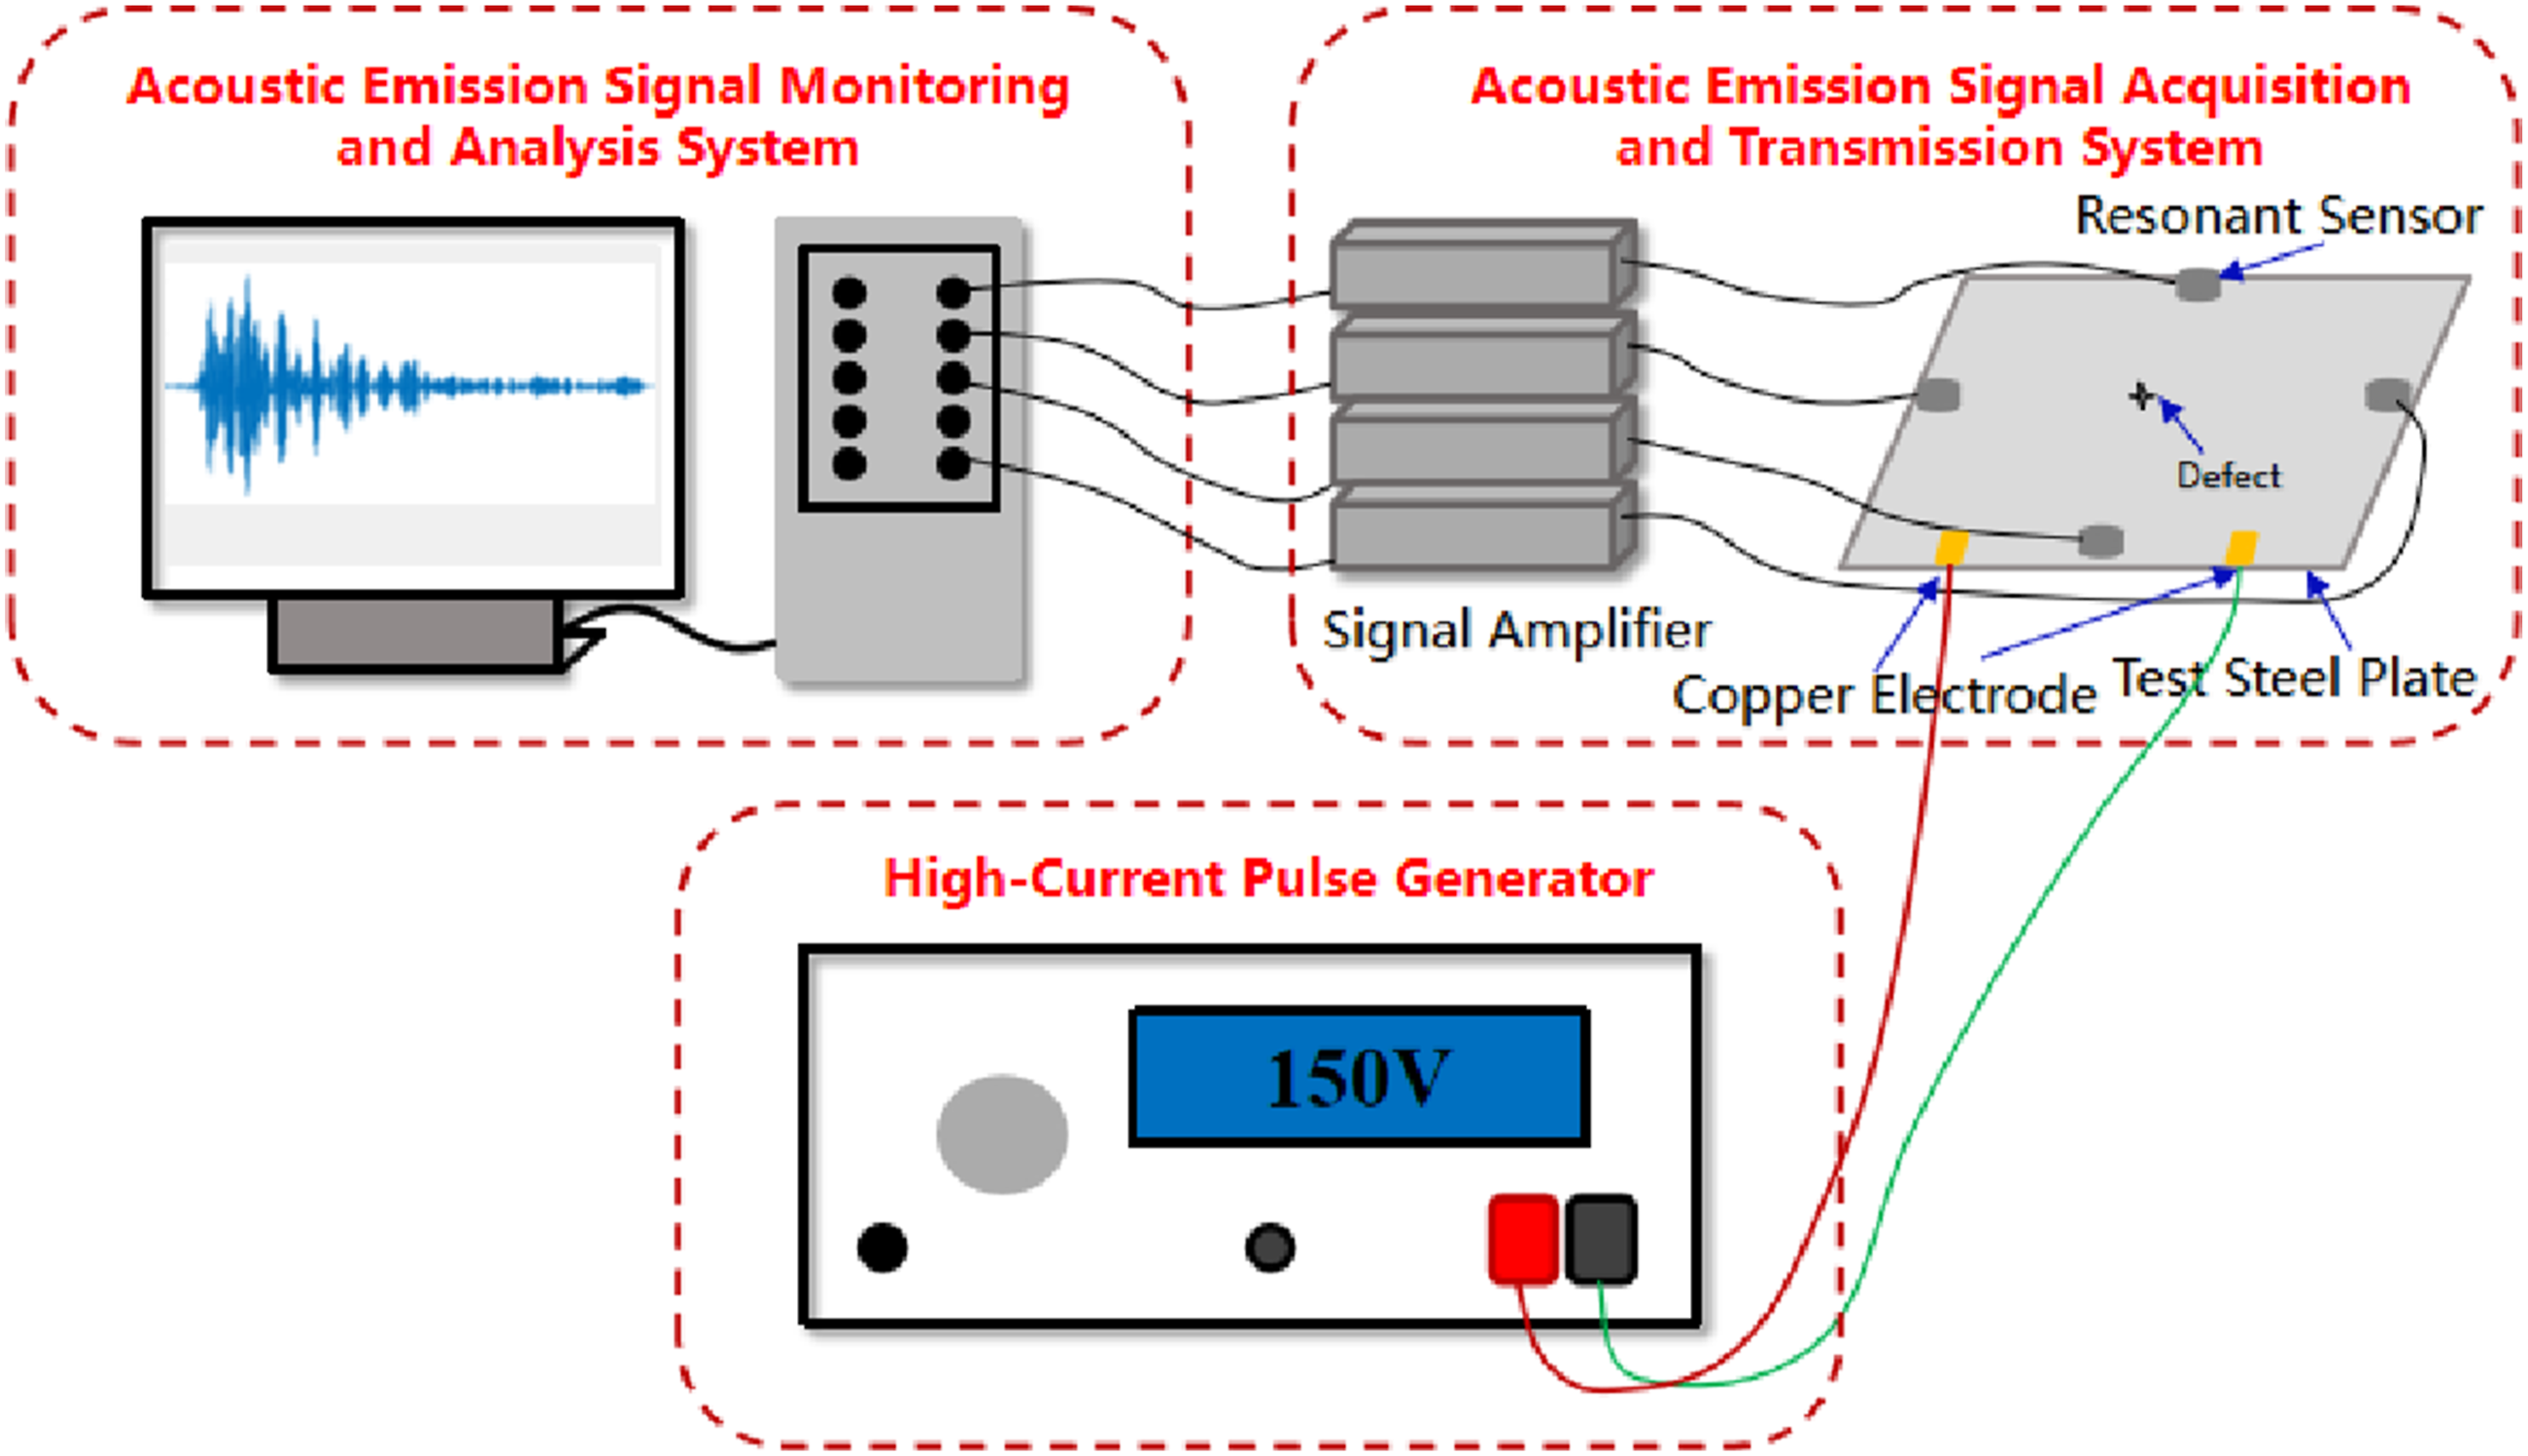
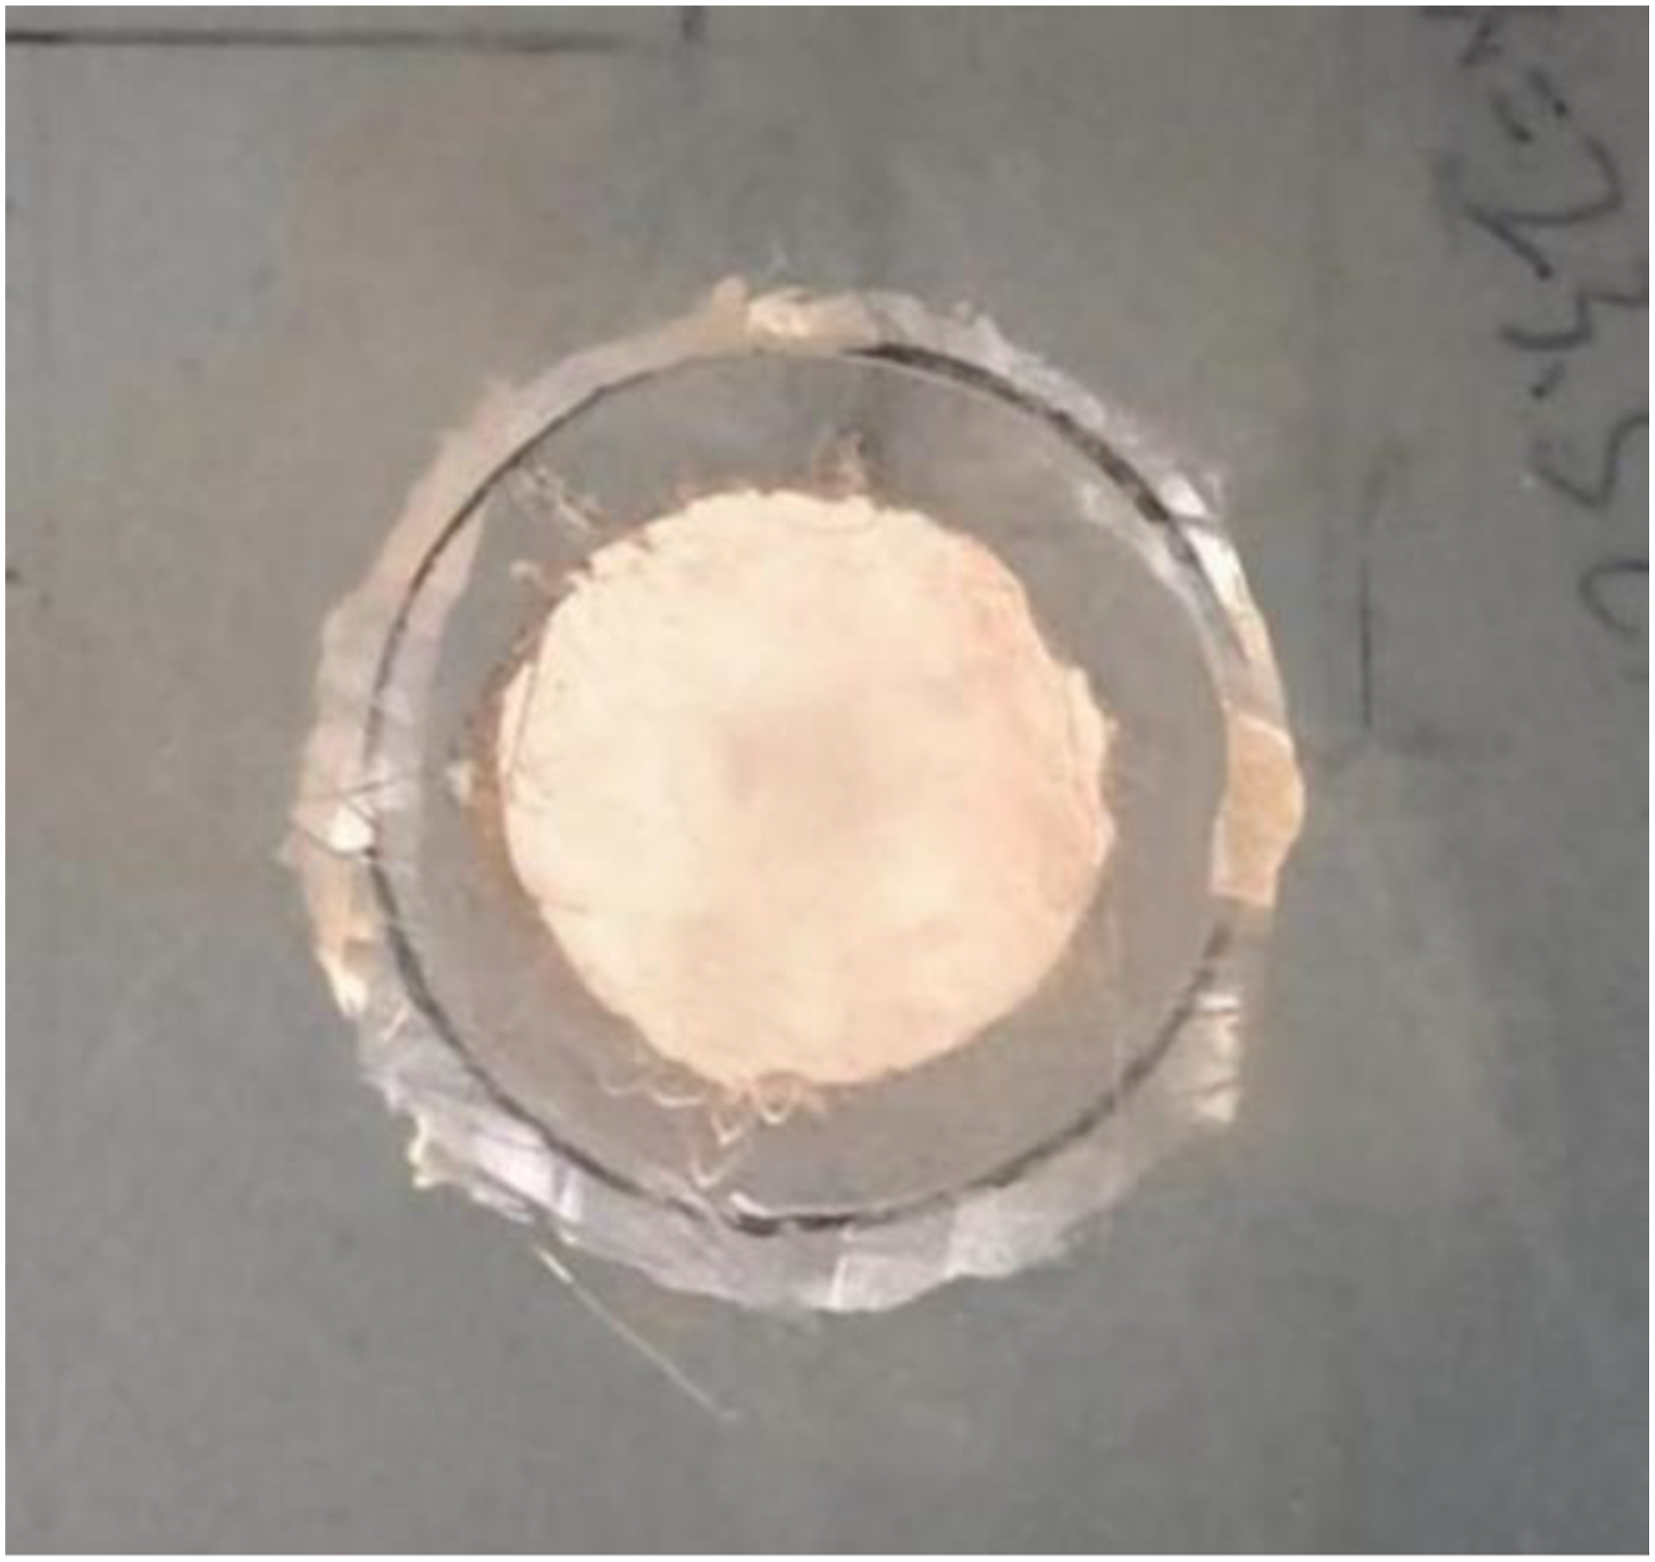
To fundamentally verify that the electromagnetic acoustic emission (EMAE) signals originate from the preset corrosion defect and to evaluate the detection capability of this method under conditions close to actual service, an independent localization verification experiment was first conducted on a large-scale Q235 steel plate (450 mm × 500 mm × 5 mm). As shown in Figure 4, four acoustic emission sensors were arranged in a diamond-shaped array. A circular area with a radius of 25 mm at the center of the test plate was subjected to electrochemical corrosion treatment (parameters consistent with those described in Section 2.1) to simulate early-stage uniform corrosion. Its macroscopic morphology is shown in Figure 5, indicating a relatively mild corrosion degree without the formation of significant corrosion pits. To systematically explore the detection threshold, short-duration high-current pulses of 800 A, 1.34 kA, 1.64 kA, 2 kA, 2.16 kA, 2.32 kA, and 2.48 kA were applied four times each. Positioning experimental device diagram. Corrosion damage condition.
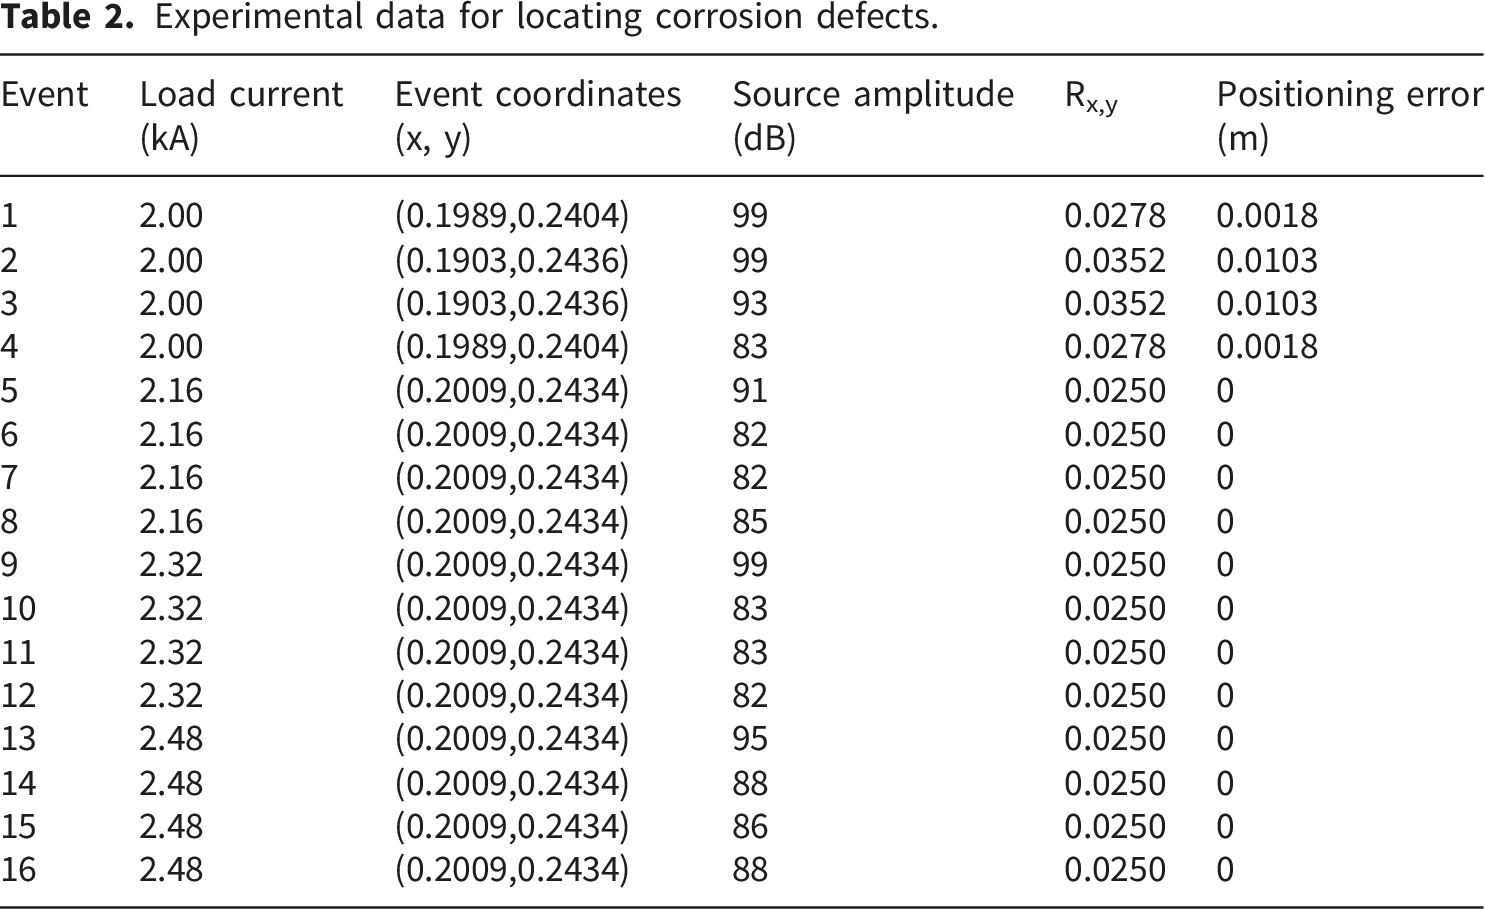
The results show that when the pulsed current was below 2 kA, the system could only capture sporadic hit signals but failed to form valid localized events. However, when the current reached or exceeded 2 kA, clear acoustic emission events could be consistently triggered and successfully located. The two-dimensional localization results, as illustrated in Figure 6, demonstrate that the event sources were highly concentrated within and along the edge of the preset corrosion zone. Quantitative analysis further revealed (as shown in Table 2) that for the vast majority of events, the distance between the located coordinates and the corrosion center was less than or equal to the radius of the corroded area (25 mm), indicating minimal localization error. This provides conclusive evidence for the spatial correlation between the EMAE signals and the corrosion defect. Furthermore, a significant attenuation in the amplitude of the acoustic emission signals was observed during the repeated loading experiments. This is a typical manifestation of the Kaiser effect, confirming from the perspective of the irreversibility of energy release that the signals originated from genuine microstructural changes within the material, rather than from external electromagnetic interference. Two-dimensional plane localization results of acoustic emission events. Experimental data for locating corrosion defects.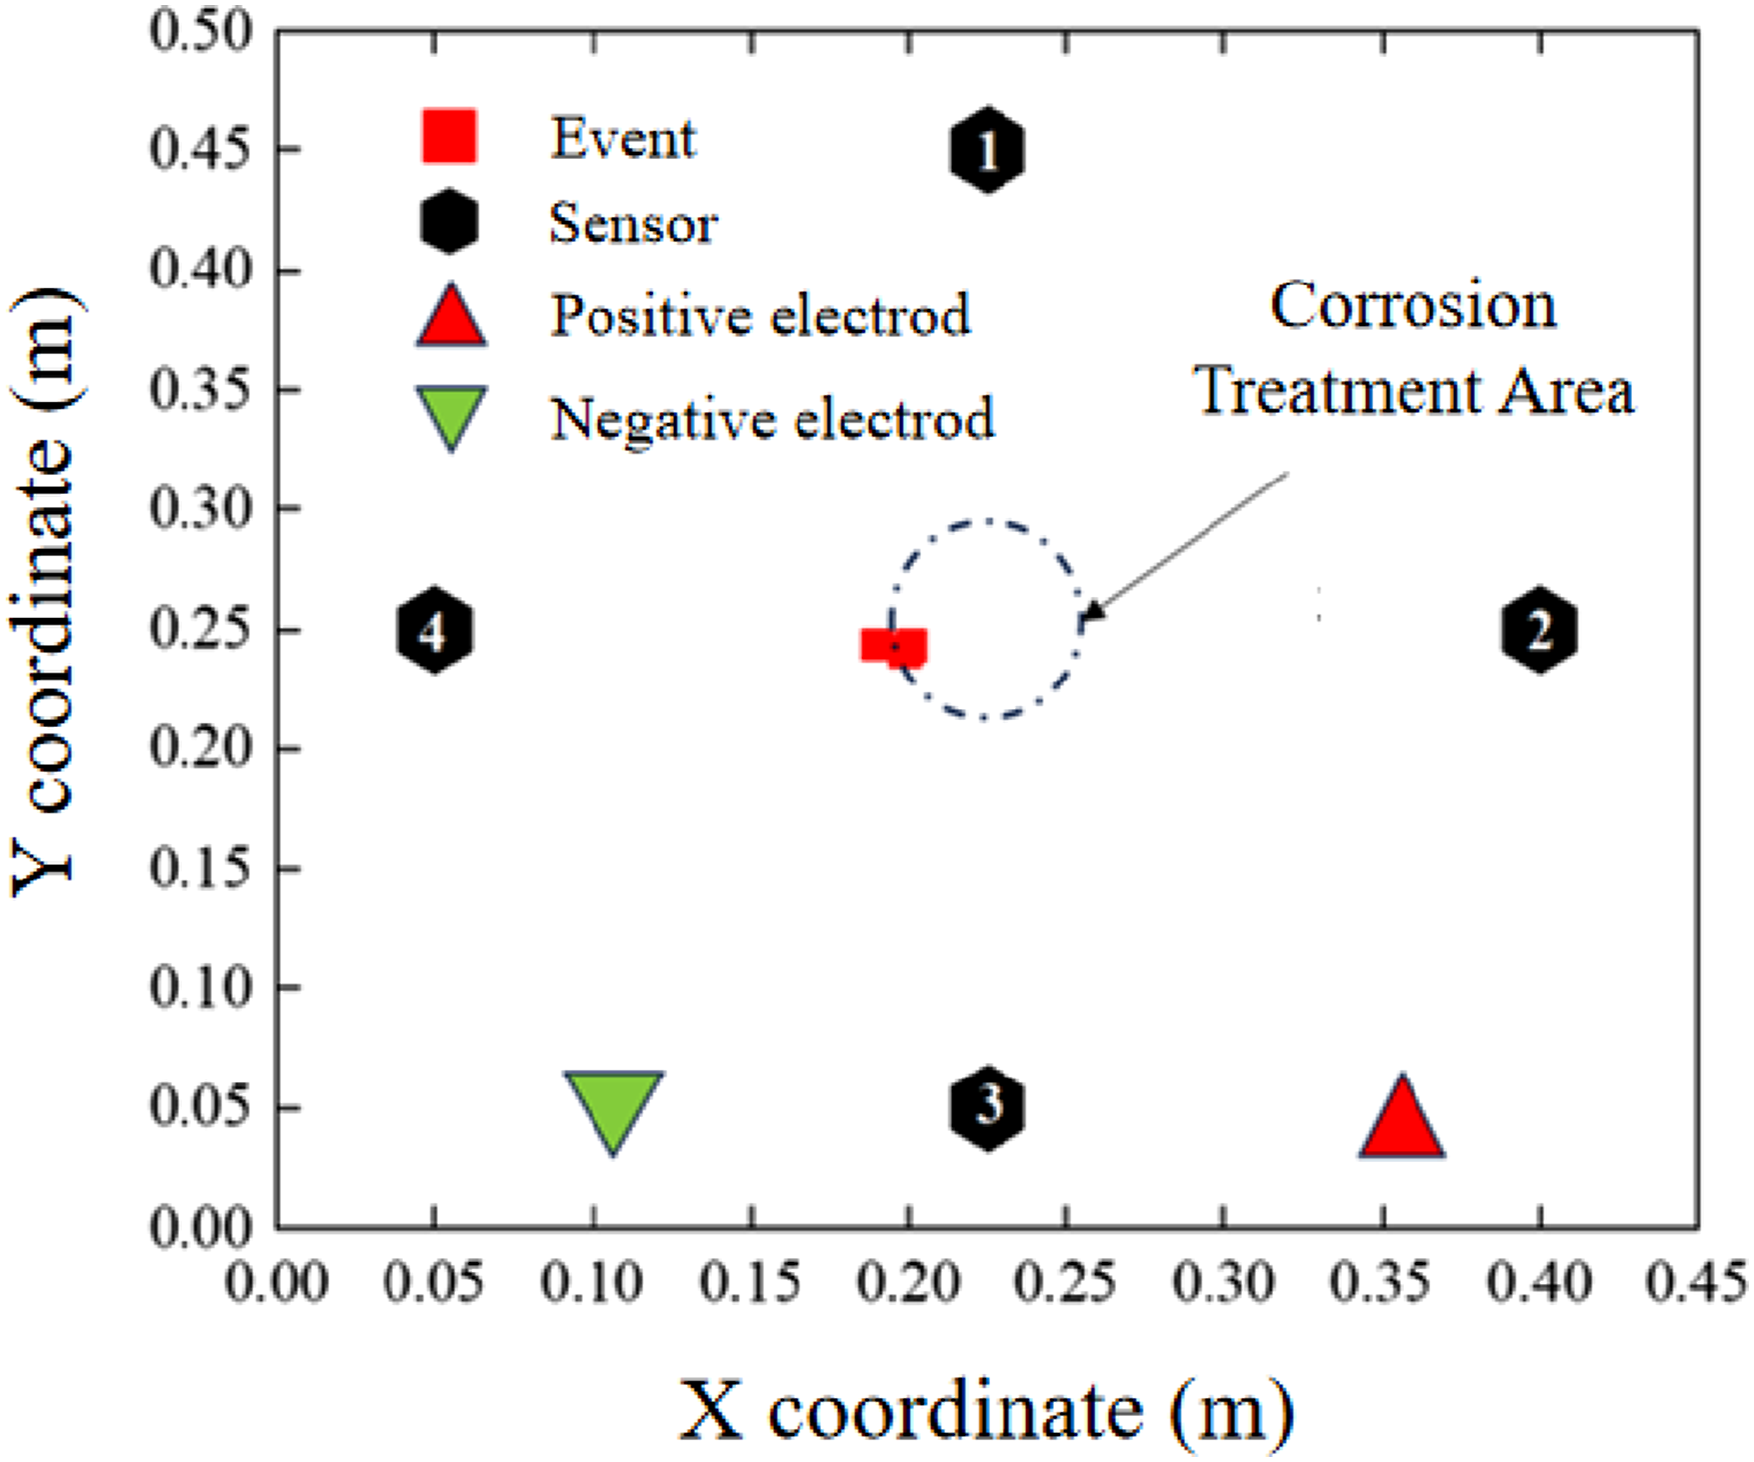
At the determined detection threshold (≥2 kA), EMAE technology can effectively identify and accurately localize early-stage uniform corrosion defects. It is noteworthy that even though no localized events were formed below the 2 kA threshold, the presence of hit signals itself suggests that the corrosion defect had already initiated activity under lower energy excitation.
3.2. Effect of current magnitude and repeated loading on acoustic emission signal amplitude
The magnitude of the pulsed high current directly determines the size of the current density at the defect.
26
Kaiser effect is a typical feature of acoustic emission signals, that is, when the same load is repeatedly loaded, the acoustic emission signal energy will decay, or even no longer occurs, based on this feature can be collected whether the signal is acoustic emission signals to discriminate. The electromagnetic acoustic emission signals obtained by repeated loading of plate 1 and plate 2 with different sizes of currents, and their signal amplitudes are shown in Figure 7. Effect of current magnitude and number of repetitions on signal amplitude: (a) Signal amplitude vs excitation current for Plate 1 and (b) Signal amplitude vs excitation current for Plate 2.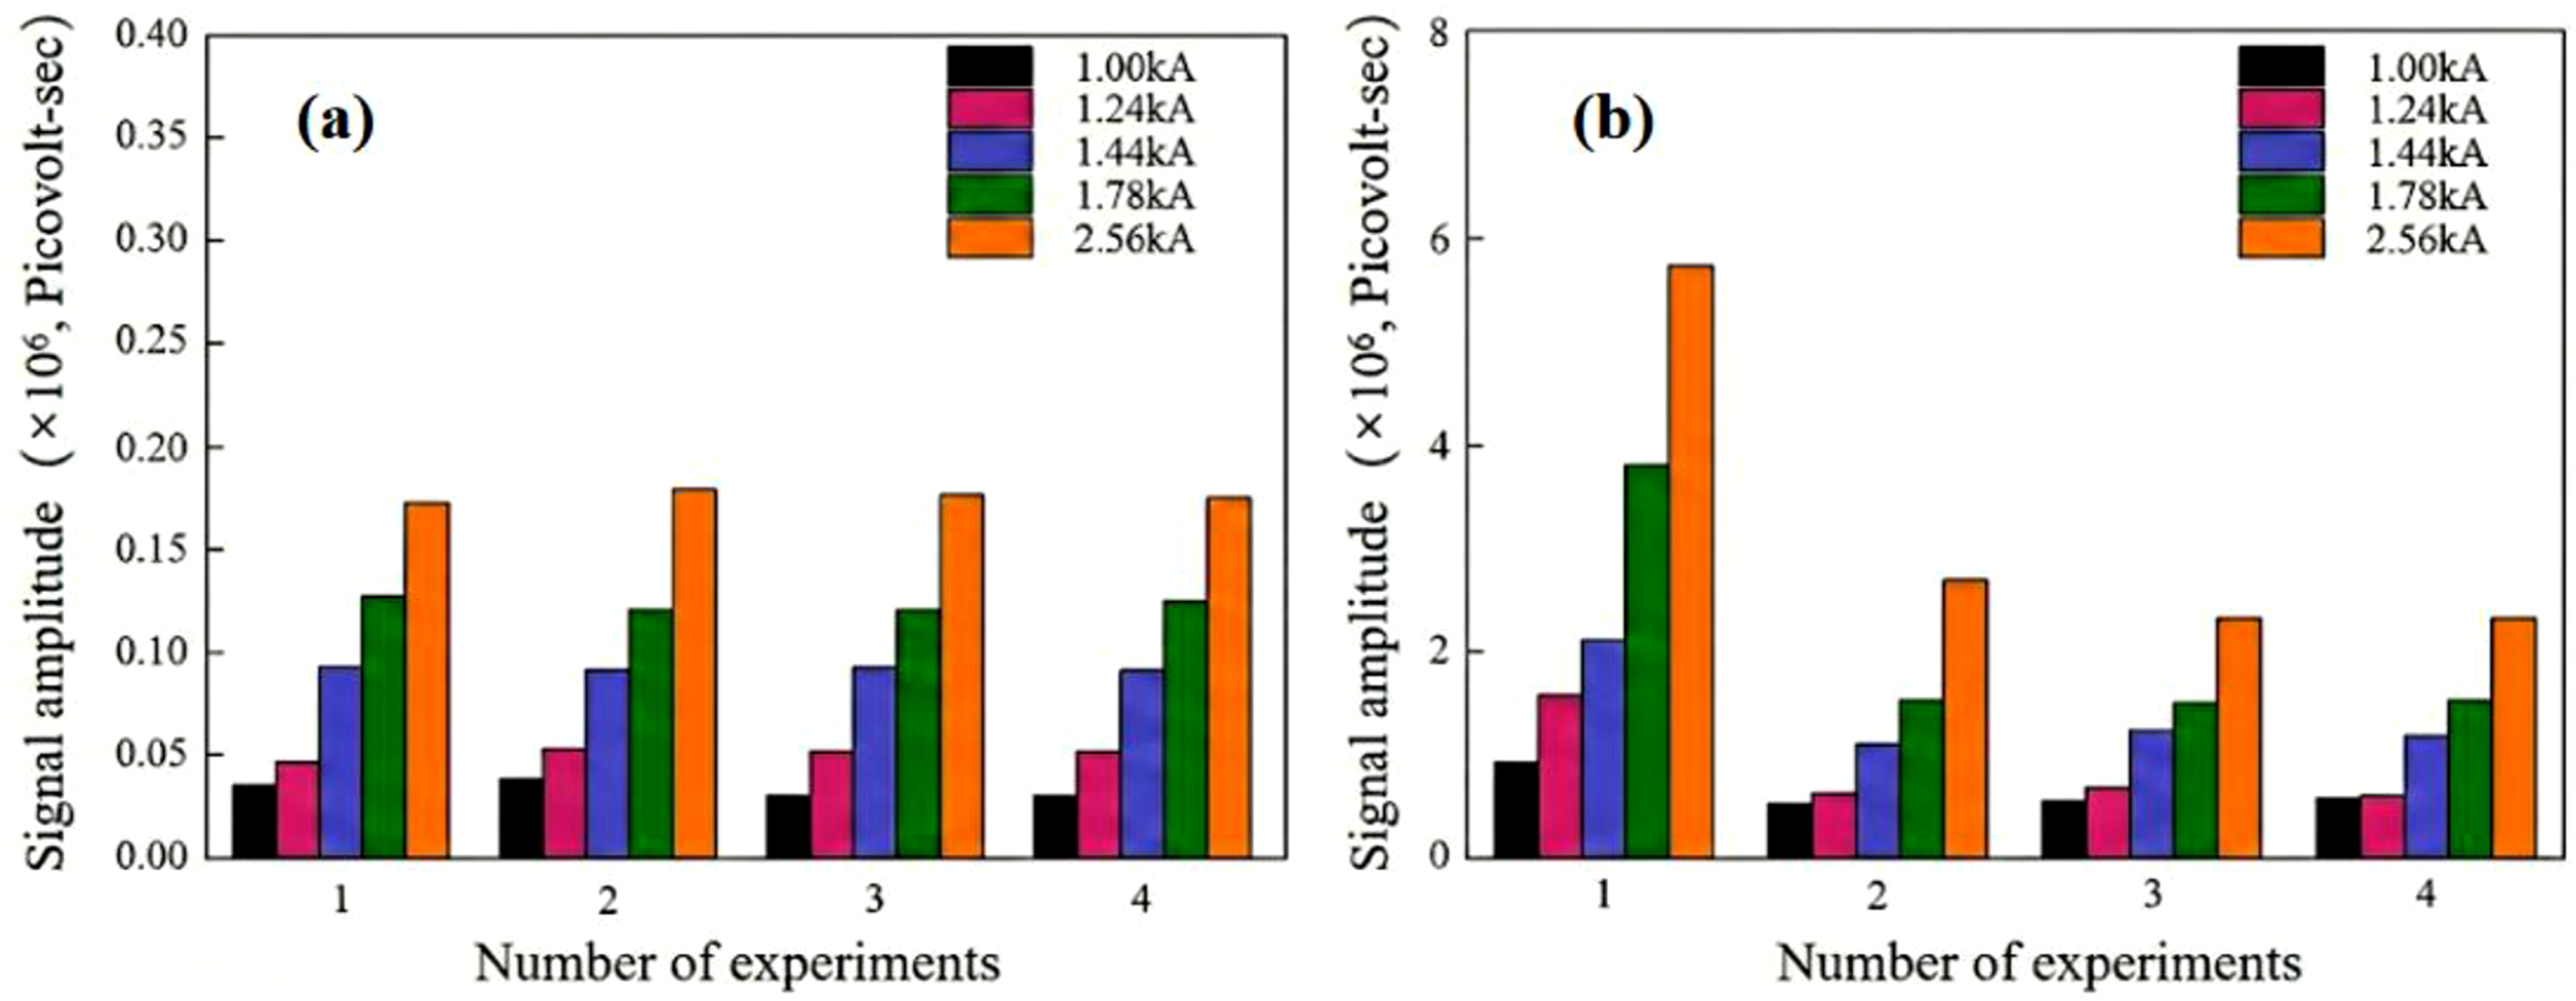
As can be seen from Figure 7, the current strength and signal amplitude are approximately linear, the signal amplitude increases with the increase of current strength, and the signal amplitude in plate 2 is significantly larger than that in plate 1. Repeated loading has almost no effect on the signal amplitude of plate 1, while the signal amplitude of plate 2 shows a significant attenuation during repeated loading, which is especially dramatic during the 2nd loading, in line with the Kaiser effect. This phenomenon reflects the nature of the Kaiser effect, i.e., the energy of the acoustic emission signal will show a tendency of attenuation and even eventually disappear under the repeated action of the same load.
Therefore, the amplitude of the electromagnetic acoustic emission signal in plate 1 is determined by the current magnitude, while the electromagnetic acoustic emission signal in plate 2 is generated by the active defects, and the corrosion defects with the tendency to expand produce acoustic emission phenomena consistent with the Kaiser effect under the excitation of the short-time pulsed current.
3.3. Characterization parameter correlation analysis
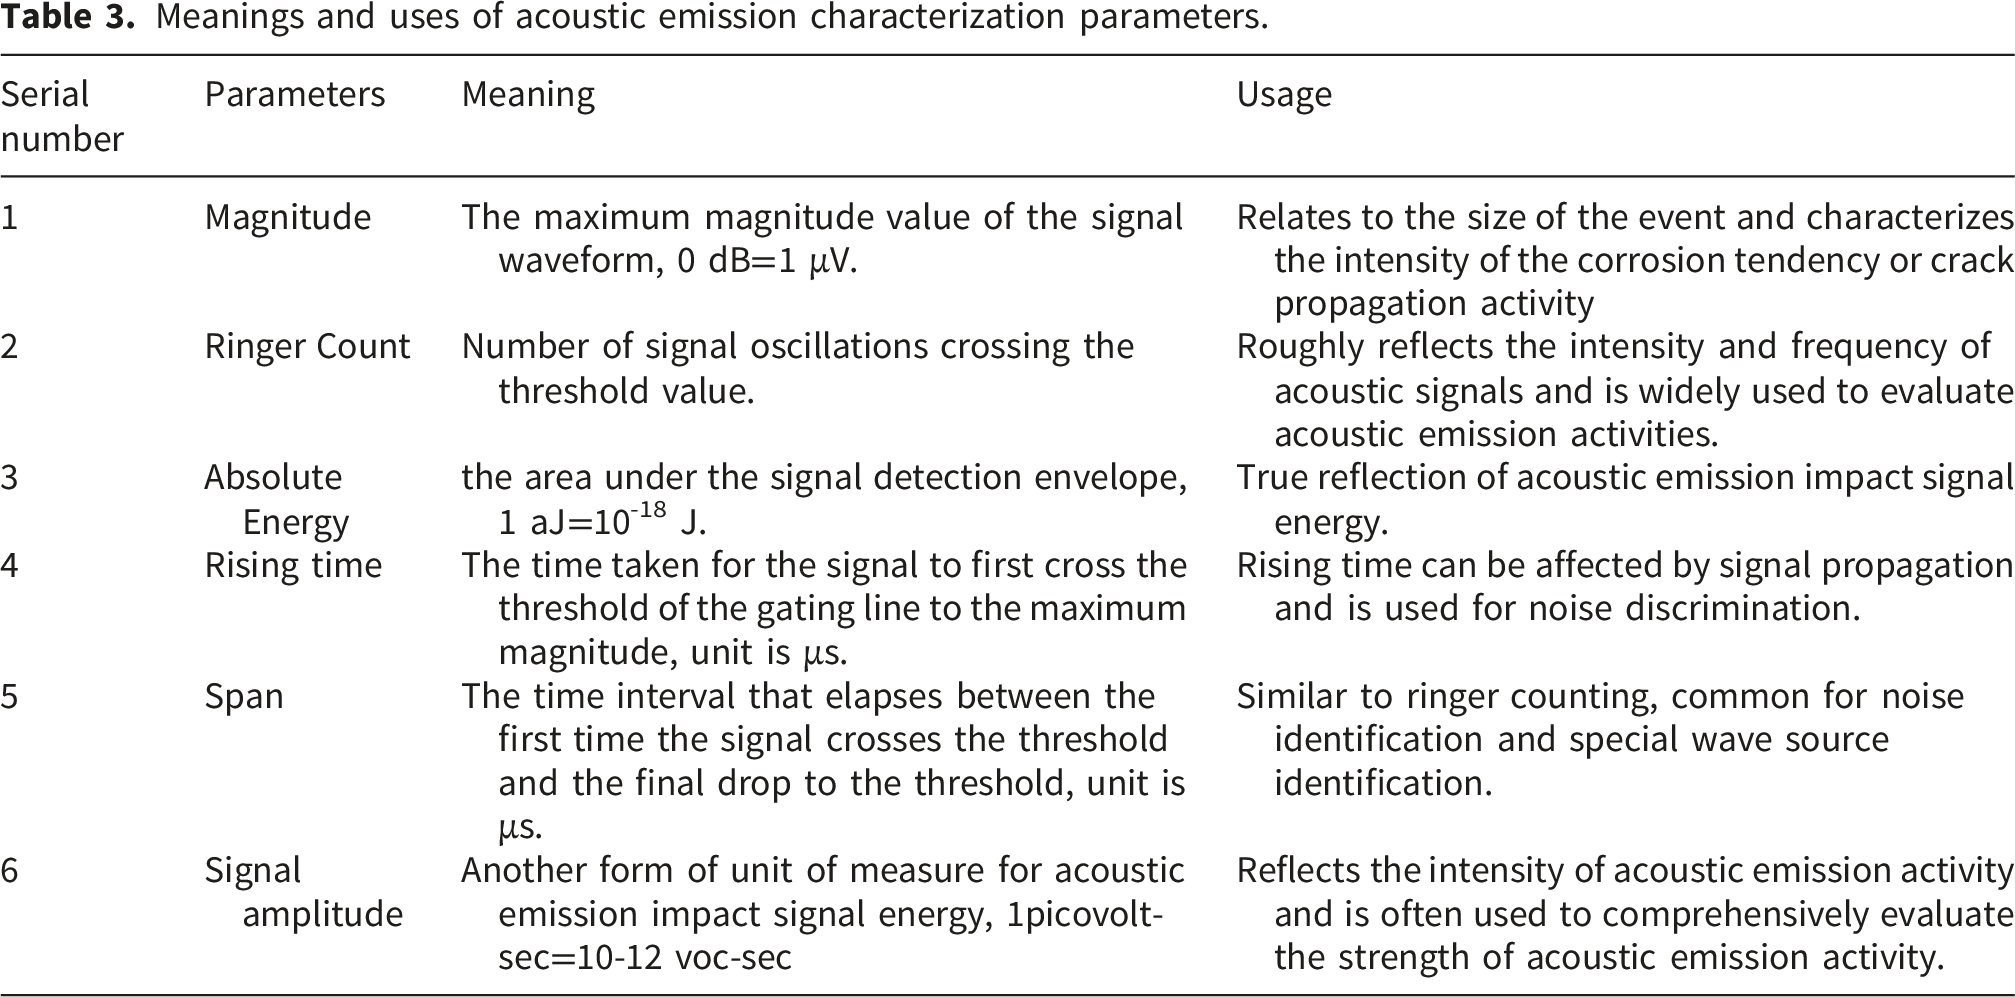
The generation of acoustic emission signals is closely related to the type and state of the acoustic emission source, so the acoustic emission signals contain information that can characterize the type of the source and the degree of damage. Acoustic emission signal characteristic parameter correlation analysis method is the most commonly used acoustic emission signal analysis method, which is the statistical relationship between any two signal parameters, this statistical relationship can be identified on the type of acoustic emission source, to a certain extent, to eliminate the interference of noise signals.27–29 The most commonly used characteristic parameters are magnitude, Rising time, span, ringing counts, absolute energy, etc. The schematic diagram of the commonly used parameters is shown in Figure 8, and the meanings and uses are shown in Table 3. Schematic diagram of acoustic emission signal characteristic parameters. Meanings and uses of acoustic emission characterization parameters.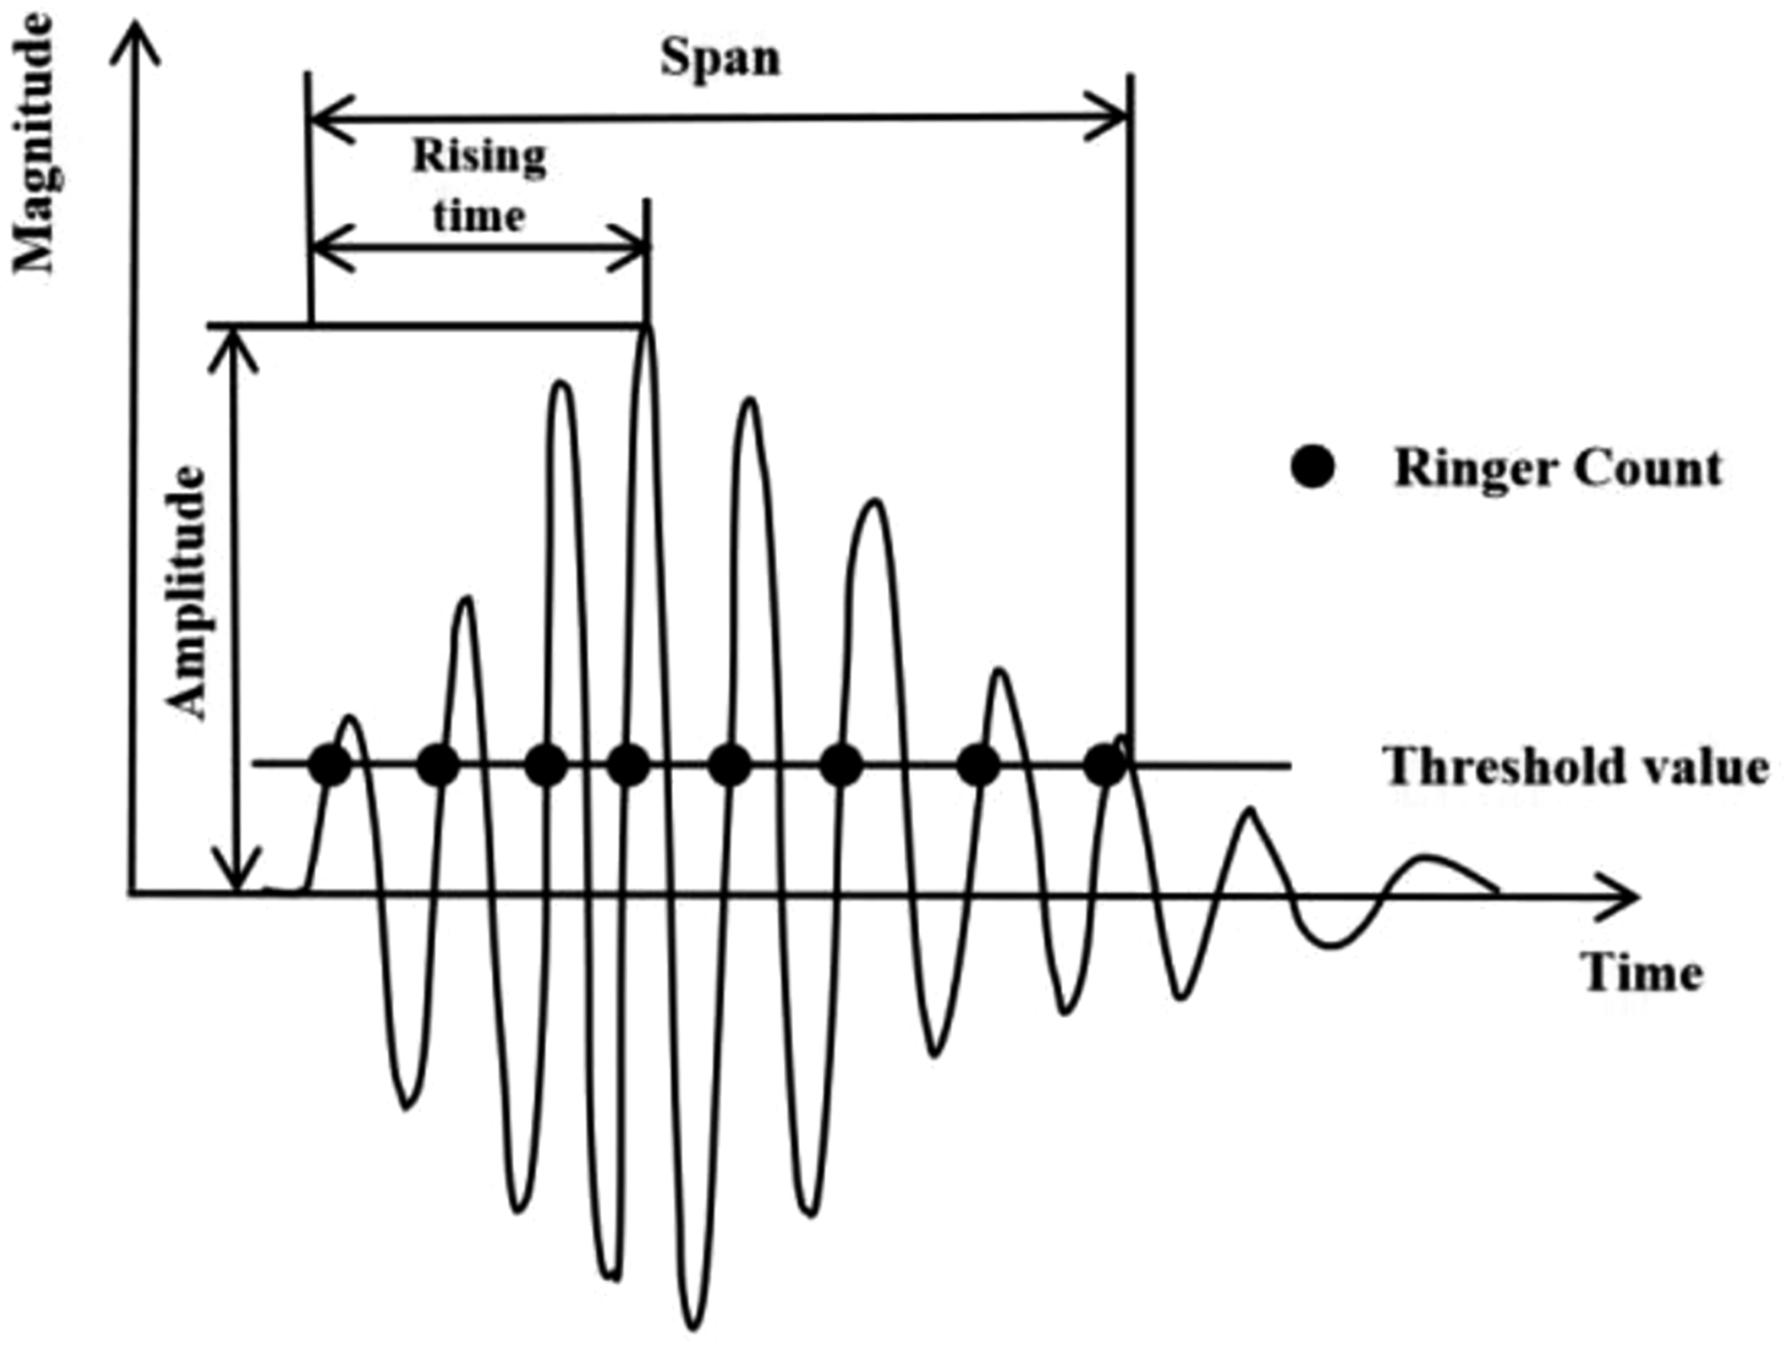
The correlation between the ringing count, rising time and span of the electromagnetic acoustic emission signals of the plate 1 and plate 2, respectively, and the magnitude of the signals is shown in Figure 9. From the magnitude correlation graph, it can be seen that the plate 1 board ringing count, span and magnitude show a good positive correlation, the plate 2 board of electromagnetic acoustic emission signal has a higher magnitude, ringing counts also rise significantly. The ratio of the Rising time to the magnitude characterizes the rise slope of the signal. The smaller slope in Plate 2 indicates that the electromagnetic acoustic emission signals generated by active corrosion defects exhibit a steeper waveform front and faster rise. Correlation of rising time, span, ringer counts and magnitude: (a) rising time vs magnitude, (b) span vs magnitude and (c) ringer counts vs magnitude.
Another typical characteristic parameter of acoustic emission signals is span, the correlation between ringer counts, absolute energy and span. As shown in Figure 10, the ringer counts and span of plate 1 show a significant linear correlation, and the absolute energy has a specific functional relationship with the span. In addition, the signal generated in plate 2 significantly outperforms plate 1 in terms of both ring count and span. Correspondingly, the absolute energy of the signals in plate 2 also reached a higher level. Correlation of span with absolute energy and ringing counts: (a) ringing counts vs span and (b) absolute energy vs span.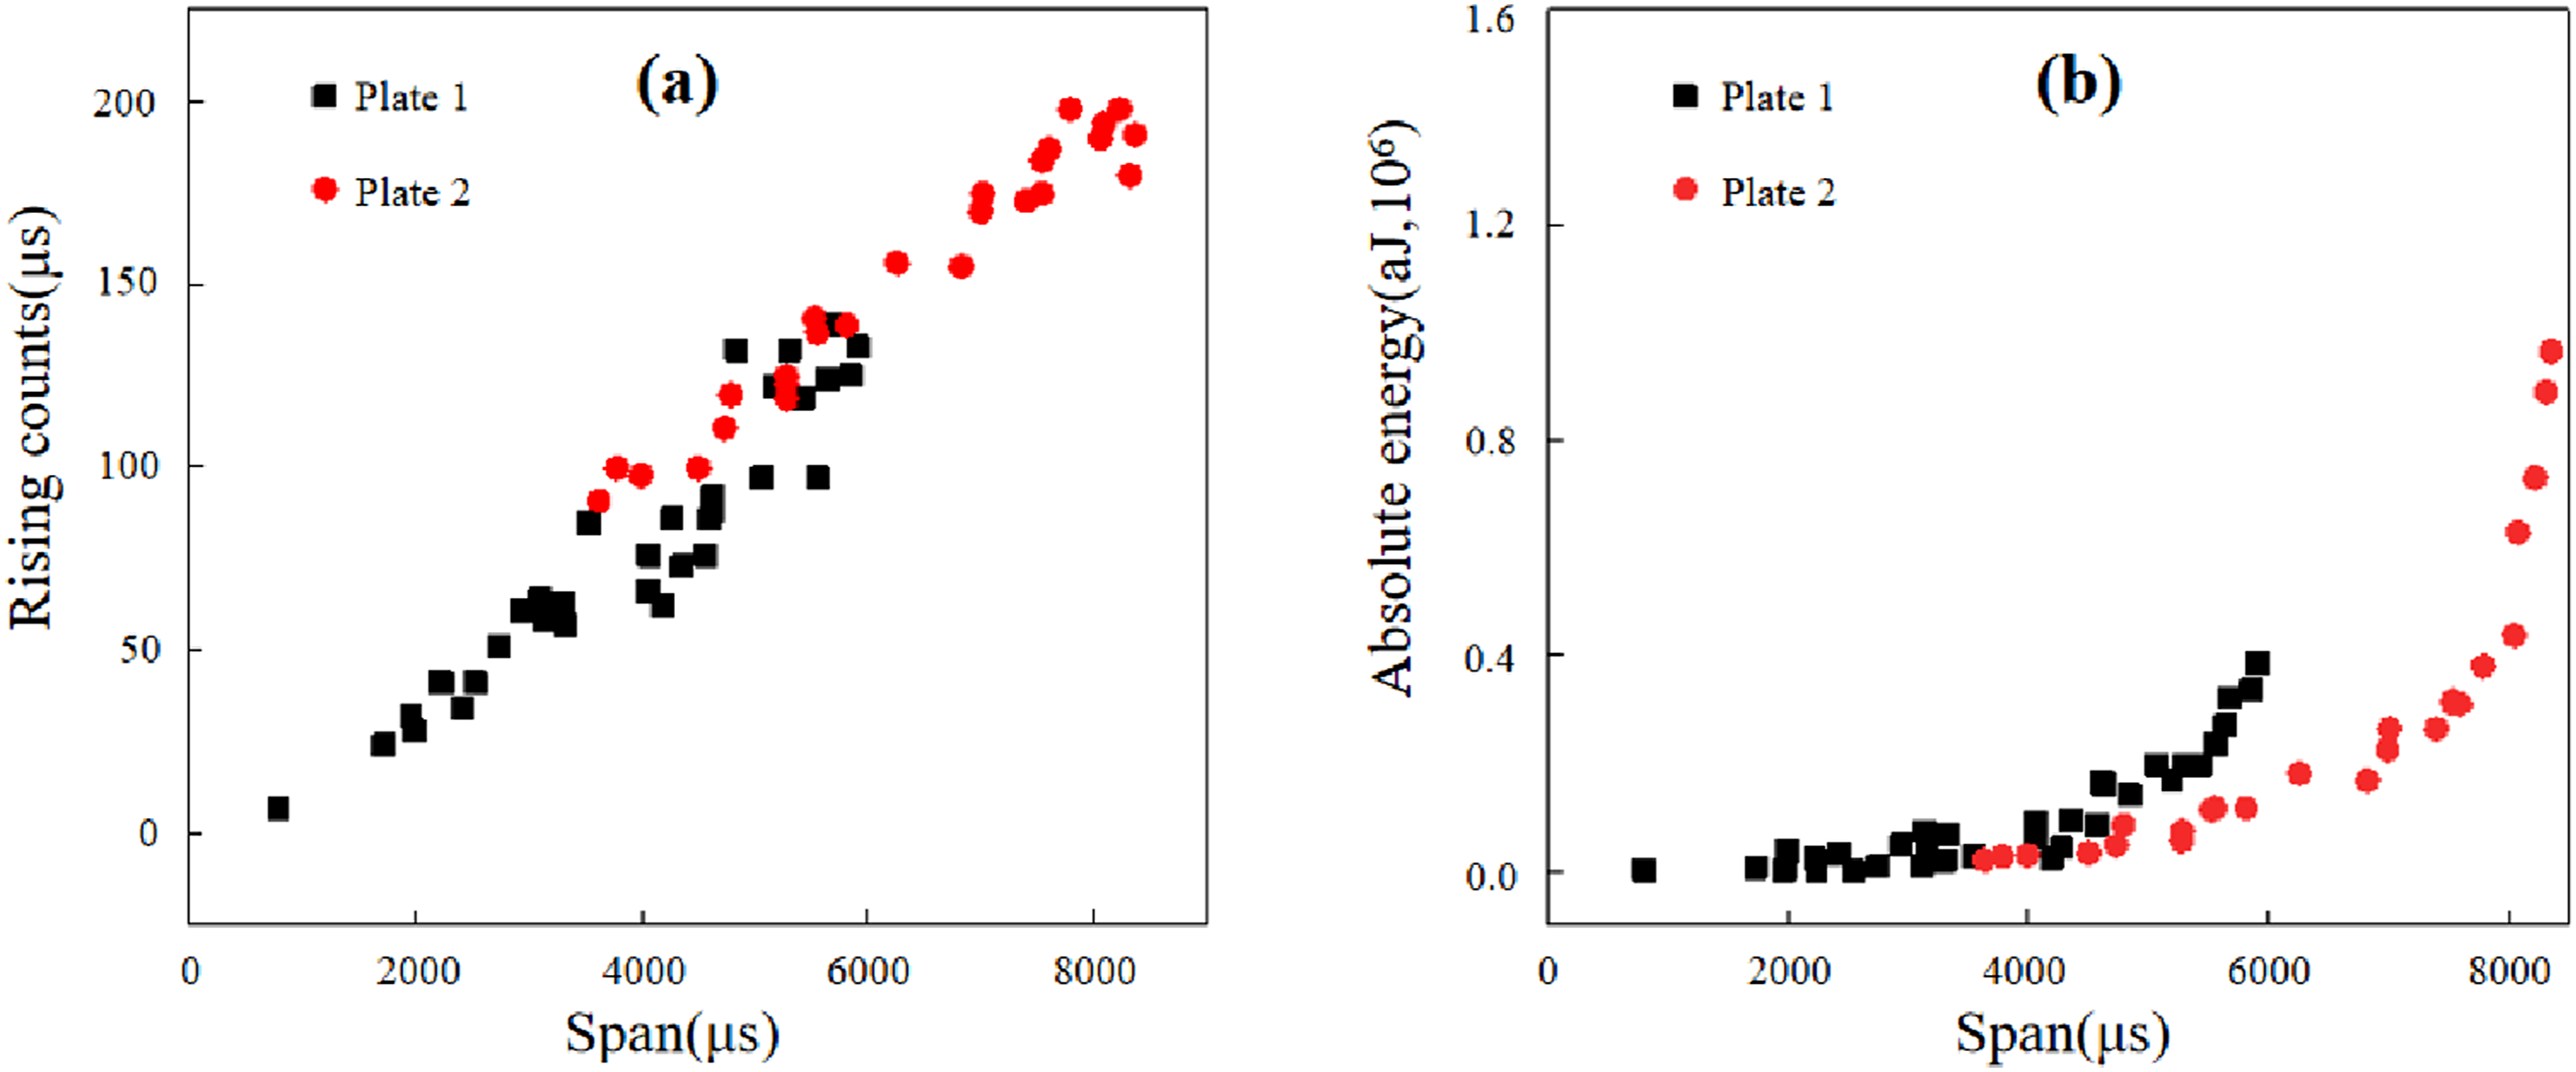
In summary, the electromagnetic acoustic emission signals of plate 1 and plate 2 have obvious differences in all kinds of typical parameter correlation analysis diagrams, which is the nature of the acoustic emission source is different, these signal characteristics can be used for the subsequent electromagnetic acoustic emission technology based on the corrosion defects in the bottom plate of the storage tanks corrosion defects detection and identification of the basis for discrimination.
3.4. Time-frequency analysis of signal based on short-time Fourier transform (STFT) and wavelet packet analysis
The waveform analysis is based on the time-domain waveform of the acoustic emission signal collected by the acoustic emission instrument, and the acoustic emission source information is obtained by time-frequency analysis of the transient waveform.30,31 Since the characteristic parameters only extract some local features of the signal waveform, the time-domain waveform contains richer acoustic emission source information than the characteristic parameters.
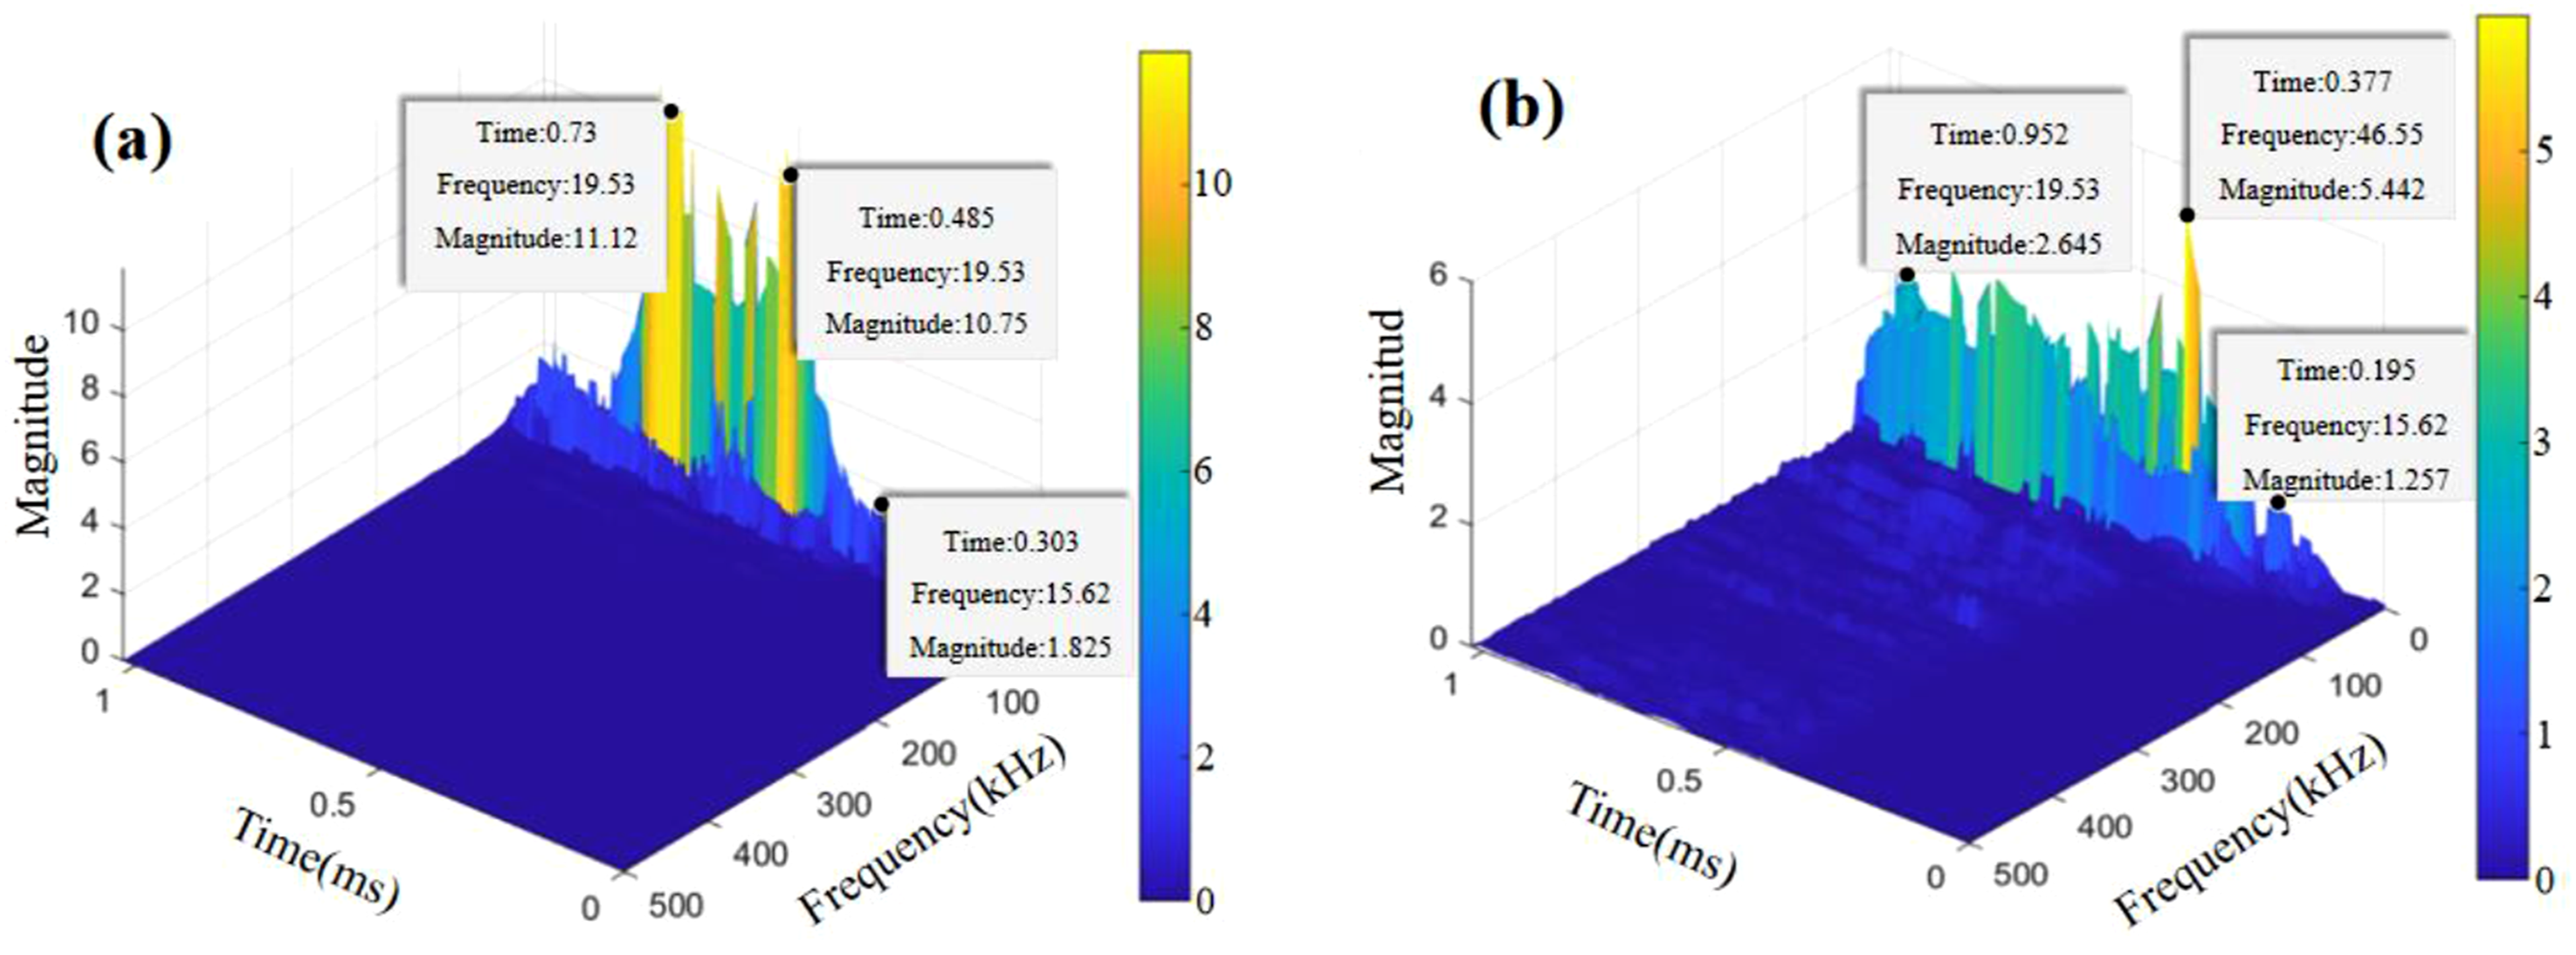
Taking the analysis results of the electromagnetic acoustic emission signal under 1000 A current excitation as a demonstration, the signal spectrum after STFT transformation and the time-frequency relationship after STFT-CS processing are shown in Figures 11 and 12. As can be seen from the figure, the characteristic frequency range in plate 1 is narrower, mainly concentrated below 35 kHz, and the peak frequency changes with time, mainly appearing after 200 μs, while the signal spectrum in plate 2 is wider, with new peaks appearing at 40∼50 kHz and throughout. STFT transformed spectrum of electromagnetic acoustic emission signal: (a) Plate 1 frequency-amplitude curve and (b) Plate 2 frequency-amplitude curve. Time-frequency relationship spectrum after STFT-CS processing: (a) Plate 1 time-frequency diagram and (b) Plate 2 time-frequency diagram.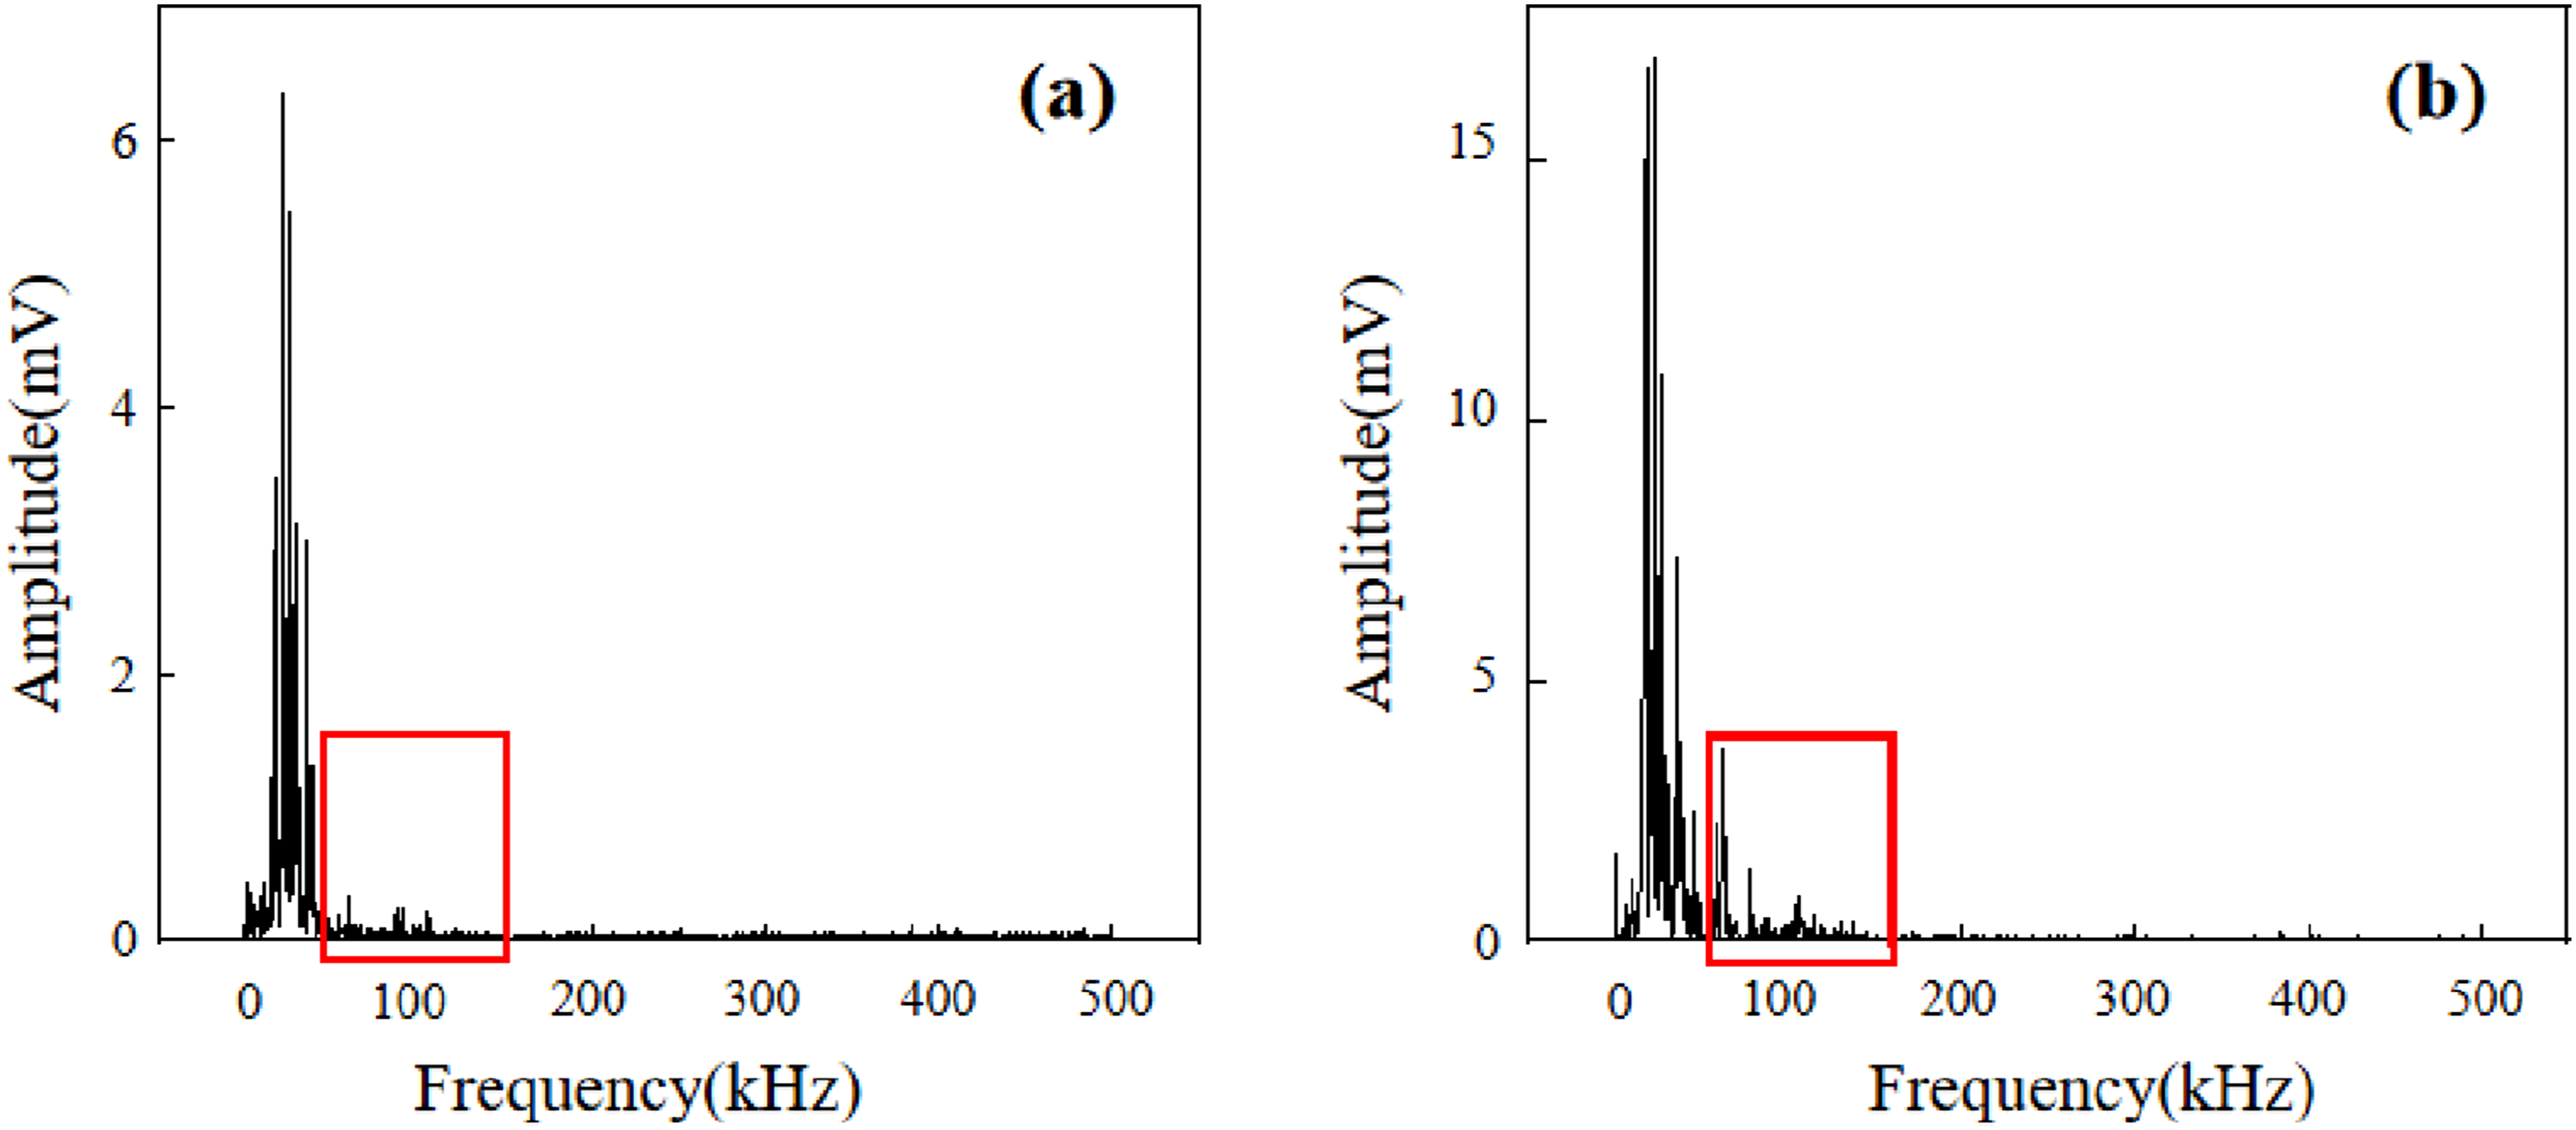
On the basis of the STFT analysis results, the frequency band layers are divided based on the wavelet packet decomposition principle. The selection of the wavelet packet decomposition level involves a critical trade-off between frequency resolution and computational complexity. In this study, the sampling frequency 
Spectral range of wavelet packet component reconstructed signals.
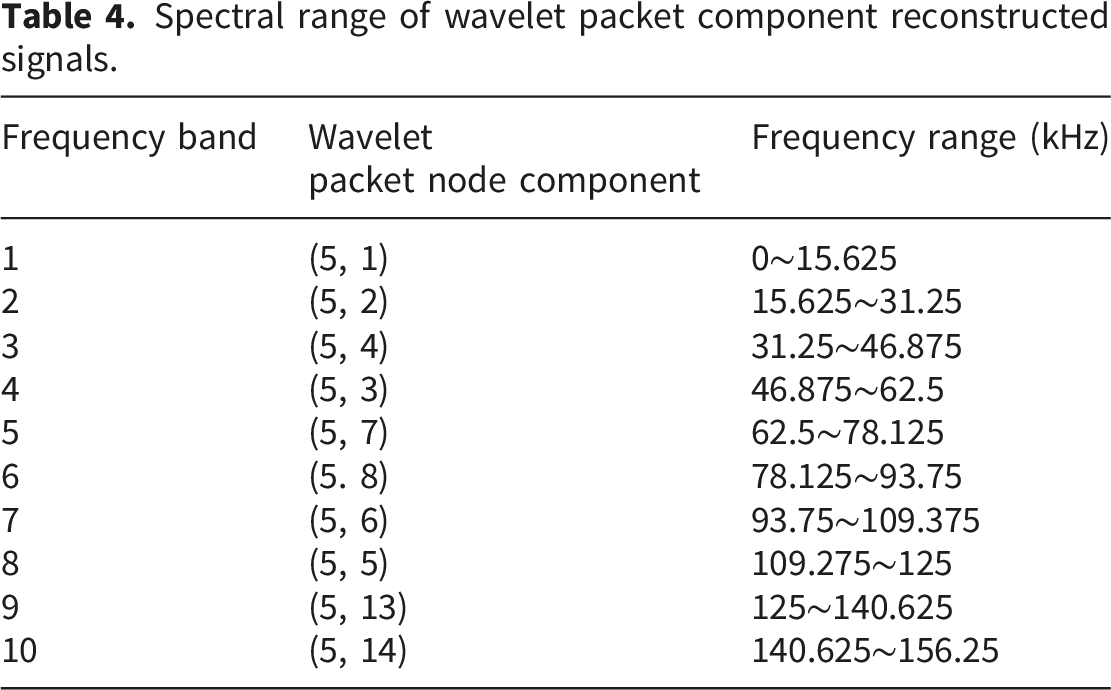
For the STFT analysis, a Hanning window with a length of 256 points (corresponding to 256 μs) and an overlap ratio of 50% was employed. This parameter set provides a frequency resolution of approximately 3.9 kHz, adequate for resolving spectral features in the tens of kHz range, while maintaining satisfactory continuity in the time dimension.
Figure 13 shows the energy distribution of the electromagnetic acoustic emission signals of the specimens before and after corrosion under 1000 A current loading in various frequency bands after wavelet packet analysis and processing, and the vast majority of the energy in the signals of plate 1 and plate 2 is concentrated in node (5, 1), node (5, 2) and node (5, 4), i.e., within the frequency band from 0 to 46.875 kHz. In contrast, a new component of the signal energy of the specimen signal of plate 2 appears at node (5, 3) from 46.875 to 62.5 kHz, which is a feature significantly different from that of plate 1 and consistent with the spectral characteristics of the waveform in Figure 11. Wavelet packet decomposition node energy spectrum coefficient entropy.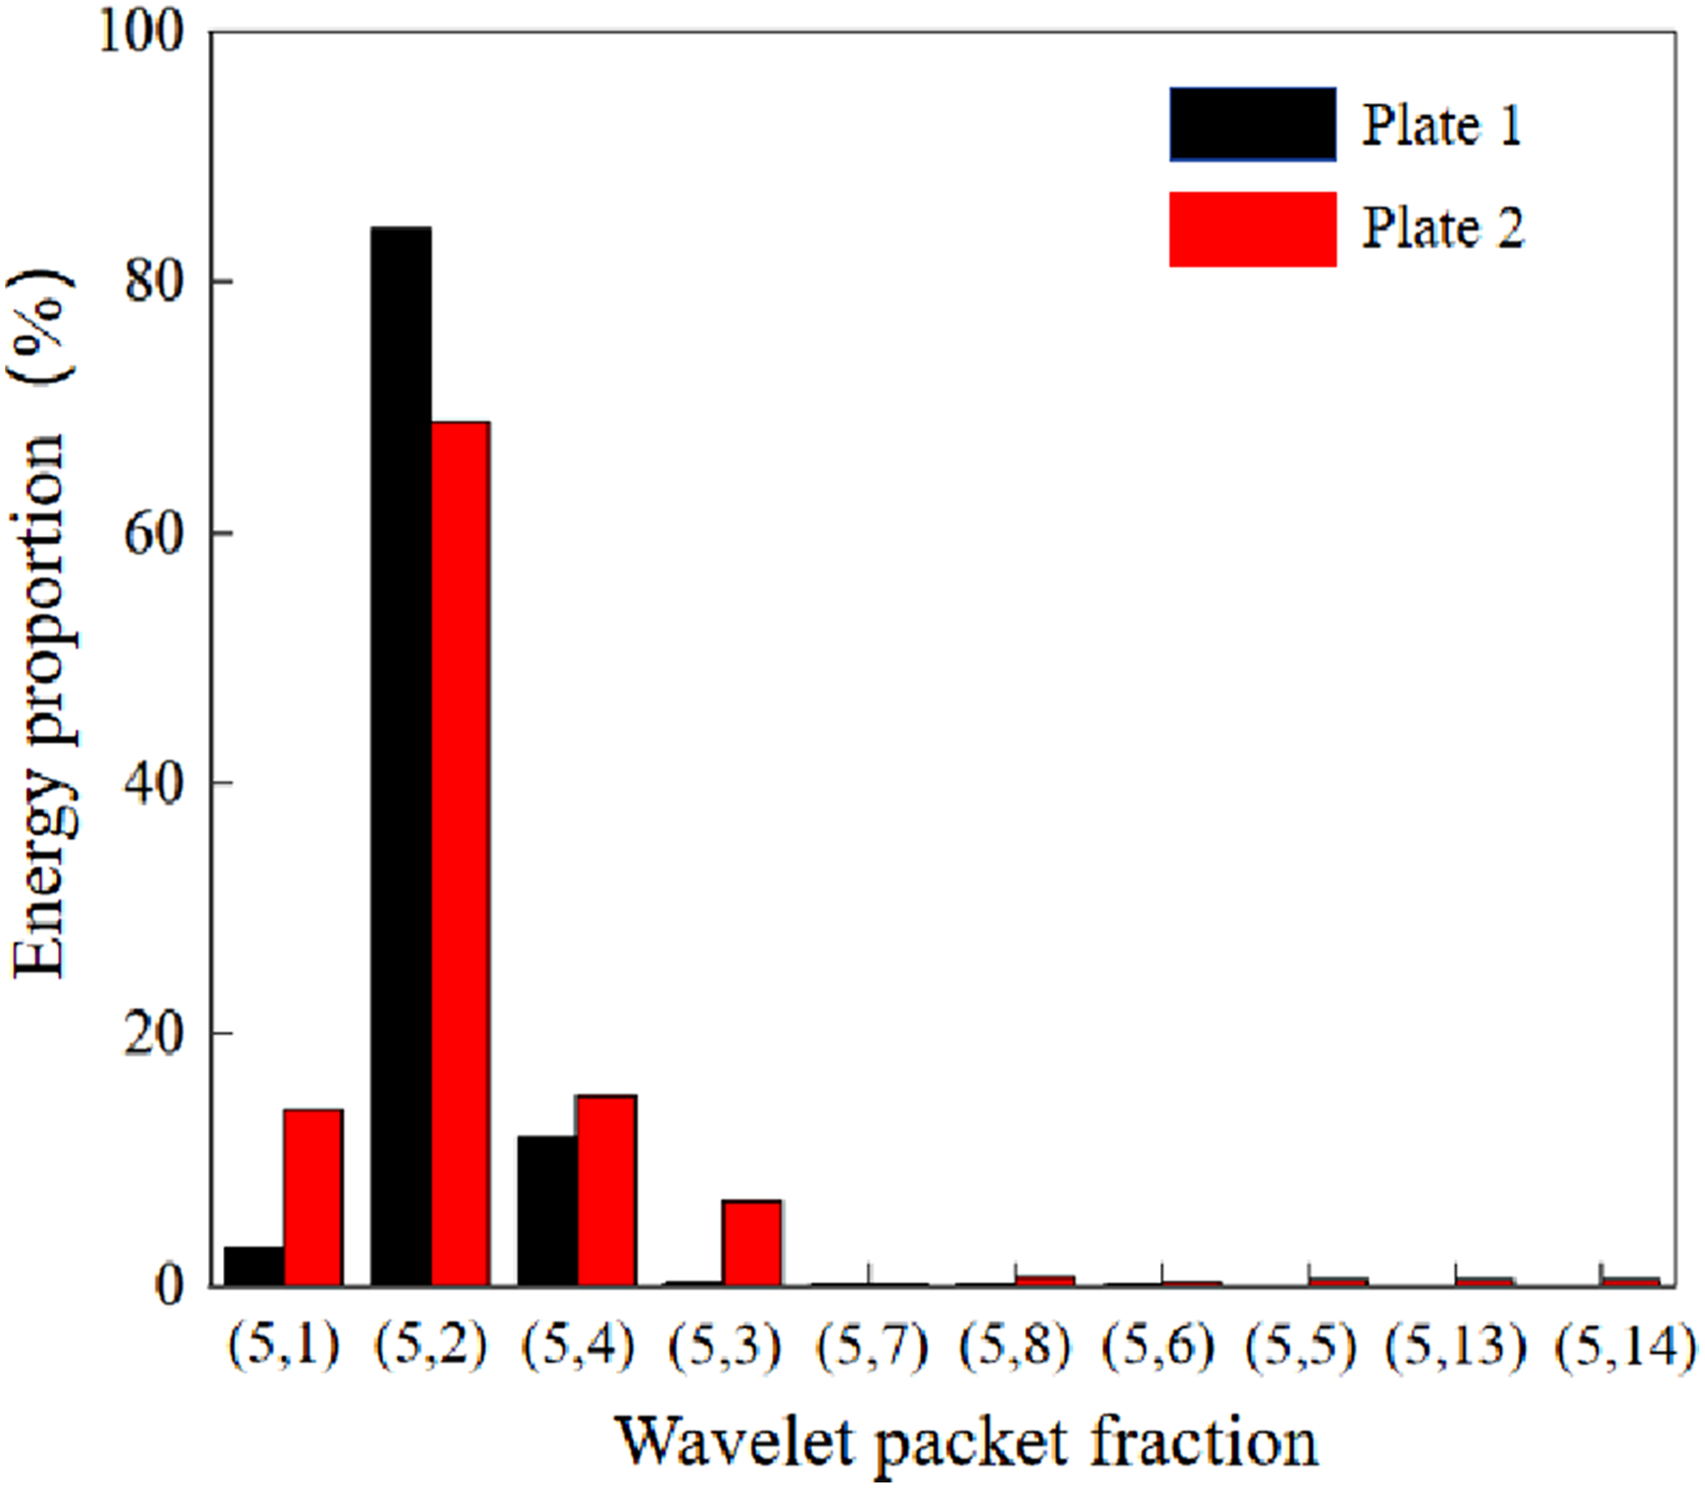
Electromagnetic acoustic emission (EMAE) signals were acquired from Plate 1 (intact) and Plate 2 (corroded) under four repeated loadings at a current of 1000 A, followed by wavelet packet decomposition and reconstruction. The energy proportions of each node are presented in Figure 14. As shown in the figure, the frequency-band energy distribution of Plate 1 remained nearly unaffected by repeated loading. In contrast, for Plate 2, the normalized energy proportion at node (5,3) (46.875–62.5 kHz) reached 6.77% during the first loading, which attenuated sharply after the second loading. The energy shares of the remaining nodes were almost unchanged under repeated loading. Repeated loading effect on electromagnetic acoustic emission signal band energy: (a) Plate 1 wave packet - normalized energy and (b) plate 2 wave packet - normalized energy.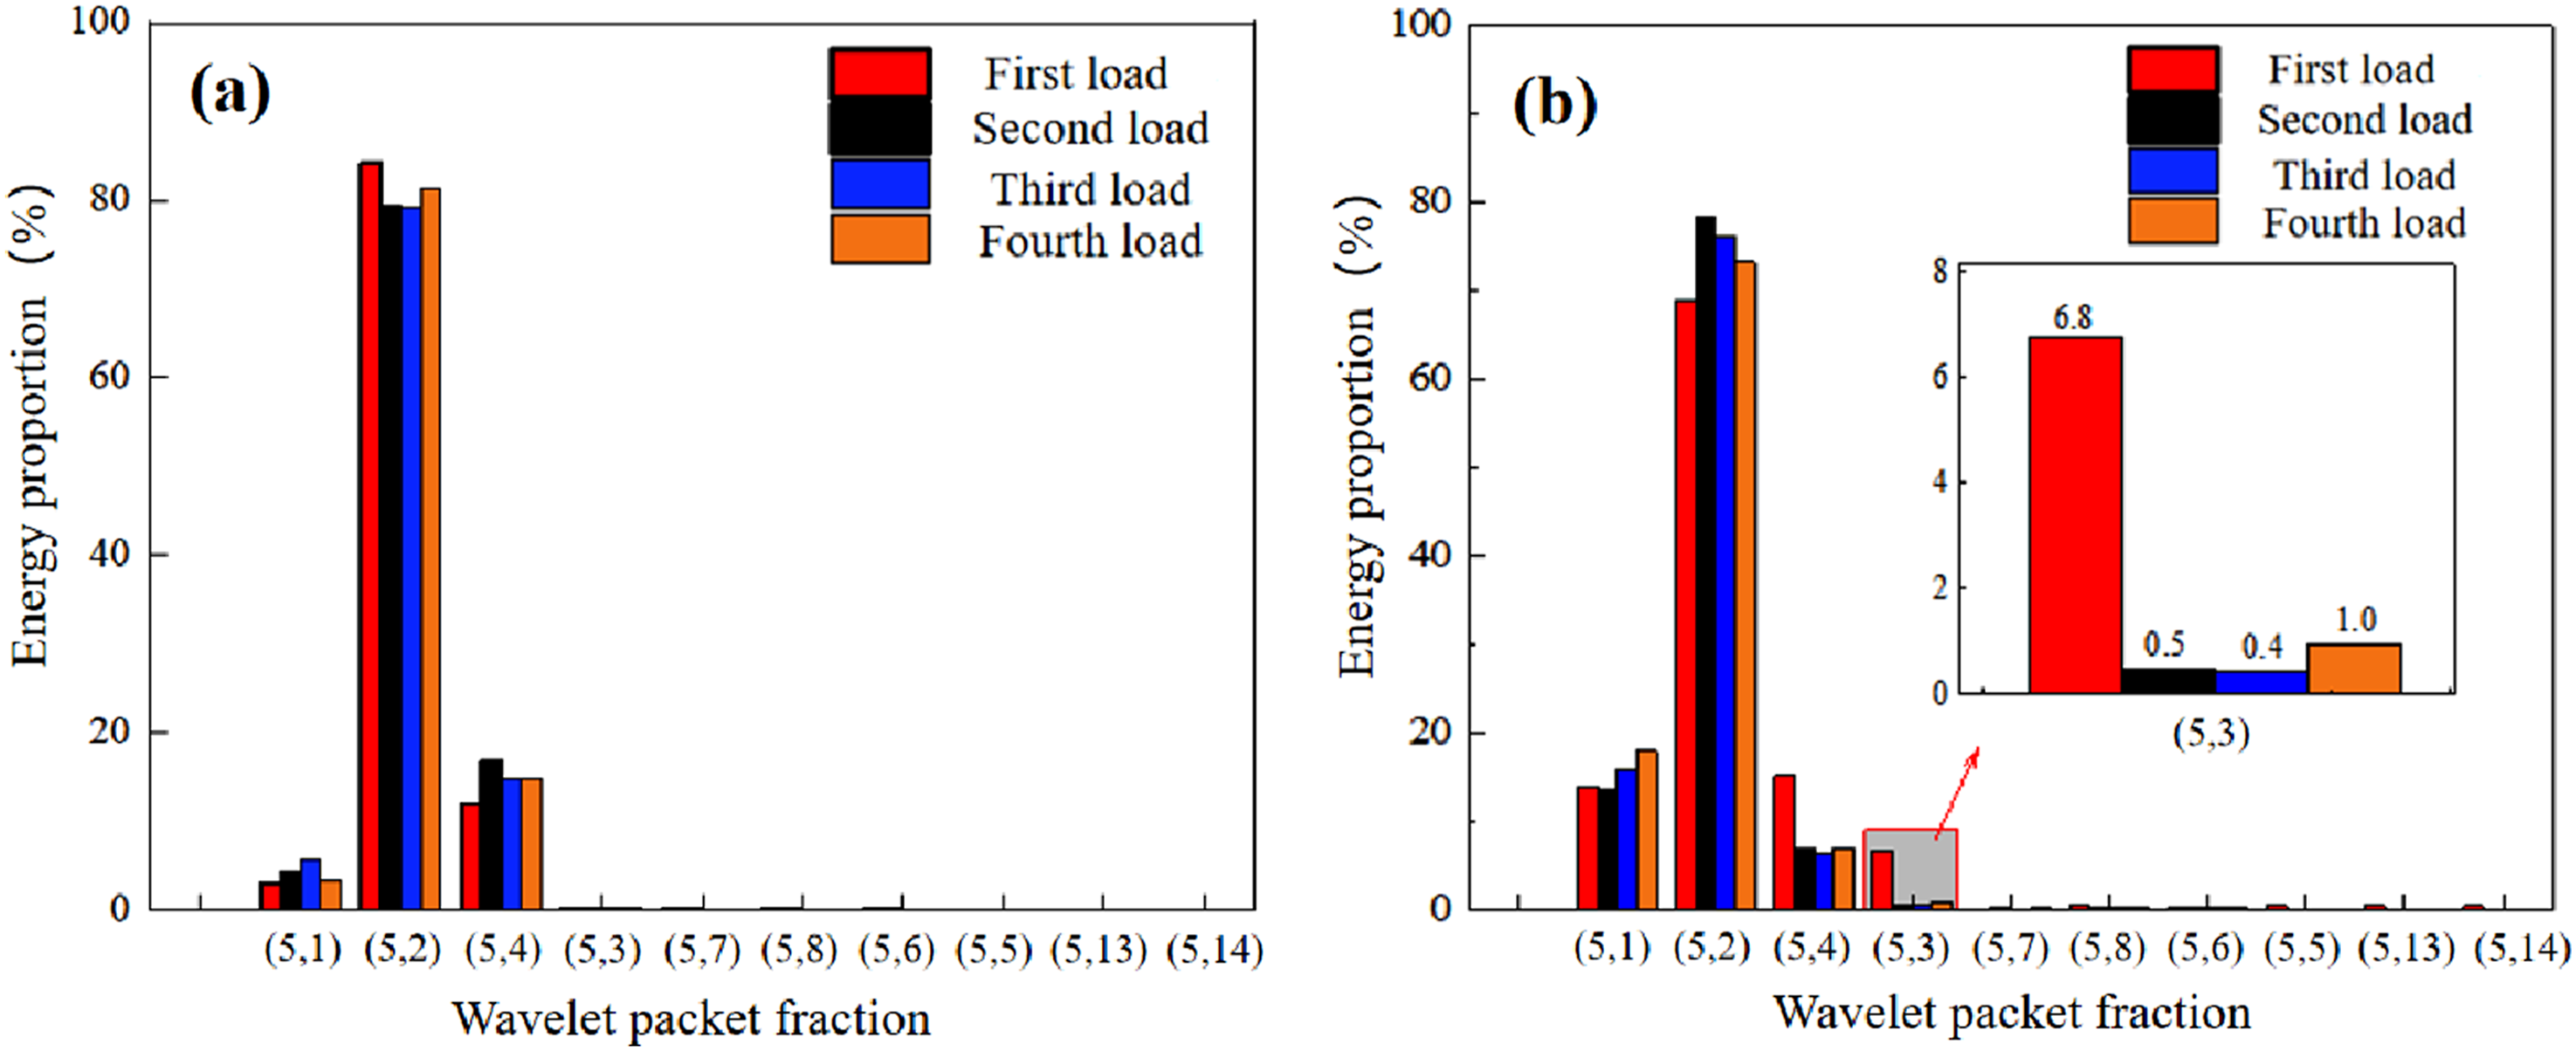
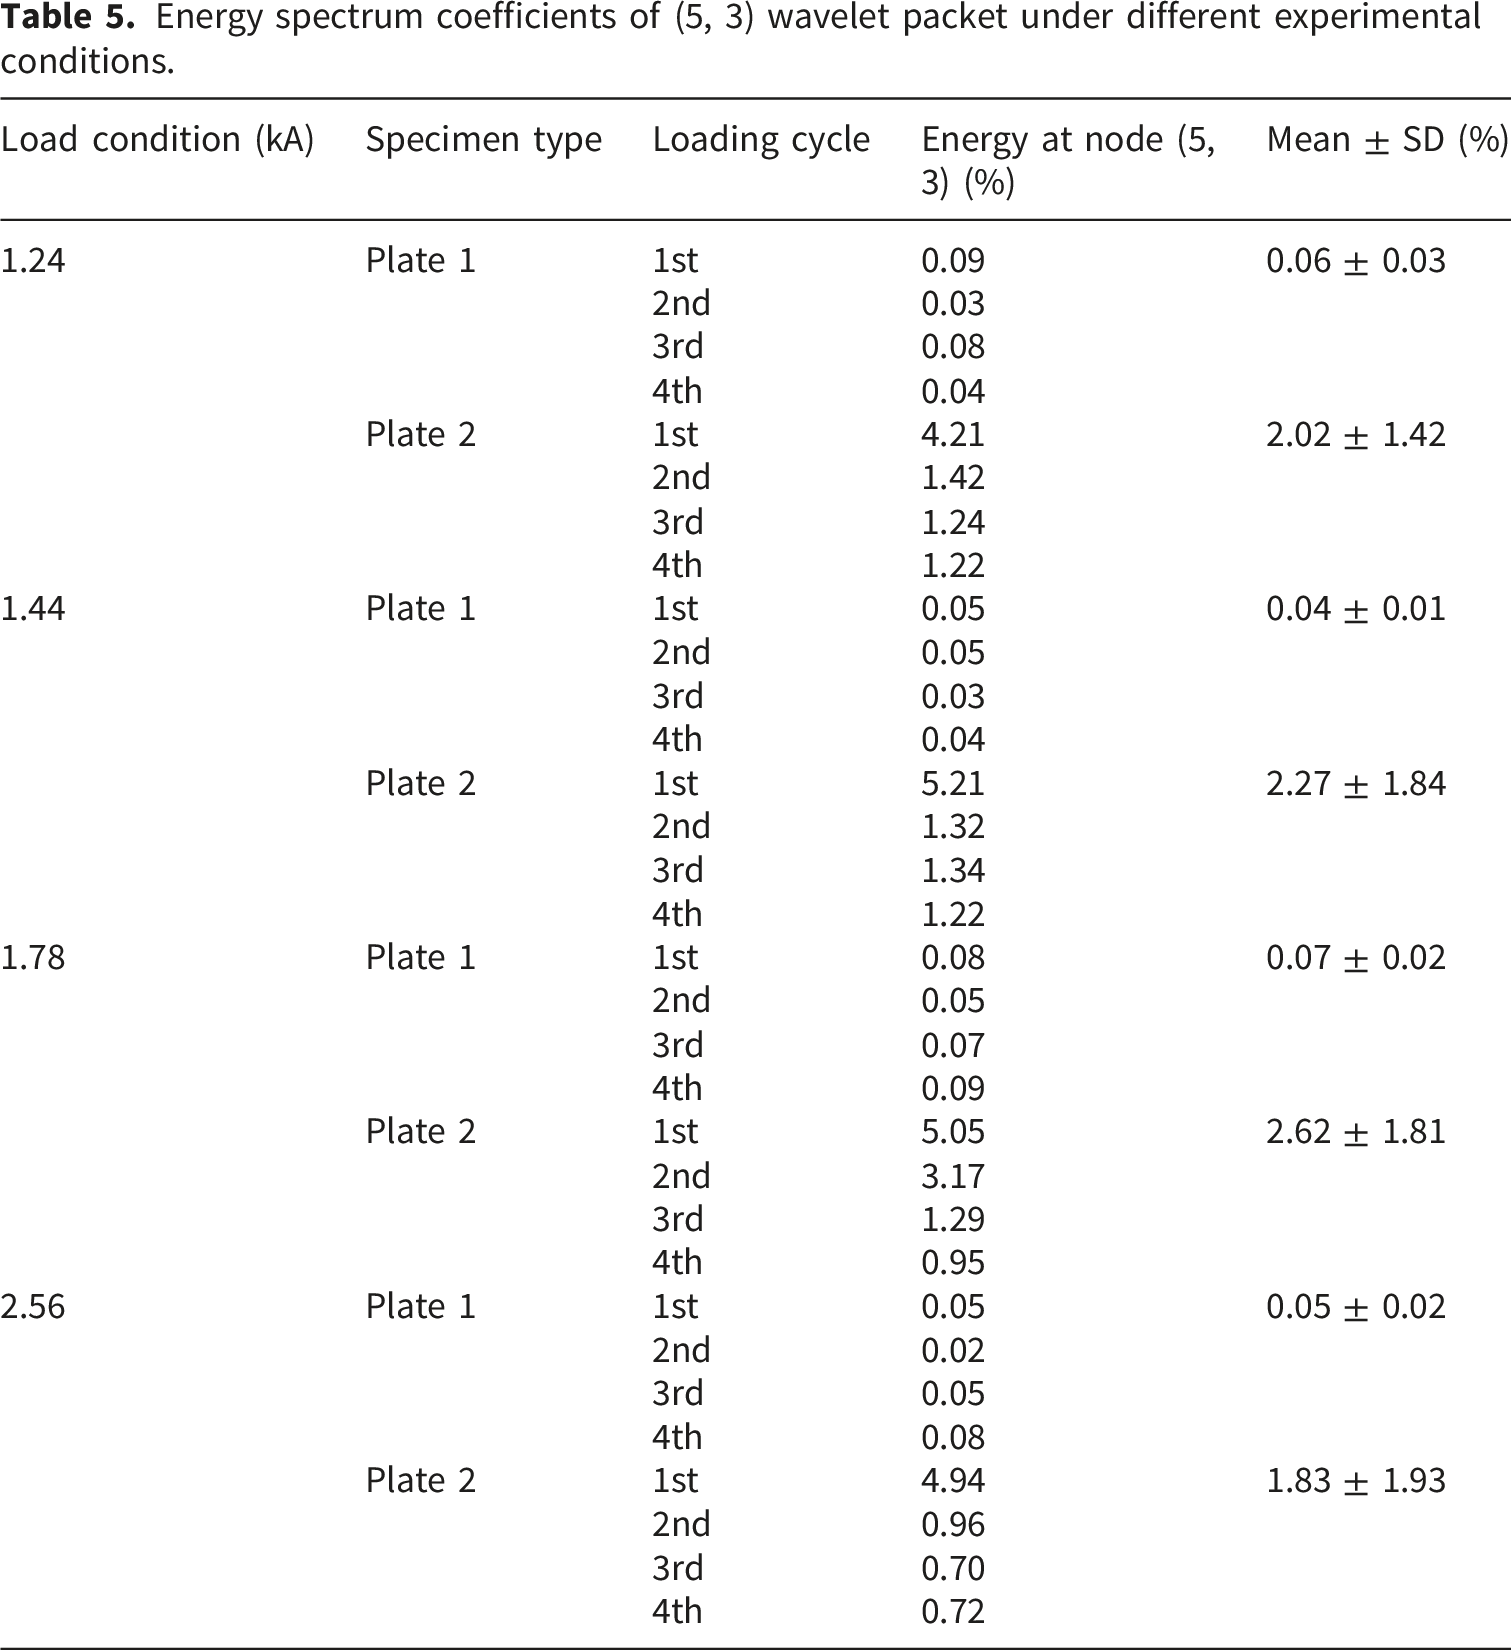
A repeated experimental analysis of the signal energy distribution characteristics at wavelet packet node (5,3) was conducted under different peak current conditions (1.24 kA, 1.44 kA, 1.78 kA, and 2.56 kA). The results are summarized in Table 5. Further analysis of the data leads to the following conclusions: (1) The signal energy at node (5,3) of the corroded plate (Plate 2) decreased rapidly after repeated loading under the same current level, demonstrating a typical acoustic emission Kaiser effect. Statistical analysis shows that, across all tested current levels, the average energy of Plate 2 during the first loading cycle (2.02%, 2.27%, 2.62%, and 1.83% for currents ranging from 1.24 kA to 2.56 kA, respectively) was significantly higher than that of the intact plate (Plate 1, with averages all below 0.07%). Moreover, starting from the second loading cycle, the average energy of Plate 2 consistently dropped substantially. Therefore, it can be concluded that the characteristic frequency band capable of characterizing uniform corrosion damage lies within 46.875–62.5 kHz. (2) The energy proportion in this characteristic frequency band is not determined by the magnitude of the current but is significantly influenced by the loading history, with the highest proportion occurring during the first loading. Although the absolute energy values varied with increasing current, the relative pattern indicative of the Kaiser effect—namely, “significantly higher energy during the first loading compared to subsequent loadings”—was consistently observed under all current conditions. Furthermore, the standard deviations of each data set fell within a reasonable range, indicating that this phenomenon is stably reproducible. Energy spectrum coefficients of (5, 3) wavelet packet under different experimental conditions.
3.5. Discussion on the source mechanisms of corrosion-induced EMAE signals
The EMAE response of the corroded specimen is fundamentally distinct from that of the intact specimen, primarily characterized by the emergence of acoustic emission (AE) activity within a characteristic frequency band (46.875–62.5 kHz) and the exhibition of a pronounced Kaiser effect. The spatial correlation of the AE event sources with the preset corrosion zone, as definitively shown by the localization results in Figure 6, confirms that these signals originate from the corrosion damage itself. The irreversible nature of the underlying mechanisms is conclusively demonstrated by the rapid attenuation of both signal amplitude and the specific energy proportion at node (5, 3) upon repeated loading (Figure 14; Table 5), effectively ruling out reversible electromagnetic noise.
The consistent concentration of the Kaiser effect within the 46.875–62.5 kHz band (Figure 14) points to a unique source mechanism associated with the corroded microstructure. The interaction of the high-intensity pulsed current with the compromised material is hypothesized to generate AE signals through the following mechanisms: (1) Fracture of Corrosion Product Layers. The generation of AE signals is closely associated with the formation and rupture of corrosion products, as established in studies on corrosion rate correlation for mild steel in acidic environments.
32
Specifically for Q235 steel, the brittle oxide films and corrosion products are susceptible to micro-fracture under the transient thermal stress or Lorentz forces induced by the pulsed current. This micro-fracture process, which involves the release of localized mechanical energy and can include the disintegration of the corrosion product layer, is recognized as a fundamental source of acoustic emission in corroding metals.
33
Being inherently irreversible, this process directly accounts for the observed Kaiser effect, as the damage caused during the initial loading event is not replicated upon reloading. (2) Microplastic Deformation at Corrosion Sites. As demonstrated by prior research, the metal substrate beneath corrosion pits or within corroded areas becomes mechanically weakened due to anodic dissolution, creating sites of stress concentration that are prone to localized plastic deformation under external loading.
34
In the context of this study, the base metal beneath corrosion products is therefore susceptible to microplastic deformation induced by the localized electromagnetic forces of the pulsed current at these microscopic imperfections. The Kaiser effect manifests because the initial loading causes yielding and irreversible deformation, whereas subsequent loads below the new, higher yield stress of the pre-deformed material produce diminished acoustic activity. (3) Release of Localized Residual Stresses. The corroded surface inherently contains microscopic irregularities that act as potent stress concentrators. The significance of stress in corrosion processes is well-established, residual stress is a critical factor in classic models of stress corrosion cracking, alongside susceptible material and a corrosive environment.
35
Corrosion itself, particularly when non-uniform, introduces a complex field of residual stresses in the near-surface region. Research on X80 steel under elastic and yield stresses in a microbiologically influenced corrosion environment further demonstrates that applied stress significantly alters corrosion morphology and rate, a phenomenon linked to stress-modulated electrochemical activity at the interface and its interplay with residual stresses.
36
The pulsed electromagnetic loading in this study can trigger the release of these localized residual stresses, generating an AE signal upon the first load. Crucially, the Kaiser effect is itself a classical method in rock and material mechanics for estimating internal stress levels, as its physical basis is the release of stored strain energy from internal defects (e.g., microcracks, dislocation pile-ups) when a material is stressed beyond its previous maximum.
37
Therefore, the observed subsequent signal attenuation aligns with a partially relaxed stress state following the initial energy release, directly linking the detected Kaiser effect to the relief of residual stresses around active corrosion sites.
In summary, the distinct time-frequency signature and the Kaiser effect provide a diagnostic basis for identifying active corrosion through EMAE. The evidence strongly suggests that the signals originate from irreversible micro-fracture and micro-deformation processes at corrosion sites.
4. Conclusion
Based on a comparative experimental study using intact and electrochemically corroded Q235 steel plates, this work leads to the following main conclusions. (1) Under the experimental conditions of this study, the electromagnetic acoustic emission signals generated by uniform corrosion defects exhibit characteristic waveforms including a steep front, fast rise time, long duration, and high ringing count. Parametric correlation analysis demonstrates that these features effectively differentiate the signals from corrosion defects from those of intact specimens. This provides a basis for screening and identifying characteristic corrosion signals within a complex background. (2) The results indicate the feasibility of using the high-intensity pulsed current excited electromagnetic acoustic emission technology for detecting corrosion defects. This study successfully distinguishes the characteristic signals produced by corrosion, which primarily occupy a frequency band of 40 to 70 kHz, from the low-frequency electromagnetic noise inherently generated during the detection process, which is mostly below 30 kHz. Effective identification of acoustic emission signals from defects was achieved by analyzing the distribution of signal energy within this characteristic frequency band. (3) The clear Kaiser effect observed in corroded specimens, characterized by the rapid attenuation of signal energy in the characteristic frequency band (46.875–62.5 kHz) upon repeated loading, confirms that the EMAE signals originate from irreversible microstructural changes associated with active corrosion defects. These changes are likely attributed to mechanisms such as the rupture of corrosion products, microplastic deformation, or localized stress release, which are fundamentally different from the mechanisms governing crack-related acoustic emission.
It is important to note the limitations of this study. The aforementioned findings and diagnostic criteria, such as the characteristic frequency band of 46.875 to 62.5 kHz and its associated Kaiser effect, are derived from a single type of uniform corrosion model prepared in a laboratory environment using a limited number of samples. The generalizability and engineering applicability of these results, particularly for localized corrosion morphologies like pitting corrosion which is more common in actual tank bottom plates, and under complex service conditions involving coatings, deposits, or coupled stresses, require further validation through more extensive and systematic experimentation. Therefore, the present method is more accurately described as providing a promising new approach for identifying active uniform corrosion defects under controlled conditions, thereby laying a necessary theoretical foundation for subsequent applied research aimed at practical engineering applications.
Footnotes
Ethical considerations
This article does not contain any studies with human or animal participants.
Funding
The authors disclosed receipt of the following financial support for the research, authorship, and/or publication of this article: This study was supported by the Scientific and Technological Project of PipeChina (Project No. 80915844).
Declaration of conflicting interests
The authors declared no potential conflicts of interest with respect to the research, authorship, and/or publication of this article.
Data Availability Statement
The authors confirm that the data supporting the findings of this study are available from the corresponding author upon reasonable request.
Disclaimer/publisher’s note
The statements, opinions and data contained in all publications are solely those of the individual author(s) and contributor(s) and not of SAGE and/or the editor(s). SAGE and/or the editor(s) disclaim responsibility for any injury to people or property resulting from any ideas, methods, instructions or products referred to in the content.