
Abstract
Selecting the most effective location for a single accelerometer is a critical challenge in the structural health monitoring (SHM) of wind turbine blades (WTBs), where high installation costs, restricted access, and strong environmental and operational variability (EOV) often limit instrumentation. This study proposes a fully unsupervised, temperature-aware data-driven framework for determining the optimal accelerometer position directly from healthy-state vibration data, enabling reliable monitoring under ambient excitation. This study addresses this challenge using a full-scale dataset from a Vestas V27 wind turbine blade instrumented with 12 accelerometers. The complete multi-sensor configuration is employed to form the basis of a systematic, data-driven investigation into optimal sensor placement under realistic operating conditions. The framework begins with a frequency-domain fusion (FDF) stage, where a discrete wavelet transform (DWT) identifies a frequency split, separating low- and high-frequency regimes. Continuous wavelet transform (CWT) coefficients are then computed within each regime to capture both global blade dynamics and localized transient responses. Features from all sensors are merged and ranked using two complementary unsupervised feature selection strategies: the Laplacian score, which preserves local geometric structure, and a temperature-aware statistical filter that penalizes environmentally sensitive features. A sensor-level attribution analysis traces high-ranking features back to their source sensors across multiple compression thresholds, identifying the most consistently informative location at each operational speed (32 RPM and 43 RPM). An autoencoder trained exclusively on healthy-state data from the selected sensor is then deployed for anomaly detection, with reconstruction error serving as the damage index. The results reveal that, in both regimes, the accelerometer located at the leading edge near the mid-span provides the most stable and sensitive response to early-stage damage. Notably, the single optimally placed sensor achieves anomaly-detection performance comparable to that of the full twelve-sensor network, demonstrating a scalable and cost-efficient pathway toward interpretable, field-deployable SHM of operational wind turbines.
Keywords
Introduction
Wind turbine blades (WTBs) operate in complex and often unpredictable environments, where they are subjected to continuous aerodynamic loading, fluctuating wind speeds, and a wide range of environmental conditions. 1 These dynamic stressors accumulate over time, leading to material degradation, fatigue, and potential damage—particularly in structurally vulnerable regions such as the leading and trailing edges. 2 Detecting early-stage deterioration is critical for reducing unplanned downtime, minimizing maintenance costs, and extending the operational lifespan of wind energy assets. 3 Vibration-based structural health monitoring (VSHM) offers a non-invasive means to capture the dynamic response of blades and detect anomalies during regular operation. 4 However, several challenges limit its effectiveness under realistic operating conditions. The low energy content of ambient excitation often produces low signal-to-noise ratios, 5 while variability in environmental and operational variabilities (EOVs) introduces further uncertainty that can obscure subtle changes associated with damage. 4 Practical limitations related to cost, accessibility, and structural constraints typically restrict the number and placement of sensors, reducing spatial resolution and observability. 6 As a result, SHM systems must operate under sparse, noisy, and variable conditions, where selecting the most informative sensor locations becomes critical to system reliability.
In this context, optimal sensor placement (OSP) plays a central role in ensuring the fidelity and robustness of vibration-based monitoring systems. Classical model-based OSP techniques—such as Effective Independence (EfI), 7 Modal Kinetic Energy (MKE), 8 and Driving Point Residue—rely on modal observability and the Fisher Information Matrix (FIM) to place sensors at locations that maximize identifiability of mode shapes.6,9–13 However, these methods often produce clustered sensor layouts near high-participation modes, overlooking dynamically passive regions where real-world damage (e.g., lightning, icing, and erosion) typically initiates.14–18 This challenge is particularly pronounced in WTBs, where operational damage—caused by lightning, icing, or erosion—often initiates in dynamically passive regions that remain under-instrumented by modal-based schemes. 18 This limitation is especially critical in WTBs, where large structural flexibility, anisotropic material properties, and spatially distributed aerodynamic loads violate the assumptions underlying traditional placement strategies.9,19 Furthermore, such methods rarely account for the influence of EOVs on sensor effectiveness—an omission that undermines placement reliability under ambient excitation.
To overcome these limitations, researchers have introduced probabilistic and information-theoretic approaches, such as uncertainty-based EfI extensions,20,21 Bayesian inference,22,23 and entropy-based fitness functions. 24 These methods incorporate modeling uncertainties and attempt to reduce redundant data by balancing spatial distribution. However, their dependency on high-fidelity numerical models and their considerable computational demands limit scalability under ambient excitation scenarios.9,20 Parallel to this, the emergence of intelligent optimization algorithms—such as genetic algorithms (GA),25–29 particle swarm optimization (PSO),30,31 and simulated annealing (SA) 32 —has enhanced global search capabilities in OSP design, especially when dealing with nonlinear and multimodal fitness landscapes. Hybrid fitness functions combining EfI, MAC, and MKE criteria33–35 have further improved solution robustness, particularly when geometric constraints and redundancy elimination are integrated into the layout optimization.30,36 Redundancy-aware frameworks, including mode-geometry fitness, 36 nearest neighbor index (NNI)-based clustering penalization, 30 and entropy-driven formulations, 37 have shown particular promise in 3D structures like WTBs, where naive planar extensions fail to capture spatial complexity. Still, these approaches remain predominantly model-centric, often overlooking empirical signal characteristics and environmental variability in real-world deployment.
In response, data-driven OSP strategies have gained momentum by evaluating sensor importance directly from measured vibration responses under operational excitation—without reliance on prior modal identification or labeled damage states. These approaches prioritize empirical feature richness, spatial diversity, and environmental resilience over theoretical observability. Sensor evaluation is based on the ability to extract informative, damage-sensitive features (DSFs) across varying EOVs.38,39 In this setting, OSP becomes an evidence-based process, grounded in the real diagnostic value of each sensor location. While machine learning (ML) techniques, particularly unsupervised ones, support this paradigm by enabling baseline learning and anomaly detection,39–43 their performance remains tightly coupled with feature quality. Feature engineering—especially time-frequency approaches such as wavelet-based—has proven effective in revealing latent patterns in ambient signals.44–49 When combined with unsupervised feature selection (FS) methods—such as Laplacian score and statistical filtering50,51—these time-frequency representations enable a principled ranking of sensors based on feature discriminability, guiding placement decisions under ambient excitation without reliance on physical models.
Building on these data-driven developments, several recent studies have revisited OSP from both model-driven and learning-based perspectives. Fritz et al. 52 optimized pressure-sensor spacing on airfoils using genetic algorithms and sequential quadratic programming, achieving more accurate lift and pressure recovery with up to 55 % fewer sensors, while Liangou et al. 53 used a D-optimal GA framework to design sensor grids for inverse load identification, minimizing uncertainty but requiring detailed Finite Element (FE) aeroelastic models. Although effective, both approaches rely on controlled aerodynamic conditions and high-fidelity simulations, limiting their applicability under ambient excitation and real EOV variability. Hybrid physics-informed frameworks embedding equilibrium or thermodynamic constraints have also been proposed, 54 yet their deployment remains constrained by uncertainties in material properties and boundary conditions in field environments. In parallel, learning-based approaches have emerged in related SHM domains: Ning et al. 53 achieved near-99 % impact localization using a single acoustic emission sensor and a multiscale Convolutional Neural Network (CNN), while Pichika et al. 55 employed a Grey Wolf Optimizer to reduce gearbox sensors from eight to five with improved classification accuracy. Complementing these studies, Fremmelev et al. 56 demonstrated that active excitation combined with distributed accelerometers can detect initiation and progression of shear-web cracks in a 52-m blade, highlighting that sensor placement is critical because sensitivity varies strongly with sensor distance from the damage and excitation source. Despite these advances, most methods rely on supervised labels, high-frequency acoustic emission measurements, controlled fault scenarios, active excitation, or detailed physical models. Collectively, the literature underscores a persistent gap: the need for unsupervised, ambient-excitation-driven OSP frameworks capable of identifying the most informative sensor location using only healthy-state vibration data under realistic environmental and operational variability.
The shift from model-driven to data-centric strategies has been reinforced by a landmark experimental campaign at the Technical University of Denmark (DTU), which has become a benchmark for evaluating sensor placement under realistic operational conditions. The present study builds directly upon the same full-scale experimental dataset collected during this DTU—Brüel and Kjær campaign on a Vestas V27 wind turbine blade. The dataset is not publicly available and was accessed by the authors through direct research collaboration with the data providers. Several follow-up studies have used the resulting full-scale V27 dataset to examine the influence of environmental factors such as temperature and wind speed on vibration characteristics,41,57–59 and to enhance robustness under varying EOVs using transient-based PCA methods.60–62 While damage detection was successful with the complete sensor network, performance declined sharply when the number of sensors was reduced, 63 and even moderate sensor configurations required extensive training data when artificial neural networks were applied. 64 Other works explored single-sensor configurations, with mixed results depending on operating conditions and sensor placement strategy. 65 More recently, García and Tcherniak 38 demonstrated single-sensor feasibility on a 34 m blade using singular spectrum analysis, while Panagiotopoulos et al. 39 showed comparable performance on the V27 dataset using unsupervised time-series models—albeit with high-frequency, actuator-excited data and extensive inspection counts. Collectively, these studies demonstrate both the potential and the limitations of sparse instrumentation, underscoring the need to identify the sensor location with the highest diagnostic value.
This study proposes a dedicated data-driven method for optimal sensor placement in vibration-based SHM of an operational WTB under ambient conditions. Unlike existing OSP approaches that rely on numerical models, supervised labels, active excitation, or high-frequency acoustic emission measurements, the proposed framework identifies the most informative sensor solely from healthy-state, operational vibration data, making it directly applicable to in-service conditions. Using a full-scale experimental dataset from the Vestas V27 campaign, the proposed method identifies the most suitable sensor based solely on healthy-state, ambient vibration data. The approach leverages wavelet-based frequency domain fusion (FDF) to extract DSFs across both high- and low-frequency bands. Filter-based FS techniques—specifically, Laplacian score and a temperature-aware statistical metric—are applied to evaluate the relative contribution of each sensor to overall feature quality under EOVs. A sensor-level attribution process is then used to identify the most consistently sensitive location. An autoencoder (AE) is trained using only healthy-state features from the selected sensor to assess its standalone anomaly detection capability.
The remainder of this paper is organized as follows: Section 2 describes the experimental setup, data collection, preprocessing, and the proposed method for sensor ranking and AE-based anomaly detection. Section 3 presents and discusses the results, including sensor ranking outcomes and AE performance. Section 4 summarizes the conclusions and potential future work.
Unsupervised framework using a single accelerometer
Figure 1 illustrates the proposed data-driven method for identifying the sensor location with the highest diagnostic value on an operational WTB under ambient excitation. The analysis leverages a full-scale multi-sensor dataset from a Vestas V27 blade subjected to progressive trailing edge damage and realistic EOVs. Time-frequency features are extracted from all 12 accelerometers using wavelet-based decomposition across high- and low-frequency bands. These features are merged into a comprehensive feature matrix and evaluated using unsupervised selection techniques—specifically, Laplacian score and a temperature-aware statistical filter. The resulting feature rankings are then aggregated to compute sensor-level attribution scores, providing a quantitative basis for identifying the sensor location with the greatest diagnostic sensitivity. Data-driven procedure for identifying the optimal sensor placement under ambient excitation.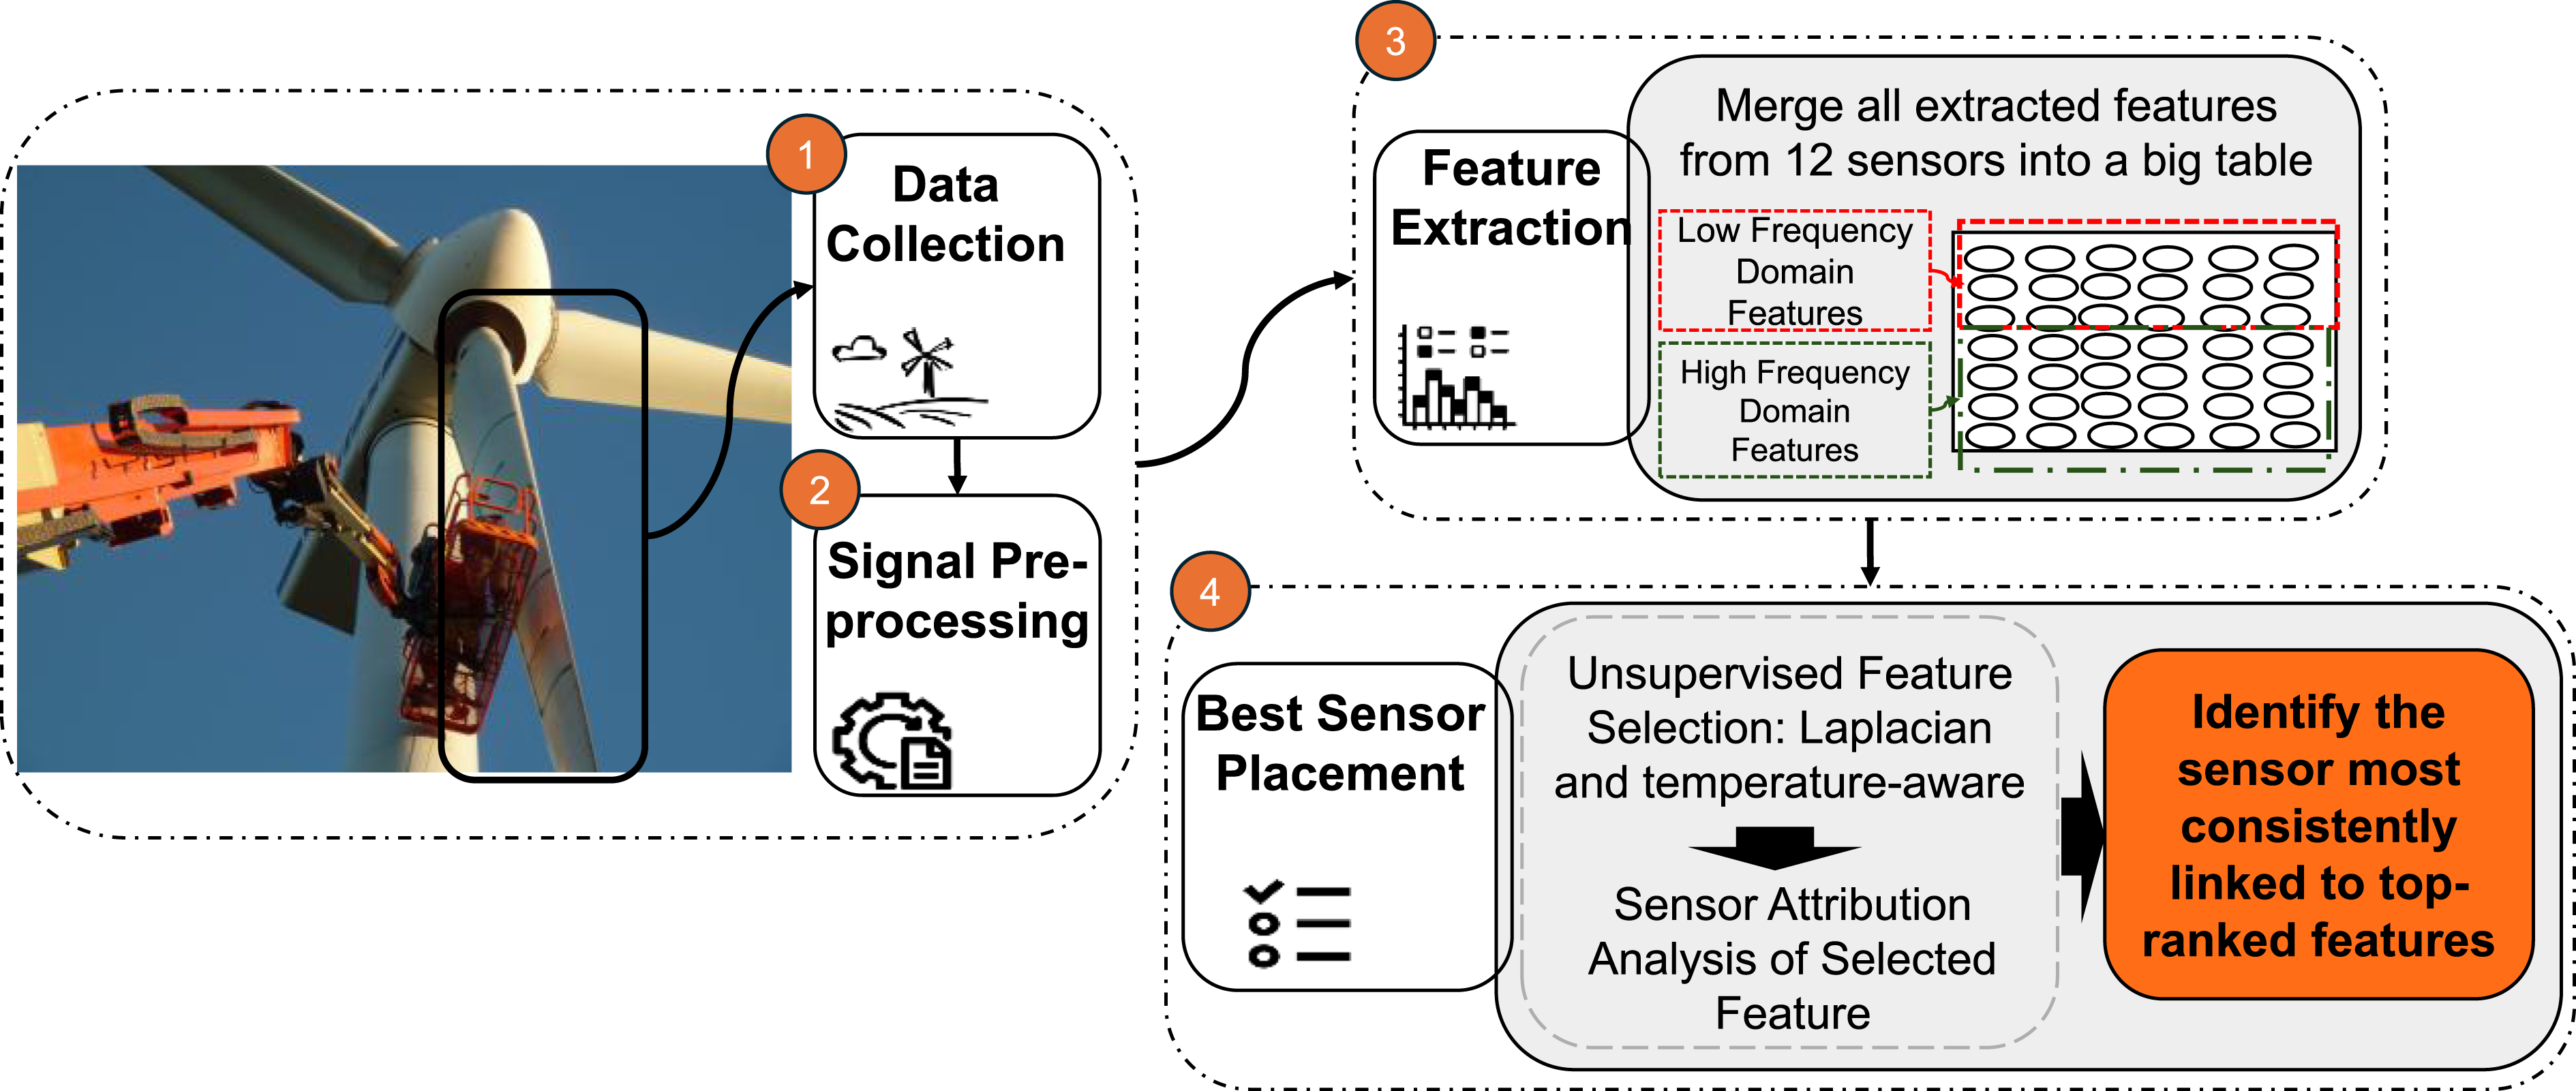
Data collection
The Vestas V27 wind turbine used in this paper is located in Denmark. The turbine is a 225 kW, three-bladed, pitch-regulated horizontal-axis machine with a rotor diameter of 27 m. One blade was instrumented with 12 monoaxial accelerometers distributed along its span to capture vibration responses at distinct structural locations. Two additional accelerometers installed within the spinner measured rotor speed and azimuth, enabling operational state classification.
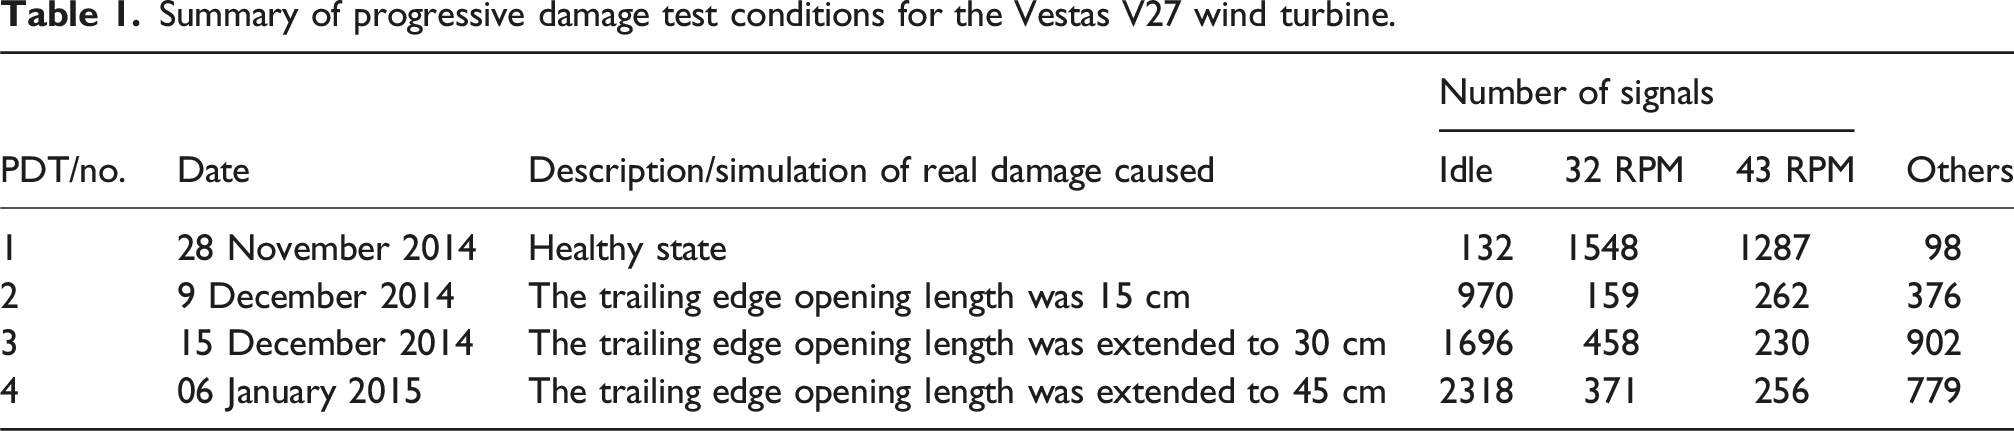
Over 104 days between late 2014 and early 2015, the instrumented blade was subjected to a sequence of progressive artificial damage scenarios: trailing edge openings of 15 cm, 30 cm, and 45 cm, followed by a repaired condition, in addition to the initial healthy state. Measurements were collected under multiple operating states—idle, 32 RPM, and 43 RPM—covering a wide range of environmental and operational variability. The left panel of Figure 1 shows the blade instrumentation layout during the campaign.
An electromechanical actuator mounted at the blade root provided controlled impact excitations at regular intervals. Acceleration responses were recorded in 30-s windows (10 s before and 20 s after each impact) at a sampling frequency of 16.384 kHz. For analysis, only the one-second ambient-vibration segment immediately preceding each impact was retained so that the extracted features reflect the natural operational response rather than the excitation. This interval also provides sufficient signal stationarity for wavelet-based feature extraction while preserving the characteristic broadband content of the blade response. Preliminary tests with 2–3 s windows produced almost identical feature statistics (<2% variation) but at considerably higher computational cost, making the 1 s window the most efficient and representative choice. The spatial arrangement of the accelerometers and the location of the simulated damage regions are illustrated in Figure 2. A summary of the number of recorded signals for each structural state and operational condition is presented in Table 1, highlighting the breadth of conditions represented in this dataset. This combination of multiple damage severities, varied operating speeds, and long-term environmental exposure makes the dataset particularly well-suited for evaluating single-sensor anomaly detection strategies under realistic field conditions. Sensor layout and damage locations along the instrumented blade. Circles indicate accelerometer positions, gray-shaded rectangles mark trailing-edge damage regions, and the dashed line represents the main spar. All dimensions are in millimeters (mm). The green star denotes the position of the electromechanical actuator. Summary of progressive damage test conditions for the Vestas V27 wind turbine.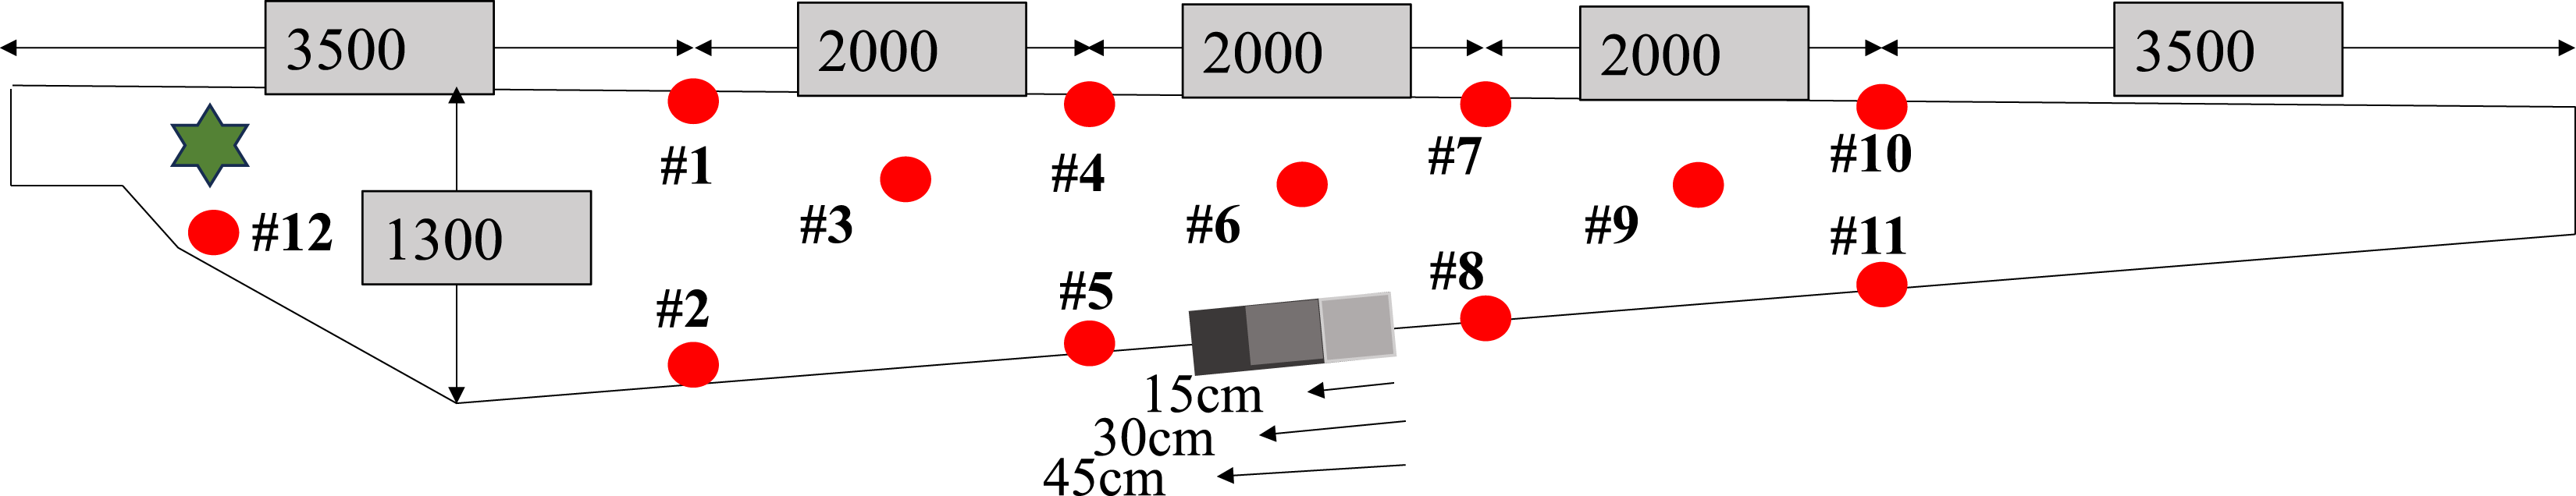
Signal pre-processing & feature extraction via frequency-domain fusion (FDF)
The vibration response of an operating WTB is strongly non-stationary: both aerodynamic loading and structural stiffness evolve with wind speed, rotor speed, and pitch control. These effects generate transient content and gradual modal drift that are not well captured by classical Fourier analysis, which provides only global spectral information and lacks temporal localization. 41 Wavelet methods address this limitation by offering joint time-+frequency resolution and are therefore well suited to ambient-response SHM in rotating machines.44–49
To capture both global modal behavior and localized, damage-sensitive dynamics, a multi-stage wavelet-based pipeline referred to as frequency-domain fusion (FDF) 66 is adopted. The pipeline consists of: (i) frequency segmentation via the discrete wavelet transform (DWT); (ii) time-frequency characterization via the continuous wavelet transform (CWT); and (iii) statistical feature extraction. The objective is to capture both global modal behavior and localized, damage-sensitive dynamics within a unified analytical representation.67–69
DWT-based frequency segmentation
The first stage establishes a physically interpretable spectral boundary separating global and local structural responses. To this end, the DWT was applied to the complete measurable bandwidth of the vibration signals before down-sampling, enabling an energy-based assessment of the signal’s multi-resolution structure.70,71 Mathematically, a signal 
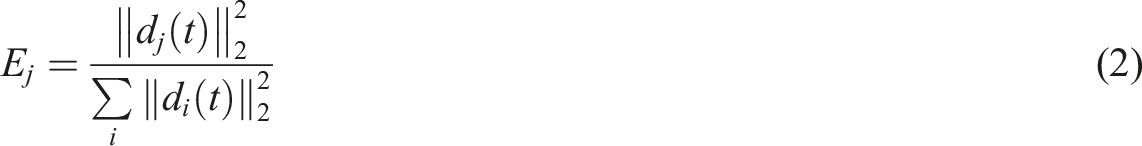
After identifying this data-driven boundary, the signals were down-sampled for computational efficiency and band-filtered within the structural frequency range of interest using finite-impulse-response filters. The signal was divided into two regimes based on the identified boundary:
CWT-based time-frequency analysis
For each filtered band, the CWT was applied to obtain detailed time-frequency representations of the non-stationary response. The CWT of a signal 
Two analytic wavelet families were selected for the CWT because of their complementary diagnostic properties: the generalized Morse and the Complex Morlet (CMOR) wavelets. The generalized Morse wavelet

The CWT configuration was adaptively tuned for each regime: frequency resolution was prioritized in
The Spectral Centroid (SC) represents the “center of mass” of the power spectrum, indicating the dominant frequency content. Shape-related measures such as Spectral Spread (SS), Skewness (SW), and Kurtosis (SK) describe dispersion, asymmetry, and peakedness—attributes that vary systematically with damage severity. Spectral Entropy (SE) quantifies the unpredictability or complexity of the signal, while Spectral Flatness (SF) distinguishes tonal (harmonic) from noise-like (broadband) behavior, serving as a useful discriminator between damaged and undamaged states. 80 Additional metrics such as Spectral Roll-off (SR), Slope (SP), and Spectral Decrease (SD) characterize how energy decays across the frequency axis, often indicating shifts toward higher frequencies associated with localized defects. The feature set used here, therefore, includes power spectrum (PS), SC, SS, spectral variance (SV), SK, SW, SF, SE, SR, SP, and SD. 58
Each descriptor is computed independently for the low- and high-frequency bands and across both wavelet families to ensure responsiveness to different damage characteristics. This dual-band computation enables the detection of both global modal shifts in the low-frequency regime and localized, damage-induced transients in the high-frequency regime, thereby improving diagnostic coverage. Together, these statistical descriptors capture the essential temporal and spectral characteristics of the WTB vibration response. Because not all features contribute equally to condition assessment, an unsupervised FS stage is subsequently applied to retain only the most informative and environmentally stable descriptors, ensuring efficiency and robustness in the downstream anomaly detection analysis.
Sensor selection through unsupervised feature selection
This step corresponds to Step 4 of the data-driven procedure in Figure 1, where the target is to identify the most diagnostically informative sensor location for anomaly detection. The process is fully unsupervised and operates without requiring any labeled damage data, as illustrated in Figure 3. It builds upon the feature matrix generated in Step 3 (Section 2.2), which includes descriptors extracted from both low- and high-frequency bands across all 12 accelerometers. To enable fair sensor comparison under ambient excitation and realistic EOVs, the features from all channels are consolidated into a unified matrix. This cross-sensor matrix preserves the spatial variation in feature quality while accounting for environmental and operational noise. Feature-ranking-based process for identifying the sensor most consistently linked to high-ranking features.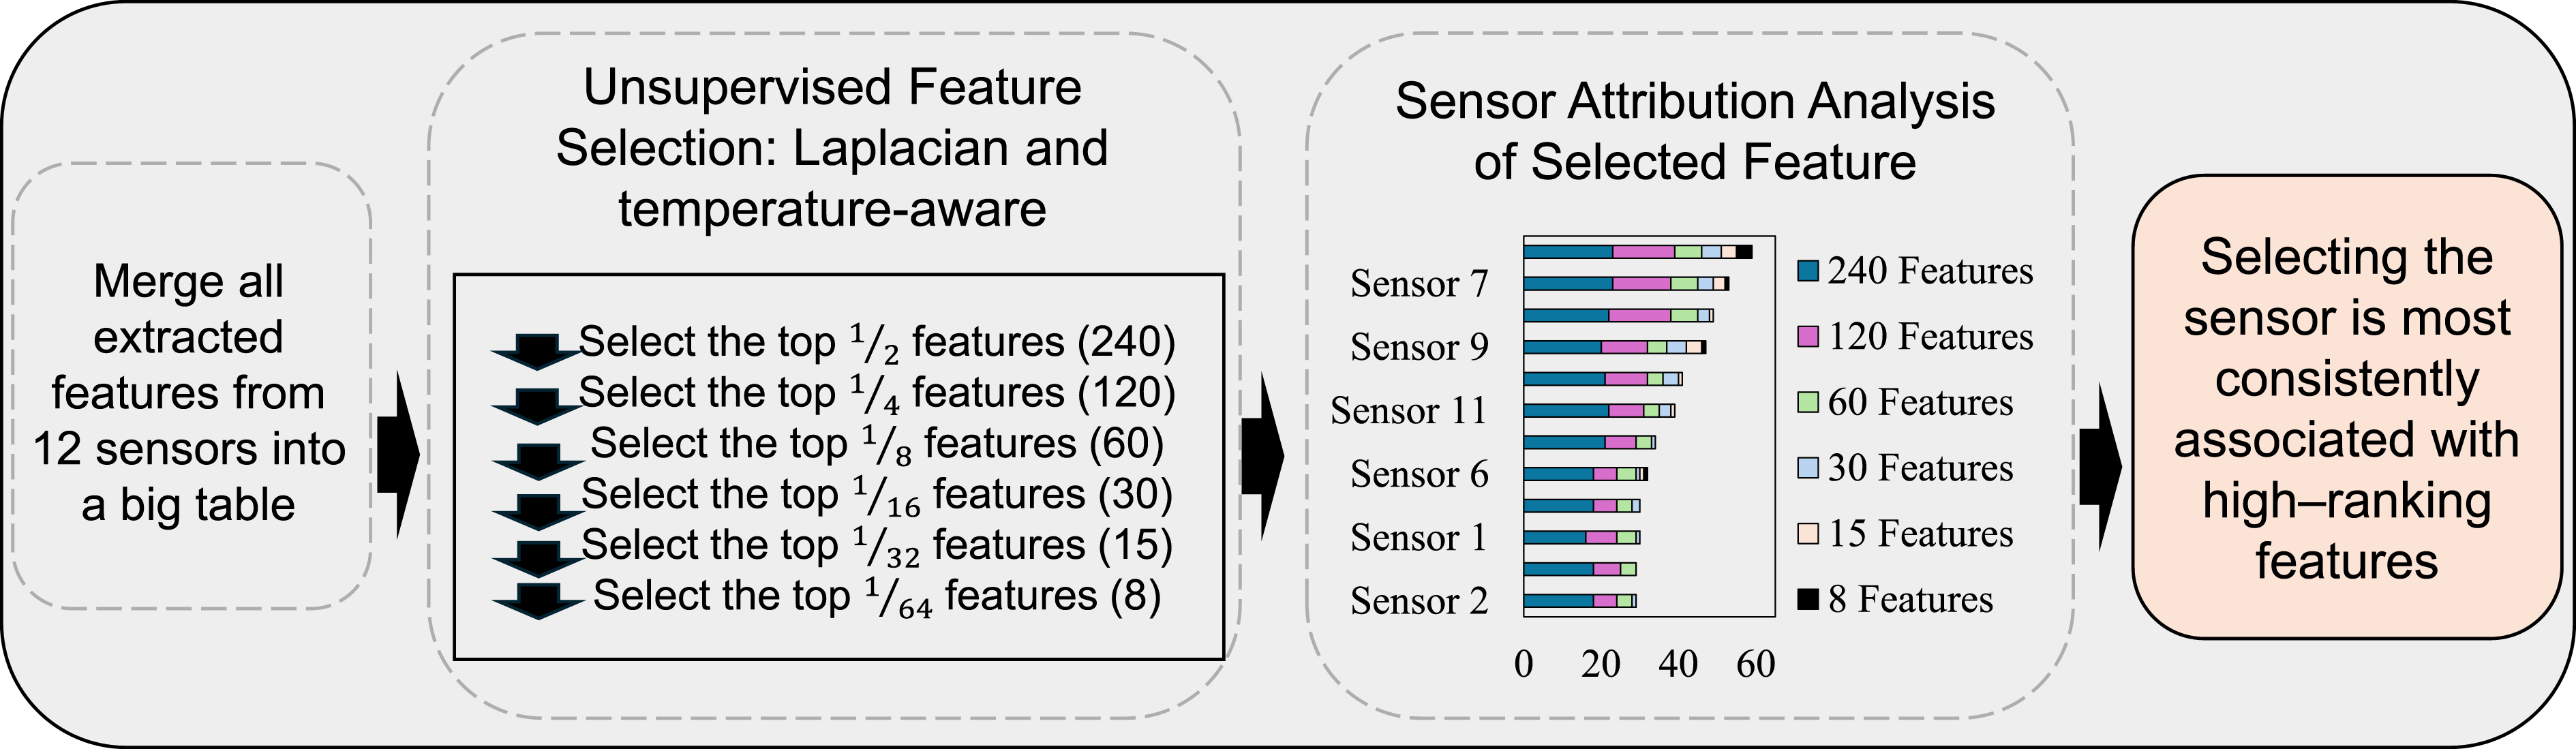
Two complementary unsupervised FS strategies are used to evaluate each feature independently:
These methods are described in detail in Sections 2.3.1 and 2.3.2, respectively. For each method, features are ranked and then progressively compressed using multiple thresholds (top ½, ¼, ⅛, 1⁄16, 1⁄32, and 1⁄64 of the total set). The sensor origin of each retained feature is tracked at each compression level, and attribution counts are accumulated across all ranks and both methods. The sensor most frequently associated with high-ranking features—across both ranking strategies and compression levels—is selected as the optimal location for anomaly detection.
The adopted compression levels were chosen to provide a logarithmic progression from coarse to fine feature subsets, allowing the framework to capture both dominant global features and subtle local descriptors. This hierarchical structure avoids bias toward any single subset size and promotes stability across ranking depths. Preliminary sensitivity tests using alternative cut-offs (e.g., top 20 %, 10 %, and 5 %) produced nearly identical dominant sensors, with less than 3 % variation in cumulative attribution. These results confirm that the final sensor rankings are not dependent on the specific threshold values. The chosen fractional sequence, therefore, offers a balanced, scale-independent, and computationally efficient representation of feature relevance across multiple compression levels. This strategy enables interpretable and scalable deployment of single-sensor SHM without requiring any prior knowledge of fault types, damage labels, or physical models.
Laplacian score FS
The Laplacian score quantifies the extent to which a feature preserves the local manifold structure of the data, favoring features that exhibit minimal variation within neighboring samples and greater global variability across the dataset.
81
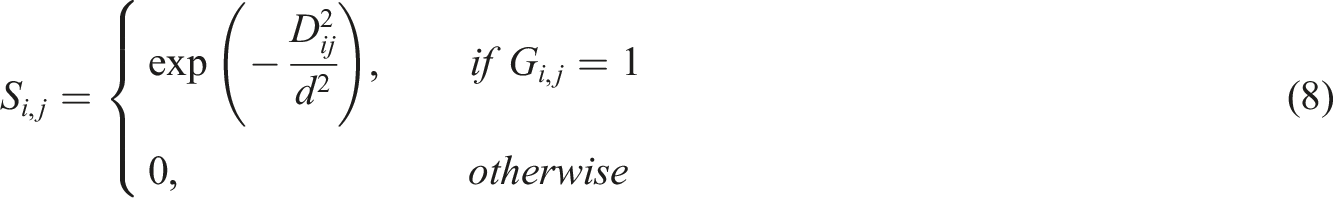
The method begins by constructing a nearest-neighbor graph 

Temperature-aware statistical FS
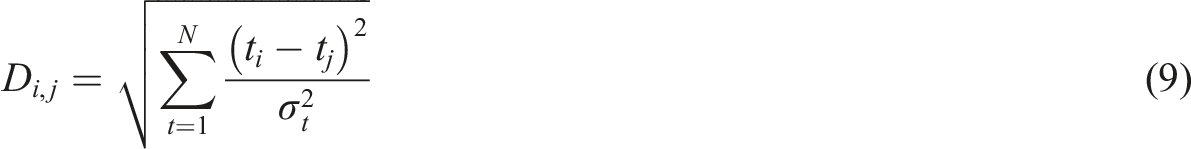
This ranking strategy identifies features that are both temporally stable and minimally affected by ambient temperature variation. First, the feature spread in the healthy dataset is evaluated through the total deviation 


Lower values of
Autoencoder-based anomaly detection
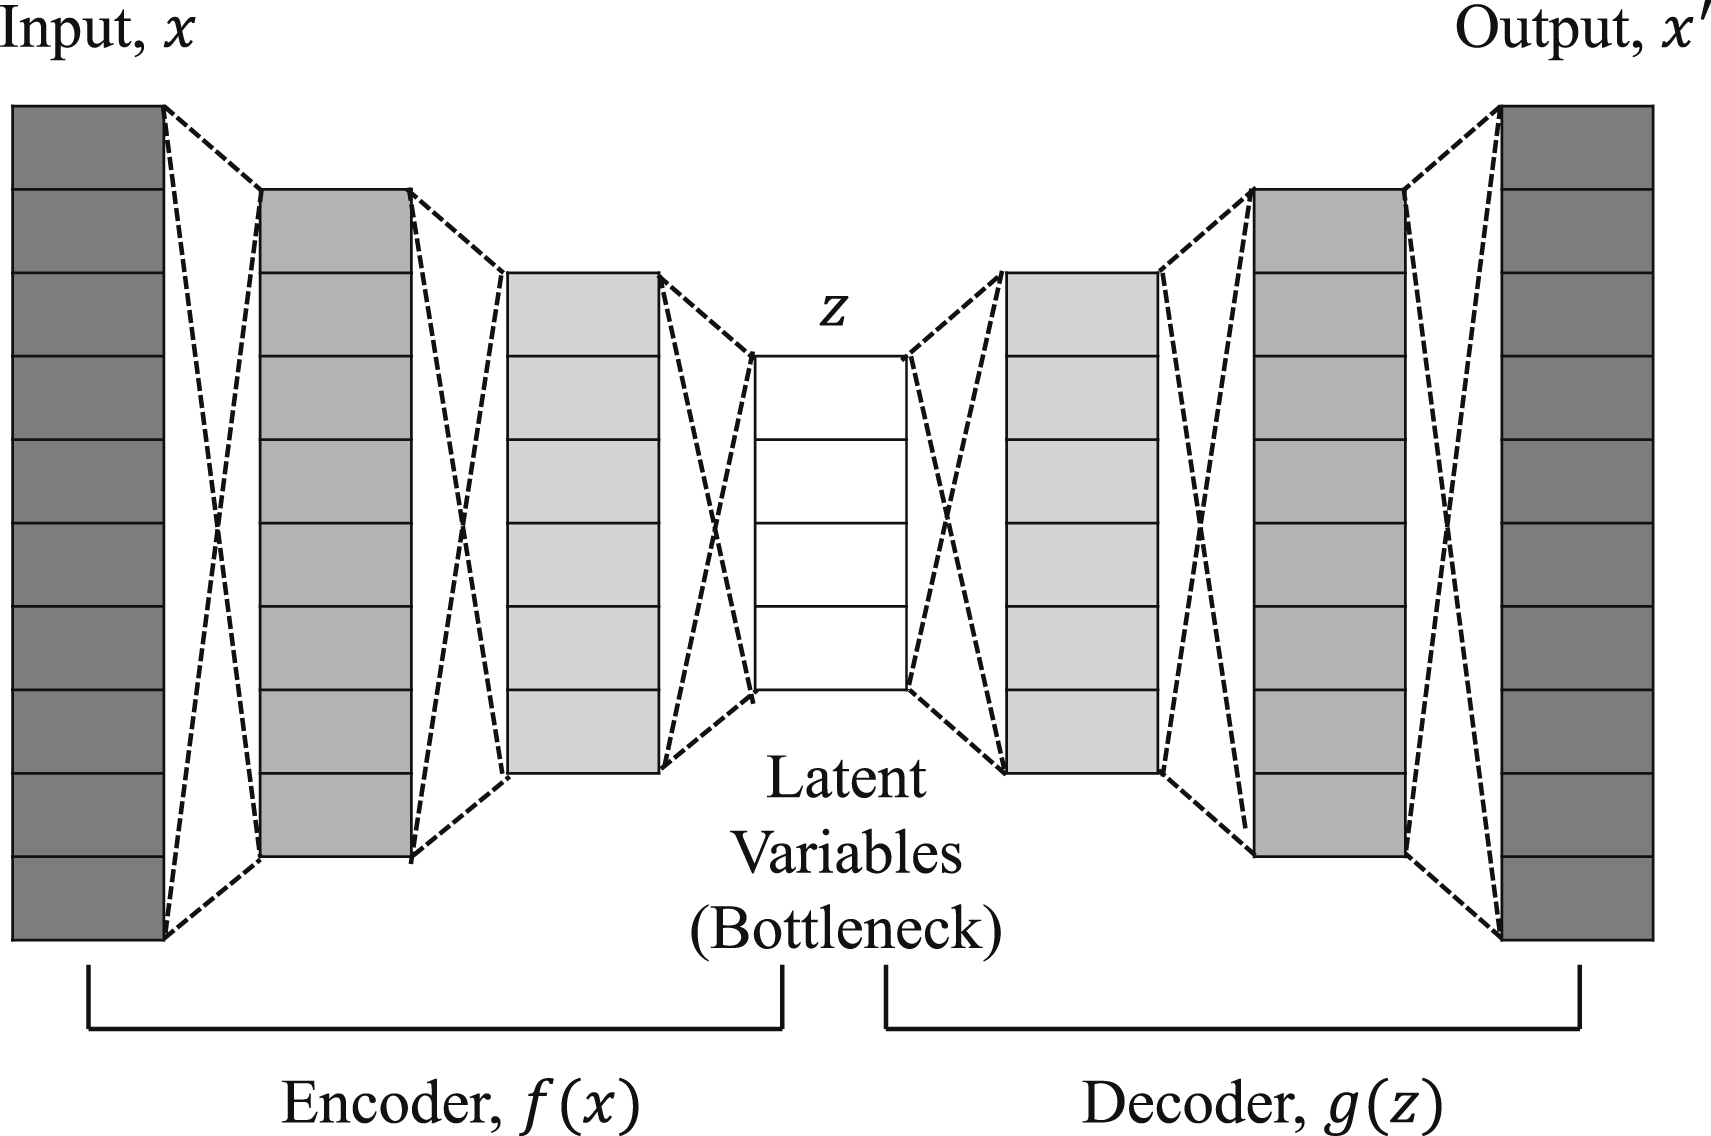
In the final stage of the framework, a shallow AE is implemented for unsupervised anomaly detection. AEs are widely used in SHM due to their ability to learn compact, nonlinear representations of normal system behavior without requiring labeled damage data. 86 The AE is trained exclusively on features from the optimal sensor selected in Section 2.3.
The network architecture comprises two key components, as illustrated in Figure 4: • Encoder, which maps a d-dimensional input vector • Decoder, which reconstructs the original input Conceptual illustration of an autoencoder.
57


The reconstruction error—defined as the mean squared difference between input and output—is computed for each test instance. A damage index (DI) is then derived from the reconstruction error, and samples exceeding a learned threshold are flagged as anomalous. To account for changes in feature distributions across operating conditions, a data-driven adaptive threshold is used. This adaptive formulation enables consistent anomaly detection performance while preserving sensitivity to early-stage damage and ensuring resilience to EOVs.
Anomaly scoring and threshold-based evaluation metrics
In the final stage, a shallow AE is trained on healthy-state features from the sensor selected via the unsupervised ranking approach to learn baseline structural behavior across EOVs. Duri inference, reconstruction error is used as the anomaly score, with an adaptive thresholding scheme applied to maintain sensitivity across operating conditions. The healthy data are segmented into windows, and for each segment 
To ensure that the reported anomaly-detection performance is statistically reliable and not influenced by a particular data split, a 10-fold 70/30 hold-out validation was conducted exclusively on healthy-state data to preserve the one-class training structure. In each repetition, healthy samples were randomly split into 70% for training and 30% for validation, and the AE was re-initialized with a new random seed. The trained model was then evaluated on the combined set of unseen healthy and damaged samples. For every repetition, reconstruction errors were computed, and adaptive thresholds were applied according to equation (21), and the resulting anomaly classifications were used to calculate Recall, Precision, F1-score, and MCC. Averaging the results across all repetitions confirmed that the AE’s detection performance remained stable under different random partitions of the healthy data, demonstrating that the framework generalizes consistently and that its performance is not dependent on any specific data split. 57
Results and discussions
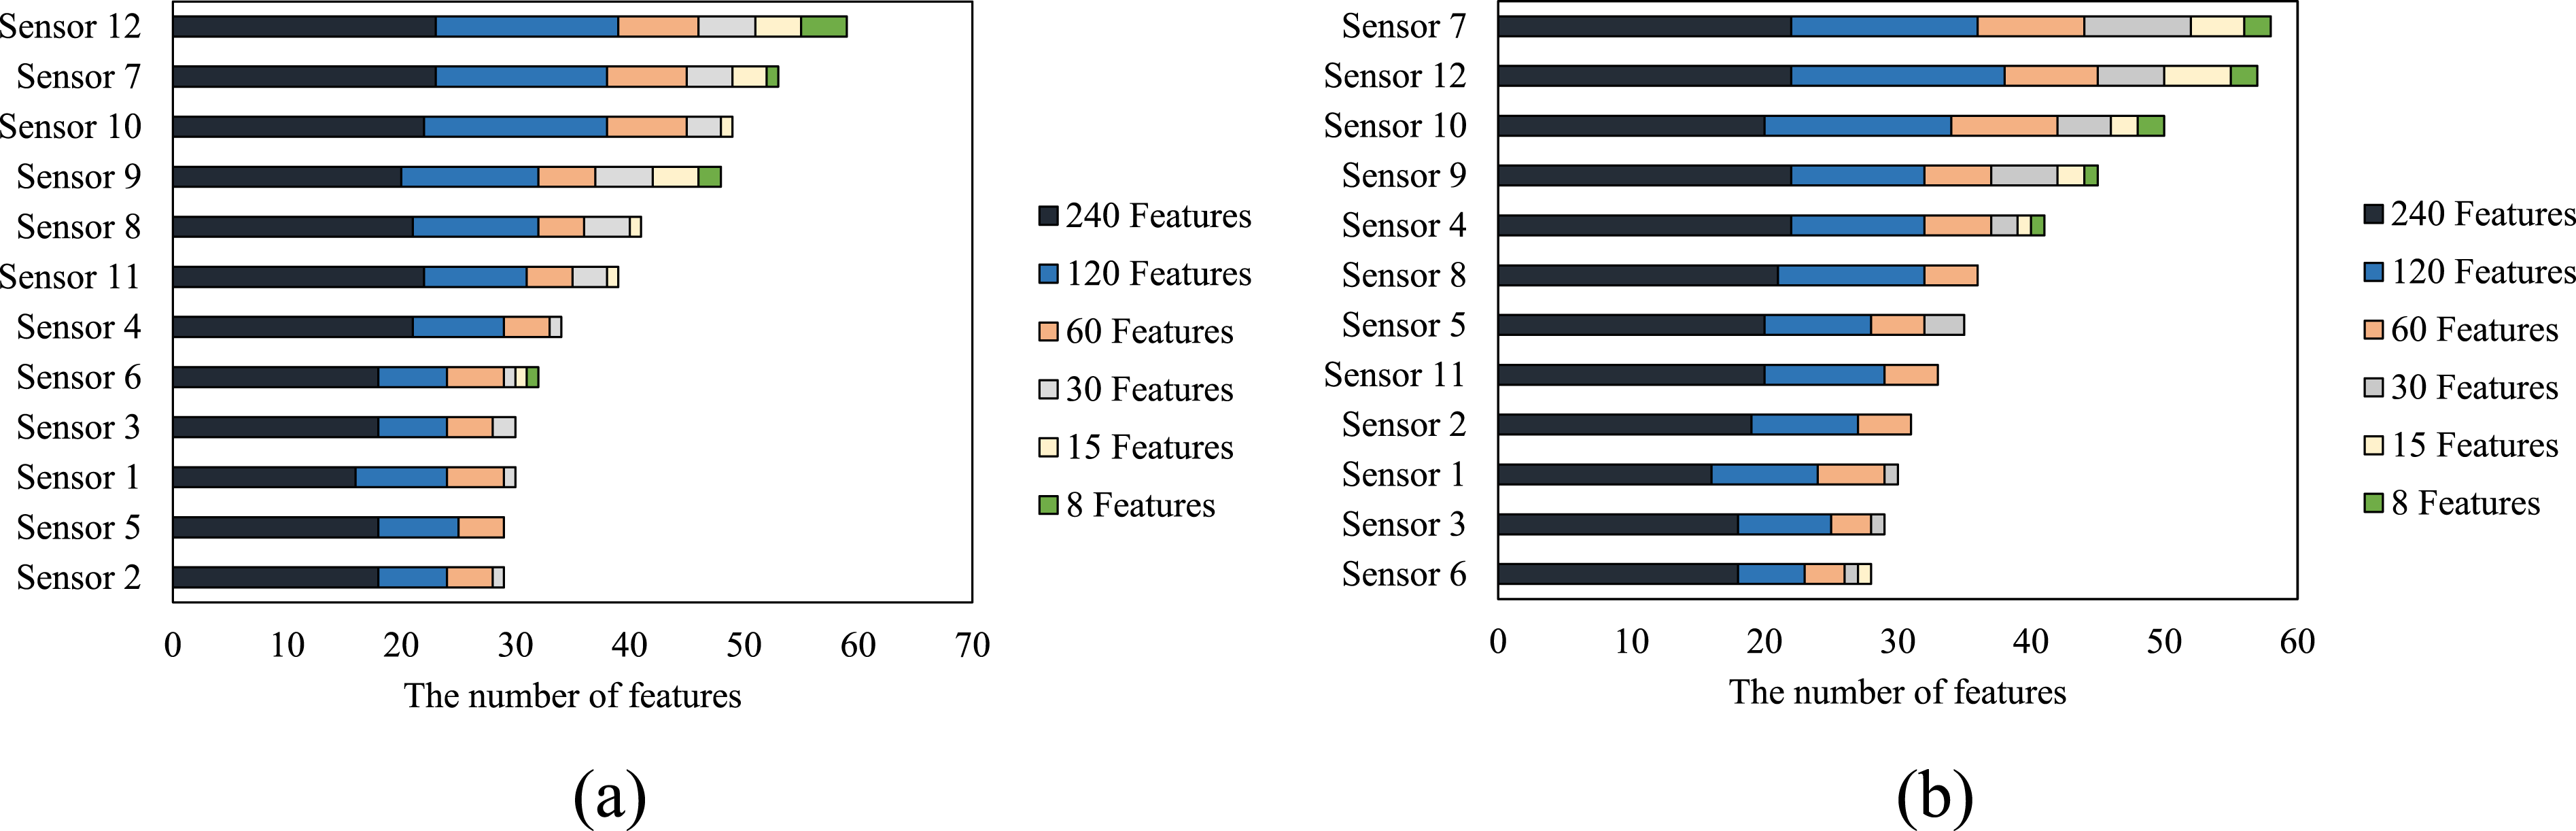
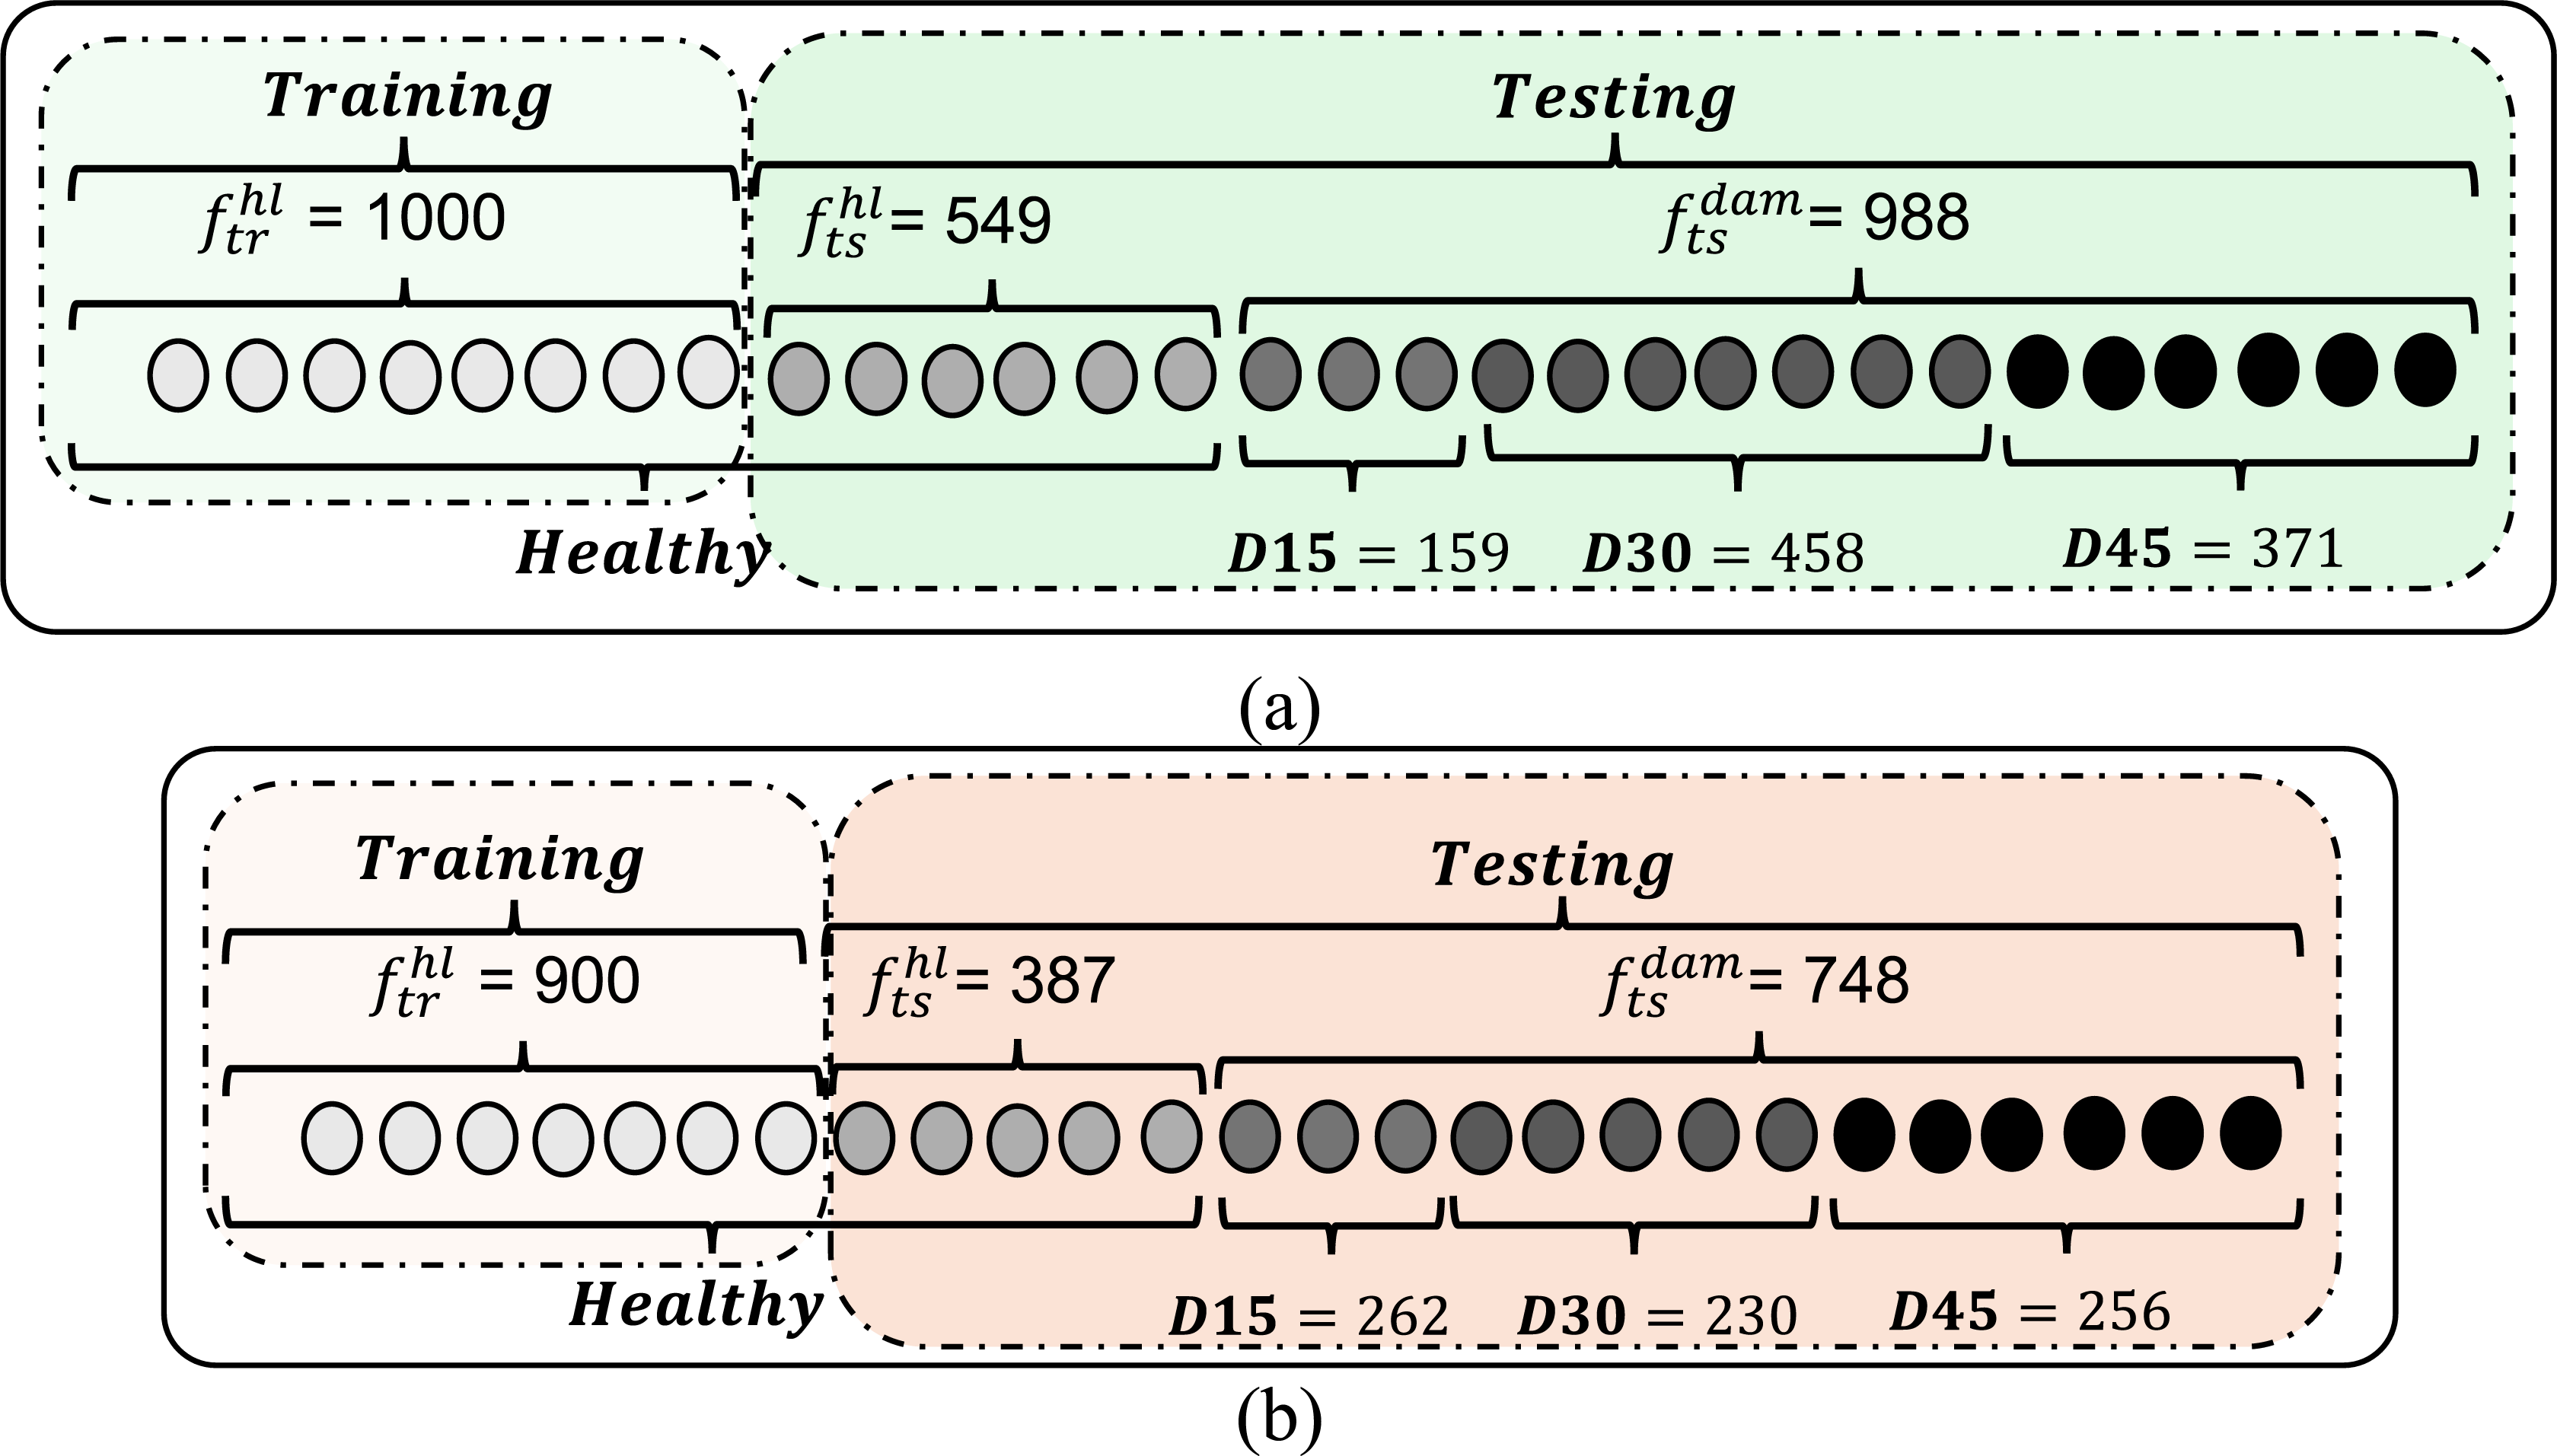
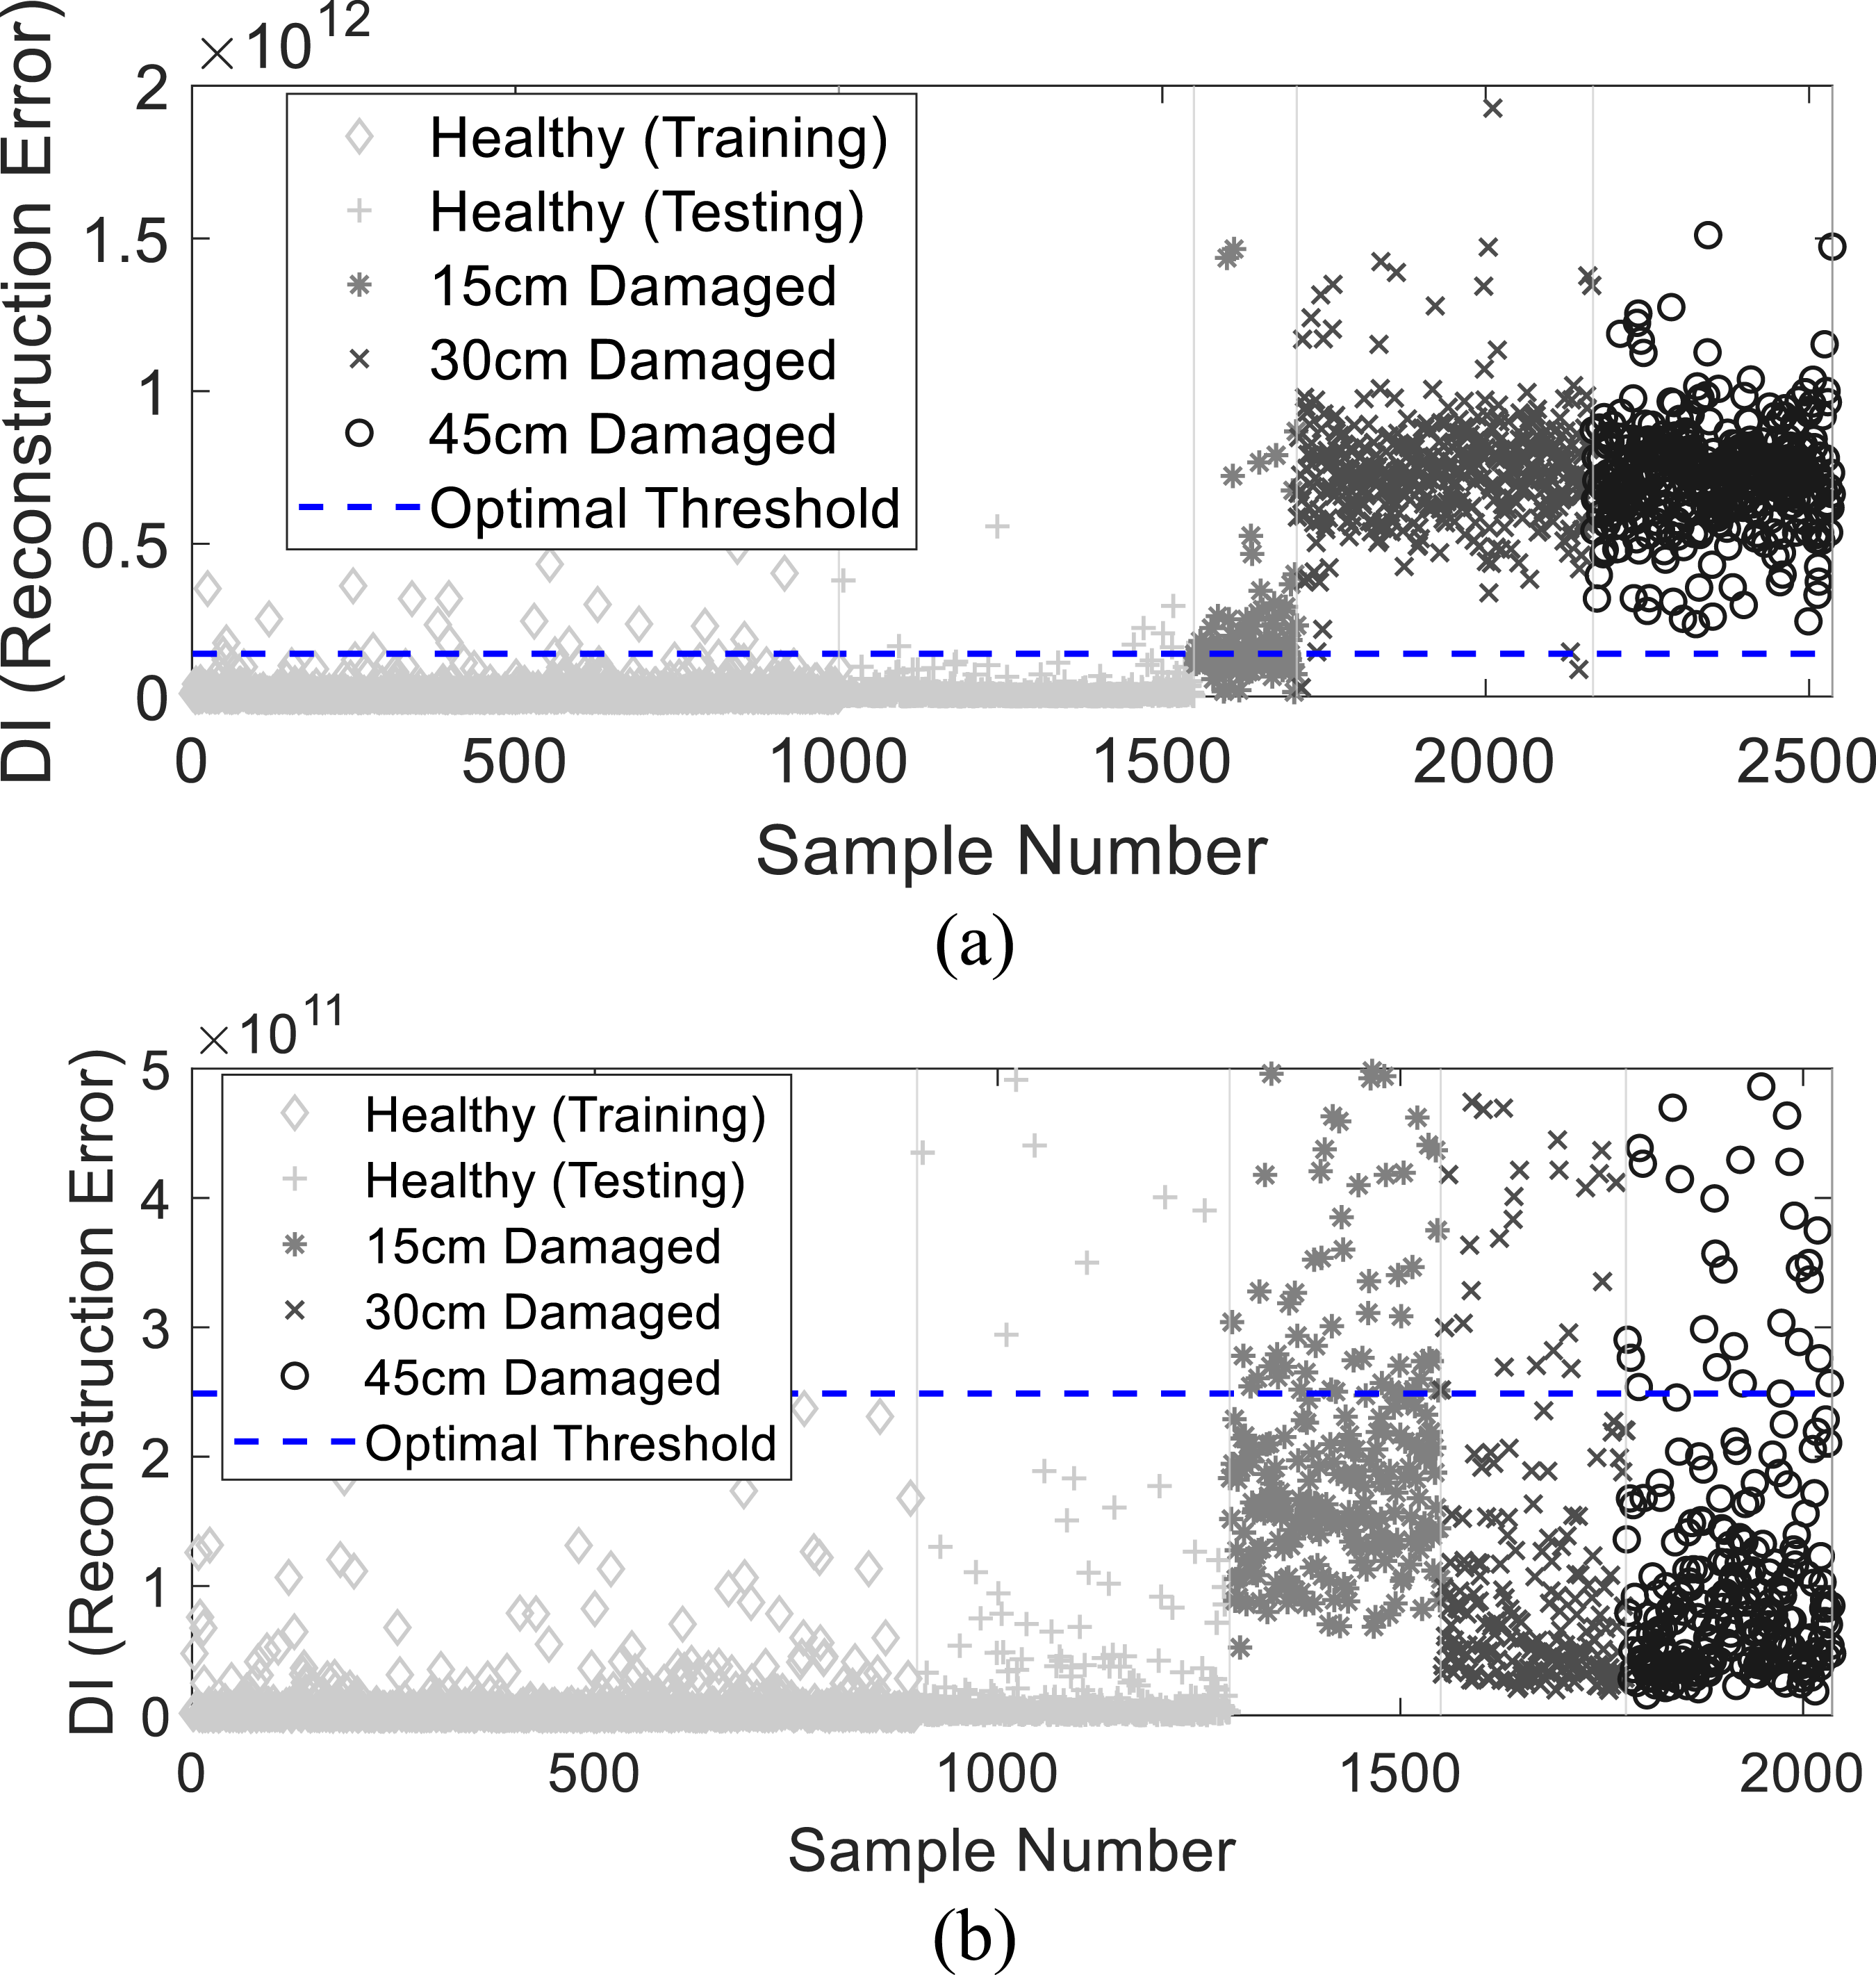
This section presents the results of the proposed unsupervised anomaly-detection and sensor-placement framework. The findings demonstrate how the FDF strategy enhances feature extraction by integrating information from both global and localized vibration responses, thereby improving sensitivity to early-stage damage under realistic EOV. The analysis first examines the data-driven frequency segmentation obtained via DWT to validate the physical consistency of the low- and high-frequency regimes, followed by the time-frequency feature extraction and sensor-ranking results. Figures 5–7 were created in Microsoft Excel 2021, and Figures 8–12 were produced using MATLAB R2024b. Energy Distribution of different operational conditions with different functions on only the healthy datasets. Feature distribution across sensors after FS by using the Laplacian of the (a) 32 RPM and (b) 43 RPM. Feature distribution across sensors after FS by using the temperature-aware FS of the (a) 32 RPM and (b) 43 RPM. Data splitting strategy for autoencoder-based anomaly detection. Frequency-domain features are extracted individually for each sensor, with (a) 32 RPM and (b) 43 RPM. Autoencoder-based anomaly detection using the sensor selected by Laplacian score: (a) Sensor 4 at 32 RPM and (b) sensor 1 at 43 RPM. Dashed blue line denotes the optimal DI threshold. Progressive increases in DI reflect worsening damage. Autoencoder of the selected sensor by the temperature-aware FS of (a) 32 RPM (the sensor 12) and (b) 43 RPM (the sensor 7). Autoencoder of the selected sensor and features (only eight features) by the temperature-aware FS of (a) 32 RPM (the sensor 12) and (b) 43 RPM (the sensor 7). The vision of MCC value of all sensors is done by the selected sensor and features by the temperature-aware FS of (a) 32 RPM and (b) 43 RPM.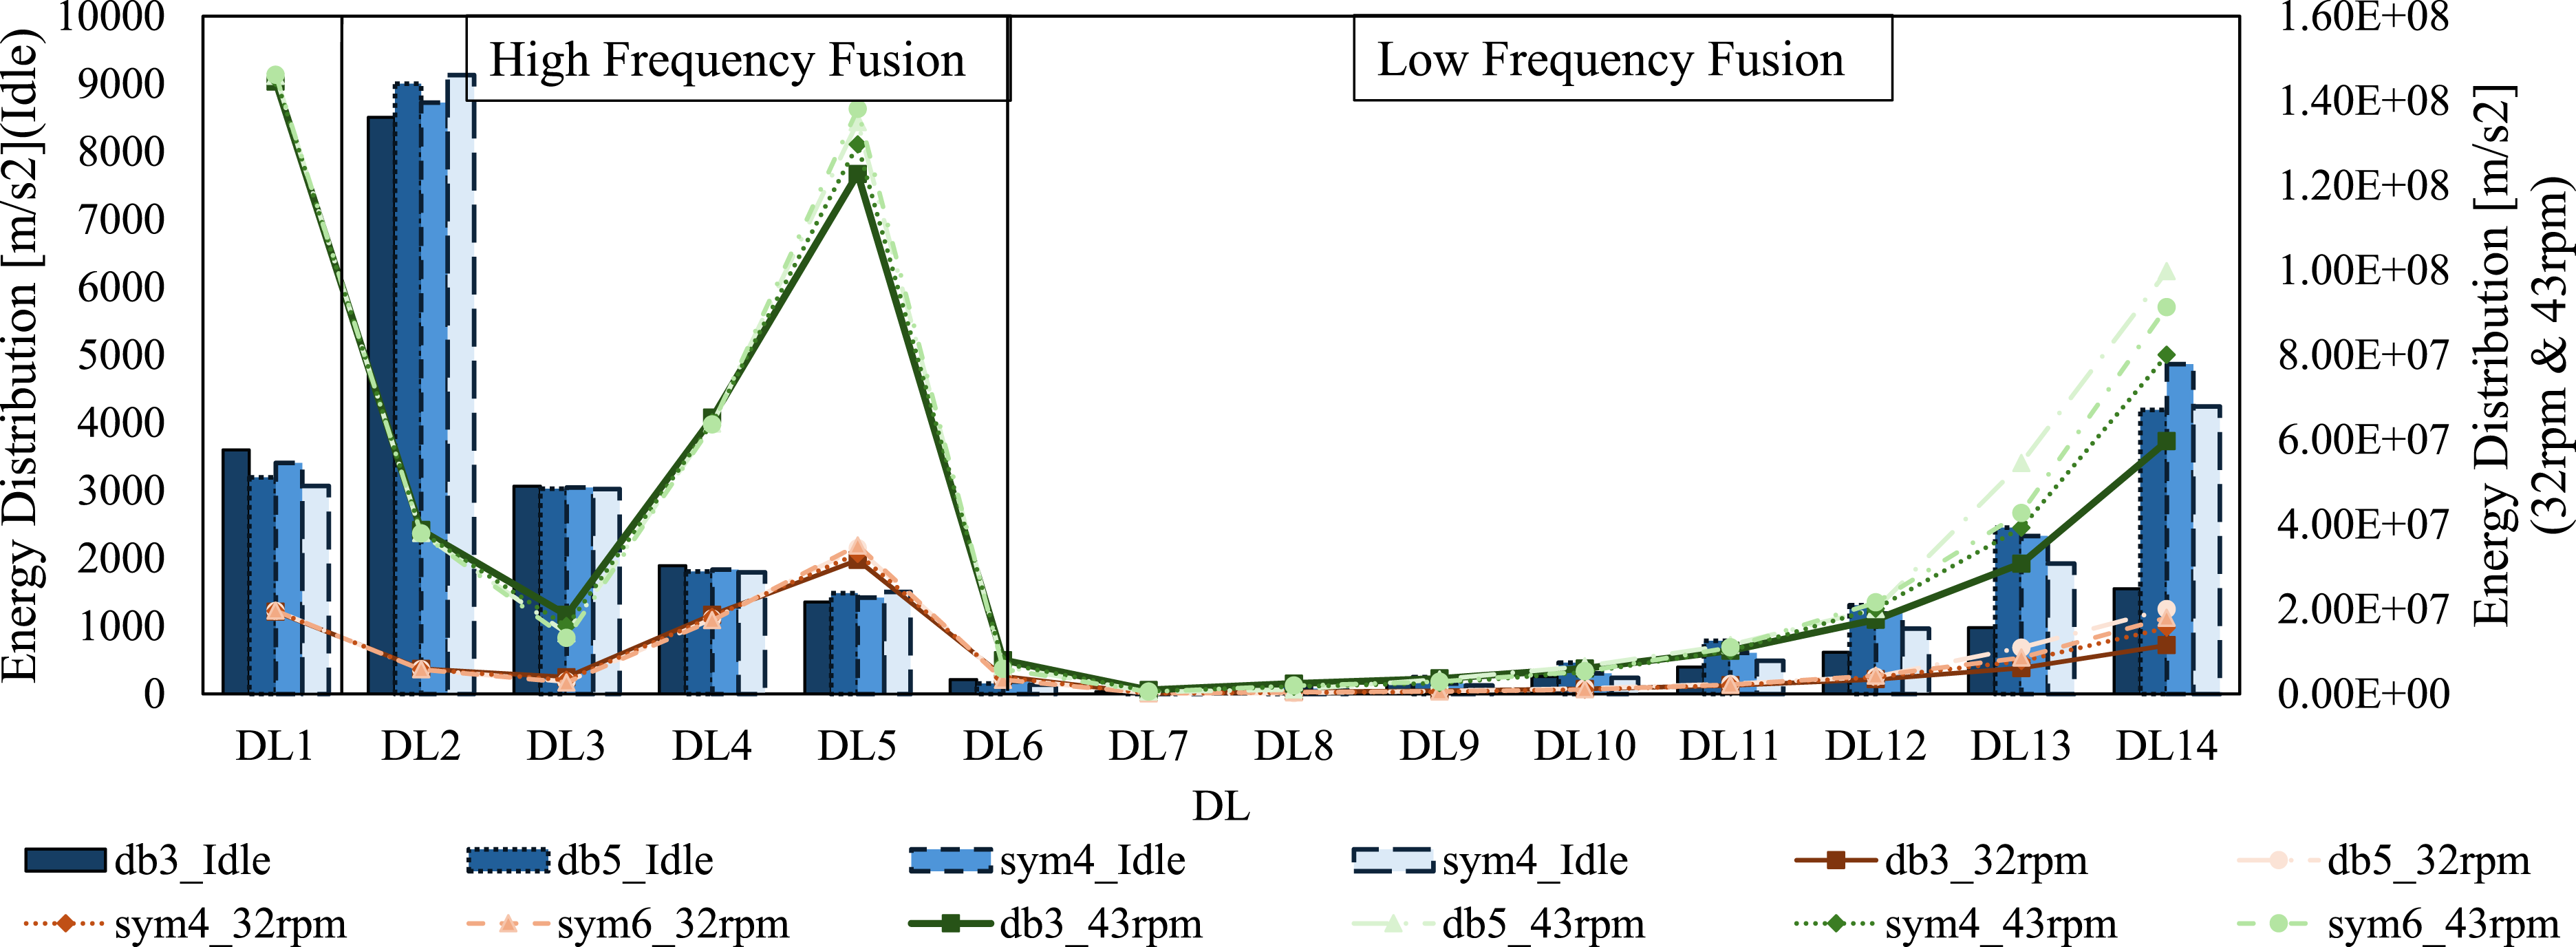


Signal pre-processing and feature extraction via FDF
To define a physically meaningful separation between global and localized vibration regimes, the DWT was first applied to the complete measurable bandwidth of the vibration signals (0–16,384 Hz) across multiple operational conditions and wavelet bases. This full-spectrum decomposition enabled a data-driven identification of the transition frequency at which vibration energy shifts from low-frequency bending and torsional modes to higher-frequency components associated with local deformation and aerodynamic excitation.
As illustrated in Figure 5, the cumulative energy distributions across decomposition levels exhibited a distinct and consistent inflection around the sixth level, corresponding to a central frequency of approximately 256 Hz. This transition delineates the boundary between the global modal domain and the localized dynamic regime. The selection of 256 Hz is physically consistent with the modal characteristics of the V27 blade, whose first few natural frequencies lie well below this threshold, while frequencies above it are governed by aerodynamic coupling, trailing-edge motion, and other localized nonlinear phenomena. The stability of this inflection across rotor speeds (idle, 32 RPM and 43 RPM) and wavelet families (Daubechies db3/db5 and Symlets sym4/sym6) confirms that the derived boundary is robust against environmental and operational variability, establishing a reliable physical foundation for subsequent analysis.
Following the identification of this cutoff frequency, the vibration signals were down-sampled by a factor of 4, reducing the sampling rate to 4.096 kHz with a corresponding Nyquist frequency of 2024 Hz. Comparative spectral and DWT-based energy analyses between the original (16.384 kHz) and down-sampled (4.096 kHz) signals confirmed that over 99 % of the vibration energy is contained below 2 kHz, with less than 0.5 % difference in total spectral energy. This demonstrates that the reduced sampling rate preserves all physically meaningful dynamic content while discarding only high-frequency, noise-dominated components. This sampling rate captures all significant structural dynamics of the blade while substantially reducing computational load and memory requirements during large-scale time-frequency analysis of one-second (4096-sample) ambient vibration segments. The down-sampling step ensures numerical stability, eliminates redundant high-frequency content beyond the resolvable range, and mitigates MATLAB memory limitations.
The down-sampled signals were subsequently band-filtered within 0–2024 Hz to suppress measurement noise and aliasing, focusing the analysis on the physically meaningful spectral region. Two regimes were then defined based on the identified cutoff frequency
Once the frequency boundary at 256 Hz was established, the vibration signals were further divided into two distinct bands using finite-impulse-response (FIR) filters: (1) a low-pass filter isolating components below 256 Hz to represent global modal dynamics, (2) a high-pass filter retaining components above 256 Hz to capture localized, high-frequency activity such as aerodynamic excitation and trailing-edge deformation.
Each filtered band was then analyzed using the CWT with both Morse and CMOR wavelets to characterize the non-stationary vibration behavior. The CWT configuration was adaptively optimized for each regime to preserve diagnostic fidelity: the low-frequency band was analyzed using 30 voices per octave, emphasizing spectral resolution to track gradual modal variations, whereas the high-frequency band employed 12 voices per octave, emphasizing temporal precision to resolve short-duration transients.
This adaptive design allows the CWT to simultaneously resolve long-duration modal softening and rapid, localized events within a unified framework. The combined use of the Morse and CMOR wavelets ensures sensitivity to both distributed modal changes and local transient phenomena, providing a physically interpretable representation of the blade’s dynamic response under ambient excitation. From each wavelet-band combination, a comprehensive set of statistical and energy-based features was extracted to quantify the vibration characteristics of the structure. These include the SC, SS, SW, SK, SE, SF, SR, SP, SD, SV, and PS. All these features were computed independently for each band (
Sensor selection through unsupervised feature ranking
Two independent feature-ranking strategies—Laplacian score and Temperature-Aware Statistical Ranking—were applied to the extracted feature set. For each operational speed, sensors were ranked according to the number of their features appearing in the top-performing subsets across multiple truncation thresholds (top ½ (240), ¼ (120), ⅛ (60), 1⁄16 (30), 1⁄32 (15), and 1⁄64 (8)). Given that each sensor originally provided 480 features, further compression to 1⁄128 (≈4 features) would have been excessively restrictive and risked losing essential diagnostic information, whereas the 1⁄64 subset (∼8 features) preserved the key descriptors while maintaining numerical stability. Performance evaluation confirmed that metrics such as MCC, precision, and recall plateaued below 15 features, with less than 0.5 % variation between 15 and 8. Therefore, selecting eight features offered the most balanced trade-off between compactness, diagnostic fidelity, and fairness across sensors and operational speeds. The results for each method and operational speed are presented in the following subsections.
Laplacian-based sensor attribution
Before performing the sensor-attribution analysis, the hyperparameters of the Laplacian score were selected and validated to ensure stable and physically meaningful ranking performance. The Laplacian score relies on two key parameters—the number of nearest neighbors (
Figure 6 presents the distribution of features selected using the Laplacian score. At 32 RPM (Figure 6(a)), S4 (leading edge, mid-span) emerged as the most influential, followed by S2 (trailing edge) and S1 (leading edge, near the root). These locations are well-positioned to capture both global modal responses and asymmetric deformation patterns that are more pronounced at low rotational speeds, where centrifugal stiffening is reduced. 89 Mid-span sensors (S 6 and 9) also ranked highly, consistent with their sensitivity to higher-order bending and torsional modes that can manifest even under mild excitation. 41 At 43 RPM (Figure 6(b)), the dominant location shifted to S1, with notable contributions from S5 (trailing edge) and S9 (mid-span). The shift toward root-adjacent and trailing-edge sensors at higher speeds suggests that increased centrifugal forces and aerodynamic loading redistribute strain energy toward these regions. 90 However, it is notable that no single sensor consistently dominated across both speeds, underscoring the influence of operational speed on spatial sensitivity and the limitations of a single-criterion selection.
The temperature-aware sensor attribution
As detailed in Section 2.3.2, the temperature-aware statistical filter does not rely on distinct hyperparameters for each criterion; instead, it ranks features by minimizing the combined quantity
Figure 7 presents the sensor rankings obtained using the temperature-aware statistical method for 32 RPM and 43 RPM. At 32 RPM (Figure 7(a)), S12 (root region) emerged as the most robust, followed by S7 and S10 (both leading edge). The root’s relative rigidity likely reduces susceptibility to thermally induced strain changes,91,92 while certain leading-edge positions appear to maintain stable responses despite environmental fluctuations. Moreover, the root region is known to experience highly complex strain topologies under both bending and torsional loading due to its asymmetric geometry and direct load transfer into the hub. This has been experimentally demonstrated in hybrid dense sensor network studies, where the root consistently exhibited the highest strain magnitudes and spatial complexity, making it highly responsive to even subtle changes in structural state. 93 Such complexity means that robust, temperature-stable features extracted from this area can serve as reliable damage indicators even under varying EOVs.
At 43 RPM Figure 7(b), S7 retained dominance, with strong contributions from Ss 12, 10, and 9 (mid-span). The repeated prominence of leading-edge sensors—namely, S7 and S10—is consistent with prior experimental findings showing that leading-edge damage, such as erosion, coating delamination, and pitting can induce significant aerodynamic changes detectable in far-field acoustic spectra. 94 These studies highlight that leading-edge surface condition directly influences local flow structures and aerodynamic loading, which in turn can enhance vibration sensitivity in this region. The prominence of S9 at higher speed suggests that specific mid-span positions can simultaneously deliver high dynamic sensitivity and environmental stability. In contrast, sensors ranking highly under Laplacian (e.g., Ss 1, 2, and 4) often dropped in prominence here, implying their strong Laplacian performance may partly stem from environmental sensitivity rather than purely structural effects.
Autoencoder-based anomaly detection
In the final stage of the proposed framework, an AE model is developed to detect structural anomalies using only the features extracted from the selected optimal sensor. To ensure robustness against overfitting and to promote generalization across unseen operational and environmental conditions, a systematic data-splitting and validation strategy is employed, as illustrated in Figure 8. For each operational regime (32 RPM and 43 RPM), the extracted DSFs are divided into non-overlapping training and testing subsets. The healthy-state data are further partitioned into a training portion (
To minimize sampling bias and assess robustness to random initialization, AE training is repeated under 10 independent 70/30 hold-out partitions of the healthy data and 10 random weight initializations. In each repetition, the network is re-initialized using Glorot (Xavier) initialization and trained using the scaled conjugate-gradient (trainscg) algorithm. Performance metrics are later averaged across all repetitions to ensure statistical reliability.
As shown in Figure 8, the data-splitting scheme includes regime-specific partitions:
For 32 RPM,
Autoencoder using the selected sensor by Laplacian
At 32 RPM, the sensor selected by Laplacian was S4 (leading edge, mid-span). As shown in Figure 9(a), this location captures clear separations between healthy and damaged states; even the smallest induced defect (15 cm trailing-edge opening) causes a noticeable increase in DI, with progressive rises for the 30 cm and 45 cm damage cases. The adaptive thresholding cleanly discriminates between normal and abnormal responses, producing a recall of 91.29 %, precision of 98.26 %, F1-score of 94.64 %, and an MCC of 0.8634—indicating strong anomaly detection capability under low-speed operation. In contrast, at 43 RPM, the selected location shifted to S1 (leading edge, near root). As shown in Figure 9(b), while severe damage cases produce elevated DIs, early-stage defects often remain close to or below the threshold, increasing the risk of false negatives. This reduced sensitivity is reflected in the metrics: recall drops to 20.62 %, despite precision remaining high at 91.12 %, yielding an F1-score of 33.62 % and an MCC of 0.2232. The weaker performance at high speed is likely due to increased aerodynamic and inertial loading, which can mask subtle damage-induced changes in the vibration signature, making them harder to detect—an effect also reported in prior studies of blade load variability. 90
These results confirm that operational speed plays a critical role in determining which sensors are most effective for anomaly detection and that leading-edge positions, particularly near mid-span, are highly informative at lower speeds, while root-adjacent sensors may become more dominant at higher speeds. However, the significant drop in sensitivity at 43 RPM highlights the need for sensor selection strategies that balance damage sensitivity with resilience to EOVs in realistic operating conditions.
Autoencoder using the selected sensor by the temperature-aware FS
In this stage, the AE model was trained and evaluated using the sensors identified through the temperature-aware feature ranking approach: S12 for 32 RPM and S7 for 43 RPM. As described in Section 3.2.2, these sensors were selected for their ability to retain environmentally stable features with minimal correlation to ambient temperature, making them less sensitive to environmental variability while maintaining strong diagnostic potential.
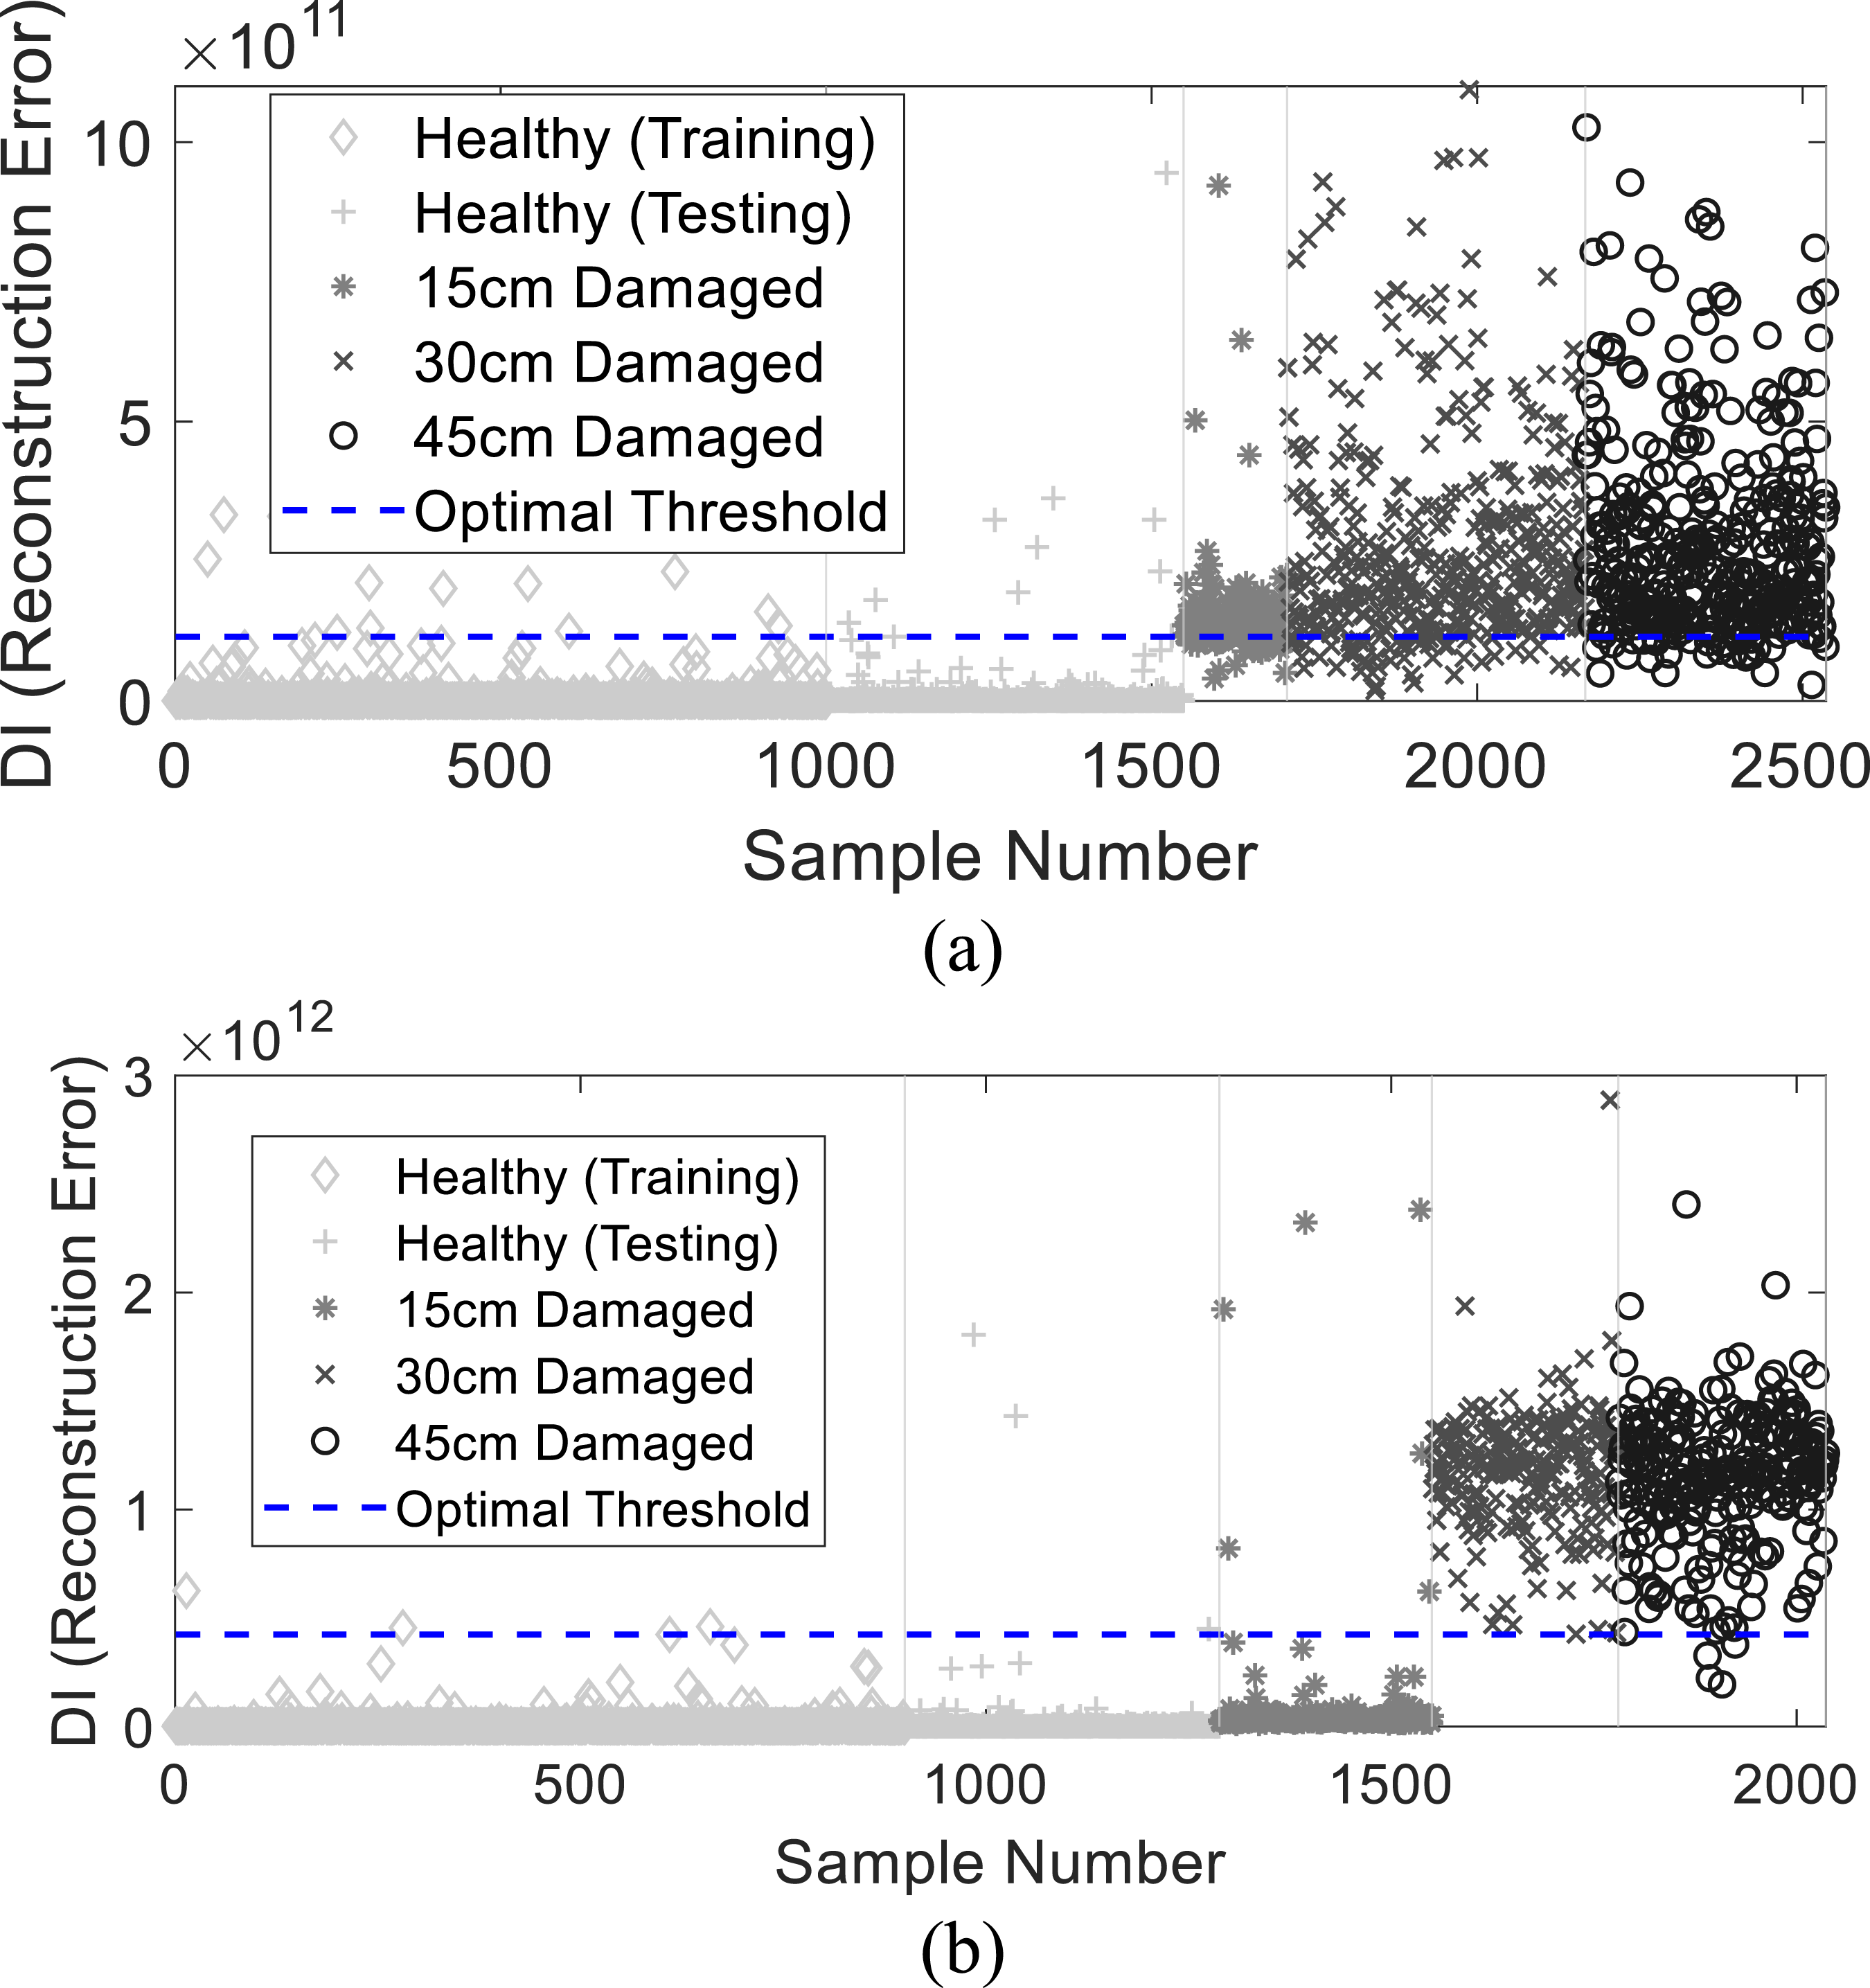
For the 32 RPM regime (Figure 10(a)), S12—mounted near the blade root—produced tightly clustered DI values for all healthy samples, with a clear monotonic increase in DI as the damage severity progressed from 15 cm to 45 cm trailing-edge openings. Despite its location in a relatively stiff region of the blade, 93 S12 performed well because of its stability under varying environmental conditions. This stability translated into high anomaly detection performance, with a recall of 87.64 %, precision of 98.07 %, an F1-score of 92.56 %, and an MCC of 0.8194. In the 43 RPM regime (Figure 10(b)), S7—positioned along the leading edge—yielded a well-separated DI distribution across all structural states. Notably, even early-stage damage (15 cm) was distinguishable from healthy data with minimal overlap, achieving a recall of 66.27 % and an F1-score of 79.52 %. Precision remained exceptionally high at 99.40 %, indicating a very low false-positive rate despite increased aerodynamic loading and operational variability at higher rotor speeds.
These results reinforce the value of temperature-aware FS for real-world SHM. By filtering out environmentally sensitive features, the method yields sensors whose responses remain stable despite changes in temperature and operational regime, aligning with prior findings on the critical role of environmental robustness in vibration-based damage detection. 95 In contrast to Laplacian-based selection, which prioritizes pure damage sensitivity, the temperature-aware approach mitigates false alarms by ensuring that the learned latent representations in the AE are less affected by environmental transients. Importantly, while the selected sensors already demonstrate strong detection performance, there is clear potential for further enhancement. The next stage of this framework refines the process by applying FS within the feature set of the chosen sensor, isolating only the most damage-sensitive and environmentally stable descriptors. This targeted refinement is expected to further improve sensitivity, maintain high precision, and deliver greater consistency across operating speeds and environmental conditions.
Autoencoder using the selected sensor and top eight features by the temperature-aware FS
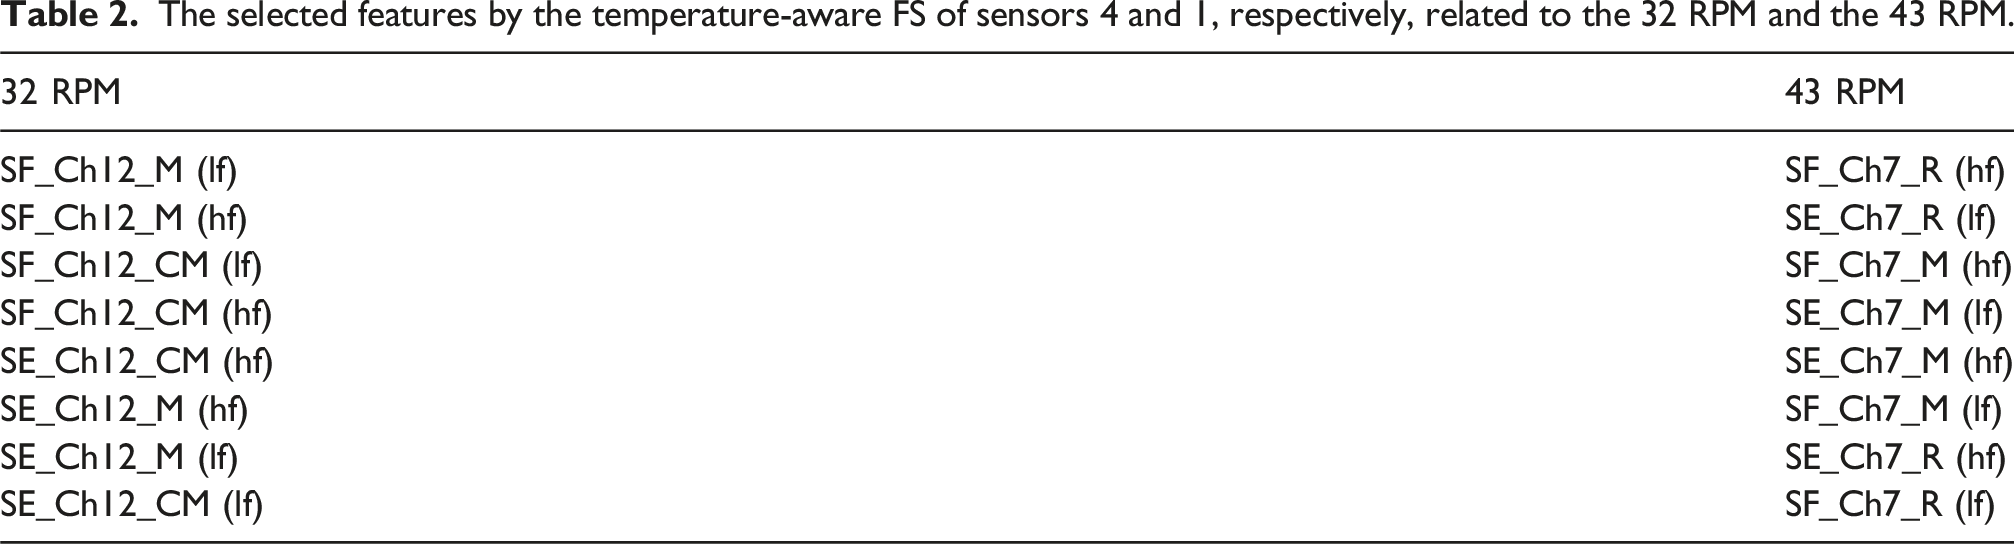
The selected features by the temperature-aware FS of sensors 4 and 1, respectively, related to the 32 RPM and the 43 RPM.
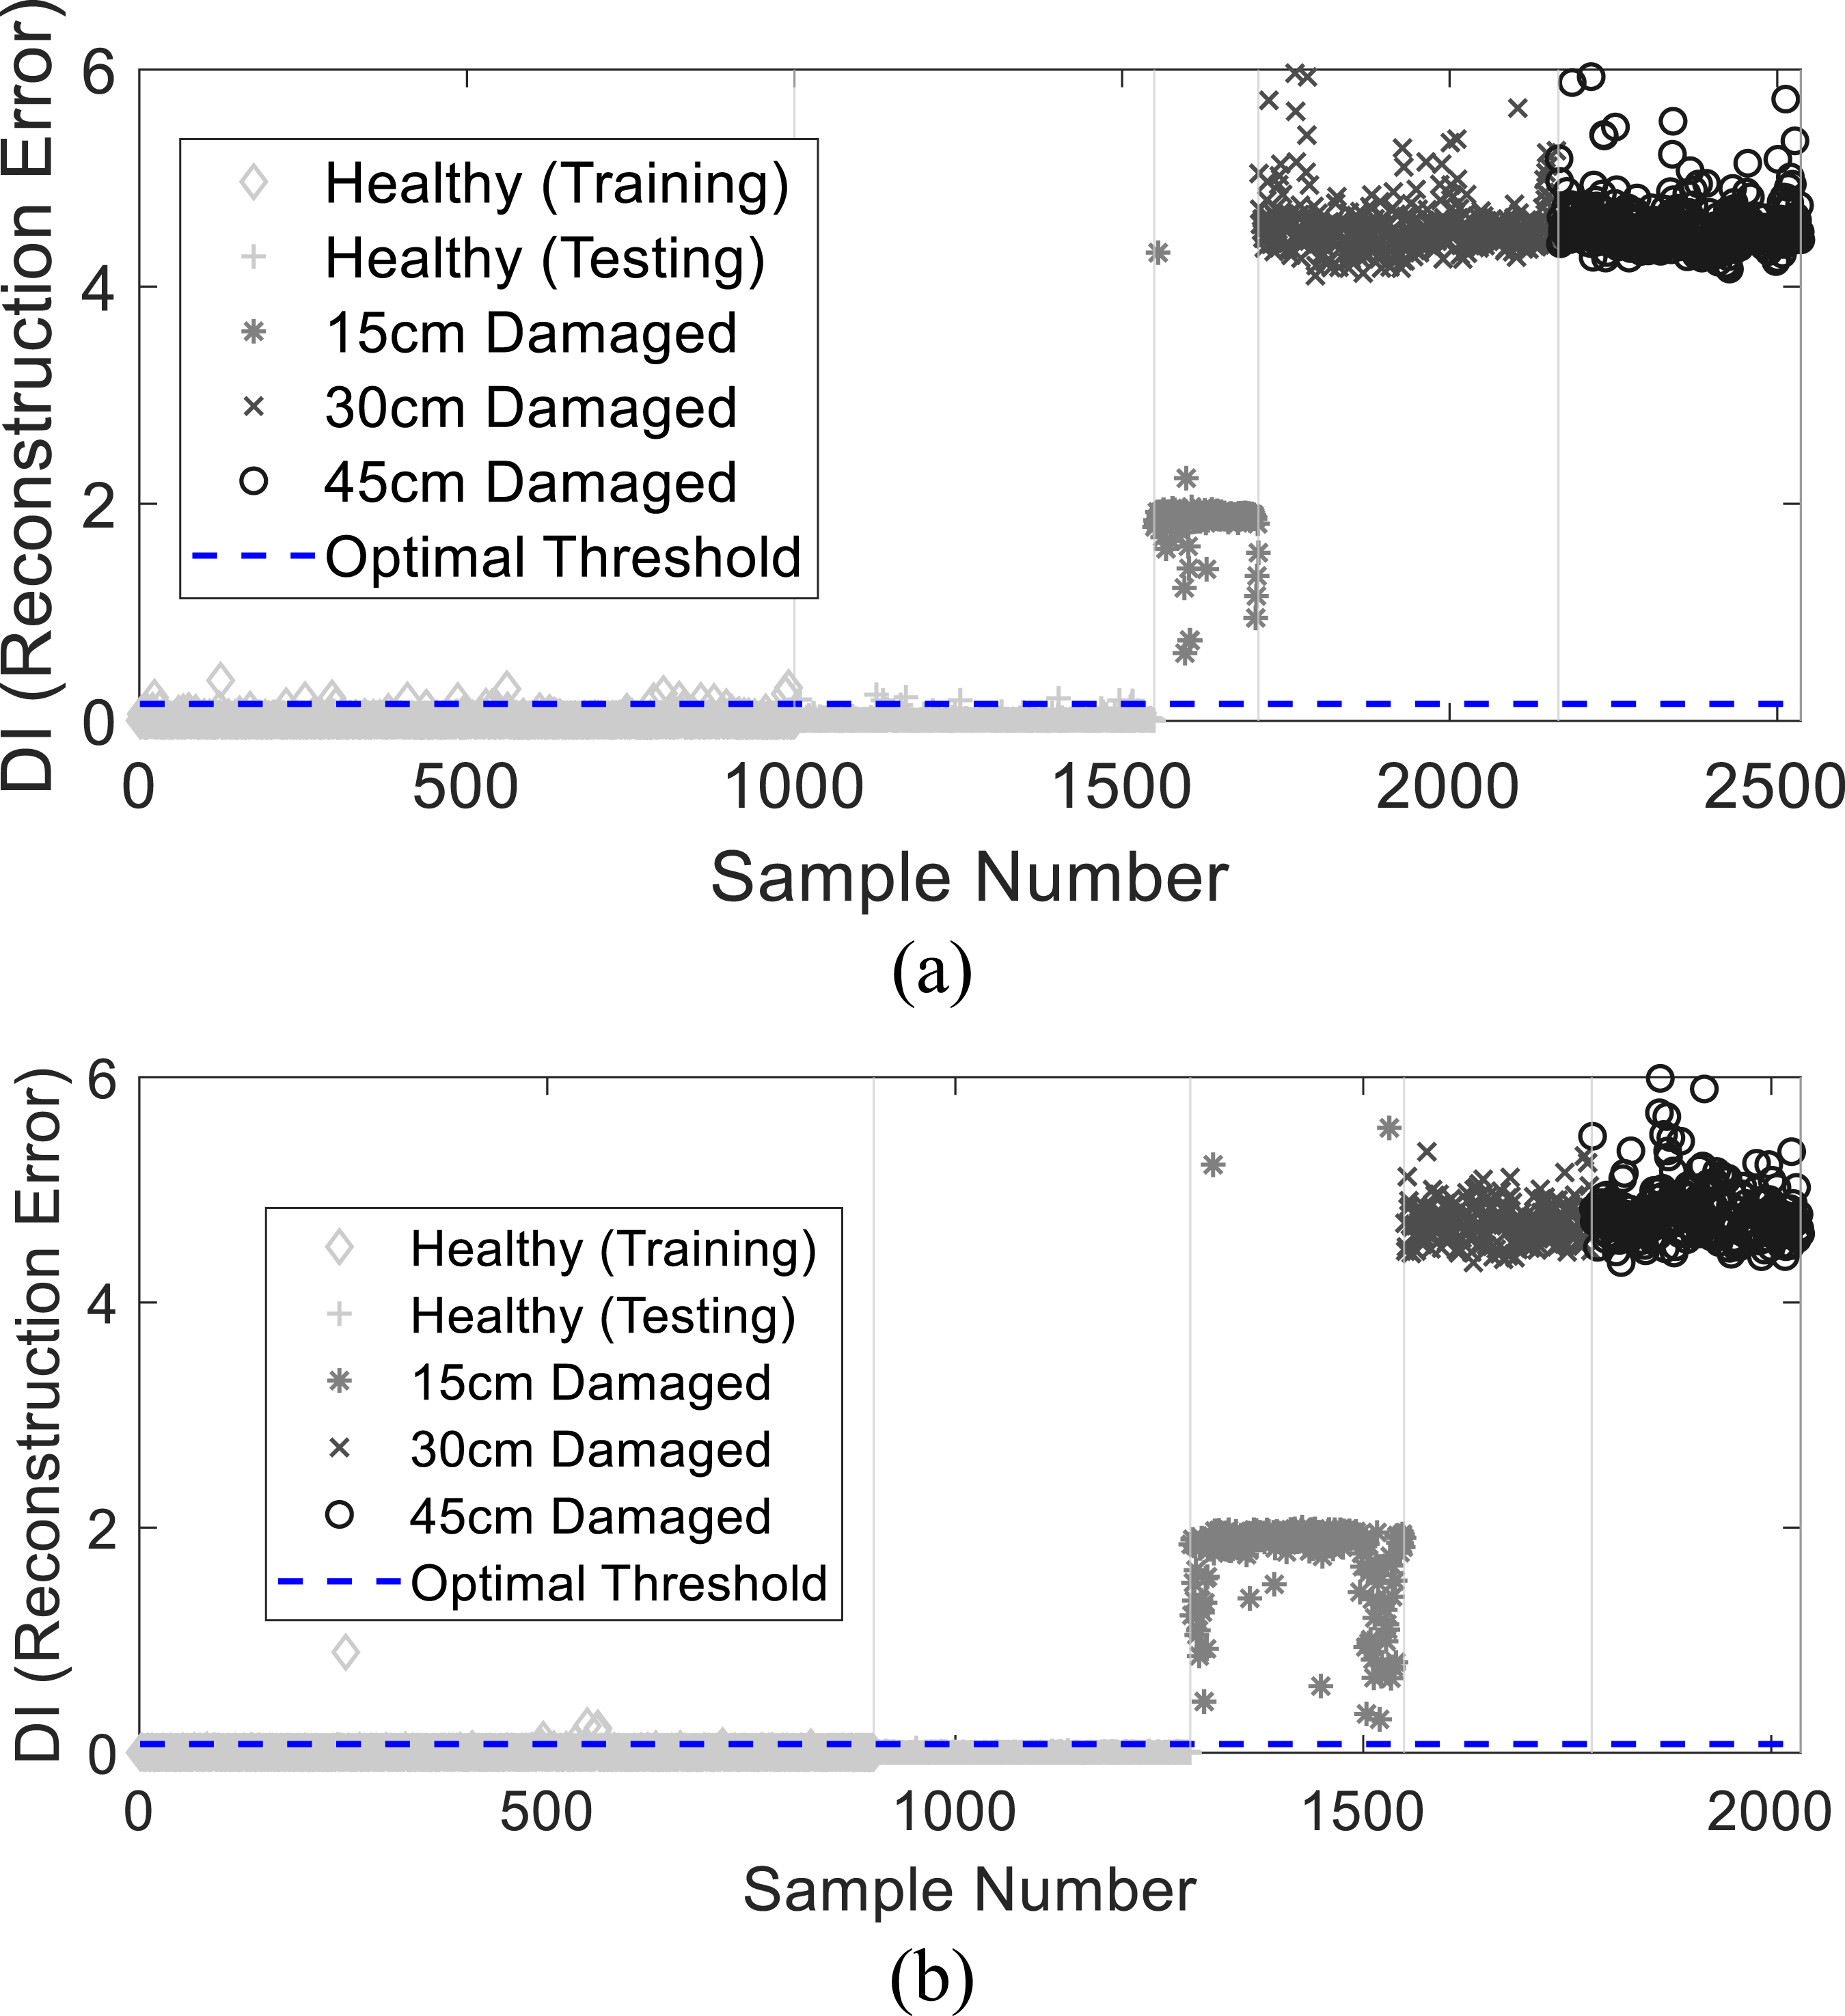
The benefits of this targeted refinement are clearly visible in the anomaly detection outcomes shown in Figure 11. In both operational regimes, the reconstruction-error-based DI for healthy samples—both training and testing—remains tightly clustered near zero, while even the smallest induced defect (15 cm trailing-edge opening) is cleanly separated above the adaptive threshold. This separation is more pronounced than in the earlier full-feature experiments, confirming that reducing feature space to the most physically informative and environmentally stable descriptors significantly enhances the model’s discrimination capability.
Performance improvements are substantial. For 32 RPM (Sensor 12), the autoencoder achieved Recall = 100%, Precision = 99.10%, F1 = 99.55%, and MCC = 0.9873. For 43 RPM (S7), results were similarly strong, with Recall = 100%, Precision = 99.87%, F1 = 99.93%, and MCC = 0.9980. These near-perfect scores demonstrate not only improved sensitivity to early-stage damage but also exceptionally low false-positive rates—critical for reliable, long-term SHM under ambient excitation.
To quantify computational efficiency, the training time of the AE was benchmarked under identical hardware conditions, measuring only the network-training process. Reducing the input dimensionality from the full feature set (444 features) to the top eight temperature-stable features yielded an approximately 45-fold reduction in training time (from about 65 to 75 s to 0.8–1.5 s on average) without any loss of detection accuracy. The AE consistently converged after roughly 250 epochs, confirming that the proposed framework is computationally efficient and suitable for real-time or embedded SHM applications.
Two key conclusions emerge from this stage: (1) Sensor placement and feature engineering are inseparable—selecting the most informative sensor alone is insufficient; detection performance ultimately depends on the discriminative power of the features it provides. (2) Targeted, physically informed feature reduction—guided by robustness to environmental variability—can improve anomaly detection performance, particularly under variable operating conditions.
Although a separate noise-injection experiment was not explicitly performed, the proposed framework inherently provides resilience to measurement and operational noise through its multi-stage design. The wavelet-based FDF acts as a natural multiresolution filter, enhancing the signal-to-noise ratio by isolating physically meaningful vibration components across time-frequency scales. The temperature-aware statistical FS penalizes unstable features whose variance may arise from random noise, while the autoencoder learns stable structural representations from healthy-state data, effectively suppressing stochastic fluctuations during reconstruction. Collectively, these steps act as implicit denoising mechanisms, ensuring that the model maintains high anomaly detection accuracy and minimal false-positive rates even under realistic noisy operating conditions. These findings underline the central premise of this work: feature engineering is equally critical for both optimal sensor placement and damage detection. The combination of environmentally robust sensor attribution with high-impact spectral-statistical features provides a scalable, interpretable, and computationally efficient pathway for operational SHM of WTBs. Future extensions could explore adaptive FS strategies to sustain optimal detection performance as EOVs evolve.
Discussion and comparison
As the developed model in earlier stages proved to be most sensitive to early‐stage damage (15 cm trailing‐edge opening), the final evaluation stage was conducted exclusively on this damage level. This provides a stringent test of sensor performance, as early‐stage damage induces only subtle changes in the vibration response compared to more severe cases. By focusing on the most challenging detection scenario, the comparison here assesses each sensor’s ability to identify minimal but meaningful deviations from healthy behavior under realistic EOV.
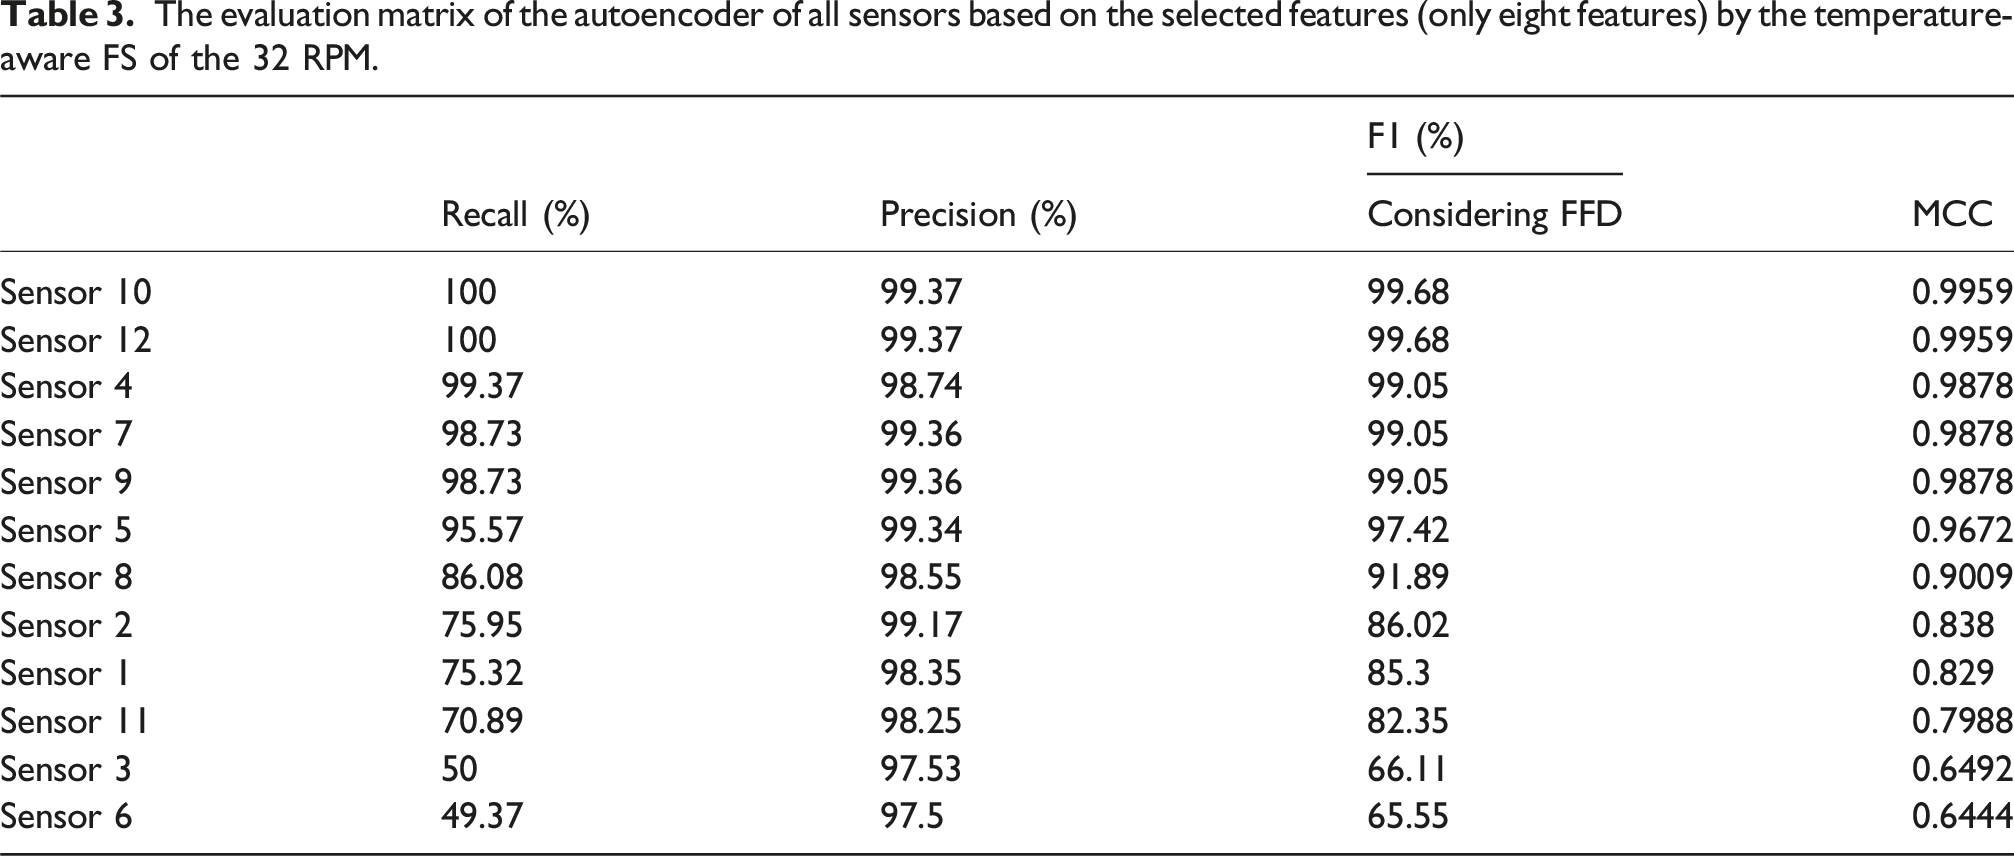
The evaluation matrix of the autoencoder of all sensors based on the selected features (only eight features) by the temperature-aware FS of the 32 RPM.
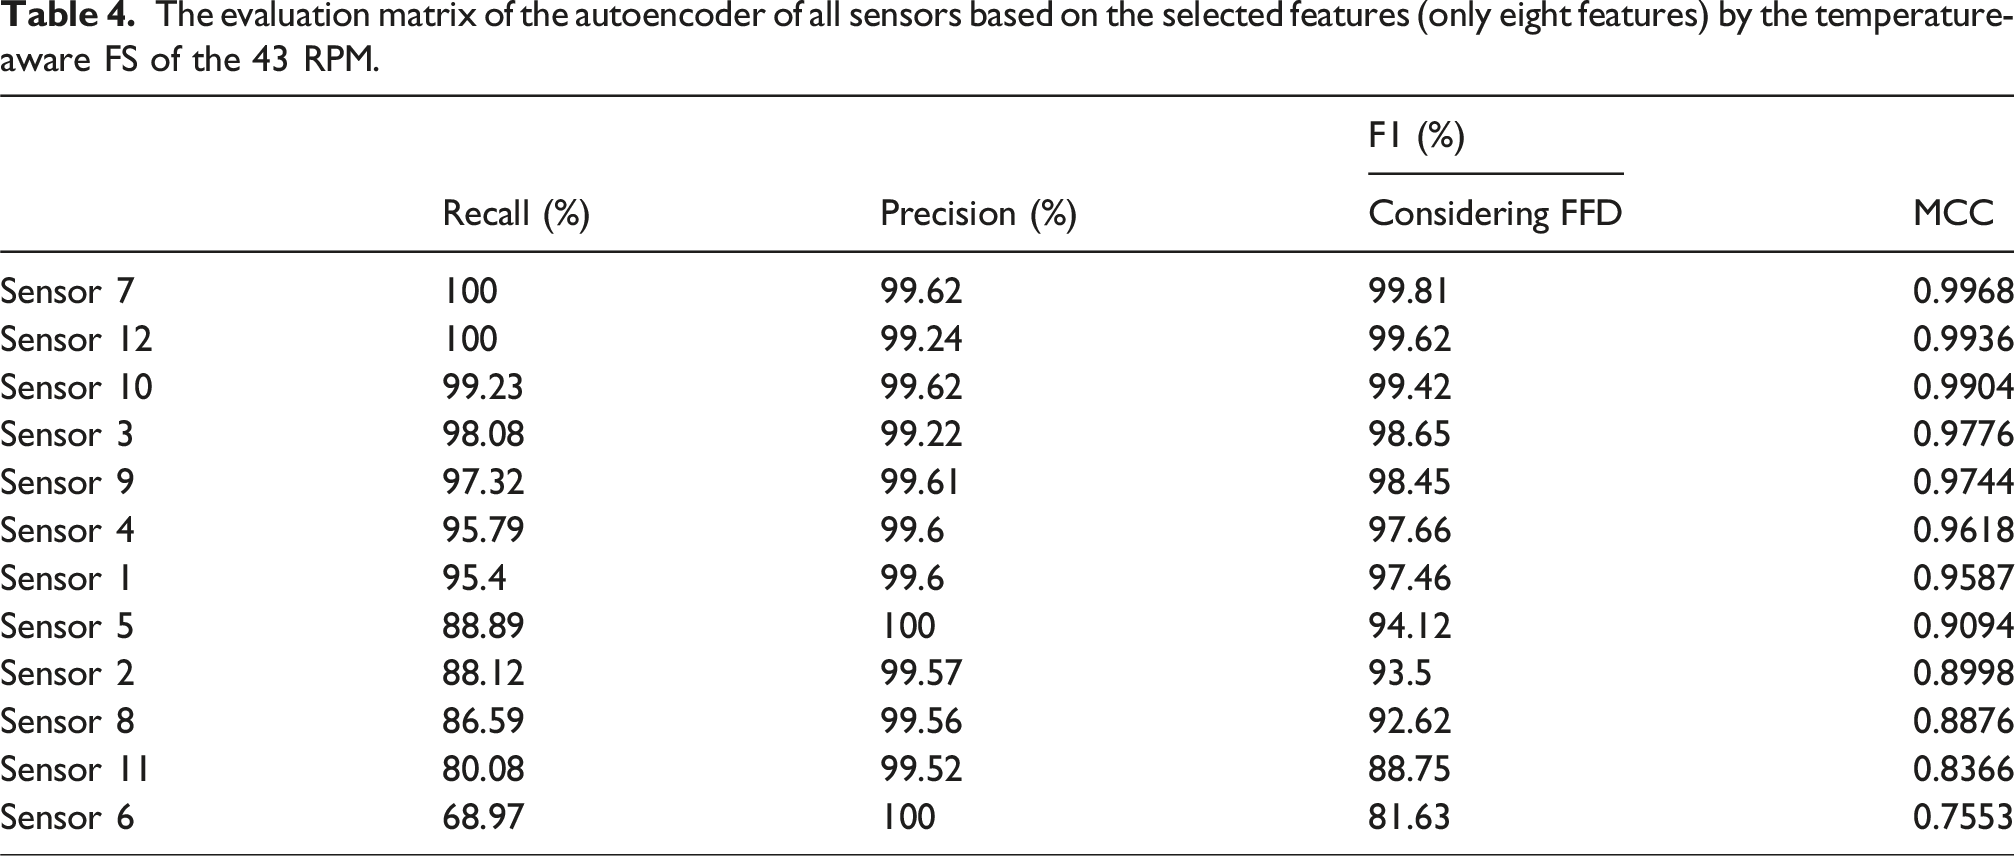
The evaluation matrix of the autoencoder of all sensors based on the selected features (only eight features) by the temperature-aware FS of the 43 RPM.
At 32 RPM, the best‐performing sensors are S10 and S12 (both MCC = 0.9959), followed by S4, S7, and S9 (all MCC = 0.9878). These locations span the leading edge (S4, S7, S10, and S12) and mid‐span (S9), suggesting that optimal low‐speed coverage combines leading‐edge positions—sensitive to global bending and asymmetric aerodynamic loading—with mid‐span positions that capture mixed‐mode vibration signatures. Sensors S3, S6, and S11 show markedly lower recall, which reduces their MCC despite relatively high precision.
At 43 RPM, the highest MCC is obtained by S7 (0.9968), with S12 (0.9936) and S10 (0.9904) close behind. Strong secondary performance is also seen for S3 (0.9776) and S9 (0.9744), indicating that certain mid‐span positions maintain high sensitivity at higher speeds. In contrast, trailing‐edge sensors, such as S5 and S8, show reduced MCC values, primarily due to lower recall. The consistent dominance of leading‐edge sensors at higher RPM supports earlier findings that these positions are particularly responsive to aerodynamic loading variations under non‐stationary conditions.
Crucially, the top‐performing sensors in this validation stage—S7, S10, and S12—are identical to those ranked highest in Section 3.1.2 by the proposed temperature‐aware sensor attribution method. This one‐to‐one match validates that the feature‐based ranking alone can accurately anticipate optimal sensor locations, even under the most challenging early‐stage damage scenario, without the need for exhaustive anomaly‐detection model training across all candidate positions. The combined evidence from both ranking and validation stages indicates that a configuration incorporating a root sensor (S12) together with two leading‐edge sensors (S7 and S10) provides comprehensive coverage of both global and local dynamic responses. This arrangement achieves robust detection capability for subtle early‐stage damage while minimizing the number of sensors required, thereby reducing instrumentation costs and data processing demands.
The present framework builds directly on the same full-scale Vestas V27 dataset examined by Panagiotopoulos et al., 39 who also investigated damage detection on this blade using a single vibration sensor. Their study employed three unsupervised statistical time-series models—Unsupervised Principal Component Analysis AutoRegressive (U-PCA-AR), Unsupervised Multiple-Model AutoRegressive (U-MM-AR), and Unsupervised Principal Component Analysis Multiple-Model AutoRegressive (U-PCA-MM-AR)—to analyze actuator-excited impulse responses collected during the same 104-days campaign. While their best method (U-PCA-MM-AR) achieved high accuracy for the 30 cm and 45 cm trailing-edge openings, its sensitivity to the smallest 15 cm defect was noticeably lower, and separate model calibrations were required for each damage scenario. Moreover, their analysis relied on controlled excitation rather than ambient operation and was limited to a narrow frequency range (150–850 Hz), which constrains direct applicability to continuous monitoring.
In contrast, the present study uses the same experimental dataset but analyses only the ambient-excitation segments, relying exclusively on naturally induced vibration responses. The proposed wavelet-based FDF generates physically interpretable descriptors spanning both global and local dynamic content, while the temperature-aware statistical attribution mitigates environmental influence. Without requiring damage labels or retraining, the method successfully detects the 15 cm early-stage trailing-edge opening—the most challenging case for previous studies—with near-perfect precision and recall. The optimal sensors identified (S7, S10, and S12) correspond to regions of high bending and torsional strain energy previously reported for the V27 blade. Overall, the proposed approach achieves benchmark-level accuracy comparable to the actuator-based statistical models of Panagiotopoulos et al., 39 yet operates under realistic ambient excitation, offering greater interpretability, scalability, and practicality for long-term in-service monitoring.
Conclusion
This study introduces a data-driven framework for optimal sensor placement in vibration-based SHM of operational WTBs, identifying the most suitable accelerometer location directly from healthy-state ambient vibration data. A wavelet-based FDF strategy was employed to extract discriminative features across both high- and low-frequency bands, effectively linking global modal and localized dynamic responses. Sensor performance was subsequently assessed using two complementary unsupervised attribution strategies: the Laplacian score, which evaluates structural sensitivity through local manifold preservation, and a temperature-aware statistical method, which quantifies environmental robustness by penalizing thermally correlated features.
For each approach, the top-ranked location was validated using autoencoder-based anomaly detection trained solely on healthy-state features. Applied to the full-scale Vestas V27 dataset, the Laplacian-based attribution identified leading-edge positions near mid-span as most sensitive to early-stage damage at 32 RPM (recall >91%, MCC = 0.86), though performance decreased at 43 RPM. The temperature-aware attribution produced more stable rankings across speeds, with recall of 87.6% at 32 RPM and 66.3% at 43 RPM. Reducing inputs to the top eight temperature-stable features yielded near-perfect accuracy, with MCC = 0.9959 for S10 and S12 at 32 RPM and MCC = 0.9968 for S7 at 43 RPM.
Final validation, conducted by training an AE for each sensor and testing exclusively on the most challenging early-stage damage scenario (15 cm trailing-edge opening), confirmed that the top-performing sensors—S7, S10, and S12—were identical to those predicted by the temperature-aware attribution. The root region (S12) provided the most consistent robustness across operating speeds, while leading-edge sensors (S7 and S10) delivered peak sensitivity at higher RPM. These findings verify that the proposed temperature-aware attribution method can accurately predict optimal sensor locations from healthy-state data alone, eliminating the need for exhaustive model retraining. The developed single-sensor placement strategy, centered on the root with targeted leading-edge coverage, enables reliable early-stage damage detection using minimal instrumentation. This represents a scalable, interpretable, and cost-efficient solution for the continuous SHM of wind turbine blades operating under realistic environmental and operational variability.
Limitations, simplifications, and assumptions
The proposed framework is developed under several simplifying assumptions. First, the analysis is based on data from a single full-scale Vestas V27 wind turbine blade; although this dataset provides comprehensive environmental and operational variability, further validation on other turbine models and geometries is required to confirm general applicability. Second, the study assumes ambient excitation and neglects strongly nonlinear aerodynamic phenomena that may occur under extreme wind or pitch transients. Third, the wavelet-based decomposition assumes quasi-stationarity within each one-second window, which may overlook ultrafast nonlinear coupling between bending and torsion. Moreover, the temperature-aware sensor attribution considers temperature as the dominant environmental factor, while other variables such as humidity or wind direction were not explicitly modeled. Finally, the shallow autoencoder architecture was deliberately chosen for interpretability and computational efficiency; deeper or physics-informed networks could further enhance robustness and transferability in future implementations.
Footnotes
Acknowledgment
The authors gratefully acknowledge Dr. Dmitri Tcherniak for his support and for providing the data used in this study.
Funding
The authors disclosed receipt of the following financial support for the research, authorship, and/or publication of this article: This work has been funded by the Sustainable Energy Authority of Ireland under the SEAI Research, Development & Demonstration Funding Programme 2021, Grant number 21/RDD/601. This publication has emanated from research conducted with the financial support of Research Ireland under Grant number 20/FFP-P/8706. Vikram Pakrashi would like to acknowledge Research Ireland NexSys 21/SPP/3756, MaREI RC2302_2, and Sustainable Energy Authority of Ireland Remotewind RDD/613.
Declaration of conflicting interests
The authors declared no potential conflicts of interest with respect to the research, authorship, and/or publication of this article.