
Abstract
This study focuses on formulating and analyzing the classical fractional order S E I R (susceptible-exposed-infected-recovered) model by incorporating the vaccination compartment with Holling type-II incidence rate to describe the spread of infectious diseases, by using Caputo fractional derivative to capture memory-dependent processes. The mathematical foundation of the proposed S V E I R model has been laid by using some fundamental properties of the operator, along with essential lemmas and validated by existence and boundedness. To calculate the secondary infections, we calculate the reproduction number by using the next generation matrix method and disease persistence and eradication are also given by equilibrium analysis. The sensitivity analysis is performed to identify influential parameters for the reproduction number by using normalized sensitivity index method. The novelty of this work lies in integrating a fractional-order epidemic model with a detailed optimal control framework. Applying Pontryagin’s Maximum Principle to vaccination and treatment interventions, the study identifies optimal strategies that minimize both infection burden and implementation costs. Additionally, a cost-effectiveness assessment is carried out to compare the interventions based on their epidemiological impact and resource use.
Introduction
Infectious diseases have a profound effect on both society and the economy, often leading to widespread challenges. On a social level, they put immense pressure on healthcare systems, disrupt daily life and contribute to mental health issues due to fear, isolation, and loss. Education is also affected, as school closures hinder learning, while stigma against infected individuals creates social divisions. Economically, these diseases lower productivity, increase healthcare costs, and interrupt global trade and travel. Governments must allocate significant resources to manage outbreaks, while lower-income populations face greater financial hardships. Diseases such as COVID-19, tuberculosis, HIV/AIDS, malaria, influenza, and Ebola have historically caused major disruptions, influencing public health policies and economic stability worldwide. The study of infectious disease transmission patterns and the assessment of possible management strategies need the use of mathematical models. Mathematical models are essential for studying infectious disease transmission patterns and the assessment of possible management strategies. Traditional compartmental models, formulated using integer-order differential equations, have been extensively applied to describe disease spread. Nevertheless, these models frequently fail to take into consideration the long-term relationships and memory effects of biological systems. In recent years, fractional-order differential equations (FODEs) have gained prominence in disease modeling due to their ability to incorporate memory and hereditary properties. This approach offers a more flexible and accurate framework for capturing the complex nature of disease progression, especially when historical states influence current infection dynamics. The efficacy of this approach has been demonstrated in numerous recent studies, including models with fractal-fractional operators 1 and those incorporating time delays and media coverage. 2 This research focuses on formulating and analyzing a fractional-order compartmental model for infectious diseases, investigating its qualitative properties and numerical solutions to refine our grasp of pathogen dissemination and intervention techniques.
Mathematical modeling has been used by many researchers as a potent tool to comprehend the transmission of infectious diseases and to propose efficient vaccination and treatment plans.3,4 Vaccination has consistently served as a fundamental approach in combating infectious diseases. Immunization programs are specifically designed to prevent and control viral illnesses, including poliomyelitis, influenza, pertussis, rabies, measles, encephalitis B, and hepatitis B. Many developing nations regularly provide these immunizations. According to the report issued by the WHO in 2005, the global eradication of smallpox—the last naturally occurring case was documented in 1977—was one of the most noteworthy achievements in public health achieved by vaccination. 5
The implementation of vaccination initiatives is critical in managing outbreaks and protecting community health. However, a key determinant of vaccine coverage is individual behavior. Since many immunization efforts are voluntary, personal decisions about vaccination often depend on factors such as public awareness, perceived severity of the disease and the community’s existing immunity level. Vardavas et al. 6 discussed two primary approaches for modeling human behavior and decision-making, underscoring the need for carefully structured and adequately funded Immunization campaigns to reach community-wide immunity. Although several studies7–9 have underscored the significance of widespread vaccination in epidemic control, detailed evaluations of their viability are still scarce.
Vaccines stimulate the immune system by presenting a harmless form of the antigen, prompting B cells to generate antibodies that specifically target the pathogen. Importantly, the immune system retains this response, providing long-term protection, often lasting years, decades, or a lifetime against future infections. Many immunization protocols require several doses over time. As an illustration, in a hepatitis B vaccination research, subjects were given three doses of the recombinant vaccine at 0, 1, and 6 months 91.2% of those examined 11 years later still showed protective levels, and 99.8% generated anti-HBs antibodies after the last treatment. 10
Researchers around the globe utilize various incidence functions based on disease characteristics. Majee et al. 11 formulated a fractional order SIR model employing a saturated incidence rate βSI/1 + aS + bI to capture both infection spread and treatment dynamics. Lu et al. 12 examined the effect of media influence on epidemic progression using an SEI model that integrates media awareness. The infection function is defined as h(S, I) = βSI/1 + mI2, which incorporates a nonlinear media effect on transmission. Similarly, Barman et al. 13 introduced a fractional-order SEIR model featuring a saturated media influence. Their study examined the role of two critical control variables: media-induced awareness and treatment interventions. The media effect was modeled as a saturation term PSM/1 + qSM. These investigations emphasize that rising awareness due to media exposure encourages behavioral changes, such as increased social distancing. More recent studies, such as those by Hu et al.,14,2 have further quantified the impact of media coverage on transmission dynamics within fractional-order COVID-19 models, demonstrating its critical role in shaping epidemic outcomes. Platforms like news media, online networks and social media play a pivotal role in spreading information, which helps individuals adopt preventive practices. Consequently, informed individuals adjust their interactions to minimize exposure to susceptible populations. To capture these dynamics, it is essential to revise the disease incidence functions to account for behaviorally driven modifications in transmission patterns.
Dano et al. 15 developed a SIR model based on fractional calculus, incorporating a saturated incidence rate expressed as β α S(t)I(t)/1 + γ α I(t). They applied two control strategies—vaccination and treatment with the aim of reducing disease prevalence across different levels of viral transmissibility. Furthermore, Kumar et al. 16 formulated an epidemic model that integrates both immunization and treatment constraints to determine optimal control strategies. Their study evaluated the practicality and cost-effectiveness of such control techniques, as well as the impact of the fundamental reproduction number R0 on intervention outcomes.
This article is structured in the following manner. While recent approaches have also explored hybrid methods like Dynamics Informed Neural Networks,17–19 our work focuses on a classical analytical and optimal control framework to derive clear public health insights. In “Review of Basic Concepts”, we lay the groundwork by introducing essential definitions and key lemmas related to fractional calculus, which form the theoretical basis for the analysis that follows. “Mathematical Model Formulation” presents the construction of a fractional order compartmental framework to capture the behavior of the infectious disease under investigation. In “Existence of Positive and Bounded solutions”, we investigate the basic qualitative characteristics of the established model, addressing aspects such as the non-negativity of solutions and the bounded nature of the system. These characteristics are essential to confirm that the model retains both biological relevance and mathematical validity.
Moving forward, “Equilibrium Analysis and Reproduction Number” is dedicated to analyzing the presence of equilibrium states and deriving the basic reproduction number, which is essential to comprehending how the disease might spread. In “Analysis of System’s Stability”, we carry out a detailed analysis of the stability of the biologically feasible equilibrium points. The next section “Sensitivity Analysis” explores the sensitivity of the basic reproduction number to different parameters, highlighting those that most significantly affect the transmission of the disease and offering valuable insights for targeted interventions. Also the section “Optimal Control Analysis” is dedicated to formulating the optimal control problem related to the model and employs Pontryagin’s Maximum Principle to derive both the necessary and adequate conditions for optimal performance. In “Cost Effectiveness Analysis”, cost-efficiency analysis of the intervention strategies is conducted to assess their affordability and effectiveness in improving public health outcomes.“Numerical Simulation” includes numerical simulations performed in MATLAB to support and validate our theoretical results, showcasing the behavior of the model under various scenarios. Lastly, in Conclusion, we discusses their relevance and provides final thoughts to conclude the study.
Review of basic concepts
Here, we present crucial terms and principles from fractional calculus that underpin the investigation.
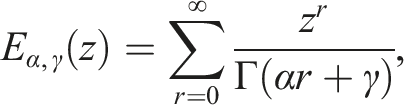
Consider a function
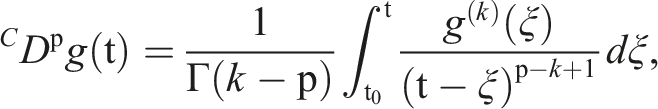
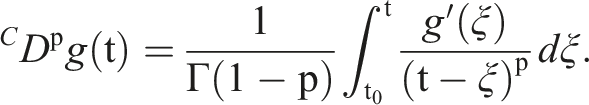
Specifically, when p ∈ (0, 1), the Caputo derivative is given as
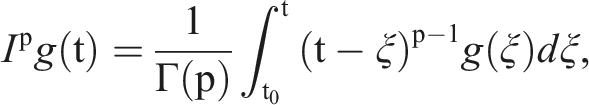
Consider a real valued continuous function g(t) defined on [t0, ∞), the fractional integral of order p > 0 is given as follows
21
For
22
Suppose that h ∈ C1[a, b] and 0 < p < 1 (1) For a ≤ t ≤ b, (2) For a ≤ t ≤ b,
20
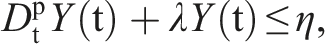
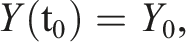
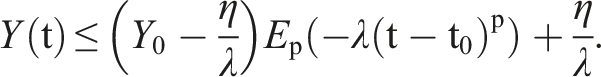
Let Y: [t0, ∞) be a real valued continuous function and satisfying that
Mathematical model formulation
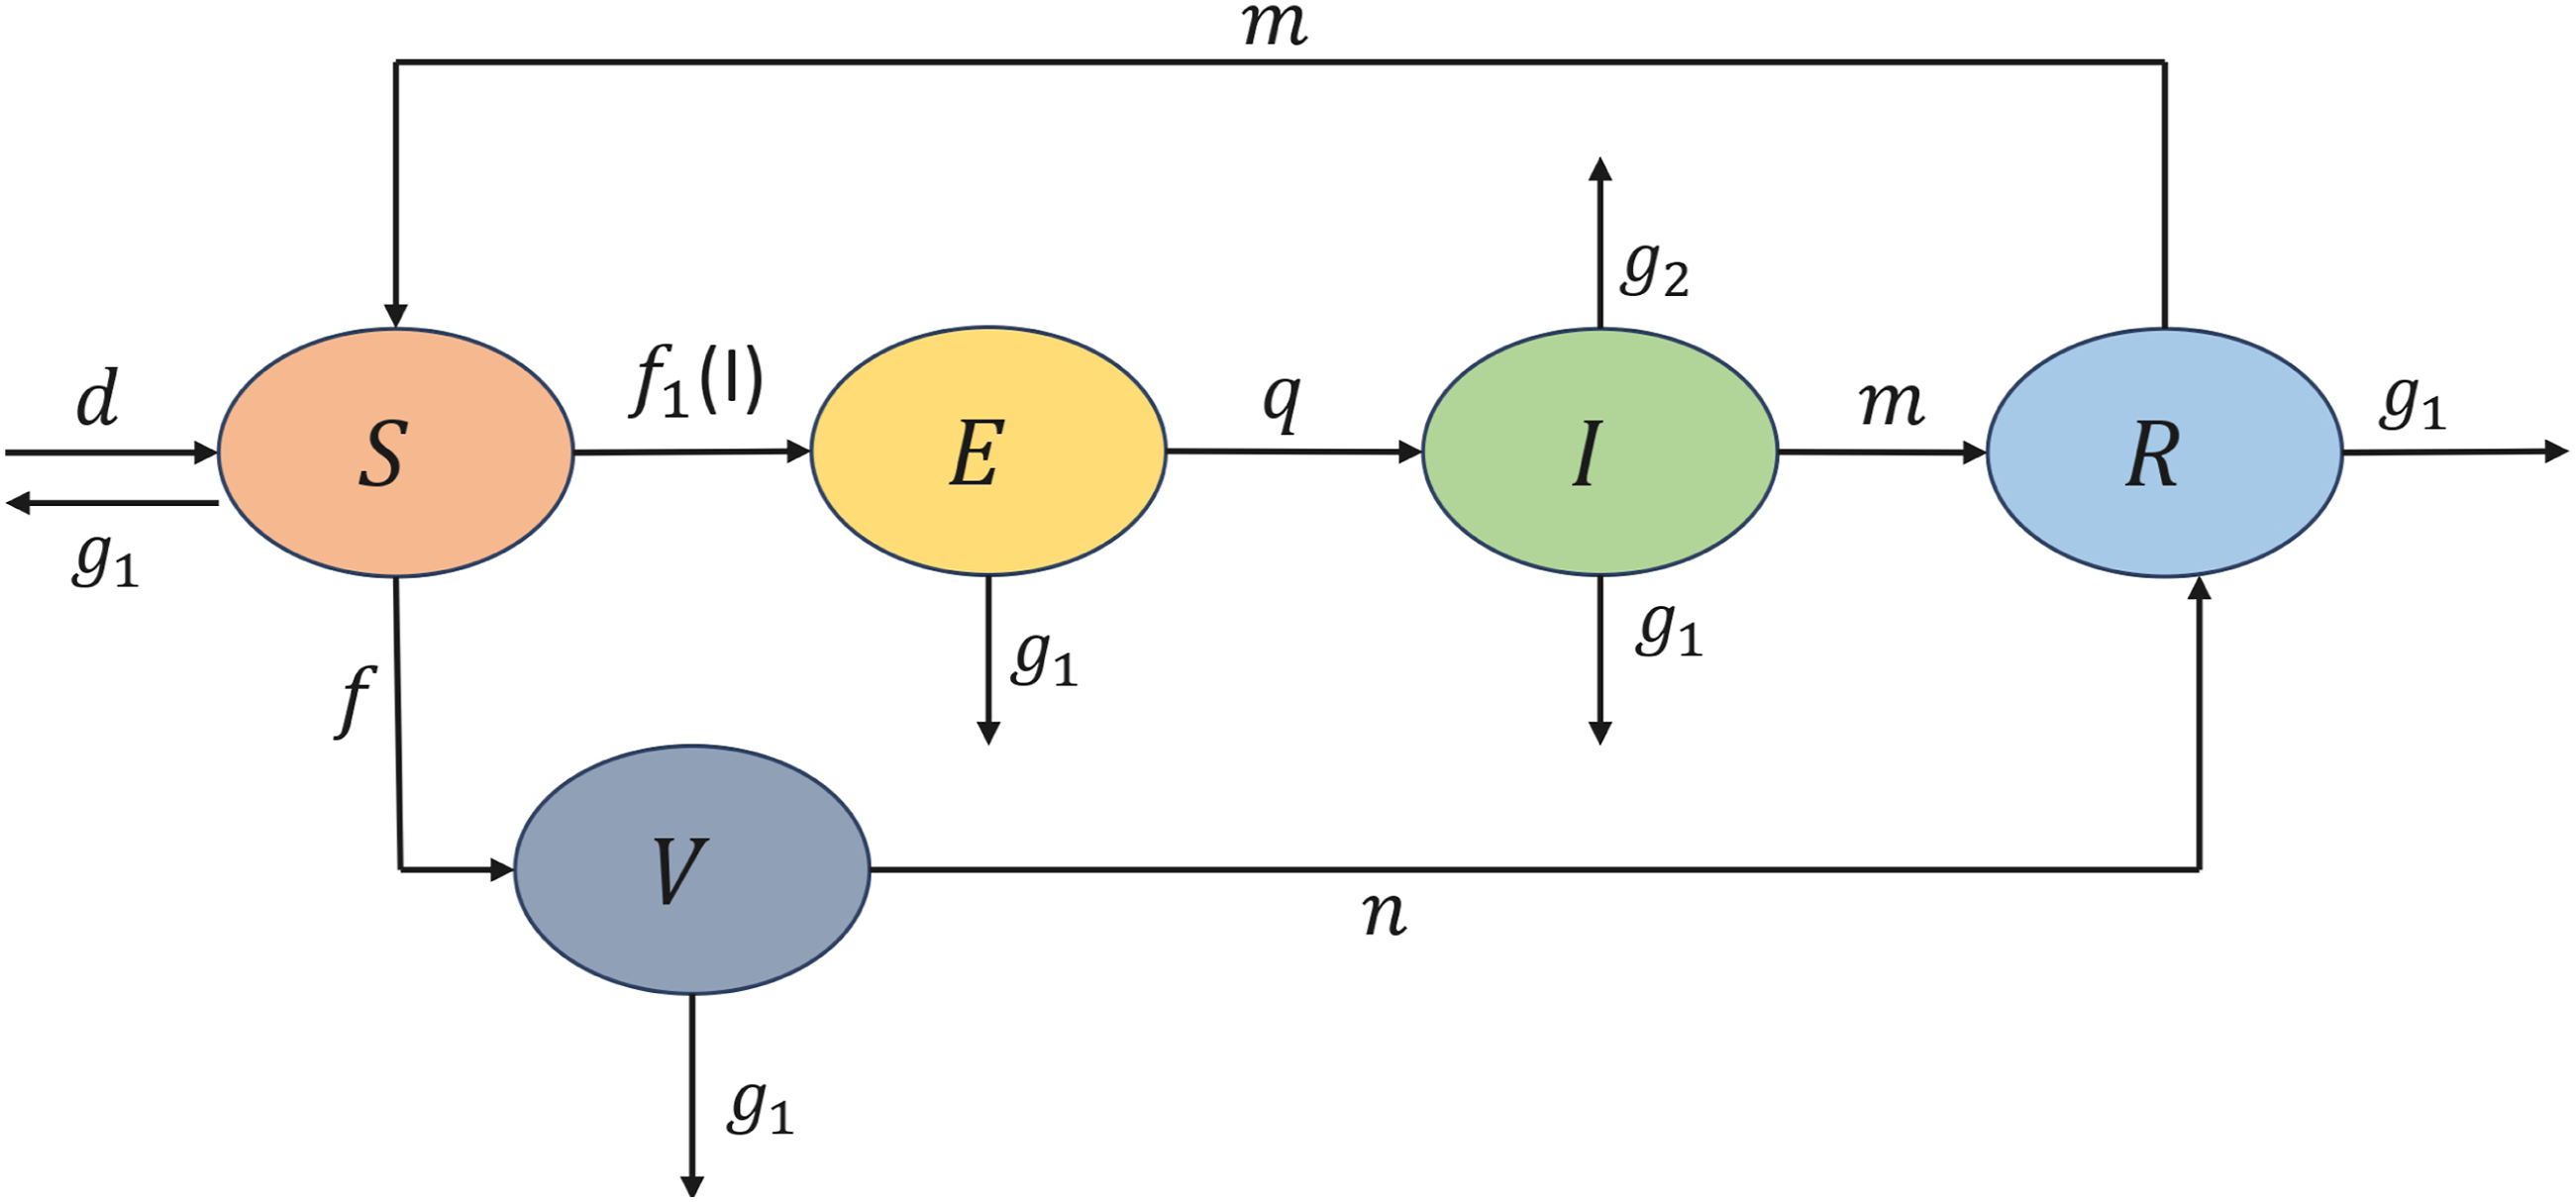
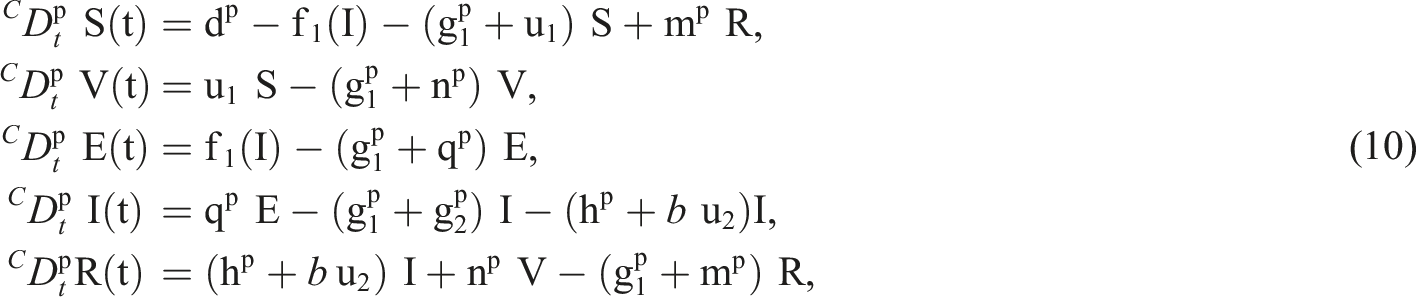
We formulate a fractional order mathematical model comprising five distinct classes to simulate the progression and regulation of an infectious disease. These compartments—Susceptible S(t), Vaccinated V(t), Exposed E(t), Infected I(t), and Recovered R(t). The compartment of Susceptible population S(t) who have not yet been infected but are at risk of contracting it. Individuals who have been immunized through vaccination and are considered protected from infection fall into the compartment V(t). The compartment of exposed individuals E(t) comprises those who have been infected but are in the latent phase and not yet infectious. The infected compartment I(t) represents symptomatic individuals who are disseminating the disease to others. Lastly, the recovered class R(t) represents the individuals who have overcome the infection and are assumed to have developed some level of immunity.
The sum of individuals in all these compartments gives the entire population, denoted by N(t) as follows

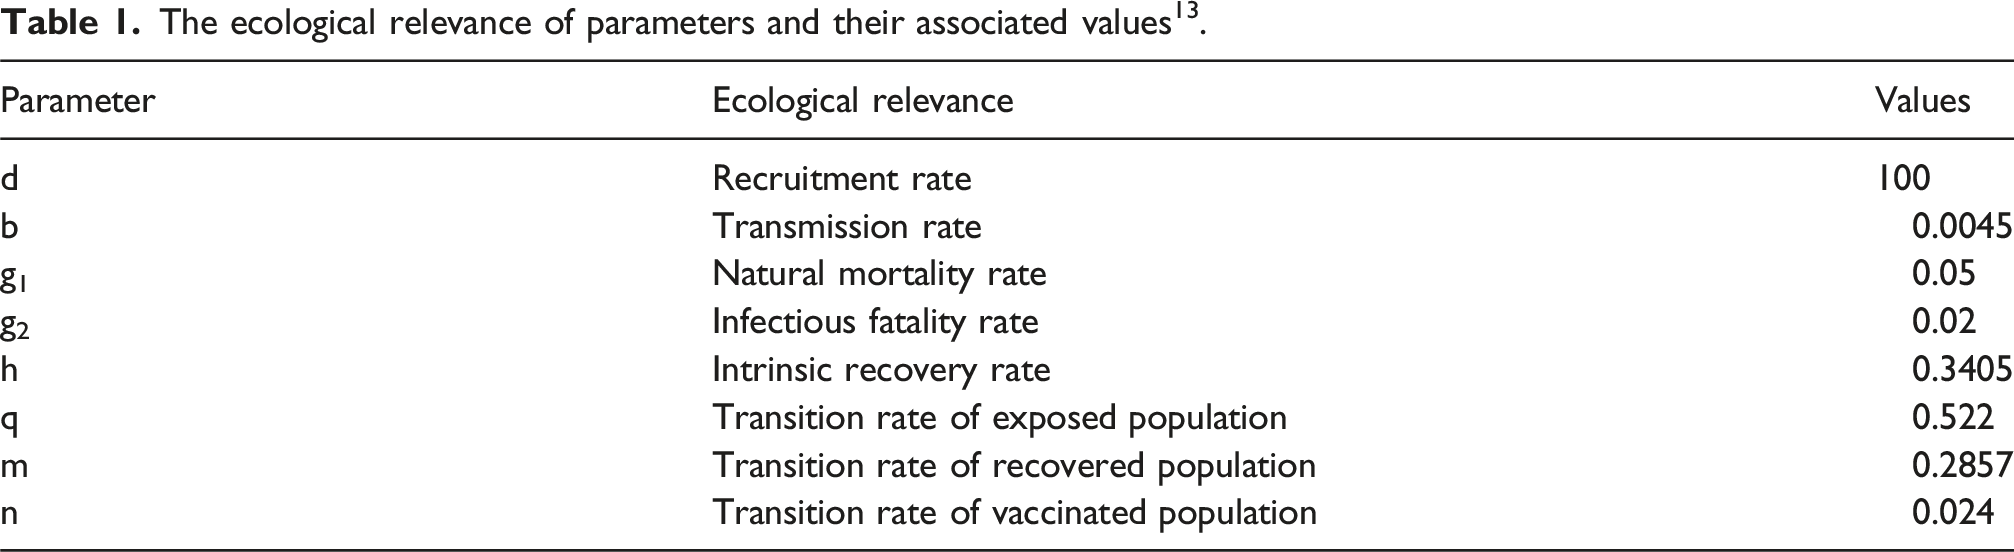
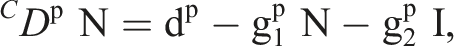
To enhance the comprehension of the disease’s progression within the community, we outline some key assumptions and parameters used in constructing the model: New individuals are added to the susceptible group S(t) at a constant rate of recruitment d. Every individual across all compartments is subject to a natural death rate g1. A fraction of the susceptible individuals undergoes vaccination at a rate f and they shift to the recovered class R(t) at a rate n. The transmission of the disease is governed by a Holling type II saturated incidence rate. The saturated incidence rate can capture the effect of reduced contact due to awareness, indirectly relating it to the media effects modeled explicitly in Hu et al.
14
and Barman et al.
13
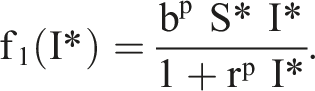
The exposure rate for susceptible individuals is given by f1(I) = b
p
S(t) I(t)/(1 + r
p
I(t)), where b represents the interaction rate between susceptible and infected persons and r accounts for the inhibition effects arising from awareness or behavioral changes that limit disease transmission. Individuals in the exposed class E(t) become infected at a progression rate q and the rate of mortality due to the disease among infected individuals is g2. A fraction of infected persons may experience natural recovery at a rate h. However, due to waning immunity, a segment of the recovered individuals lose immunity and transition back to the susceptible class at the rate m.
Based on the above assumptions and mechanisms, we construct a system of nonlinear fractional order differential equations to describe the temporal evolution of each compartment and to investigate the disease’s spread and potential control strategies
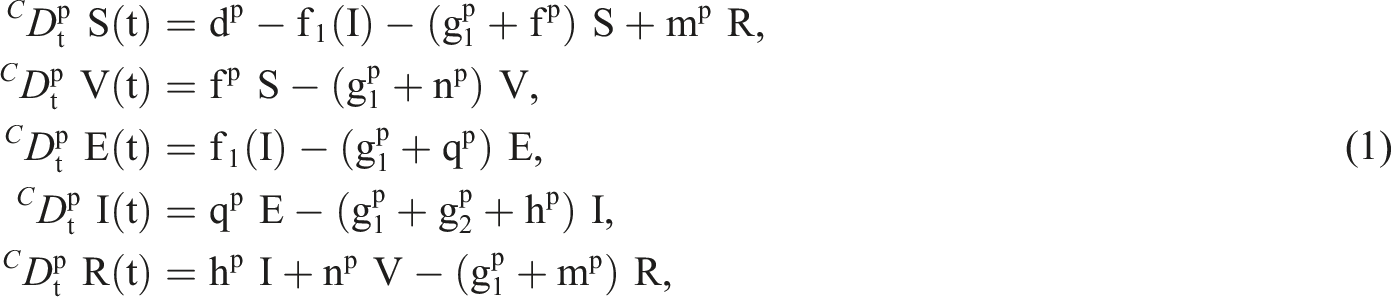

The schematic of the suggested model appears in Figure 1, while Table 1 outlines the biological explanations and values of the associated parameters. Flowchart of SVEIR model. The ecological relevance of parameters and their associated values
13
.
In the following section, we examine the properties of the non-negativity and boundedness of the model (1).
Existence of positive and bounded solutions
In infectious disease modeling, it is essential to ensure that solutions remain both positive and bounded to maintain biological relevance. These conditions guarantee that population variables stay within realistic and meaningful limits.
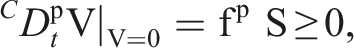
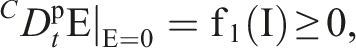
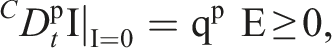
If S(0) > 0, V(0) ≥ 0, E(0) ≥ 0, I(0) ≥ 0, R(0) ≥ 0, then the solutions of model (1) (S(t), V(t), E(t), I(t), R(t)) are positive for p ∈ (0, 1], ∀t ≥ 0.
We have Since these equations are positive for all t ≥ 0. Hence, using Lemma 2.1, S(t), V(t), E(t), I(t), R(t) ≥ 0, ∀t ≥ 0. □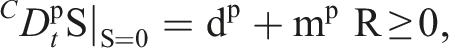

The solutions corresponding to system (1) are uniformly bounded for every t ≥ 0.
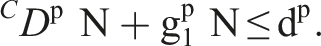
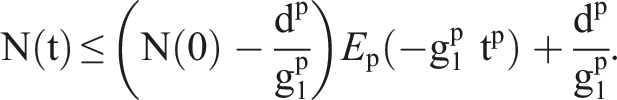
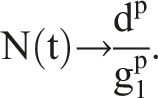
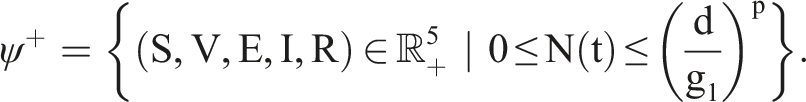
We have From system (1), this simplifies to Applying Lemma 2.2, we obtain Taking t → ∞ and conclude that Furthermore, this is the system’s feasible region As a result, the system (1) has bounded solutions.
In the following section, we analyze the system by locating its equilibrium states and evaluating the associated basic reproduction number. This analysis is essential for understanding the disease dynamics and threshold conditions for its spread.
Equilibrium analysis and reproduction number
This section focuses on identifying the steady states and calculating the basic reproduction number, which together help in understanding the system’s behavior over time. In the context of infectious disease models, they help assess whether the infection will vanish over time or remain within the population. A disease-free equilibrium represents a stable situation with no active cases, while an endemic steady state signifies the continual presence and propagation of the infection within the community.
Disease-free equilibrium (DFE)
For the disease-free equilibrium (DFE), we take E = 0, I = 0 in model (1) and obtain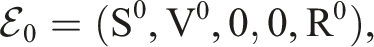
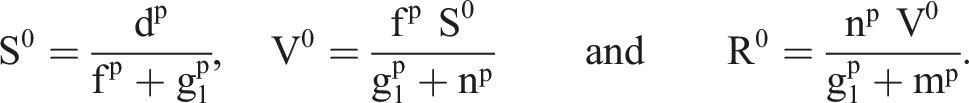
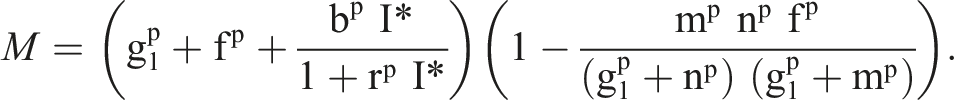
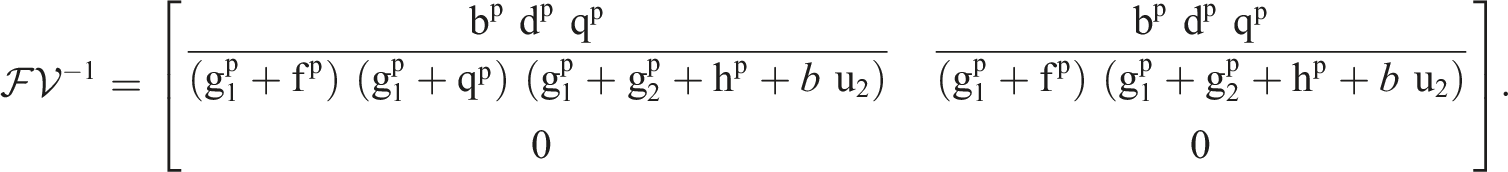
Fundamental reproduction number
The fundamental reproduction number, represented by
According to the model (1) equations, the matrices 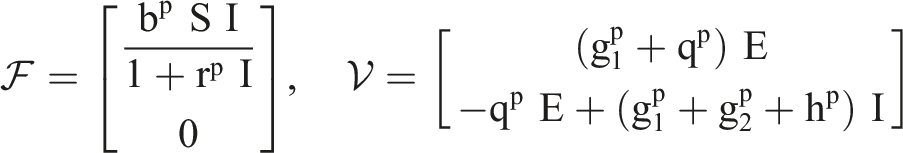
At the DFE point 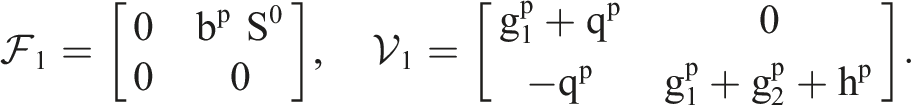
Next, we find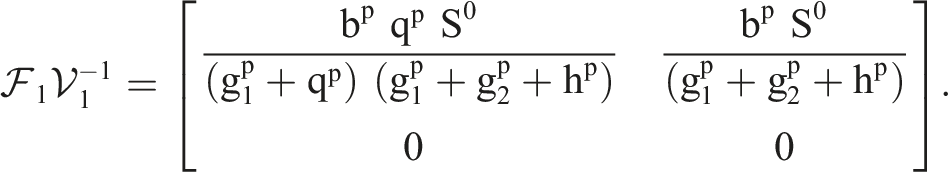
Consequently, 
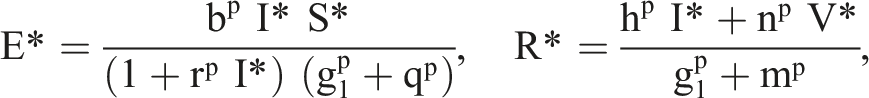
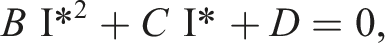
Endemic equilibrium (EE) point
To ascertain the EE point of the system (1) 


On solving the above equations, we obtain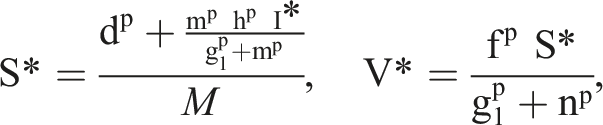


Analysis of System’s stability
The current section focuses on analyzing the stability behavior of model (1) around the disease-free and endemic equilibria.
When
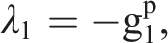
The Jacobian matrix J, corresponding to model (1) at the disease-free equilibrium Clearly, eigenvalues λ1, λ3, and λ5 are always negative. Further, λ2 is negative if 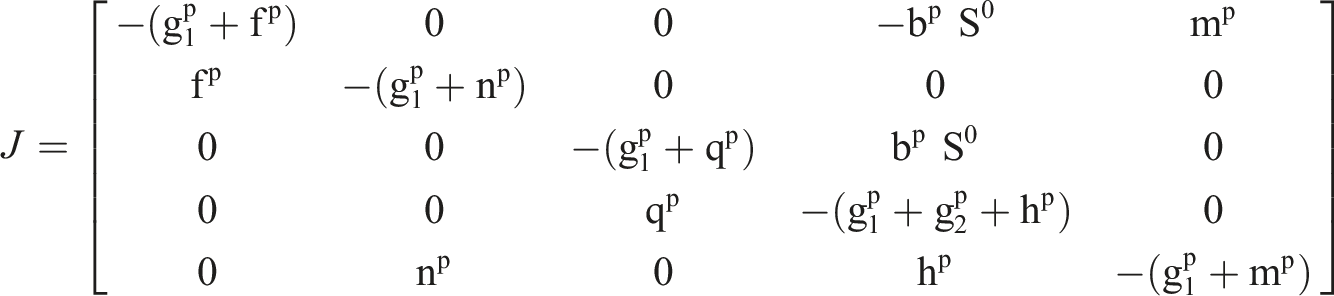


The endemic equilibrium point
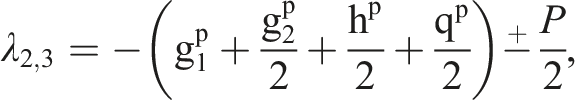
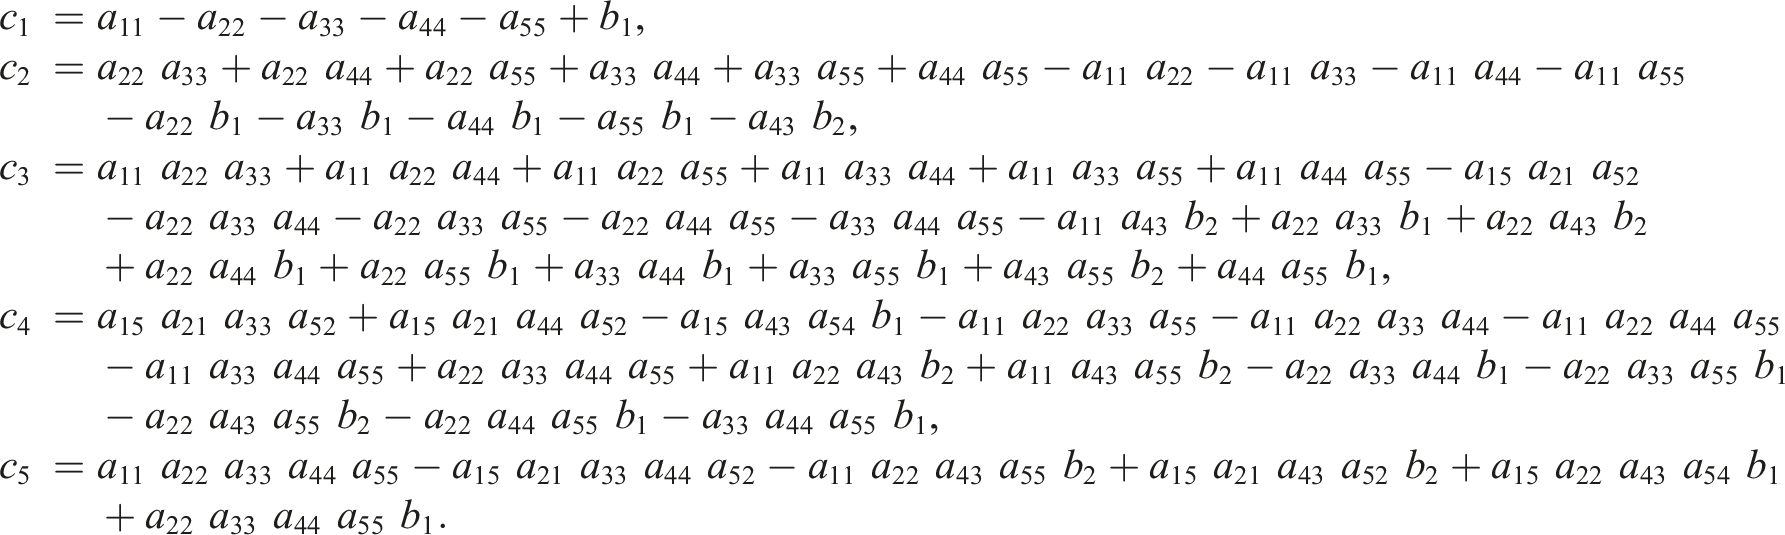
At the EE point The characteristic polynomial of matrix J* is given by Now, according to the Routh–Hurwitz stability criterion,
23
the roots of the characteristic equation have a negative real part if Hence, the endemic equilibrium will be locally asymptotically stable.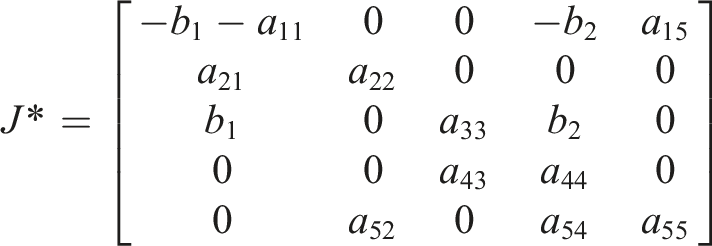


The next section illustrates how the basic reproduction number responds to variations in the model’s parameters through a sensitivity investigation. This aids in determining which parameters have a major effect on the dynamics of the transmission.
Sensitivity analysis
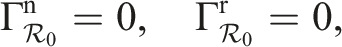
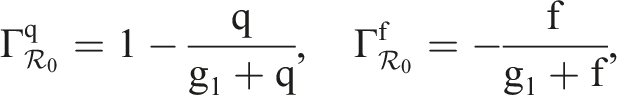
This section examines the sensitivity of the basic reproduction number 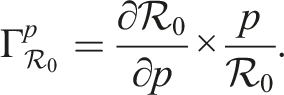
If the sensitivity index is positive, then an increase in parameter p leads to a rise in 
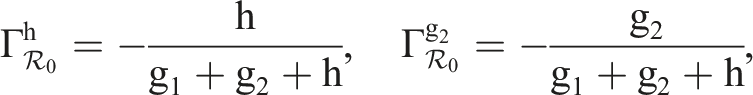

Sensitivity analysis of model parameters for p = 1.
On the other hand, parameters with negative sensitivity indices, namely g1, g2, f, and h exert an inverse effect on
These relationships are visually summarized in Figure 2, which illustrates how each parameter impacts the basic reproduction number Forward sensitivity indices for reproduction number 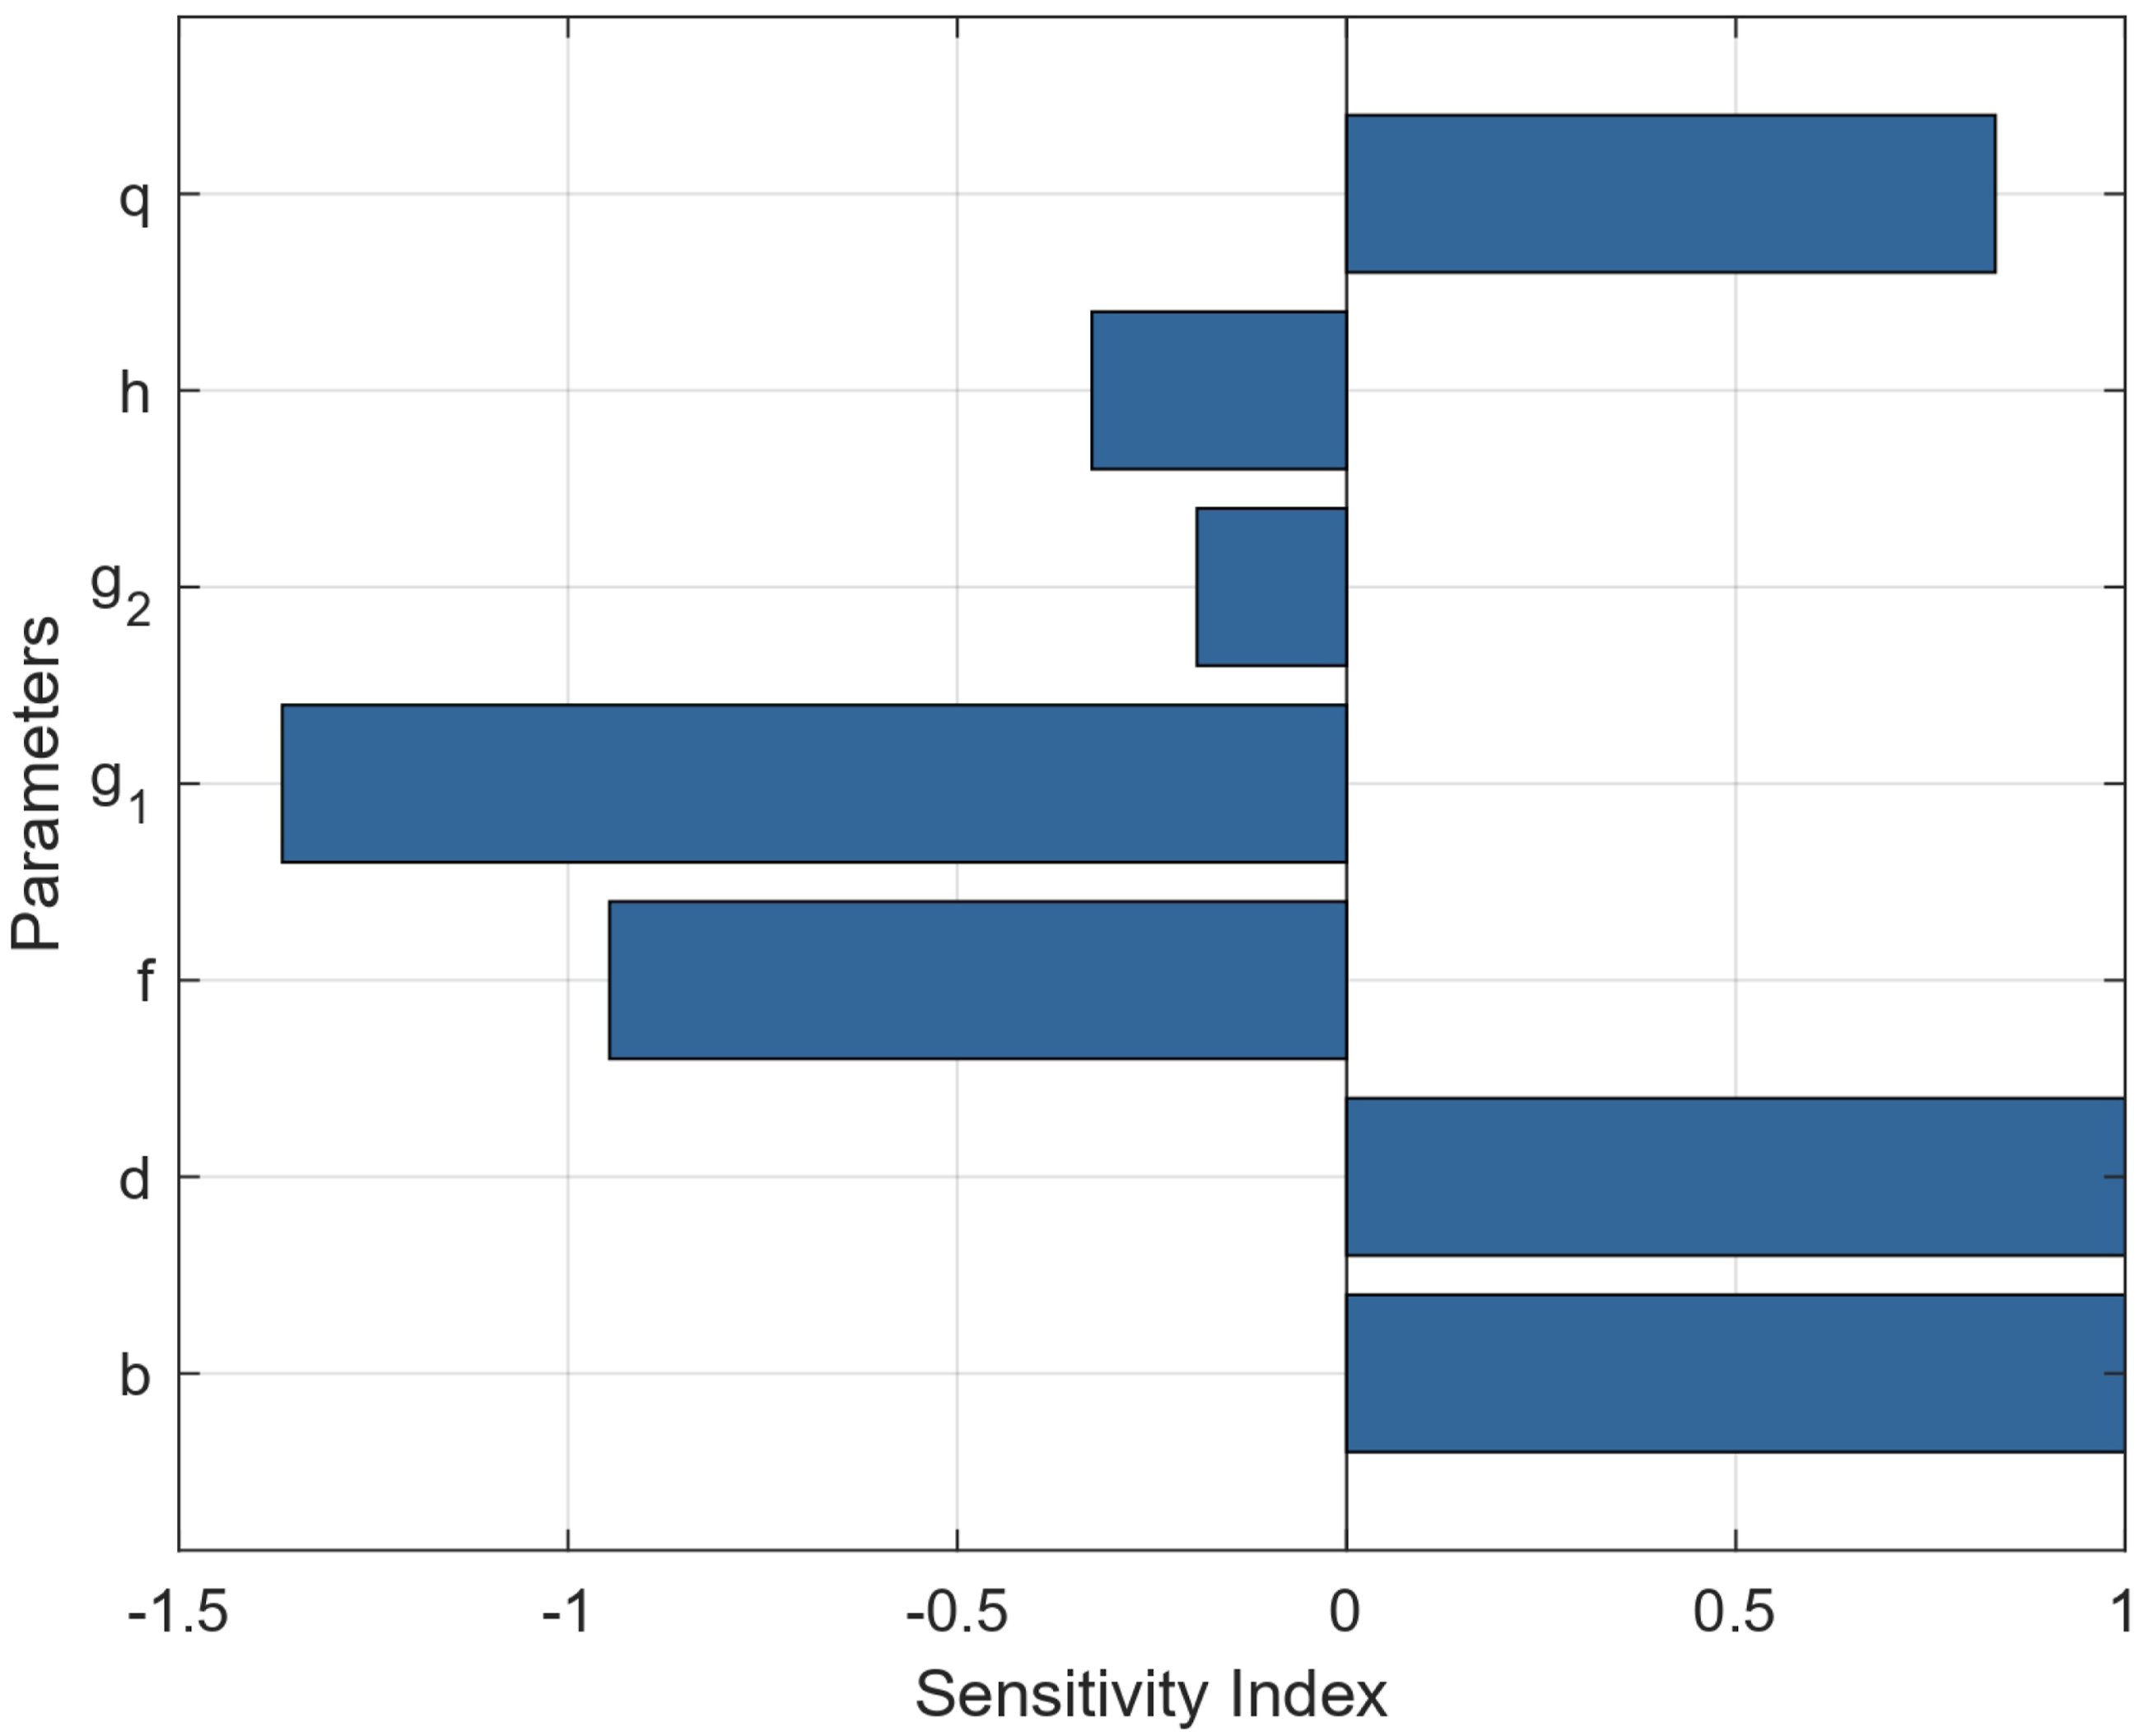
Optimal control analysis
The main purpose of analyzing the patterns of infection spread and disease progression is to develop effective strategies for controlling disease spread and ultimately eradicating the infection. To accomplish this, we use Pontryagin’s Maximum Principle (PMP), a powerful mathematical tool in optimal control theory. PMP helps determine the optimal control functions that minimize both disease prevalence and intervention costs.
In this analysis, we introduce two time-dependent variables, namely, vaccine effort u1(t) and treatment effort u2(t). These controls are implemented under the assumption that intervention measures should be maximized when necessary to curb disease transmission while ensuring that the associated costs remain minimal.
Our objective is to strike a balance between two competing factors: (1) Decreasing the number of individuals infected within the community. (2) Limiting monetary expenses and societal burdens associated with vaccination and treatment interventions.
Calculation of total cost
Here, we want to evaluate the total expenditure associated with applying control strategies, which needs to be kept low to maintain efficient disease management.
Cost associated with the disease burden
The economic impact of the infection, including loss of productivity and increased healthcare needs, is represented as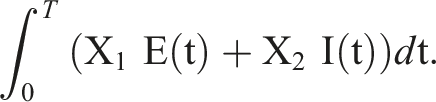
Cost of vaccination effort
The expense incurred in implementing vaccination programs, including vaccine procurement, distribution, and administration, is given by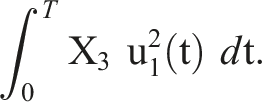
Cost of treatment effort
Providing treatment to infected individuals involves hospitalization, medical care, and pharmaceutical expenses. The total cost associated with treatment interventions is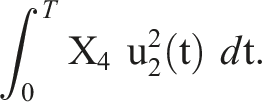
To formulate an effective control strategy, we define the objective functional as detailed below

The optimal control problem aims to reduce the disease’s effects while considering the associated costs of vaccination and treatment. The objective functional for this optimal control problem is provided below
Here, the parameters X
i
(i = 1, 2, 3, 4) are positive weights assigned to appropriately scale and prioritize the individual components of the objective function. In infectious disease control,15,24 quadratic costs are used for the control measures, where 

The impact of implementing control functions u1 and u2 on the reproduction number
This section focuses on evaluating how the control functions u1 and u2 affect the basic reproduction number, represented by Impact of optimal control measures u1 and u2 on basic reproduction number R0c at (a) p = 0.8, (b) p = 0.9 and (c) p = 1.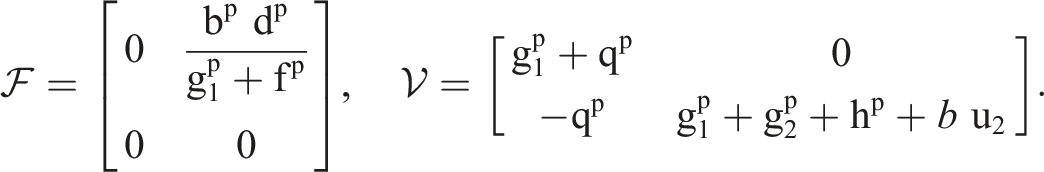


Optimal control problem
Here, we construct the necessary conditions for optimal control by utilizing Pontryagin’s Maximum Principle
26
to the Hamiltonian function. We define u1(t) = u1 and u2(t) = u2 for simplicity’s sake. The Hamiltonian function is defined as follows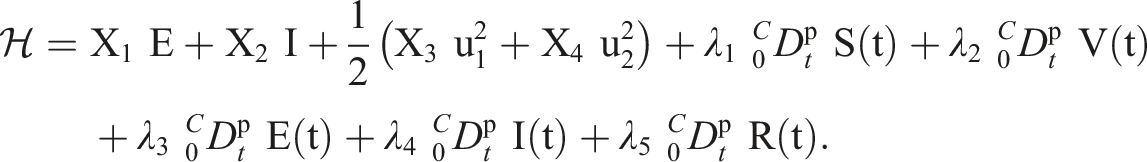
Here, λ i (i = 1, 2, 3, 4, 5) represent the adjoint variables corresponding to the state variables of system (10).
Now, from (10) we obtain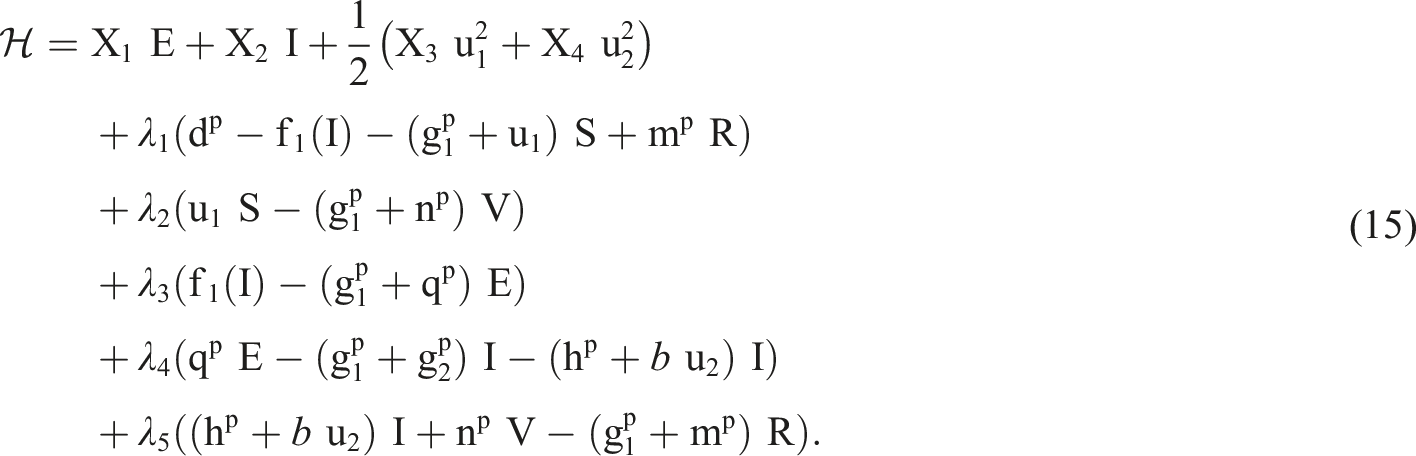
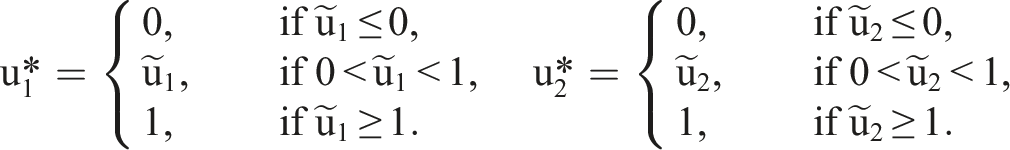
Assume that (S*, V*, E*, I*, R*) represents the steady-state solution of system (10) under the optimal control function 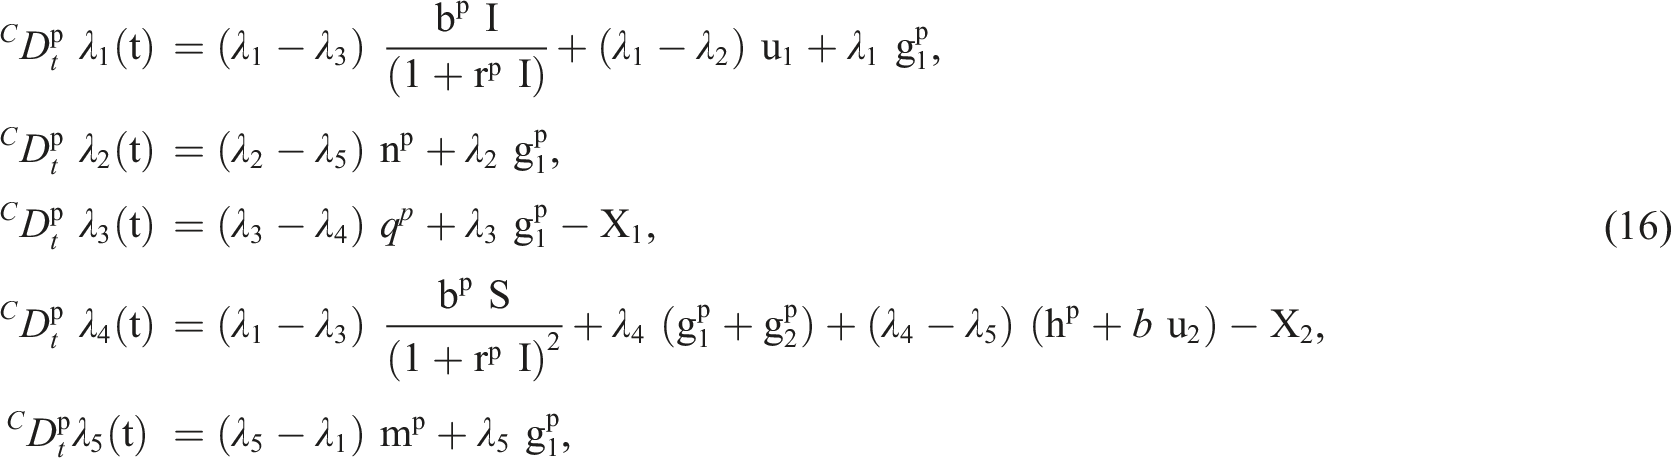
Assume that 
The optimal control pair 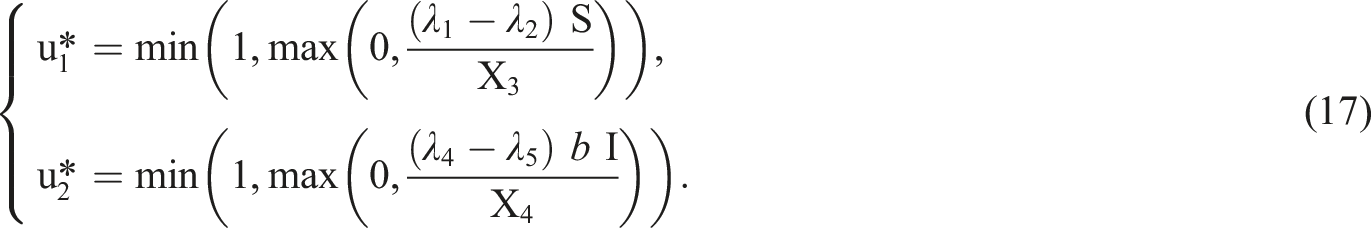
Now using the transversality conditions λ
i
(T) = 0, for i = 1, 2, 3, 4, 5 and the optimality conditions, we have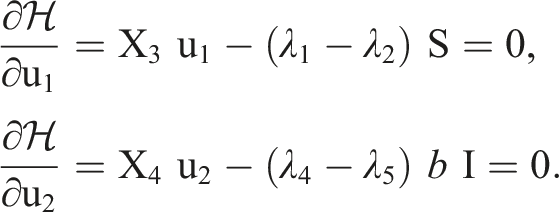

Optimal problem model
The optimal problem model corresponding to the minimum objective function 

The corresponding adjoint model is given by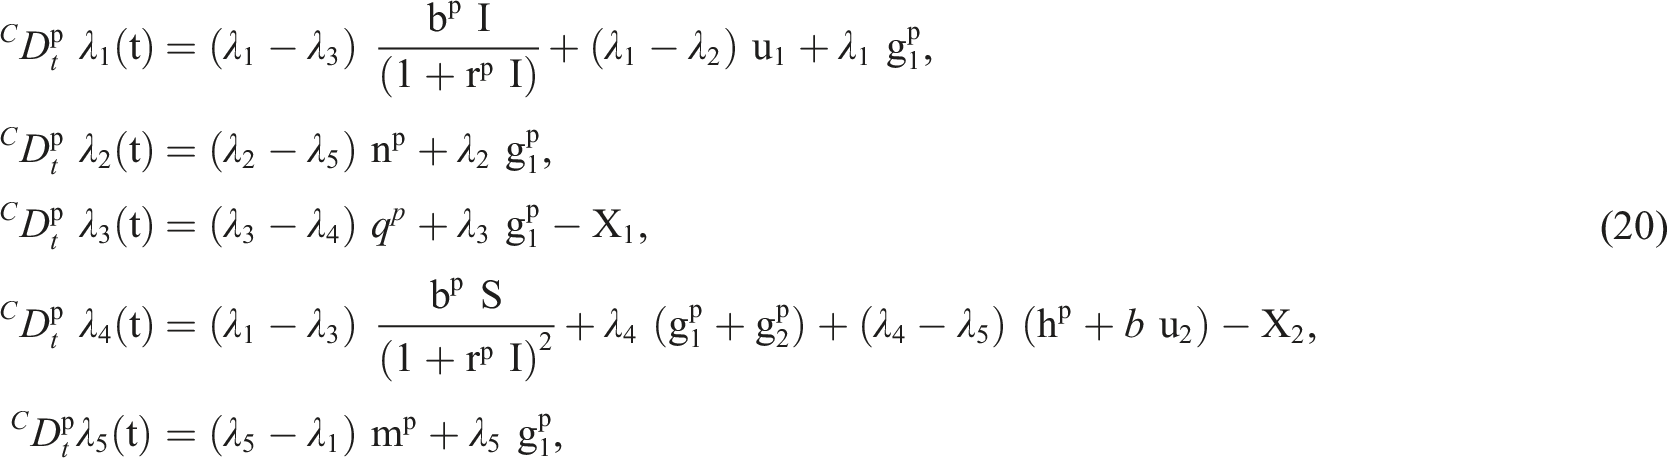
Cost effectiveness analysis
Monitoring and managing the outbreak and diffusion of transmissible diseases within a population demands considerable financial and logistical resources. Hence, identifying and implementing cost-efficient strategies for disease prevention is of paramount importance. Additionally, factors such as lifestyle and public awareness significantly influence the transmission dynamics of an infection. Consequently, countries might implement different approaches to efficiently handle and mitigate the disease. Drawing from the outcomes of the optimal control simulations, it becomes essential to identify and choose the most economically viable intervention strategy from among the available combinations.
To assess cost-effectiveness, two approaches are employed:
Average cost-effectiveness ratio (ACER)
ACER measures how cost-efficient an intervention is by comparing the overall expenses associated with the intervention relative to the number of infections it prevents. It is given by below formula
The overall cost required for carrying out a specific intervention strategy is given by
Incremental cost-effectiveness ratio (ICER)
ICER is a metric used to evaluate the cost-effectiveness of two competing intervention strategies by comparing their differences in cost and health outcomes. For two strategies, A and B, the ICER is expressed as
The change in the number of infections avoided by each technique is captured by the denominator, while the numerator shows the difference in disease control costs between the two interventions. To demonstrate the effects of various optimal control strategies on infectious disease management, we analyzed three distinct combinations of the control variables u1 and u2: • • •

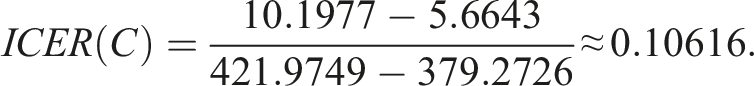
The total infections prevented, the overall cost of the control strategies and the respective ACER and ICER values.
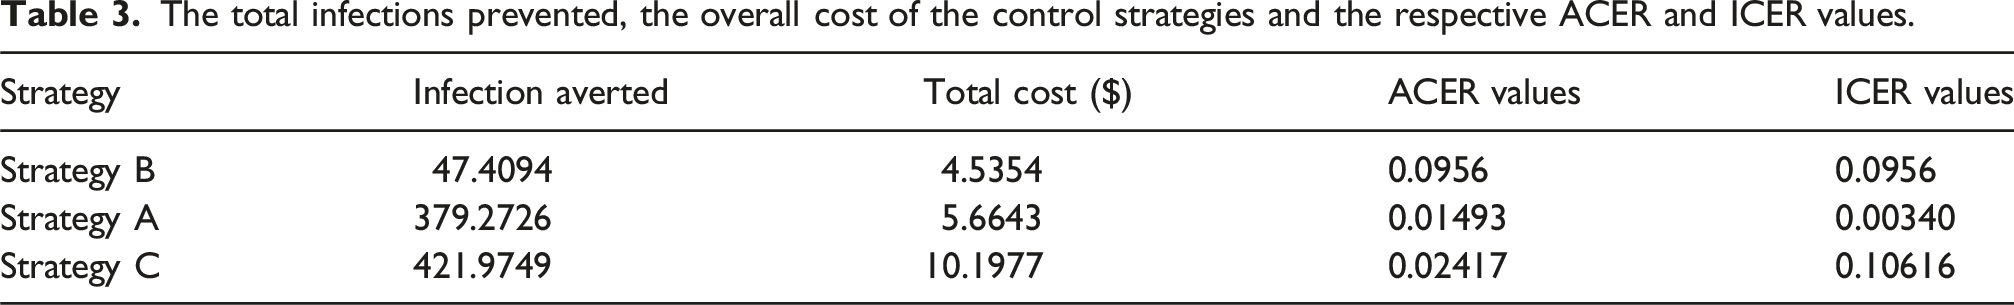
While Strategy C prevents the highest number of infections, its incremental cost per additional infection averted over Strategy A is significantly higher. Therefore, from a pure cost-effectiveness standpoint, Strategy A is the most efficient use of resources. This finding aligns with the ACER results and underscores the high value of vaccination as a primary intervention.
Next, we evaluate Strategy A against Strategy B by recalculating the ICER
The comparison between the two strategies shows that Strategy A is more cost-effective compared to Strategy B, as Strategy B is less efficient and more expensive than Strategy A. Consequently, in this study, Strategy A is regarded as the most economical infection control measure. This conclusion aligns with the ACER method results obtained earlier. Furthermore, the total infections prevented, the overall cost of the control strategies and the respective ACER and ICER values are shown in Figures 4(a)–(d). Strategic comparison focusing on infections prevented, overall cost, ACER, and ICER metrics.
Numerical method
To obtain approximate solutions of the fractional–order system, we employ a fractional Euler scheme 28 constructed for differential equations involving the Caputo derivative.
Consider the fractional differential equation (FDE) of Caputo type

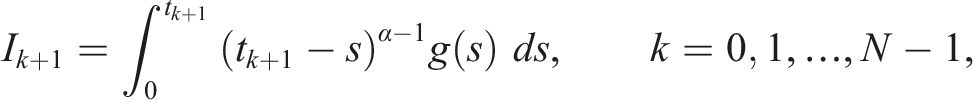
Solving equation (23) is often converted to solving the following equivalent Volterra integral equation
Let the interval [0, T] be divided uniformly as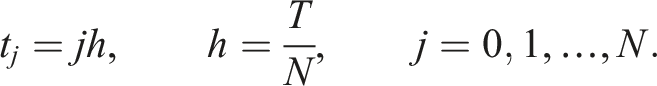
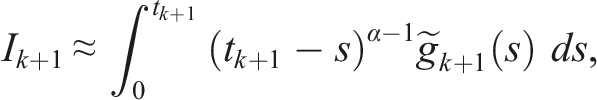
Fractional forward Euler approximation
If 


Fractional backward Euler approximation
If instead we take

The stability properties of the fractional Euler scheme have been rigorously analyzed in the literature. In particular, Theorems 3.1 and 3.2 in 28 provide conditions under which the method yields stable numerical approximations.
Forward-backward sweep method for fractional-order optimal control problem
In order to obtain the optimal control for the proposed fractional-order model, we apply a forward–backward sweep method, 26 which iteratively updates the state, adjoint and control variables within a unified computational framework.
We consider a fractional-order optimal control problem

According to Pontryagin’s Maximum Principle,
29
an optimal pair (x*, u*) must satisfy the given Hamiltonian system.


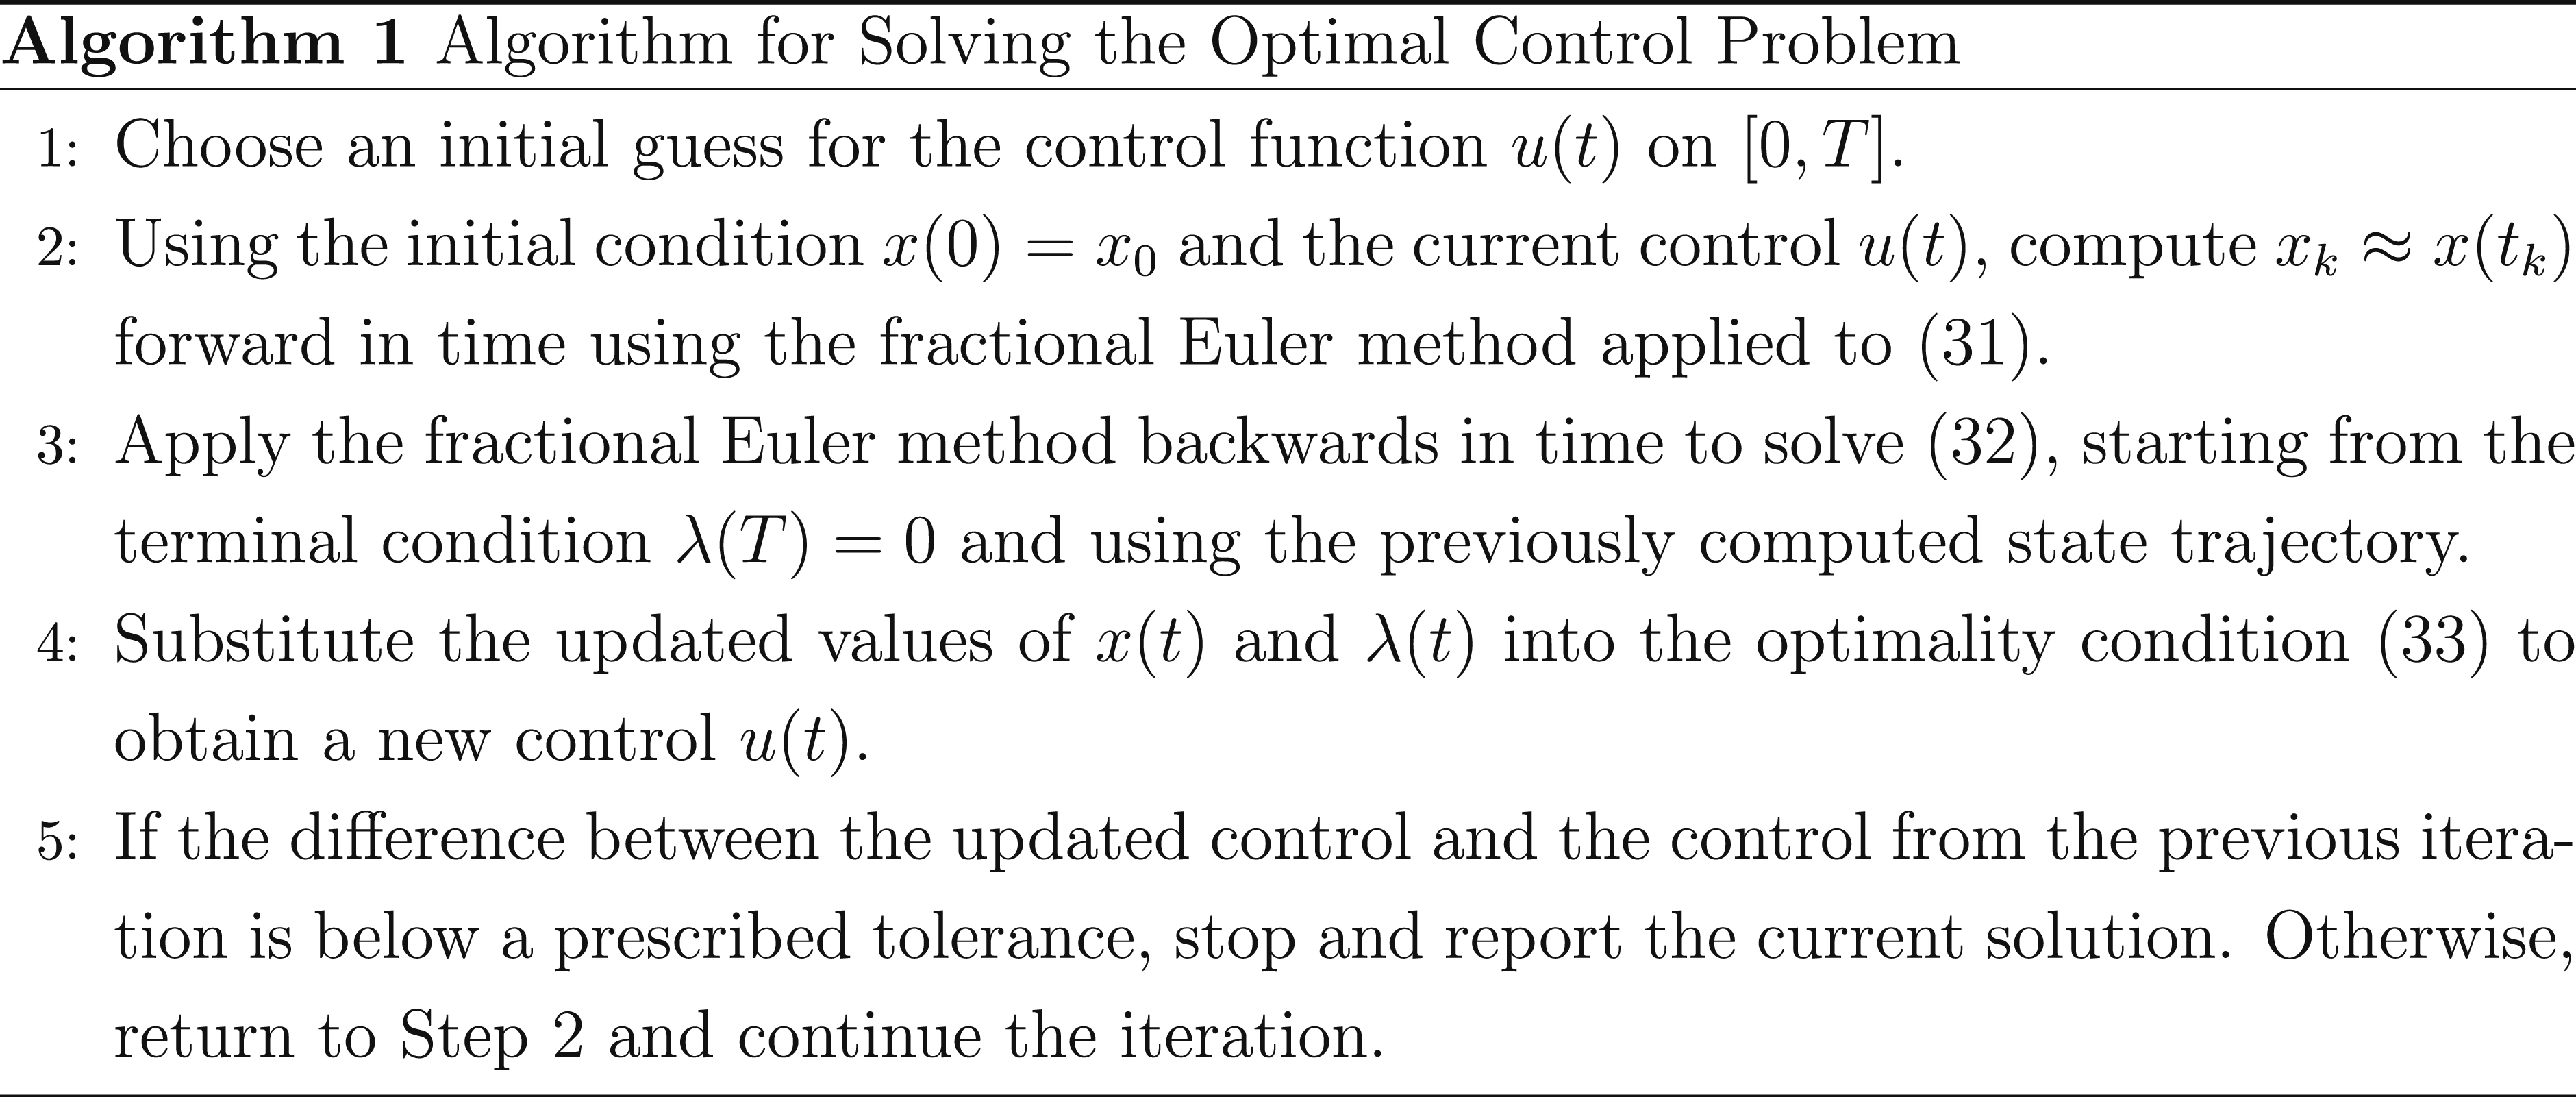
To compute the optimal solution numerically, the fractional state and adjoint equations are discretized using the fractional Euler approximations described earlier. A general outline of the numerical algorithm is summarized below.
Numerical simulation
This section is dedicated to performing a computational simulation of the system defined by (1) and solving the corresponding optimal control problem given in (19).
Numerical simulation of model (1)
Upon computing basic reproduction number using q = 0.01, h = 0.03,405
13
and considering the parameters r = 0.3 and f = 0.89 based on the literature27,20,13 as biologically reasonable and suitable for the dynamics of the proposed model and utilizing the other parameters from Table 1, we find that
Considering the initial values S(0) = 50, V(0) = 20, E(0) = 15, I(0) = 10, and R(0) = 5, Figure 5 demonstrates that when Dynamic behavior of different compartments for DFE at 
Next, by taking b = 0.075, f = 0.70 and the additional parameters are obtained from Table 1. We compute Time series behavior of population densities for EE at 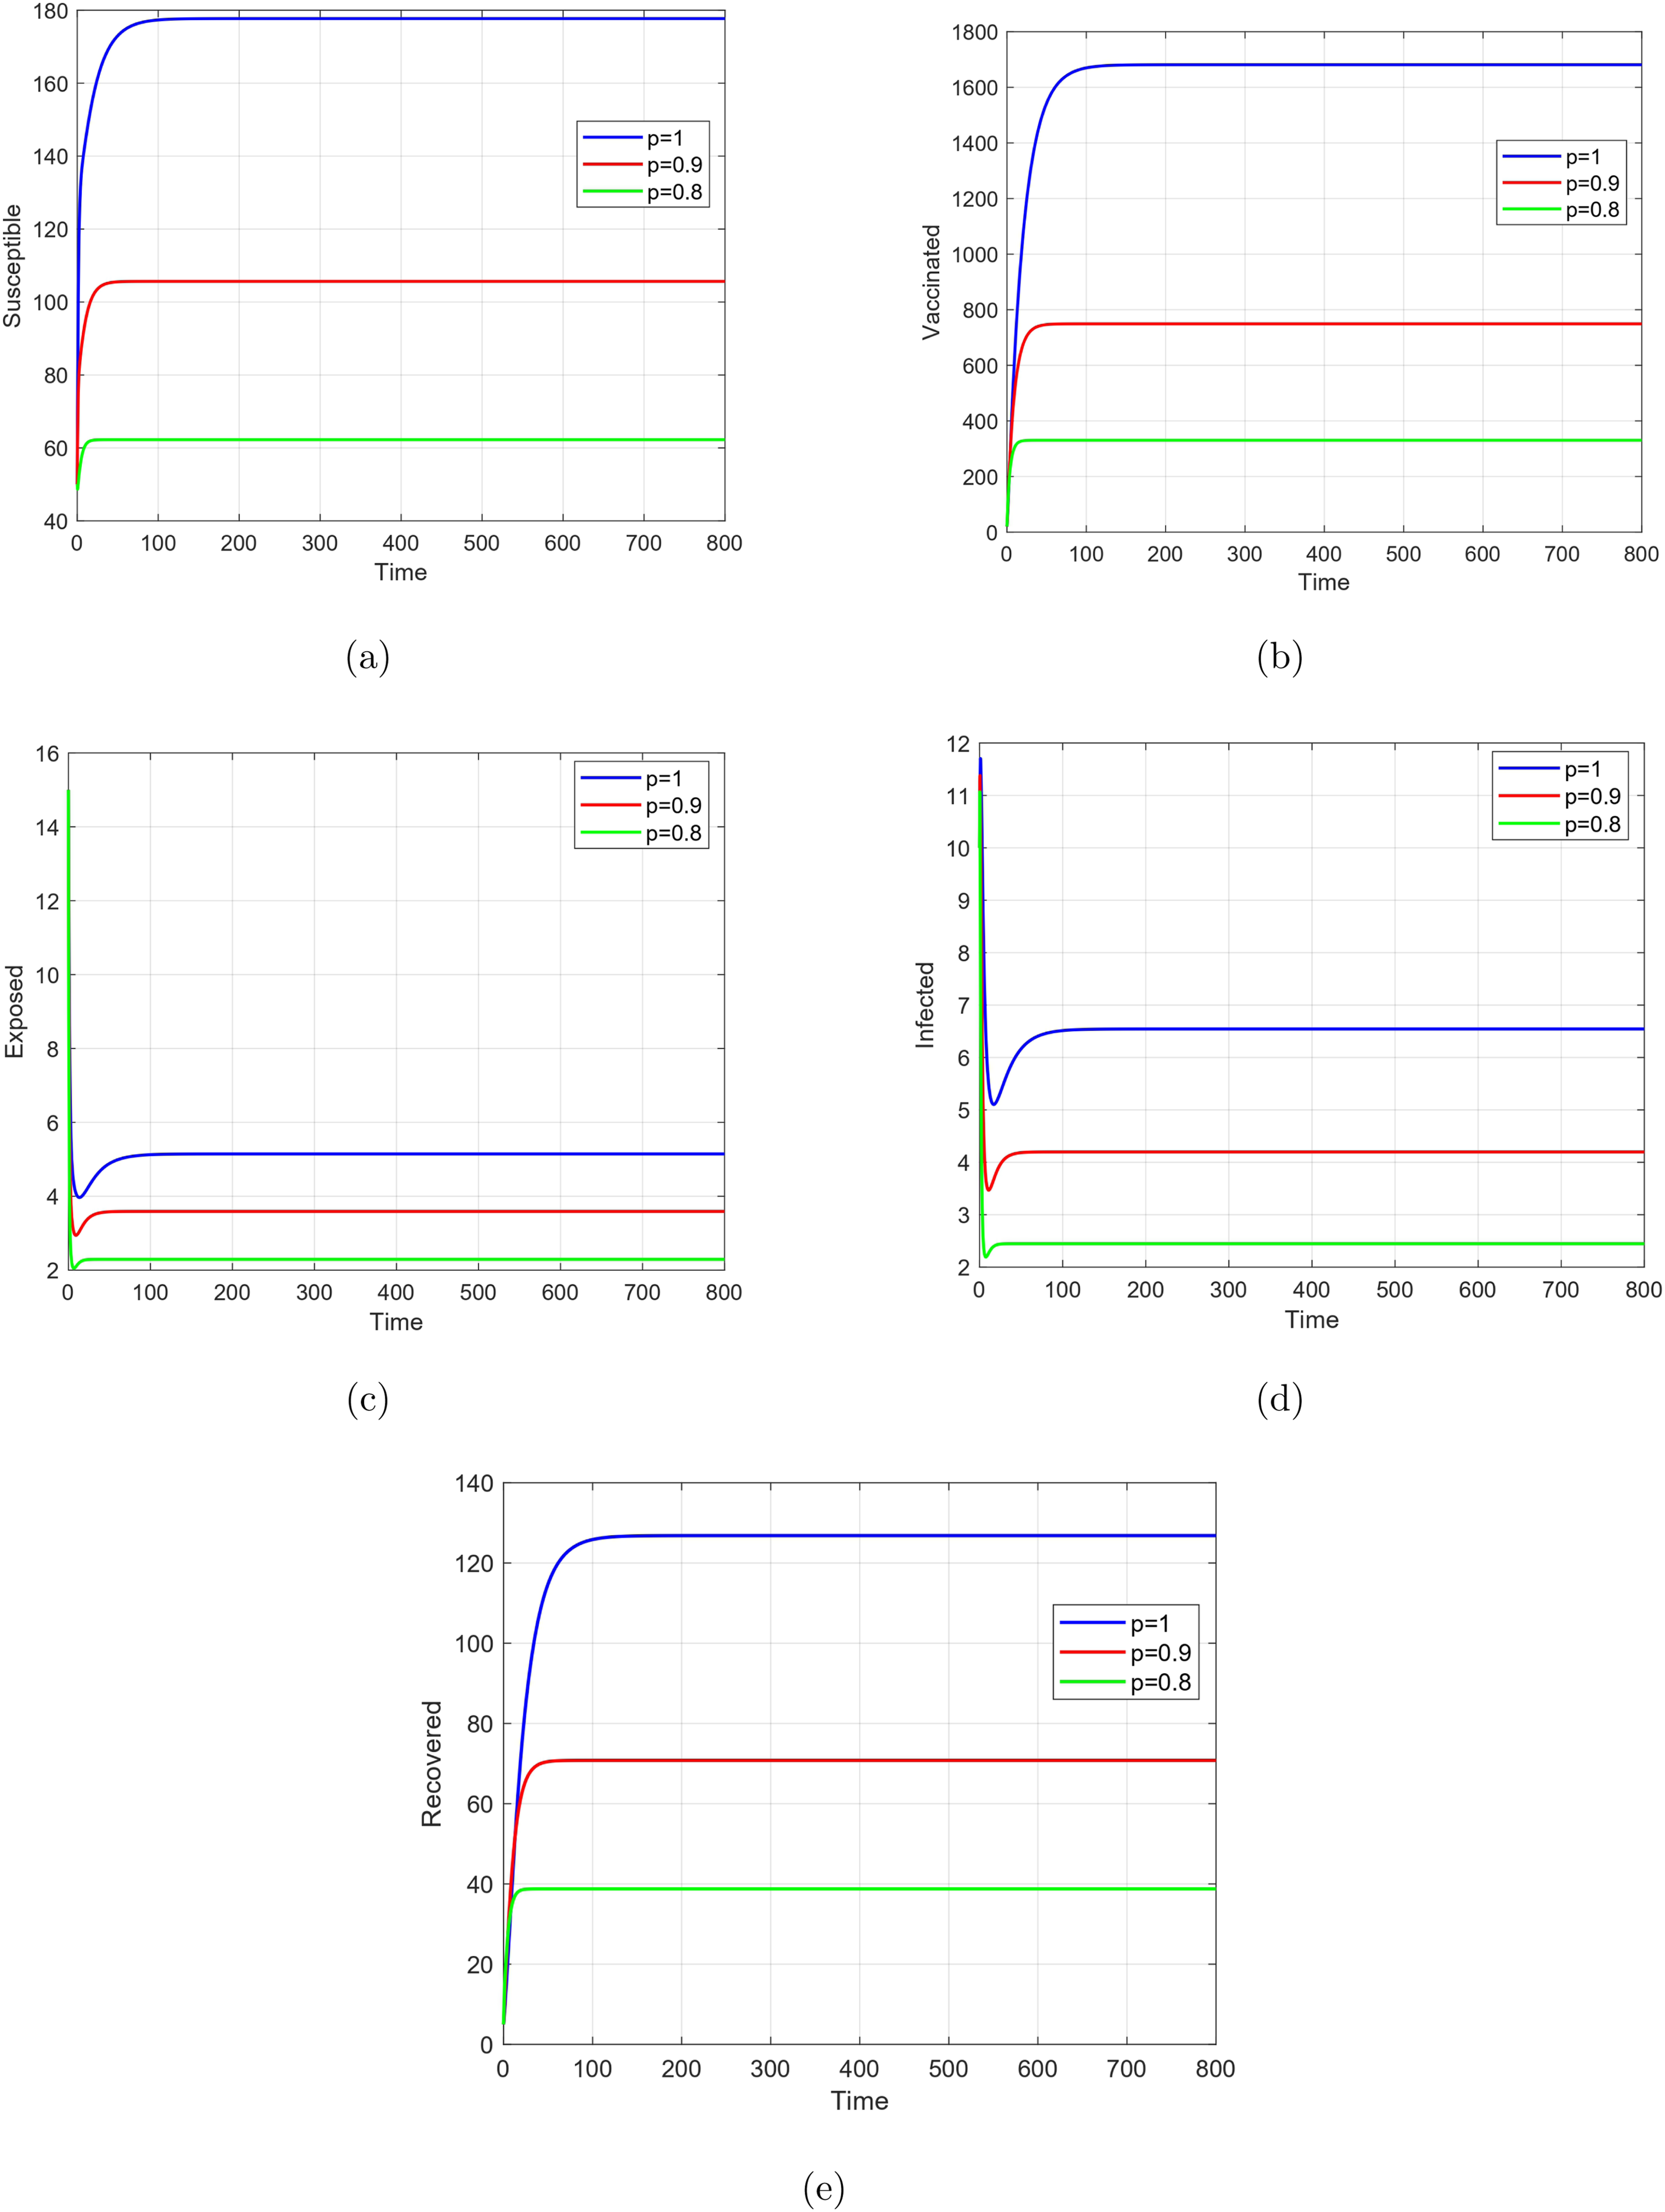
Numerical simulation of the optimal control problem
This portion of the study involves numerically simulating the optimal control system (10) and the objective functional (9). The optimality system (19)–(20), along with the optimality conditions (18) and the control set (13), is solved using Sweep method with the Fractional Euler forward-backward method over [0,100] days. The state equations are computed with the forward Fractional Euler method starting from an initial guess, while the adjoint system is tackled using the backward Fractional Euler method. Additionally, we assess the influence of the control measures u1 and u2 in decreasing the infected population. We consider the values of weight parameters X1 = 3, X2 = 2, X3 = 4, and X4 = 9. 27
Figure 7 displays the optimal control profiles over time and illustrates that both control measures follow a similar temporal pattern, applying maximum effort initially and gradually reducing their intensity as the system stabilizes. To assess the effectiveness of different control interventions, we consider the control variables u1 = 0.2 and u2 = 0.7 and simulated the model under multiple strategy scenarios, as illustrated in Figures 8–11. Figure 8 illustrates the behavior of state variables after implementing vaccination control. The results show a notable decline in the exposed and infected populations, while the recovered population increases rapidly. Furthermore, with a decrease in the fractional order, the count of exposed and infected individuals also lessens, underscoring the essential contribution of curbing disease propagation and mitigating its overall impact. Comparison of control profiles u1 and u2. Susceptible, Vaccinated, Exposed, Infected, and Recovered populations with and without vaccination control. Susceptible, Vaccinated, Exposed, Infected, and Recovered populations with and without treatment control. Susceptible, Vaccinated, Exposed, Infected, and Recovered populations without and with control using a combination of vaccination and treatment. Susceptible, Vaccinated, Exposed, Infected, and Recovered populations without and with different control strategies at p = 1.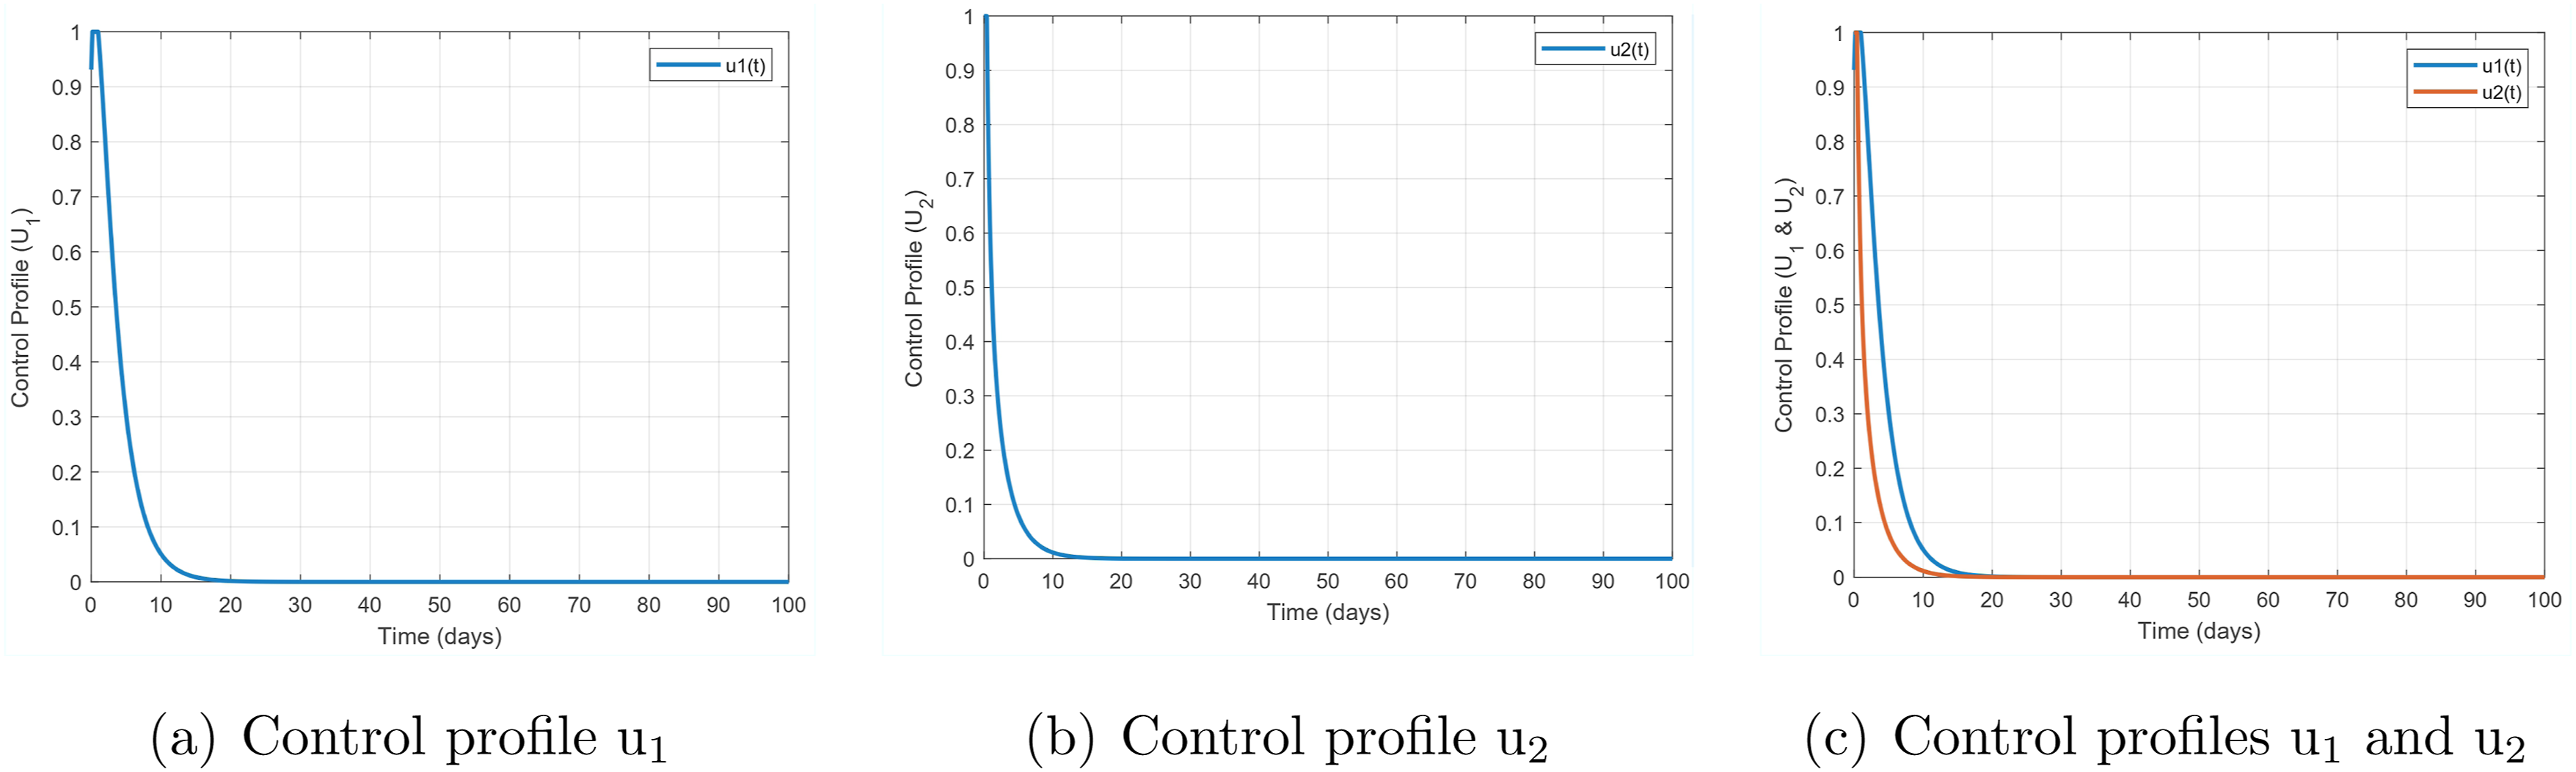


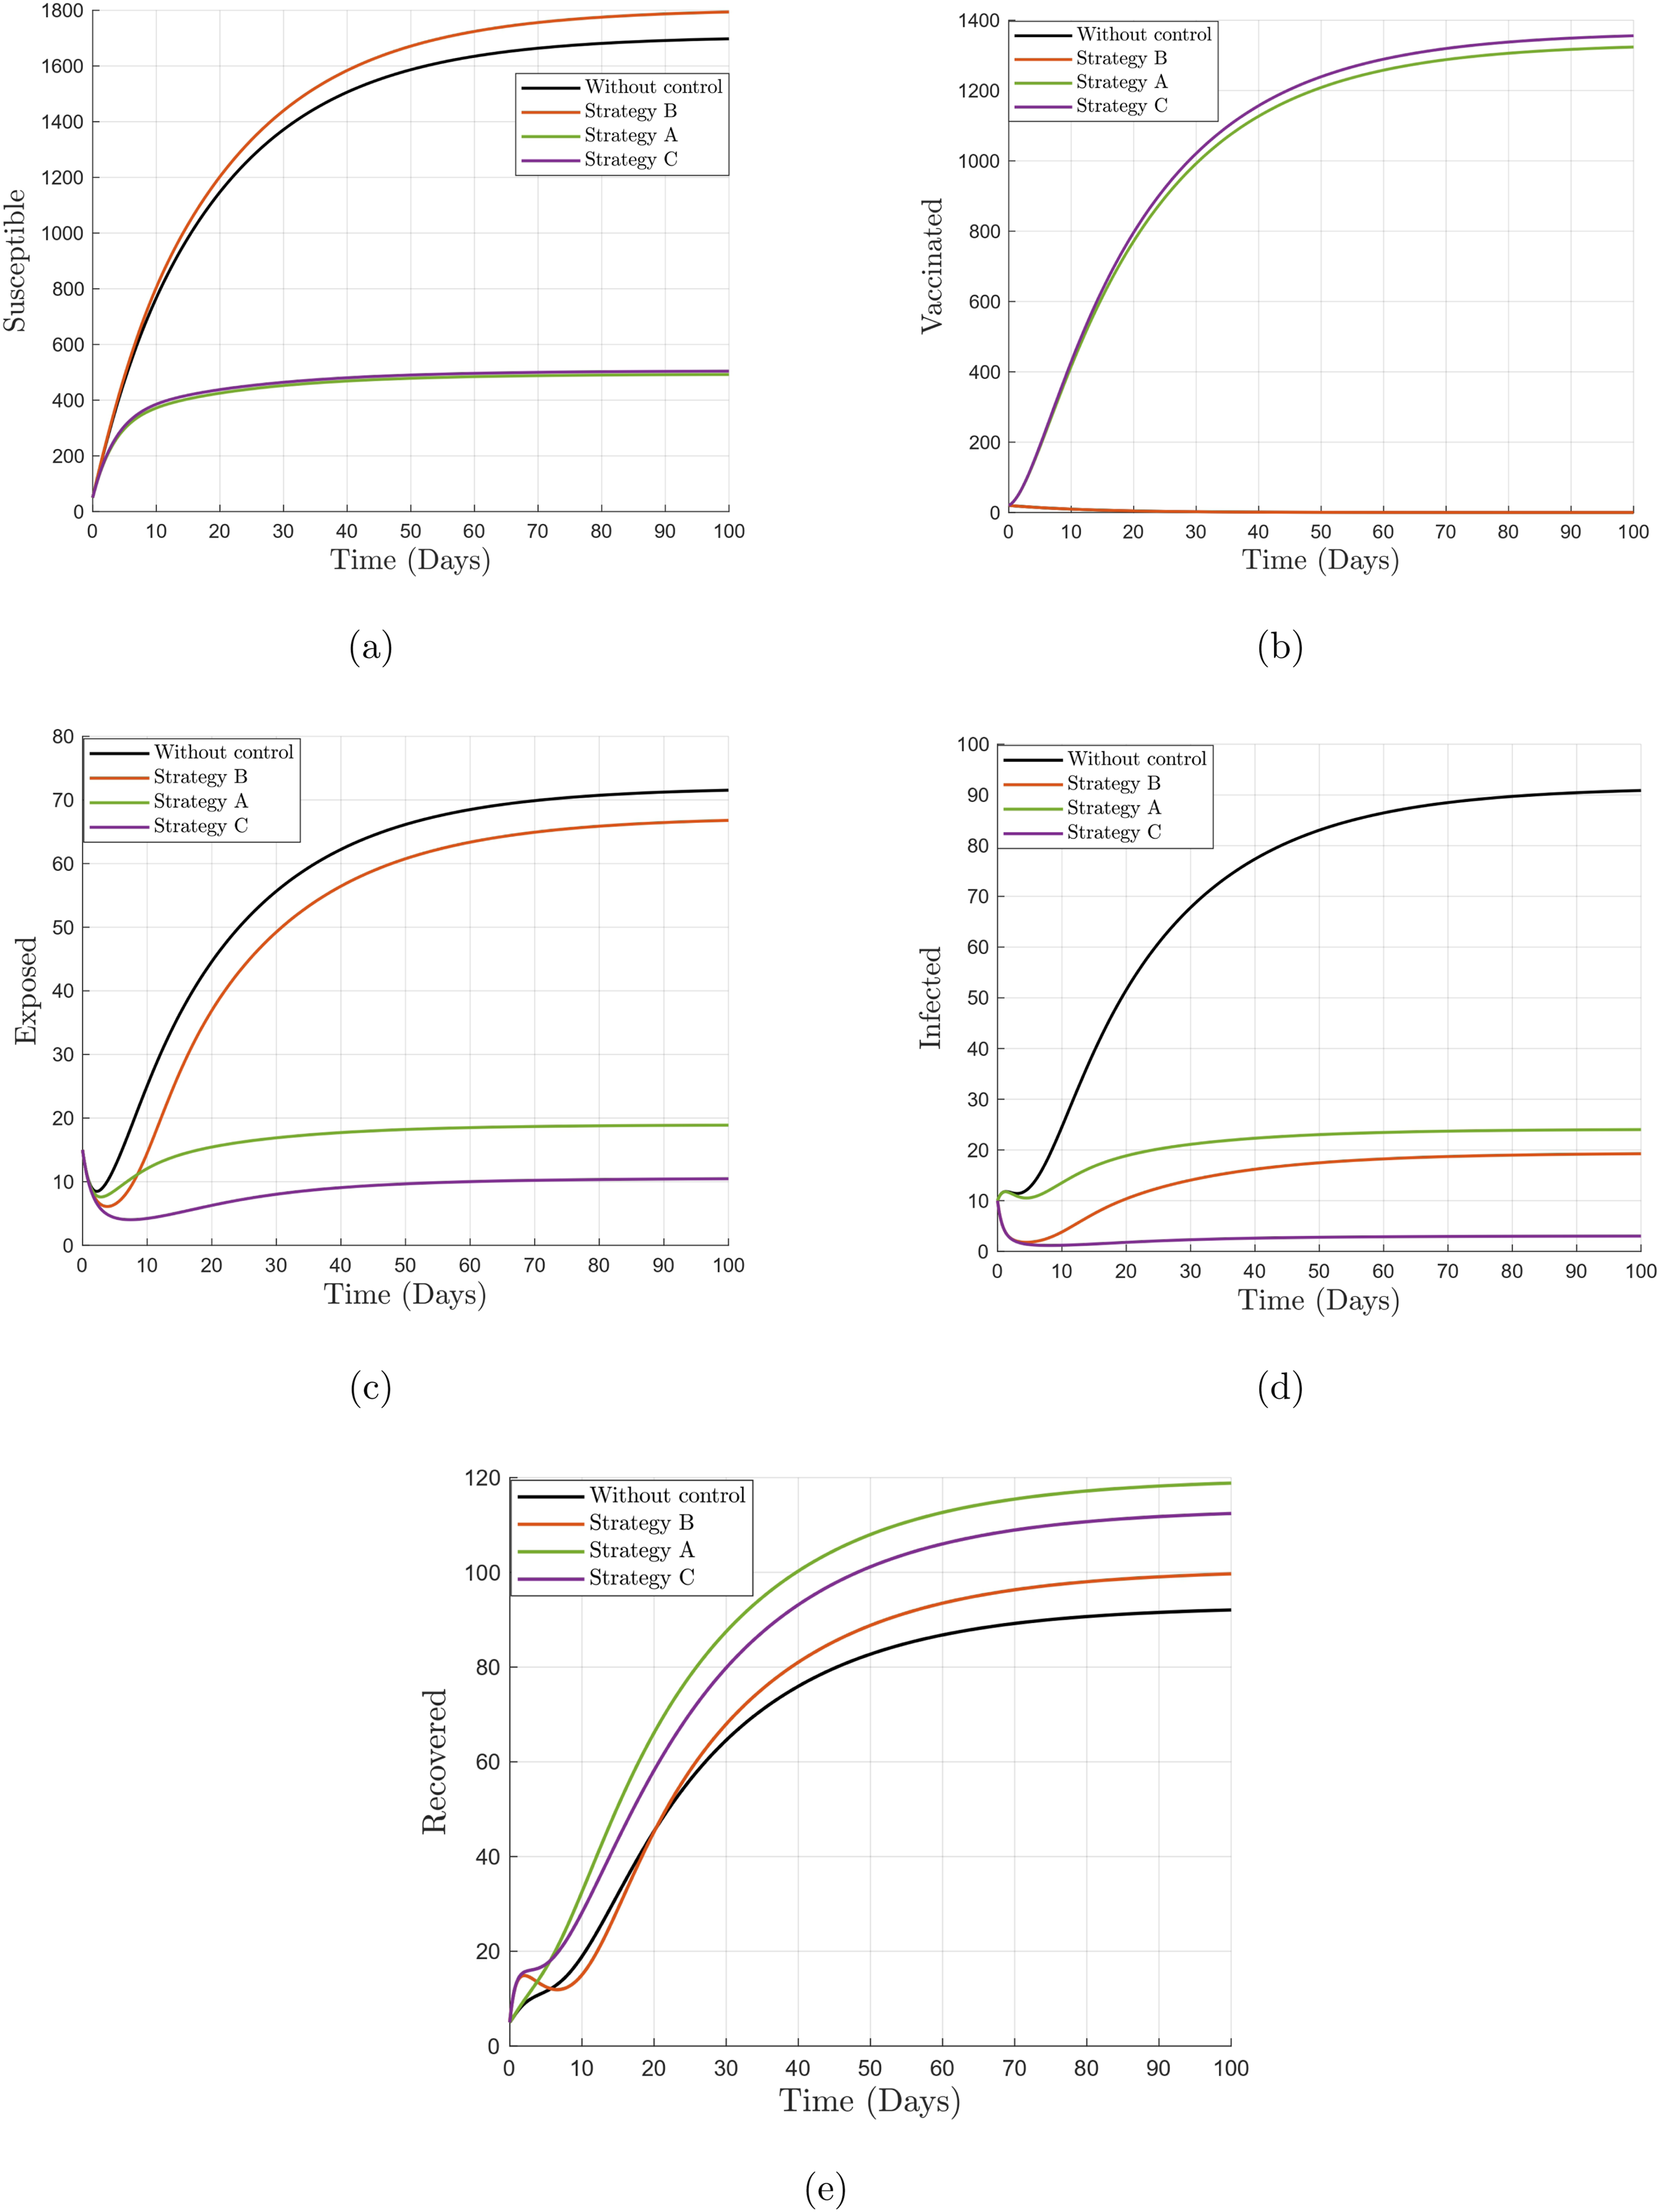
Figure 9 demonstrates the impact of treatment control on the state variables. The findings show a gradual decrease in the exposed and infected populations over time, along with a rise in both the susceptible and recovered groups. The fractional order is key in determining the dynamics of all compartments, affecting the speed of disease spread and recovery. A lower fractional order further accelerates the decline in infections, highlighting the memory effect in fractional order systems. These findings emphasize the effectiveness of treatment strategies in limiting disease transmission, enhancing recovery rates and ultimately contributing to better epidemic control.
Figure 10 depicts the total influence of applying both vaccination and treatment interventions on the various population groups. The results demonstrate that implementing both interventions simultaneously is more effective than applying either intervention individually. The integrated approach notably decreases the exposed and infected populations while considerably boosting the recovered population. Moreover, as the fractional order diminishes, the infection burden further declines, indicating the influence of memory effects in fractional order models. The synergy between vaccination and treatment enhances disease mitigation by not only preventing new infections but also accelerating recovery, thereby reducing the overall disease burden.
Figure 11 depicts the dynamics of susceptible, vaccinated, exposed, infected, and recovered populations under different control strategies when p = 1. As shown in Figure 11(a), the susceptible population is highest in strategy B, followed by strategies A and C. Likewise, Figure 11(b) shows that strategies C and A result in a swift rise in the vaccinated population. Additionally, Figures 11(c) and (d) demonstrate that strategy C is highly effective in lowering the number of exposed and infected individuals. Lastly, Figure 11(e) shows that strategy A results in the highest number of recovered individuals compared to strategies B and C.
Conclusion
In this research, we proposed a fractional-order SVEIR model to investigate the dynamics and control of infectious disease transmission. The inclusion of fractional derivatives allows the model to account for memory effects and hereditary properties, providing a more realistic representation of the underlying biological processes compared to classical models. We derived the basic reproduction number
To minimize the disease’s impact, an optimal control problem was formulated incorporating time-dependent vaccination and treatment strategies. Using Pontryagin’s Maximum Principle, the necessary conditions for optimality were obtained. Numerical simulations were conducted to illustrate the effectiveness of these control strategies in reducing the number of infections. Additionally, a cost-effectiveness analysis was carried out to compare the control strategies. Our cost-effectiveness conclusion, which strongly favors vaccination, is supported by the dynamics observed in other complex models, such as those incorporating nucleic acid testing and protective awareness, where prevention-oriented controls often yield superior efficiency. 30
The fractional order p ∈ (0, 1) determines the strength of memory included in the epidemic dynamics. For p = 1, the system behaves as a classical model without memory, whereas for p < 1, the present evolution depends on the accumulated history of infection and recovery. Biologically, this accounts for delayed immune responses, waning immunity and behavior shaped by past disease levels. As p decreases, memory effects intensify, leading to slower transitions and smoother epidemic curves. Hence, fractional models can more realistically capture history-dependent disease processes. 31 Overall, this study emphasizes the potential of fractional-order models in epidemiological research and underscores the importance of integrating optimal control and economic evaluation to inform disease intervention policies.
Footnotes
Acknowledgment
One of the authors (D.B.) would like to thank for the grant funding PIRF Project Number: I0074 provided by the Lebanese American University, Beirut, Lebanon.
Funding
The authors received no financial support for the research, authorship, and/or publication of this article.
Declaration of conflicting interests
The authors declared no potential conflicts of interest with respect to the research, authorship, and/or publication of this article.