
Abstract
In order to solve the rotor-three-stage brush seal rubbing fault problem during the test run of a counter-rotating aerojet engine, based on the Fast Fourier Transform (FFT), the three-dimensional waterfall diagrams and color maps of different vibration measuring points on the casing, the frequency spectrum diagrams of the time-domain signal step section, and the amplitude maximum section are analyzed, respectively. The results show that the time-domain signal step section is the beginning of the engine fault, the amplitude maximum section is the serious fault section, and the amplitude of low and high-pressure fundamental frequency and abnormal high frequency of the serious fault section of each measuring point are higher than those of the beginning of the fault; in the low-frequency section, the fault causes a large number of components such as doubling frequencies k1f1, k2f2, and the combined frequency k1f1+k2f2 of the low and high-pressure rotors to appear in the spectrum diagram. To investigate the cause of the fault, based on the results of the disassembly inspection and comparing the engine fault data with the normal vibration data, it is determined that the fault is caused by the increase in rotor vibration due to the rise in high-pressure rotational speed, which lead to the local rubbing between the rotor and the three-stage brush seal. Finally, the high-frequency 3f1+6f2 feature in the vibration spectrum is explained in terms of the fault mechanism, and a universal identification method for rotor-three-stage brush seal rubbing fault is established.
Keywords
Introduction
Brush seal is a contact dynamic sealing technology with excellent sealing performance, and its sealing leakage is only 1/5∼1/10 of the labyrinth seal.1,2 As the total temperature and pressure of the turbine inlet of the aero-engine continue to increase, the sealing performance and leakage on the turbine side have put forward higher requirements. Therefore, the three-stage brush seal with better pressure-bearing and sealing performance can be used instead of the single-stage brush seal.3–5 In addition, rotor–stator rubbing (such as rotor-brush seal rubbing) is one of the common faults in aero-engines.6,7 In order to pursue high thrust-weight ratio and high efficiency, modern aerospace engines have increasingly smaller gaps between the rotor and brush seal, blades and casing, which leads to phenomenon of rubbing between rotor and stator parts occurring from time to time.8,9 The seriousness of rotor–stator rubbing can lead to serious damage of rotor and stator, blade fracture, and even other serious consequences.10,11
In the field of engine health management, failures of components such as rotors, disks, stators and other are all closely related to vibration, and the early characteristics of engine failures can also be reflected in vibration signals. By monitoring the vibration status, abnormal vibration signals during engine operation can be identified in time to prevent further expansion of the fault. 12 Therefore, exploring the vibration signal characteristics of rotor–stator rubbing faults such as rotor-three-stage brush seal, especially the early fault characteristics, is of great significance and engineering practical value for engine fault diagnosis, timely shutdown and troubleshooting.
Rotor–stator rubbing faults are usually secondary effects of other engine faults, such as rotor imbalance, misalignment and shaft crack, which may cause rubbing faults.13,14 From 1994 to 1996, the U.S. F110-100 engine developed cracks in the turbine labyrinth seal, causing a rubbing fault between the engine rotor and the casing, which ultimately led to the crashes of four F-16 fighter jets equipped with this type of engine.15,16 Thus, it can be seen that the rotor–stator rubbing fault has always been a problem faced by modern aero-engines, and it is also a hot topic of research by many scholars in recent years.
For the study of rotor–stator rubbing, there are mainly theoretical model, numerical simulation, simulation experiment, and real test run experiment. For the theoretical model method, Muszynska et al.17–19 proposed a mechanical model of rotor–stator rubbing by introducing elastic recovery coefficient and explored the dynamic response of rotor when rotor–stator rubbing occurs locally at different positions in the radial and axial directions. Chen et al.7,20 established a coupled dynamics model of rotor-ball bearing-casing with imbalance-misalignment-rubbing coupling faults, used the variable step Runge-Kutta method to obtain the system response, and explored the characteristics and laws of coupling faults. For numerical simulation research, Liu et al. 21 proposed an implicit-explicit integration scheme to numerically simulate the engine blade-casing rubbing process, simulated the transient dynamic process of blade-casing rubbing, and analyzed the dynamic response characteristics of the blade. For the simulation experimental study, Wang et al. 22 designed an experimental device that can simulate the local rubbing fault based on the structural characteristics of the aero-engine turbine casing and studied the vibration characteristics of high- and low-pressure rotors experiencing local rubbing. Chu et al.23,24 established a single-disk and multi-disk rubbing rotor system test device, designed a special stator structure to achieve full circle rubbing, and analyzed the nonlinear response and bifurcation characteristics of the system during rubbing. Qu et al. 25 designed an experimental device that can simulate single-point rubbing, multi-point rubbing, local rubbing, and even full rubbing of the rotor, analyzed the vibration characteristics of the rotor by changing the rotor rotational speed and the gap between the rotor and the stator parts, and explored the nonlinear response of the rotor rubbing. For the experimental study of real test run, Jiang et al. 26 analyzed the vibration characteristics of the casing and rotor in view of the problem that the vibration of the fan casing was too large and the amplitude was swinging during the test run of an engine, and the results showed that the casing deformation caused the incongruity of the rotor and stator clearance, which led to the rubbing fault of the engine rotor and stator. Based on the rotor speed curve and the amplitude envelope of vibration doubling frequency of an engine, Zhai et al. 27 respectively analyzed the frequency spectrum of local rubbing fault and normal vibration signal at the measuring point of turbine casing and proposed a rotor local rubbing fault monitoring method. Finally, the rotor-stator rubbing fault characteristics were analyzed by extracting the kurtosis index, margin index, and total amount of vibration signal.
In summary, it can be seen that previous researchers have done a lot of work on the establishment of mechanical model of rotor-stator rubbing, the analysis of spectral characteristics of experimental simulation of rotor-stator rubbing, and the vibration frequency characteristics of other coupled rubbing faults, and have achieved important research results. However, the analysis of the rubbing fault types and vibration frequency characteristics that occur during the actual test run of aero-engine is still mainly concentrated on the blade-casing rubbing of single-rotor aero-engine. The fault situation is single and the research is limited. As for the counter-rotating aero-engine, 28 which has a more complex structure and more prominent vibration problems, there are currently no relevant reports on the rotor-three-stage brush seal rubbing fault and vibration frequency characteristics that occur during the real test run.
Based on this, this paper utilizes the counter-rotating aero-engine designed by the team to measure the vibration data of the rotor-three-stage brush seal rubbing fault during the actual test run and conducts a study on the frequency characteristics of vibration signals at different measuring points on the casing. First, according to the changing rule of the high- and low-pressure rotors speed of the engine, the vibration time-domain signal of the casing measuring point is analyzed, and combined with the engine disassembly inspection results, the cause and degree of engine fault are determined. Then, in order to solve the problem of abnormal step and excessive amplitude of the time-domain vibration signal of multiple measuring points of the engine, based on the Fast Fourier Transform, the waterfall diagrams, the spectrum diagrams of the time-domain signal step section, and the maximum amplitude section of the eight measuring points on the casing are drawn to determine the period when the system began to fault and the fault was serious. Then, the vibration frequency characteristics in the waterfall diagrams and spectrum diagrams of different measuring points are quantitatively described, and the high-frequency amplitudes of the starting fault and the severe fault section of the four horizontal measuring points are compared, so as to analyze the spectral characteristics of adjacent measuring points at the fault location. Finally, in order to investigate the influence of rotor speed on high-frequency vibration characteristics and engine rotor-three-stage brush seal rubbing fault, the fault data is compared and analyzed with the normal vibration data of the same counter-rotating aero-engine, and combined with the structural characteristics of the three-stage brush seal, the high-frequency characteristics in the vibration signals are explained from the fault mechanism, so as to establish a universal identification method for rotor-three-stage brush seal rubbing fault in counter-rotating aero-engine.
Experimental system and measurement method
Figure 1 shows the schematic diagram of the dual-rotor system model for rub-impact fault, which is mainly composed of high-pressure and low-pressure rotors, rubbing surface and massless ideal rotating shaft. According to the rotor concentrated mass method, it is assumed that the masses of the low-pressure and high-pressure rotors are m1 and m2, respectively. In addition, according to the engine disassembly inspection results in the following text, it can be seen that since the engine fault is located on the high-pressure rotor side, and the low-pressure rotor has no rubbing fault, the high-pressure rotor can be simplified to the Jeffcott model for rub-impact analysis. Schematic diagram of the dual-rotor system model for rub-impact fault.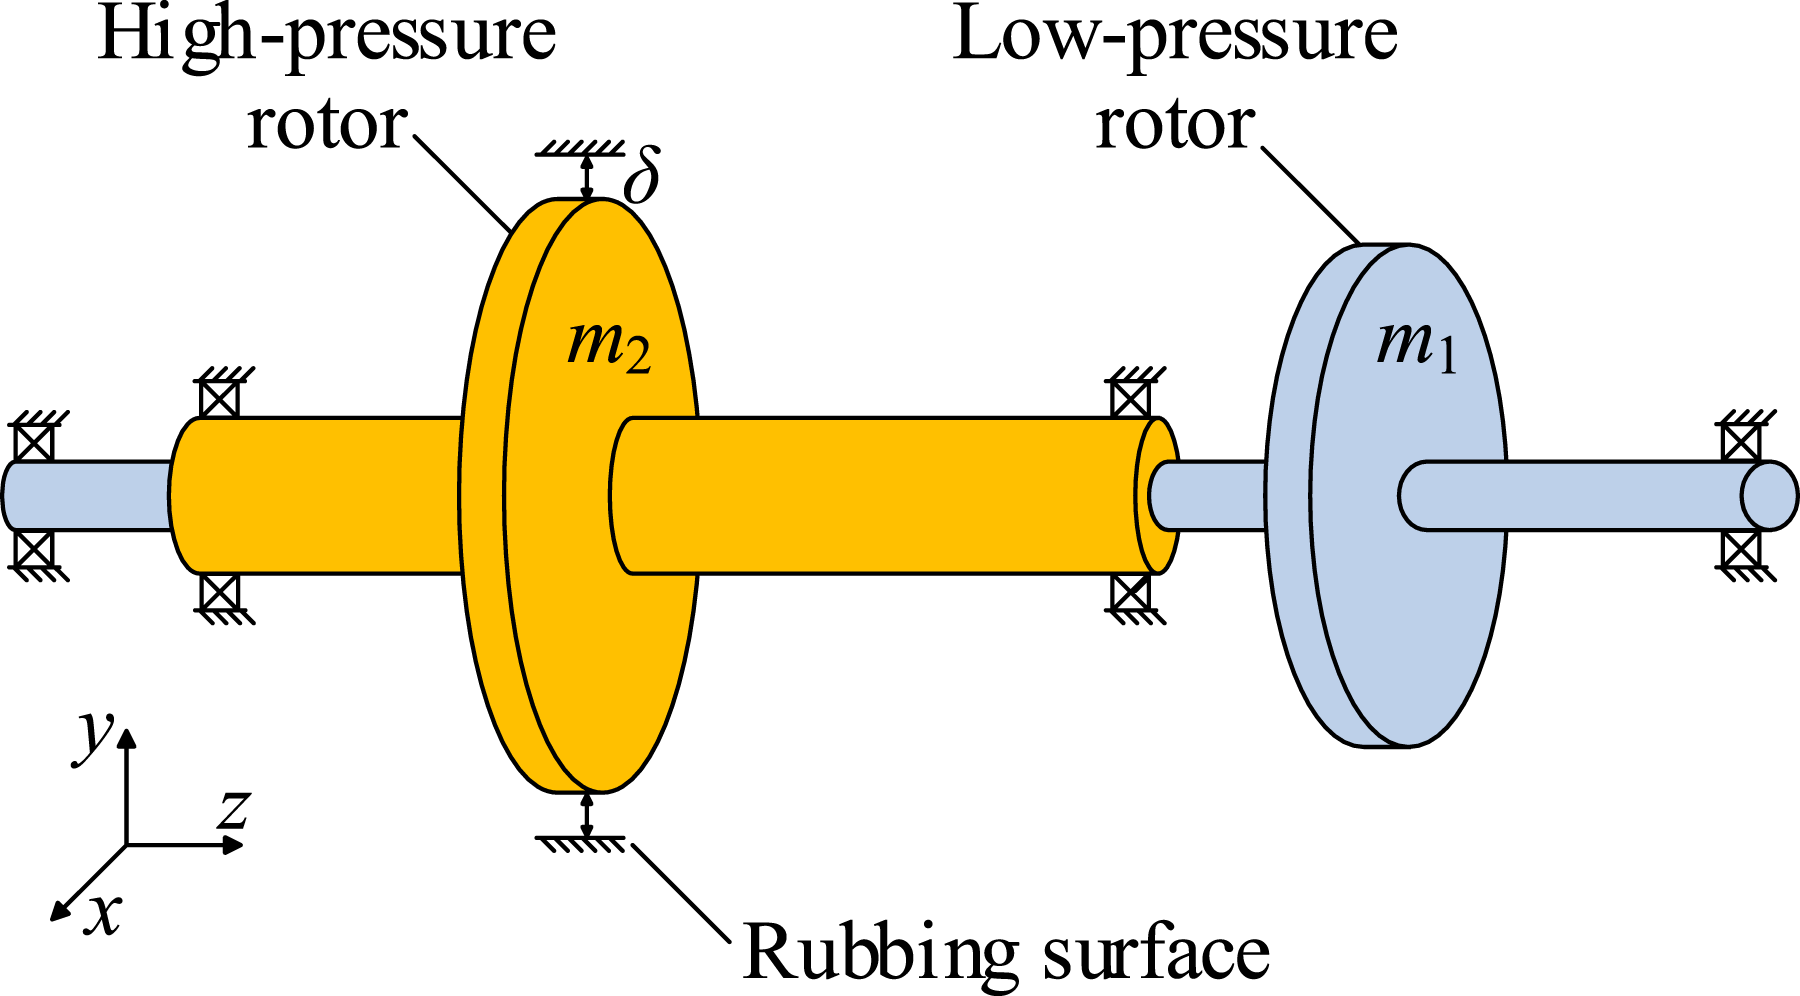
When the high-pressure rotor and the rubbing contact surface have a short-term rubbing contact, it is simplified as an elastic contact, and the thermal effect generated during the rubbing process is ignored. Assuming that the friction between the high-pressure rotor and the rubbing contact surface follows the Coulomb friction law, and the effects of gravity and gyroscopic moment are negligible and thus not considered, when rubbing fault occurs in the high-pressure rotor, the dynamic equation of the system is as follows:

Rub-impact force equation:

Among them, the stiffness variation of the rotor system is:

System structure
The three-stage brush seal support structure of a counter-rotating engine is shown in Figure 2. The three-stage brush seal is composed of three single-stage brush seals in parallel along the axial direction, which is located at the front end of the high-pressure first stage turbine as a whole to reduce the gas leakage in the main and secondary flow paths of the engine.
29
In addition, for the overall structure of the engine, the low-pressure rotor is a “1-0-1” support method, and the high-pressure rotor is a “0-2-0” support method. The material of the rotor is high-temperature alloy GH4169, with a density of 8.24 g/cm3, which has excellent fatigue resistance. Schematic diagram of the three-stage brush seal support structure of a counter-rotating aero-engine.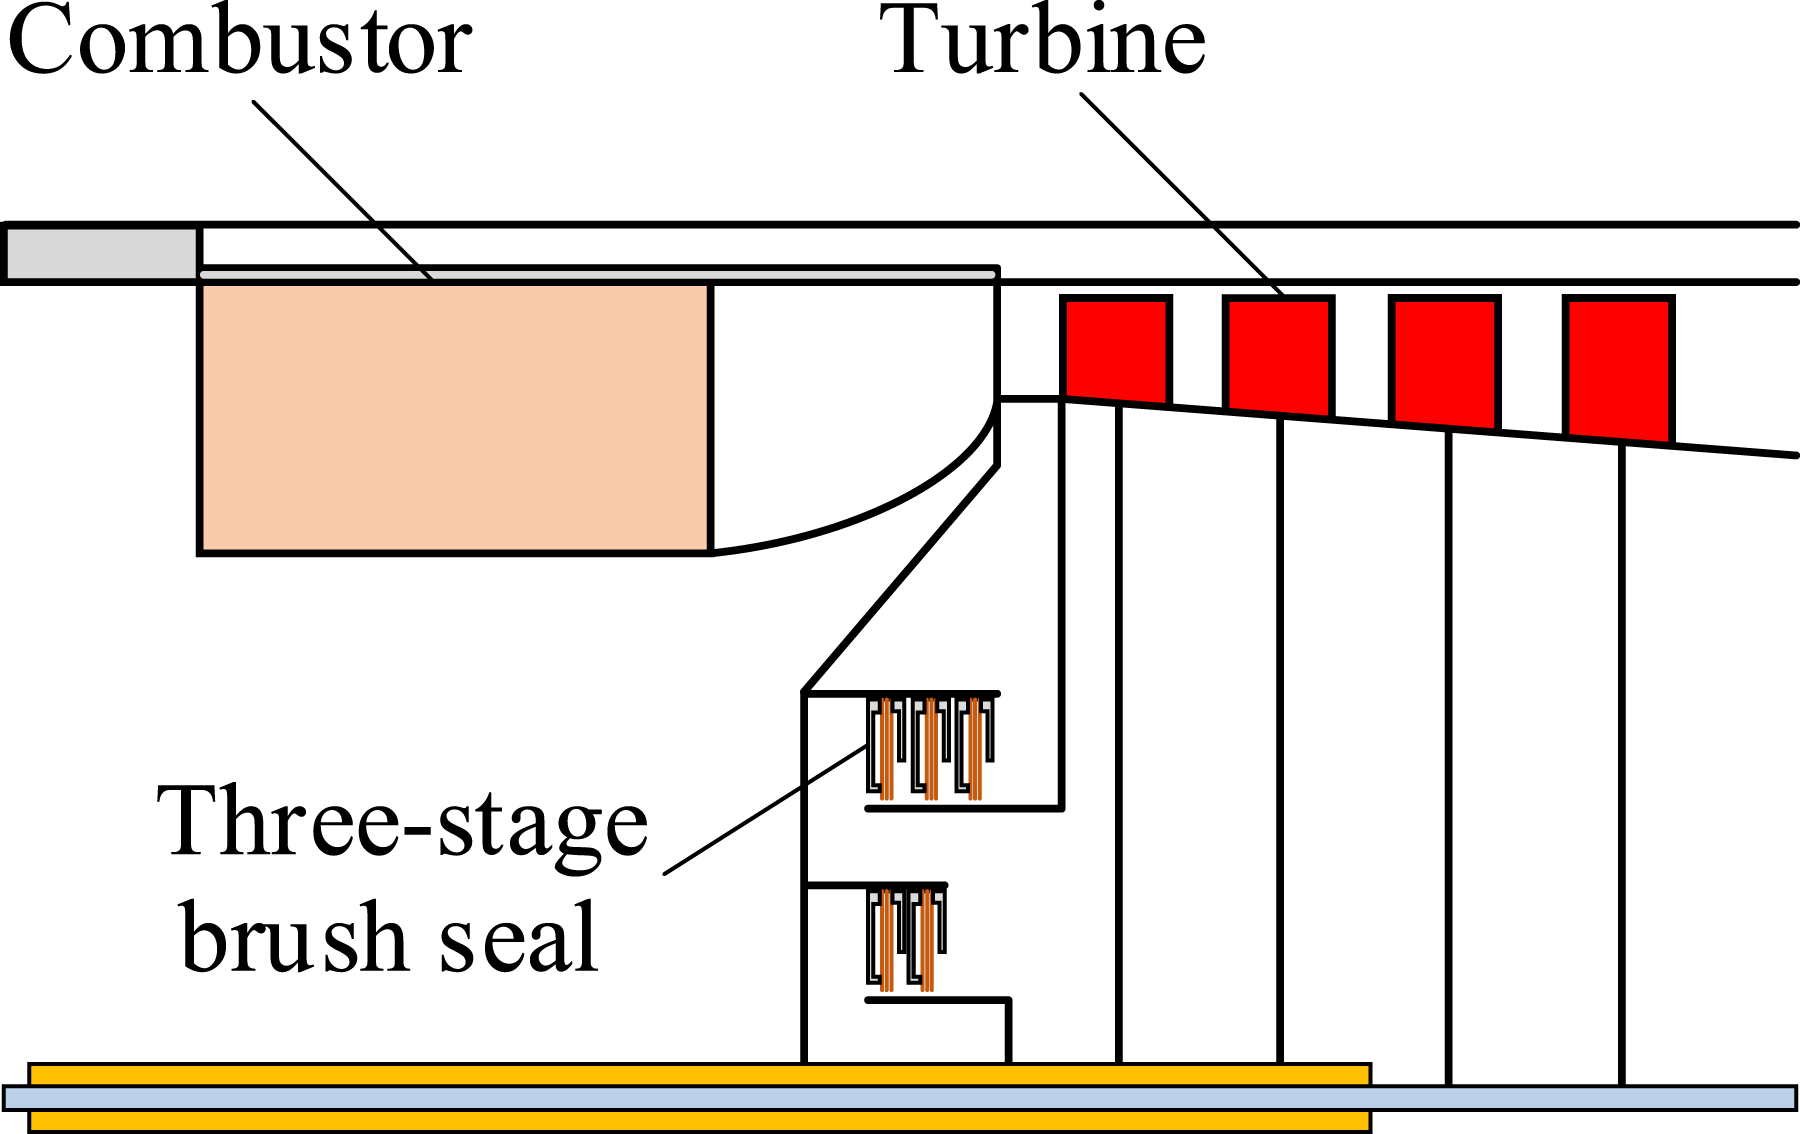
Figure 3 shows the physical and planar structure of the welded three-stage brush seal used in this engine. It is mainly composed of front plate, brush bundle, and back plate. The front plate is used to prevent upstream high-pressure turbulence, and the back plate is used to provide axial support for the brush bristle when it is axially bent and deformed due to the airflow pressure,
30
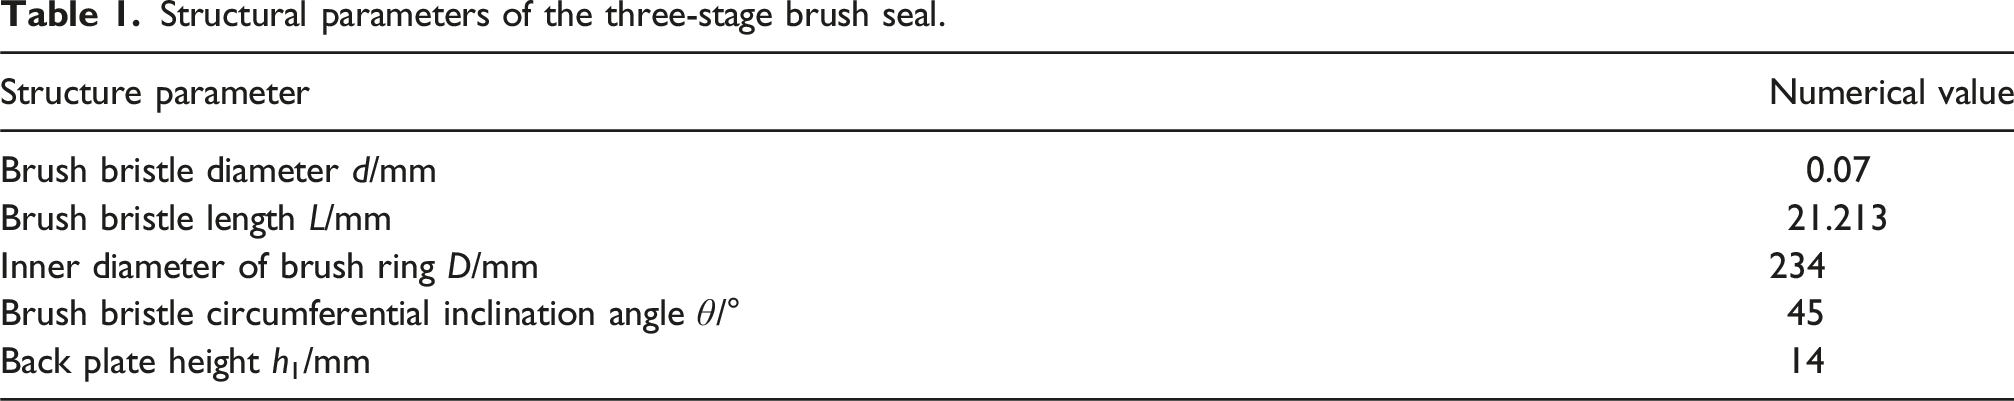
and the wear-resistant coating area of the high-pressure first stage turbine runway ring is below the brush bundle. Among them, the distance between the inner diameter of the brush seal back plate and the high-pressure turbine runway ring is 1.0 mm, and the thickness of the wear-resistant coating on the turbine runway ring is 0.2 mm. The specific structural parameters of the three-stage brush seal used in this paper are shown in Table 1. Schematic diagrams of the physical and planar structure of the three-stage brush seal. (a) Physical diagram, and (b) schematic diagram. Structural parameters of the three-stage brush seal.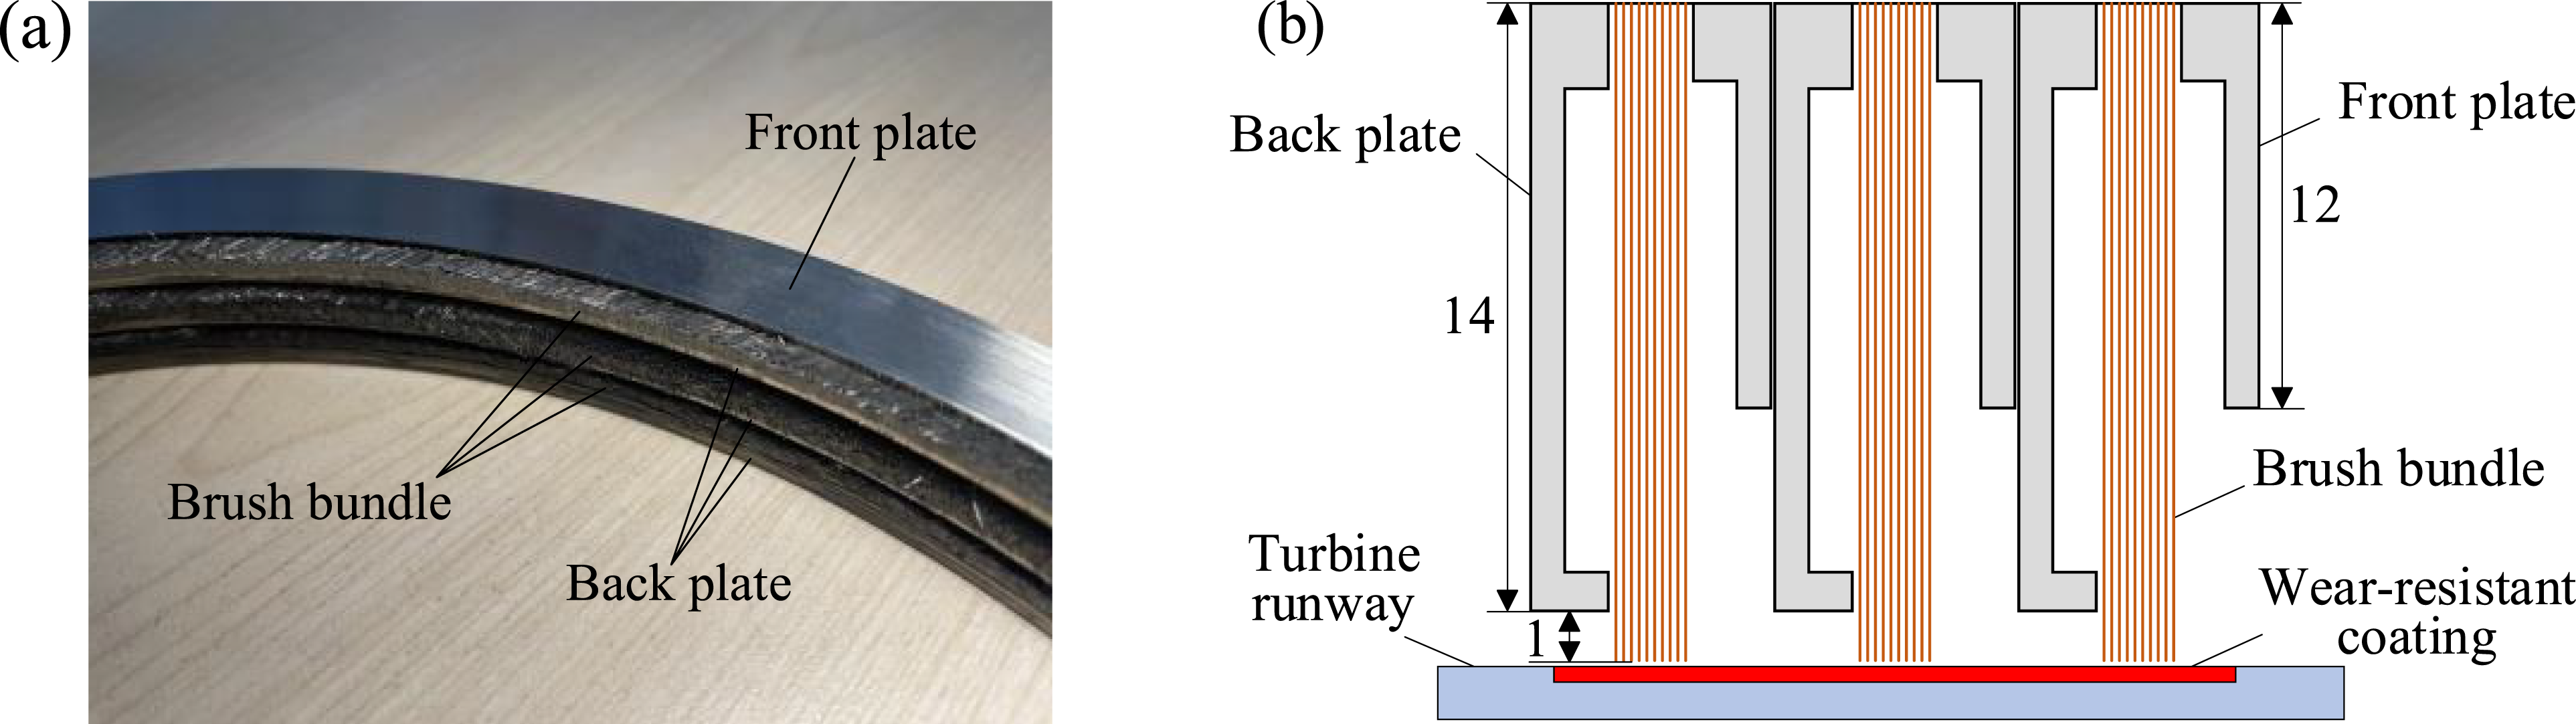
Layout and measurement method of vibration measuring points
During the entire test run, in order to monitor the mechanical operation status of the engine, mutually perpendicular accelerometers are installed on multiple load-bearing sections of the engine casing to obtain the vibration data of the casing from the horizontal and vertical directions, respectively. Figure 4 shows a schematic diagram of the layout of the accelerometers measuring points on the casing. Among them, section 1 is the intake support casing, section 2 is the front end of the transition casing, section 3 is the rear end of the transition casing, and section 4 is the rear end of the turbine casing. Here, since sections 1 to 4 are critical parts of the aero-engine with prominent vibration issues, it is necessary to focus on monitoring their vibration amplitudes. In addition, H1∼H4 and V1∼V4 are the corresponding horizontal and vertical vibration measuring points of each section respectively, and the three-stage brush seal structure is located between section 3 and section 4. Layout diagram of accelerometers measuring points on the casing.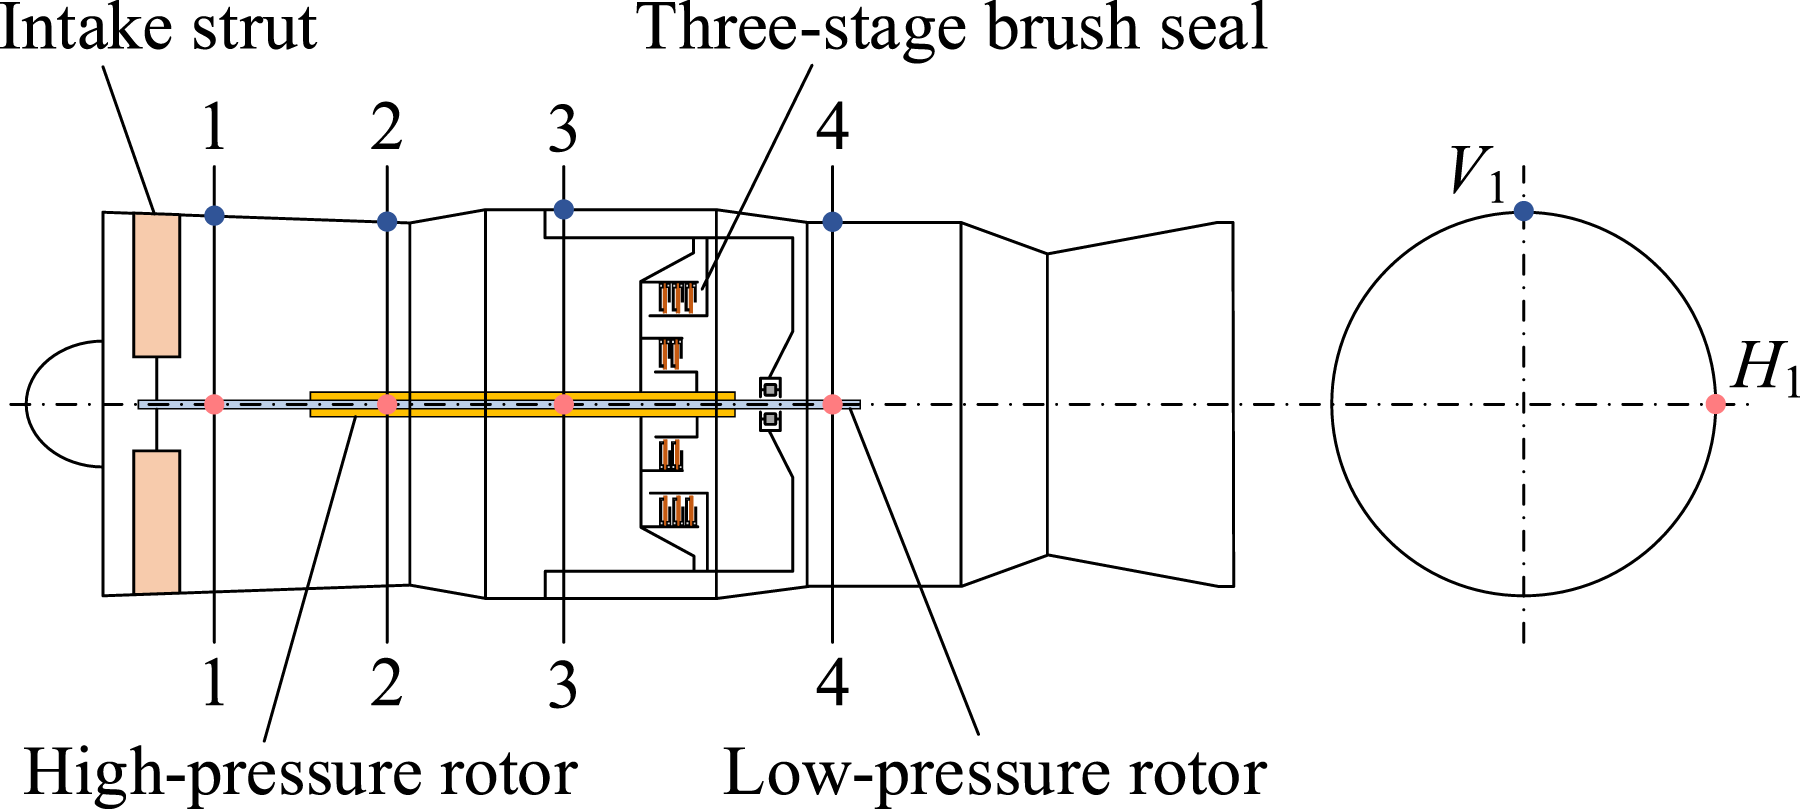
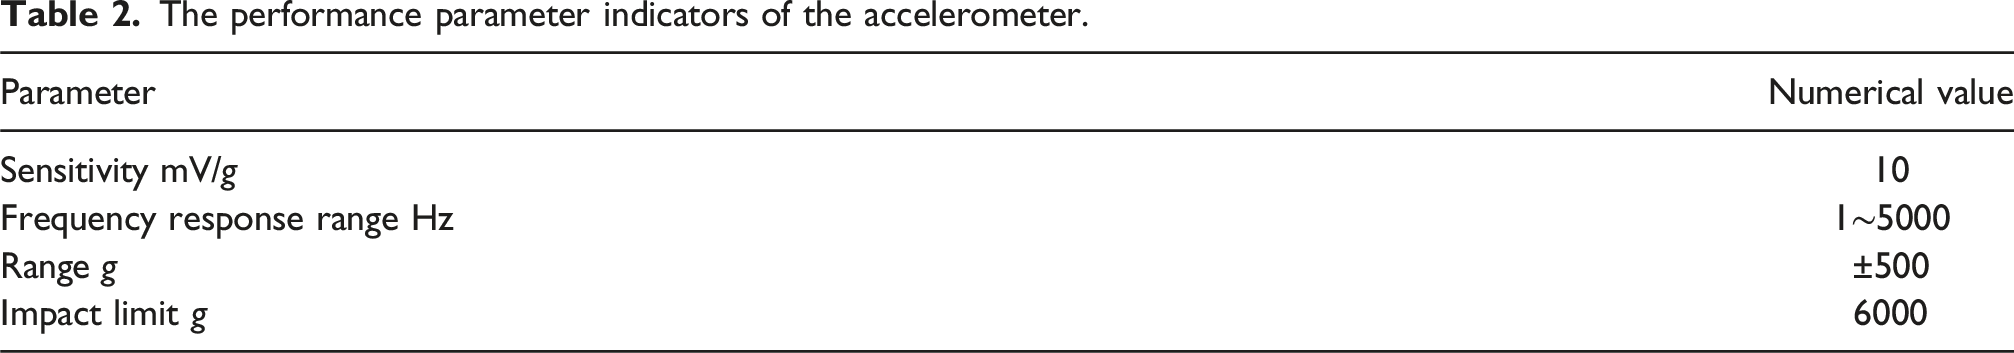
The performance parameter indicators of the accelerometer.
Test run vibration data analysis
Description of vibration signal
During the bench test of a counter-rotating engine, the starter motor is first used to turn the high-pressure rotor speed to 1600 r/min. Then, the low-pressure rotor begins to operate, and then the high- and low-pressure rotors continue to increase their speeds. After a period of time, the low-pressure rotor speed N1 remains near 1400 r/min, and the high-pressure rotor speed N2 stabilizes at 5000 r/min. Finally, at 148 s, the high- and low-pressure rotors simultaneously reduce their speeds until the final shutdown.
Figure 5 shows the rotational speed changes of the high- and low-pressure rotors and the time-domain diagrams of the vibration signals of eight measuring points. The continuous test run of the engine lasts 244.5 s, and the sampling frequency of the vibration signal is 20 kHz, and the eight accelerometers on the casing have completely recorded the vibration signal data of each measuring point. It is worth noting that, according to the testing standards for aero-engine, if the vibration amplitude of the engine casing exceeds the fault warning value of 25 mm/s during the test run, emergency alarm, and other measures must be taken. Therefore, this paper has performed an integration preprocessing on the acceleration signals obtained from the accelerometers to obtain the vibration velocity signals of different measuring points, so as to meet the requirements of the engine testing standards. The rotational speed changes of the high- and low-pressure rotors and the time-domain diagrams of the vibration signals of the eight measuring points. (a) High- and low-pressure rotors speed, and (b) vibration signals from eight measuring points.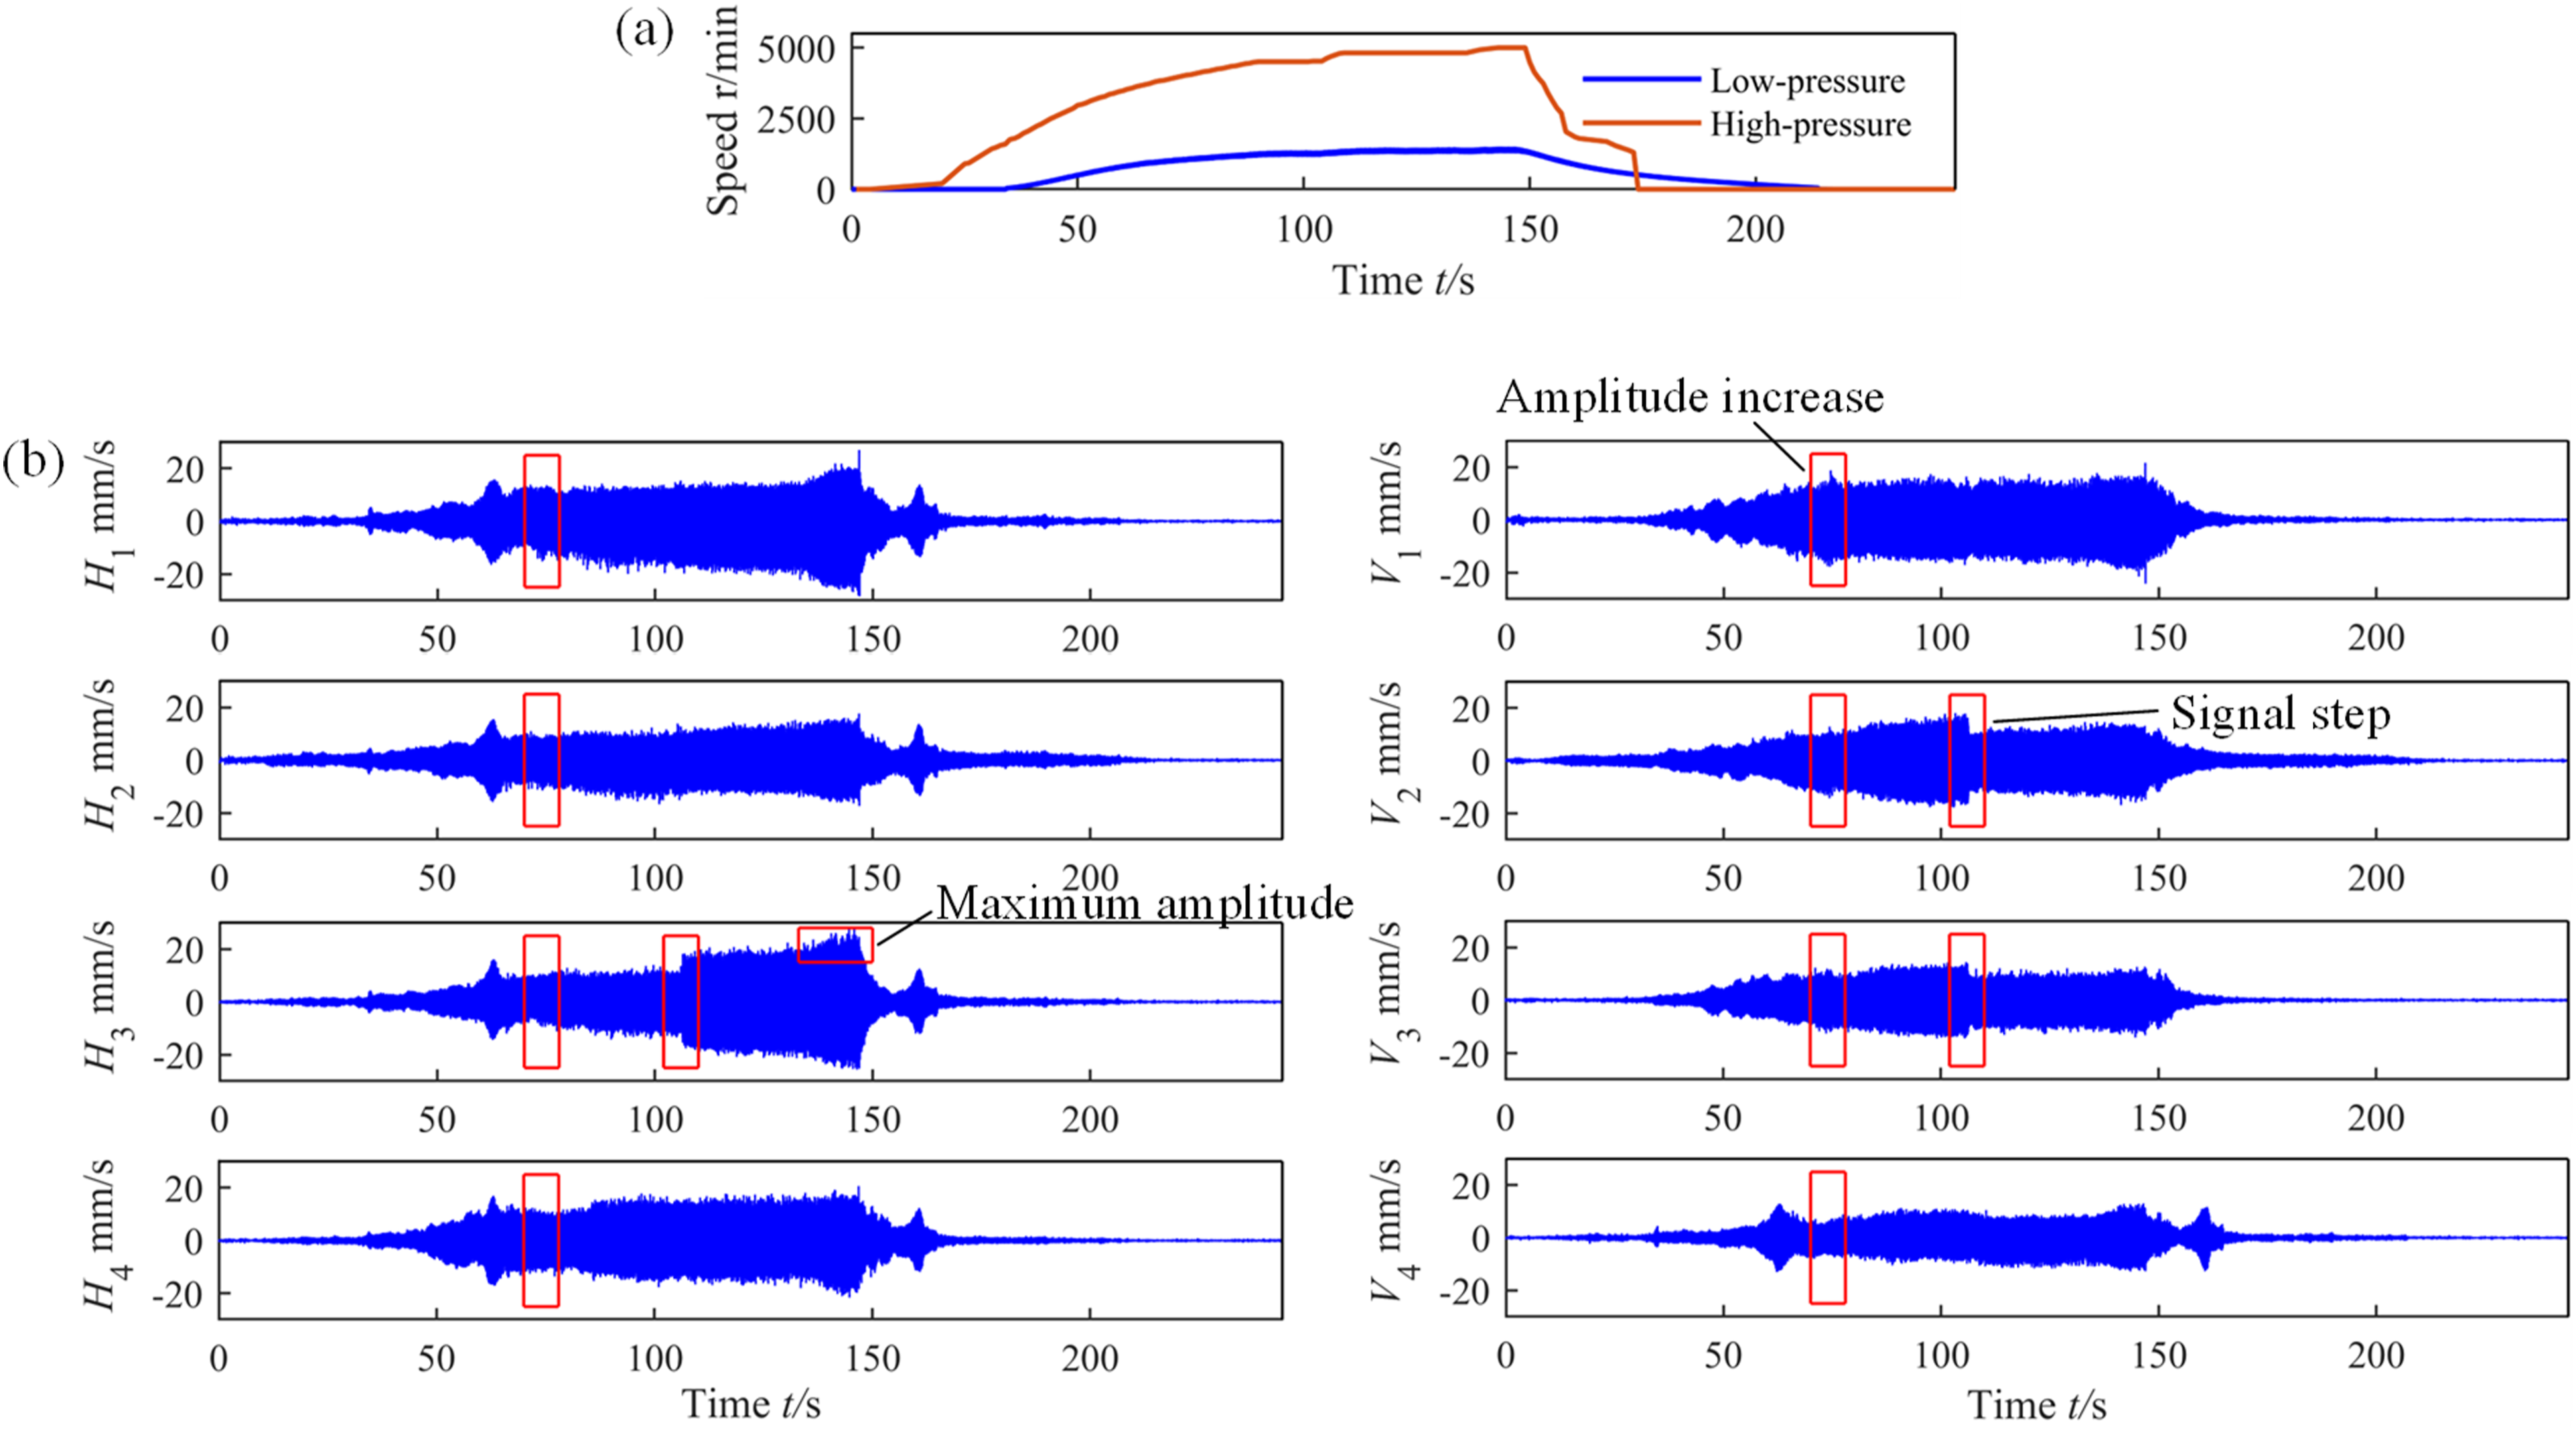
Dismantling inspection
Combined with the previous description of the engine fault vibration time-domain signal, in order to determine the specific type and severity of engine fault, a comprehensive disassembly inspection of the engine is conducted before the frequency-domain analysis of the vibration signal. It is finally determined that a local rubbing fault occurred between the high-pressure rotor and the three-stage brush seal at the front end of the high-pressure first stage turbine of the engine. Figure 6 shows the picture of the three-stage brush seal rubbing fault, and Figure 7 shows the picture of the high-pressure first stage turbine runway ring rubbing. The picture of three-stage brush seal rubbing fault. The picture of high-pressure first stage turbine runway ring rubbing.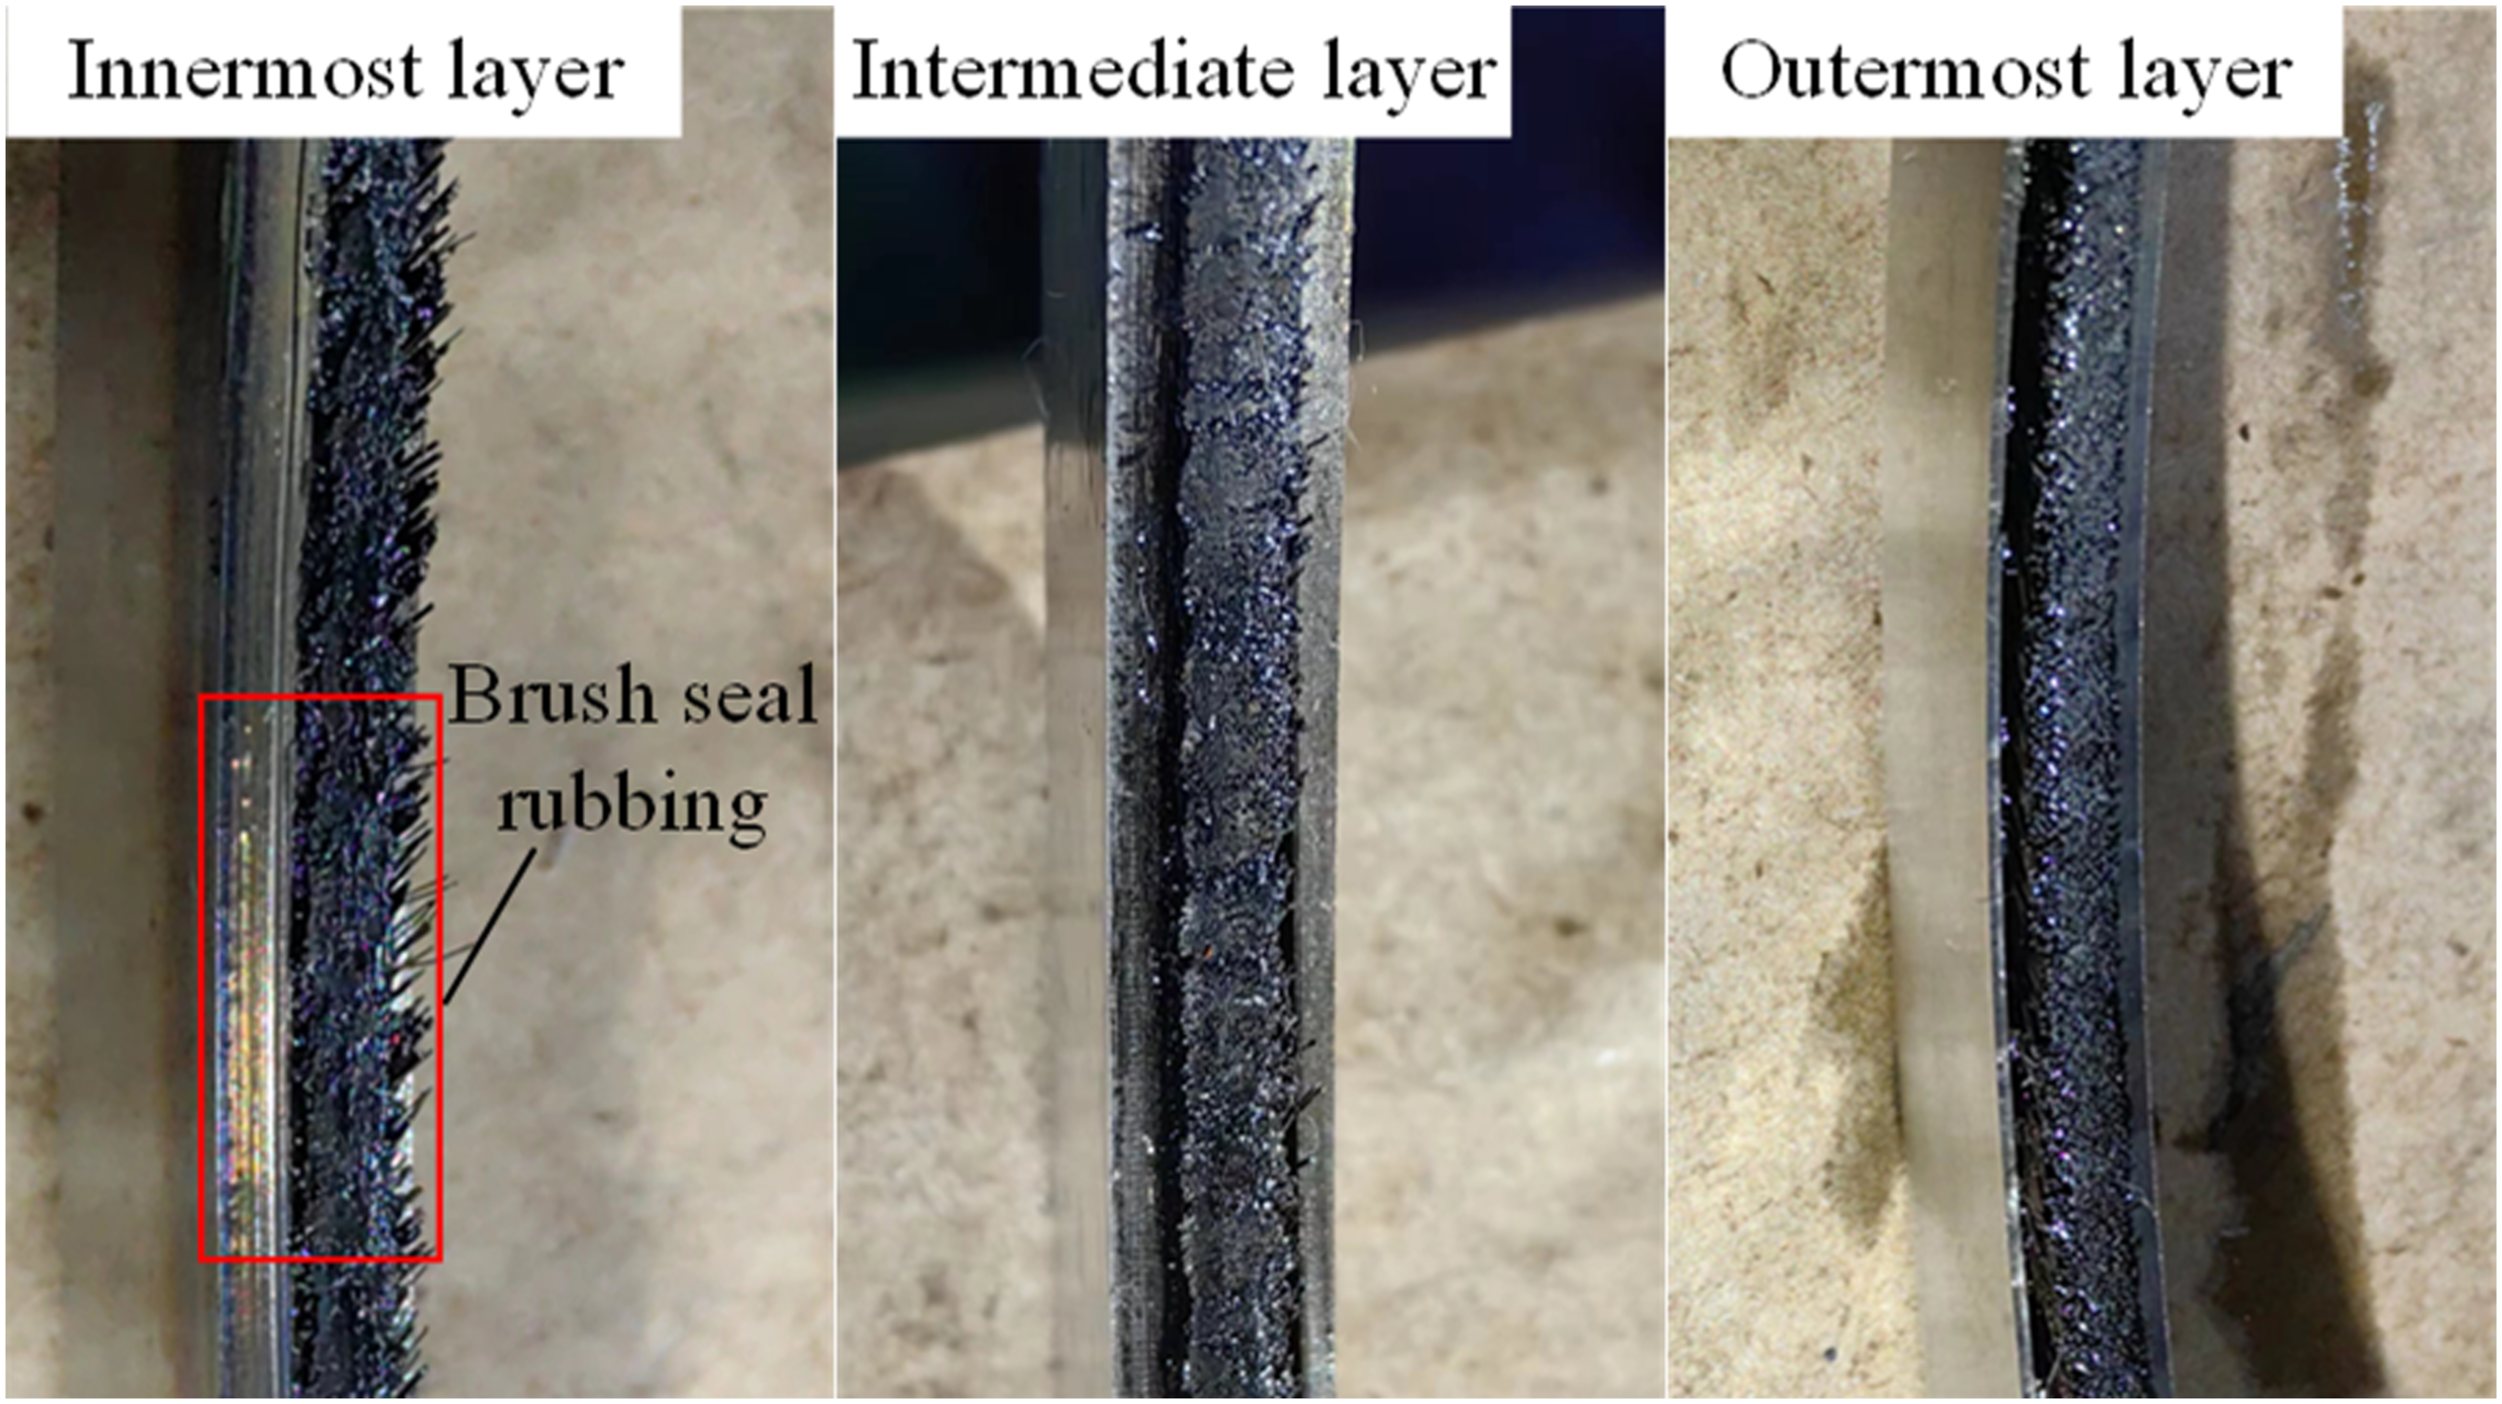
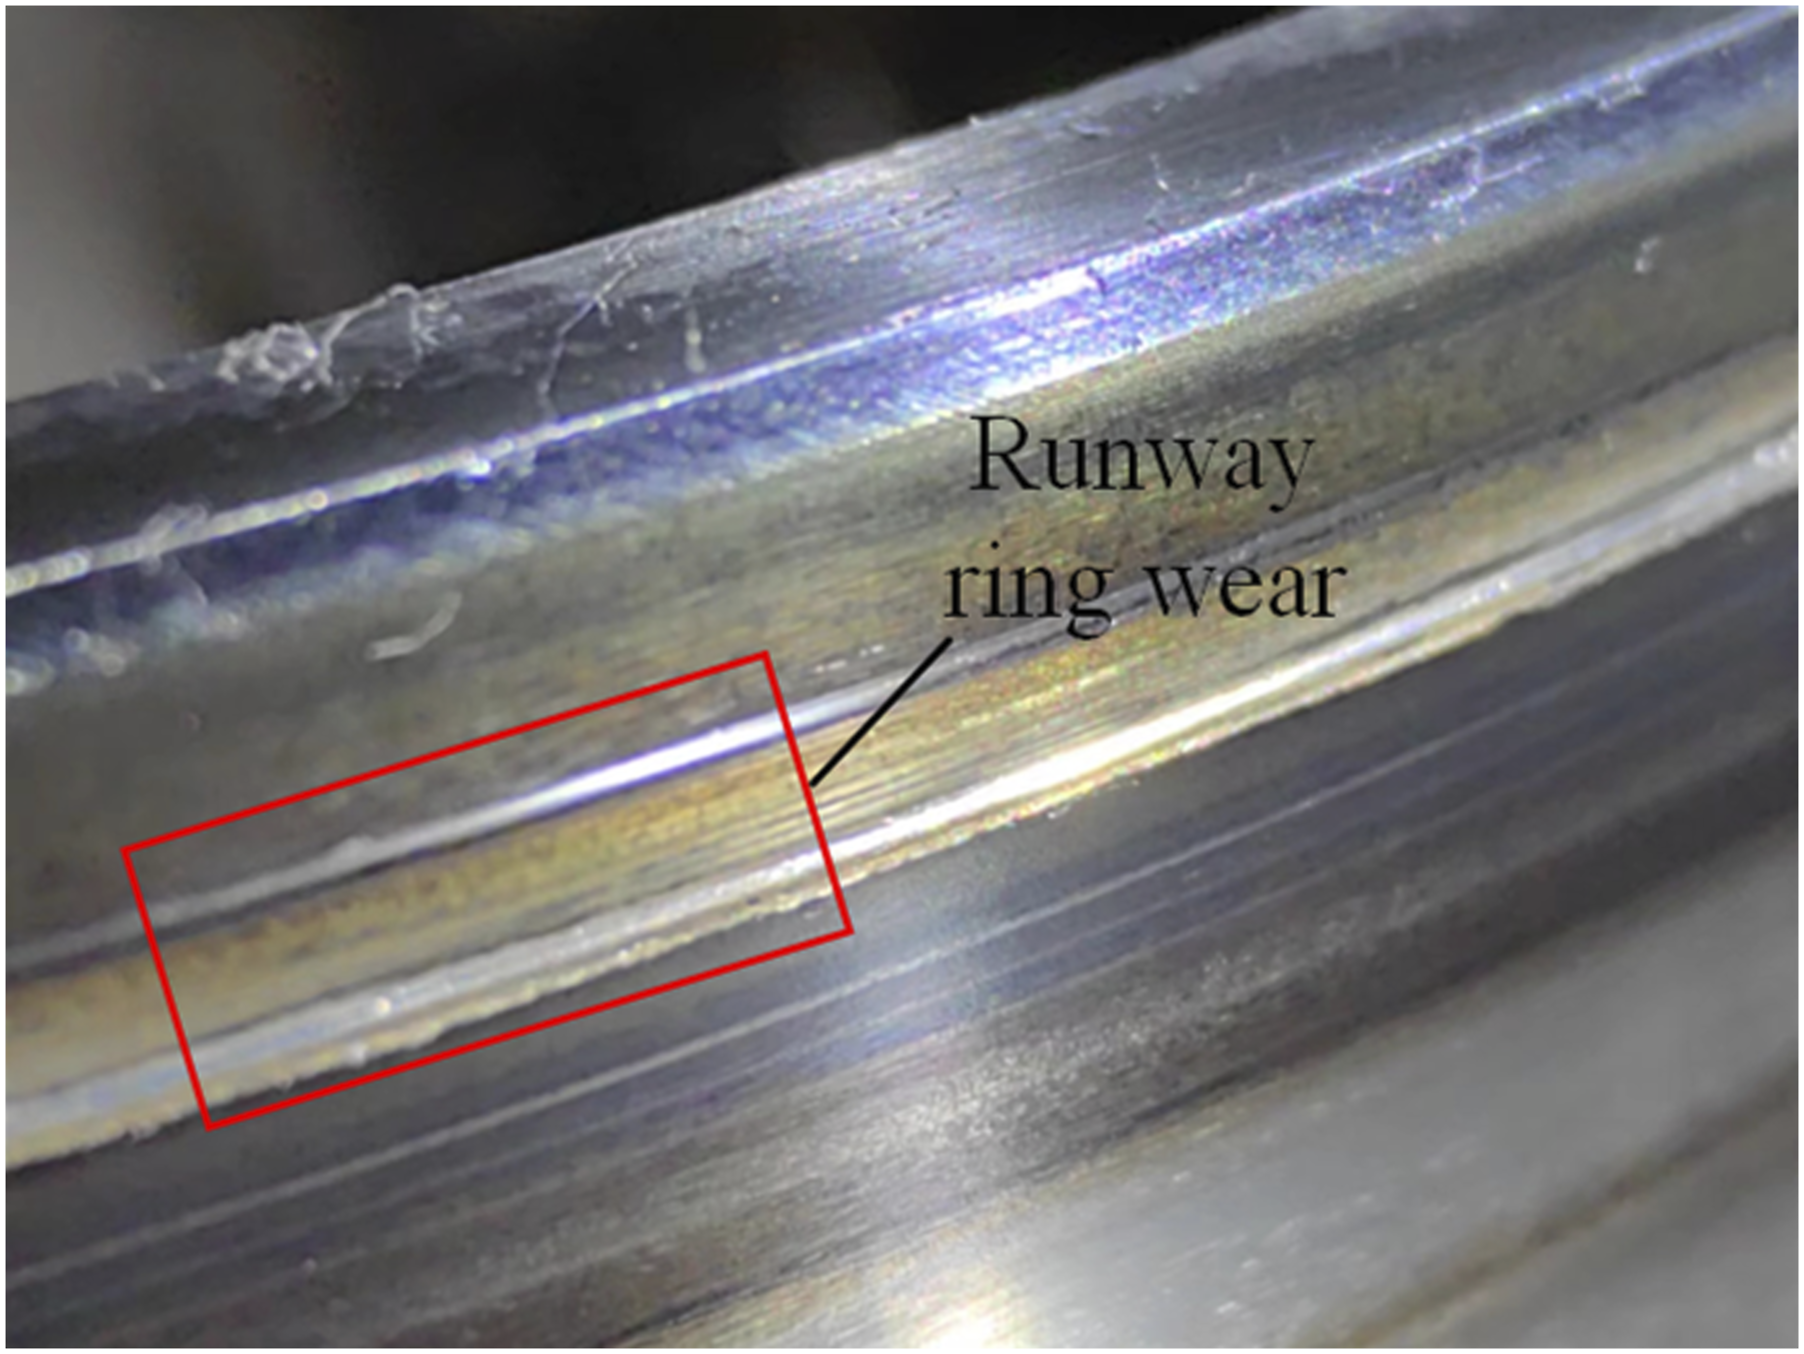
It can be seen from Figures 6 and 7 that the innermost layer brush bundle of the three-stage brush seal has been severely worn due to rubbing, and its back plate has turned blue due to high temperature, while the intermediate layer and the outermost layer brush seals have a relatively small degree of rubbing. On the runway ring of the turbine, a groove of about 0.25 mm is also worn out, which exceeds the thickness of the wear-resistant coating on the runway ring. In addition, the disassembly of the engine determines that the location of the rotor-three-stage brush seal rubbing fault is between section 3 and section 4 of the casing vibration measuring points, and other than that, no other types of faults occur in the entire engine.
Combined with the changing rules of the high- and low-pressure rotors speed and vibration time-domain signals shown in Figure 5, as well as the results of the above disassembly inspection, it is determined that the cause of the engine fault in this time may be due to the increase in high-pressure rotor speed, which causes the increase in rotating shaft vibration displacement, resulting in local rubbing between the rotor and the three-stage brush seal, thereby causing a sharp rise in the temperature of the rubbing contact surface. In addition, under the effect of high temperature, the outer diameter of the turbine runway ring increases, and the distance between the brush seal plate and the runway ring continuously decreases, which exacerbates the rubbing fault.
Analysis of fault vibration characteristics
By observing the time-domain diagrams of the vibration signals of the eight casing measuring points shown in Figure 5, it can be found that with the continuous increase of the high- and low-pressure rotors speed, when the high-pressure rotor speed N2 reaches 4000 r/min, the amplitude signals of each measuring point have a significant upward trend compared with those of the low speeds. At 106 s, the time-domain vibration signals of the three measuring points V2, H3, and V3 all show step mutation phenomena. Among them, the amplitudes of V2 and V3 measuring points decrease in a cliff like manner, while the amplitude of H3 measuring point increases significantly. When the high-pressure rotor speed stabilizes at around 5000 r/min and continues to run for a period of time, the amplitude of H3 measuring point continues to rise. In the range of 138–148 s, the amplitude of the H3 measuring point reaches the maximum value during the entire test run, and often exceeds the fault warning value of the casing amplitude of 25 mm/s, and the amplitude of the H3 measuring point is significantly higher than that of the other measuring points during this time period.
Aiming at the problem of signal step and excessive amplitude of vibration signals at multiple measuring points during the above test run, in order to analyze the frequency characteristics of fault vibration signals at different section measuring points of the engine from the frequency-domain perspective, based on Fast Fourier Transform (FFT), the three-dimensional waterfall diagrams of the four section measuring points on the casing as well as the planar color maps of the section 3 and section 4 are drawn, respectively, as shown in Figures 8–11. Waterfall diagrams of vibration signals from two measuring points in section 1. (a) H1 horizontal measuring point, and (b) V1 vertical measuring point. Waterfall diagrams of vibration signals from two measuring points in section 2. (a) H2 horizontal measuring point, and (b) V2 vertical measuring point. Waterfall diagrams and color maps of vibration signals from two measuring points in section 3. (a) Waterfall diagram of H3 measuring point, (b) color map of H3 measuring point, (c) waterfall diagram of V3 measuring point, and (d) color map of V3 measuring point. Waterfall diagrams and color maps of vibration signals from two measuring points in section 4. (a) Waterfall diagram of H4 measuring point, (b) color map of H4 measuring point, (c) waterfall diagram of V4 measuring point, and (d) color map of V4 measuring point.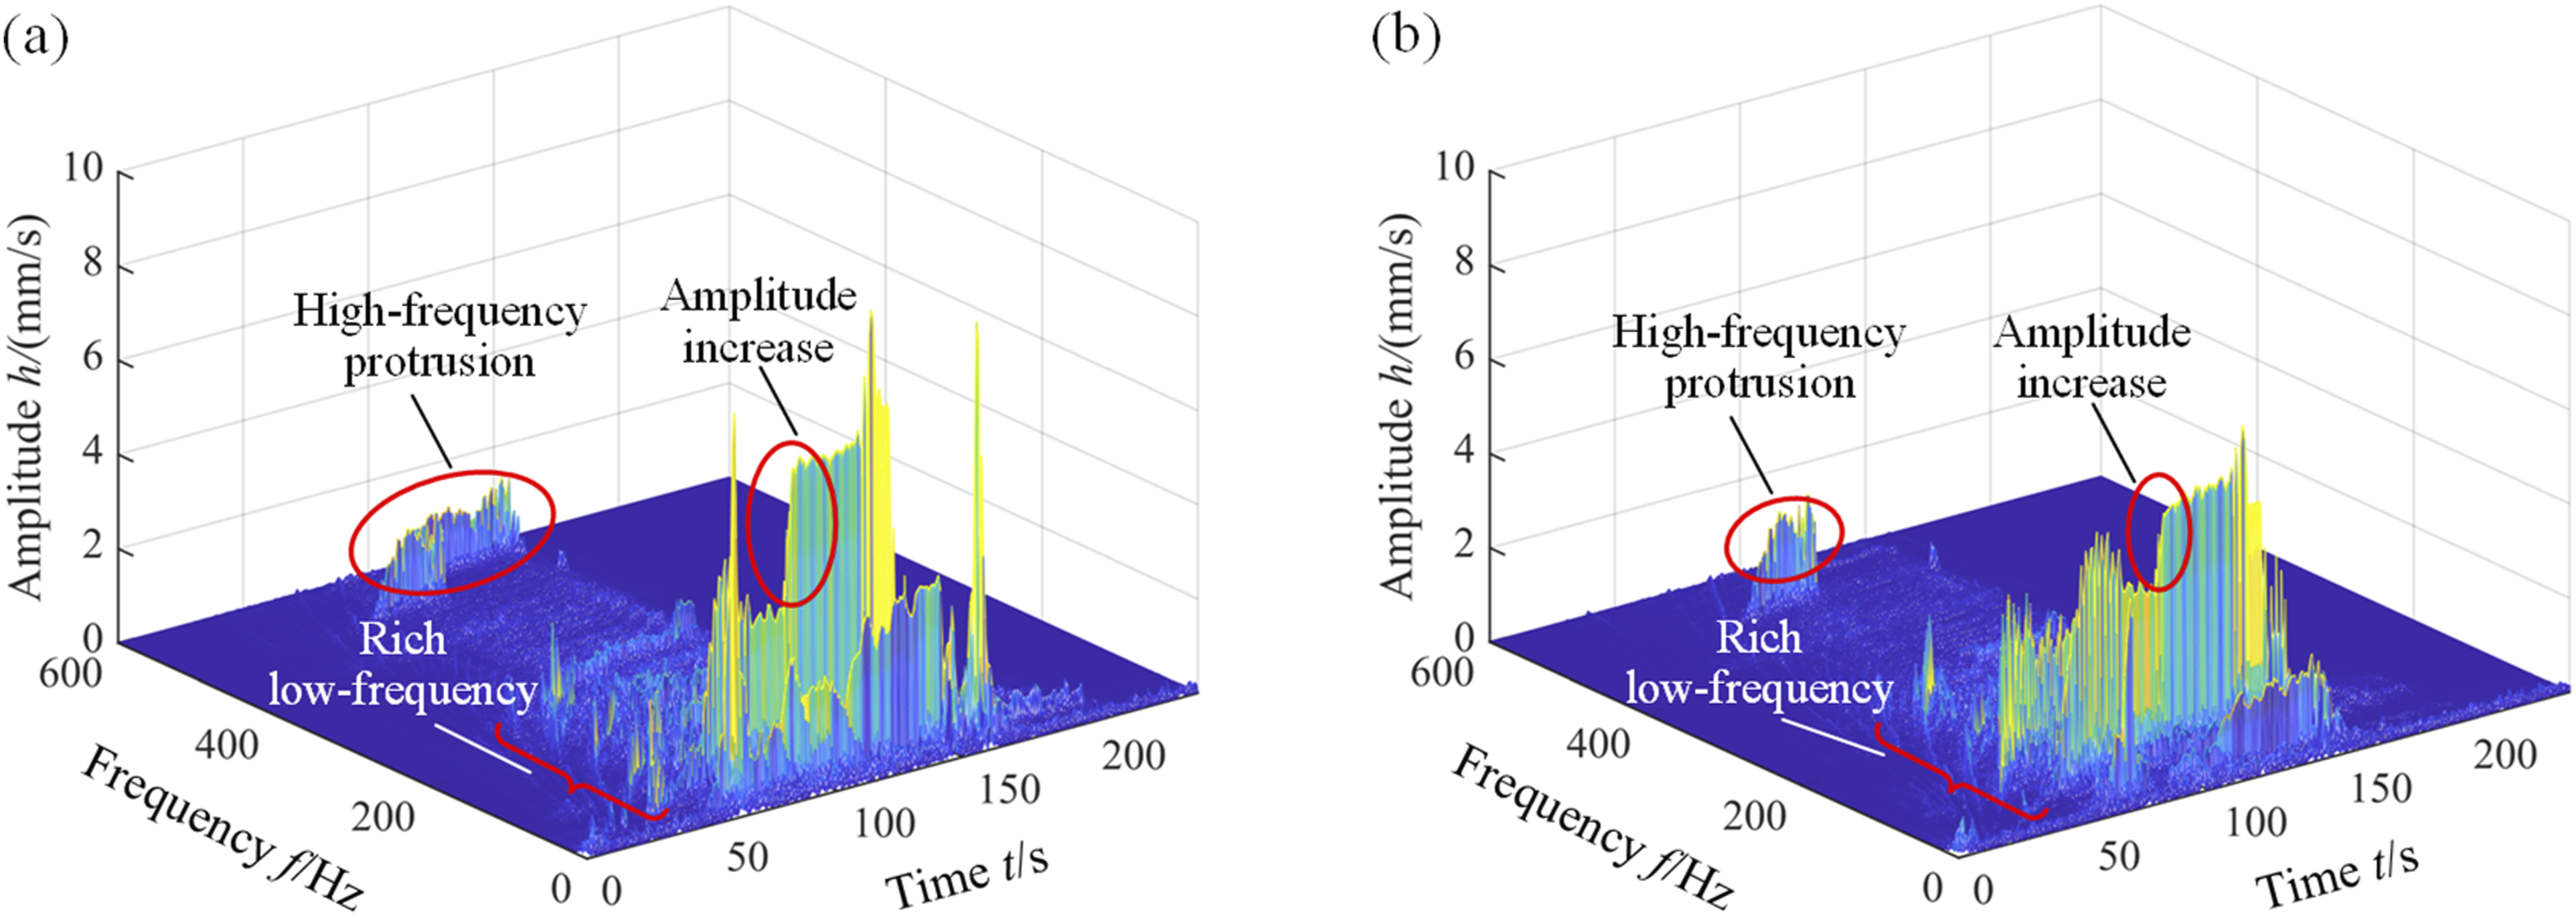
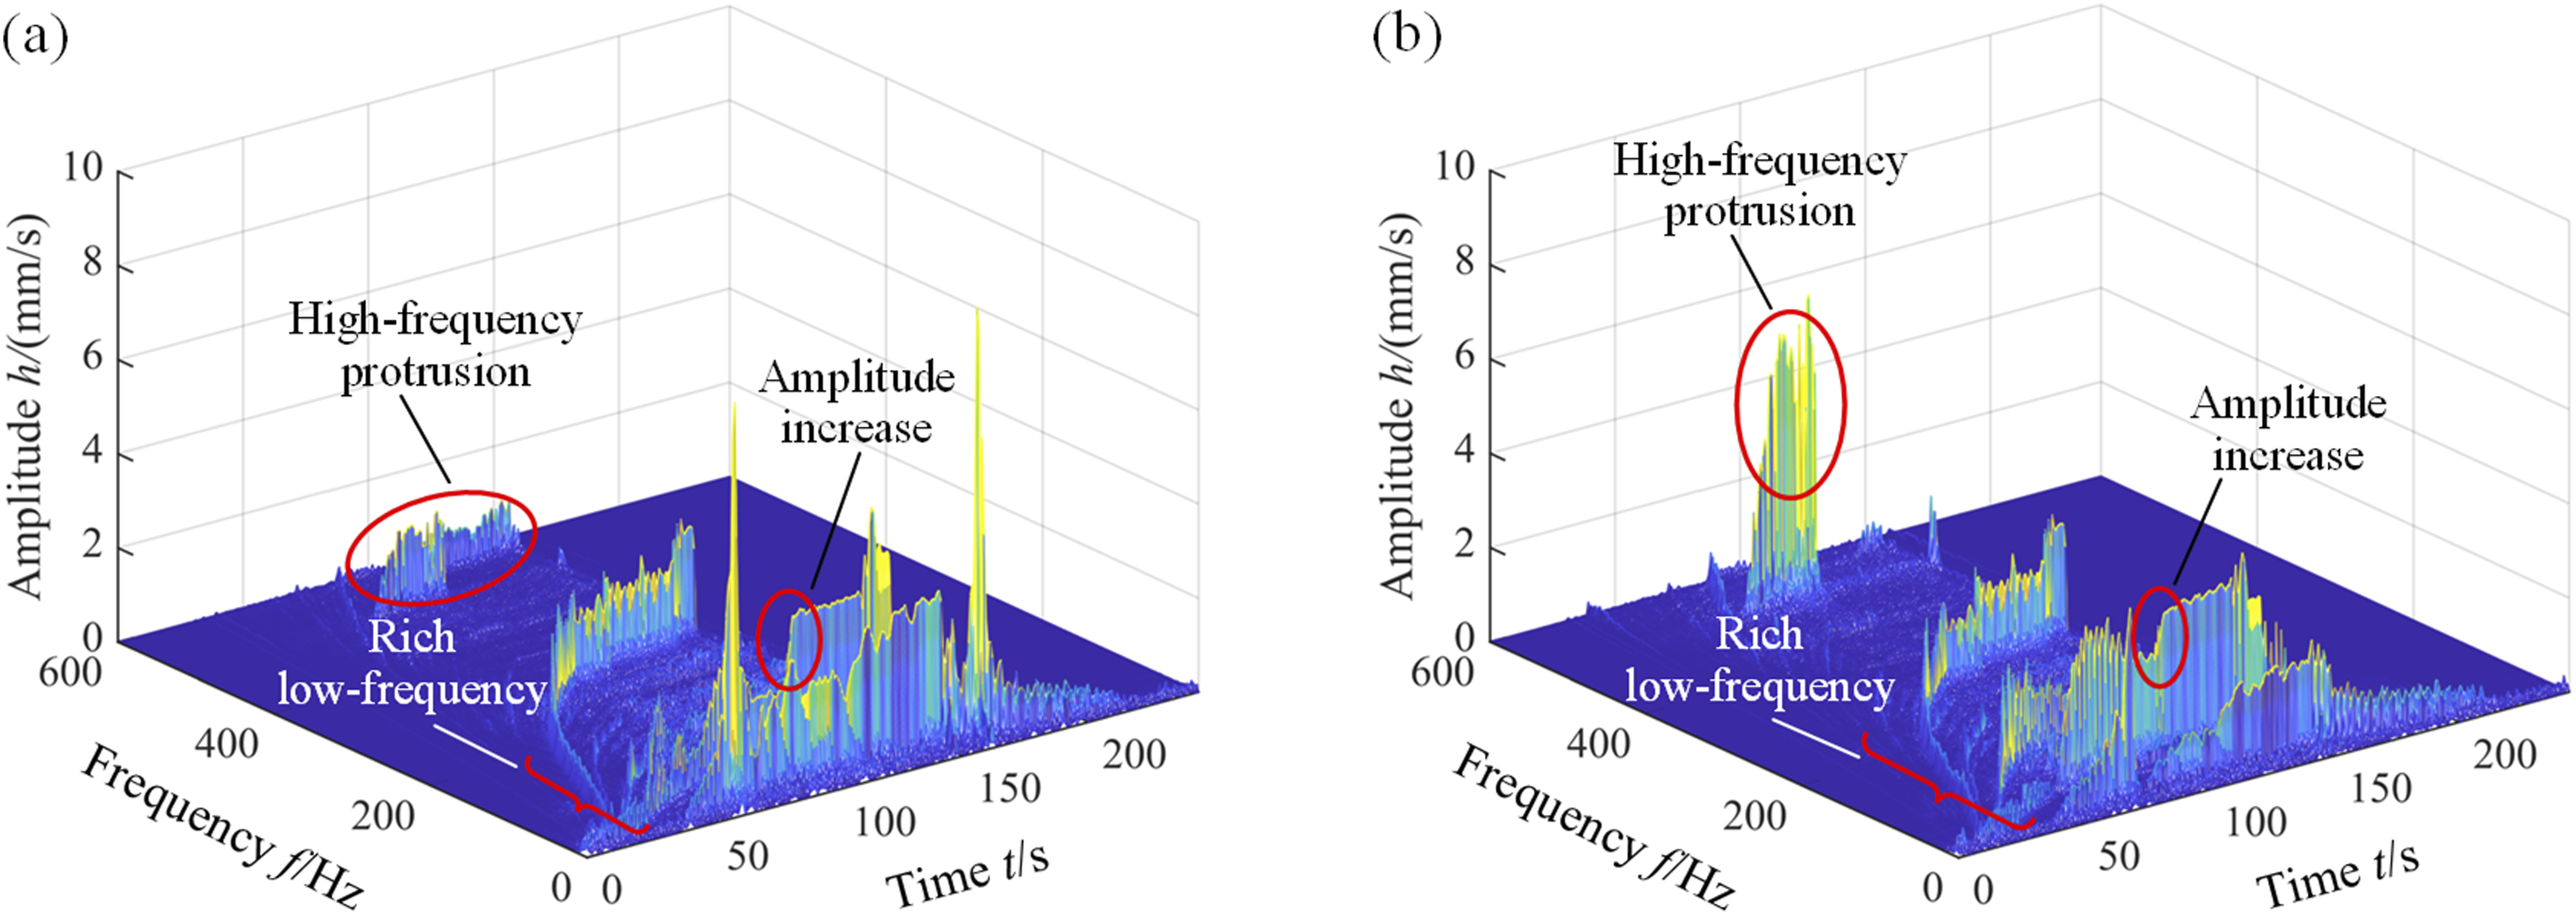
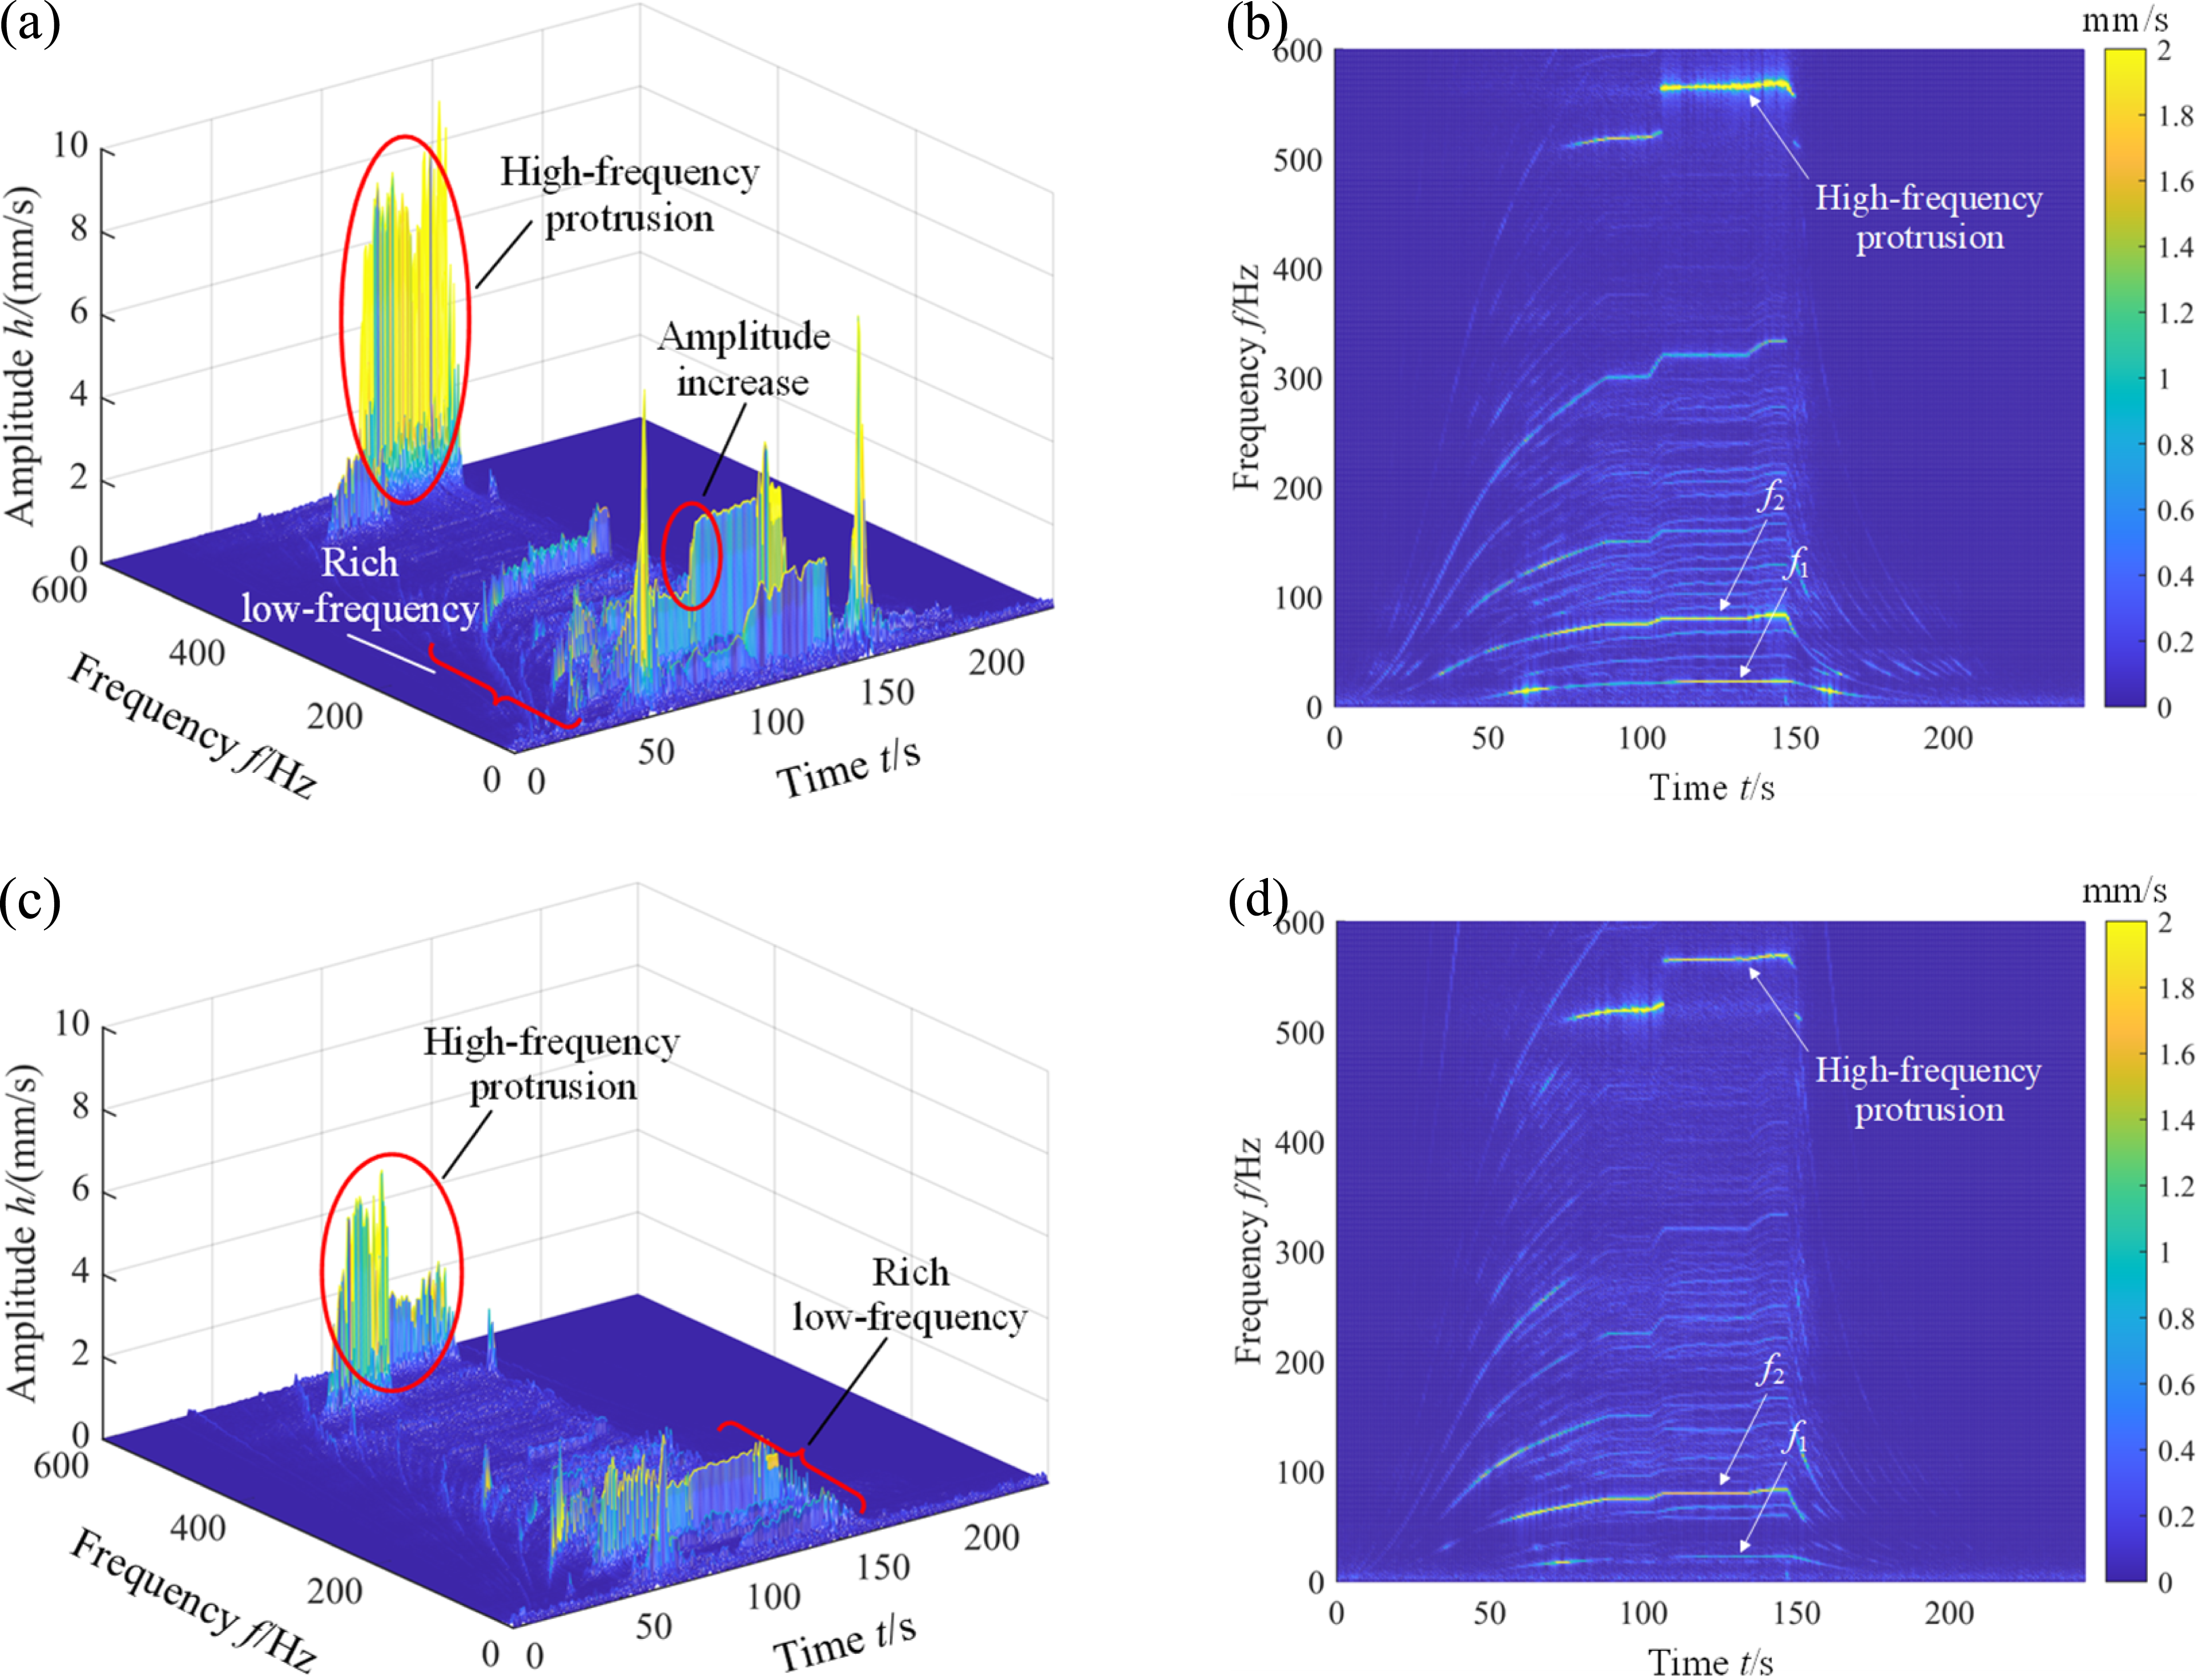
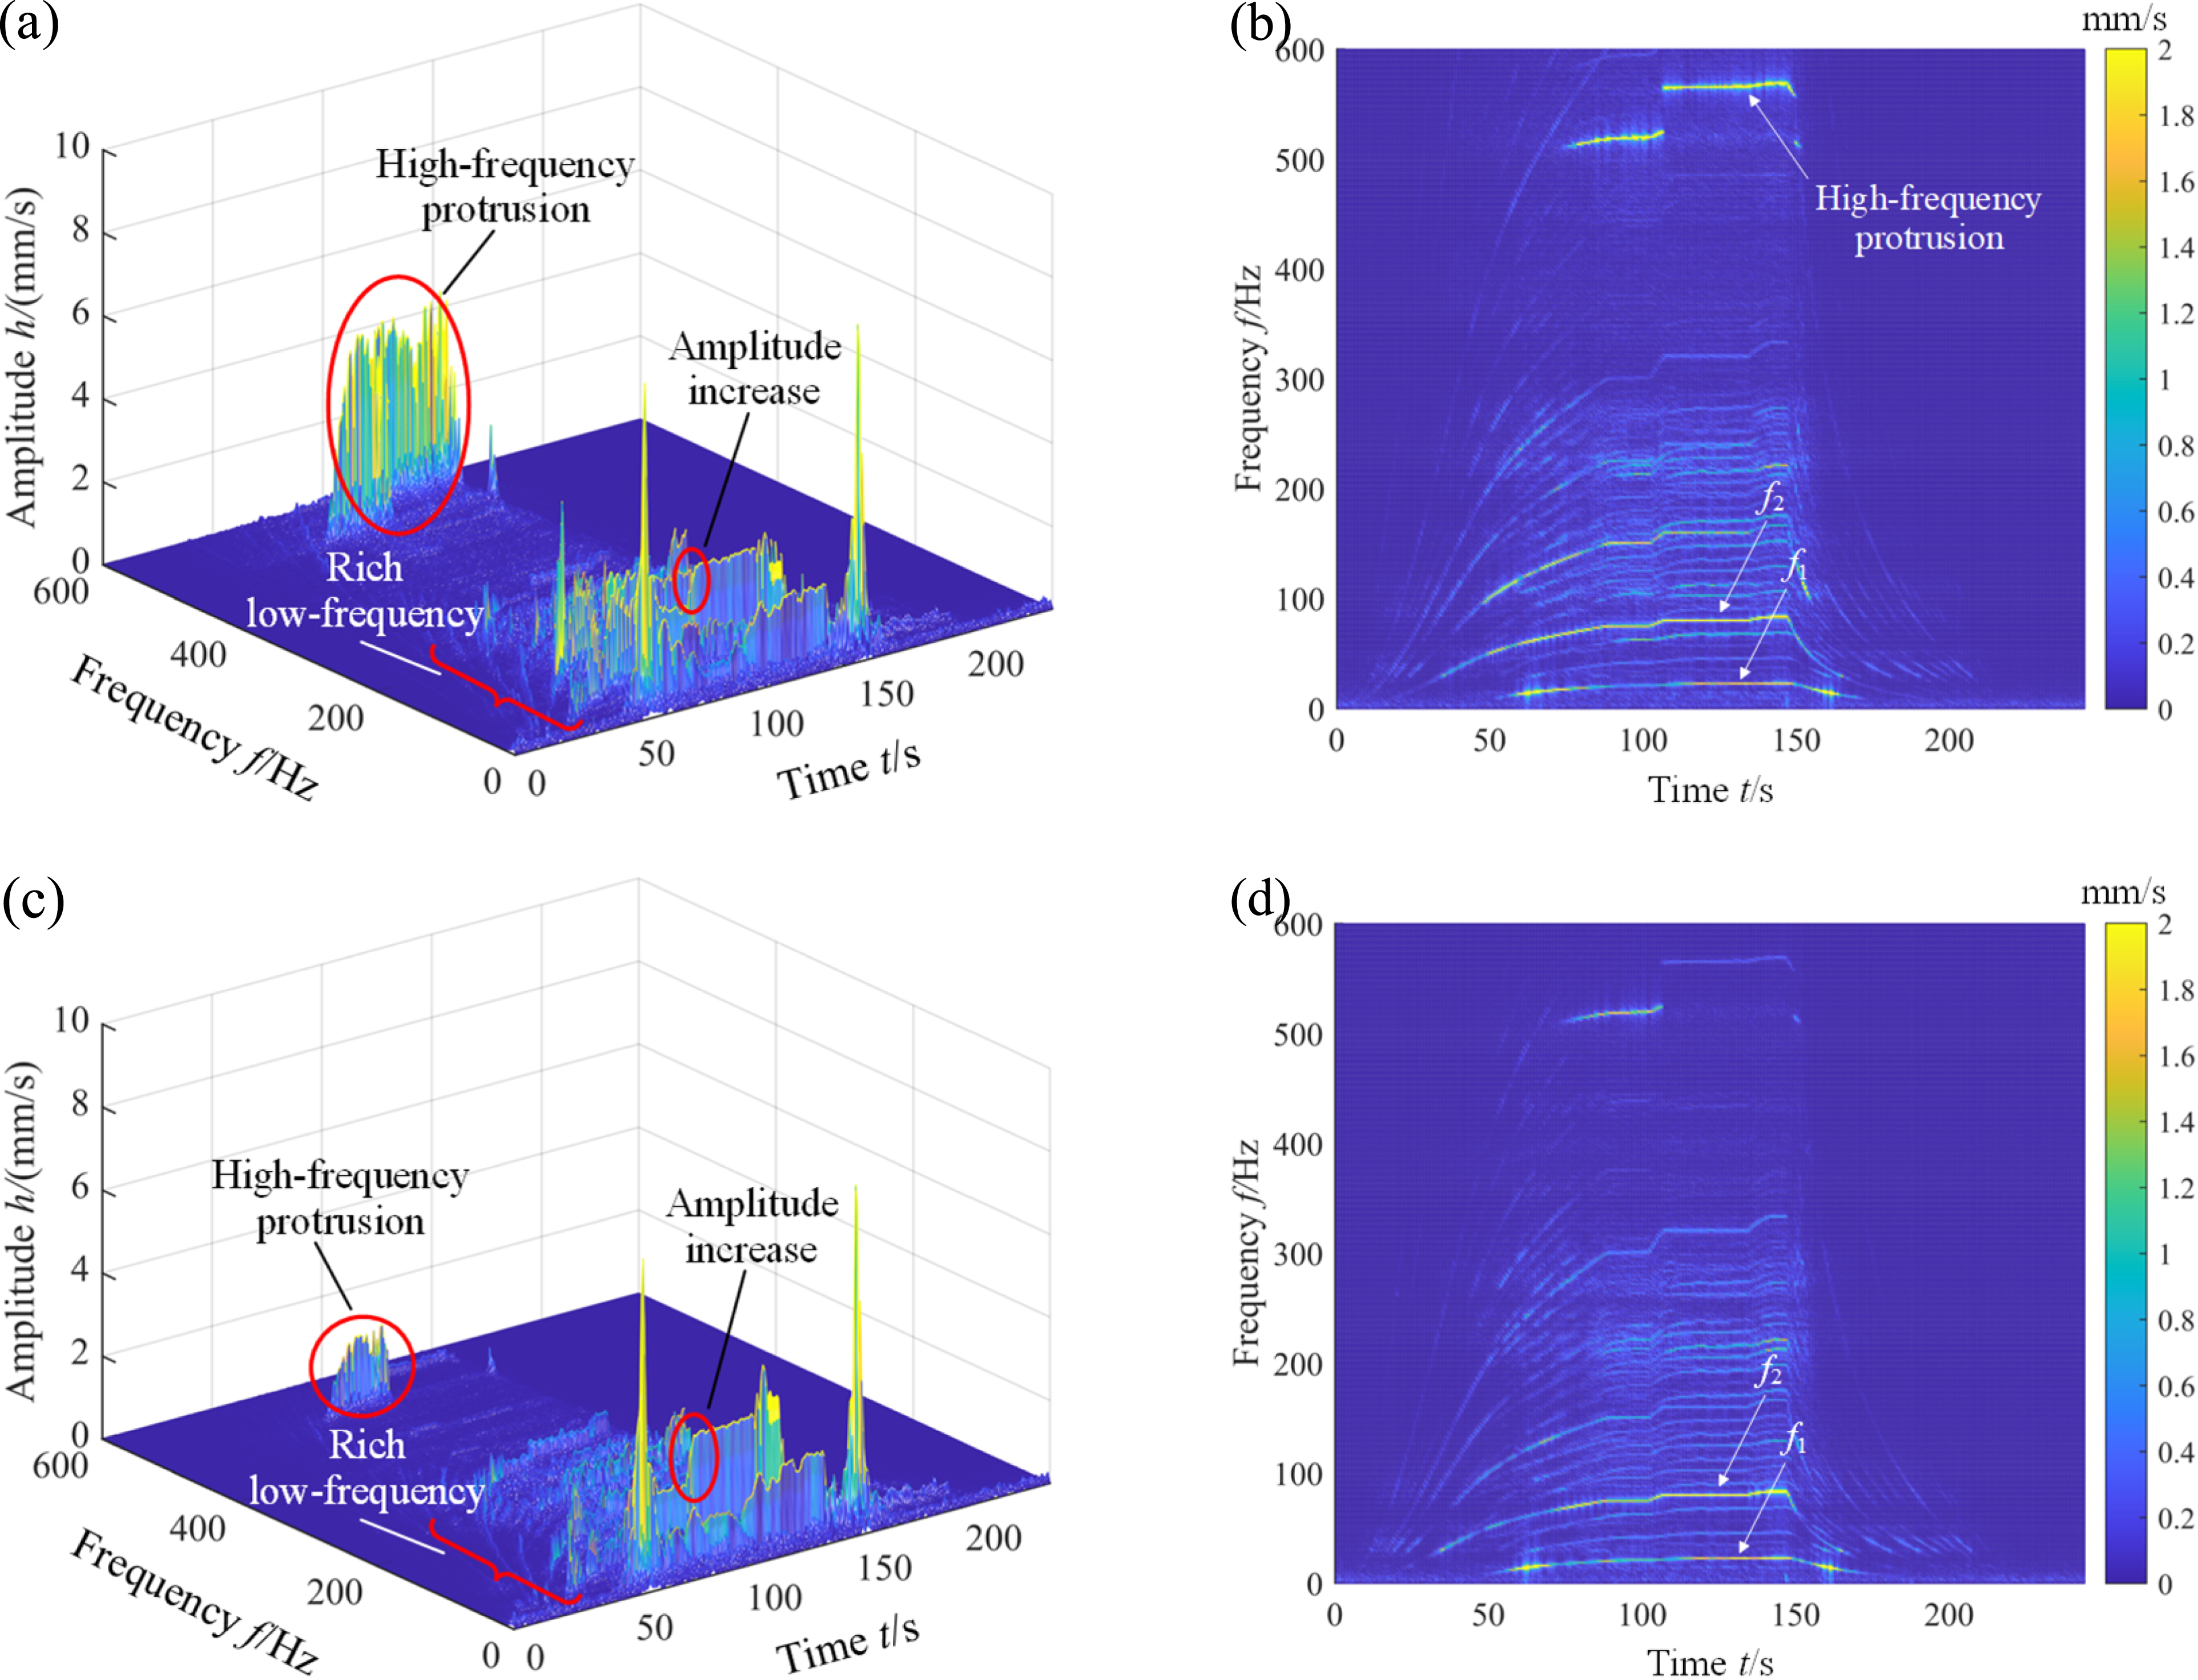
By comparing the vibration signal waterfall diagrams and color maps of each section measuring point, and combining the spectral characteristics of high and low-pressure dual-rotor aero-engine.31,32 In the high-frequency part, high-frequency vibration characteristics with different amplitudes appear at each cross-section measuring point on the casing, and the vibration frequency is mainly concentrated near 568.8 Hz. In the waterfall diagrams and color maps of the horizontal and vertical measuring points in section 3, there is relatively obvious high-frequency abnormal vibration, and the H3 measuring point is the most significant. In section 2 and section 4, only a part of measuring points have obvious high-frequency vibrations, while the high-frequency vibration amplitudes of the two measuring points in section 1 are relatively small. In addition, the high-frequency vibration generation time in the waterfall diagram of each measuring point is around 106 s, which is consistent with the generation time of the vibration step signal in the time-domain diagrams of three measuring points V2, H3, and V3, so the time-domain signal step segment is the start time of the engine fault. The high-frequency vibration peaks of each measuring point generally occurs at 147.51 s, and at this time, the amplitude of the H3 and other measuring points in the time-domain diagrams have also reached the fault warning value, so the maximum amplitude segment of the time-domain signal is the period of serious engine fault.
It is worth noting that abnormal steps in the time-domain signal are often accompanied by engine faults, while engine fault characteristics are not necessarily reflected in sudden changes in the time-domain signal, and useful fault vibration characteristics may be submerged in the time-domain signal. For example, the time-domain diagrams of H1, V1, H2, H4, and V4 measuring points show no signal step phenomenon, but high-frequency fault characteristics with small amplitudes are shown in the frequency-domain analysis.
In the low-frequency part, when the high-pressure rotor speed reaches 4000 r/min, the waterfall diagrams of each measuring point of the casing begin to show low-order harmonics with different amplitudes, and their frequency components become rich in the range of 0∼200 Hz. Here, the generation of harmonics is primarily the result of the combined effects of nonlinear factors and changes in the dynamic characteristics of the system (such as stiffness and damping parameters). After a step in the vibration signal at 106 s, the system adds additional rubbing force at the rubbing contact surface, which stimulates the nonlinear vibration of the system, causing a significant increase in the amplitude of the high-pressure fundamental frequency at each measuring point of the casing, even reaching twice the amplitude before the fault, and the amplitude continues until about 138 s. In addition, similar to the high-frequency vibration characteristics, the low-order harmonic component reaches a peak at 147.51 s, and then due to the simultaneous decrease of the high- and low-pressure speeds until the final stop, the low-frequency component does not appear again in the waterfall diagram of each measuring point.
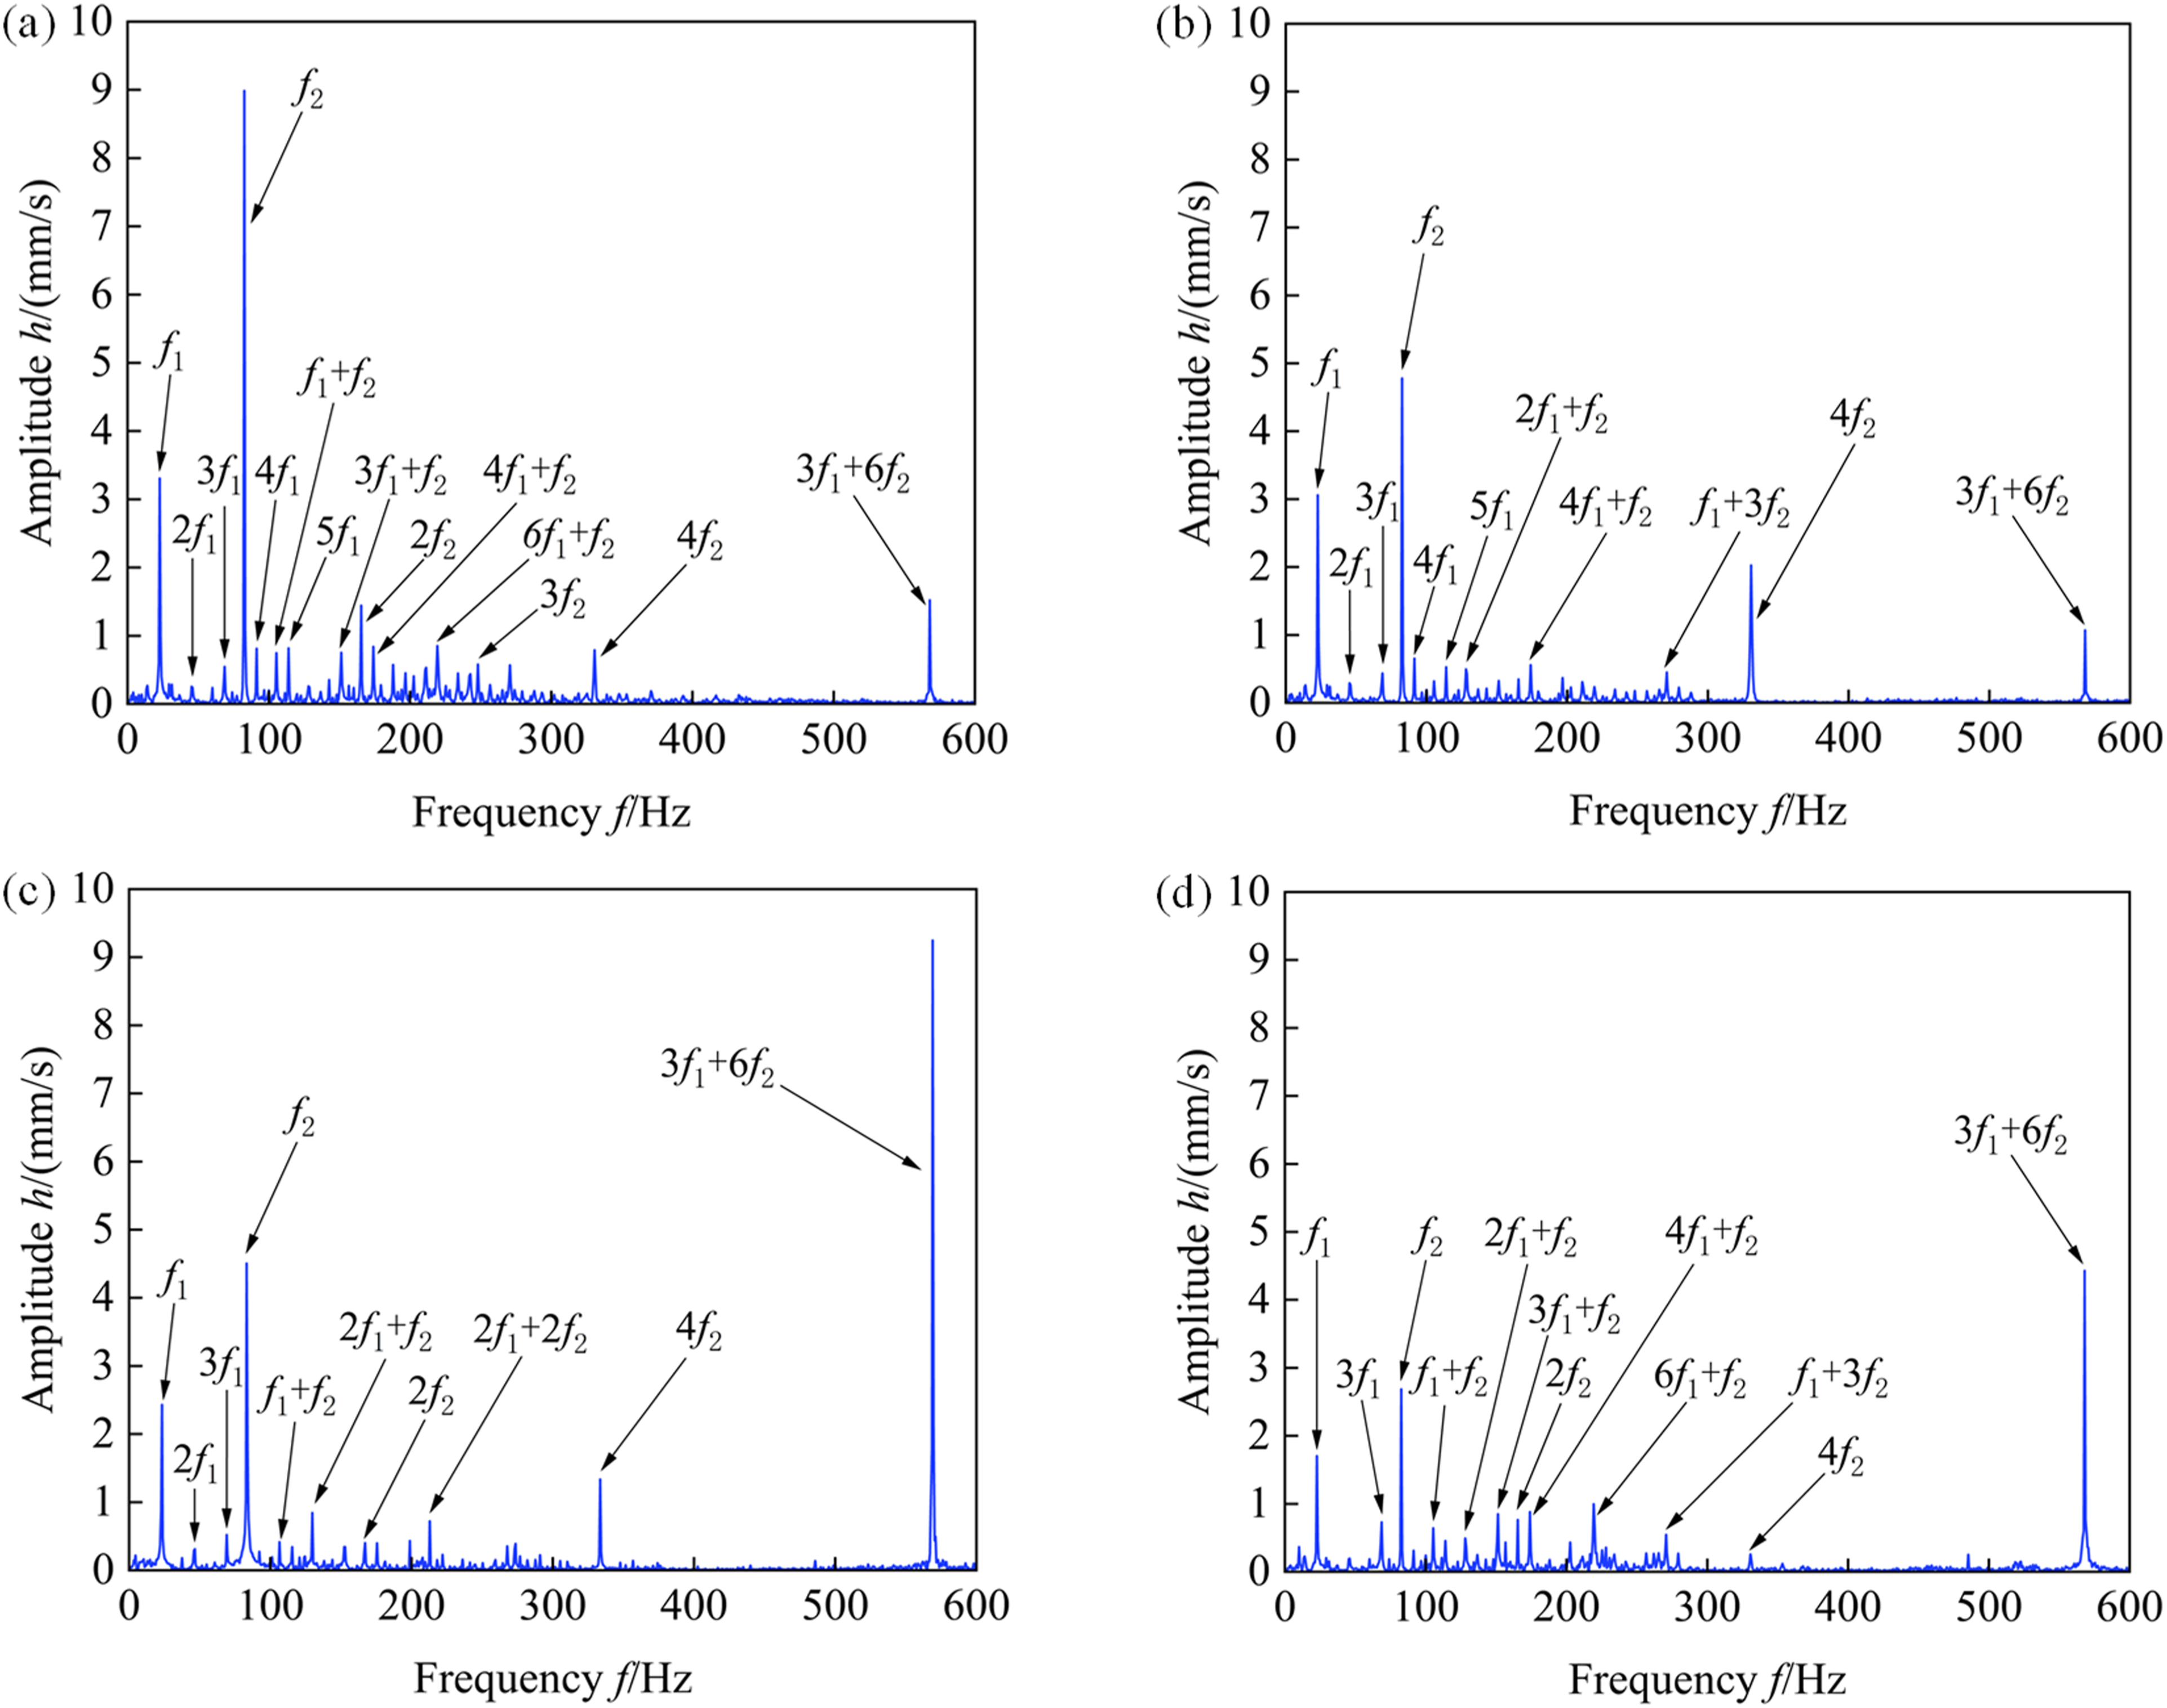
In order to analyze the frequency characteristics before and after the engine fault more specifically, four horizontal measuring points H1, H2, H3, and H4 with obvious vibration characteristics are taken as examples for analysis. Combined with the vibration time-domain diagrams, small time units are taken for the beginning of the engine fault and the serious section of the fault, respectively, and frequency-domain spectrum analysis is performed based on the FFT method. Figures 12 and 13 show the vibration spectrum diagrams of the four horizontal measuring points at the beginning of the fault and when the fault is severe respectively. Vibration spectrum diagrams of four horizontal measuring points at the beginning of fault. (a) H1 measuring point, (b) H2 measuring point, (c) H3 measuring point, and (d) H4 measuring point. Vibration spectrum diagrams of four horizontal measuring points with severe fault. (a) H1 measuring point, (b) H2 measuring point, (c) H3 measuring point, and (d) H4 measuring point.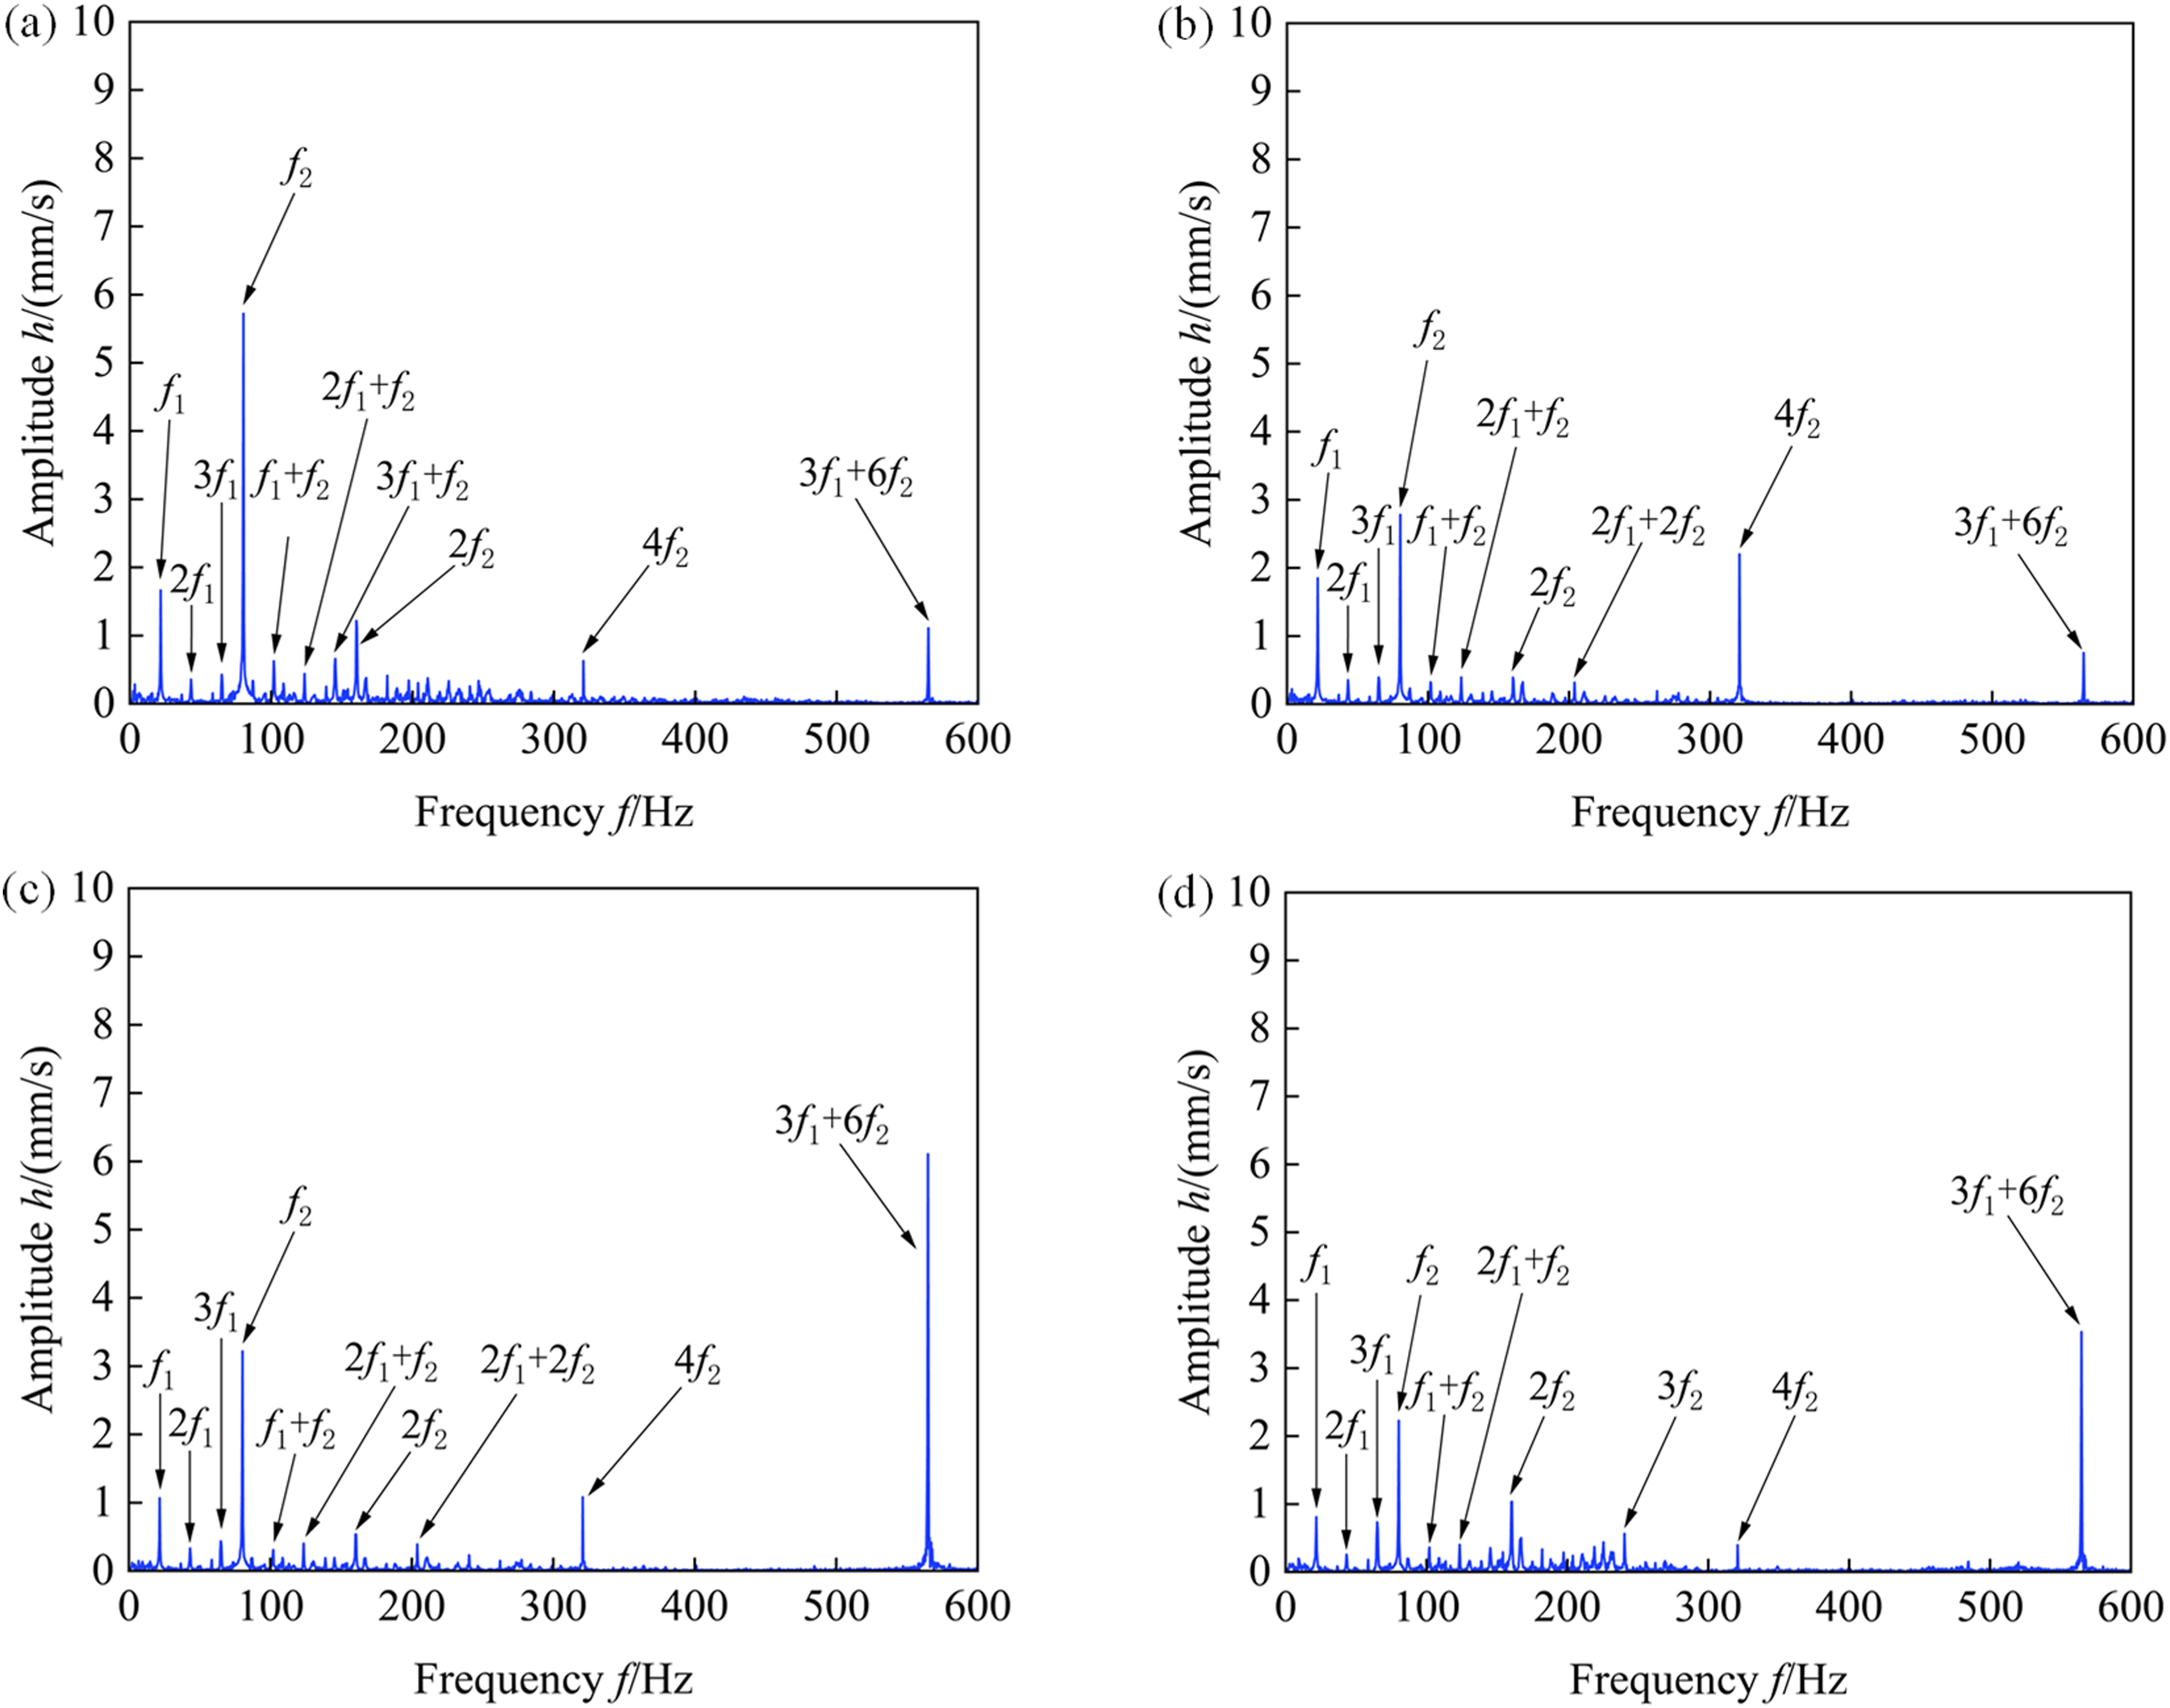
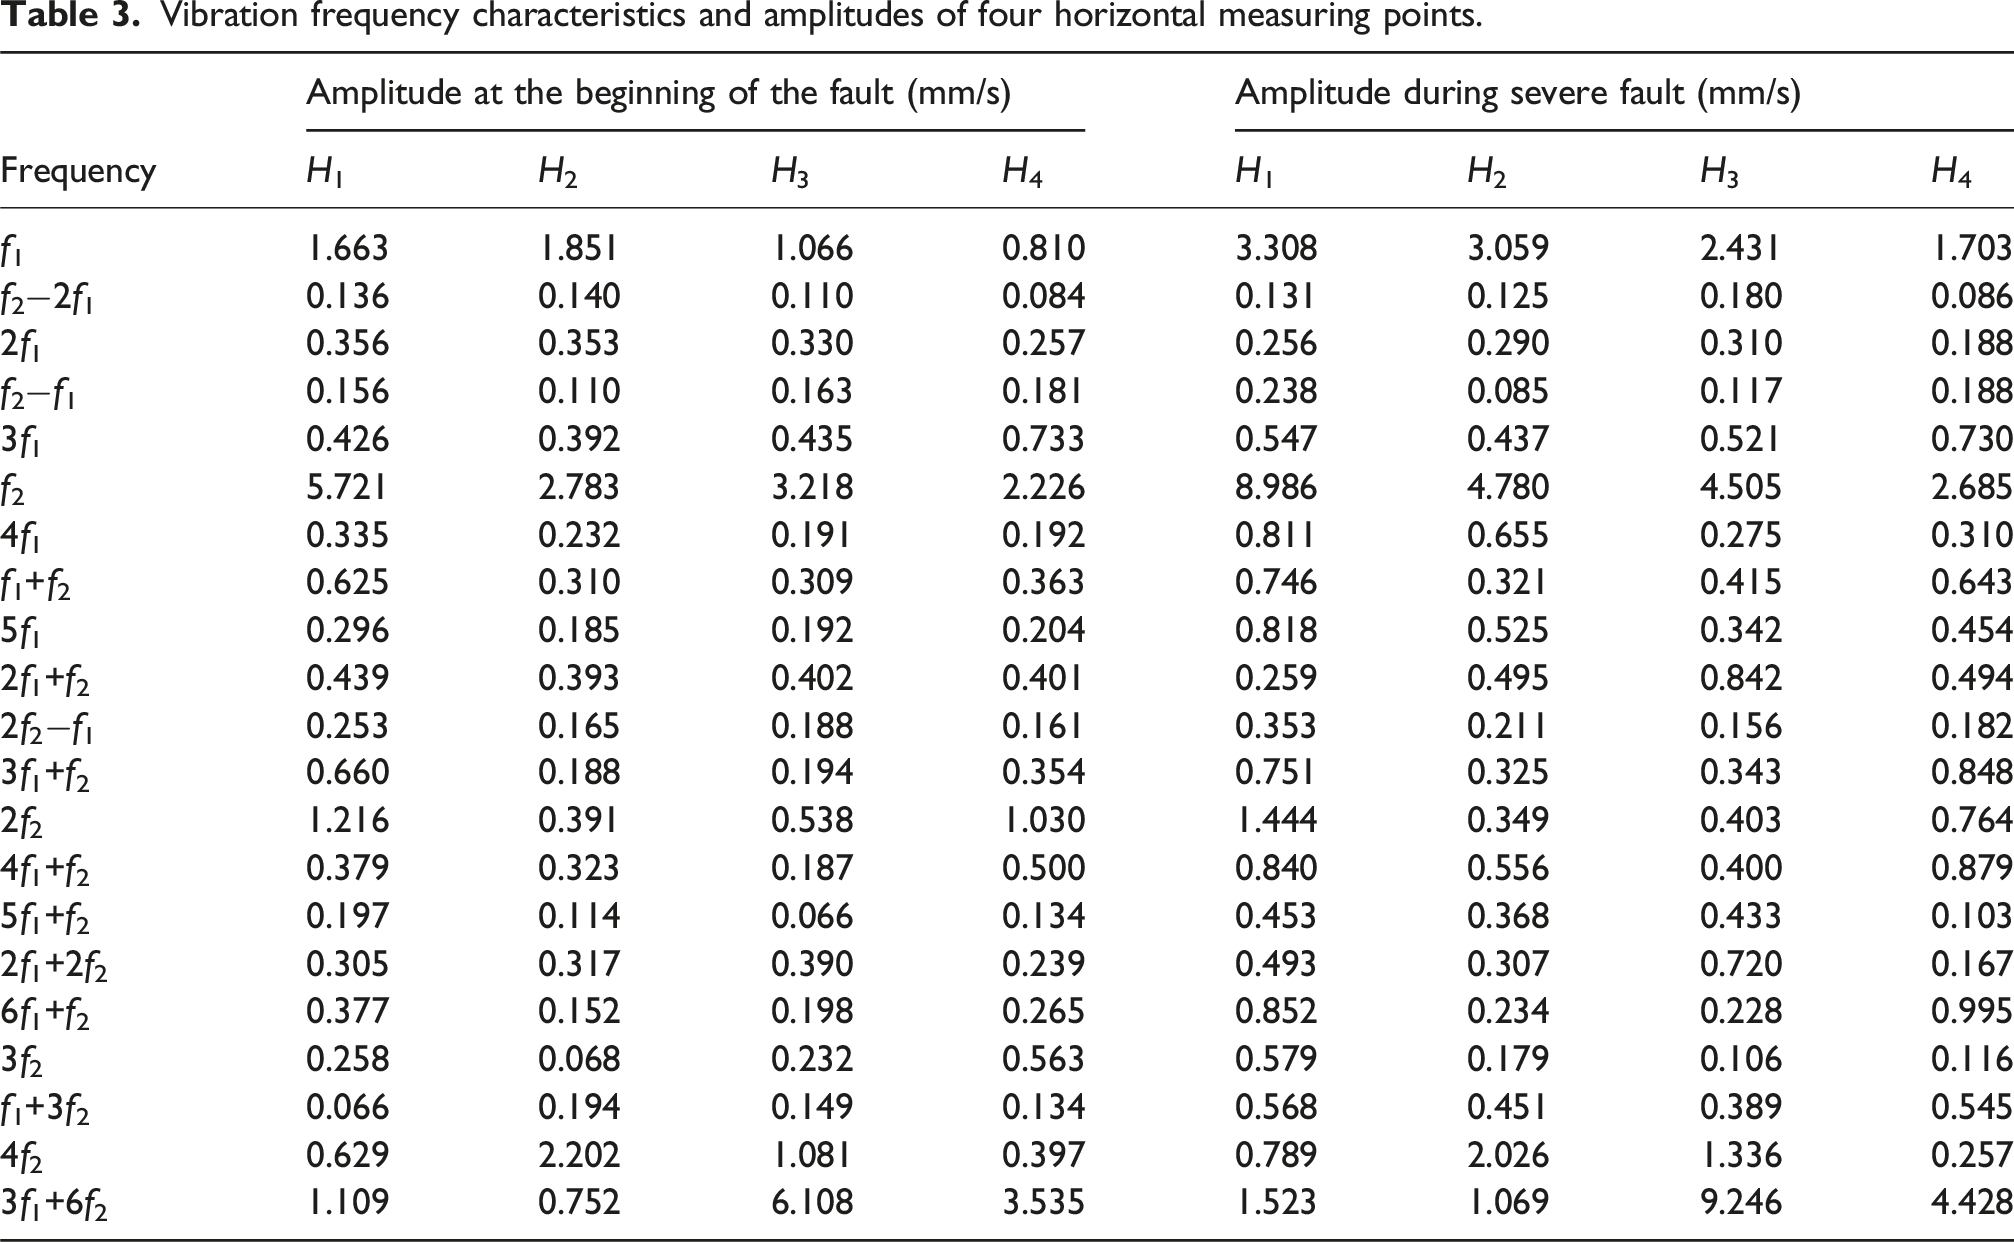
In the engine starting fault spectrum diagram shown in Figure 12, the frequency components of each measuring point are analyzed and labeled separately based on the principle of minimizing the percentage error between the frequency theoretical calculation value and the spectrum value. In the low-frequency part, the low and high-pressure rotors fundamental frequencies f1 and f2 of each measuring point (f1 is the low-pressure speed frequency, f2 is the high-pressure speed frequency) are relatively prominent, and the fundamental frequency amplitude of the H1 measuring point is relatively large, while the H4 measuring point is the smallest. In addition to the rotor fundamental frequency, a large number of low- and high-pressure rotors doubling frequencies k1f1, k2f2, and combined frequency k1f1+k2f2 appear at each measuring point. Among them, the amplitudes of frequency components such as 2f1, 3f1, 2f1+f2, 2f2, and 4f2 are relatively large, while the amplitudes of the difference between high-pressure and low-pressure doubling frequencies such as f2-2f1, f2-f1, and 2f2-f1 are generally small. In the high-frequency part, the combined frequency 3f1+6f2 component with varying amplitudes occurs at each horizontal measuring point, and the combined frequency amplitude of the H3 measuring point is the largest, reaching 6.108 mm/s, followed by H4 measuring point, while the amplitudes of H1 and H2 measuring points are relatively smallest. In addition, no other frequency components appear near the high-frequency 3f1+6f2 at each measuring point. Overall, when the engine fault occurs at the beginning, the low-frequency components of each measuring point are abundant, and the amplitudes of some doubling and combined frequencies are relatively large. Moreover, the high-frequency vibration characteristics of the H3 measuring point are the most significant.
In the spectrum diagram of the severe engine fault section shown in Figure 13, the low-frequency part is similar to the spectrum characteristics at the beginning of the engine fault, and each measuring point exhibits the characteristics of rich frequency components, including a large number of low- and high-pressure rotors doubling frequencies k1f1, k2f2, and combined frequency k1f1+k2f2, which is very similar to the fault characteristics of engine rotor-casing rubbing, 33 and turbine blade-outer ring rubbing. 34 This indicates that various types of rotor–stator rubbing faults in aero-engines have some similar vibration frequency characteristics. In addition, comparing Figures 12 and 13, it can be seen that the low- and high-pressure fundamental frequency and high-frequency amplitudes in the severe fault section of each measuring point are higher than the fault starting period, and the high-frequency amplitude of the H3 measuring point reaches the maximum value of 9.246 mm/s in the entire test process. It can be seen that the high-frequency vibration characteristic 3f1+6f2 directly reflects the type and location of the engine fault, and clarifying the relationship between the two is of great value for engine fault diagnosis.
Vibration frequency characteristics and amplitudes of four horizontal measuring points.
Fault comparative analysis
As can be seen from the previous paper, when the engine high-pressure speed N2 stabilizes in the range of 4000–5000 r/min and continues to operate, the engine successively undergoes the initial fault and severe fault periods. The low-frequency components in the spectrum diagrams of each measuring point are gradually enriched, and the amplitudes of the fundamental and high-frequency increase significantly. Based on this, in order to comparatively explore the impact of rotor speed on high-frequency vibration and engine fault, this paper uses the same counter-rotating engine before the fault occurs to compare and analyze its normal vibration data under the high-pressure speed of 3900 r/min, so as to clarify the causes of high-frequency abnormal protrusions and engine fault.
The total normal test run time of the engine this time is 270.15 s, during the period of 160 to 190 s, the engine high- and low-pressure speeds are 3900 and 1060 r/min, respectively, and the engine continues to run for 30 s. During the test run, the layout of the vibration measuring points of the engine casing, accelerometer model, and sampling rate are consistent with those in the previous paper.
Figure 14 shows the waterfall diagram and color map of the normal vibration signals of the engine H3 measuring point. Comparing Figure 10(a) with 14, it can be seen that for normal vibration signals, there is no high-frequency vibration feature in the waterfall diagram, and the high-frequency part is smooth and without burrs. In the low-frequency part, the frequency components of normal vibration signals are relatively simple, only a small number of interference frequencies near the fundamental frequency, but there are not a large number of doubling frequency and combined frequency components. Waterfall diagram and color map of vibration signals at H3 measuring point. (a) Waterfall diagram of vibration signals, and (b) color map of vibration signals.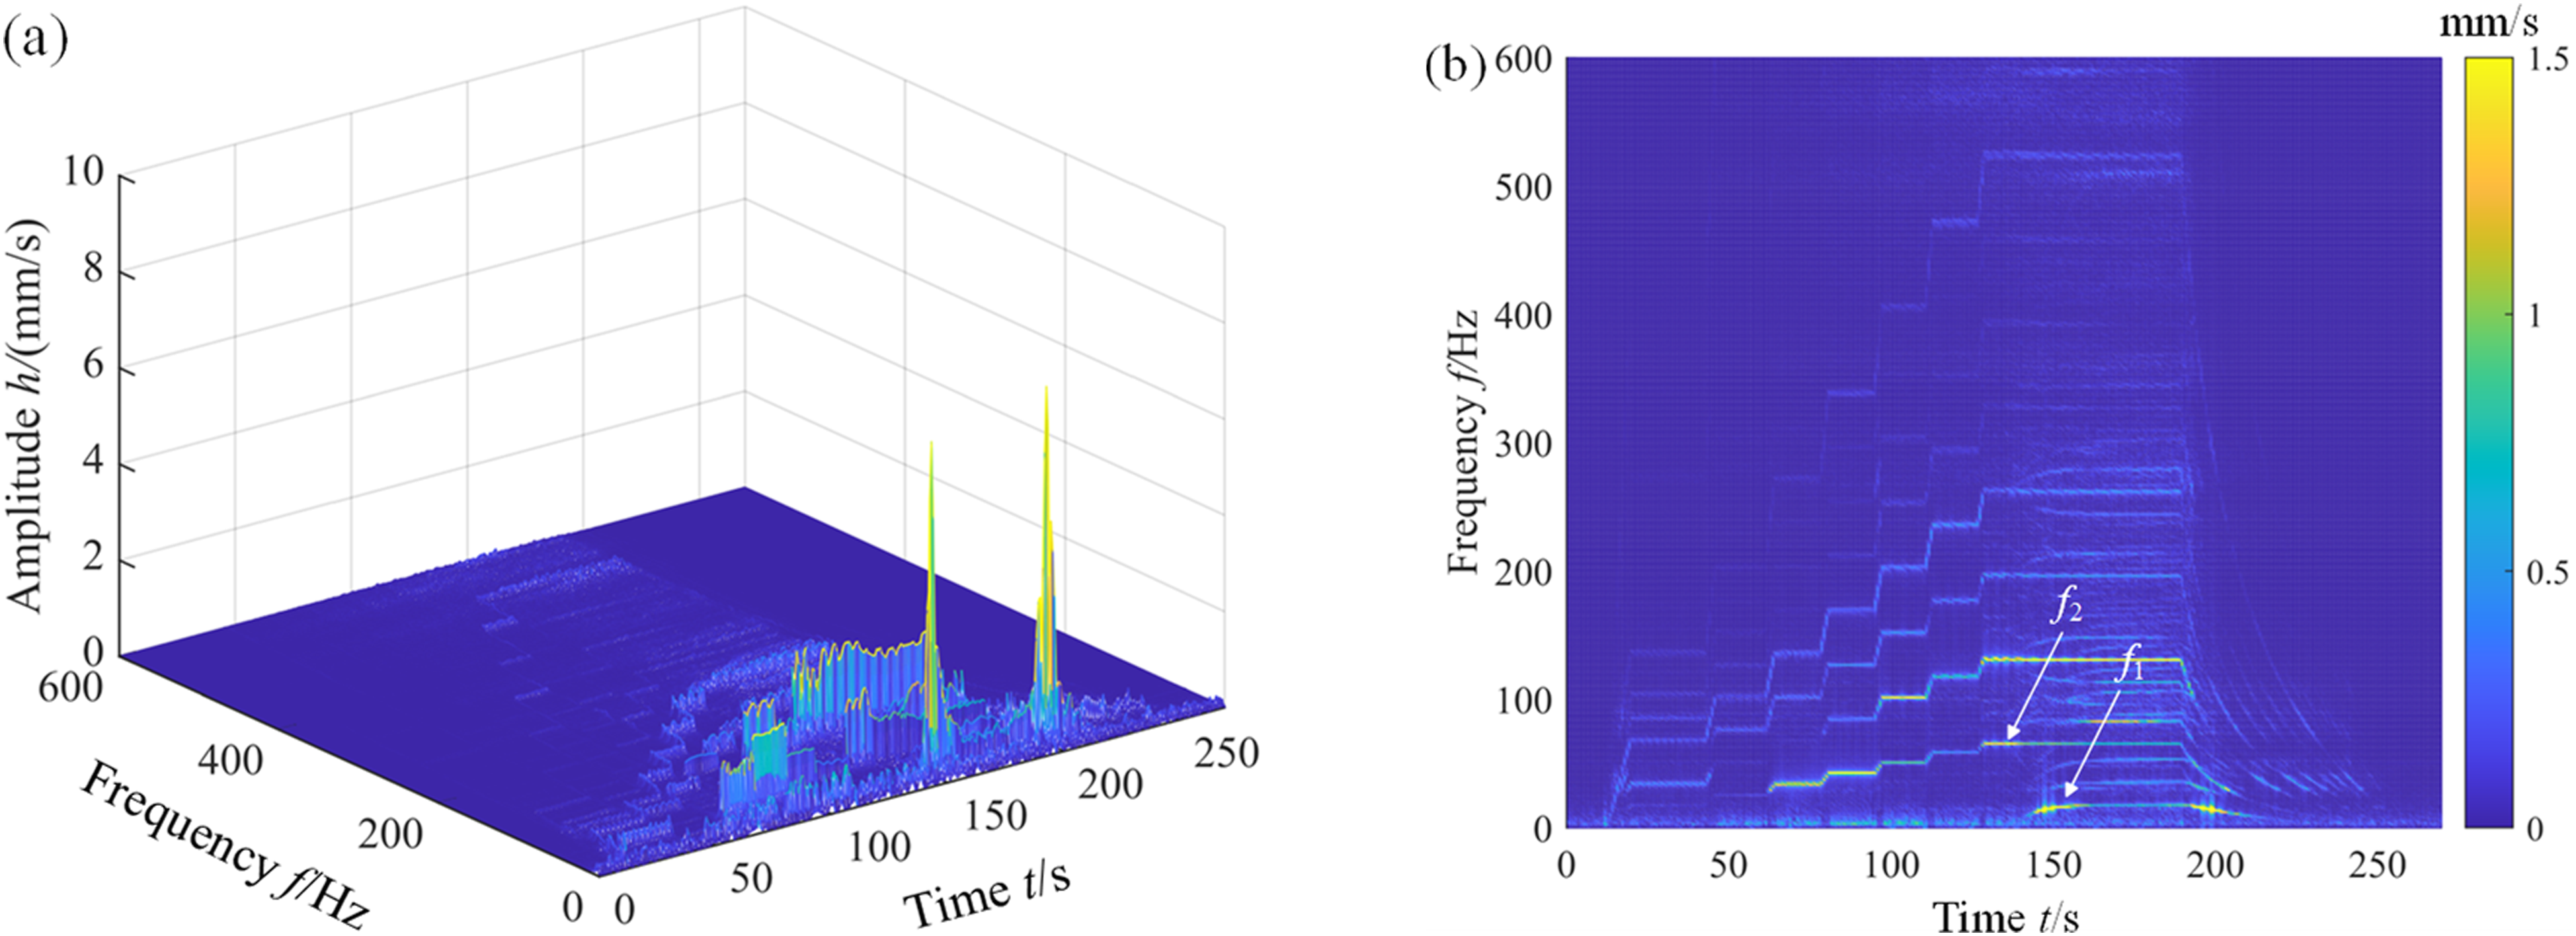
Figure 15 shows the time-domain and spectrum diagrams of the engine in the period of 189–190.5 s. Comparing Figure 15(b) with 13(c), it can be seen that when the engine runs stably at a low speed of 3900 r/min for 30 s, there is no high-frequency vibration characteristic in the spectrum diagram, and the doubling frequency and combined frequency components are also relatively less. When the engine stabilizes at 5000 r/min and continues to run, the high-frequency vibration characteristics in the spectrum diagram are gradually intensified, and the engine fault becomes more serious. In summary, it can be seen that the high-frequency abnormal vibration 3f1+6f2 characteristics that appeared during the previous test run can be used as the typical signal characteristics of aero-engine fault. The cause of the engine fault is due to the high-pressure rotor speed increase, which causes the vibration of the rotating shaft to increase, and then leading to local rubbing fault between the aero-engine rotor and the three-stage brush seal. If this high-frequency vibration component exists during the next test run of the aero-engine, the engine should be shut down immediately to prevent the rubbing fault from further expanding. Time-domain and spectrum diagrams of vibration signals at H3 measuring point. (a) Time-domain diagram of vibration signals, and (b) spectrum diagram of vibration signals.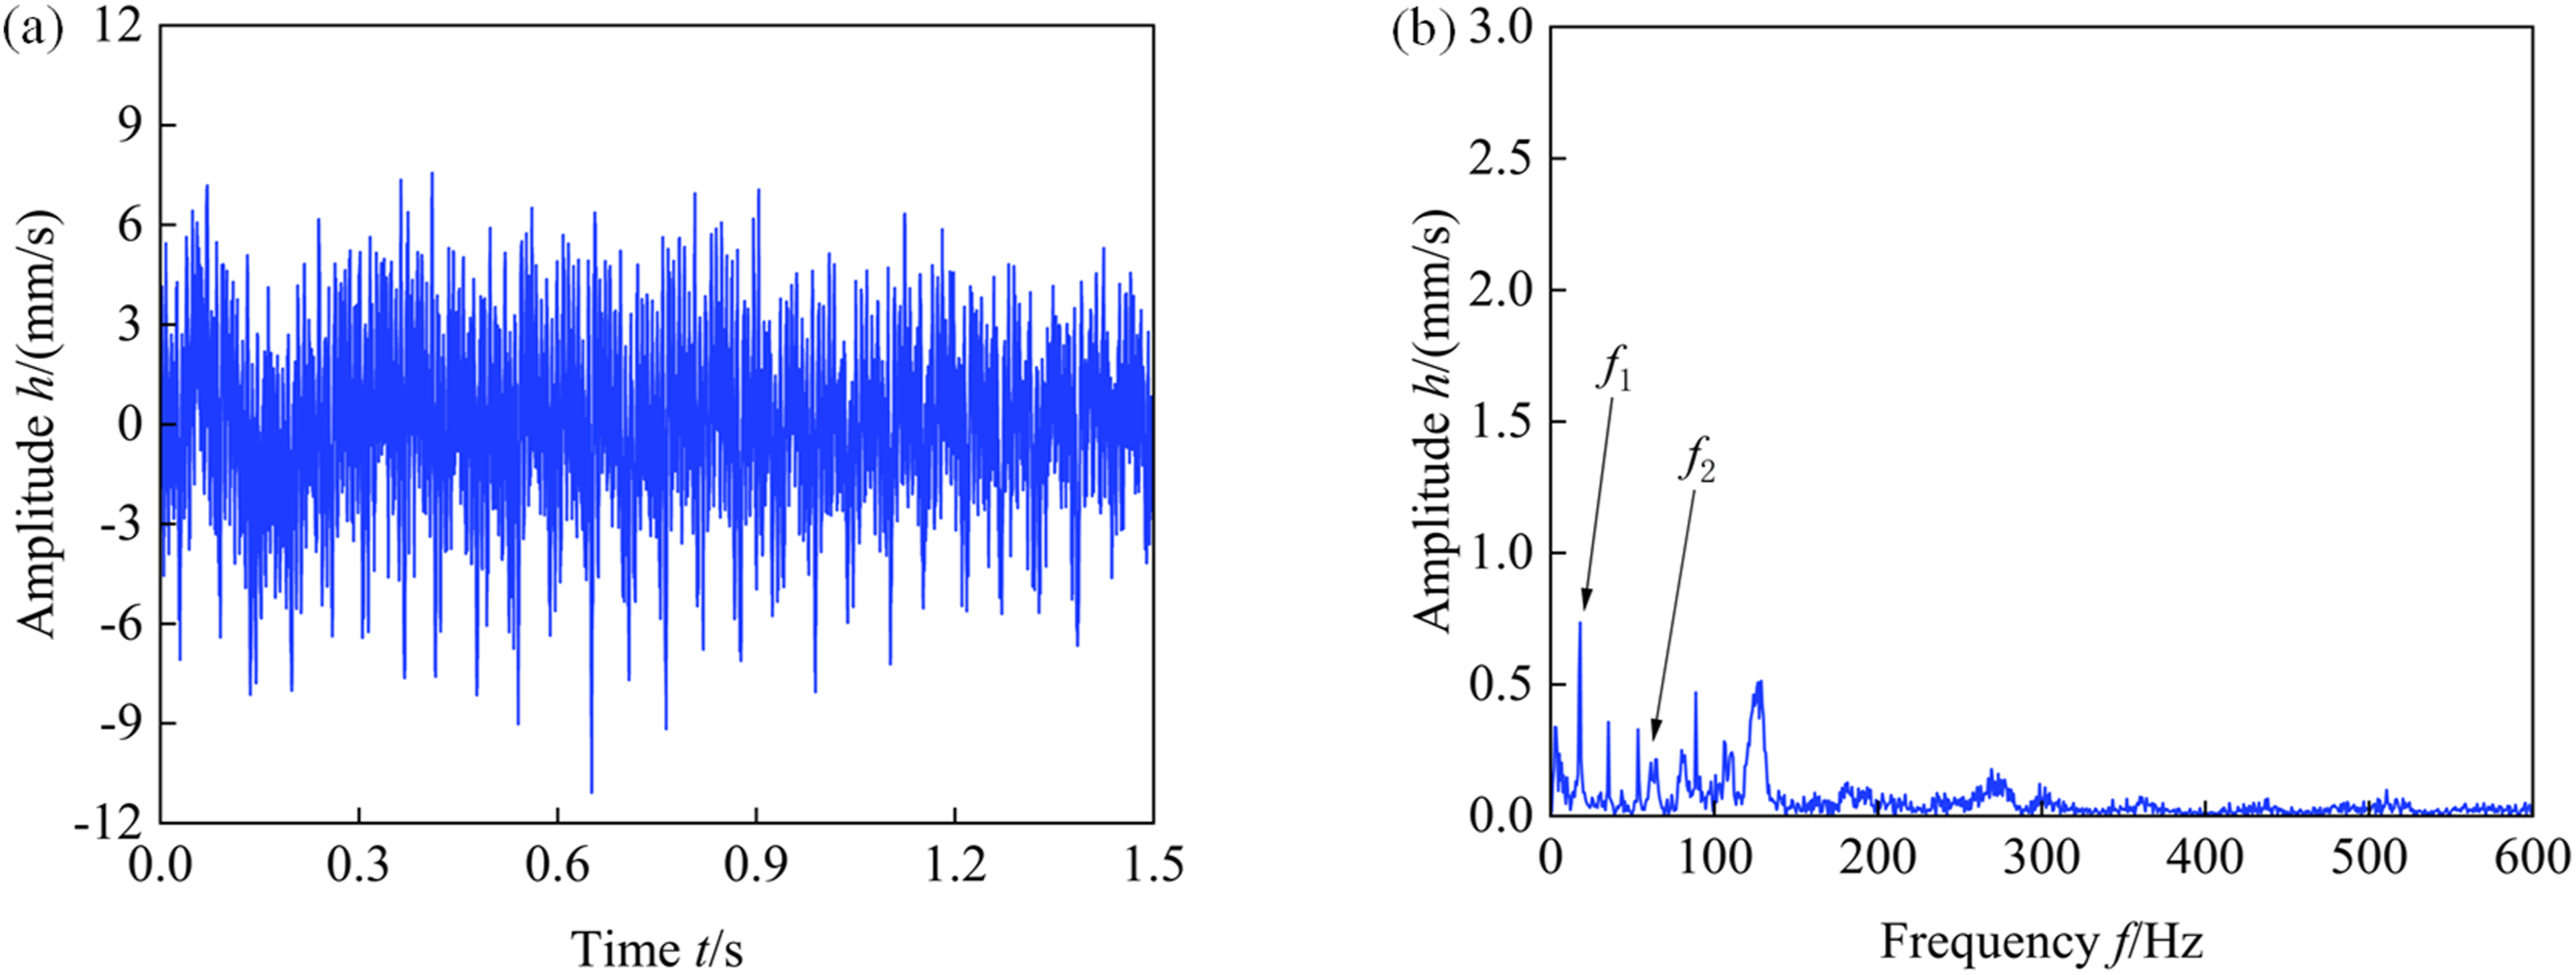
In order to explain the cause of high-frequency 3f1+6f2 feature in the vibration signal from the engine fault mechanism, and based on this, to establish a universal identification method for the rotor-three-stage brush seal rubbing fault. According to Ref. 23 and 24, and combined with the structural characteristics of the three-stage brush seal, it can be seen that since the fault is the rubbing between the high-pressure rotor and the three-stage brush seal with similar structural stiffness, thus the rotor system generates an additional stiffness nΔk. According to equation (3), it can be seen that the value of the additional stiffness is nk
c
(1-δ/r), its value is directly proportional to the number of rubbing contact surfaces (the number of brush seal stages n) and the magnitude of stiffness. Due to the introduction of additional stiffness and the vibration excitation of the two high-temperature air cavities of the three-stage brush seal, the actual stiffness and instantaneous frequency components of the system during rubbing continue to increase, which explains the coefficient characteristics of the 3f1+6f2 component in the high-frequency protrusion. In addition, as for the high-frequency protrusion component presents the characteristics of combined frequency k1f1+k2f2, according to the research in Ref. 22, as well as combined with the schematic diagram of the vibration transfer path of the high- and low-pressure rotors of the engine as shown in Figure 16, it can be seen that the low-pressure rotor system has two vibration transfer paths a and d. The path a is the bearing-intake support casing-compressor casing-transition casing, and the path d is the bearing-supporting frame-turbine casing-transition casing; while the high-pressure rotor system along the transfer paths b and c, the vibration amount is directly transmitted to the transition casing through the respective bearings, that is, the high and low-pressure rotors form a vibration coupling effect at the transition casing measuring points H3 and V3. So as for the counter-rotating aero-engine, when the high-pressure rotor experiences a rotor–stator rubbing fault, due to the vibration coupling and counter-rotating effects of the high- and low-pressure rotors, the frequency components of k1f1+k2f2 will appear in the vibration signal of the casing, and there is k2>k1. Schematic diagram of vibration transfer path for engine high- and low-pressure rotors.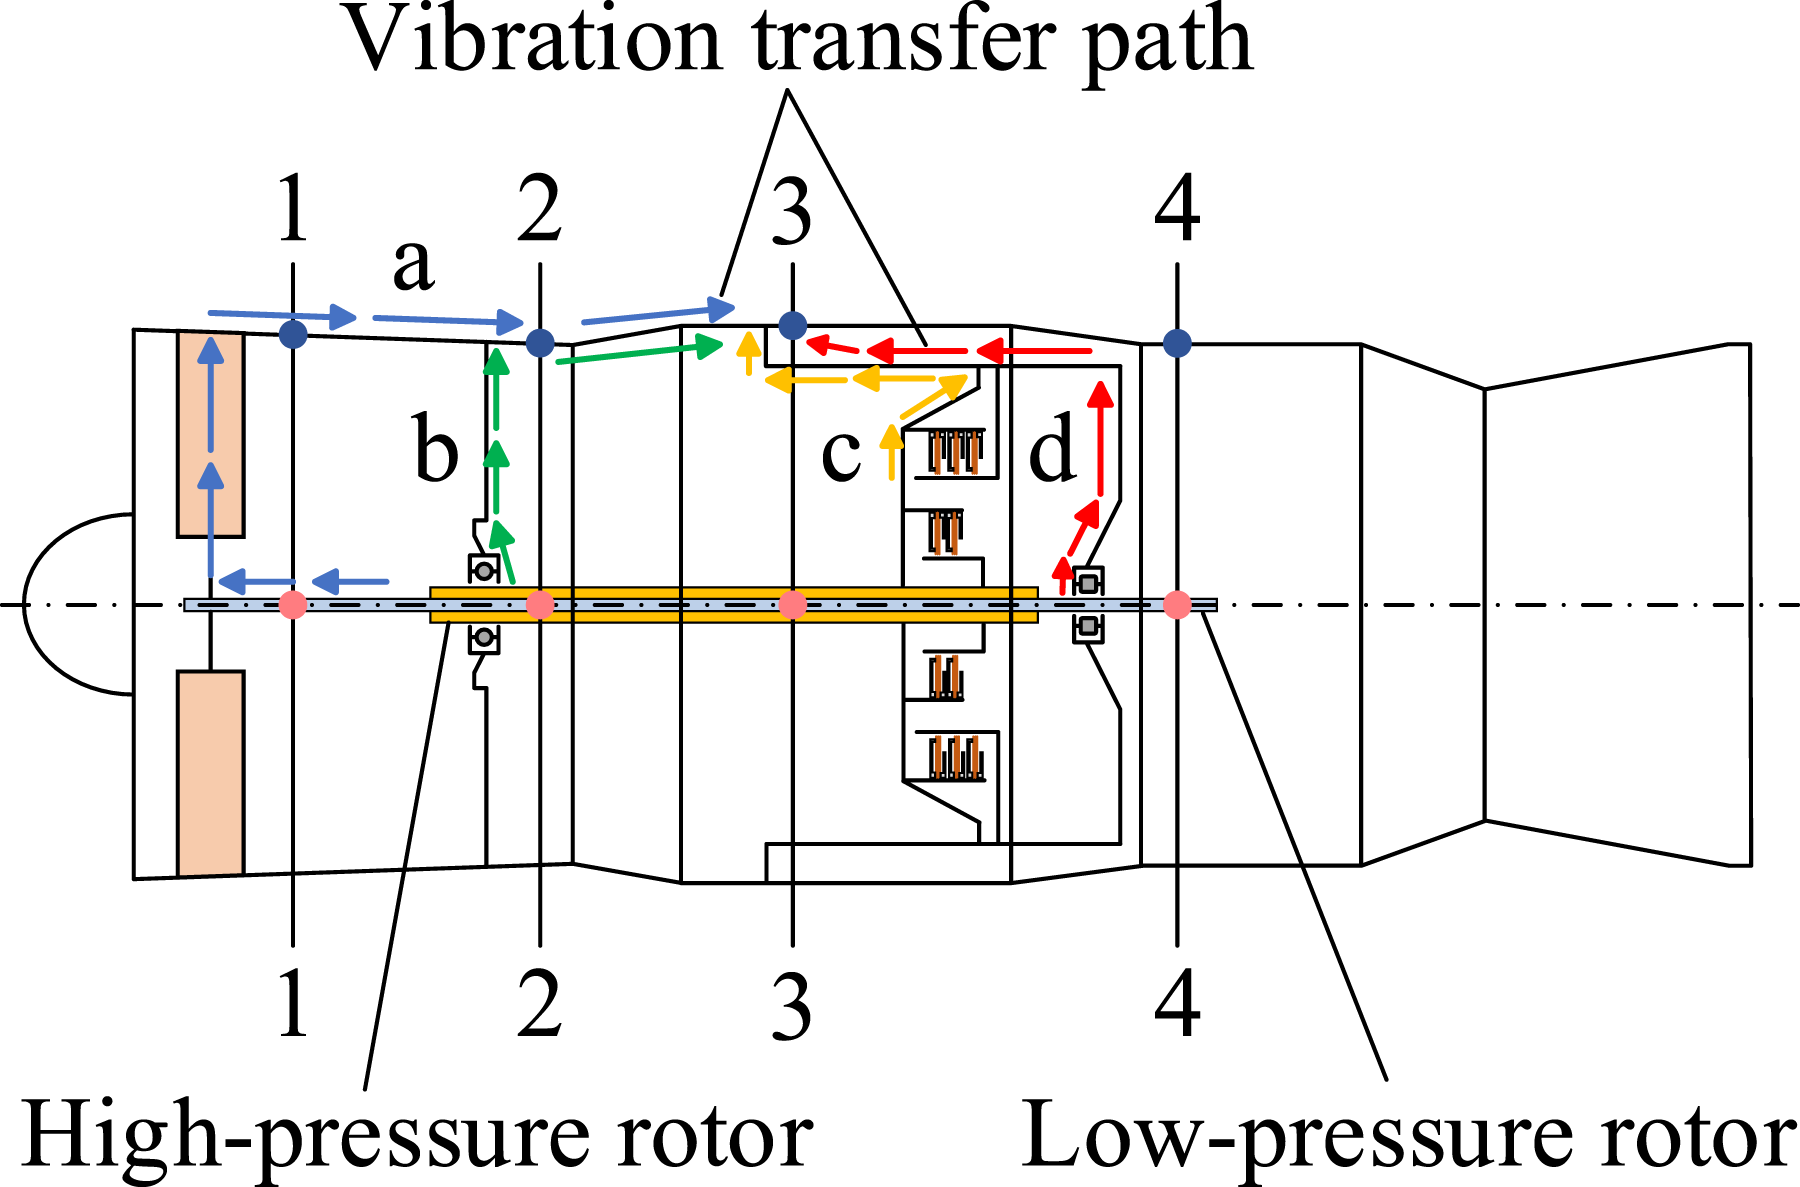
In summary, if the vibration transfer path of the high- and low-pressure rotors of a counter-rotating dual-rotor aero-engine has a vibration coupling effect similar to that mentioned above, and a three-stage brush seal rubbing fault occurs at the high-pressure first stage turbine. Then, during the vibration signal analysis, the high-frequency protrusion 3f1+6f2 component of each measuring point should be considered the typical diagnostic feature of the engine rotor-three-stage brush seal rubbing fault. Therefore, in the structural design process of the next generation engine, a more reasonable rotor-three-stage brush seal clearance should be designed, and dynamic balance should be achieved as much as possible during the assembly process, so as to avoid the occurrence of rotor-three-stage brush seal rubbing fault.
Conclusions
This paper addresses the issue of rotor-three-stage brush seal rubbing fault that occurs during the test run of a counter-rotating aero-engine. Based on the Fast Fourier Transform (FFT), a detailed frequency-domain analysis is conducted, and the following conclusions are obtained: 1. There are varying degrees of high-frequency abnormal protrusions in the waterfall diagrams of the measuring points at each section of the casing, the frequency component is the combined frequency 3f1+6f2, and the high-frequency fault characteristics of the H3 measuring point are the most significant; in the low-frequency part, the fault causes a large number of components such as doubling frequencies k1f1, k2f2 and combined frequency k1f1+k2f2 of the low- and high-pressure rotors to appear in the spectrum diagrams. 2. The step section of the time-domain signal is the beginning period of the engine fault, and the maximum amplitude section is the serious fault period. The low- and high-pressure fundamental frequencies and abnormal high-frequency amplitudes of the serious fault section of each measuring point are higher than the beginning period of the engine fault, and the high-frequency amplitude of the H3 measuring point reaches the maximum value of 9.246 mm/s in the whole test run process. 3. By disassembling and inspecting the engine and comparing the fault data with normal vibration data, it is ultimately determined that the cause of the engine fault is due to the increase in high-pressure rotor speed, which causes the increase in rotating shaft vibration, resulting in local rubbing between the rotor and the three-stage brush seal. The high-frequency abnormal protrusion 3f1+6f2 component in the vibration signal is the typical diagnostic feature of the rotor-three-stage brush seal rubbing fault in the counter-rotating dual-rotor aero-engine.
Footnotes
Statements and declarations
Funding
The author(s) disclosed receipt of the following financial support for the research, authorship, and/or publication of this article: This work has been carried out with the supports of The National Science and Technology Major Project (J2019-II-0011-0031) and The National Natural Science Foundation of China (Grant No. 52336002). The author(s) would like to thank them for funding it and their permission to publish the paper.
Conflicting interests
The author(s) declared no potential conflicts of interest with respect to the research, authorship, and/or publication of this article.