
Abstract
Structural vibration analysis often involves evaluating power spectral density to understand vibration processes. However, these spectra typically include overlapping vibration modes, complicating the analysis of individual components. This study presents a method to separate vibration modes into distinct components, simplifying structural vibration analysis. By combining maximal overlap discrete wavelet transform with fast Fourier transform, the composite vibration signal is decomposed into frequency-specific components. This approach enables precise analysis of individual vibration modes, facilitating the detection of those most sensitive to structural changes. Furthermore, the method effectively removes noise and irrelevant vibrations, enhancing the accuracy and reliability of structural evaluations.
Keywords
Introduction
Extracting information from structural vibration signals1–3 has become a crucial method in monitoring structural health and has been widely applied in recent studies. During operation, structures such as bridges,4–6 beams,4,7,8 or buildings9,10 are subjected to various types of vibrations caused by both external loads and internal factors. These vibration signals are typically measured and analyzed to monitor changes in the structure,11–13 particularly potential changes that could cause damage. Vibration signal analysis is often conducted in the time domain, where parameters such as amplitude14–16 and time17,18 are used to evaluate variations in the vibration process. However, because real-world vibration signals are often complex and contain multiple components, relying solely on time-domain analysis may not provide sufficient information for an accurate quantitative assessment of structural changes. To overcome this limitation, many studies have shifted towards frequency domain analysis,12,19,20 where parameters such as natural vibration frequencies,12,19,20 harmonic amplitudes,14,15 and peak power can be extracted.21–23 This type of analysis offers a deeper understanding of the quantitative characteristics of the structure, enabling the detection of minor structural changes through variations in the signal. However, in practice, measured vibration signals do not reflect a single vibration mode, but contain overlapping components, including noise. This overlap makes it more difficult to analyze and identify distinct vibration modes, and the evaluation results may be distorted, reducing accuracy.
One of the major challenges in structural health monitoring (SHM) is the complexity of vibration signals, which often contain multiple overlapping vibration modes. These overlapping modes obscure key signal components, making it difficult to accurately detect structural damage.24,25 This challenge is further amplified by environmental noise, which introduces additional signal distortions and reduces the system’s sensitivity to subtle structural changes. While techniques such as the fast Fourier transform (FFT) are commonly used to analyze vibration signals, they struggle to effectively decompose complex signals into distinct components, especially in the presence of noise. This limitation highlights the need for an advanced method that can provide both high frequency resolution and robustness against noise. Although FFT is widely used due to its computational efficiency and simplicity, it assumes that signals are stationary, which is often not the case in real-world structures where vibration signals may change over time. As a result, FFT has difficulty capturing non-stationary or transient signals, which are essential for detecting early structural damage. Alternative methods, such as the Short-Time Fourier transform (STFT) and Continuous Wavelet transform (CWT), offer some improvements in time-frequency analysis but are computationally expensive and struggle to balance time and frequency resolution effectively. Moreover, while wavelet-based methods improve signal analysis by separating noise from key components, their limitations in handling signals without downsampling can lead to loss of important signal details, particularly in long-term monitoring applications. Maximal overlap discrete wavelet transform (MODWT), unlike DWT, does not require downsampling, allowing it to retain all the original signal information while effectively analyzing signals in both the time and frequency domains. When combined with FFT, which excels in frequency resolution, the MODWT-FFT approach overcomes the limitations of both traditional FFT and wavelet methods. This combination provides high-resolution analysis without losing critical signal information, making it a more effective solution for separating overlapping vibration modes and minimizing noise interference. The proposed method aims to fill the gap in current literature by offering enhanced precision in SHM.
This study proposes a novel solution by combining two powerful analytical methods26–28: MODWT 29 and FFT.30,31 This combination not only allows for the analysis of the overall vibration signal but also the separation of individual vibration components,32,33 helping to eliminate unwanted noise and irrelevant components. MODWT has the ability to process signals in both the time and frequency domains without requiring downsampling, allowing the original signal to be decomposed into approximation and detail signals. This helps to distinguish between the main structural vibrations and the noise in the measured signals. After the signal is processed with MODWT, FFT is applied to convert the signal from the time domain to the frequency domain, enabling the extraction of power spectral densities of individual vibration components. The results of this analysis show that each distinct vibration mode has its own frequency and energy level, clearly identifying the vibrations most sensitive to structural changes. These vibrations can serve as key indicators of potential damage to the structure. For example, if a particular vibration changes abnormally during operation, it could indicate the presence of cracks,34–36 deformations,37,38 or other structural problems.39–41 The development of cracks significantly impacts the vibration response of beams, leading to reduced stiffness and corresponding decreases in natural frequencies and power spectral density (PSD). This phenomenon has been well-documented, 42 which underscores the importance of evaluating structural vibration behavior under both undamaged and damaged conditions. Our findings align with this observation, demonstrating how crack propagation alters vibration characteristics, further emphasizing the need for advanced analysis methods to monitor and assess structural health effectively. At the same time, this method helps to eliminate noise signals, such as irrelevant signals or external environmental factors, increasing sensitivity and accuracy in detecting damage.42,43 While this study focuses on beams as a representative structural element, the broader context of structural health monitoring necessitates considering columns and foundations, which, alongside beams, form the primary lateral load-bearing system in buildings and bridges. Recent studies44–46 highlight their critical roles in resisting dynamic loads and maintaining structural stability.
A key contribution of this research is its ability to accurately identify resonance regions, where the majority of the energy from individual vibrations is concentrated. Instead of analyzing the entire signal, this approach focuses on isolating the vibration components that have the most significant impact on structural changes. By isolating these critical vibrations, the method allows for a more precise assessment of the structure’s stability and durability. Monitoring changes in these vibrations also facilitates early detection of damage, enabling timely repairs or maintenance, which ultimately helps prevent further degradation. The integration of MODWT and FFT not only enhances the quality of signal analysis but also provides a new approach in structural health monitoring. This method enables engineers to detect structural issues earlier and with greater accuracy, thereby reducing risks and extending the lifespan of construction projects. The combined use of these techniques improves not just the precision of the analysis but also provides a more detailed and comprehensive view of the structural condition throughout its operation.
Theoretical basis
Maximal overlap discrete wavelet transform (MODWT)
The DWT is a powerful multiresolution analysis technique,
44
commonly used for noise filtering45,46 and signal component separation,
47
as detailed in Figure 1. In real-world vibrations, each signal has a characteristic frequency, while noise often lacks meaningful patterns. Discrete wavelet transform (DWT) effectively decomposes a signal into low-frequency (core characteristics) and high-frequency (noise-dominated) components. This decomposition enables DWT to isolate main vibrations from noise by separating the signal into approximation and detail components. Noise filtering model and signal component separation using DWT.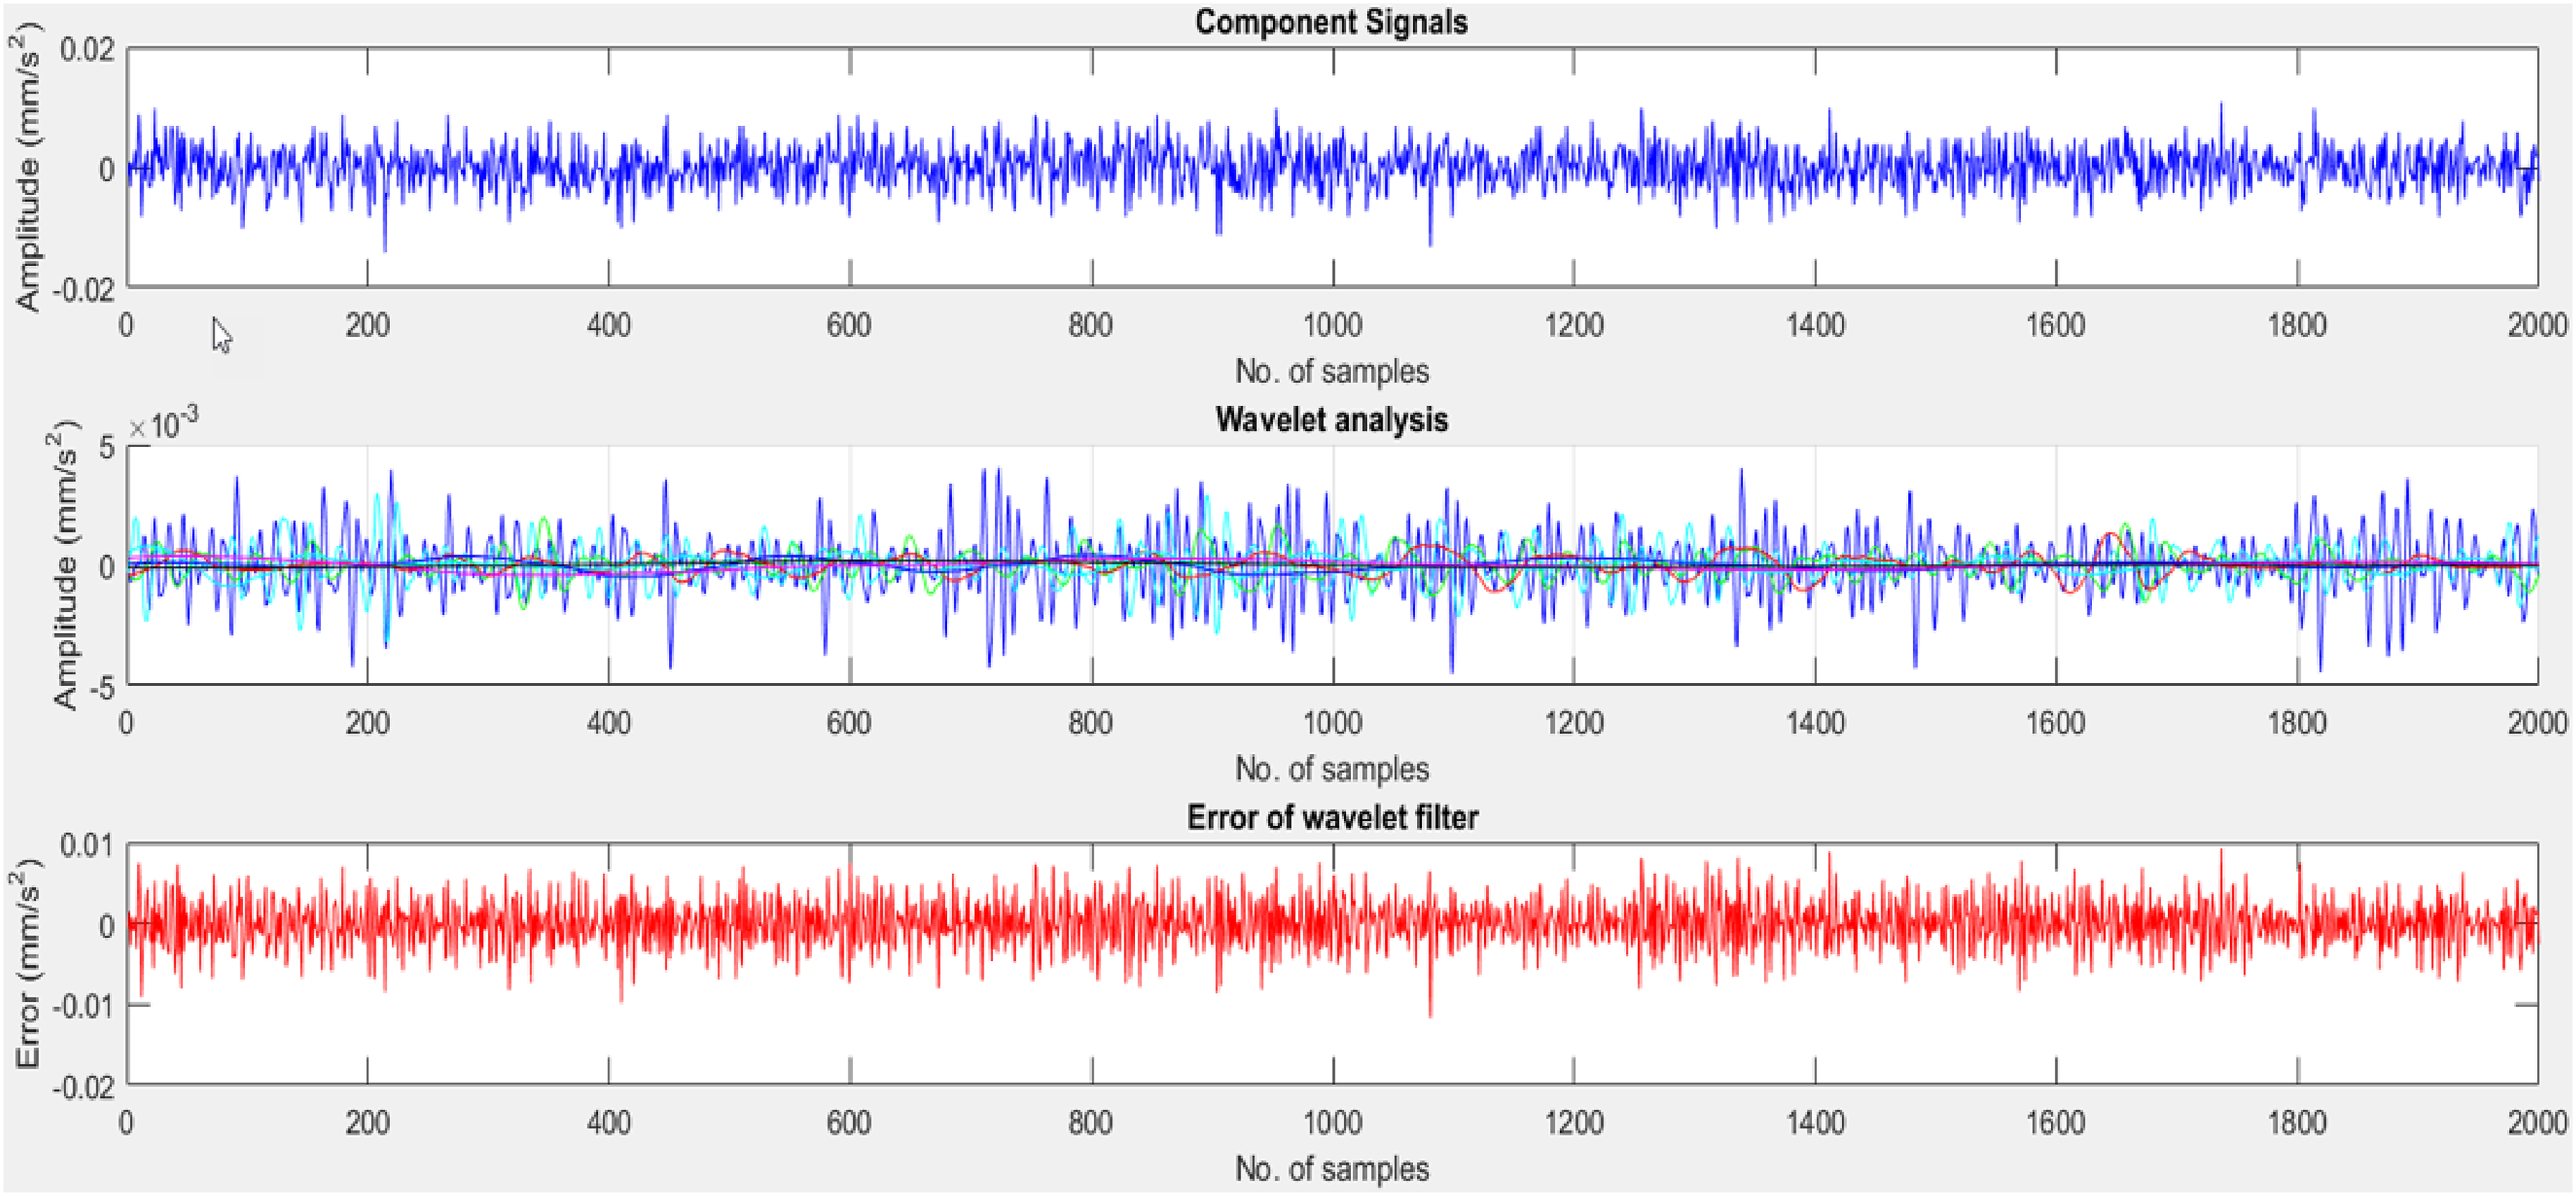
Any signal

Here,


These coefficients allow for efficient signal decomposition while maintaining its structural information across resolutions. The relationship between the scaling coefficients (


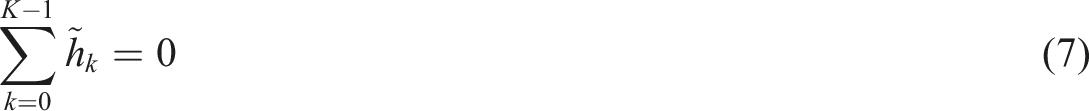
Equations (4)–(6) demonstrate the process carried out using the Discrete Wavelet Transform (DWT). However, for long-term data collection, the traditional DWT becomes less effective and accurate due to its reliance on downsampling, which can lose valuable information. To address this limitation, this paper employs the Maximal Overlap Discrete Wavelet Transform (MODWT), also known as the undecimated discrete wavelet transform. MODWT improves DWT by modifying filter sizes, ensuring no loss of resolution. Specifically, the filter coefficients for low- and high-frequency regions are scaled as follows: Wavelet decomposition of MODWT.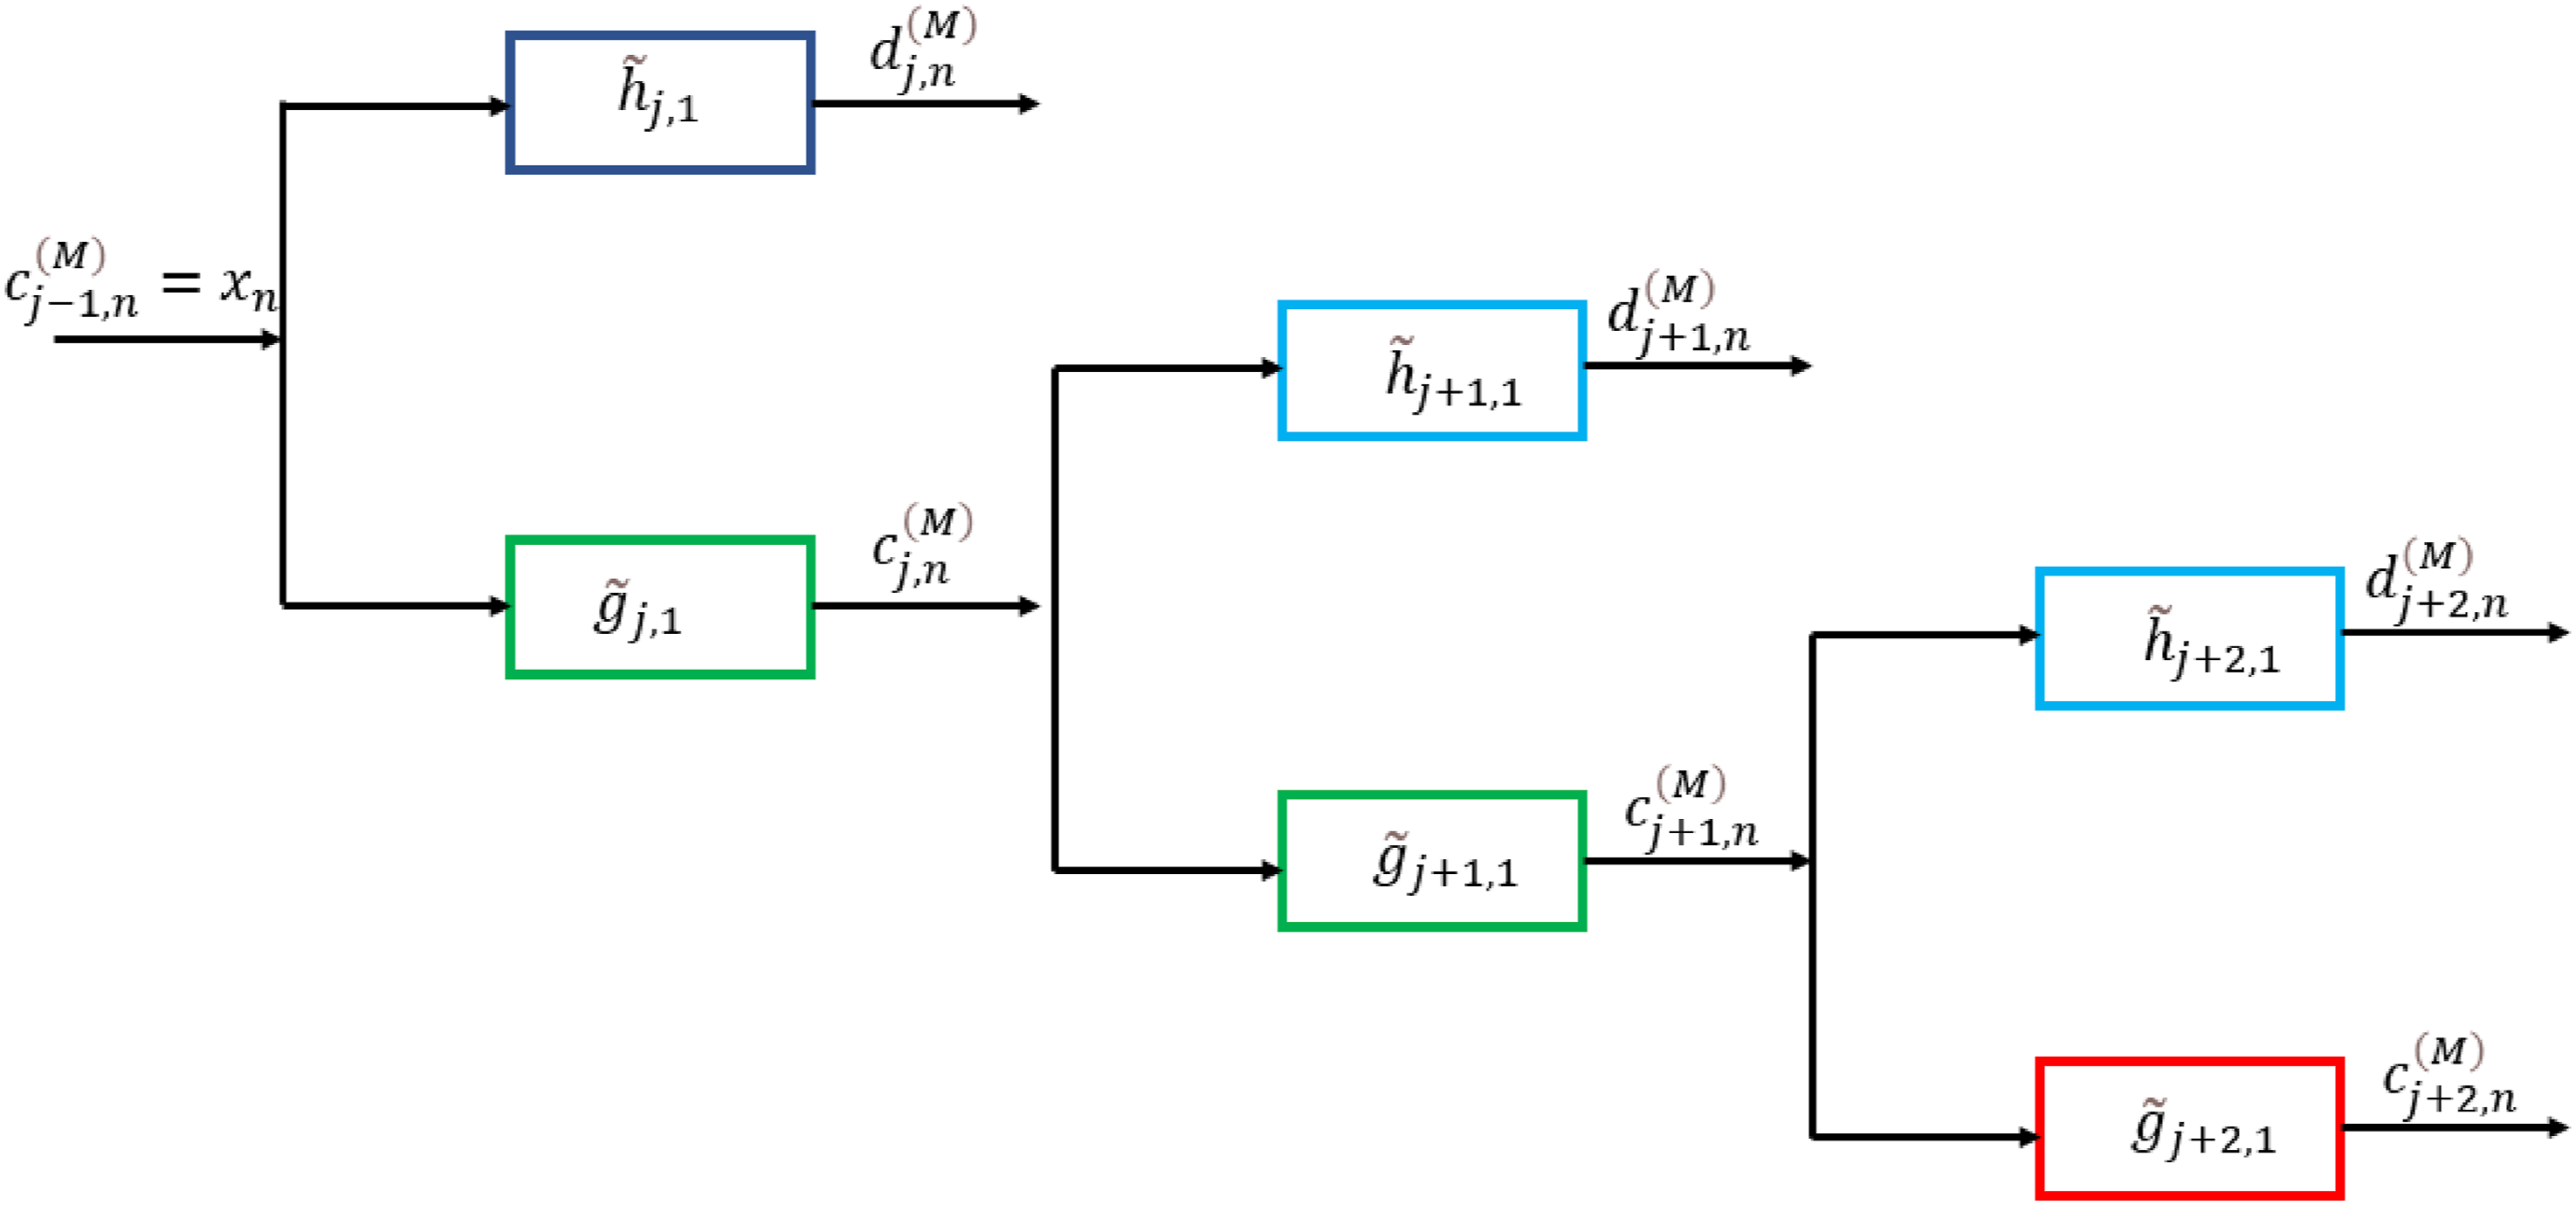


This approach ensures that the signal is not downsampled, retaining all critical information while providing enhanced resolution for long-term data analysis. As a result, MODWT significantly improves signal decomposition and reconstruction accuracy, making it a superior tool for vibration analysis and structural health monitoring.
In Figure 2, it can be seen that the original signal can be reconstructed by MODWT multiresolution analysis model.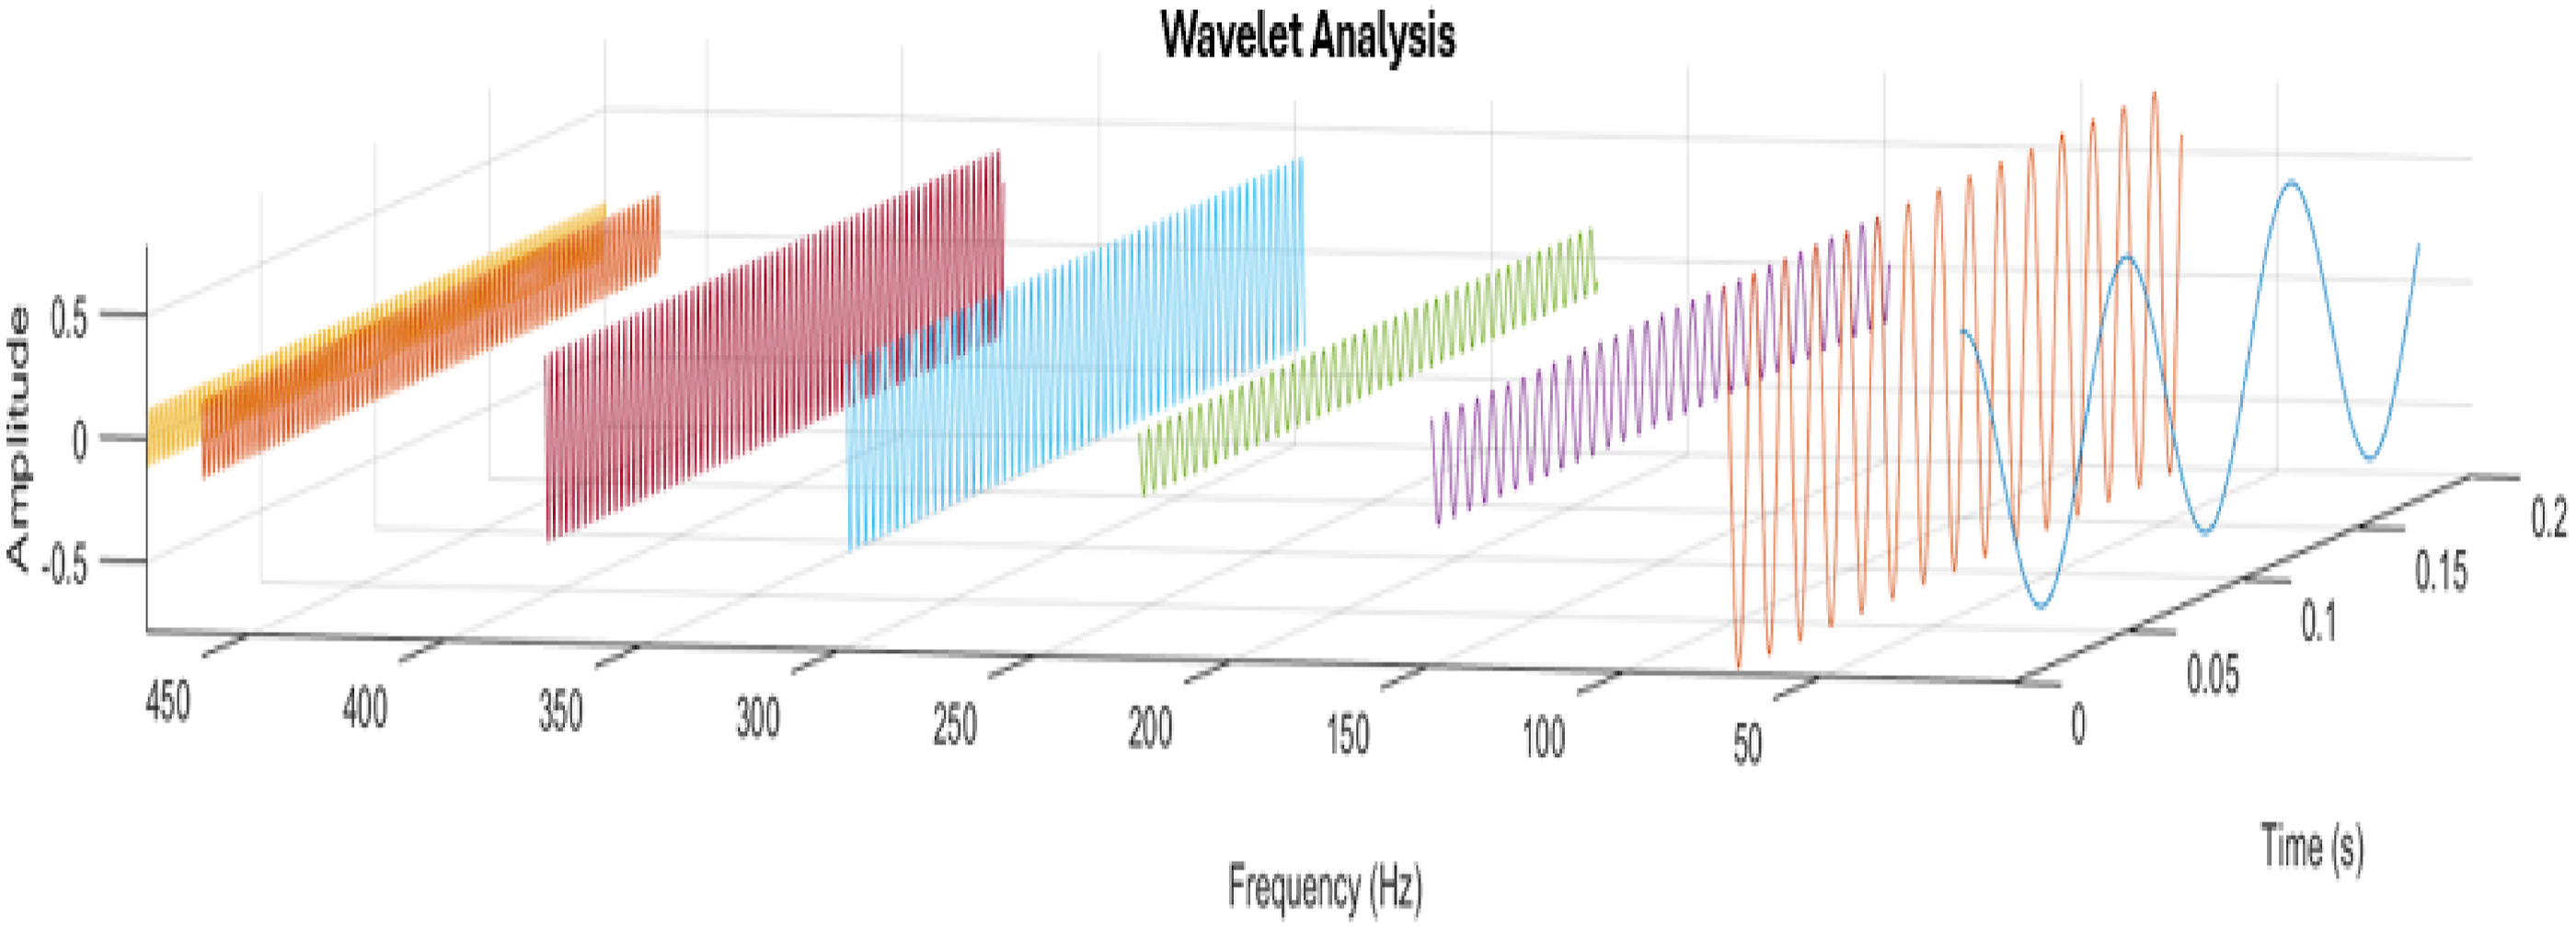


Theory of power spectral density estimation using the fast Fourier transform
To optimize the decomposition of the original signal using MODWT, this study develops a model to transform the signal from the time domain to the frequency domain. The reason for this is that the original signal is often raw data that contain much information that is difficult to fully exploit through time-domain analysis alone. Transforming the signal to the frequency domain offers many advantages, allowing us to analyze the vibration characteristics in more detail. In this study, the signal is analyzed primarily in the frequency domain through the spectrum, specifically PSD, as shown in Figure 4. Combined model of MODWT and FFT from this paper.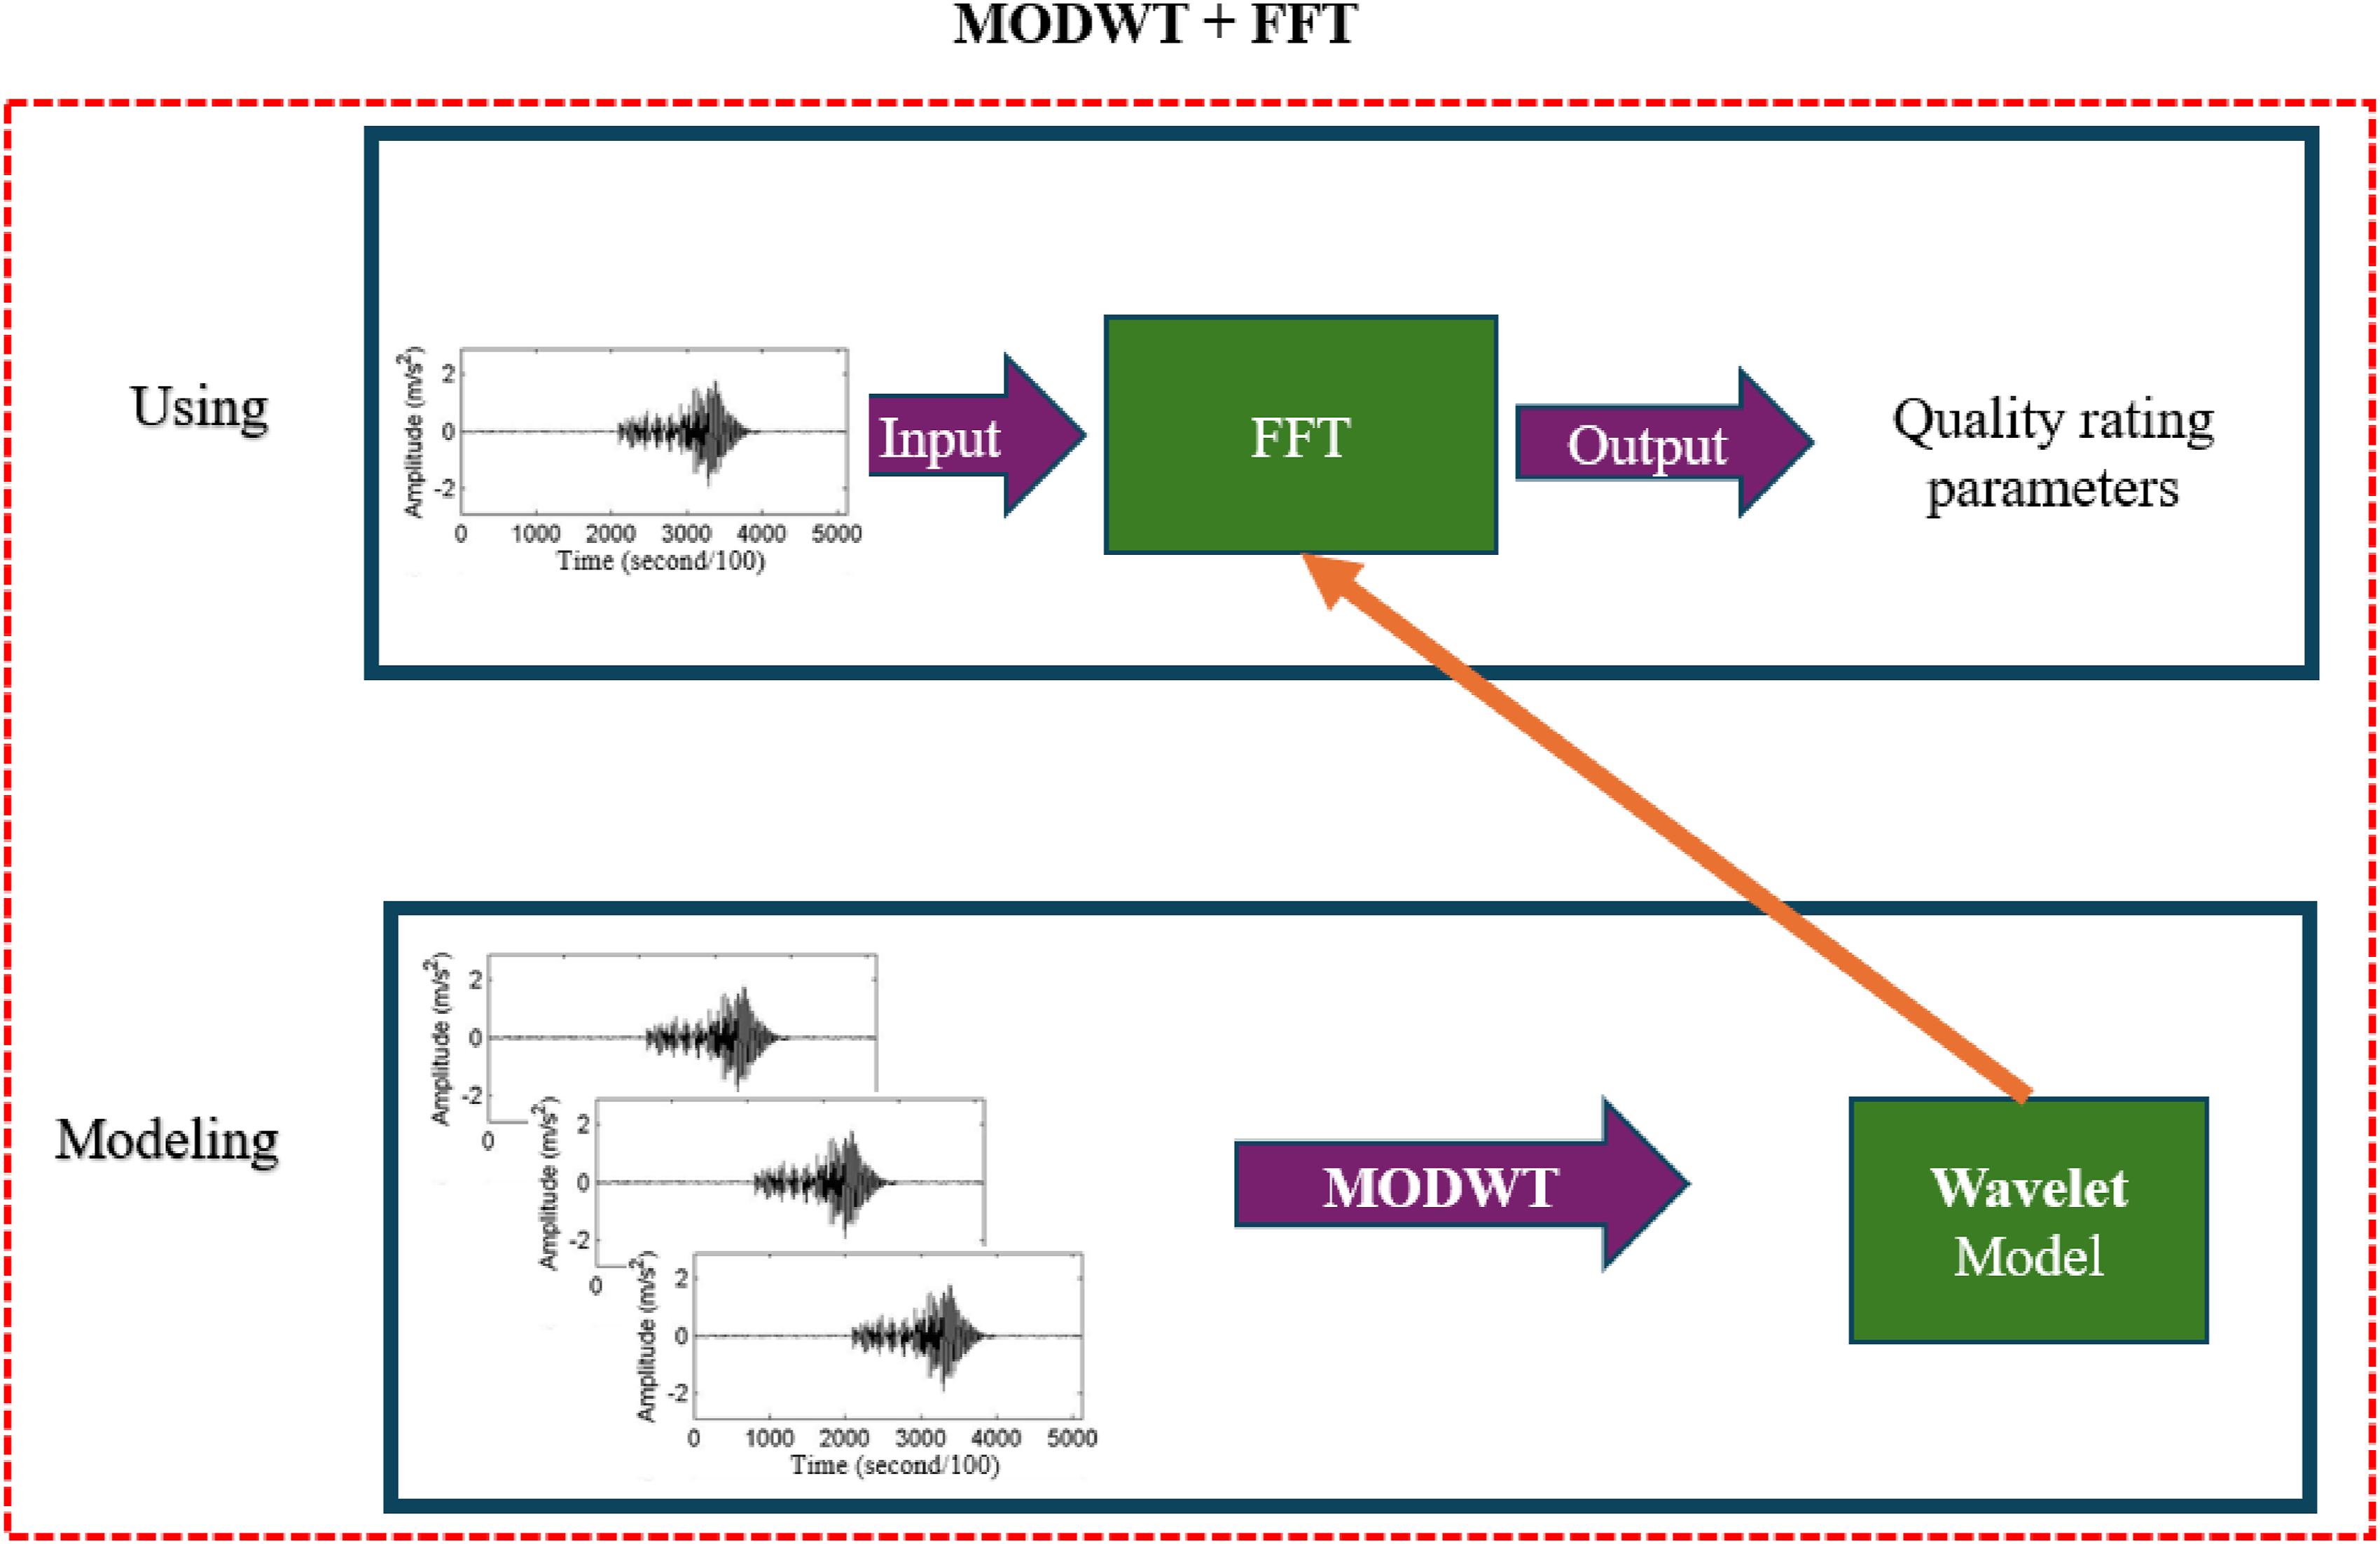
The power spectral density is calculated based on the Fourier transform of the autocorrelation function of the signal in the time domain, at two time points τ and T + τ Overview of the signal change from the time domain to the frequency domain.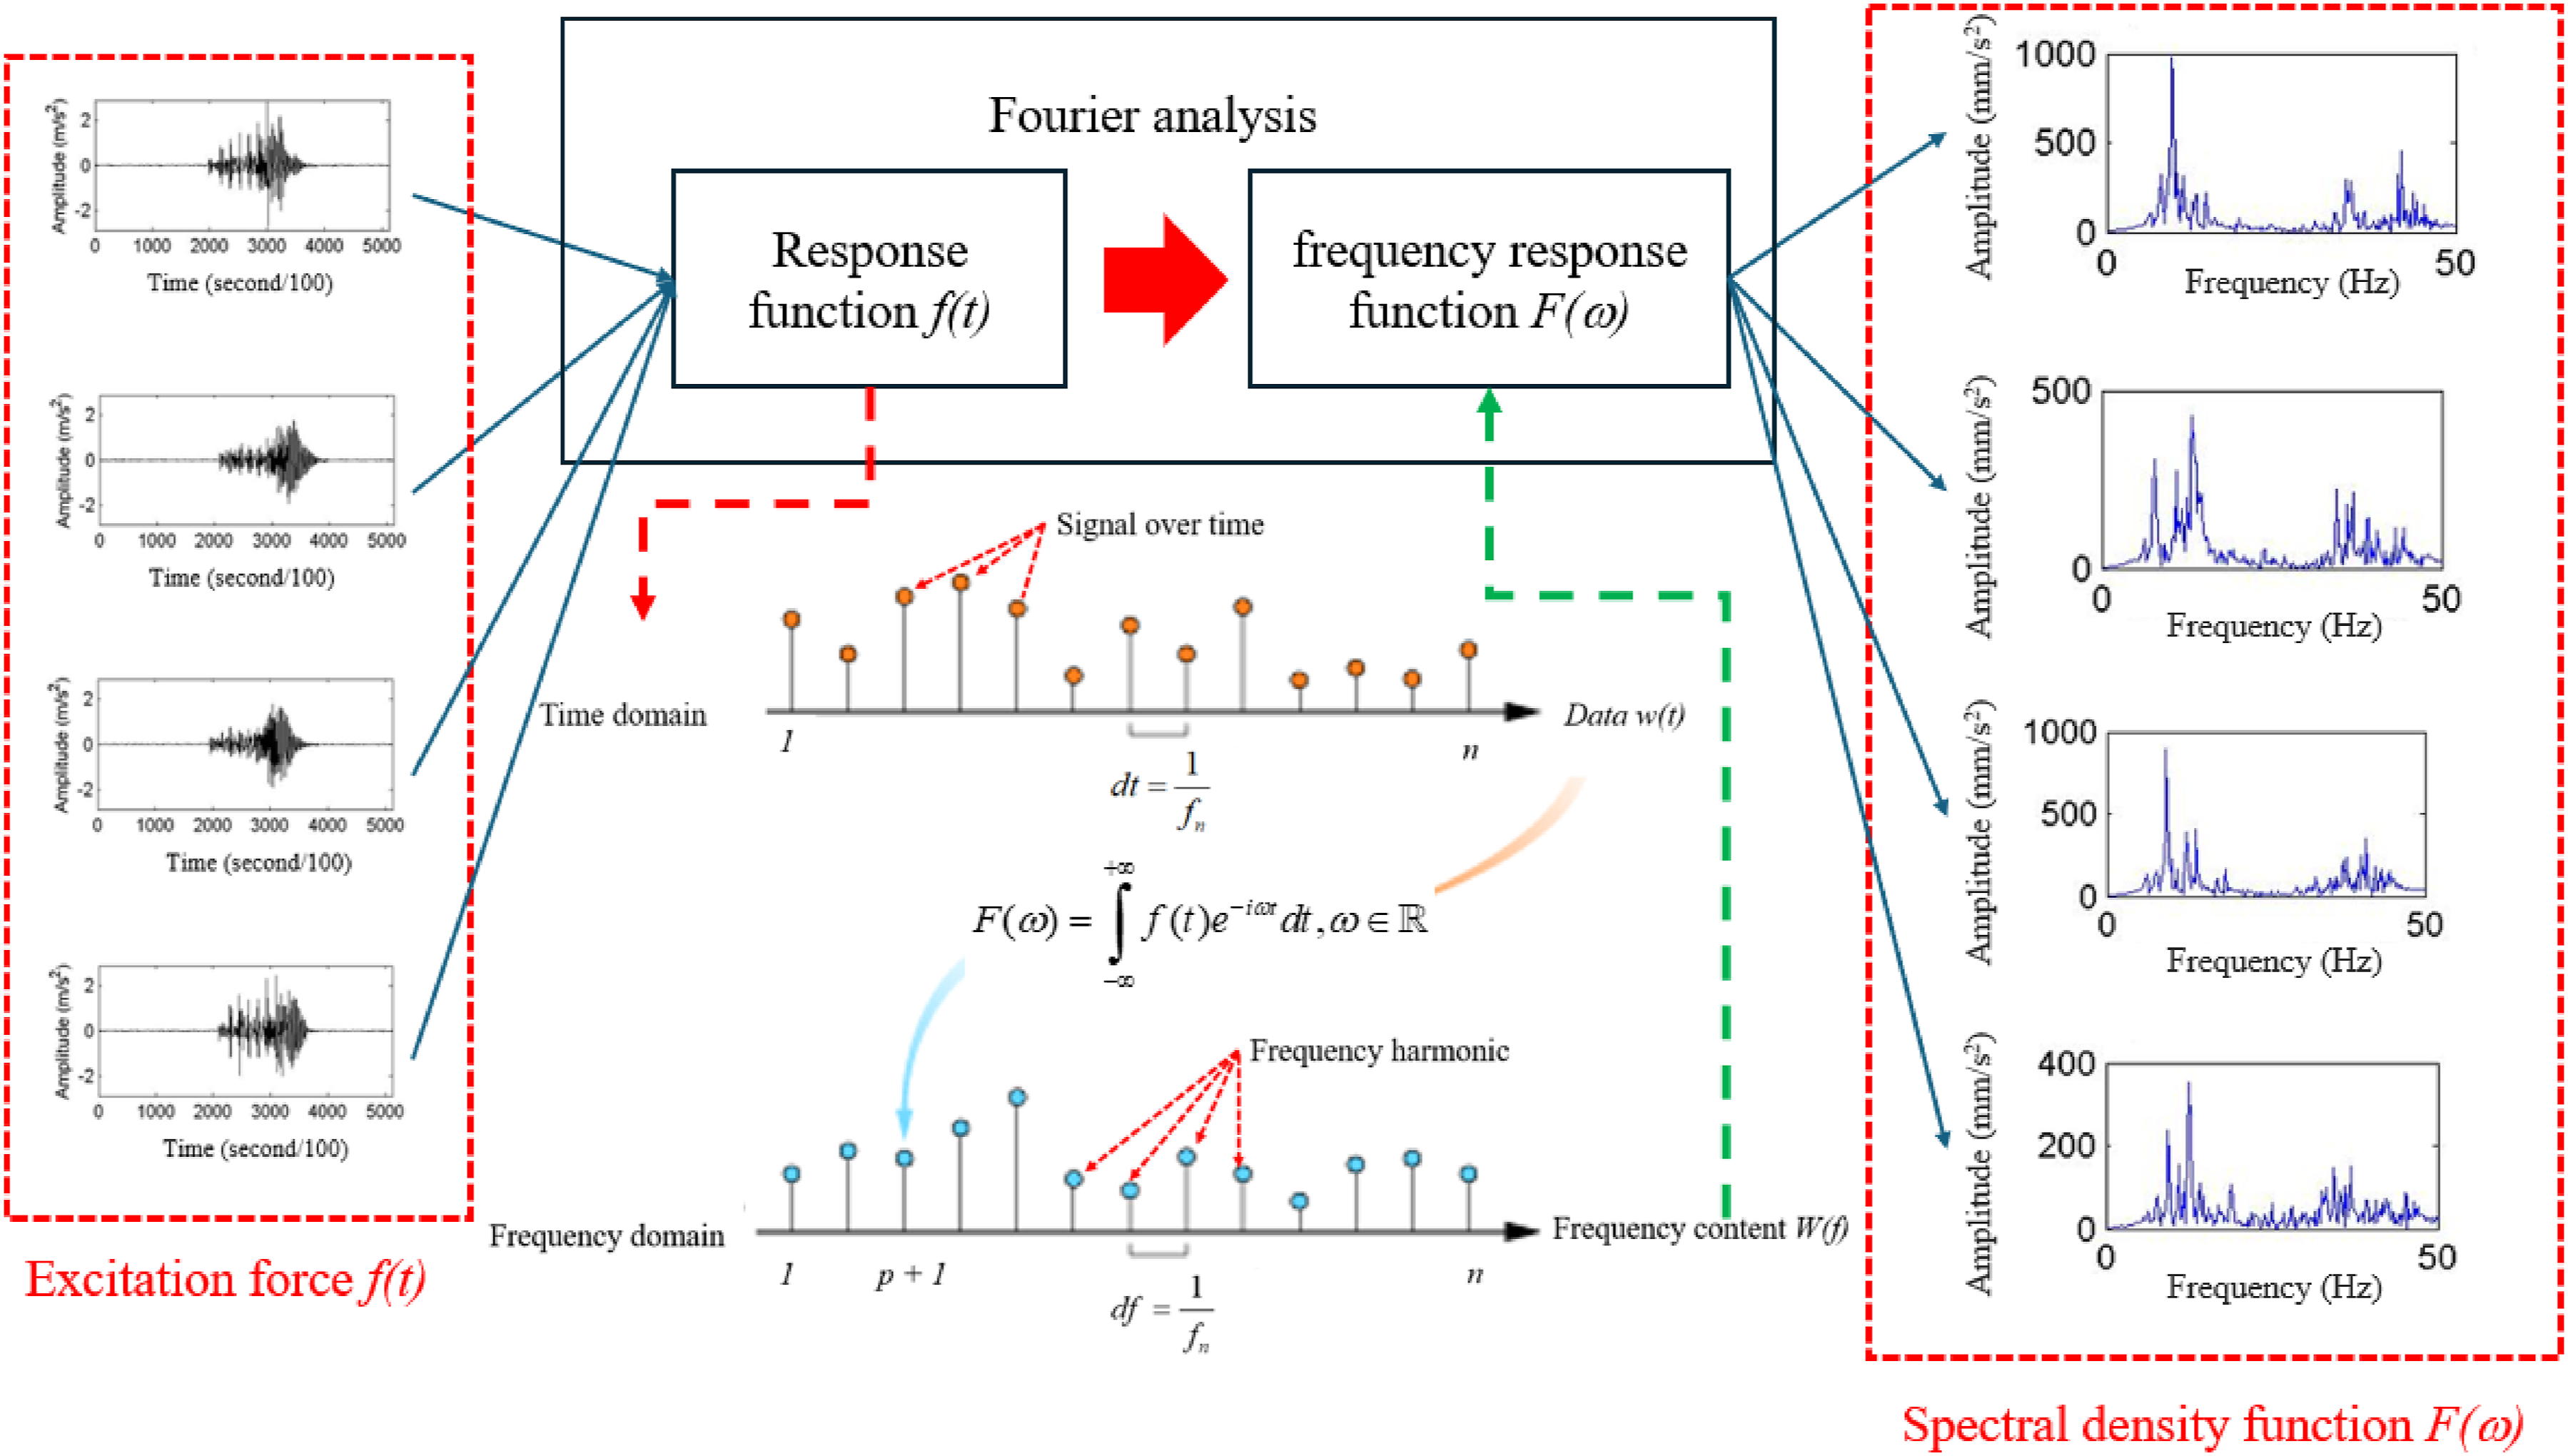

According to Fourier theory, any signal function can be decomposed into many components with different frequencies. Therefore, this study applies the Fourier transform to separate the composite signal into component signals, each corresponding to a specific frequency. This means that the original signal in the time domain can be represented as the sum of subfunctions, each associated with a specific frequency. The Fourier transform of a signal f(t)

If we want to reverse the transformation from the frequency domain back to the time domain, it is performed as in equation (18)

Then, the approximation


Substituting equations (19) into (20) gives

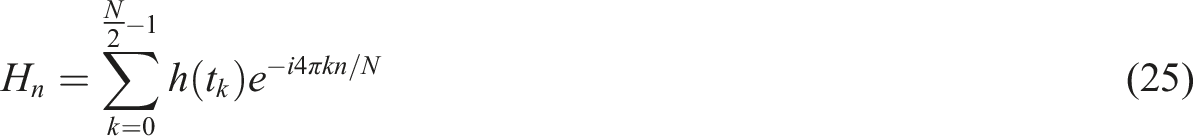
Equation (21) leads to the discrete Fourier transform

The FFT algorithm in this article is applied only for the case N = 2
s
, where

Applying the discrete Fourier transform equation (22) to each sequence in equation (23), we get

Substituting equation (24) in equations (25) and (26) produces the following
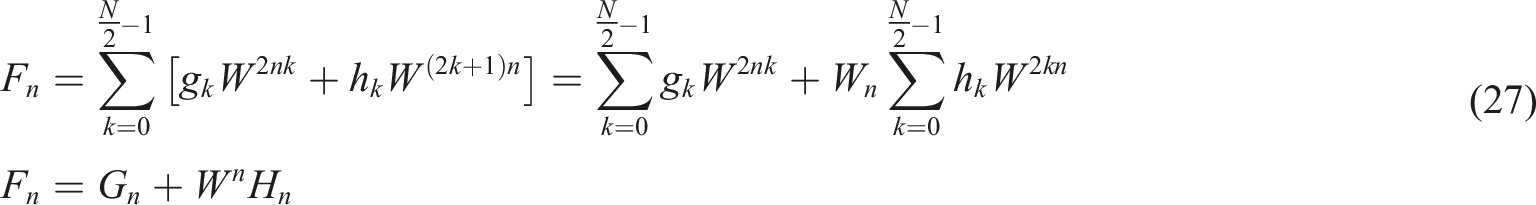
Thus, with FFT, we can quickly process the autocorrelation function of the signal to obtain the power spectral density in the frequency domain. By transforming the signal from the time domain to the frequency domain, we can analyze hidden components in the signal that would not be detected if processed in the time domain. Changes in the signal will also result in changes in the power spectral density.
Justification for the selection of MODWT and FFT
The combination of the MODWT and the FFT was chosen for this study because it offers significant advantages in terms of both signal resolution and noise separation, which are critical in SHM. MODWT was selected over other wavelet-based techniques for several reasons: • No downsampling: Unlike the DWT, MODWT does not involve downsampling, meaning that the full temporal resolution of the original signal is preserved. This is particularly important in long-term monitoring applications where no signal information should be lost. • Multiresolution capability: MODWT provides a multiresolution analysis, allowing the signal to be decomposed into components at different frequency scales. This makes it ideal for detecting both global structural changes (low-frequency vibrations) and localized damage (high-frequency vibrations). • Noise reduction: By isolating high-frequency noise and irrelevant components, MODWT improves the clarity of the vibration signals, making it easier to accurately assess structural integrity.
While MODWT excels in time-frequency analysis, it alone is insufficient for precise frequency domain analysis. By combining it with FFT, the study leverages the strengths of both methods: • Enhanced frequency resolution: FFT provides a highly accurate calculation of the PSD, enabling detailed frequency domain analysis. This is essential for identifying the specific frequency shifts that occur due to structural damage. • Complementary strengths: MODWT handles the multiscale time-domain analysis effectively, while FFT excels in high-resolution frequency domain analysis. Together, they allow for more detailed and precise identification of critical vibration modes that are sensitive to damage.
This approach offers a significant advantage over traditional methods like the STFT or CWT, which often struggle with either signal resolution or computational efficiency. The combined use of MODWT and FFT not only facilitates the separation of noise from meaningful signal components but also improves the overall accuracy and sensitivity in detecting early structural changes, making it an optimal solution for advanced structural health monitoring.
Experimental model
Experimental model
The experimental model includes the following main components: beam frame, survey vehicle, transmission system, inverter, signal receiver box, DC power supply, signal amplification circuit, multichannel receiver circuit, computer, and signal cables, all of which are detailed in Figure 6. Experimental model.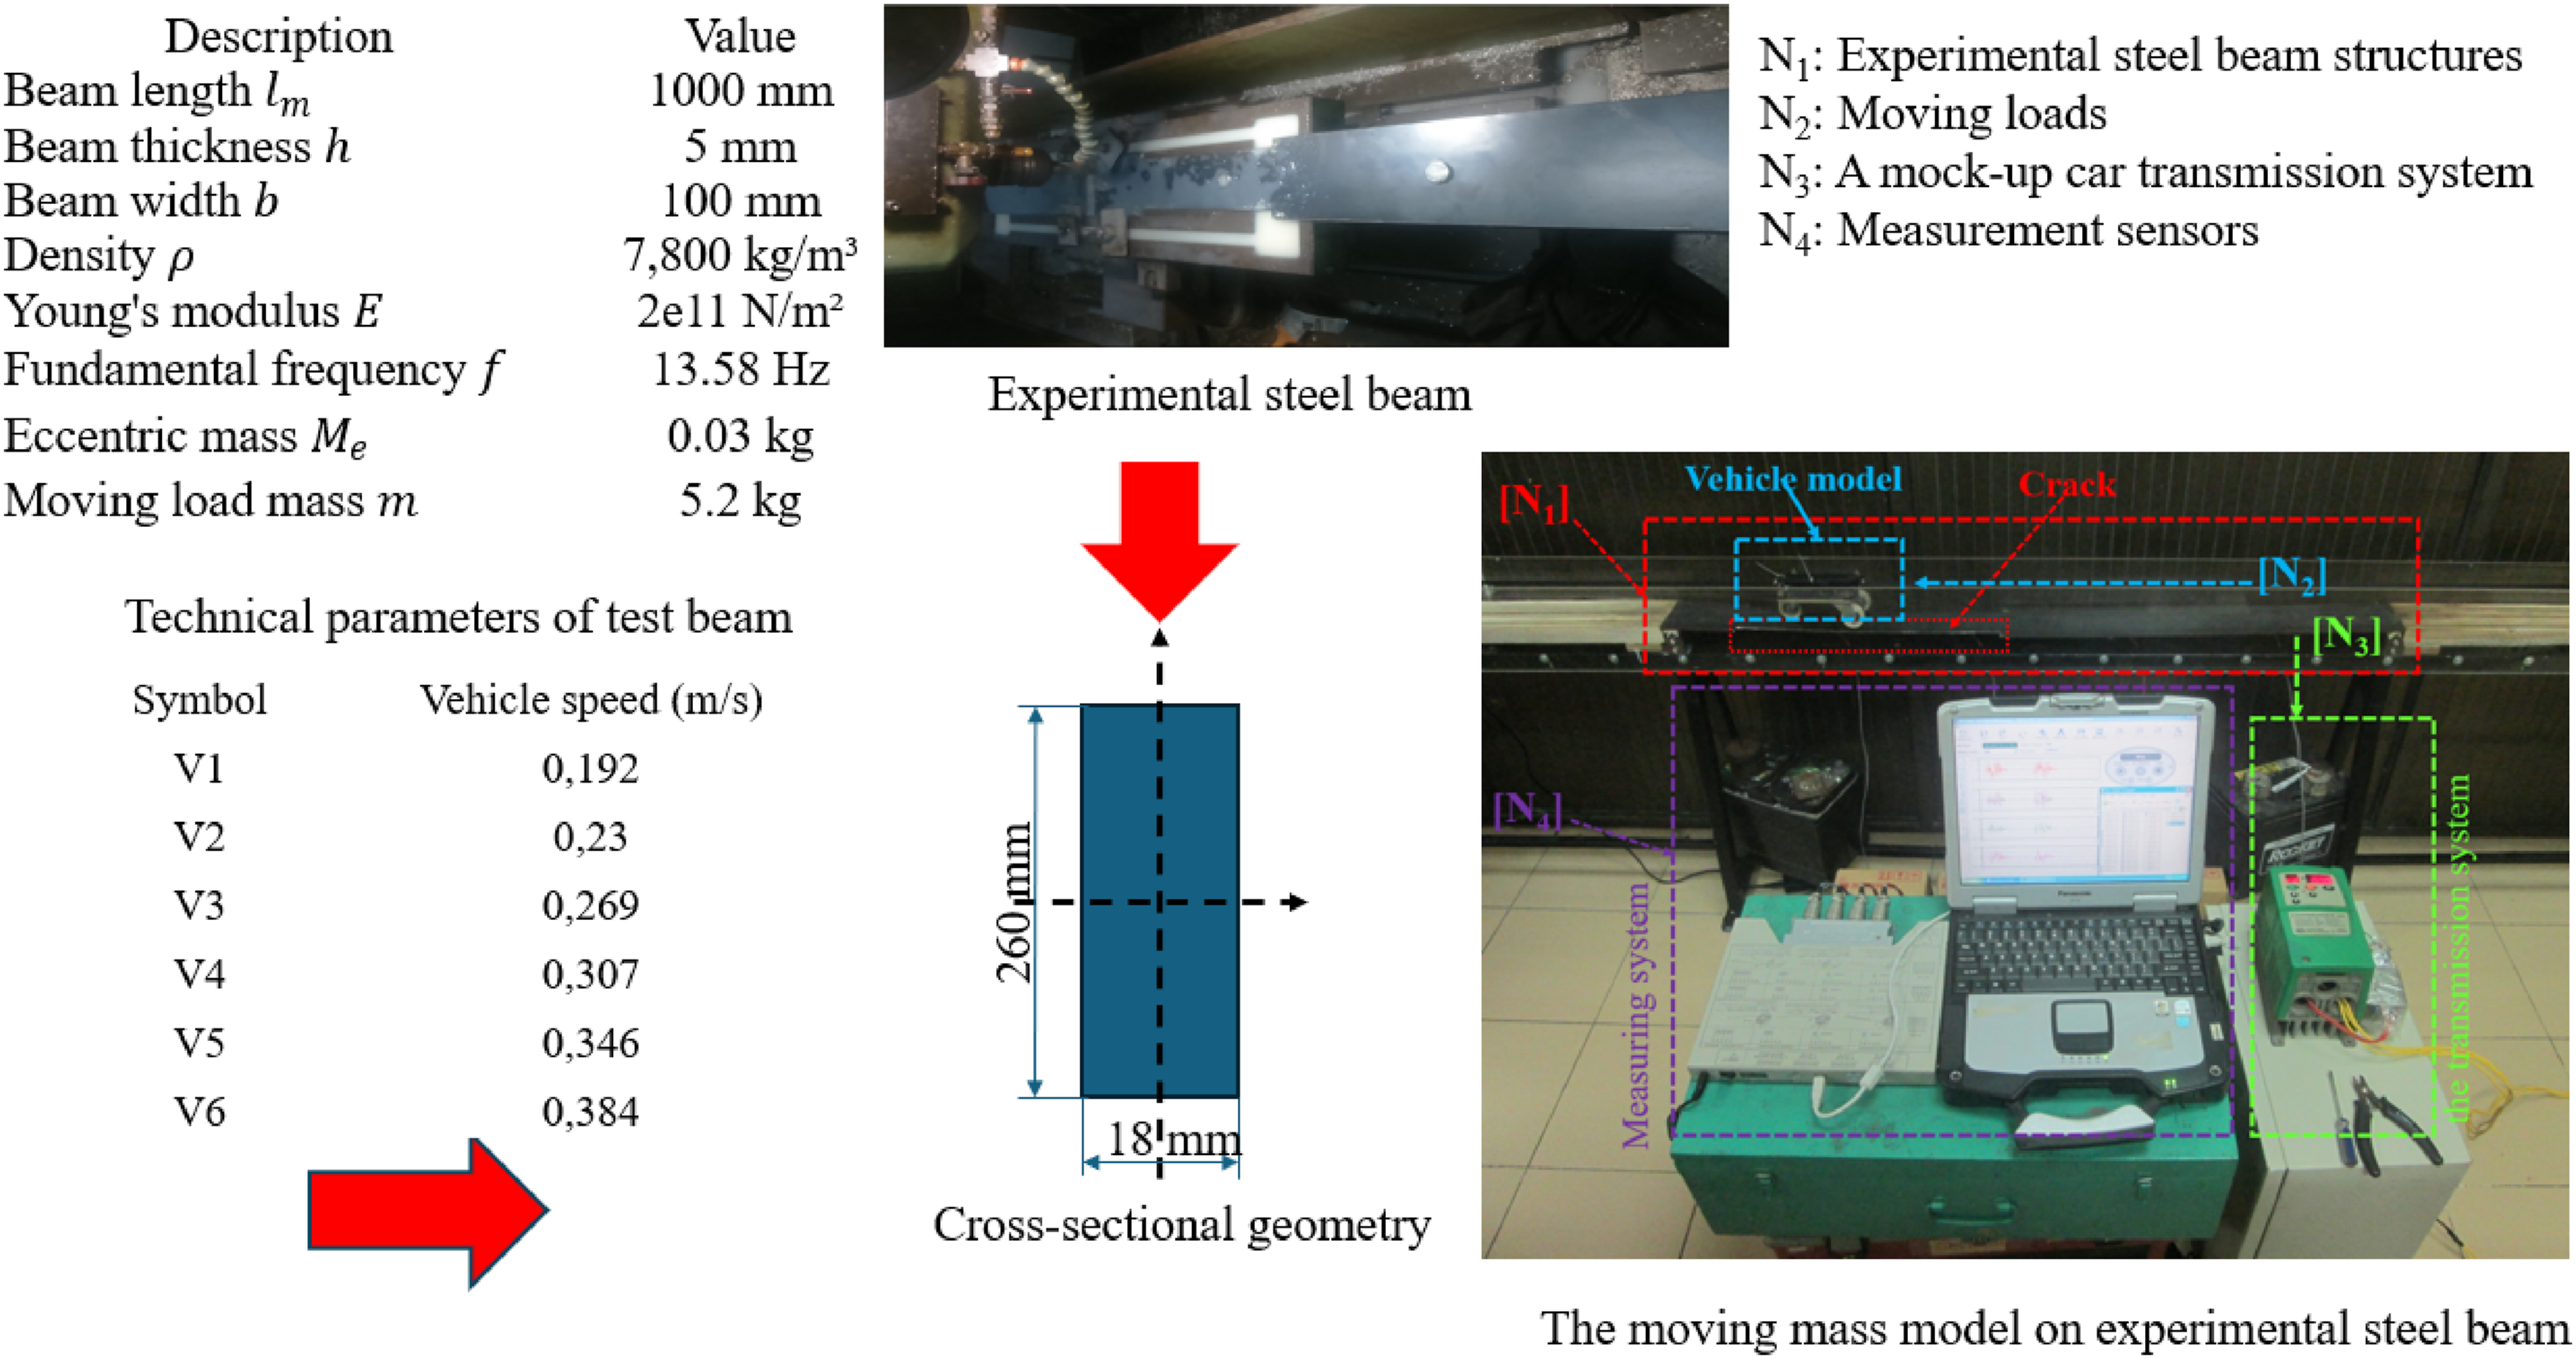
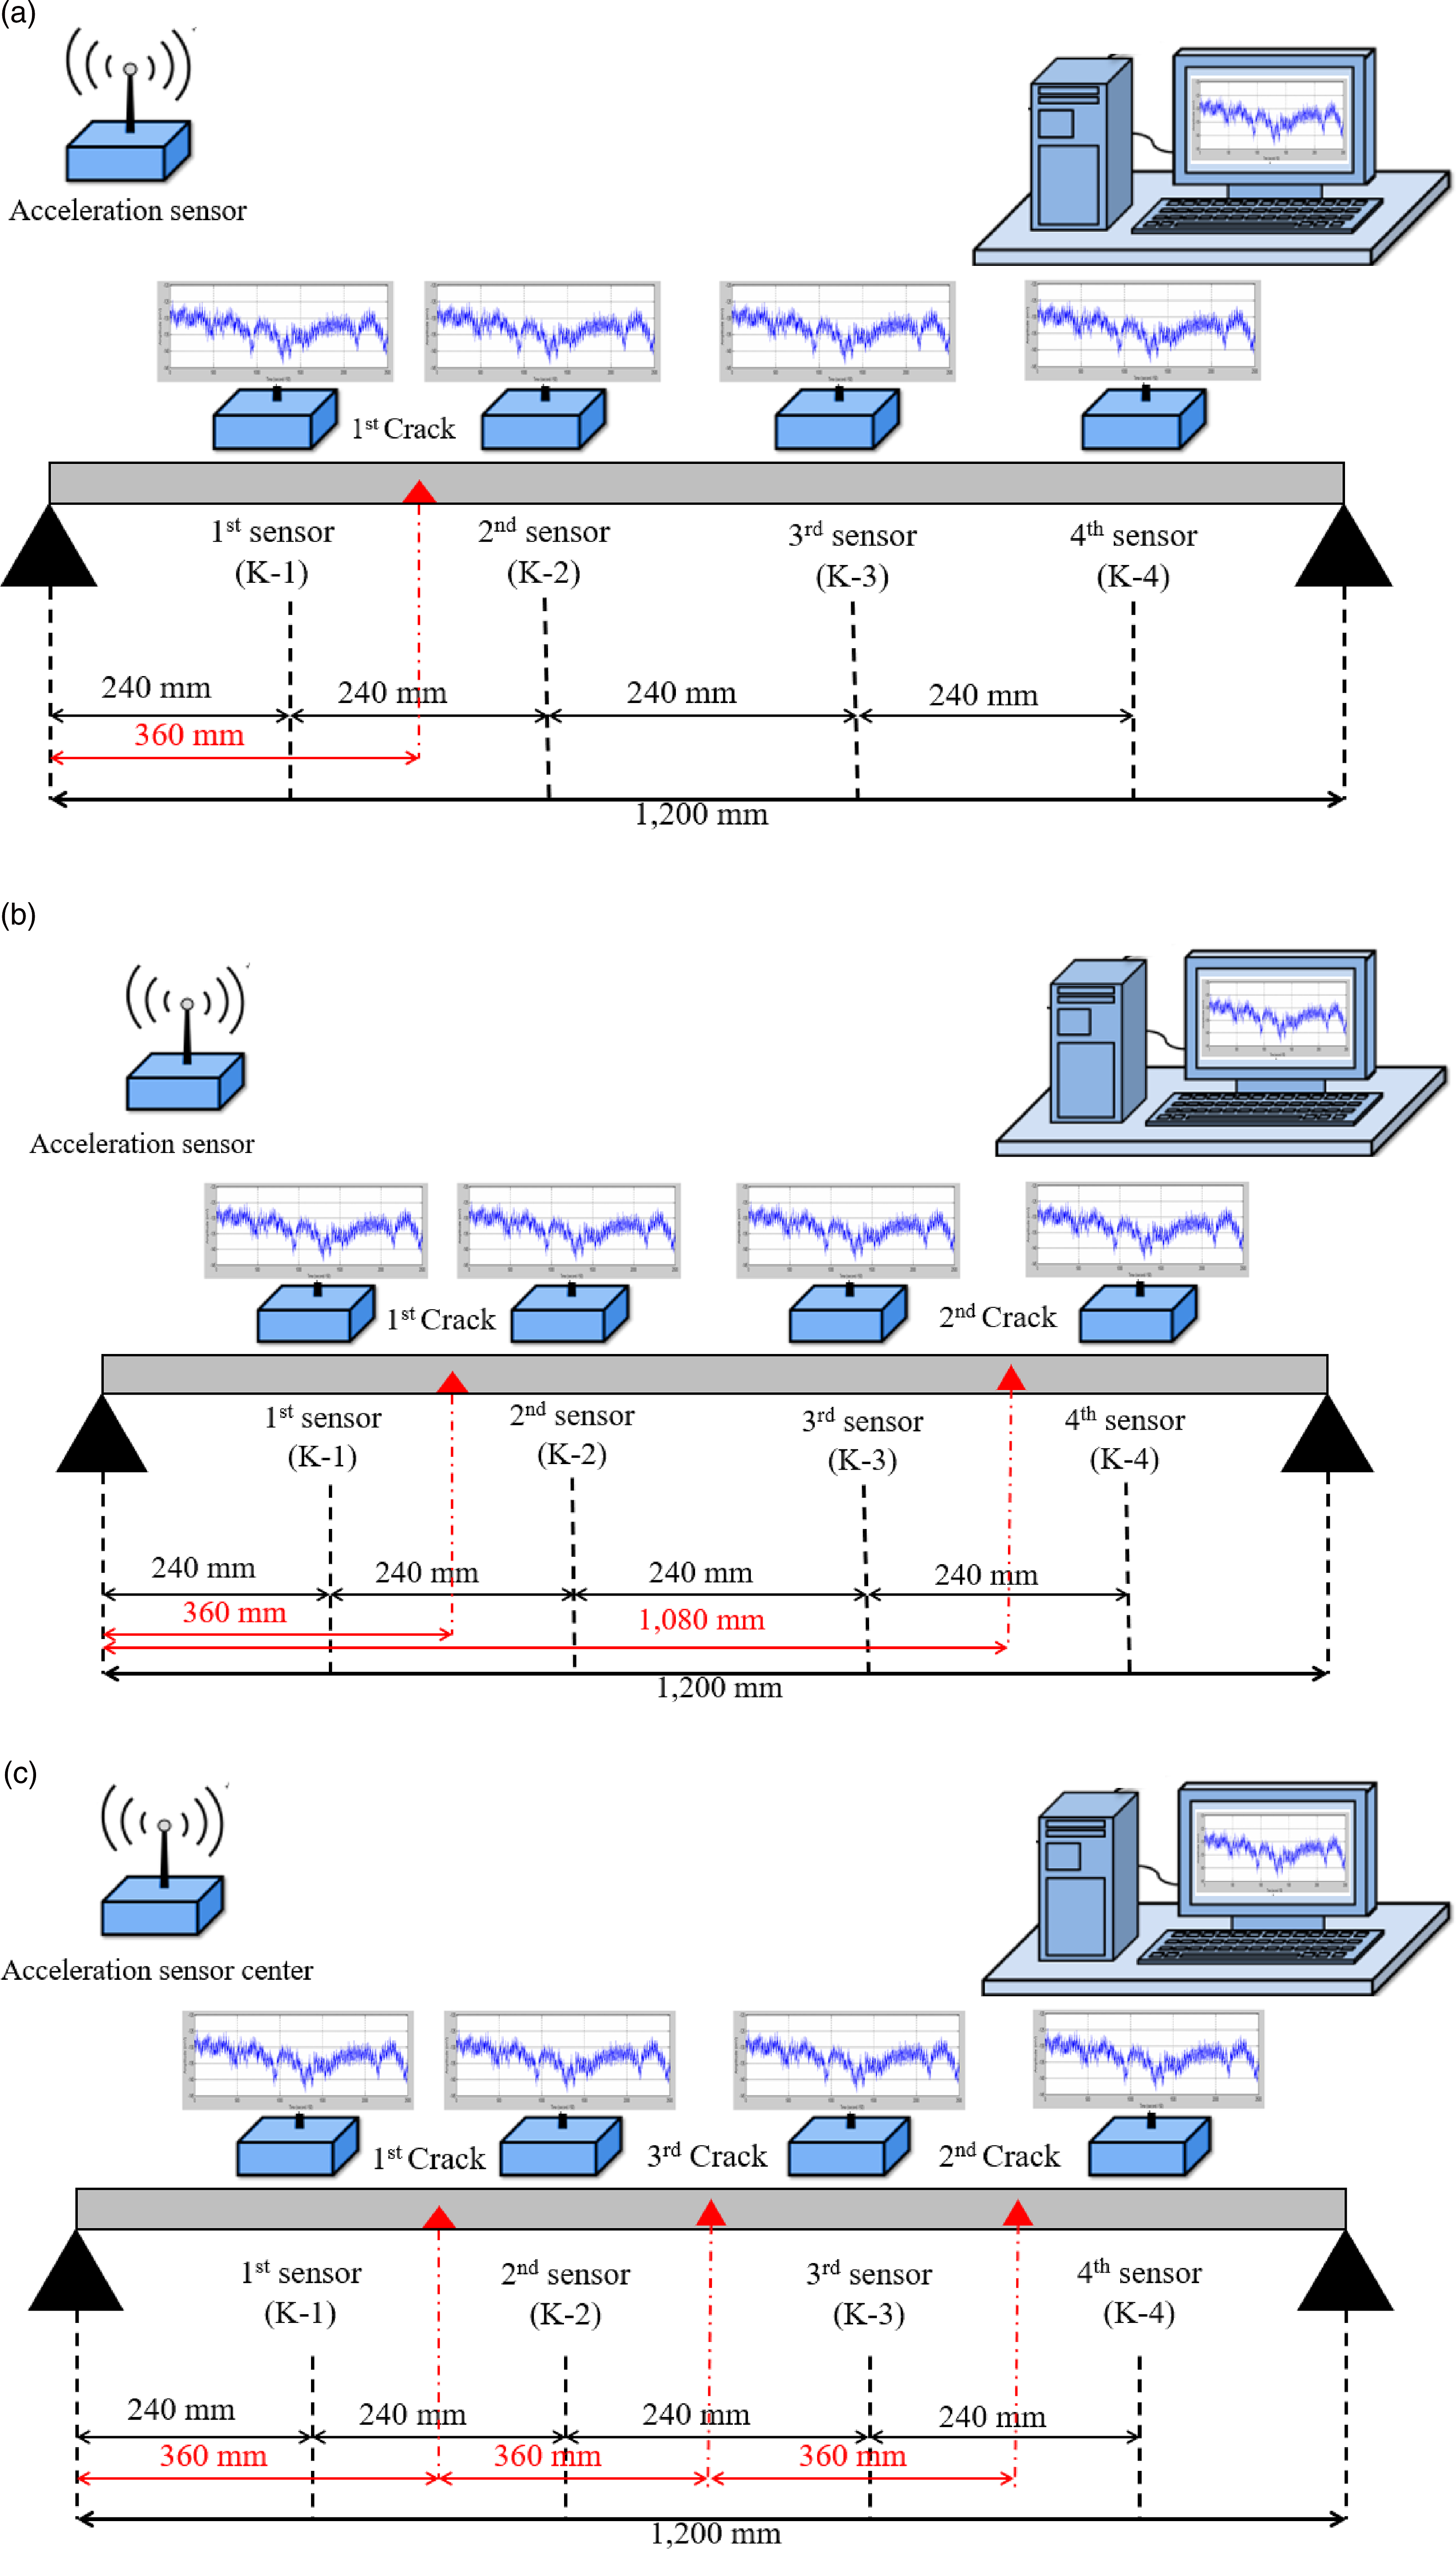
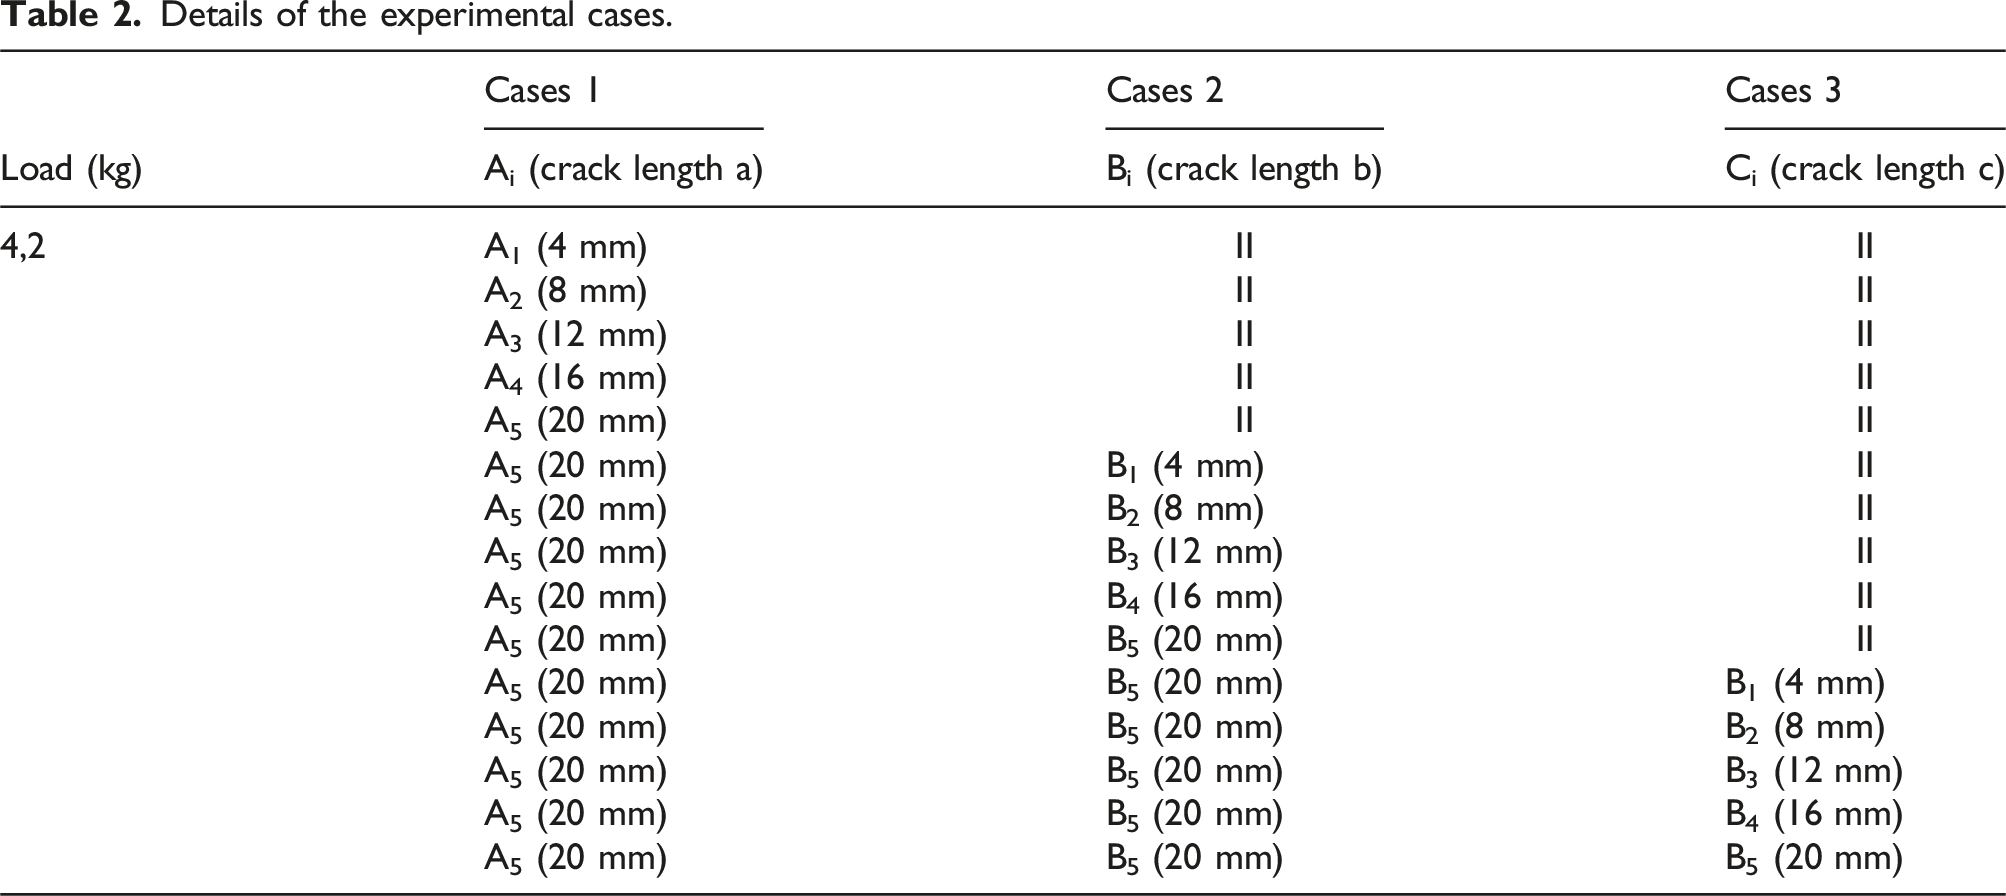
The experimental model consists of a steel beam measuring 100 cm in length, 1 cm in width, and 0.5 cm in height. The beam is supported on two rubber-padded supports to minimize external noise interference. Wooden blocks are attached to each end to simulate the real-world conditions of a vehicle moving onto a bridge. The total experimental path is 120 cm, representing the distance traveled by the vehicle along the beam. Cracks of varying lengths are introduced into the beam to simulate structural defects. These cracks are generated using precision CNC methods to ensure accurate dimensions, allowing the experiment to systematically study the relationship between crack growth and changes in the beam’s vibration response. The experiment considers three cases of crack lengths: • Case A: Varying crack lengths (4 mm, 8 mm, 12 mm, 16 mm, and 20 mm) on one end of the beam. • Case B: The crack length is fixed at 20 mm on one side, while the other end has varying crack lengths (4 mm, 8 mm, 12 mm, 16 mm, and 20 mm). • Case C: Crack lengths are varied simultaneously on both ends of the beam, with lengths ranging from 4 mm to 20 mm.
This progression of crack lengths enables the study of how defect size and location affect the vibration response, particularly in terms of the beam’s stiffness and natural frequencies. The reduction in stiffness caused by crack growth leads to changes in the beam’s vibration characteristics, making it easier to assess the sensitivity of the beam to progressive damage. By correlating these changes with the crack sizes, the study aims to develop a clear understanding of how vibration signals can serve as indicators of structural integrity.
Measurement and data processing method
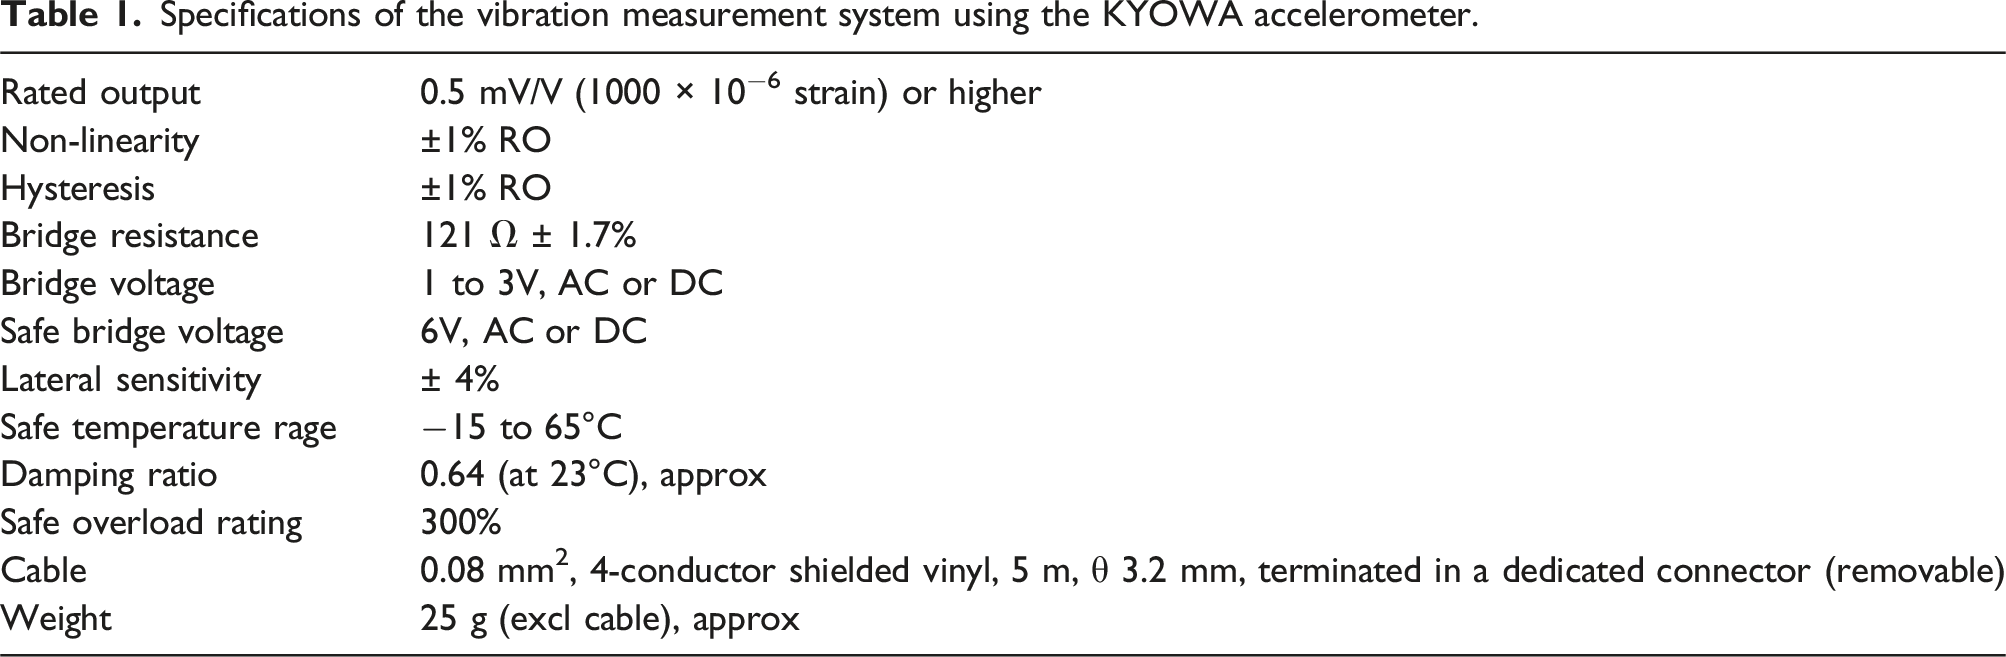
The measurement and signal processing process begins with the acquisition of the sensor, as shown in Figure 7. This signal is then amplified to enhance its strength, ensuring the accuracy and sensitivity of the data collected by the accelerometer sensor, with the specifications detailed in Table 1. After amplification, the signal is transmitted through a multichannel receiver circuit, where signals from multiple sensor sources are aggregated. The consolidated signal is transferred to the signal acquisition box, where it is normalized and prepared for the final analysis step. Finally, the processed signals are sent to a computer. Here, specialized software performs data-processing procedures such as noise filtering, frequency analysis, and other technical calculations. The final results are displayed as graphs, data tables or detailed reports, aiding in analysis and scientific conclusions. Measurement and signal processing process. Specifications of the vibration measurement system using the KYOWA accelerometer.
Vibration signals are captured using accelerometers placed at key locations along the beam, denoted as K1, K2, K3, and K4. These sensors measure the vibration response as a vehicle simulation moves along the beam. The vibration data is collected at multiple stages of the crack growth to track how the beam’s vibrational modes evolve with increasing damage. After data collection, the signals are amplified using a signal receiver box and a multichannel receiver circuit to ensure accuracy and sensitivity. The amplified signal is transmitted to a computer for processing using specialized software that filters noise, conducts frequency analysis, and isolates key vibration components. The key metrics for analysis include changes in power spectral density (PSD) and natural frequencies, both of which serve as indicators of structural damage. ➢Preparation of Experimental Samples: - A fixed load of 4.2 kg is applied uniformly across all tests to maintain consistency. The beams used in the experiments have dimensions and configurations as shown in Figure 6. - The experimental samples are designed with cracks of different lengths corresponding to three cases: A (crack length a), B (crack length b), and C (crack length c). Each case involves varying crack sizes to analyze the impact of crack length on the beam’s vibration response and structural integrity ➢Performing the experiment for each case: Case A (crack length a): - Conduct the experiment with crack lengths ranging from 4 mm to 20 mm, corresponding to the levels: A1 (4 mm), A2 (8 mm) A3 (12 mm) A4 (16 mm), and A5 (20 mm). - For each test, keep other factors constant to ensure consistency, then record the results as shown in Figure 8(a). Case B (crack length b): - Keep the crack length at 20 mm (A5). - Perform the experiment with crack lengths b ranging from 4 to 20 mm, corresponding to the levels: B1 (4 mm), B2 (8 mm), B3 (12 mm), B4 (16 mm), and B5 (20 mm). - Record the results for each crack length b and analyze the effect of b on the experimental results as shown in Figure 8(b). Case C (crack length c): - Keep the crack length at 20 mm (A5). - Keep the crack length b fixed at 20 mm (B5). - Conduct the experiment with crack lengths c ranging from 4 to 20 mm, corresponding to the levels: C1 (4 mm), C2 (8 mm), C3 (12 mm), C4 (16 mm), and C5 (20 mm). - Record the results after each combination of experiments to assess the simultaneous effect of cracks a, b, and c, as shown in Figure 8(c). (a) Experimental model for the Ai case. (b) Experimental model for the Bi case. (c) Experimental model for Ci case.
Details of the experimental cases.
MODWT and FFT application in structural vibration analysis
The vibration data is first processed using the MODWT, which decomposes the signal into approximation and detail components across multiple resolution levels. Unlike traditional wavelet transforms, MODWT avoids downsampling, preserving the entire signal’s temporal information. This allows for an accurate separation of the vibration components from noise, enhancing the clarity of the structural health analysis. Once the signal is decomposed, the FFT is applied to transform the decomposed components into the frequency domain. FFT enables the precise calculation of the PSD for each vibration mode, allowing the study to track how these frequencies change as cracks grow in size. The combination of MODWT and FFT allows for a detailed analysis of the signal’s frequency content, separating the critical vibration modes that are most sensitive to structural changes from noise and irrelevant signals.
Relationship between crack size and vibration response
The progressive introduction of cracks in the beam significantly alters the vibration response, particularly in terms of natural frequencies and PSD. As cracks grow, the stiffness of the beam decreases, leading to a corresponding decrease in the natural frequencies. The results show that for each additional crack size, the peak amplitude of the PSD decreases, and the curvature of the spectral shape changes, making these metrics reliable indicators of structural damage. Through the use of MODWT and FFT, the study successfully isolates the critical vibration modes that are most responsive to structural changes. By focusing on these modes, it is possible to detect early signs of structural degradation, enabling timely interventions and repairs. The method is shown to be effective in differentiating between noise and meaningful signals, making it an advanced tool for structural health monitoring.
Results
Power spectral density separation
PSD is the result of transforming vibration signals from the time domain to the frequency domain through FFT of the autocorrelation function of the original signal. This creates a spectrum with continuous frequencies, which may include multiple distinct frequencies representing various separate signal components. The spectrum obtained from this transformation is a combination of the power spectral densities of individual signals, corresponding to specific vibrations occurring within the structure. When the MODWT analysis method is used, the distinct signals can be separated from the overall signal, and the power spectral density of each individual signal can also be isolated. This allows for a detailed analysis and evaluation of each distinct vibration component, as illustrated in Figure 9. Spectrum components analyzed from separated signals.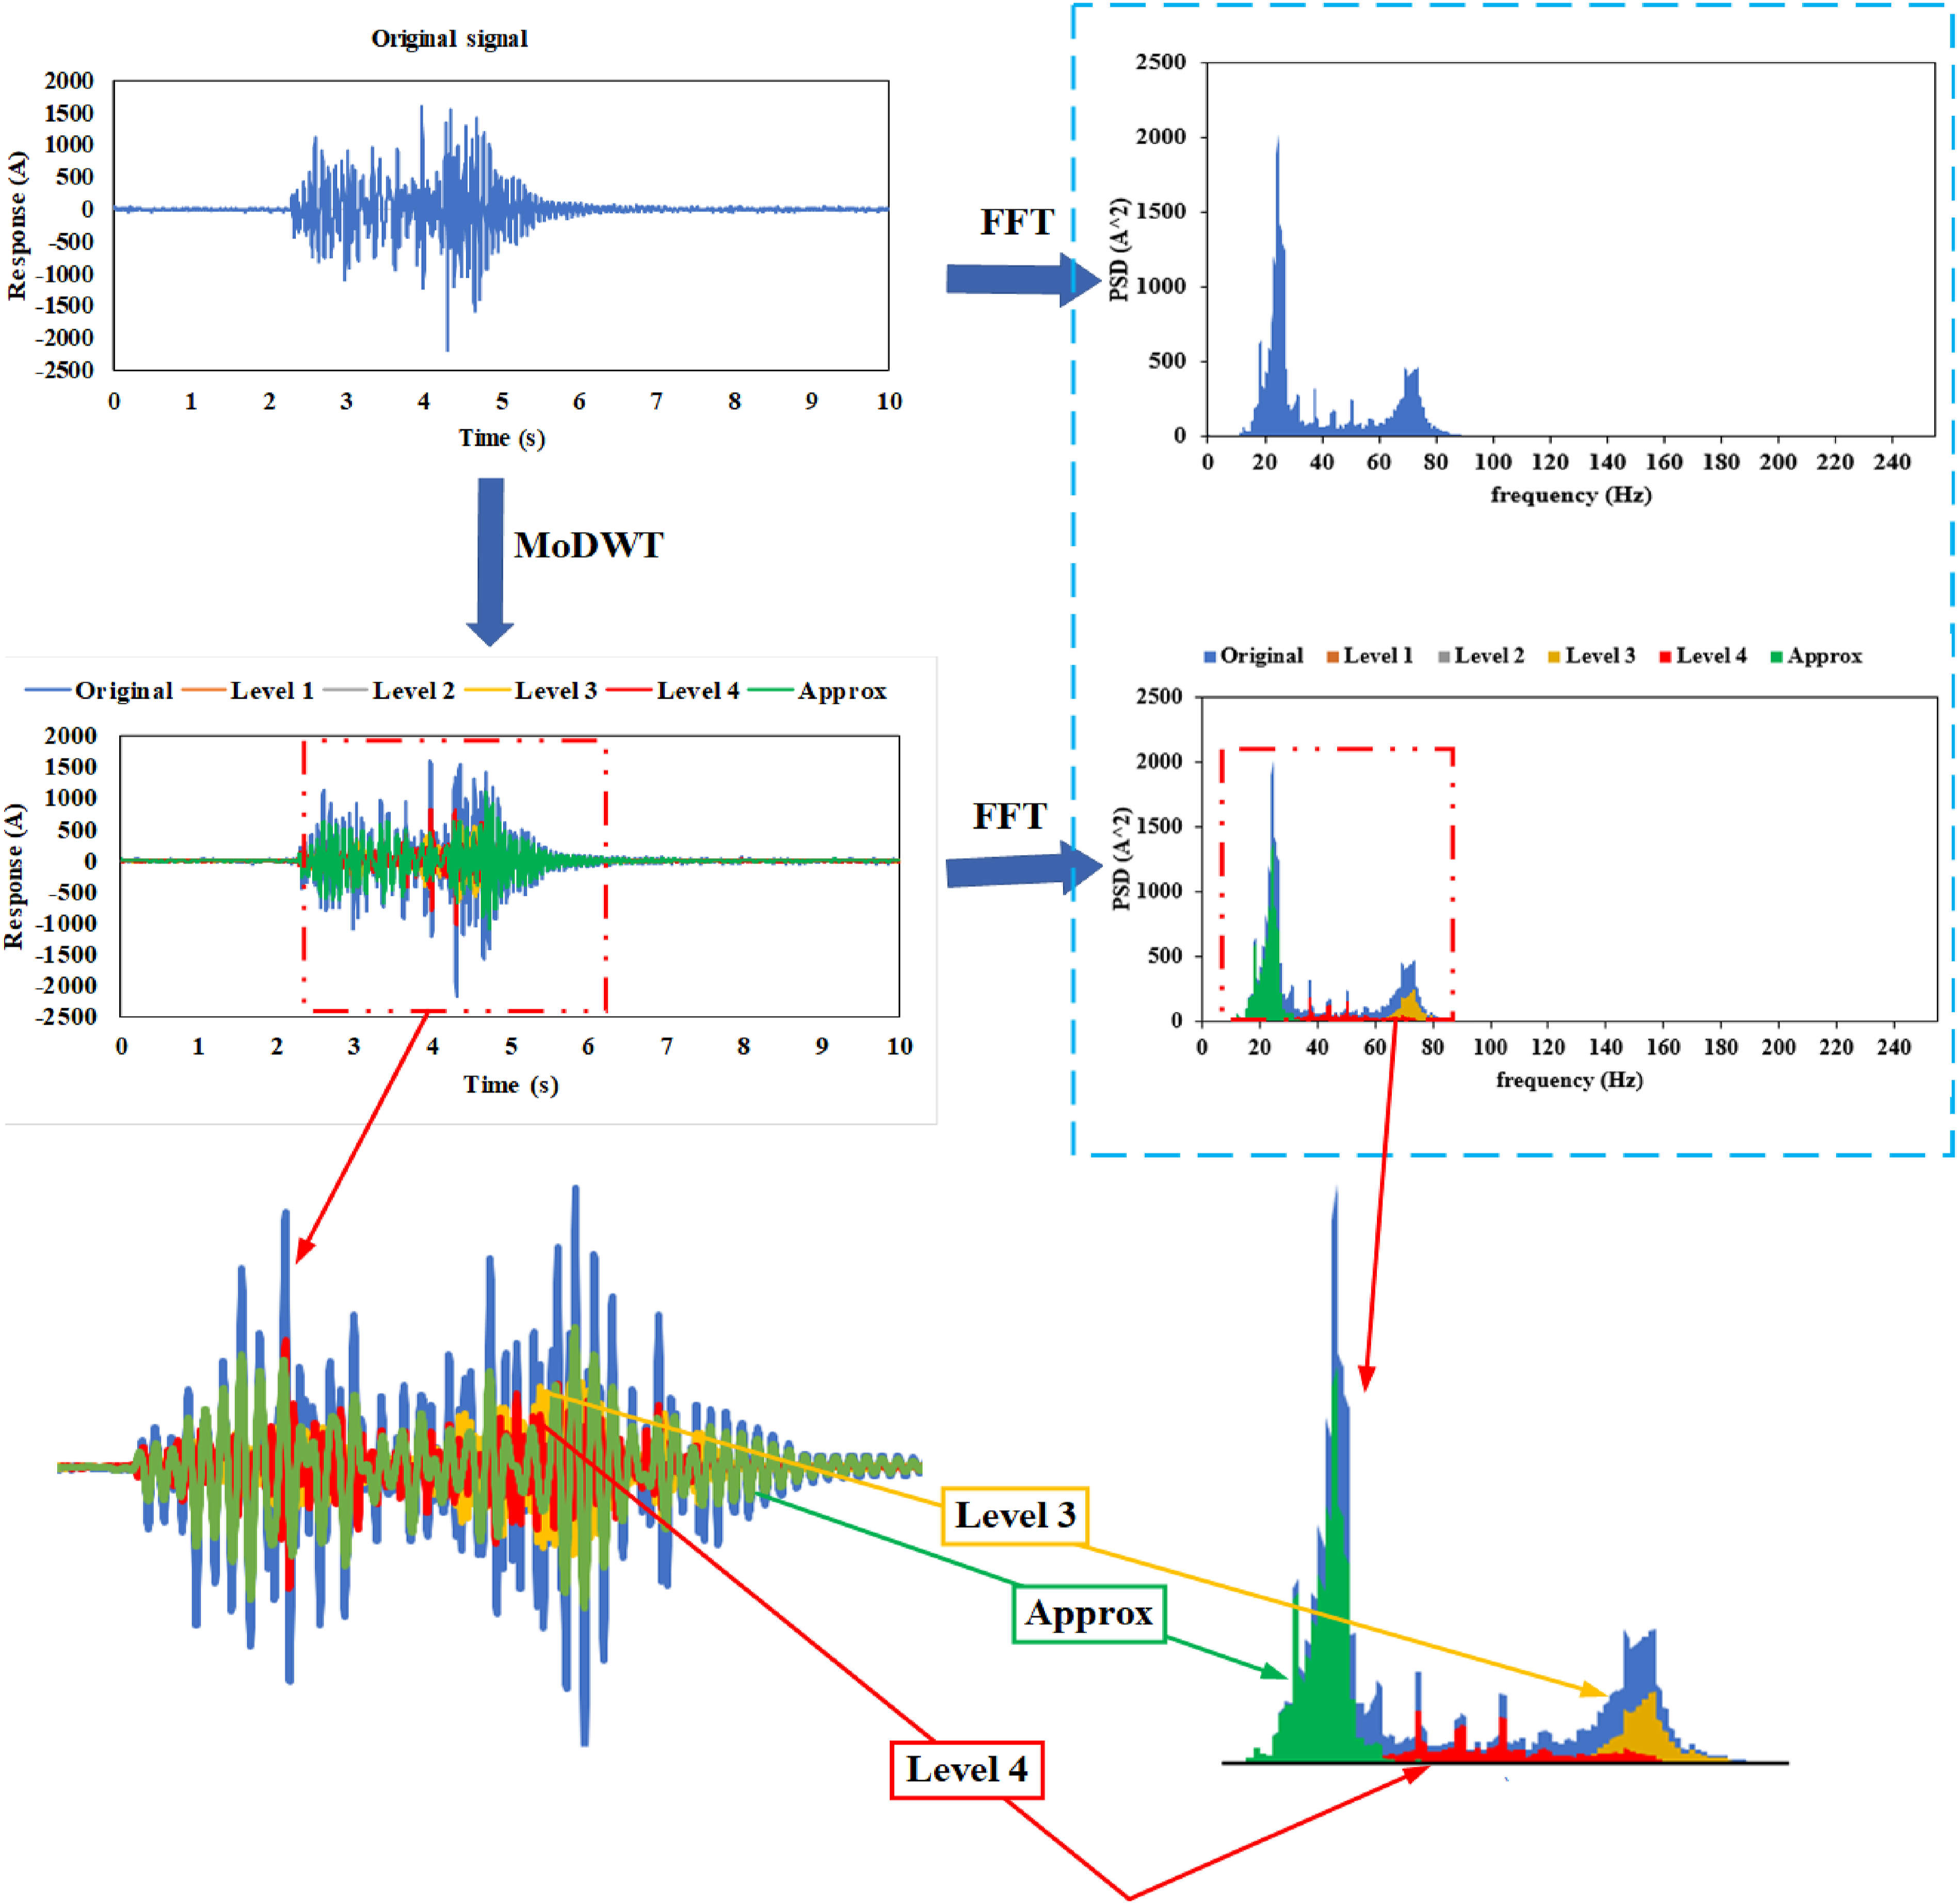
It can be observed that the power spectral densities consist of distinct vibration regions, demonstrating that the combined MODWT and FFT method used in this study successfully separates individual signals from the overall signal. As illustrated in Figure 9, the signal separated at level 4 is not an individual signal, but a noise component within the group of overall signals. Due to this separation process, unwanted noise or irrelevant signals were filtered out, eliminating disruptive factors and improving the accuracy of analyzing key signals in the vibration system.
Separation and selection of signal types for investigation
To easily identify the signal types that need to be investigated, the study separated the signals obtained from the experiment into three distinct spectra. Among them, two spectra have significantly higher amplitudes compared to the remaining one, indicating that these are the spectra formed from the main signals that we need to focus on. These signals directly affect the subject being studied and evaluated. Conversely, the smaller spectrum is typically related to noise signals or those with very low amplitude, insufficient to provide important information for the research. Generally, during data processing and analysis, these components are eliminated to focus on crucial signals, as shown in Figure 10. Power spectral density separation.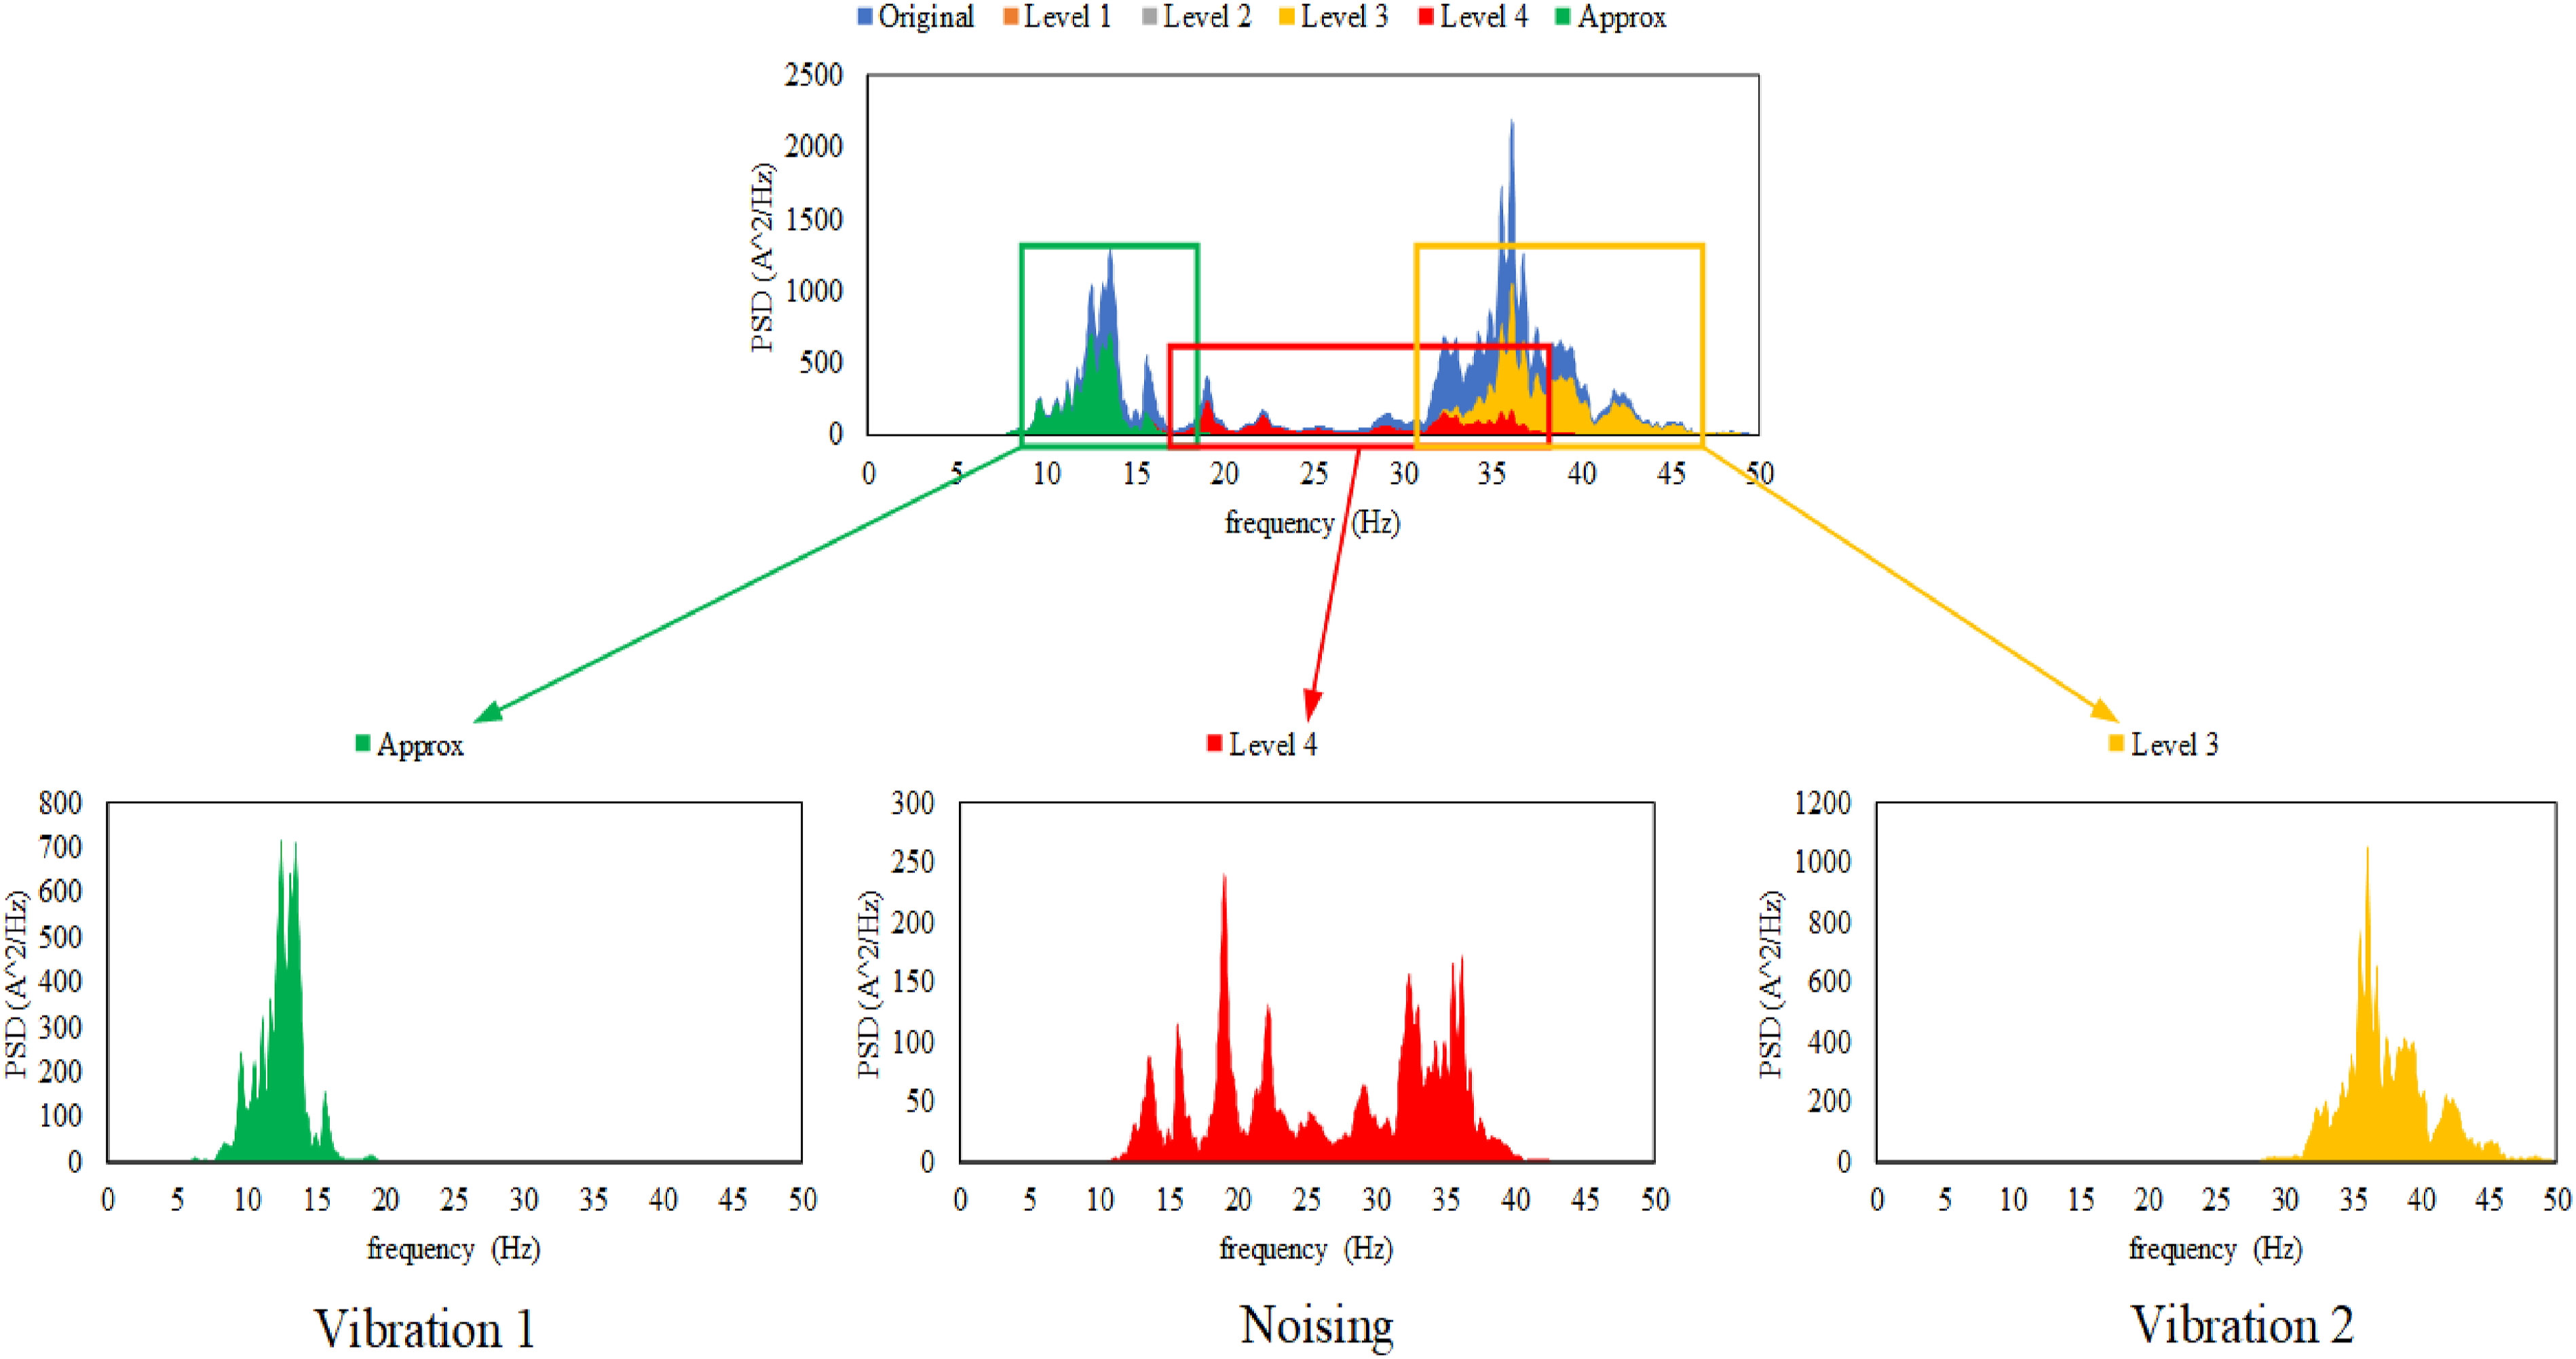
In Figure 10, the peaks observed in the power spectral density (PSD) separation correspond to the natural frequencies of the structure and the predominant excitation frequency introduced during the experimental process. These natural frequencies represent the inherent vibrational modes of the beam, which are directly influenced by the structural properties such as stiffness and mass. As damage progresses, such as crack growth, these natural frequencies exhibit noticeable shifts and reductions in amplitude, indicating structural degradation. Additionally, the predominant excitation frequency, associated with the applied external loading during the experiment, also appears as a distinct peak in the PSD, reflecting the dynamic response of the structure to the imposed forces. To provide greater clarity, the revised manuscript will annotate each peak in Figure 10, specifying the associated natural frequencies and the excitation frequency. Furthermore, we will include an expanded discussion explaining how these frequencies relate to the structural condition, emphasizing their critical role in identifying and monitoring damage. This detailed analysis ensures a comprehensive understanding of the PSD results and their implications for structural health monitoring.
The results from the PSD and vibration mode analysis demonstrate significant shifts in frequency and amplitude as the structural condition changes. Figure 10 shows the spectral separation of vibration components, which is a crucial indicator of structural health. These frequency shifts reflect changes in the stiffness and integrity of the structure, which occur as cracks or other forms of damage develop and progress. In particular, the gradual reduction in the peak amplitude of the PSD, coupled with shifts in the natural frequency, indicates a weakening of the structure. This reduction is a direct result of the decreased stiffness caused by cracks, which alters the vibrational characteristics of the beam. Monitoring these changes in the vibration spectrum allows for early detection of structural deterioration, enabling timely interventions to prevent further damage. The separation of individual vibration modes using MODWT further enhances the clarity of these observations. By isolating the most sensitive vibration modes, the analysis highlights specific frequency bands that are most affected by structural changes. These bands can serve as early indicators of damage, as even minor shifts in these frequencies can signal the onset of cracks or deformations. Overall, the interpretation of these results suggests that the combination of MODWT and FFT provides a more accurate and detailed view of the structural health of the beam. The clear correlation between frequency shifts, amplitude changes, and structural damage emphasizes the practical utility of this method for real-time monitoring and early damage detection in engineering applications.
Thus, by applying the MODWT multiresolution analysis method, the study was able to separate two distinct vibration spectra from the same original signal obtained from the experiment. To determine which vibration spectrum is more sensitive to damage on the beam, the study analyzed a series of vibration signals obtained after several iterations of cracking and increasing the crack size on the beam. The power spectral density of these signals was then separated into two different vibration types, as illustrated in Figure 10. Analyzing these vibration types helps the study assess the sensitivity of each spectrum to the damage on the beam, thereby drawing more accurate conclusions about the structural condition.
Figure 11 presents the separation of two distinct vibration types derived from the overall vibration signals. This graph highlights how different vibration modes respond to structural damage. Specifically, Vibration 1 shows inconsistent changes in frequency and amplitude with crack progression, suggesting that this mode is less sensitive to structural damage. In contrast, Vibration 2 demonstrates a more predictable and stable pattern, with clear reductions in peak amplitude and frequency as damage increases. This indicates that Vibration 2 is a more reliable indicator of damage, as its behavior correlates directly with the growth of cracks in the structure. The significance of this observation is crucial for the SHM systems. By focusing on the vibration mode most sensitive to damage (in this case, Vibration 2), SHM systems can achieve more accurate detection of structural changes, reducing the likelihood of false positives or negatives. This targeted approach helps prioritize the vibration components that are most useful for assessing the structure’s integrity, thereby enhancing the precision of damage detection. Figure 11 shows the progressive changes in the PSD peak values across different levels of damage. The graph reveals that, as the cracks deepen, the peak amplitude of the PSD for Vibration 2 decreases steadily. This trend provides a direct measure of the structure’s degradation: the greater the reduction in the PSD peak, the more severe the structural damage. The gradual decrease in frequency and amplitude highlights the effectiveness of PSD analysis for quantifying the extent of damage. This finding emphasizes the utility of PSD changes as a diagnostic tool, providing engineers with quantitative metrics for assessing structural health. Additionally, the comparison between the behaviors of Vibration 1 and Vibration 2 underscores the importance of selecting the appropriate vibration mode for analysis. While Vibration 1 may show random fluctuations that are less reliable for detecting damage, Vibration 2 offers a stable and consistent response, making it a critical component in early damage detection. Separated Vibration Types from some signals after multiple cracks.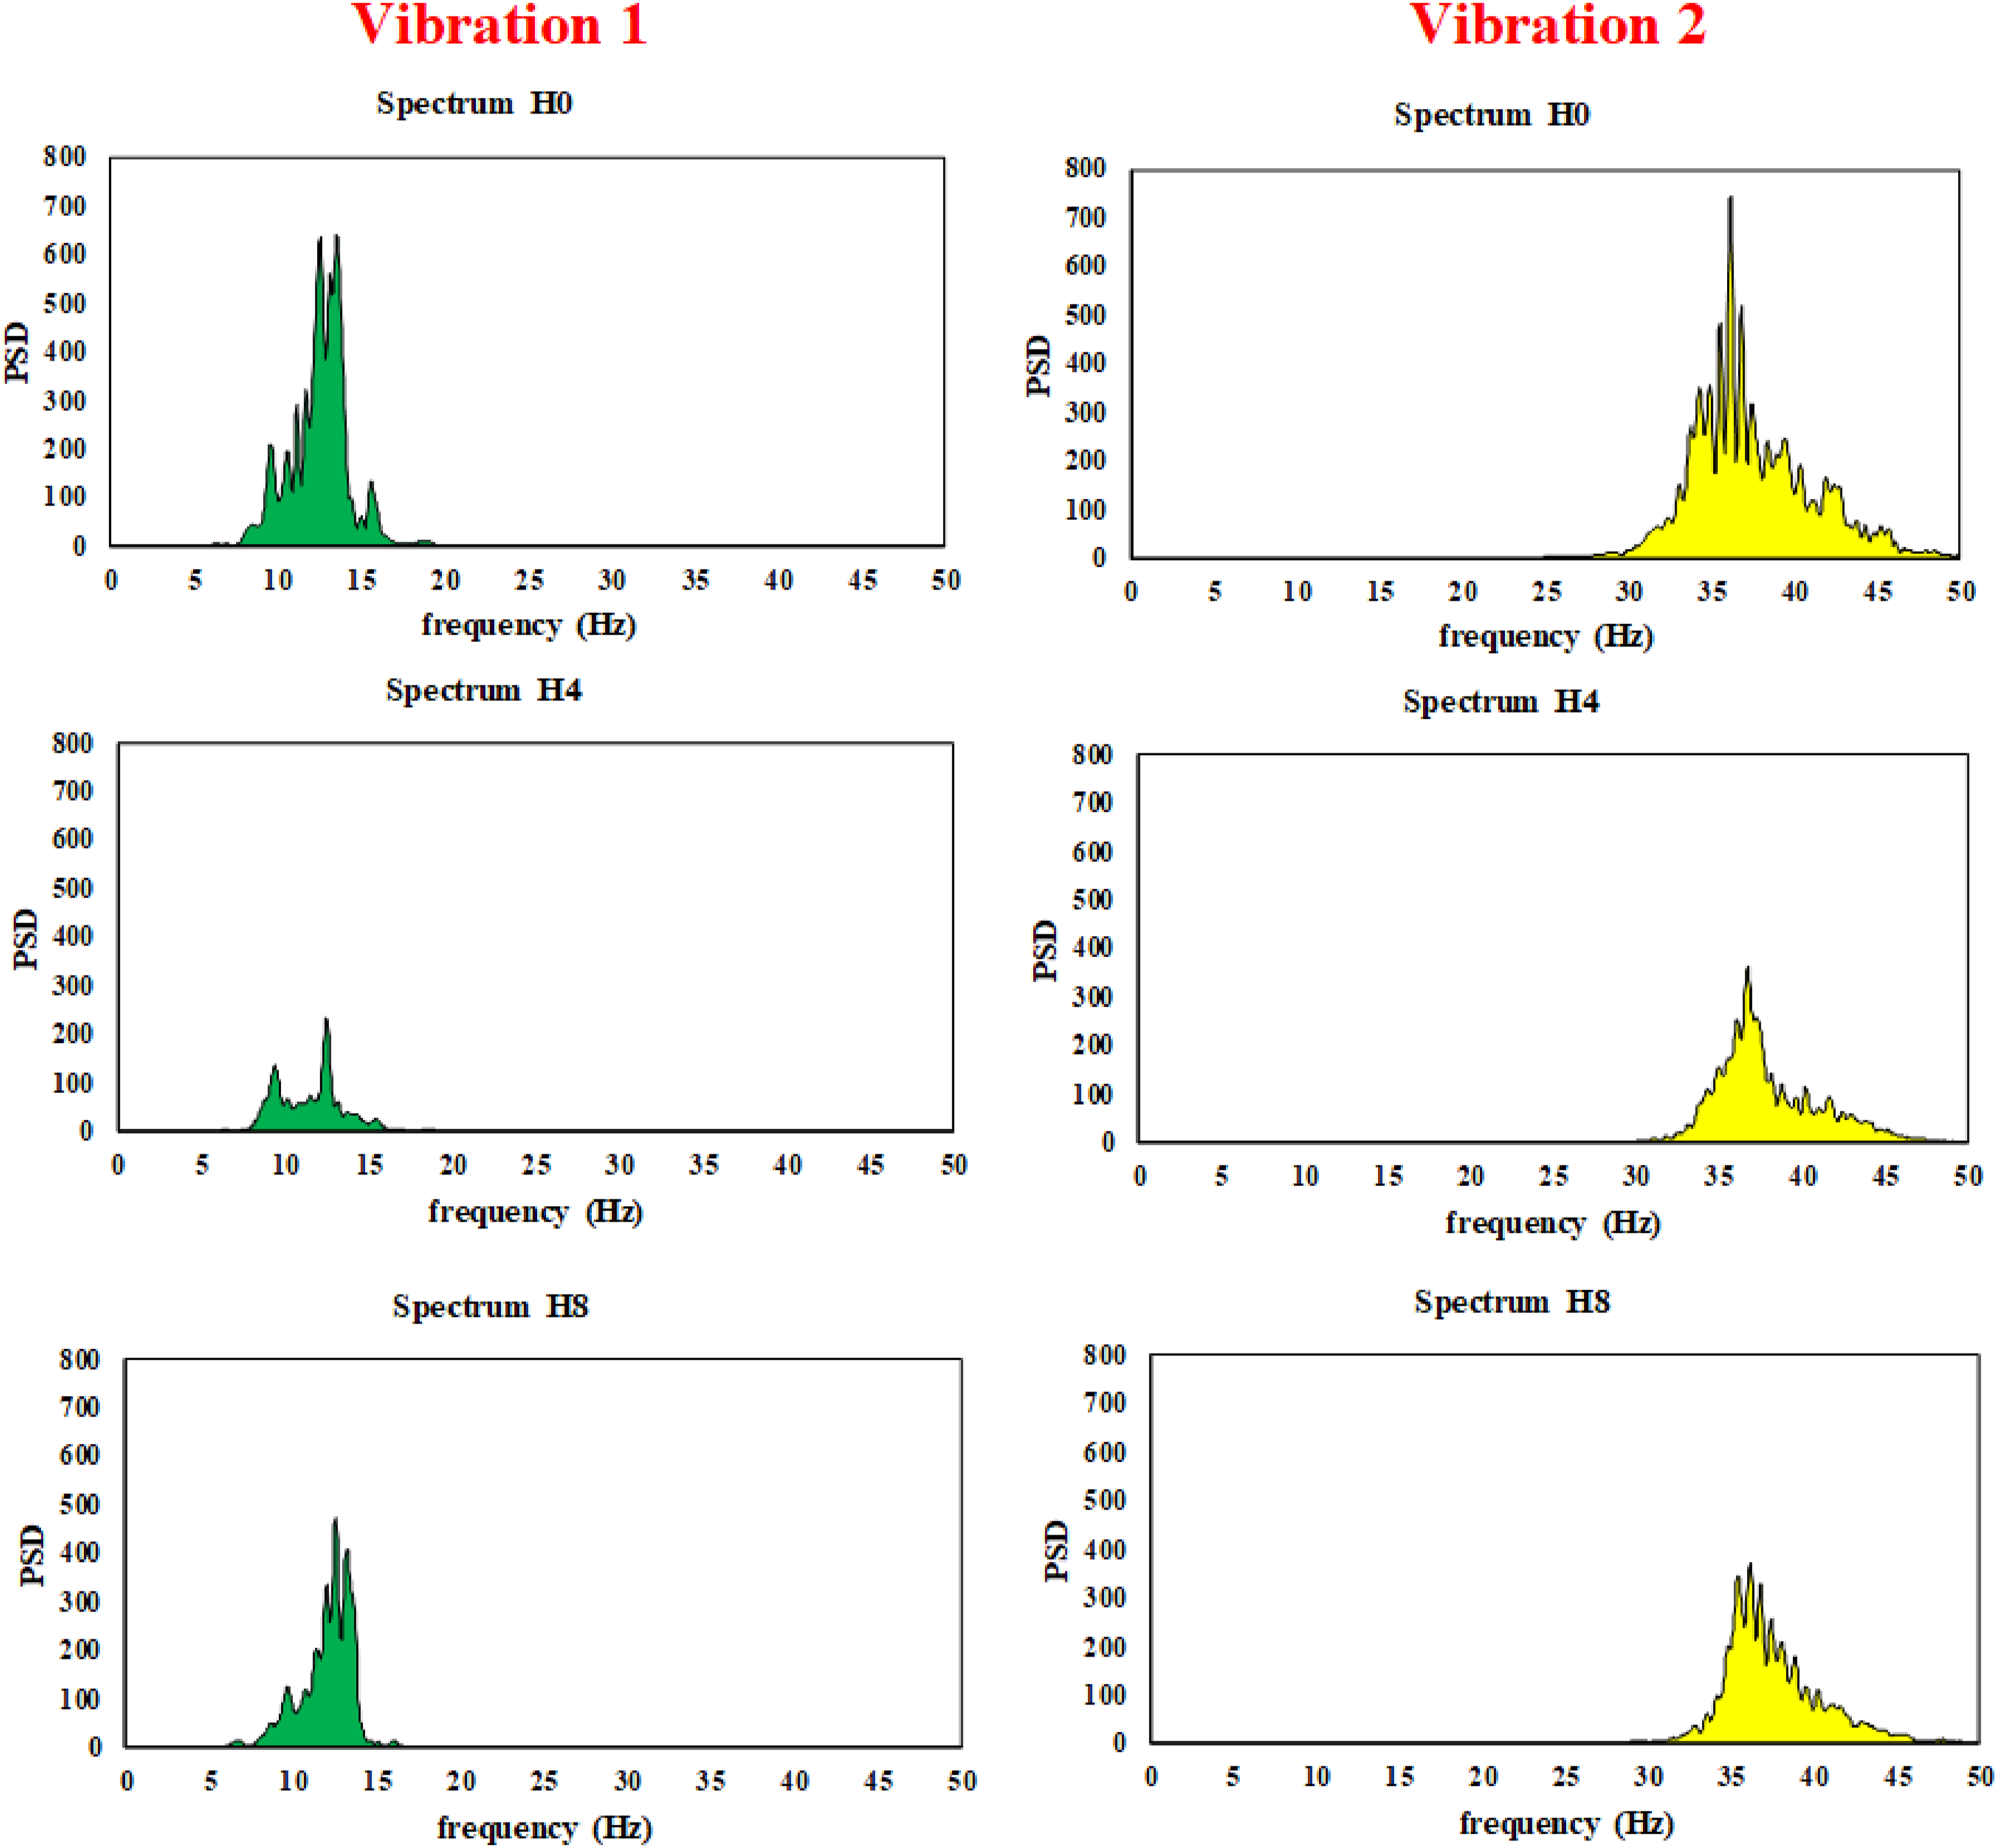
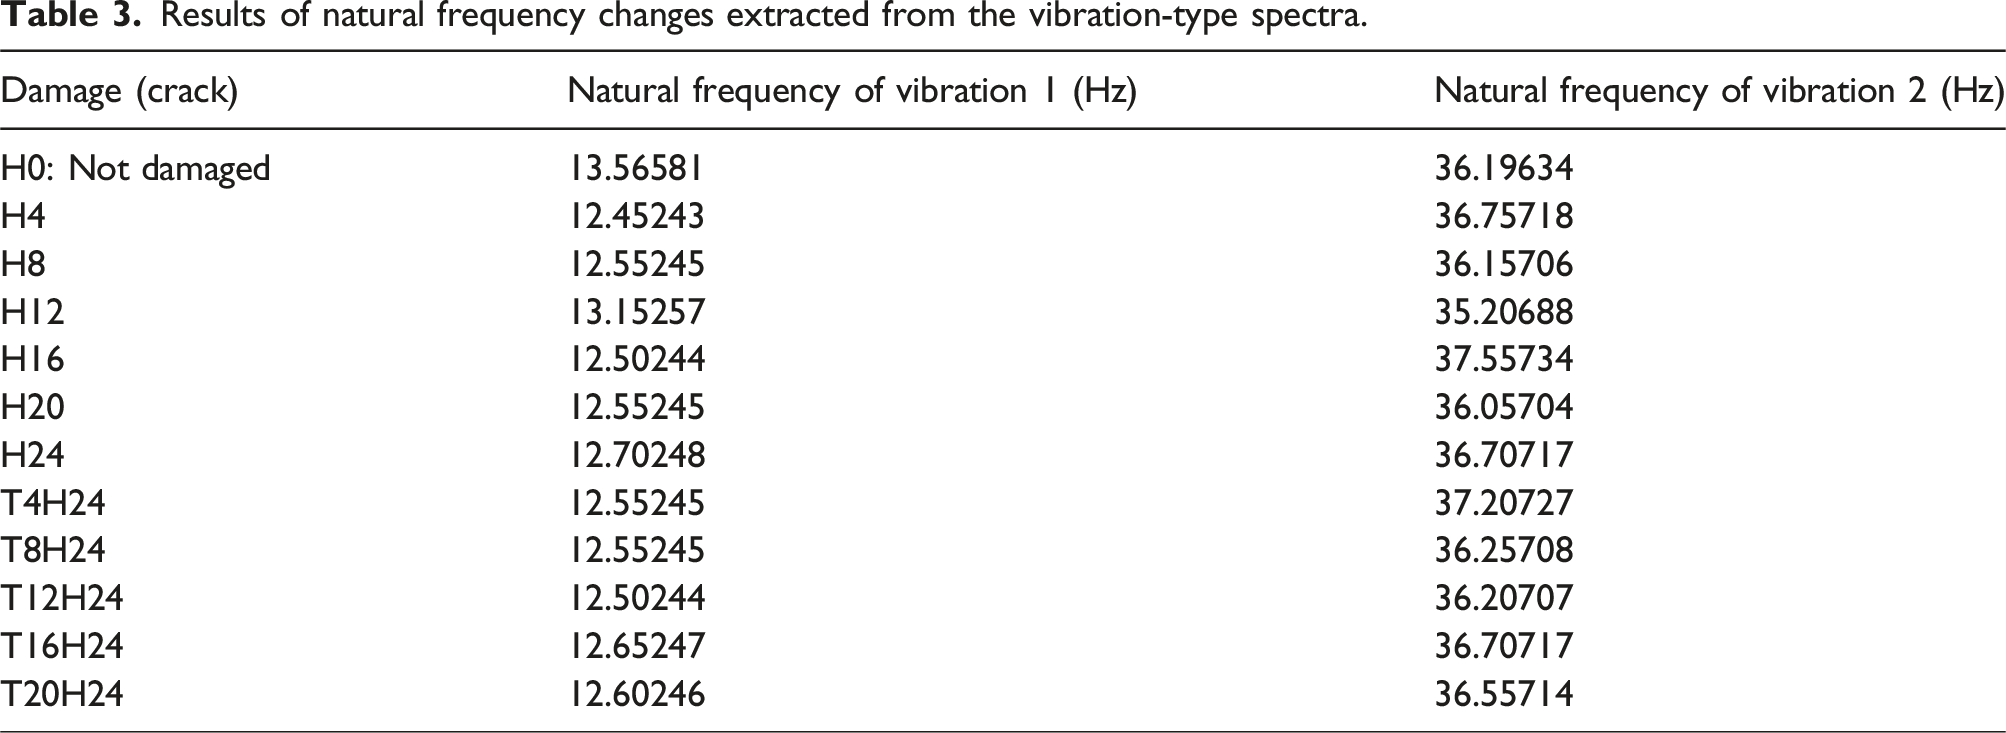
Results of natural frequency changes extracted from the vibration-type spectra.
As shown in Figure 12, the peak power spectral density of the second vibration mode (vibration (2) shows consistent changes throughout the progression of damage (crack) in the beam. This clearly reflects the correlation between increasing damage and a decrease in the power spectral density. On the contrary, the power spectral density of the first vibration mode (vibration (1) fluctuates irregularly, sometimes increasing and sometimes decreasing, without following any consistent pattern, indicating that this vibration mode is not stable enough for damage assessment. Based on the preliminary investigation of these two vibration modes, the study decided not to use natural frequency as a characteristic quantity for analyzing changes in the power spectral density. Instead, the paper chooses the peak power spectral density as the primary indicator for assessing spectral changes. This quantity shows a noticeable change throughout the damage process, with a trend of decreasing as the damage on the beam increases. Particularly for the second vibration mode (vibration 2), the peak power spectral density exhibits stable and consistent changes, progressively decreasing with each cracking stage. Therefore, the paper selects this vibration mode as the main criterion for investigation, as it is more sensitive to damage and provides more reliable information on the structural condition of the beam. Changes in peak power spectral density across cracks for vibrations 1 and 2.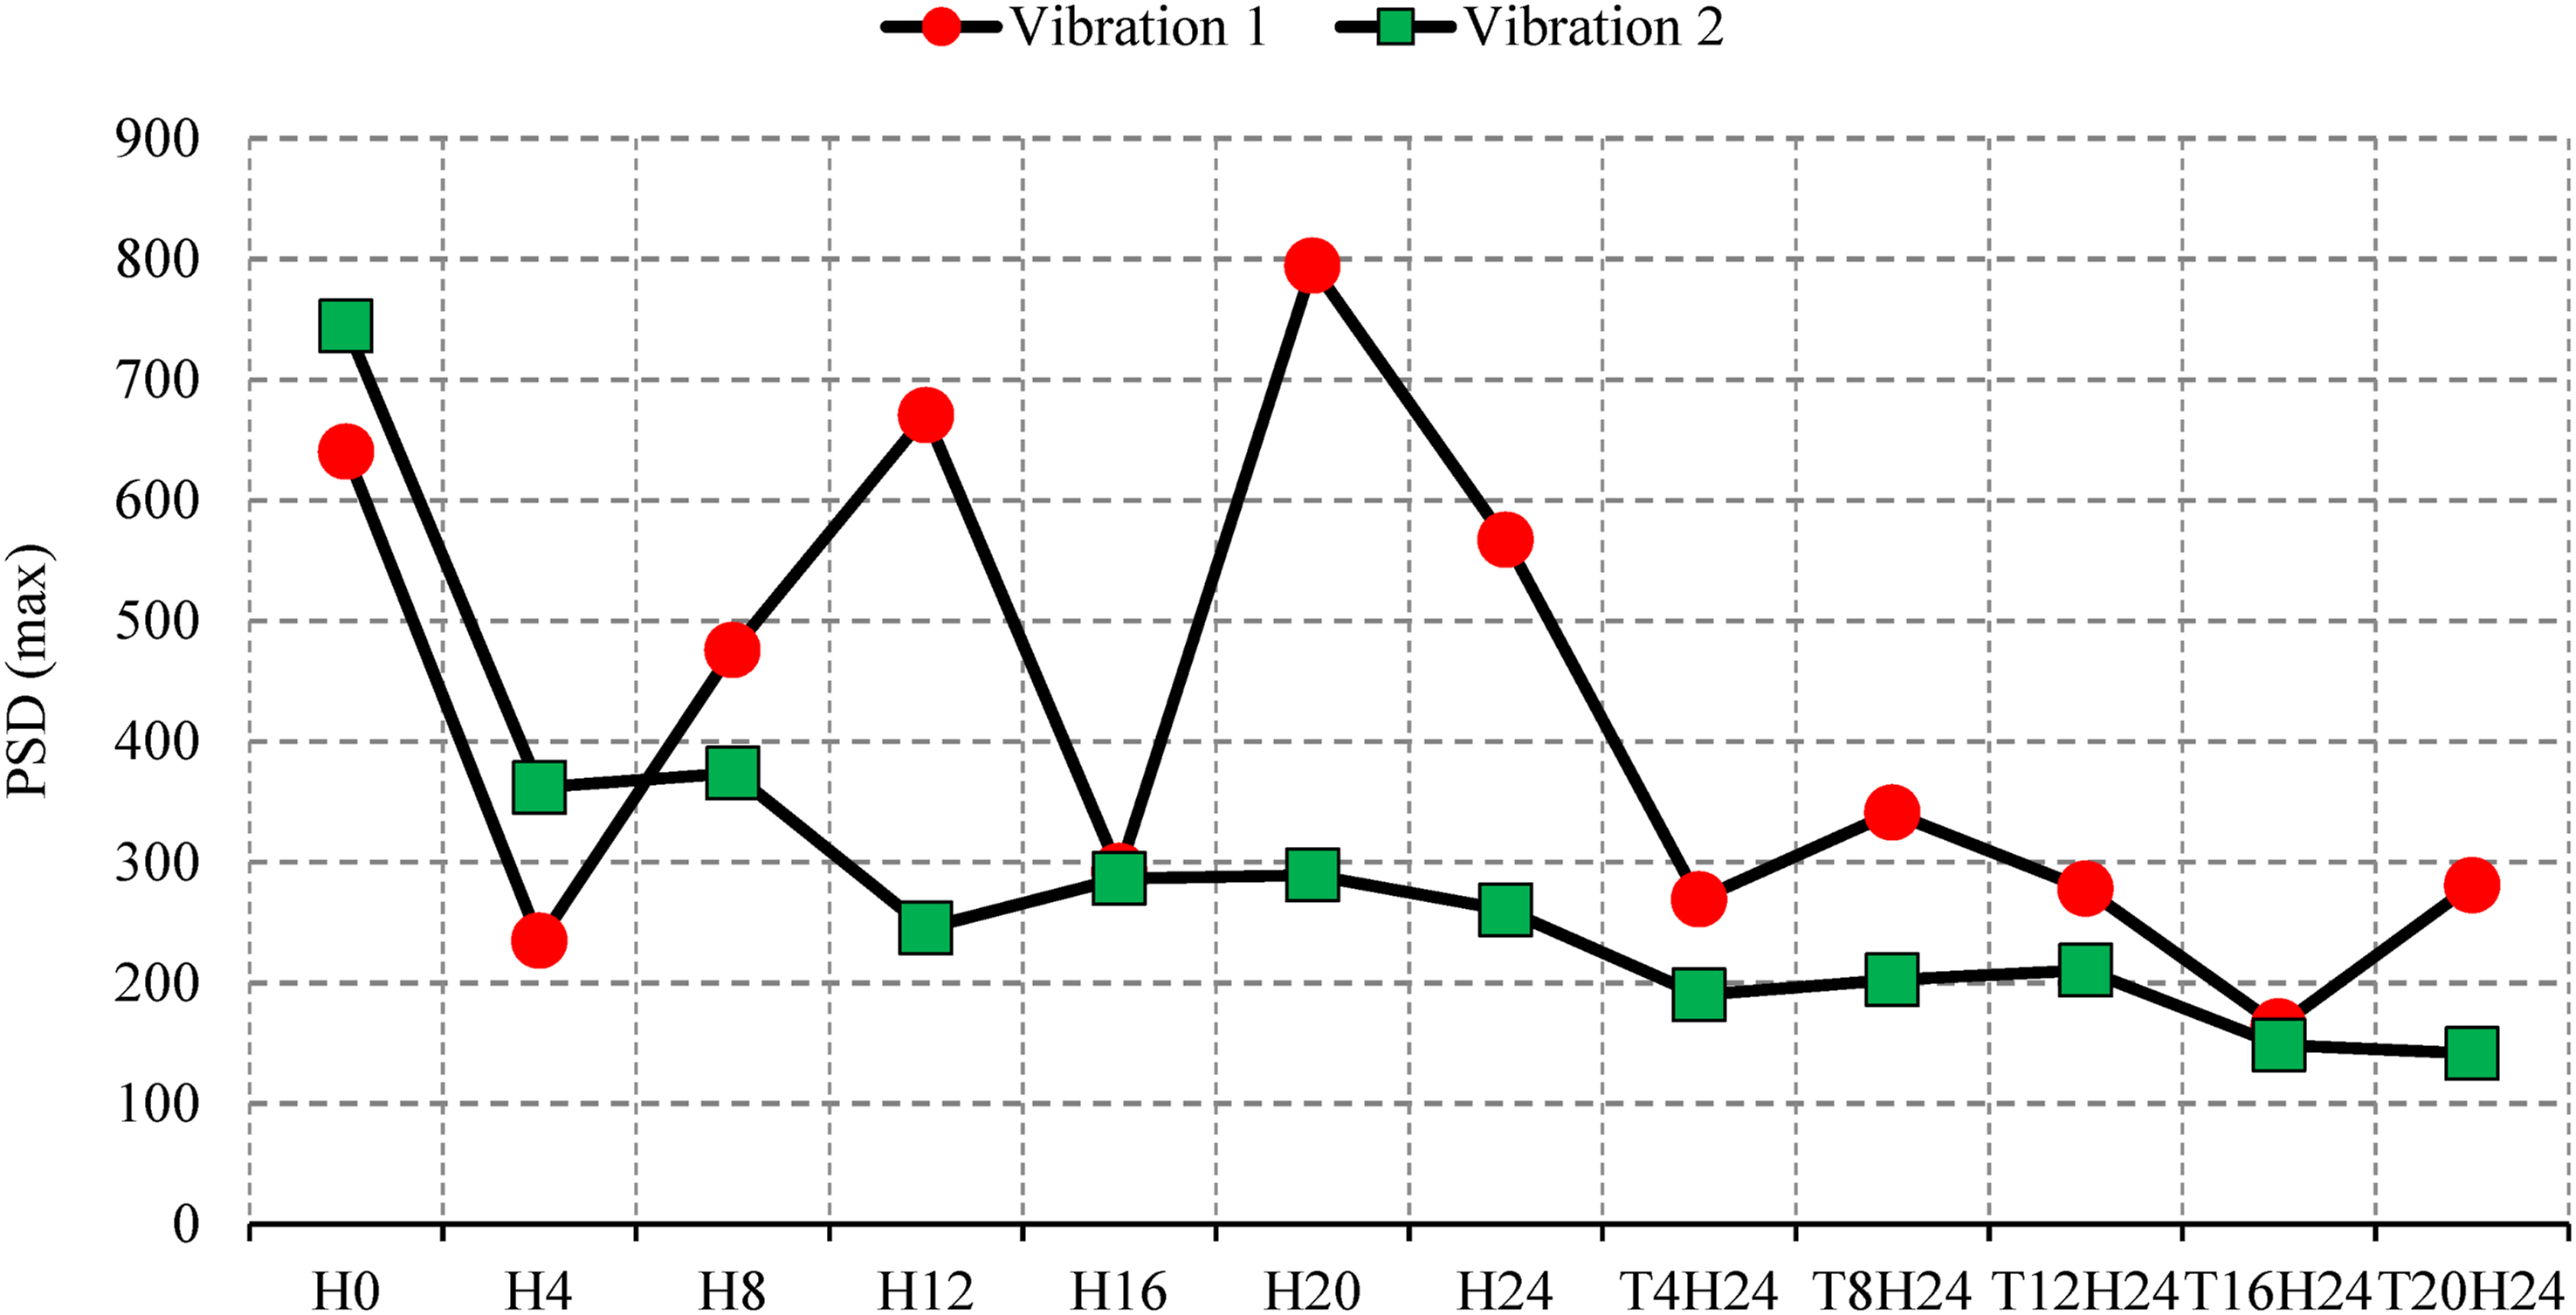
Damage analysis on the beam through vibration mode
As previously analyzed, changes in the spectrum can be evaluated through the peak value of the PSD. For the second vibration mode, which is considered more sensitive to damage, the corresponding PSDs were collected and analyzed after cracking and increasing the crack on the beam. To begin with, the study evaluated changes in PSD by tracking the peak value. According to the experimental model, there are four measurement points along the beam, called channels, denoted K1, K2, K3, and K4, along the beam’s length. Initially, we will examine the changes in the PSD in the first channel, K1. The second spectrum of vibration modes of the beam in channel K1, over different measurements, is shown in Figure 13. These changes in the spectrum will help assess the damage level of the beam at the measurement point and provide a clearer understanding of the sensitivity of the second vibration mode to cumulative damage to the structure. Power spectral density of the second vibration mode through various cracks at K1.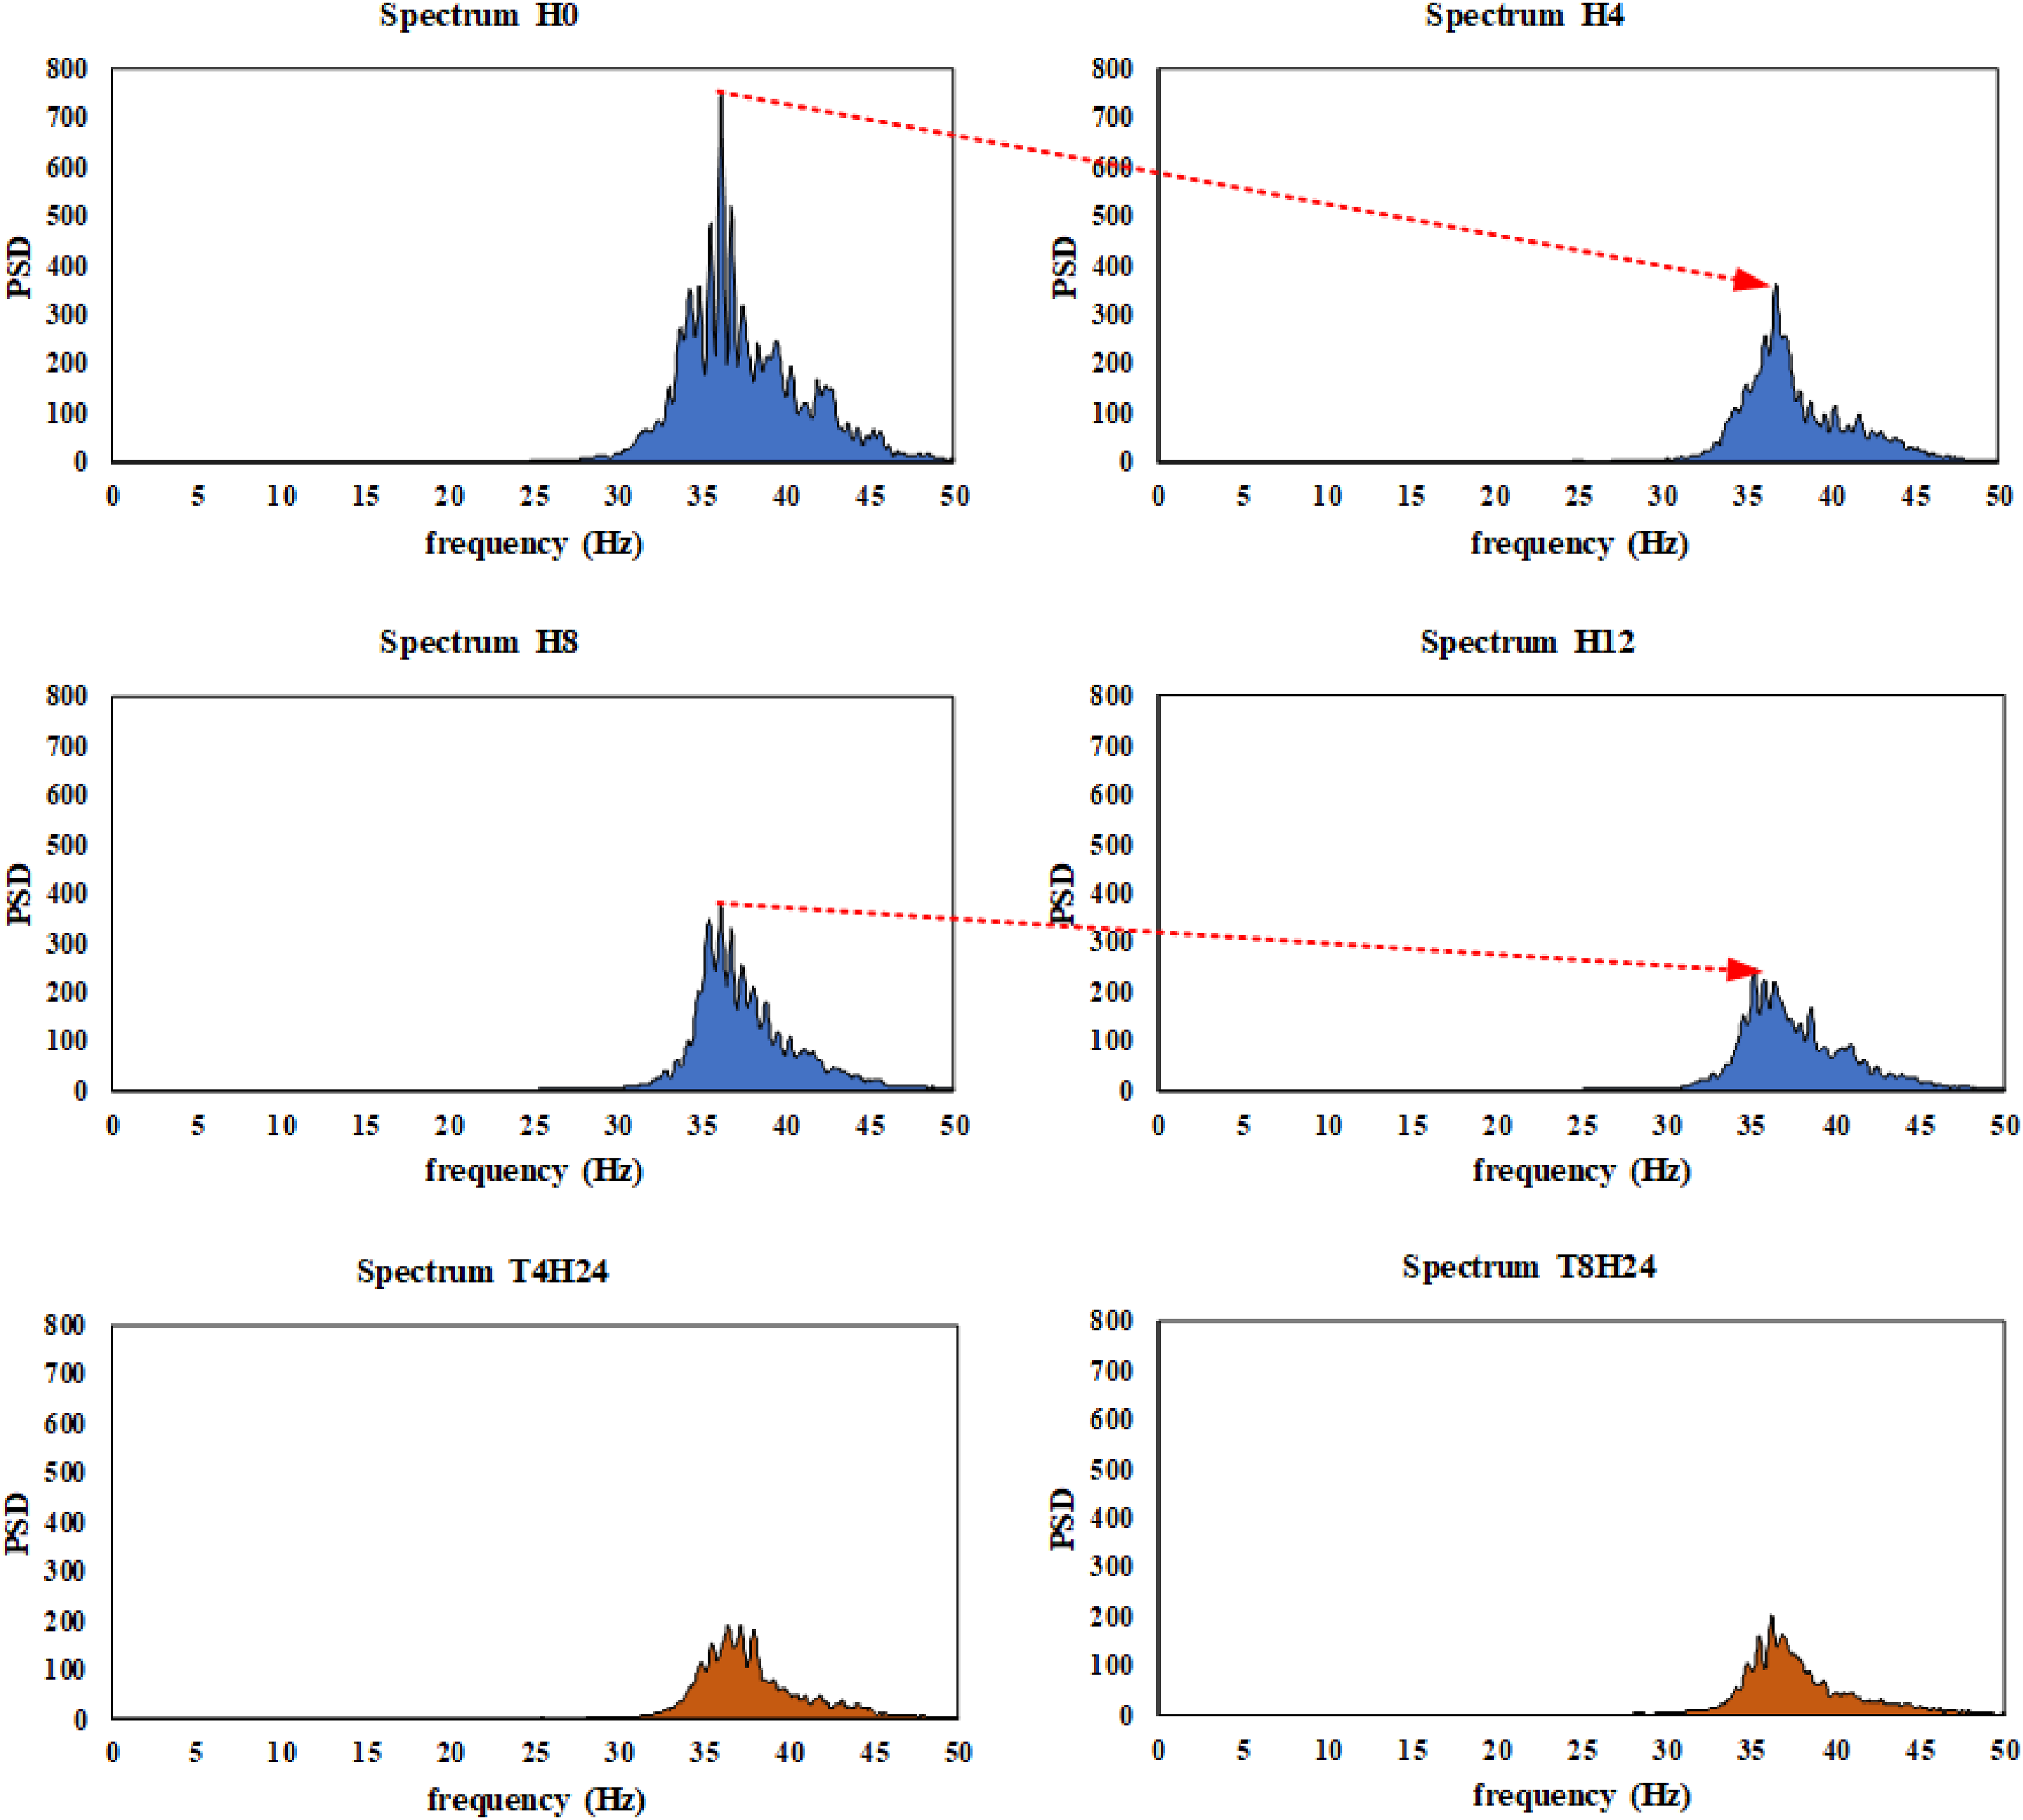
Observing Figure 13, we can see that the power spectral density of the second vibration mode in channel K1 changes significantly across the different cracks. These spectra tend to show a gradual reduction in peak value and a change in sharpness of the peak. As the depth of the crack H increases, the spectra tend to decrease in sharpness, and this decrease occurs more quickly at higher frequencies than at the peak frequency. Before crack T appears, the PSD at frequencies lower than the peak frequency exhibits a pronounced curve. When crack T first appears, this curve becomes broader, and the amplitude of the PSD around the peak tends to increase, causing a significant reduction in the sharpness of the spectrum. To better understand the changes in the peak PSD value for the second vibration mode in channel K1, the study aggregated all results through the various cracks and crack increases, as presented in Figure 14. These changes provide crucial information about the impact of damage on the vibration characteristics of the beam, particularly at measurement point K1. Peak value of vibration 2 spectrum through various cracks from K1.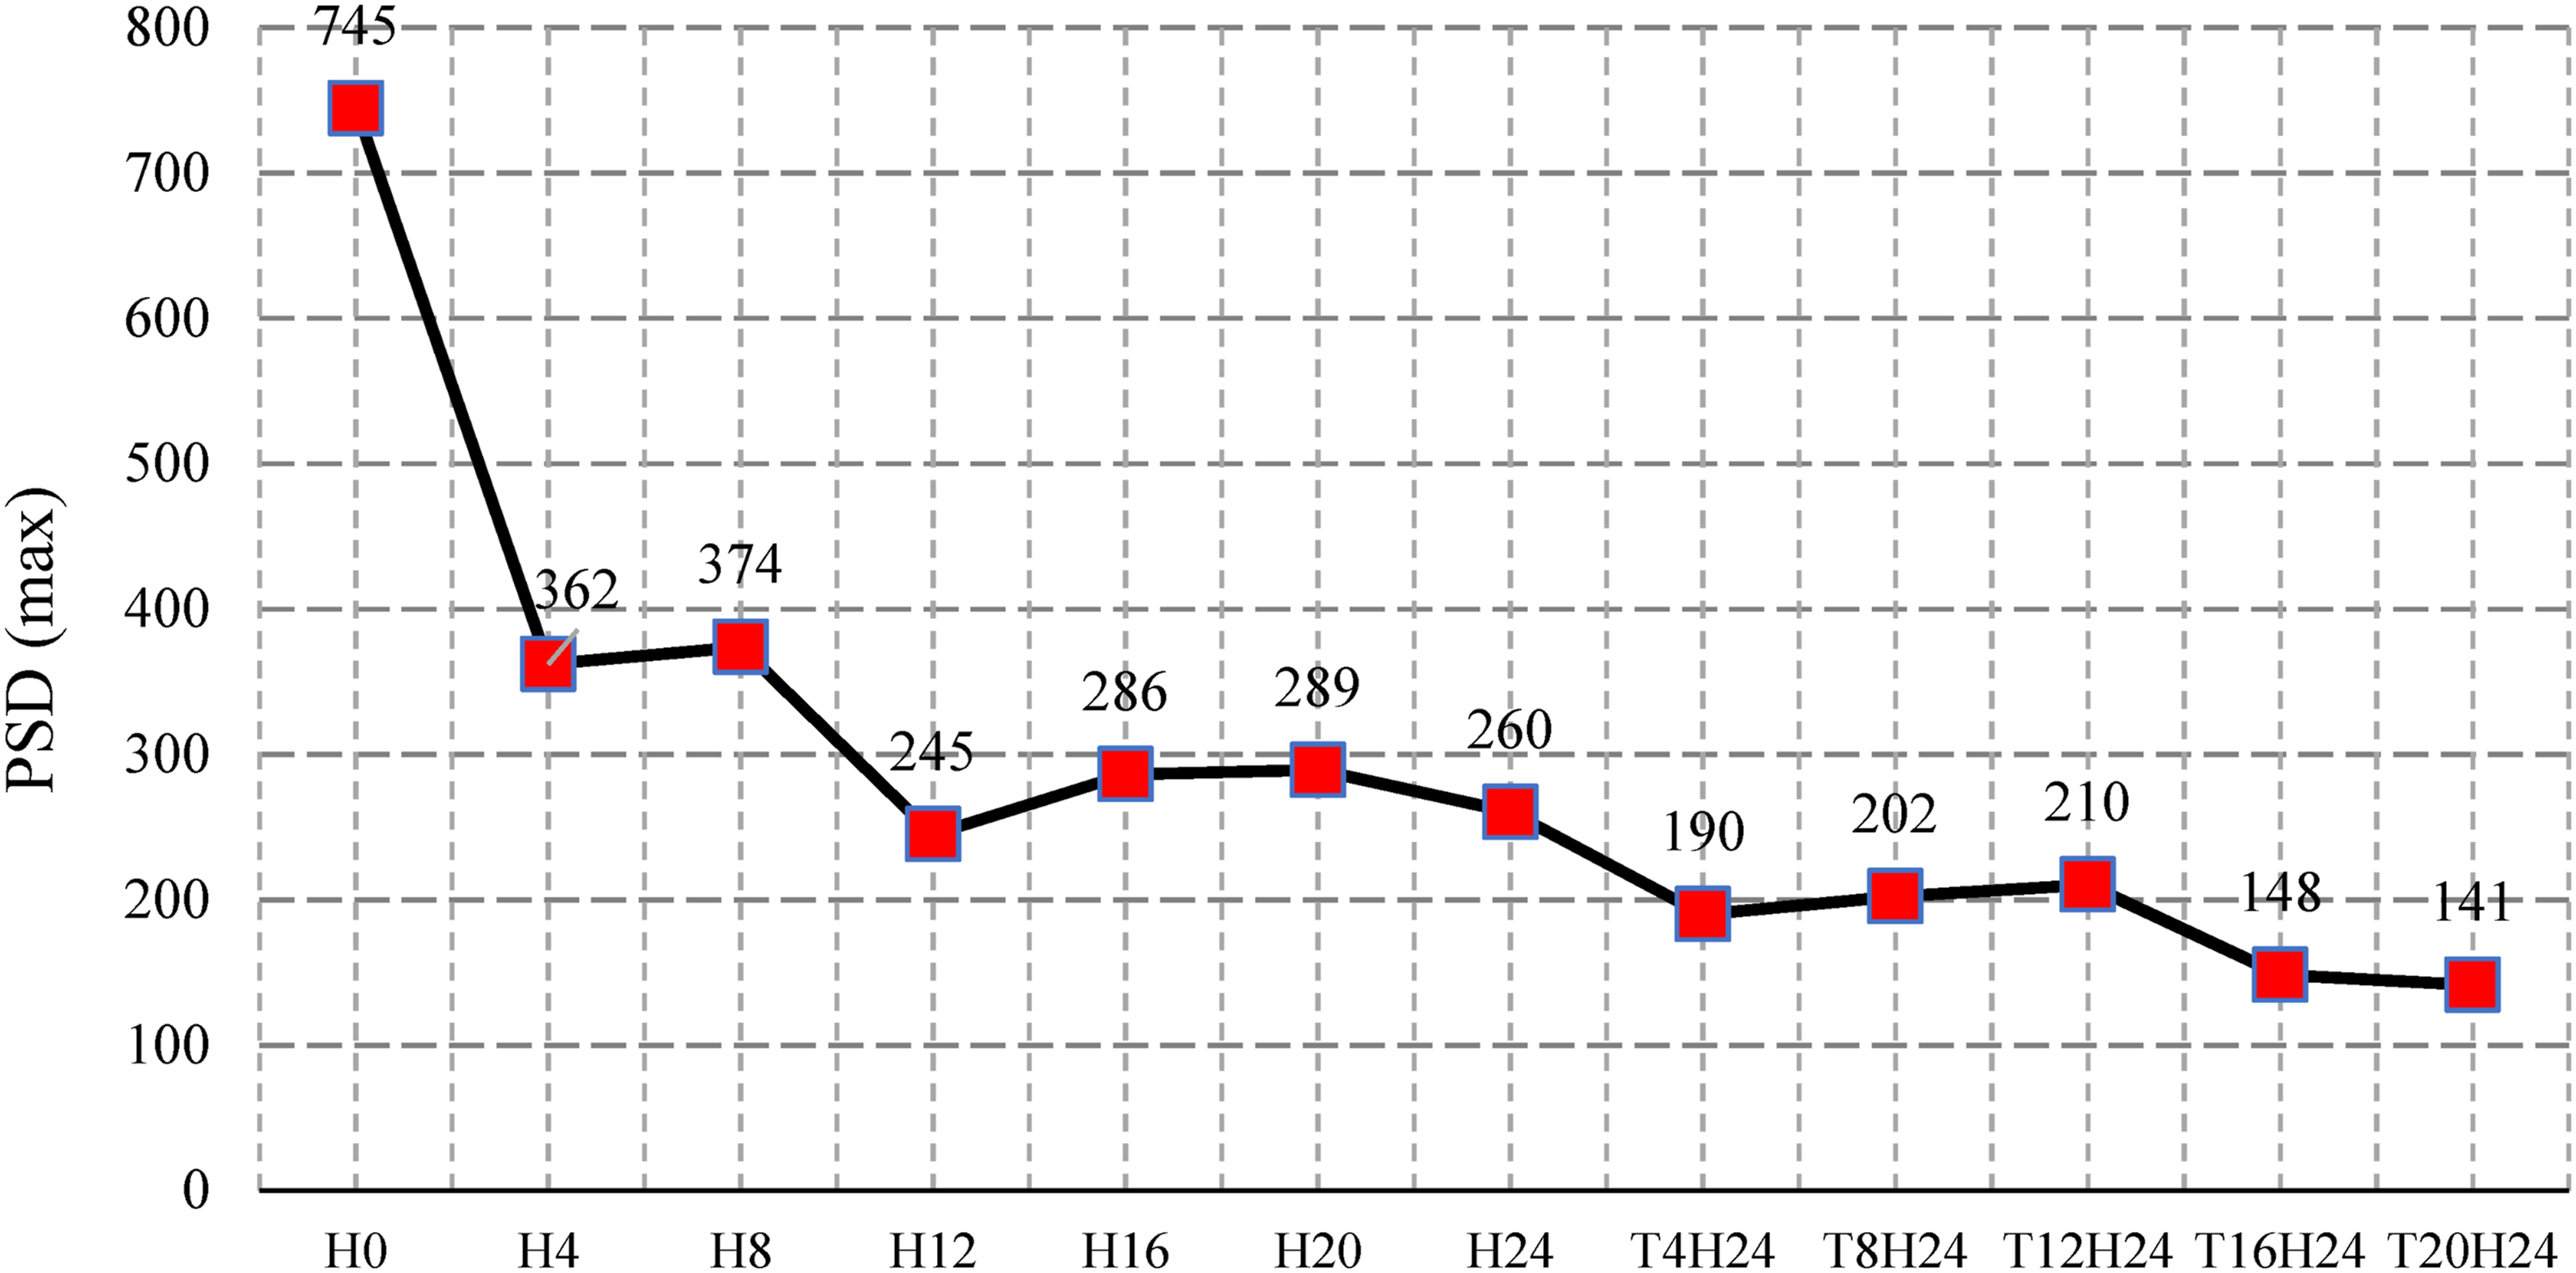
It can be observed that the peak value of the PSD for the second vibration mode gradually decreases throughout the process of damage (crack) formation and development on the beam. Initially, when the beam had no cracks, the maximum PSD value reached 745 (A2/Hz). However, after the first crack (H) appeared, this value dropped by more than half. The decline continued and when crack T reached a depth of 20 mm along with crack H reaching a depth of 24 mm, the peak value had decreased by more than five times compared to the initial value. The study analyzed the PSD change process for the second vibration mode in channel K2. Based on the trend observed in K1, the hypothesis was made that in channel K2, located between cracks H and T, the peak amplitude of the PSD might be smaller than at K1 due to greater damage. To test this hypothesis, the study processed the data and obtained PSD results, as shown in Figure 15. These results will help clarify the influence of PSD cracks on the peak values at different measurement locations on the beam. Power spectral density of the second vibration mode through various cracks at K2.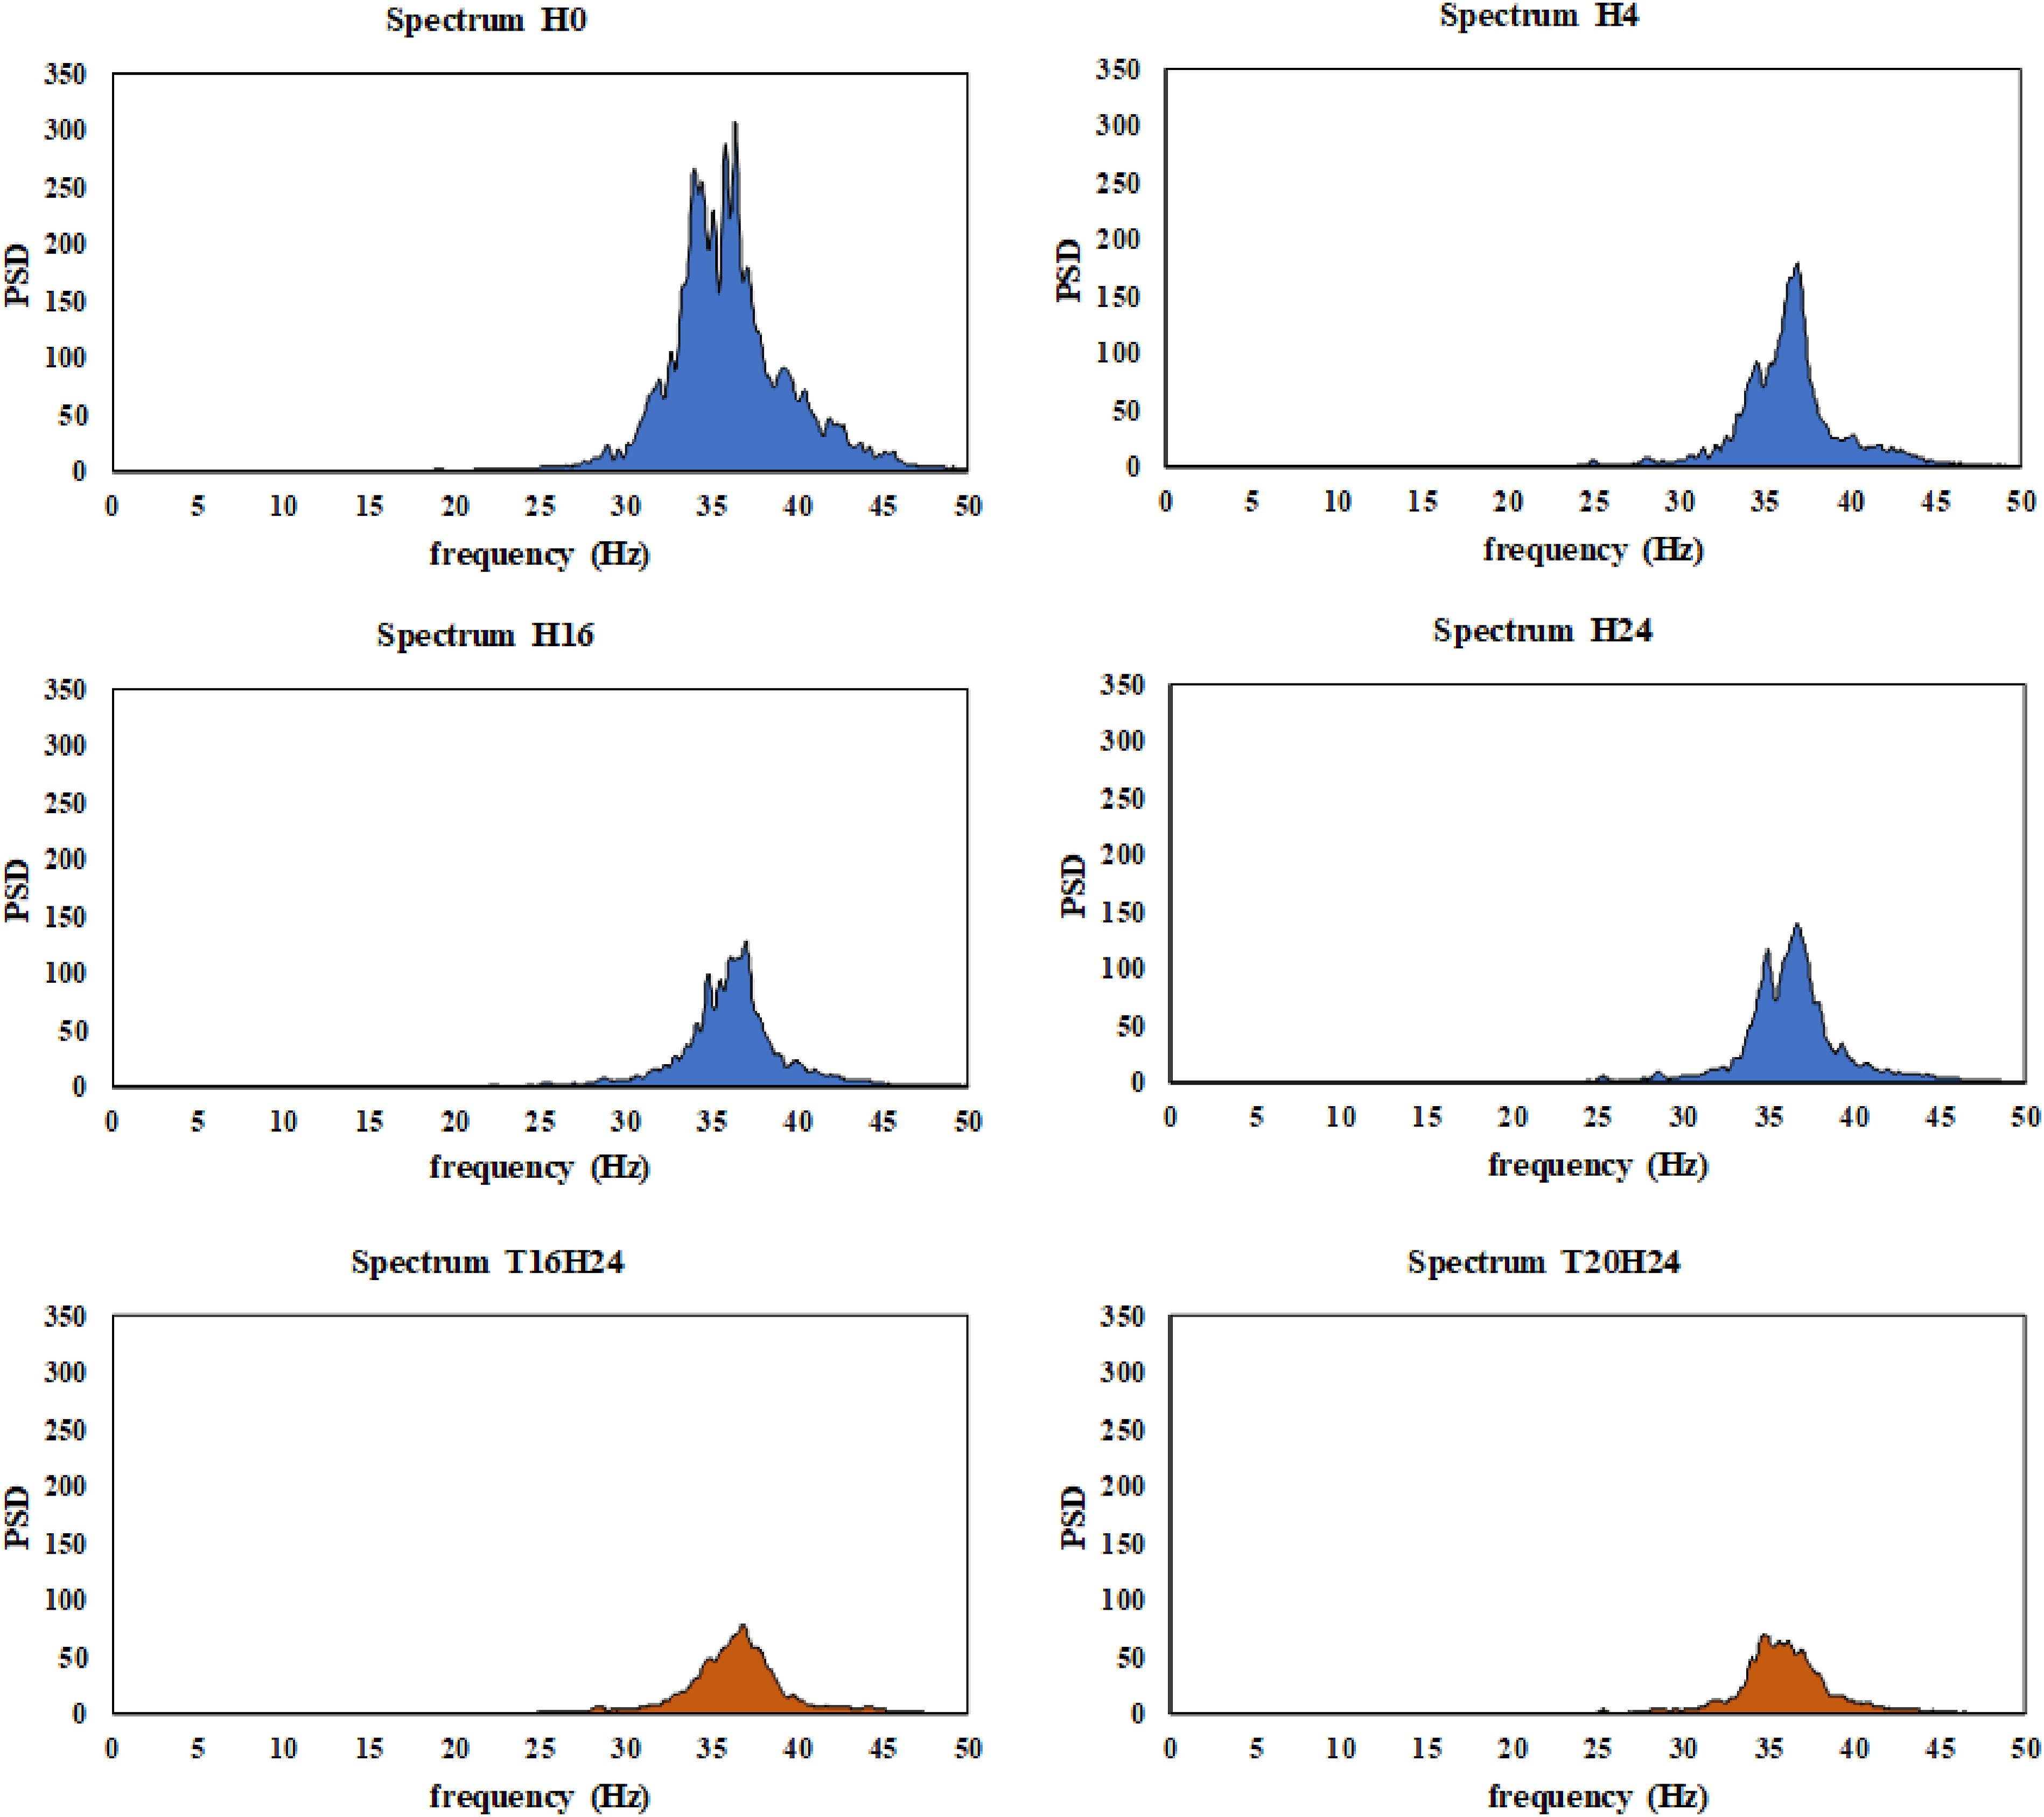
The power spectral densities at position K2 also show a gradual decrease in peak amplitude, consistent with the initial prediction that the changes in the spectrum at K2 would align with the changes at K1. However, the power spectral density values at K2 are significantly lower than those at K1. As damage (crack) increases, the curvature of the spectrum around the peak frequency area also increases. Regarding the peak frequency, it can be observed that this value tends to decrease throughout the process, with the spectrum peak shifting gradually to the left. However, as with the observations about the spectrum at K2, the frequency changes very slowly and becomes more complex with multiple peaks emerging in the resonance region. Because these changes are minimal and slow, frequency is not a suitable parameter for assessing changes in power spectral density. To better observe the fluctuation of the peak amplitude during crack progression, we have compiled and presented the results for all spectra at K2 through each crack and crack increase, as illustrated in Figure 16. Peak value of vibration 2 spectrum through various cracks from K2.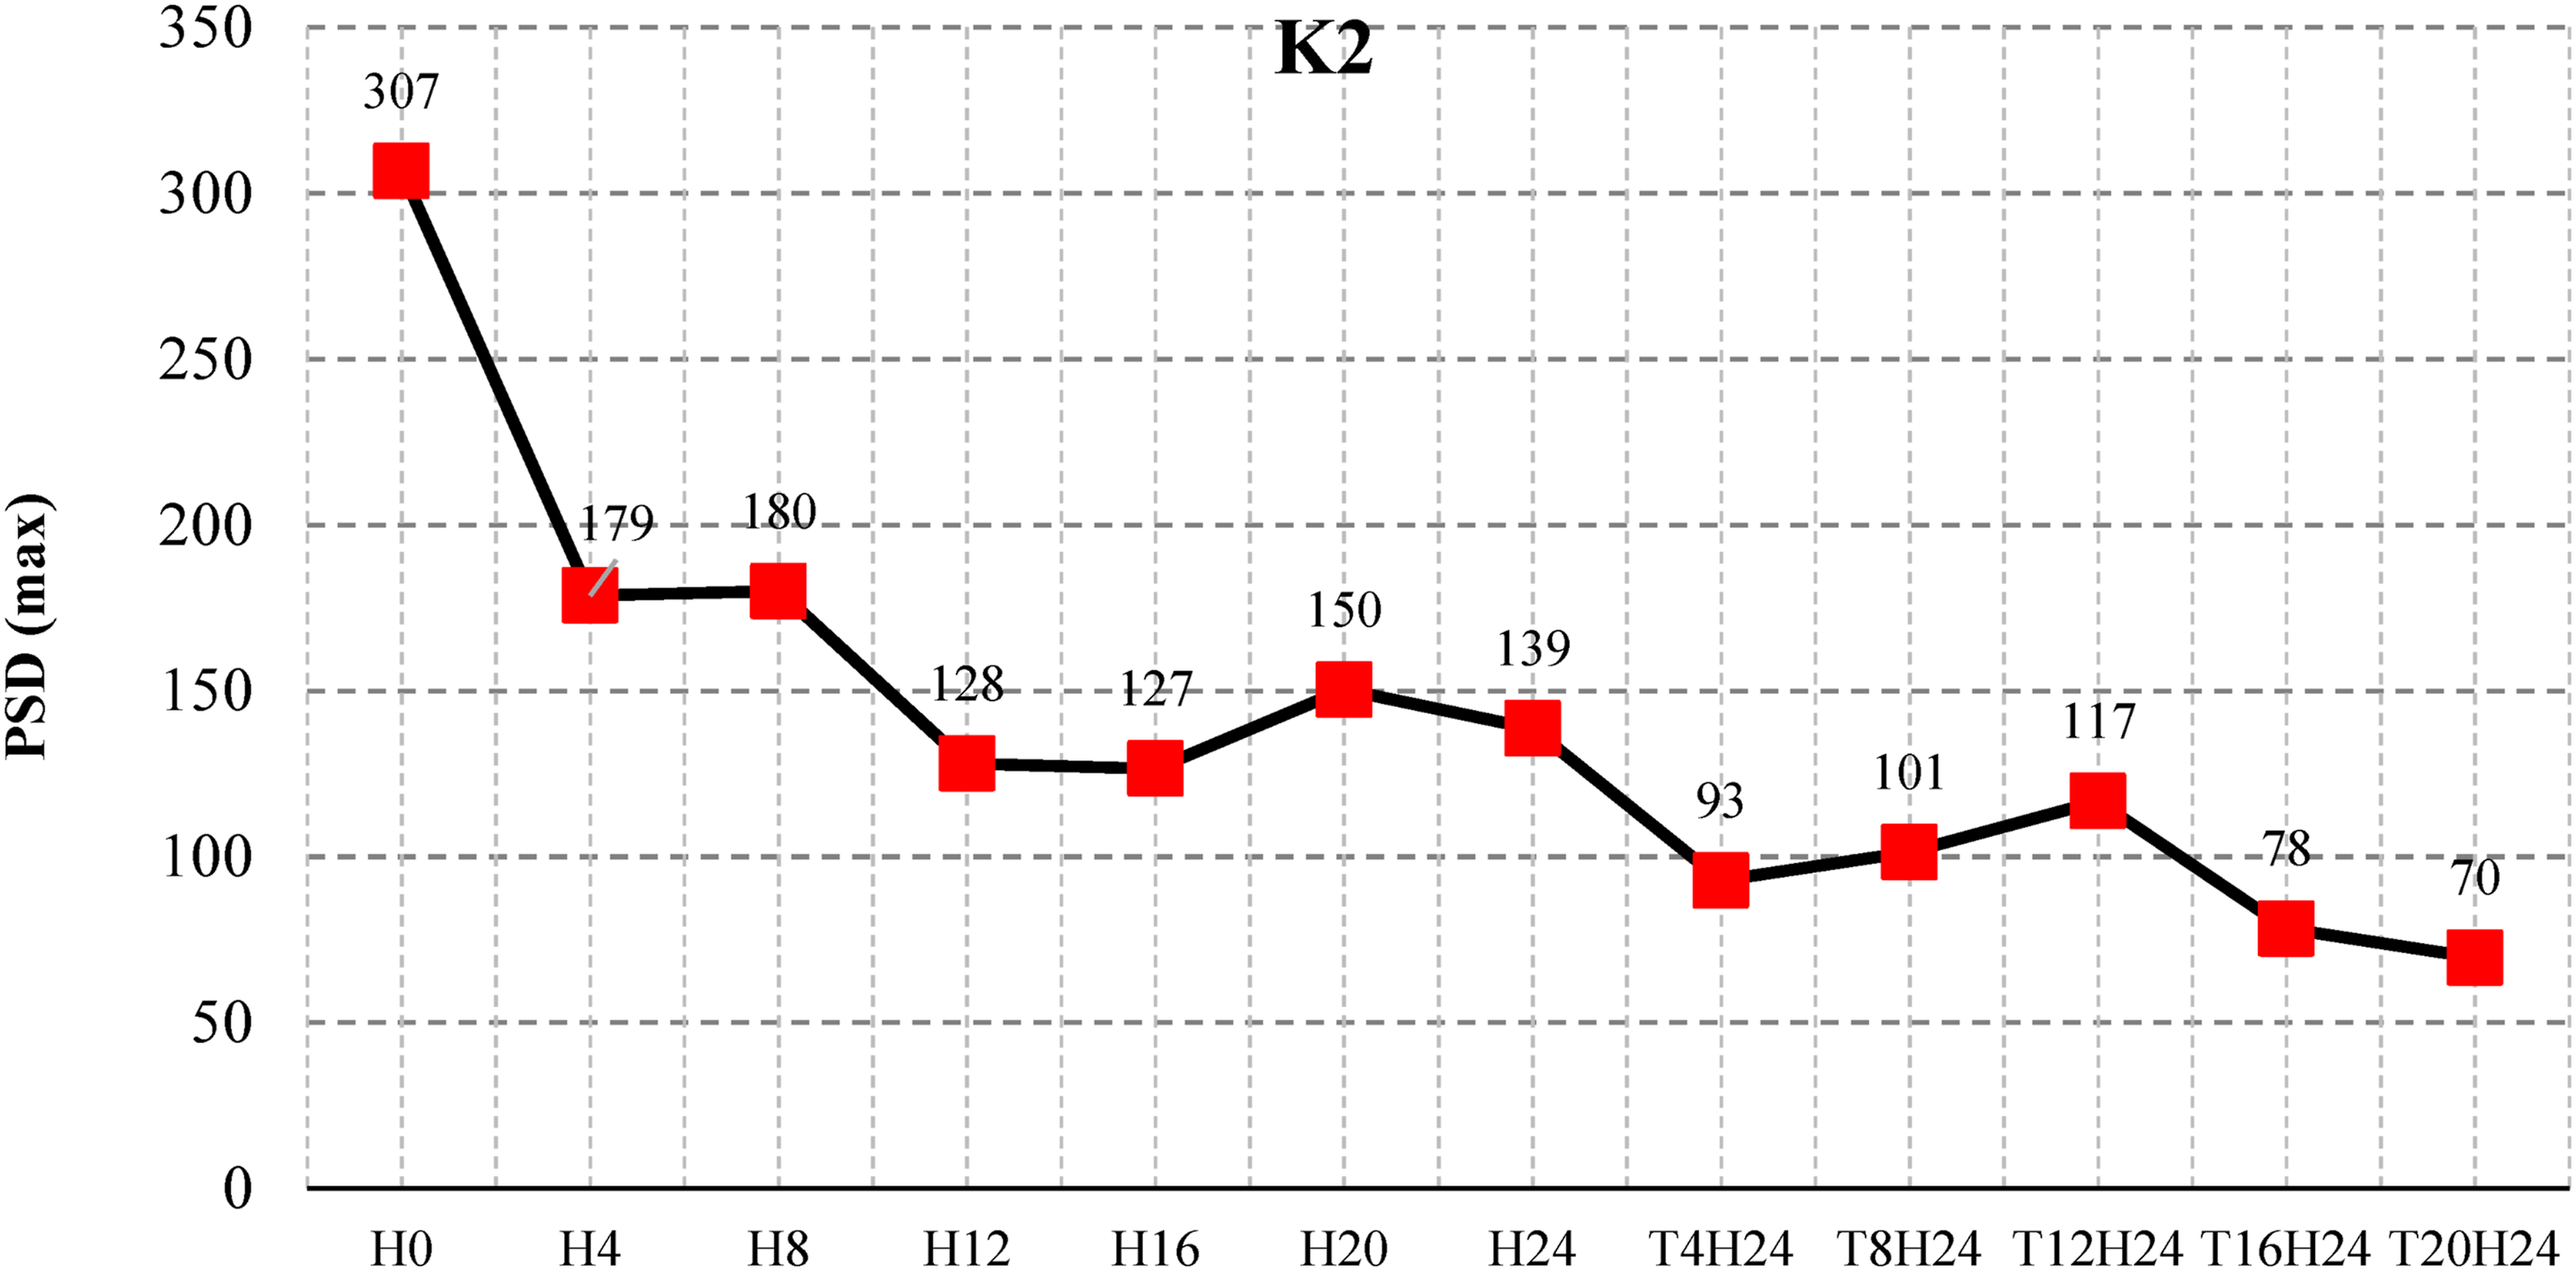
Finally, to ensure that the observed trend is consistent across the entire beam and to comprehensively assess the spectrum changes, we also conducted similar analyses on the signals from the sensors at channels K3 and K4. The results of these analyses show the changes in the peak amplitude of the spectrum at these positions during damage progression, as shown in Figures 17 and 18. These results provide a more comprehensive view of the changes in the impact of cracks on the power spectral density throughout the entire beam, helping to accurately assess the degree of damage and structural integrity. Peak value of vibration 2 spectrum through various cracks from K3. Peak value of vibration 2 spectrum through various cracks from K4.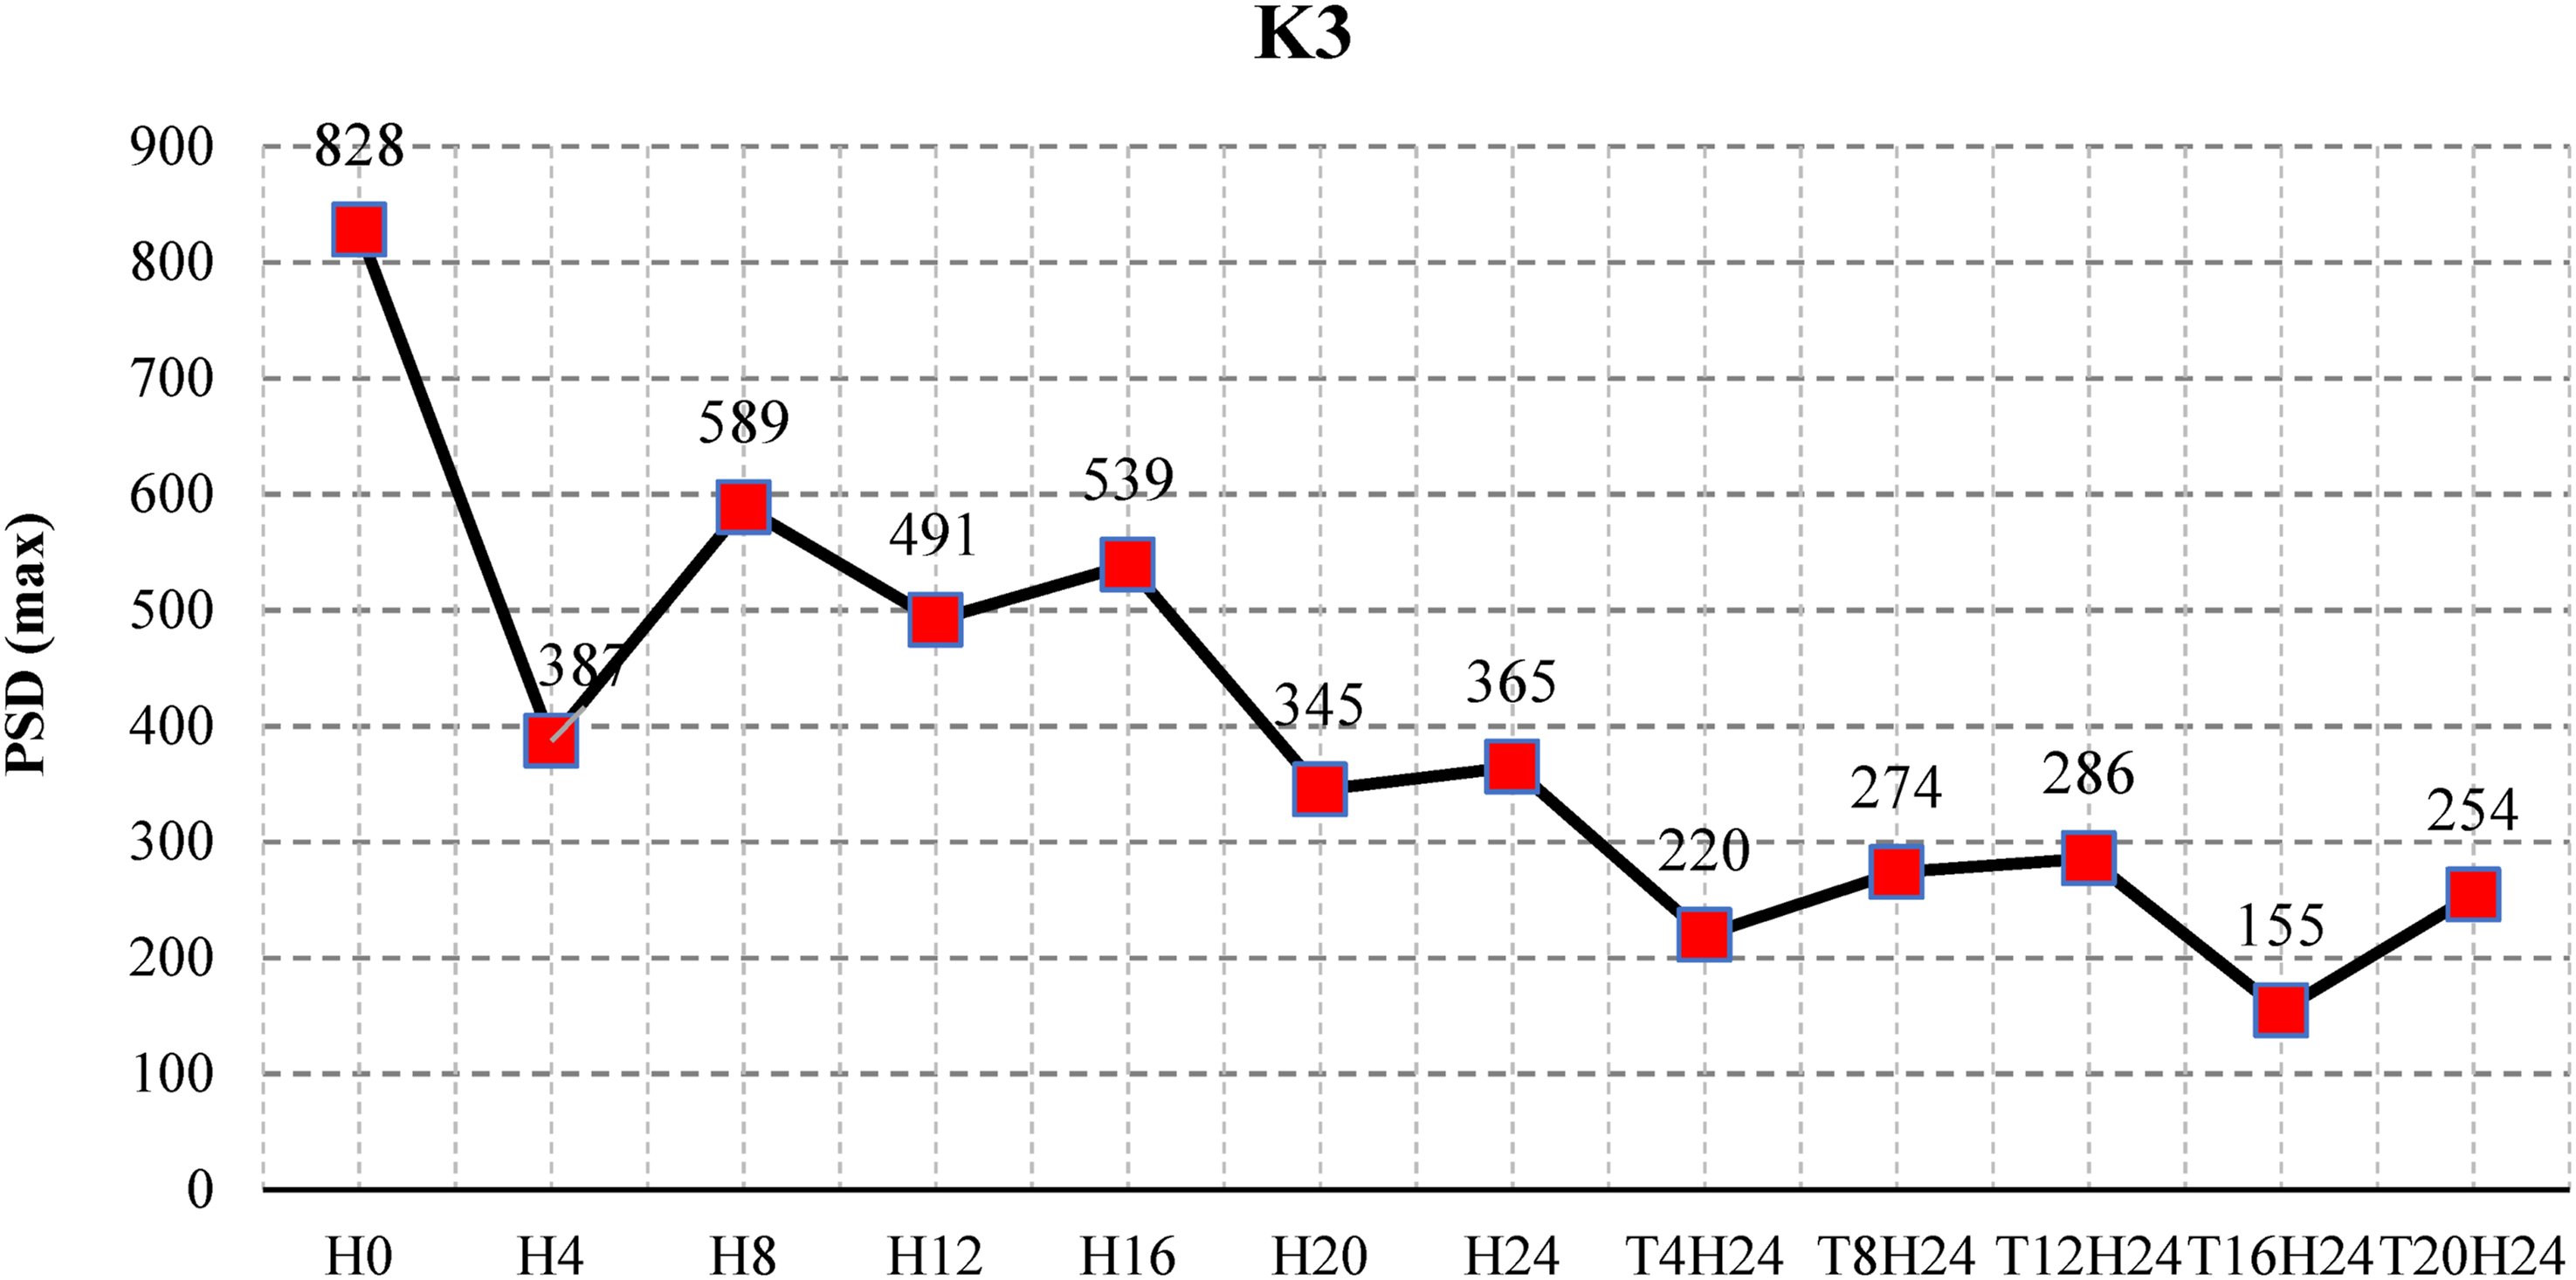
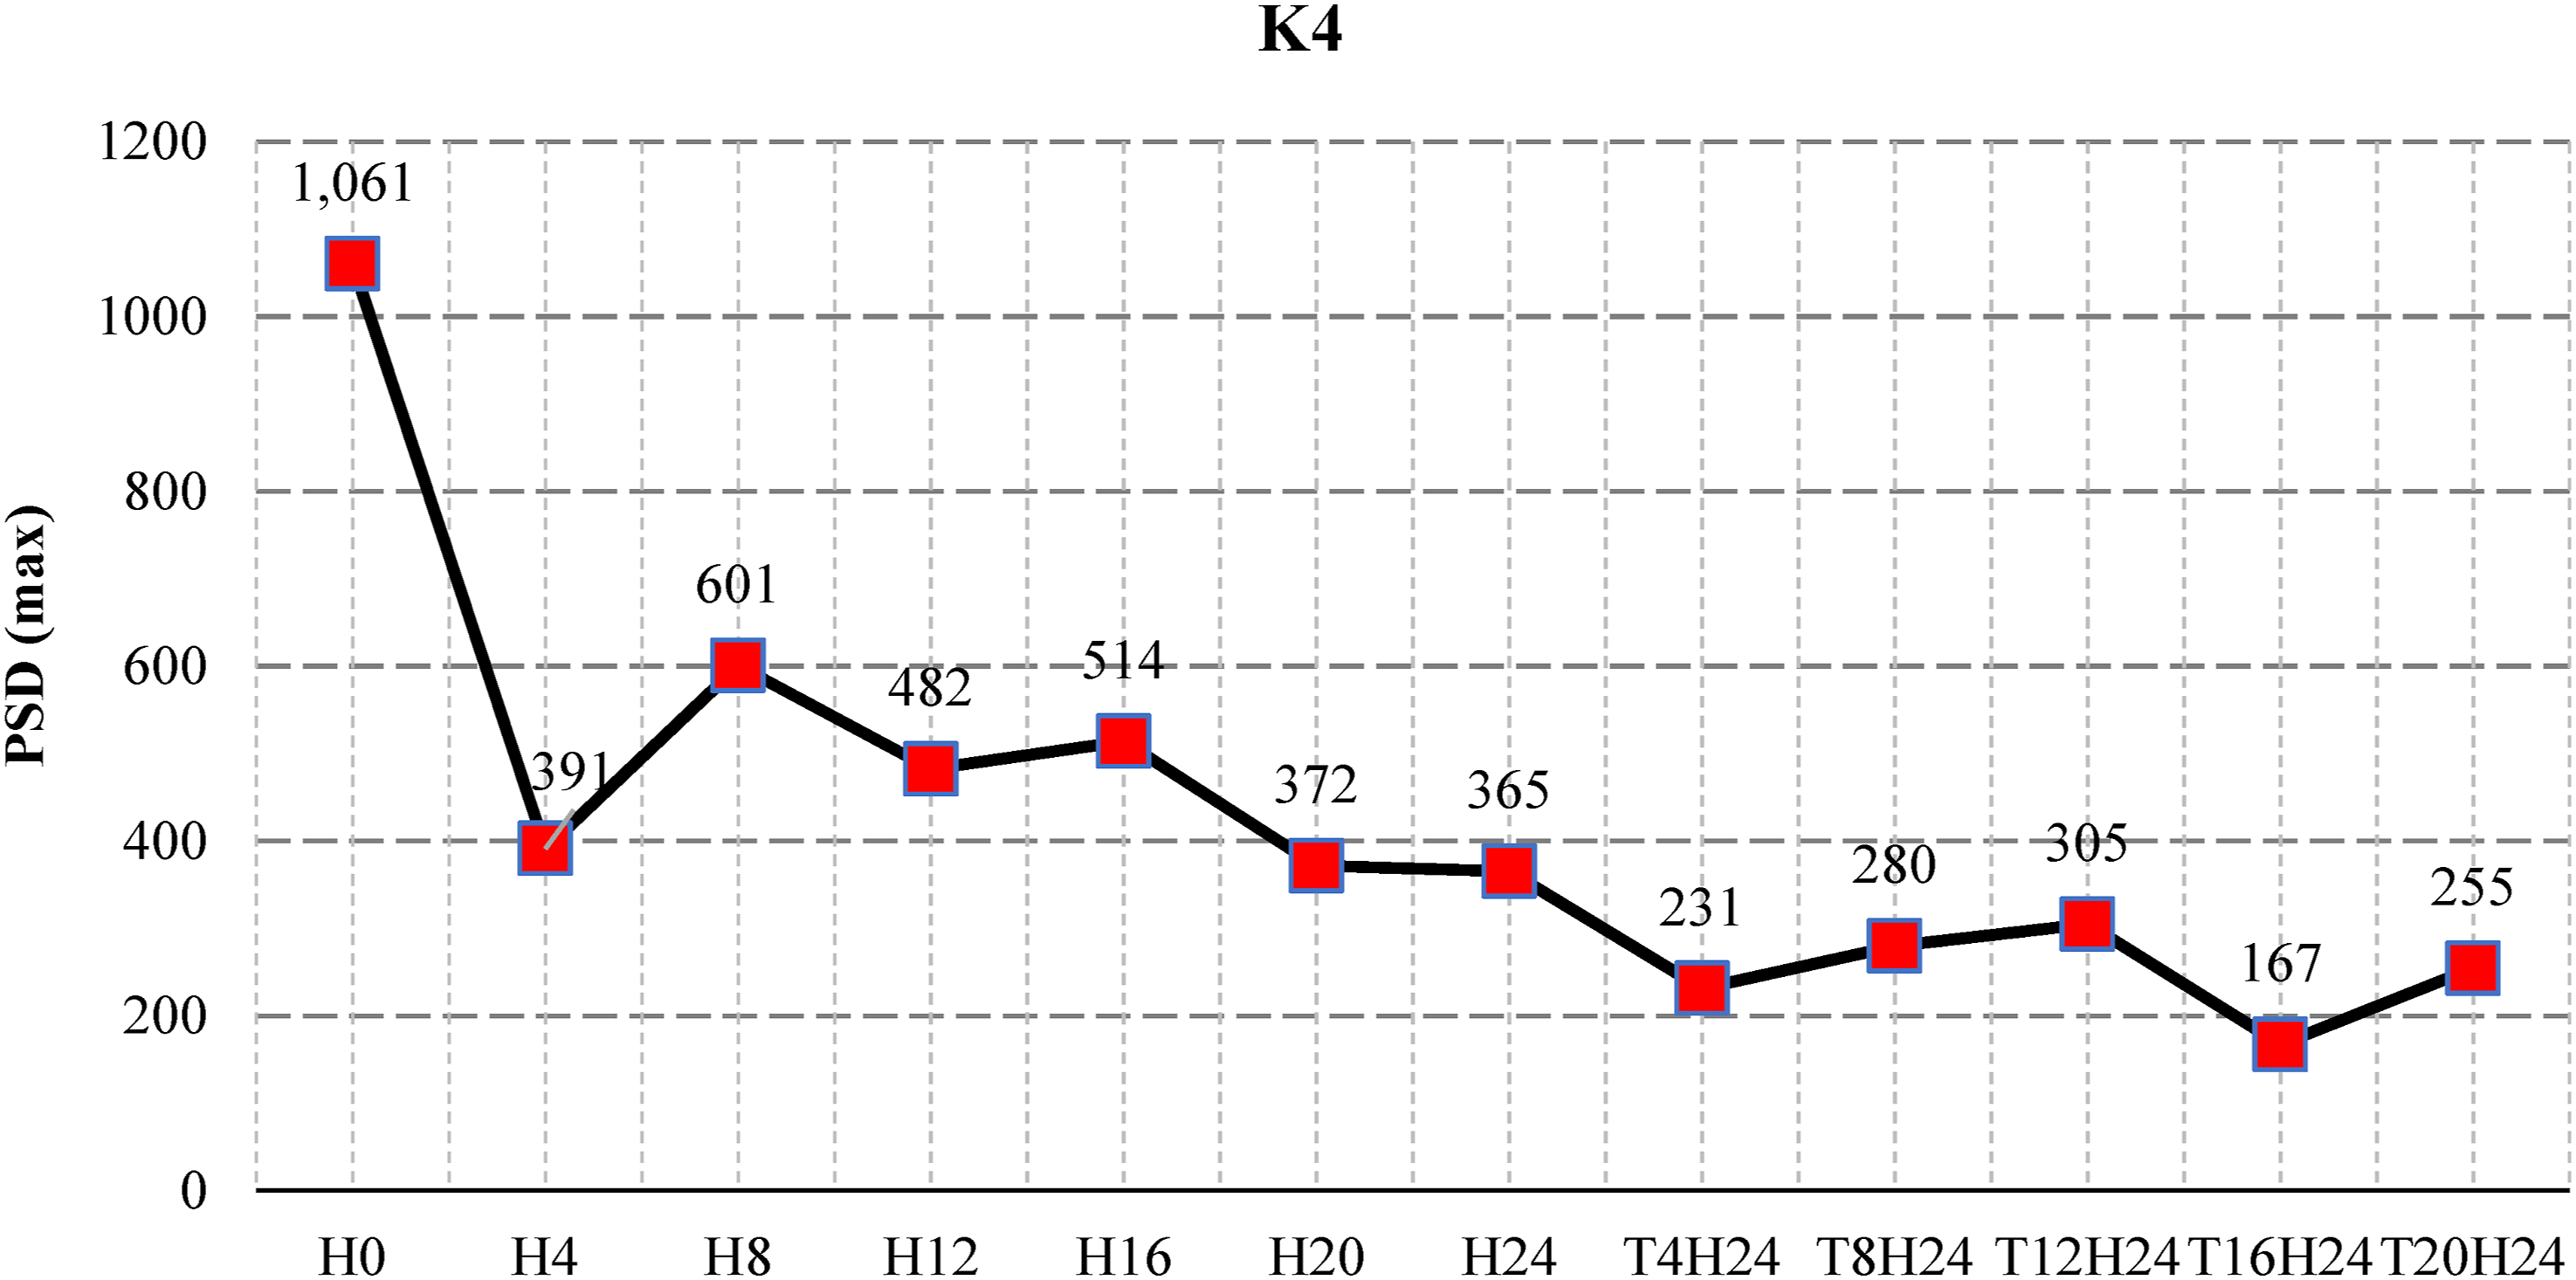
According to the analysis results, the second vibration mode has the highest power spectral density at the fourth sensor position (K4) and the lowest at the second channel (K2). Throughout the damage growth process on the beam, the power spectral densities tend to decrease in peak value, with the reduction occurring faster at positions closer to the cracks. By averaging the peak amplitude values of the spectrum at all four channels, we obtain an overall picture of the changes across the entire beam. These values allow for a more accurate assessment of the impact of damage on the beam structure at different measurement locations.
Throughout the entire cracking process and the increase in the size of the crack on the beam, the position with the smallest peak amplitude of the spectrum for the second vibration mode is K2. This is the location near the middle of the beam and the closest to both cracks during the experiment. The next position with the smallest peak amplitude is K1, which is near the second crack (T). Then comes K3, which has a larger amplitude value than K1 and K2, as it is close to the middle of the beam but not as close to the cracks as the other two channels. The position with the highest peak amplitude value is K4, located near the simple support end and also farthest from the cracks on the beam. The regression curve of the peak amplitude values of the second vibration mode spectrum across the entire beam (represented by the red dashed line) shows a clear distinction in power spectral density across the beam. According to this curve, the weakest part of the beam is K2, while the strongest point is near the right support, close to K4, which is farthest from the cracks. This clearly identifies the weak and strong regions of the beam on the analysis of the power spectral density. In addition to evaluating the spectral changes through the peak amplitude, the study also aims to observe the visual changes in the power spectral density. To achieve this, we applied a normalization method to eliminate the differences in values between the spectra. Specifically, each spectrum is normalized by dividing the entire amplitude of the spectrum by its corresponding peak amplitude value. This normalization method balances the values between the spectra without altering their shape, allowing for easier comparison of the visual appearance, as shown in Figure 19. This helps the study gain a more intuitive view of the changes in PSD across different stages of beam damage. Normalized power spectral density.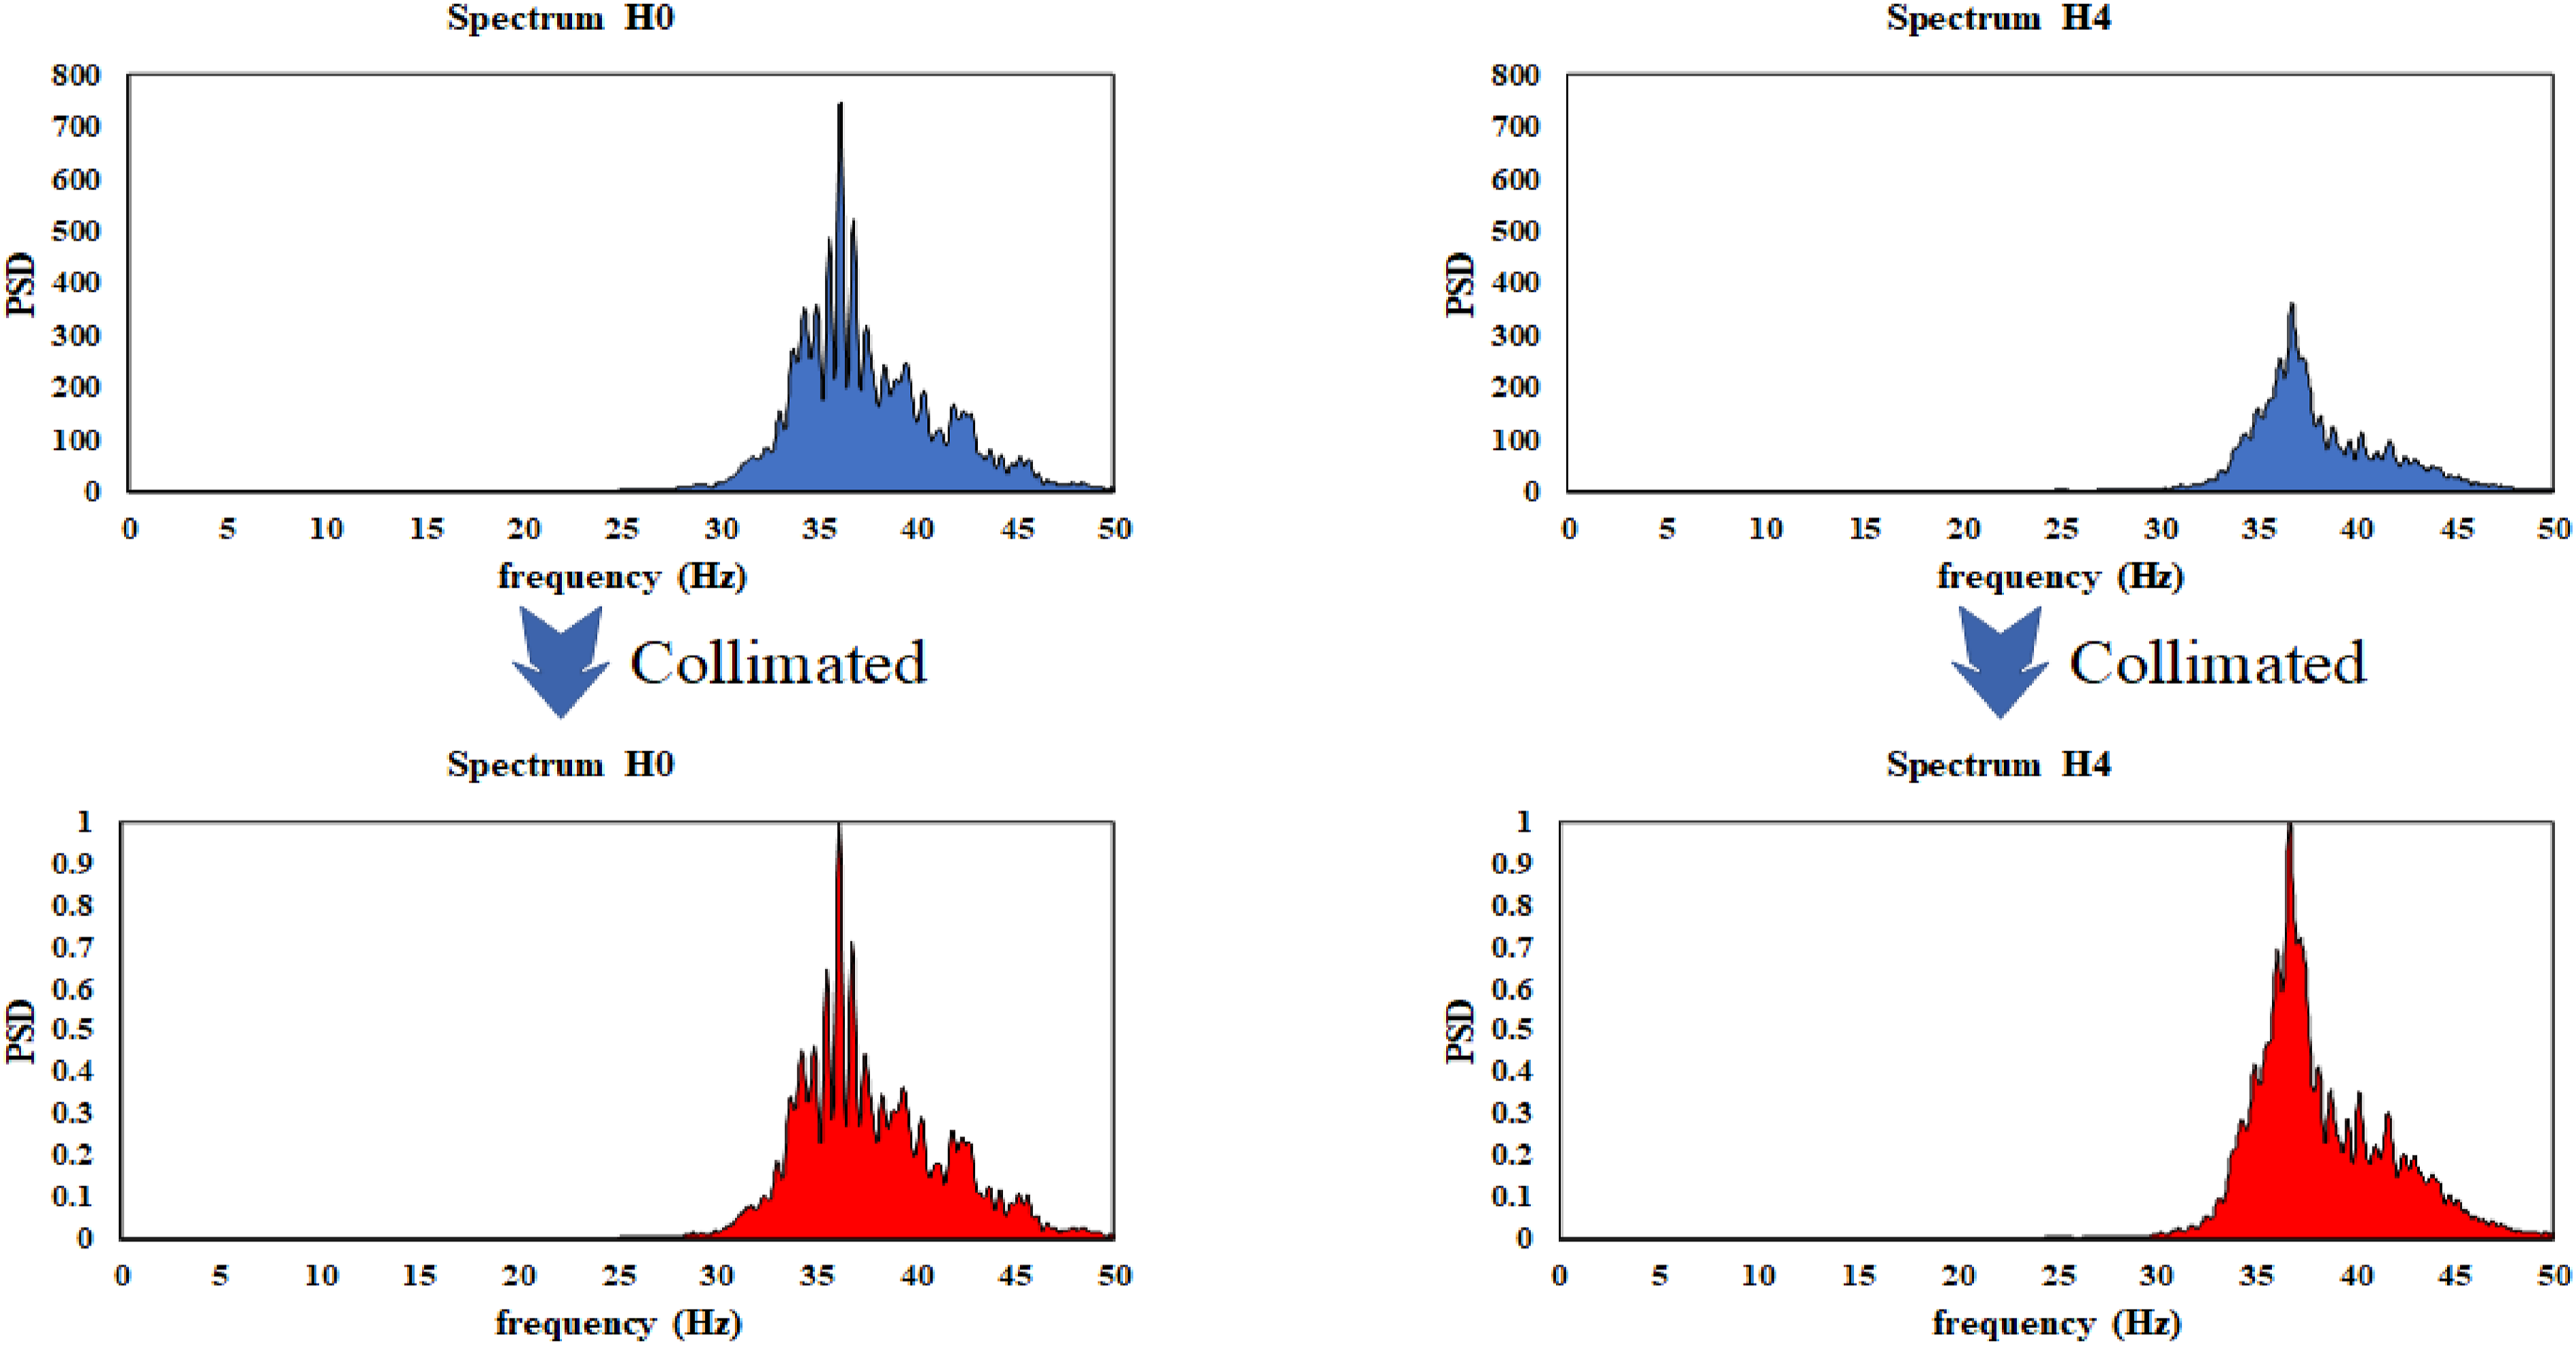
It can be seen that the normalization process has allowed us to obtain spectra that no longer differ in value, leaving only differences in shape. Spectra with varying magnitudes are scaled to the same ratio, facilitating the analysis and comparison of their shapes. This makes it easier and more intuitive to assess the shape changes in the power spectral density. To select criteria to evaluate these shape changes, we normalized all spectra throughout the experiment and compared the differences between them, as illustrated in Figure 20. This method helps to clearly identify structural changes through the shape analysis of the spectra. Normalized power spectral density of vibration 2 through various cracks.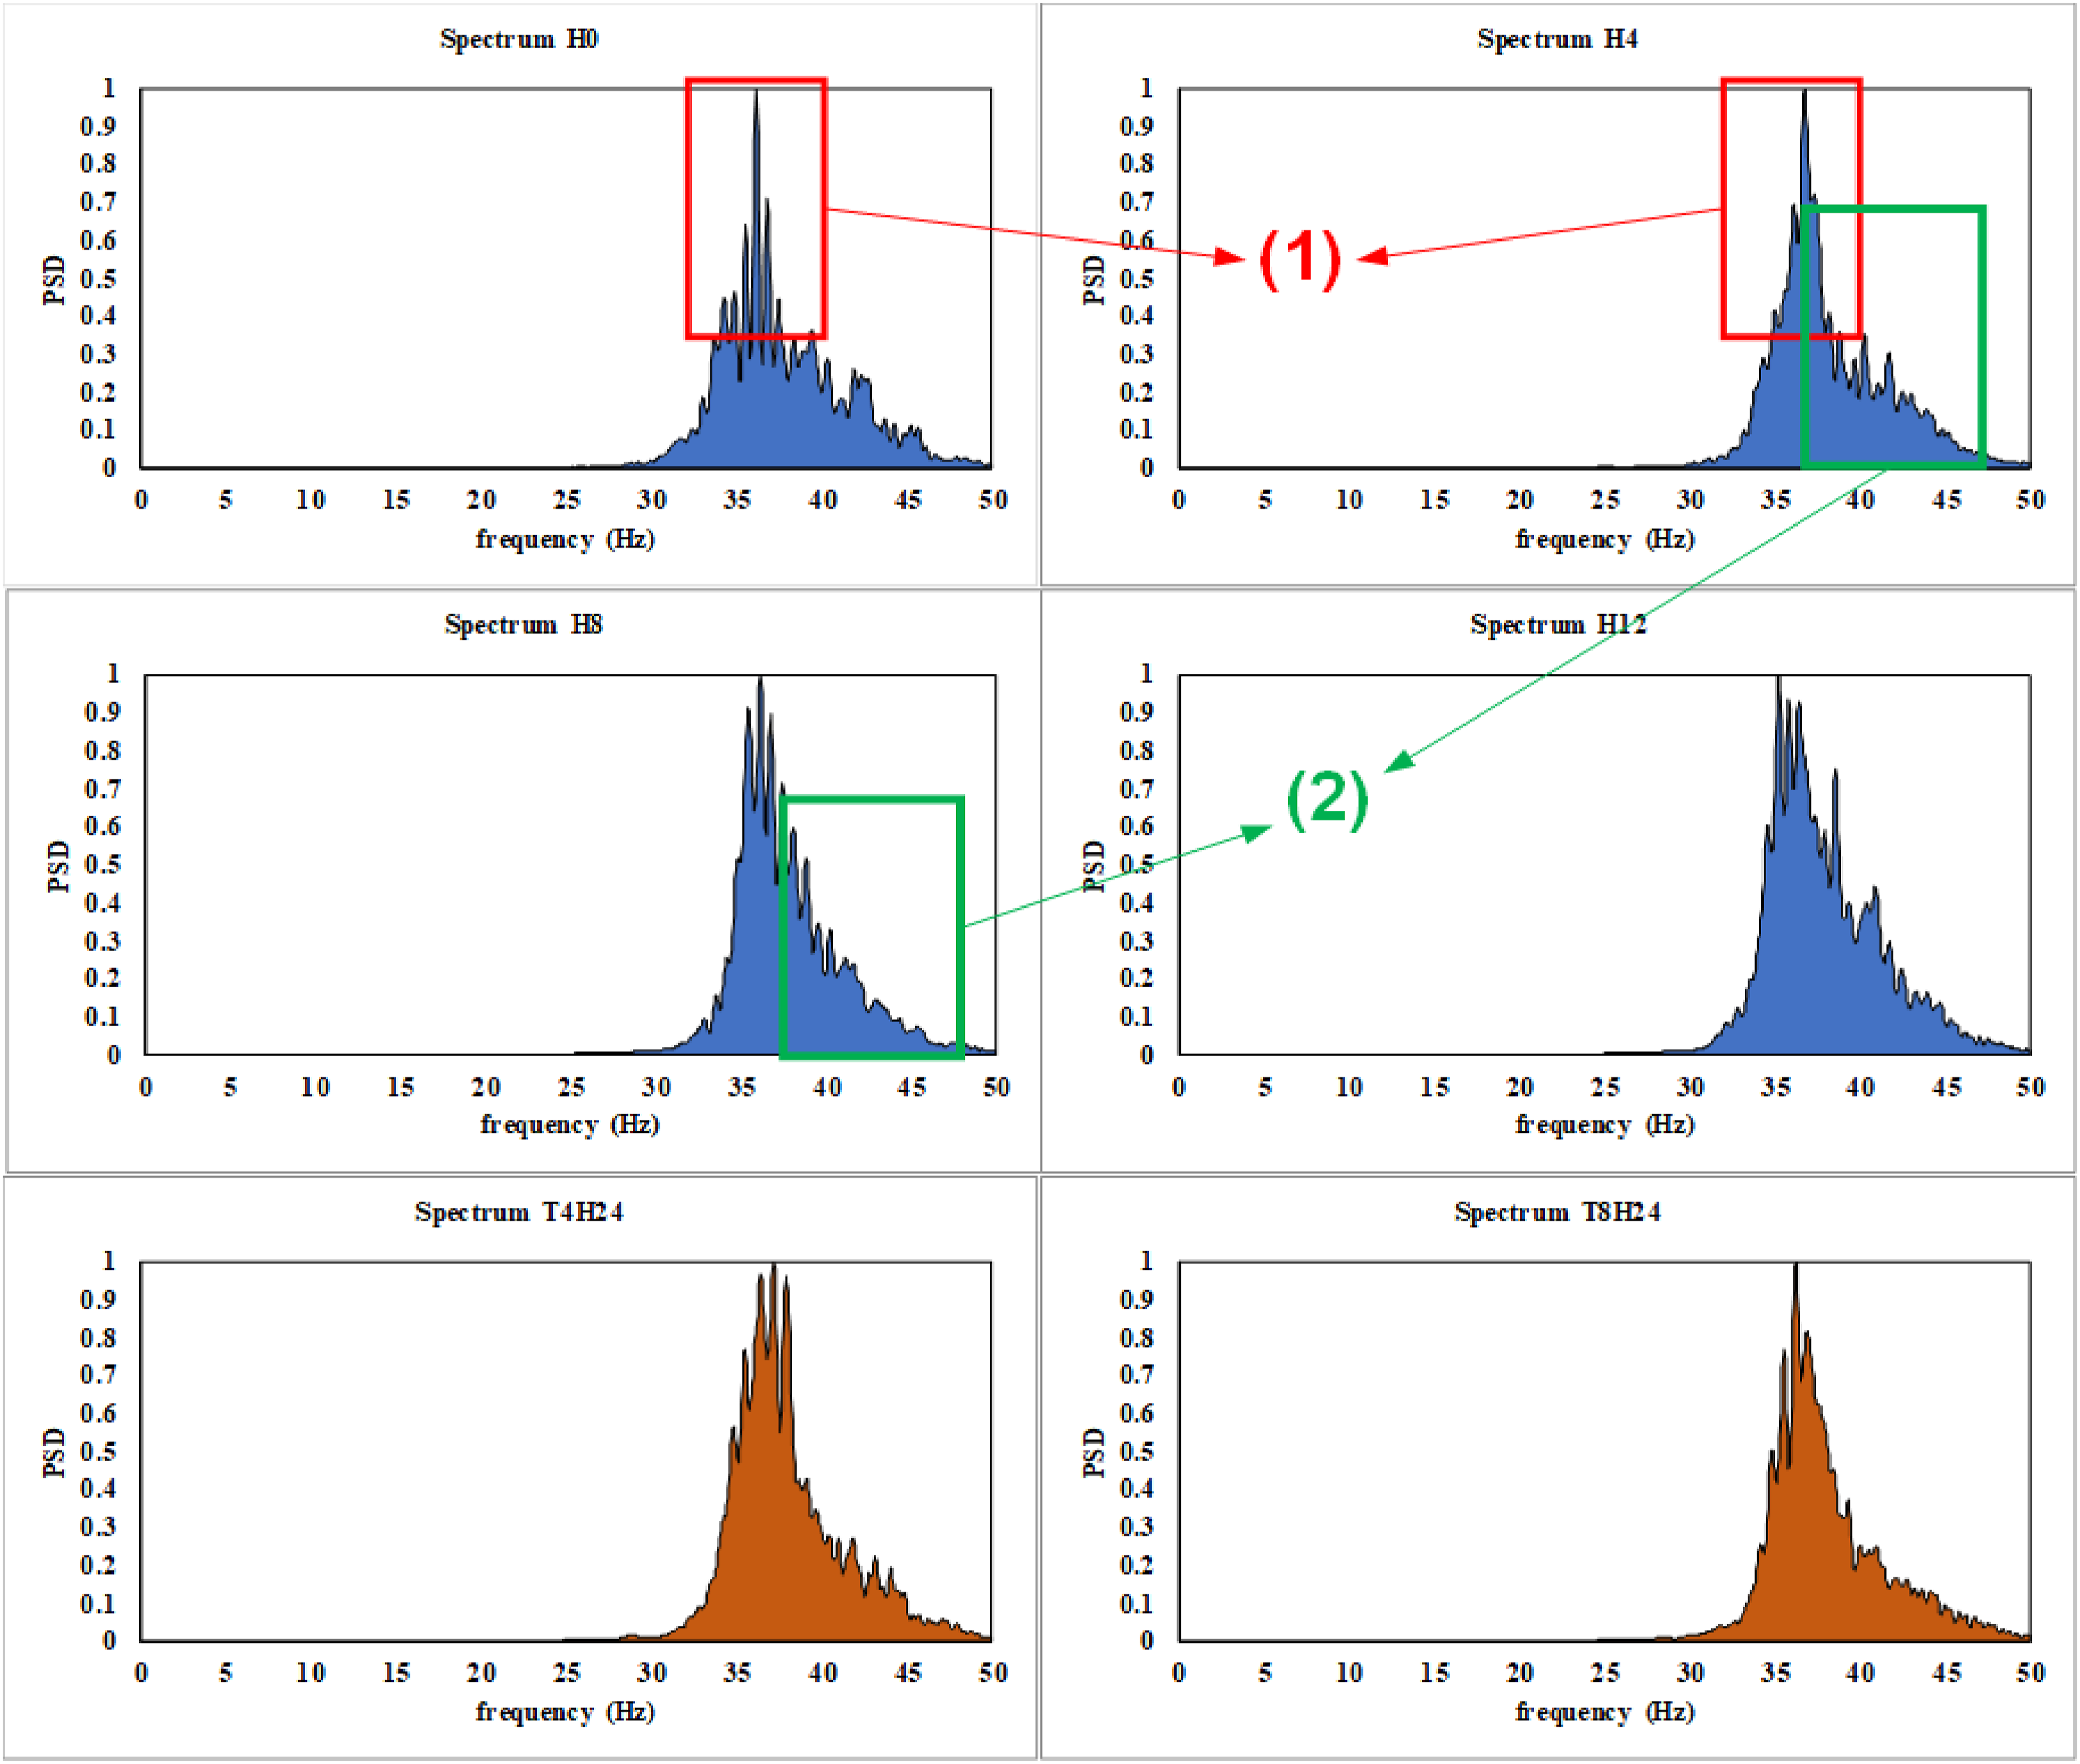
To further clarify the discussed content, we will analyze in detail two criteria for assessing the shape changes of the power spectral density: ➢ Criterion (1)—Change in Sharpness Around the Peak Value: • In the area near the peak frequency of the power spectral density, we observed that the sharpness of the spectrum can change after each crack. Specifically, the sharpness can increase or decrease, as indicated by the rise or fall in the amplitude values around the peak of the spectrum. • To assess this change, we calculate the sum of the normalized amplitude values (amplitudes divided by the peak value) over a defined frequency range. This sum provides an overall view of the changes in amplitude around the peak of the spectrum. ➢ Criterion (2)—Change in Curvature at Higher Frequencies: • In the area with frequencies higher than the peak frequency (the right-side frequency region of the peak), the shape of the spectrum also changes after each crack. The curvature of the spectrum curve may change, meaning that the curve can become more curved or flatter, reflecting variations in the vibration components at higher frequencies. • To evaluate this criterion, we calculate the correlation between the spectral curve in the high-frequency region and an exponential curve, represented by
The general quantity used to evaluate the shape change of the spectrum, denoted as Spectrum change with the appearance of the first crack (H crack). Spectrum change with the appearance of the second crack (T Crack).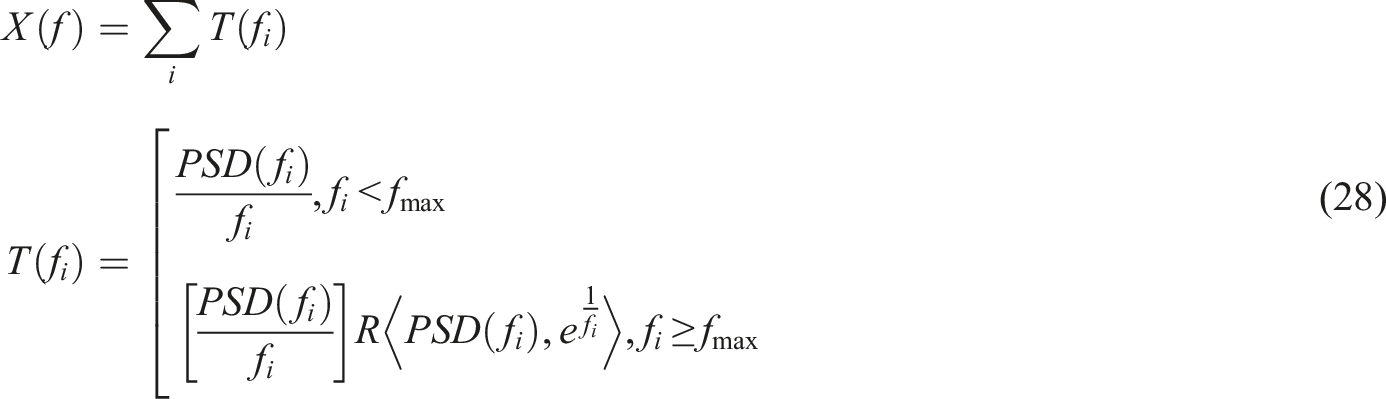
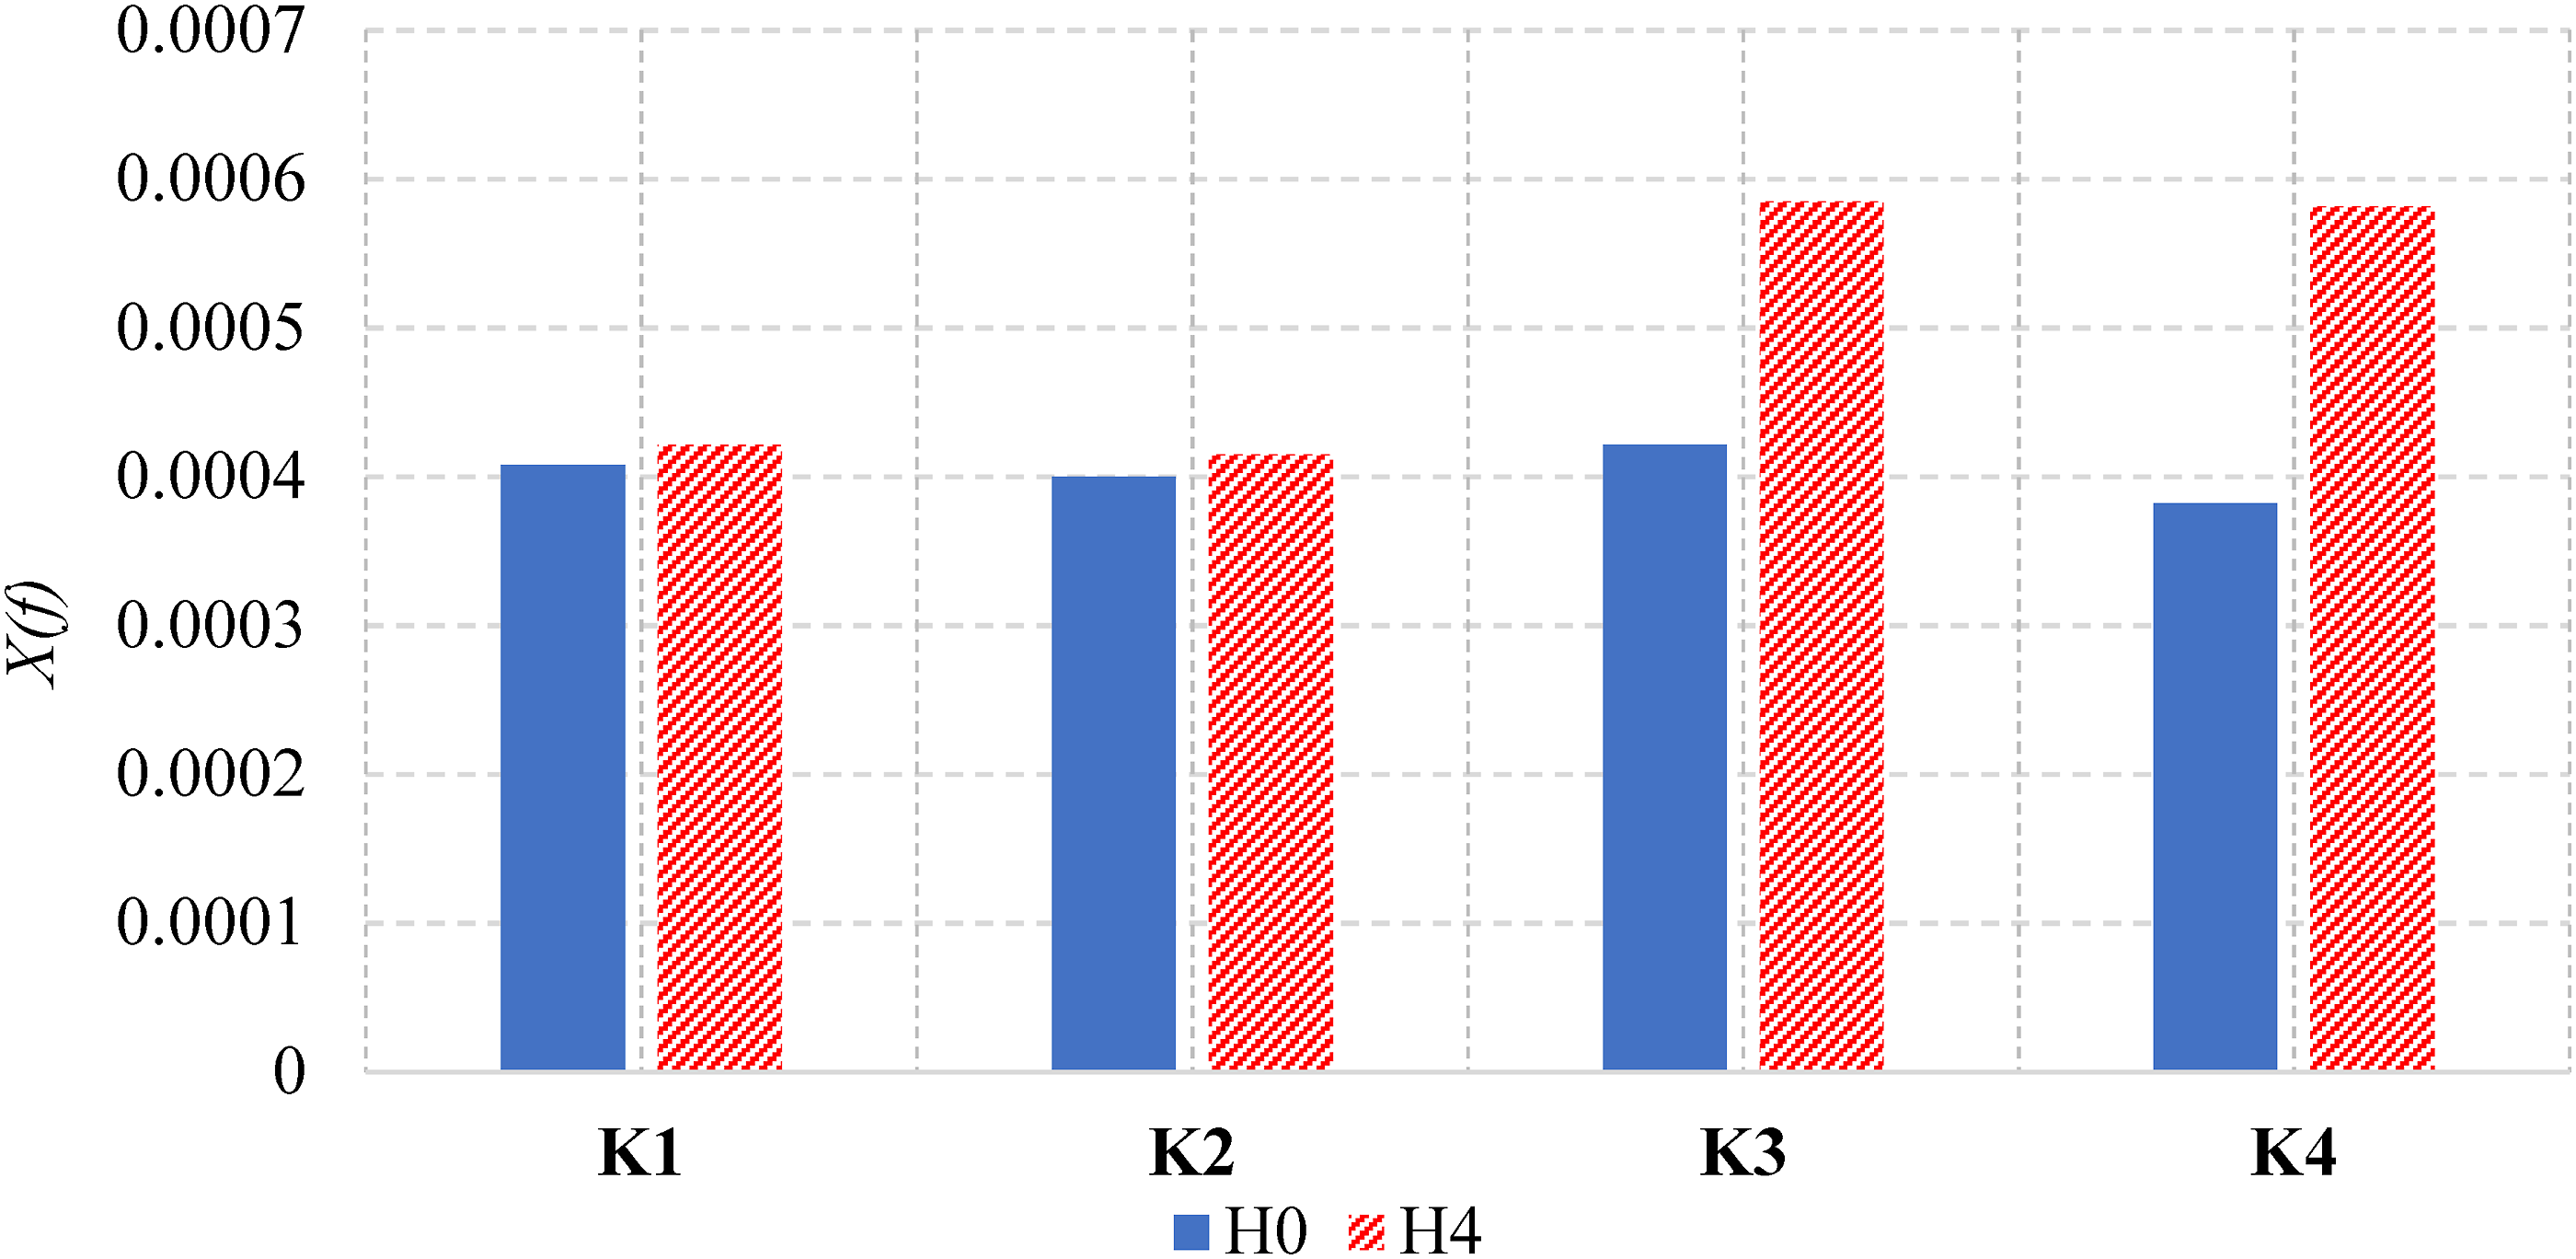
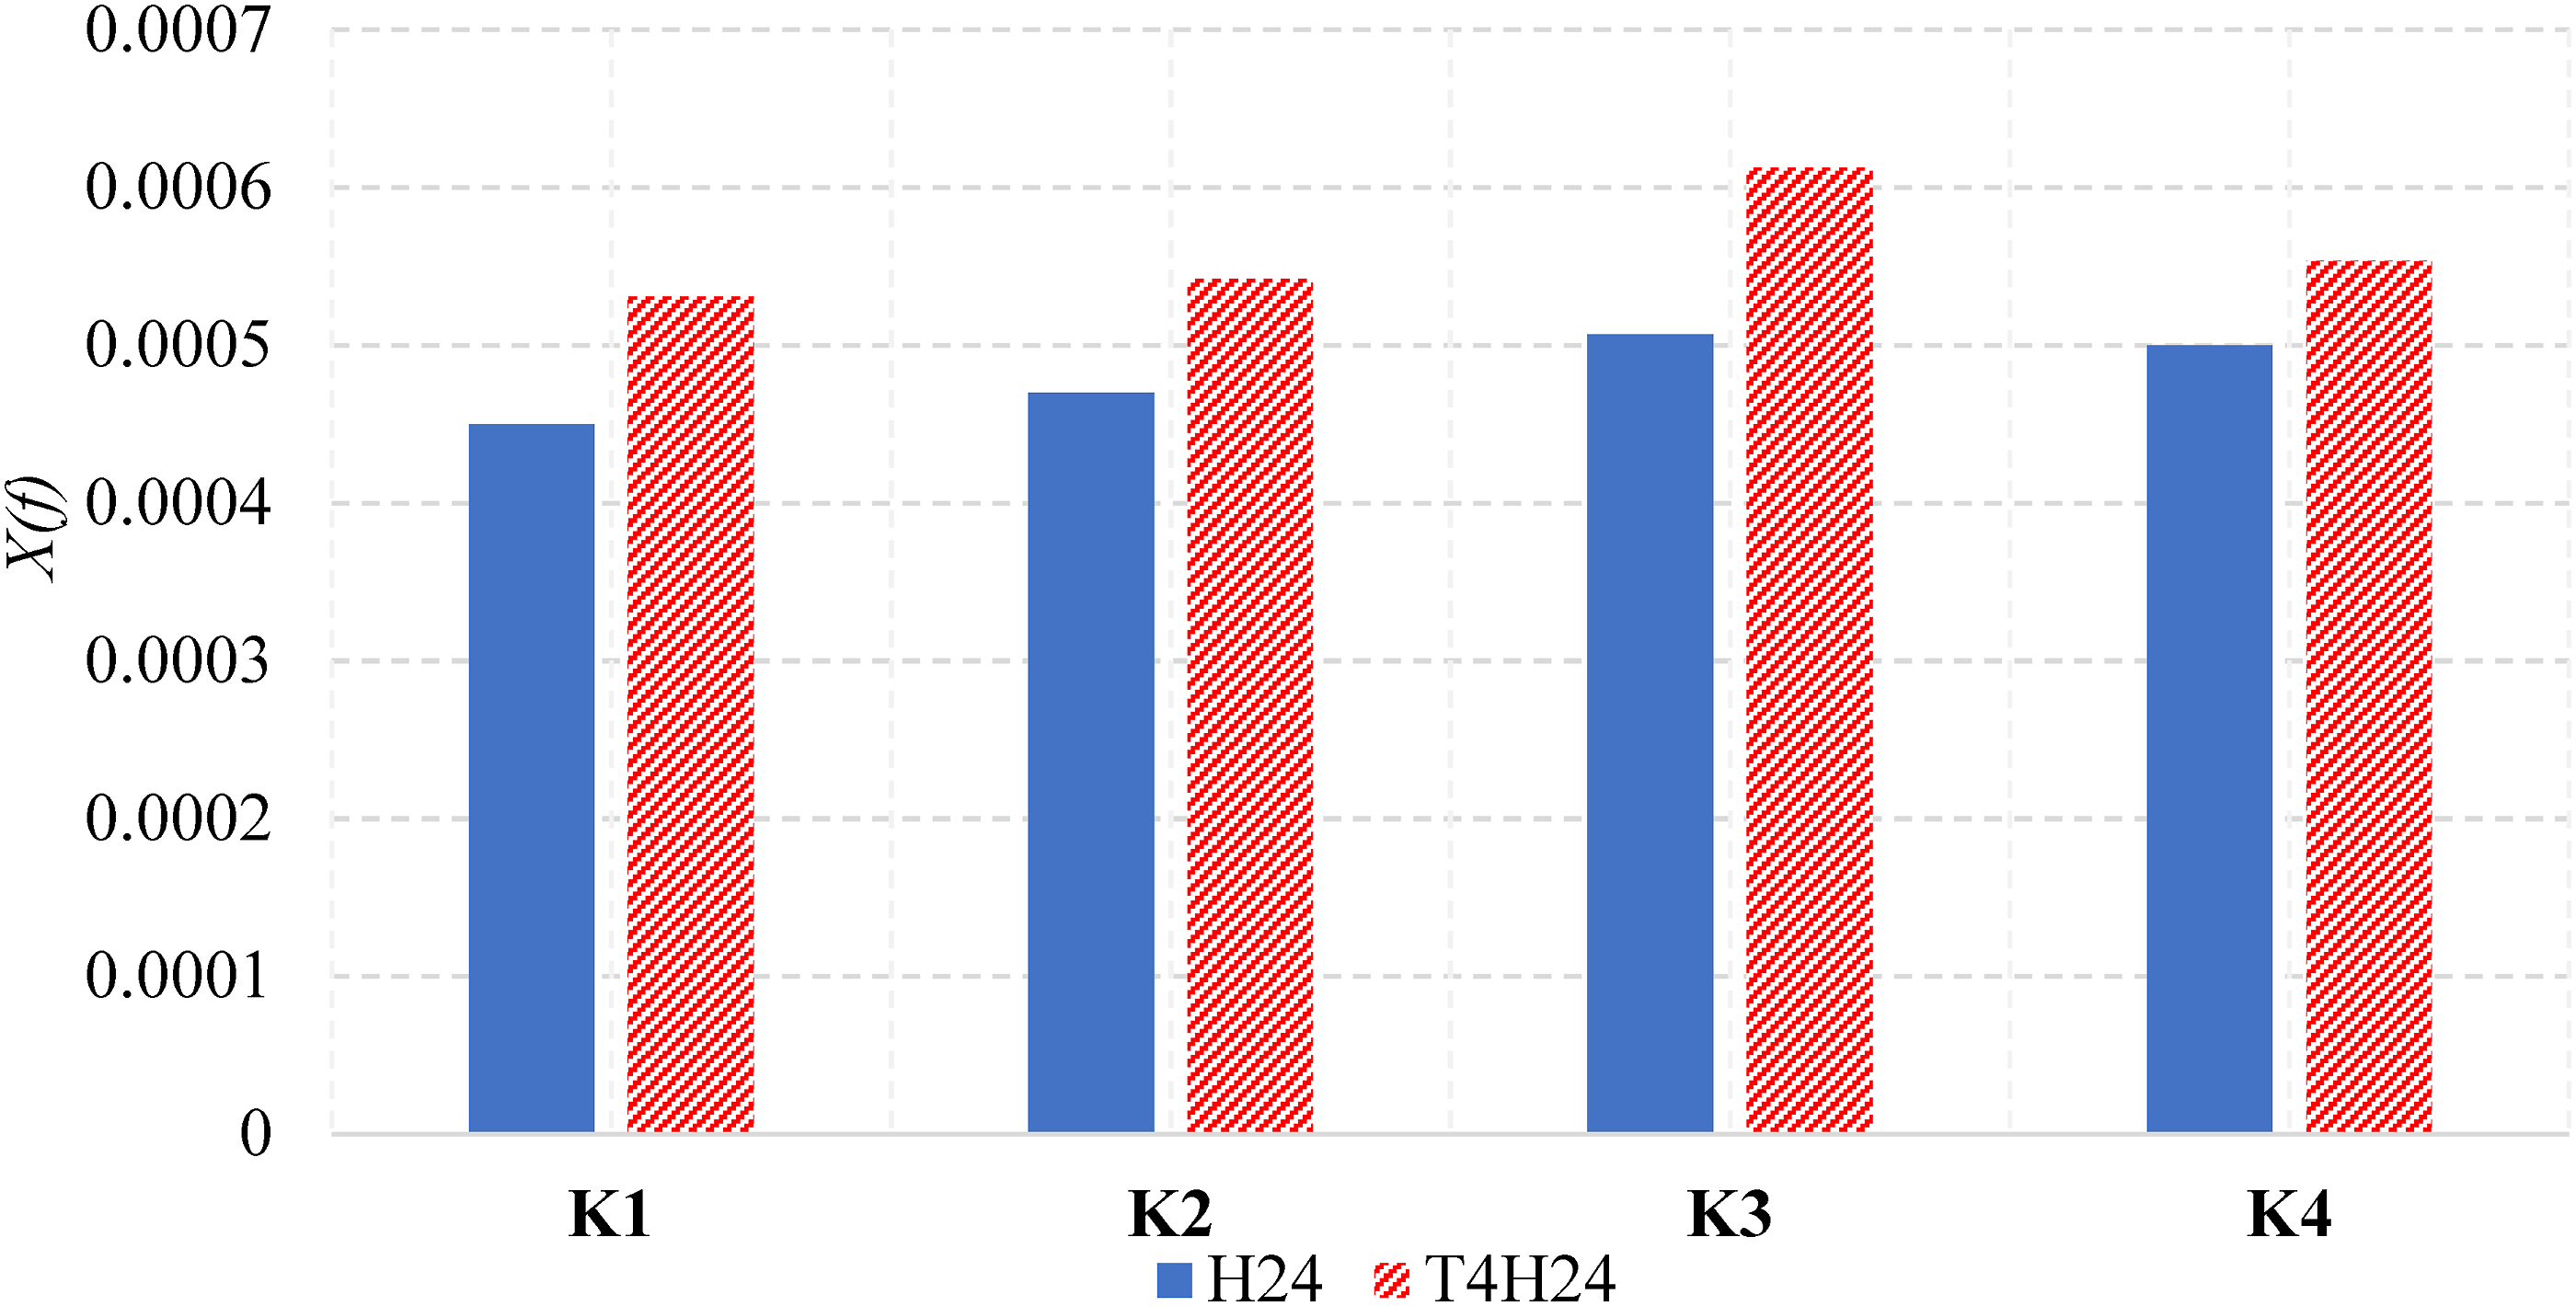
On the basis of the results obtained, it can be seen that the parameter used to evaluate the shape change of the power spectral density increases when a crack appears. When the first crack (H) occurs, the value of this parameter increases significantly, along with a noticeable difference in the degree of change between positions on both sides of the crack. This indicates that the H crack causes an uneven change in the shape of the spectrum across the sensor channels. However, when the second crack (T) appears, the shape change in the power spectral density becomes more uniform across all four sensor channels. This suggests that the second crack has a more balanced effect on the entire system, leading to consistent shape changes in the spectrum at all measurement positions, without the large discrepancies observed with only the first crack. These results confirm the sensitivity of the spectrum shape parameter to detect and assess the degree of damage at different stages of the process.
Discussions
Impact of environmental factors on vibration measurements
One critical aspect of the SHM is accounting for external environmental factors, such as temperature fluctuations, wind, and external loads, which can introduce noise and distort the vibration signals. These factors can significantly impact the accuracy of vibration analysis, as they may obscure the true vibration modes associated with structural damage. In the context of this study, while MODWT-FFT enhances the clarity of the signal by separating noise from meaningful vibration components, it is still essential to consider how environmental factors might affect the overall system performance.
To mitigate the influence of these factors, MODWT’s multiresolution capability plays a crucial role. By decomposing the vibration signals into low-frequency and high-frequency components, MODWT allows for the effective isolation of noise that typically arises from environmental conditions. For instance, temperature-induced vibrations or wind effects often manifest in high-frequency ranges, and through the MODWT decomposition, these components can be filtered out during analysis. This ensures that only the core structural vibrations are analyzed, thus improving the reliability of the results.
However, despite these capabilities, it is acknowledged that some residual effects of environmental factors may still persist, particularly in more extreme conditions. Therefore, future work could focus on integrating environmental monitoring sensors alongside vibration sensors to account for these factors more comprehensively. Additionally, adaptive noise filtering techniques could be incorporated to dynamically adjust the analysis based on real-time environmental data.
Comparison with existing methods
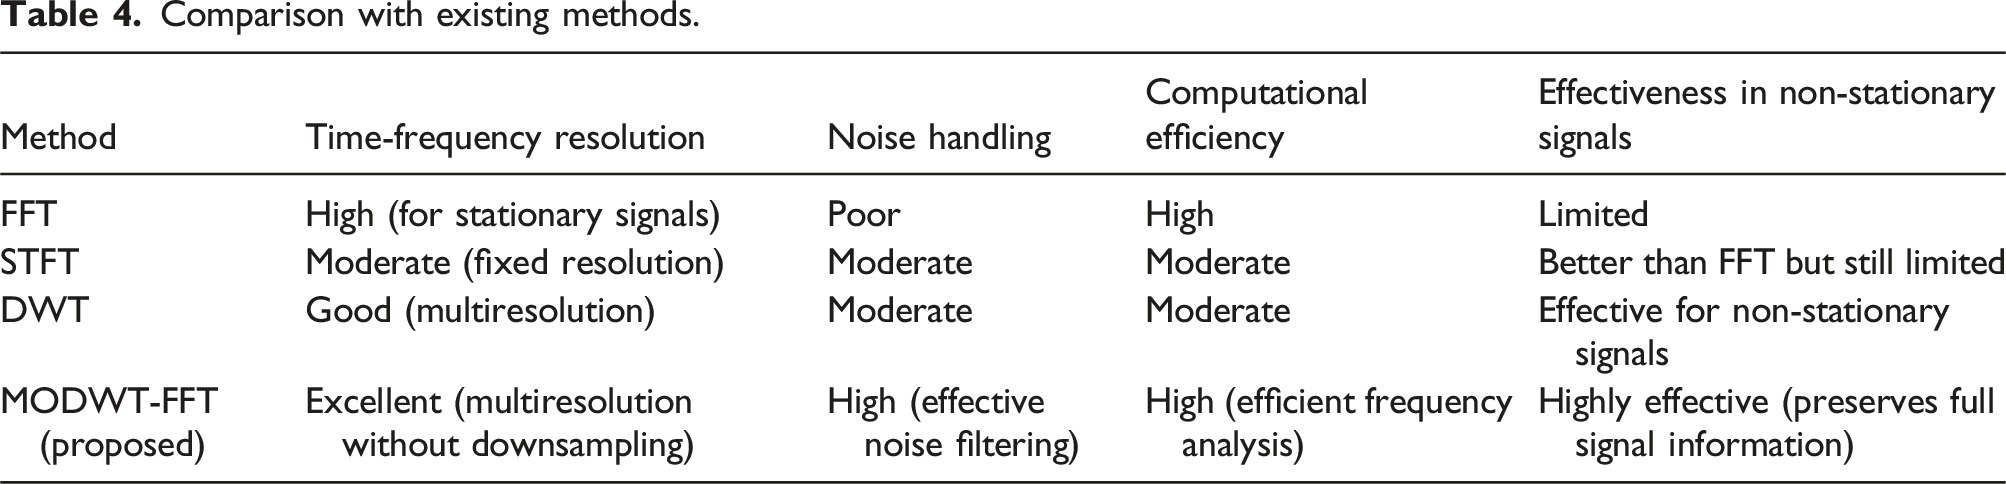
Comparison with existing methods.
Time-frequency resolution
Time–Frequency resolution of MODWT compared to other methods.
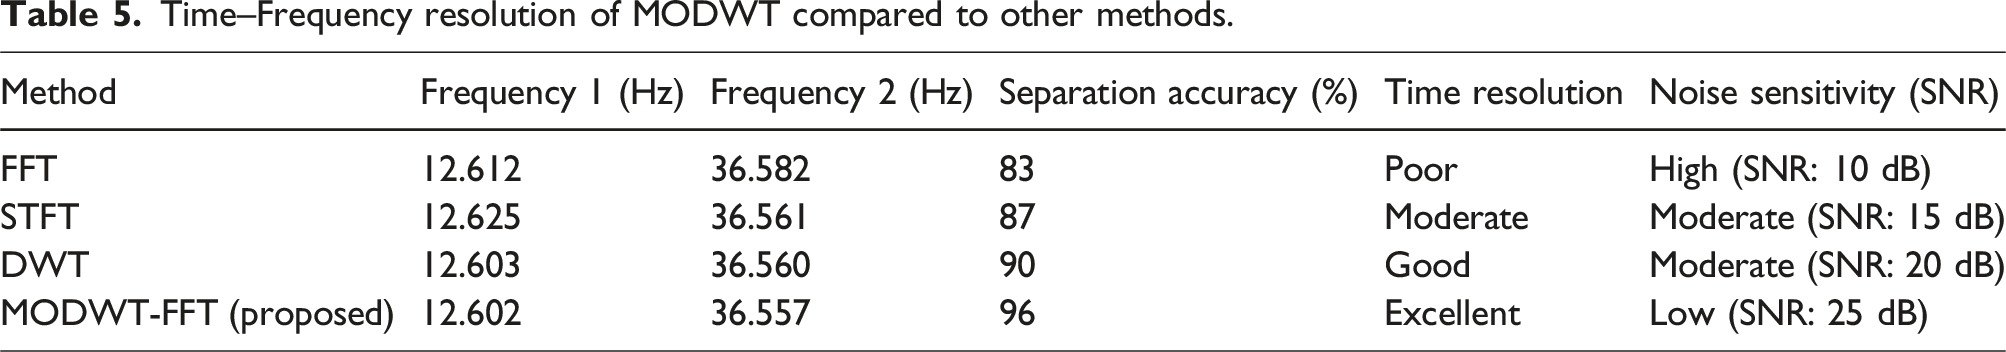
The Table 5 illustrates the clear advantage of MODWT-FFT in accurately separating overlapping vibration modes and handling noisy signals. In practical SHM applications, the superior time-frequency resolution of MODWT-FFT allows engineers to detect subtle structural changes that would be missed using traditional methods. For instance, in bridge monitoring, where minor cracks may cause small shifts in vibrational frequencies, this method ensures that even the smallest deviations are detected early, preventing further damage.
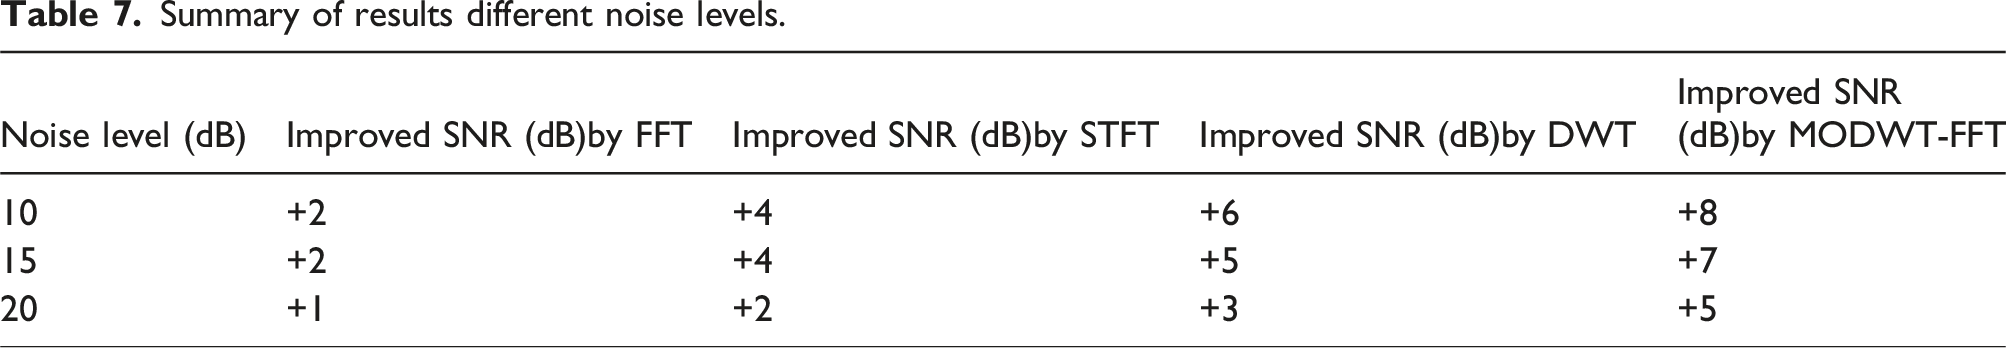
Noise handling
The results for different noise levels.
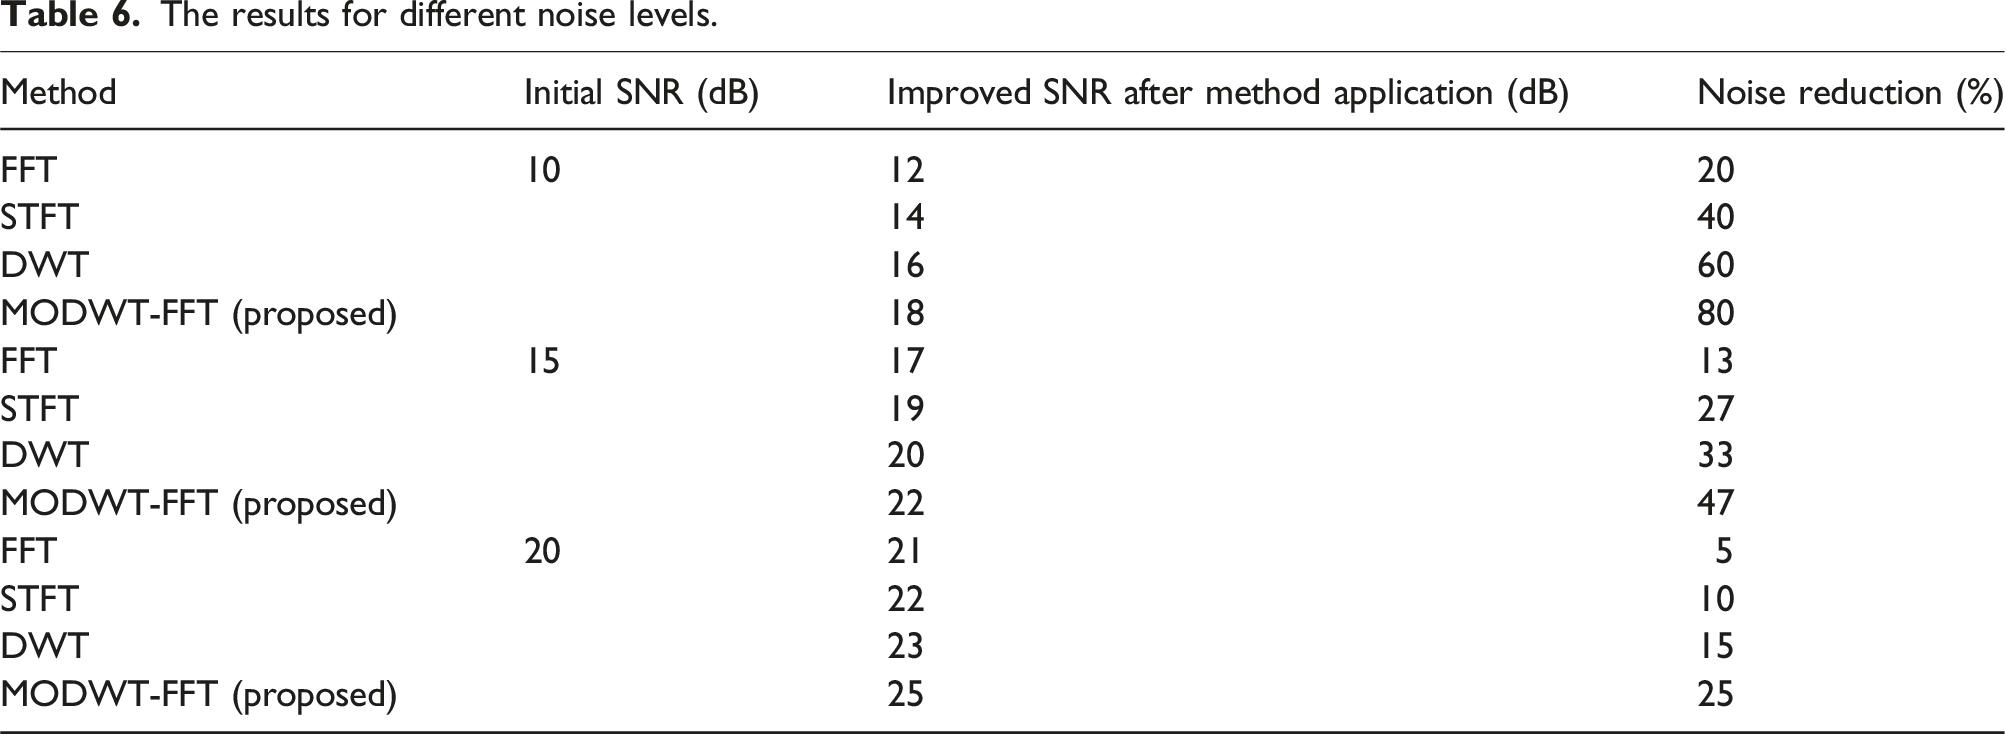
Summary of results different noise levels.
Computational efficiency
FFT remains the most computationally efficient method due to its simplicity, but this comes at the cost of accuracy, especially for non-stationary signals. STFT and DWT offer better handling of non-stationary signals but at a higher computational cost. The MODWT-FFT approach balances both computational efficiency and accuracy, making it suitable for real-time SHM applications.
Effectiveness in non-stationary signals
Non-stationary signals, common in real-world structures due to variable operational conditions, are a significant challenge for traditional FFT. While STFT and DWT improve on this, they still suffer from limitations in balancing time and frequency resolution. MODWT, by avoiding downsampling, maintains the signal’s full information, making it highly effective in analyzing non-stationary signals and tracking changes in the structure’s vibration modes over time.
In comparison to existing methods, the proposed MODWT-FFT combination demonstrates a clear advantage, particularly in the accurate separation of overlapping vibration modes and in handling noise from environmental factors. The integration of these two methods ensures that structural health monitoring systems are not only more sensitive to subtle structural changes but also more robust in real-world conditions. Future work may focus on integrating this method with environmental monitoring or machine learning models to further enhance its reliability and predictive capabilities.
Practical applications and improvements
The combination of MODWT and FFT presents clear advantages for real-time structural health monitoring. By offering improved time-frequency resolution, superior noise reduction, and enhanced sensitivity to structural damage, this method can be effectively applied in scenarios where early detection of structural issues is critical. For example, in bridge health monitoring, the ability to identify small shifts in vibration modes and PSD could allow for timely maintenance interventions, reducing the risk of catastrophic failure.
Additionally, the method could be further refined by incorporating machine learning models that learn to predict structural damage based on vibration patterns. Such models could be trained using historical vibration data and could integrate MODWT-FFT features for more accurate predictions.
Conclusion
This paper successfully achieved the objective of diagnosing damage in beams by evaluating changes in PSD. PSD was calculated on individual vibration modes, separated from the overall spectrum using the multiresolution analysis technique with the maximal overlap discrete wavelet transform (MODWT). The key findings of the study include: • The overall vibration signal consists of multiple individual vibrations and noise. The MODWT multiresolution analysis technique allows the original signal to be separated into distinct vibration signals while filtering out noise, improving the accuracy of the analysis. • The PSD obtained from the overall vibration signal is a combination of the PSDs of individual vibrations and noise. Separation of the individual vibrations clarifies the impact of damage on the main vibrations of the beam. Some individual vibrations are more sensitive to damage and respond synchronously to the increase in damage on the beam. This helps identify critical vibrations that need to be monitored. • As the damage to the beam increases, the peak amplitude of the PSD corresponding to damage-sensitive individual vibrations gradually decreases. This provides a reliable basis for assessing the extent of damage over time. Changes in PSD shape of the PSD are also closely related to damage. Analyzing shape changes in the PSD helps determine the moment damage occurs, providing useful information to monitor structural condition.
These results demonstrate the rationality and high applicability of the method. The study uses vibration signals that are easily measurable and can be applied to real-world structures, with consistent and reasonable damage identification results at multiple measurement points. These findings confirm the potential application of the method in monitoring and diagnosing damage in real-world structures, particularly bridge and beam systems.
Footnotes
Declaration of conflicting interests
The author(s) declared the following potential conflicts of interest with respect to the research, authorship, and/or publication of this article: This is to certify that to the best of authors’ knowledge, the content of this manuscript is original. The paper has not been submitted elsewhere nor has been published anywhere. Authors confirm that the intellectual content of this paper is the original product of our work and all the assistance or funds from other sources have been acknowledged.
Funding
The author(s) received no financial support for the research, authorship, and/or publication of this article.
Originality Statement
“I hereby declare that this submission is my own work and to the best of my knowledge it contains no materials previously published or written by another person, or substantial proportions of material. Any contribution made to the research by others, with whom I have worked in draft or elsewhere, is explicitly acknowledged in the draft.”