
Abstract
This paper introduces a novel method for detecting damage in beams based on energy distribution analysis of the power spectrum (PSD). An experiment was carried out on a steel beam, where incremental cuts representing damage were introduced. At each stage, the beam was subjected to a load and its vibrations were measured to collect data. These vibration signals were then analyzed using the discrete wavelet transform (DWT), which isolates distinct signal segments that are more sensitive to the presence of damage. To further clarify the results, these signal segments were processed using the fast Fourier transform (FFT). The findings show that the power spectrum of the segmented signals is significantly more sensitive to damage compared to the power spectrum of the original signal. The study evaluates the sensitivity to damage using the energy distribution of the power spectrum in the frequency domain, while tracking changes in this energy as damage progresses. The proposed method not only accurately identifies the presence of damage but also monitors its progression over time. This offers a promising solution for predicting structural damage and conducting quality assessments, providing early warnings, and tracking the development of structural issues.
Keywords
Introduction
During the operation and use of construction structures, structural damage is an inevitable factor that can lead to serious consequences if not detected and addressed in a timely manner.1,2 Damage to load-bearing structures, 3 especially beams, 4 is a major cause of severe incidents, ranging from structural weakening to complete collapse. Therefore, identifying and assessing the development of damage to beams has become an urgent need,5,6 not only to ensure operational safety but also to optimize maintenance costs and extend the useful life of the structure.
Structural Health Monitoring (SHM)1,7 is a vital research area in modern engineering, especially in construction, transportation, and mechanical systems.1,8 The goal of SHM is to monitor the operational status of structures and mechanical systems to detect and evaluate the extent of damage,9,10 thus proposing timely maintenance and repair measures before damage progresses to an irreparable state. Structural monitoring allows us to determine the location, extent, and progression of damage,1,11,12 as well as predict when failures might occur, helping to minimize economic and human losses. In load-bearing structures, beams are a critical component and often carry substantial loads throughout the operating life of the structure. Damage to beams can begin as small cracks and gradually develop into more severe issues.13,14 If not detected early, these cracks can cause structural weakening or even complete collapse. Thus, the development of methods to detect and monitoring damage progression in beams plays a crucial role in ensuring the safety of structures and extending their useful life.
Currently, many methods are used to detect damage in structures, ranging from traditional approaches such as visual inspection and nondestructive testing (NDT) to more advanced techniques like vibration analysis and structural health monitoring (SHM).2,15 Visual inspection is the simplest and most common method, but its effectiveness depends largely on the experience and skills of the inspector. Additionally, visual inspection can only identify damage that has progressed to a visible state, while small cracks or latent damage are often overlooked. NDT methods such as ultrasound, X-rays, and acoustic analysis provide more detailed insights into the structural condition. However, these methods can be expensive, requiring modern equipment and highly skilled personnel, particularly when inspecting structures in difficult-to-access locations. In recent years, vibration analysis has proven to be highly effective in detecting damage,16,17 particularly damage related to beams. Vibration analysis is based on the principle that structural damage affects the vibration characteristics of the structure, such as natural frequencies,5,18 vibration amplitudes,3,6,19 and vibration modes.20–23 Monitoring and analyzing these changes helps to detect cracks early and assessing the extent of damage. One of the key advantages of this method is its ability to be applied under actual operating conditions of the structure, eliminating the need to halt operations for inspection. While operational noise can affect the results, advanced techniques such as noise filtering and signal processing have been developed to mitigate these effects, allowing for accurate damage detection even when the structure is in use.
Power spectral density (PSD)2,24,26 analysis is one of the common methods in vibration analysis. PSD measures the energy distribution of the vibration signal in the frequency domain,5,18,26 helping to identify key characteristics of the signal, 27 such as dominant frequency components 28 and energy levels at each frequency.29,30 When a structure is damaged, changes in the power spectrum can be clearly observed, showing the impact of damage on the frequency components of the vibration signal.2,15 PSD not only provides information on the presence of damage but also helps track the progression of the damage.31,32 As a crack appears and grows, the vibration energy of the structure is redistributed, often increasing the energy levels at higher frequencies. 33 Monitoring this change helps not only the presence of damage 34 but also predict the rate of its development.
The discrete wavelet transform (DWT)4,35,36 is a powerful method for analyzing time-varying signals, especially non-linear and unstable signals like the vibration signals of beams.37–39 The discrete wavelet transform (DWT) enables the decomposition of signals into multiple components at different scales,40,41 making it effective in identifying changes that traditional methods like the fast Fourier transform (FFT) might overlook. 42 FFT is a widely used tool in frequency analysis, transforming signals from the time domain to the frequency domain,43,44 but it may not capture transient or localized changes in signals as effectively. By combining DWT and FFT,45,46 a more robust analytical approach is achieved, allowing for the detailed decomposition and examination of complex signals. This integrated method provides deeper insights into the energy distribution of vibration signals, enhancing the sensitivity and accuracy of damage detection.
With the advantages of PSD, DWT, and FFT analysis, this paper proposes a new method for detecting damage in beams based on energy distribution analysis of the power spectrum.2,24,25 By using vibration signals collected from a steel beam, the study separates the signal using DWT to isolate distinct characteristics and then uses FFT to analyze changes in the frequency domain. The objective of the research is to develop a sensitive and efficient method to detect the presence and progression of structural damage while providing a robust tool for predicting damage and assessing structural quality. The method proposed in this paper not only helps in early and accurate detection of damage but also enables monitoring of its progression over time. This brings great benefits to construction, bridge, and other structural projects where regular monitoring and maintenance are crucial. The study also opens opportunities for the application of smart structural monitoring systems, contributing to the advancement of the fields of civil and mechanical engineering.
Theoretical basis
Dynamic equation of beam vibration
The study focuses on a beam subjected to the influence of a moving load traveling along the surface of the beam, as illustrated in Figure 1. Dynamic model of the beam.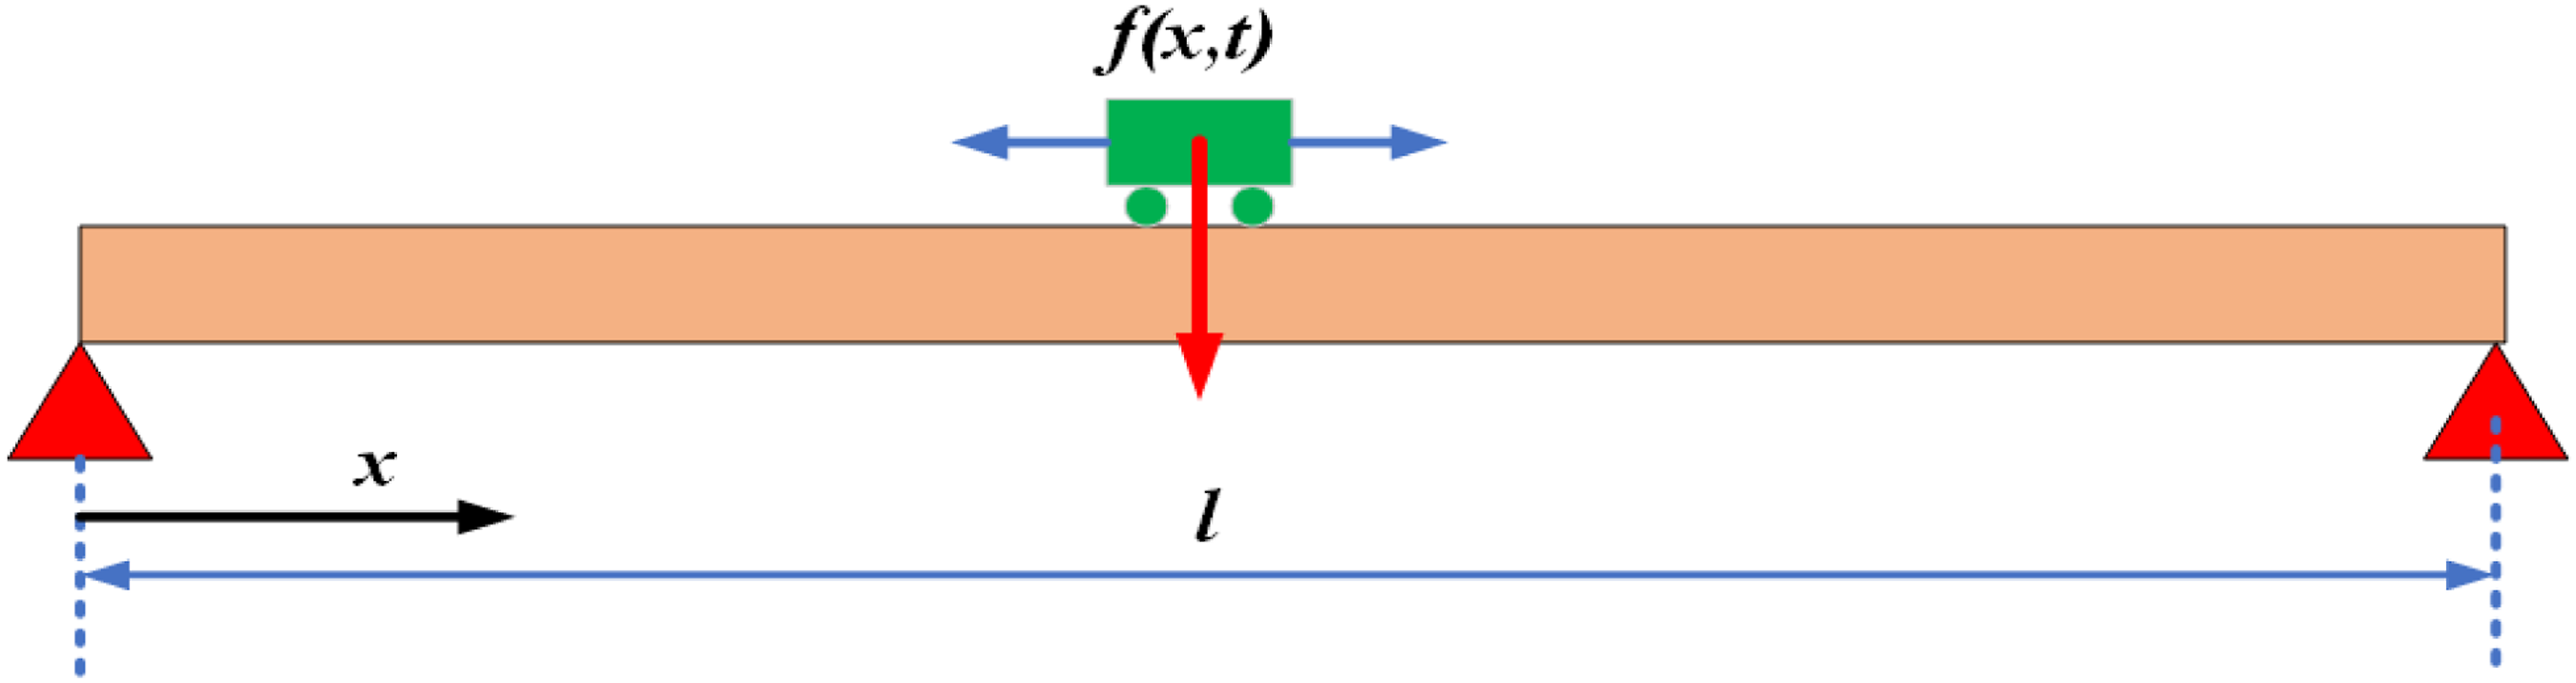
The dynamic equation of the beam under the action of force

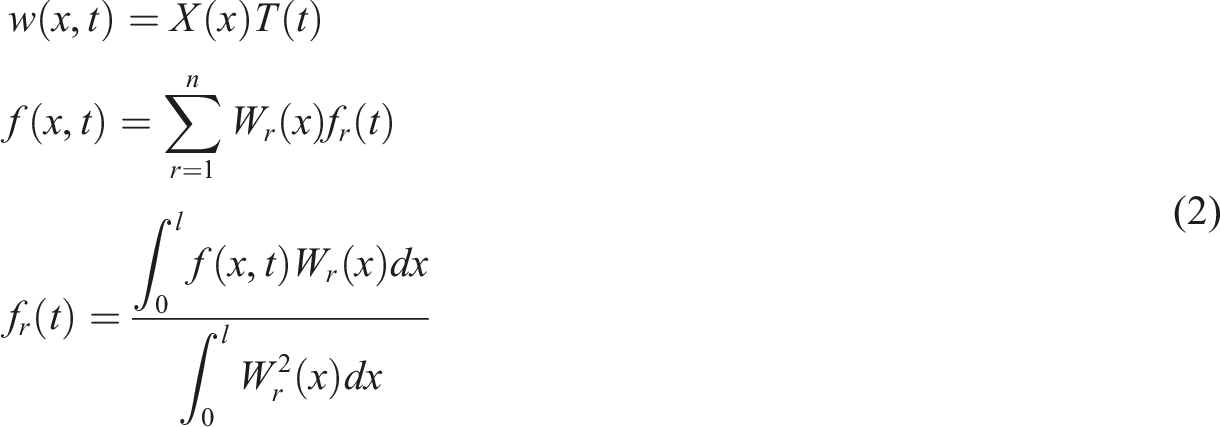
According to equation (2), the function w (x, t) is expressed as two separate functions: X (x) and T (t), where X (x) which contains only the spatial variable, and T (t), which contains only the time variable. Based on equation (2), equation (1) can be rewritten as the following equations


Solving equation (3) and equation (5) yields the natural frequencies p
r
. Substituting these into equation (4) provides a set of functions T
r
(t) that satisfy


The forced solution of equation (8) has the following form

Here, the amplitude is given by the expression
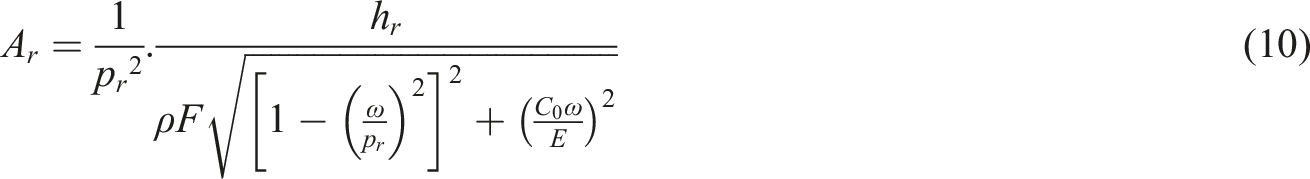
According to equation (10), the amplitude of the vibration is a function that depends on the material and mechanical properties. This paper focuses on processing this quantity with respect to power characteristics in the frequency domain, specifically the PSD, with

Discrete wavelet transform (DWT)
The discrete wavelet transform (DWT) is a powerful analytical tool for signal processing, particularly in problems involving time-varying characteristics. DWT operates on the principle of multiresolution analysis, allowing complex signals to be decomposed into more understandable components. This technique is often applied in noise filtering, field separation, and identifying hidden features within a signal. In DWT, each signal is divided into two main components: the approximation component (A) and the detail component (D). The approximation component (A) contains the low-frequency information of the signal, representing the general features, and is extracted using a low-pass filter. This component describes the main observable characteristics and is less affected by noise. On the contrary, the detail component (D) contains the high-frequency information, clarifying smaller features or rapid changes within the signal. This detail component is extracted using a high-pass filter, which helps detect minor fluctuations or noisy signals, as shown in Figure 2. Multiresolution analysis using discrete wavelet transform.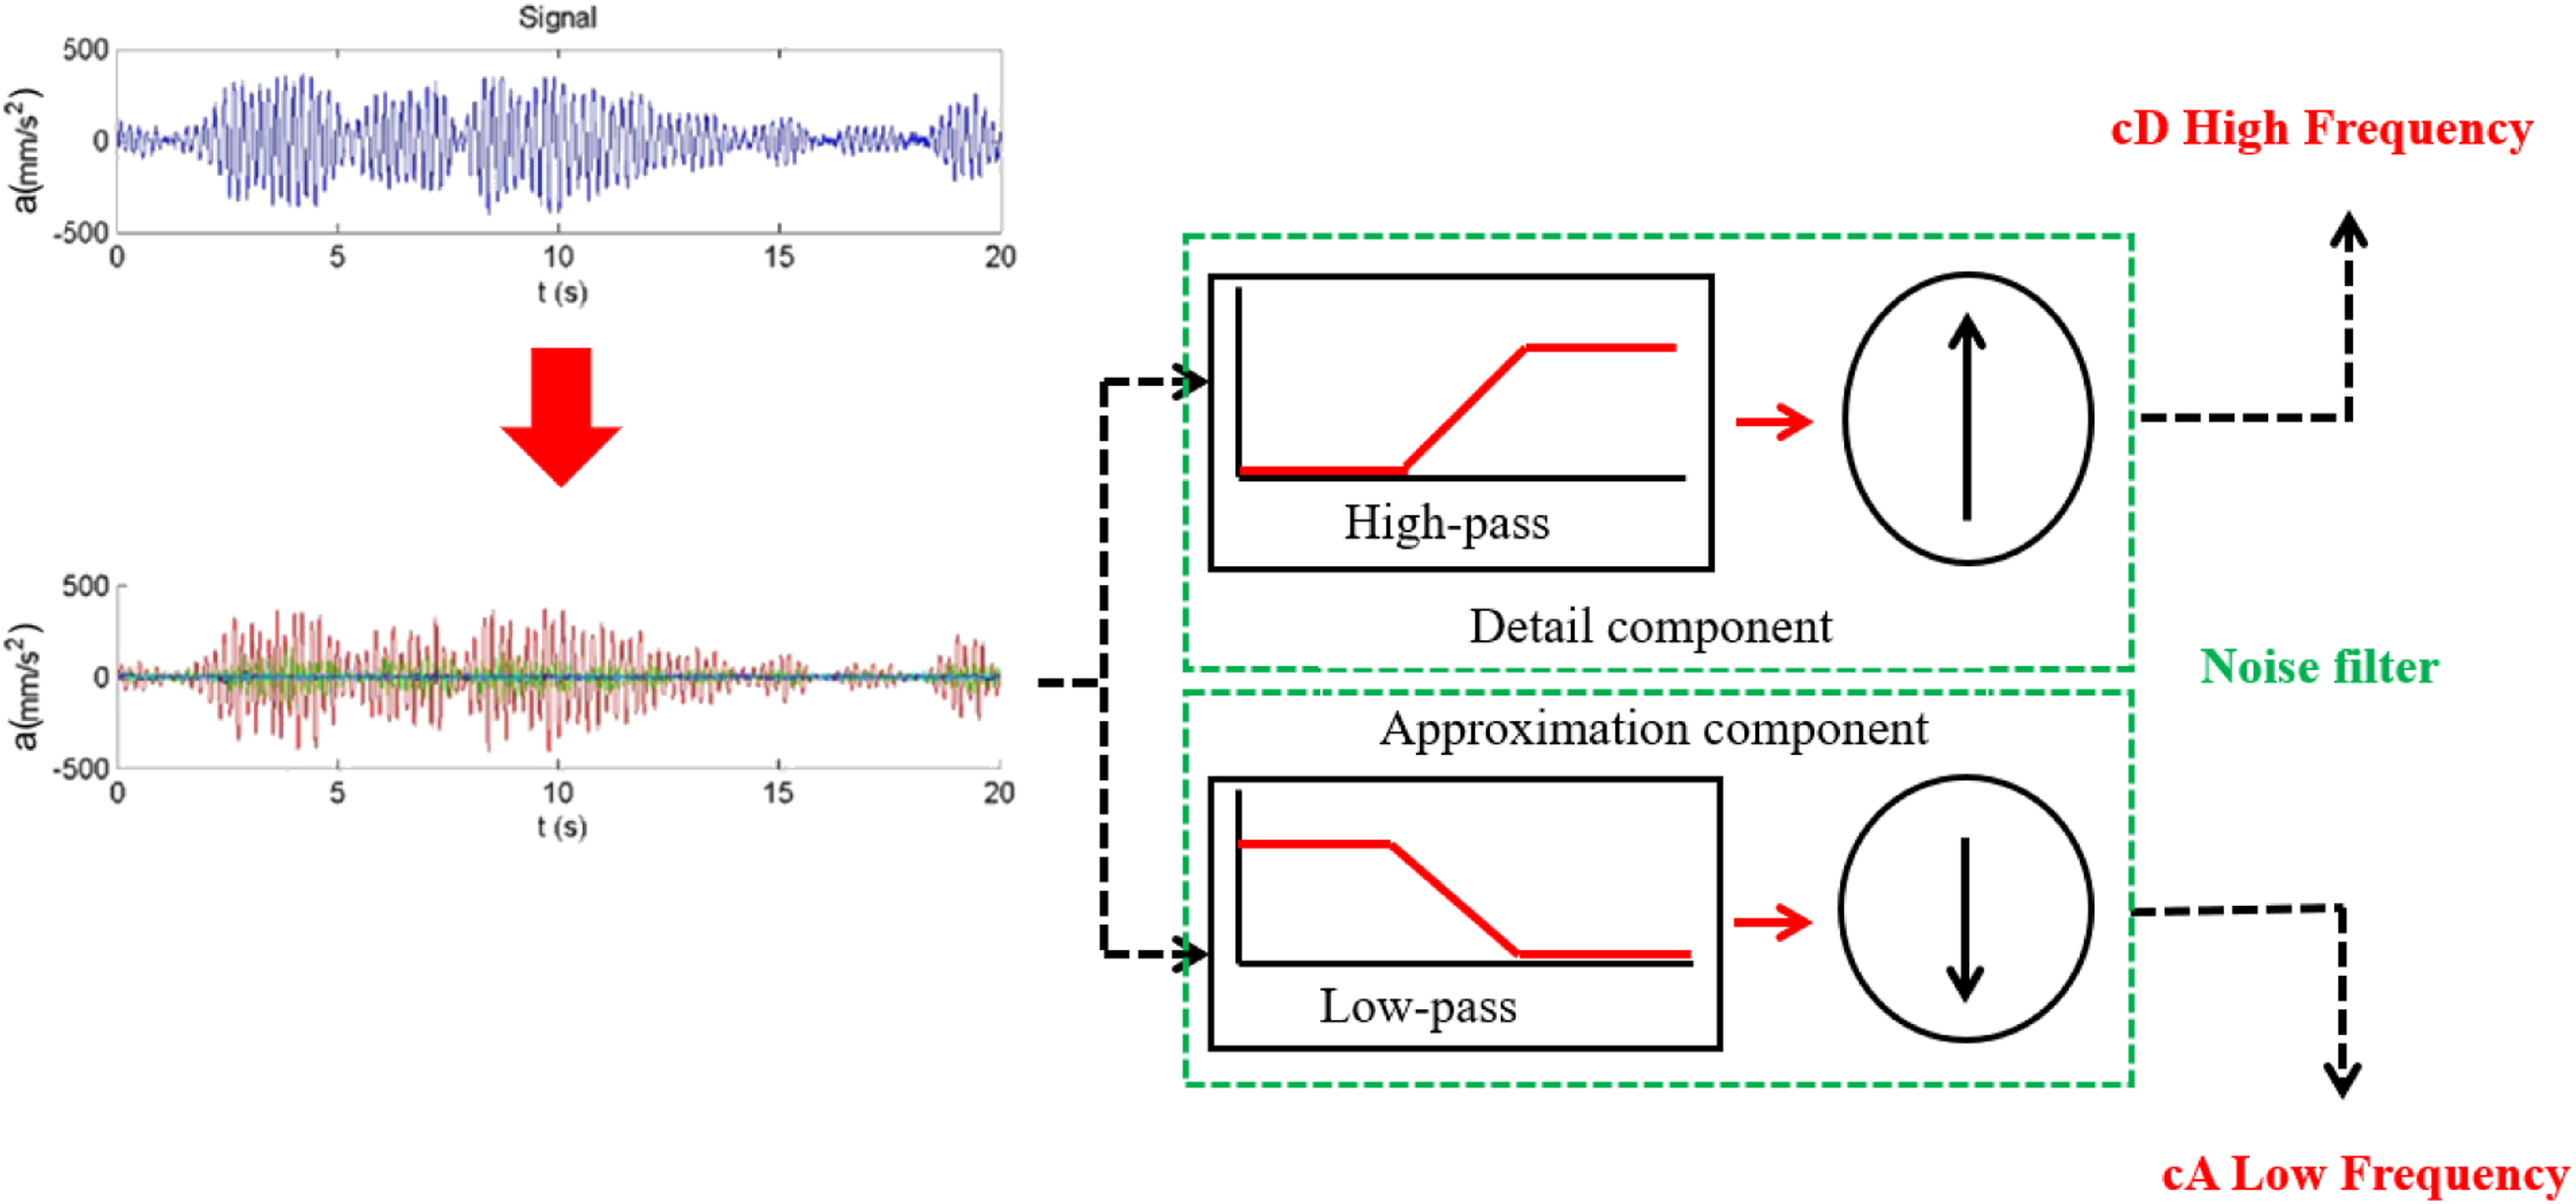
As shown in Figure 3, the analysis process can be performed multiple times, at different levels. To avoid an increase in computational load, the signal is downsampled by a factor of 2 at each level of analysis. Thus, for each level, the signal has a different resolution. Therefore, the discrete wavelet transform is referred to as multiresolution analysis (MRA). Multiresolution signal analysis using discrete wavelet transform.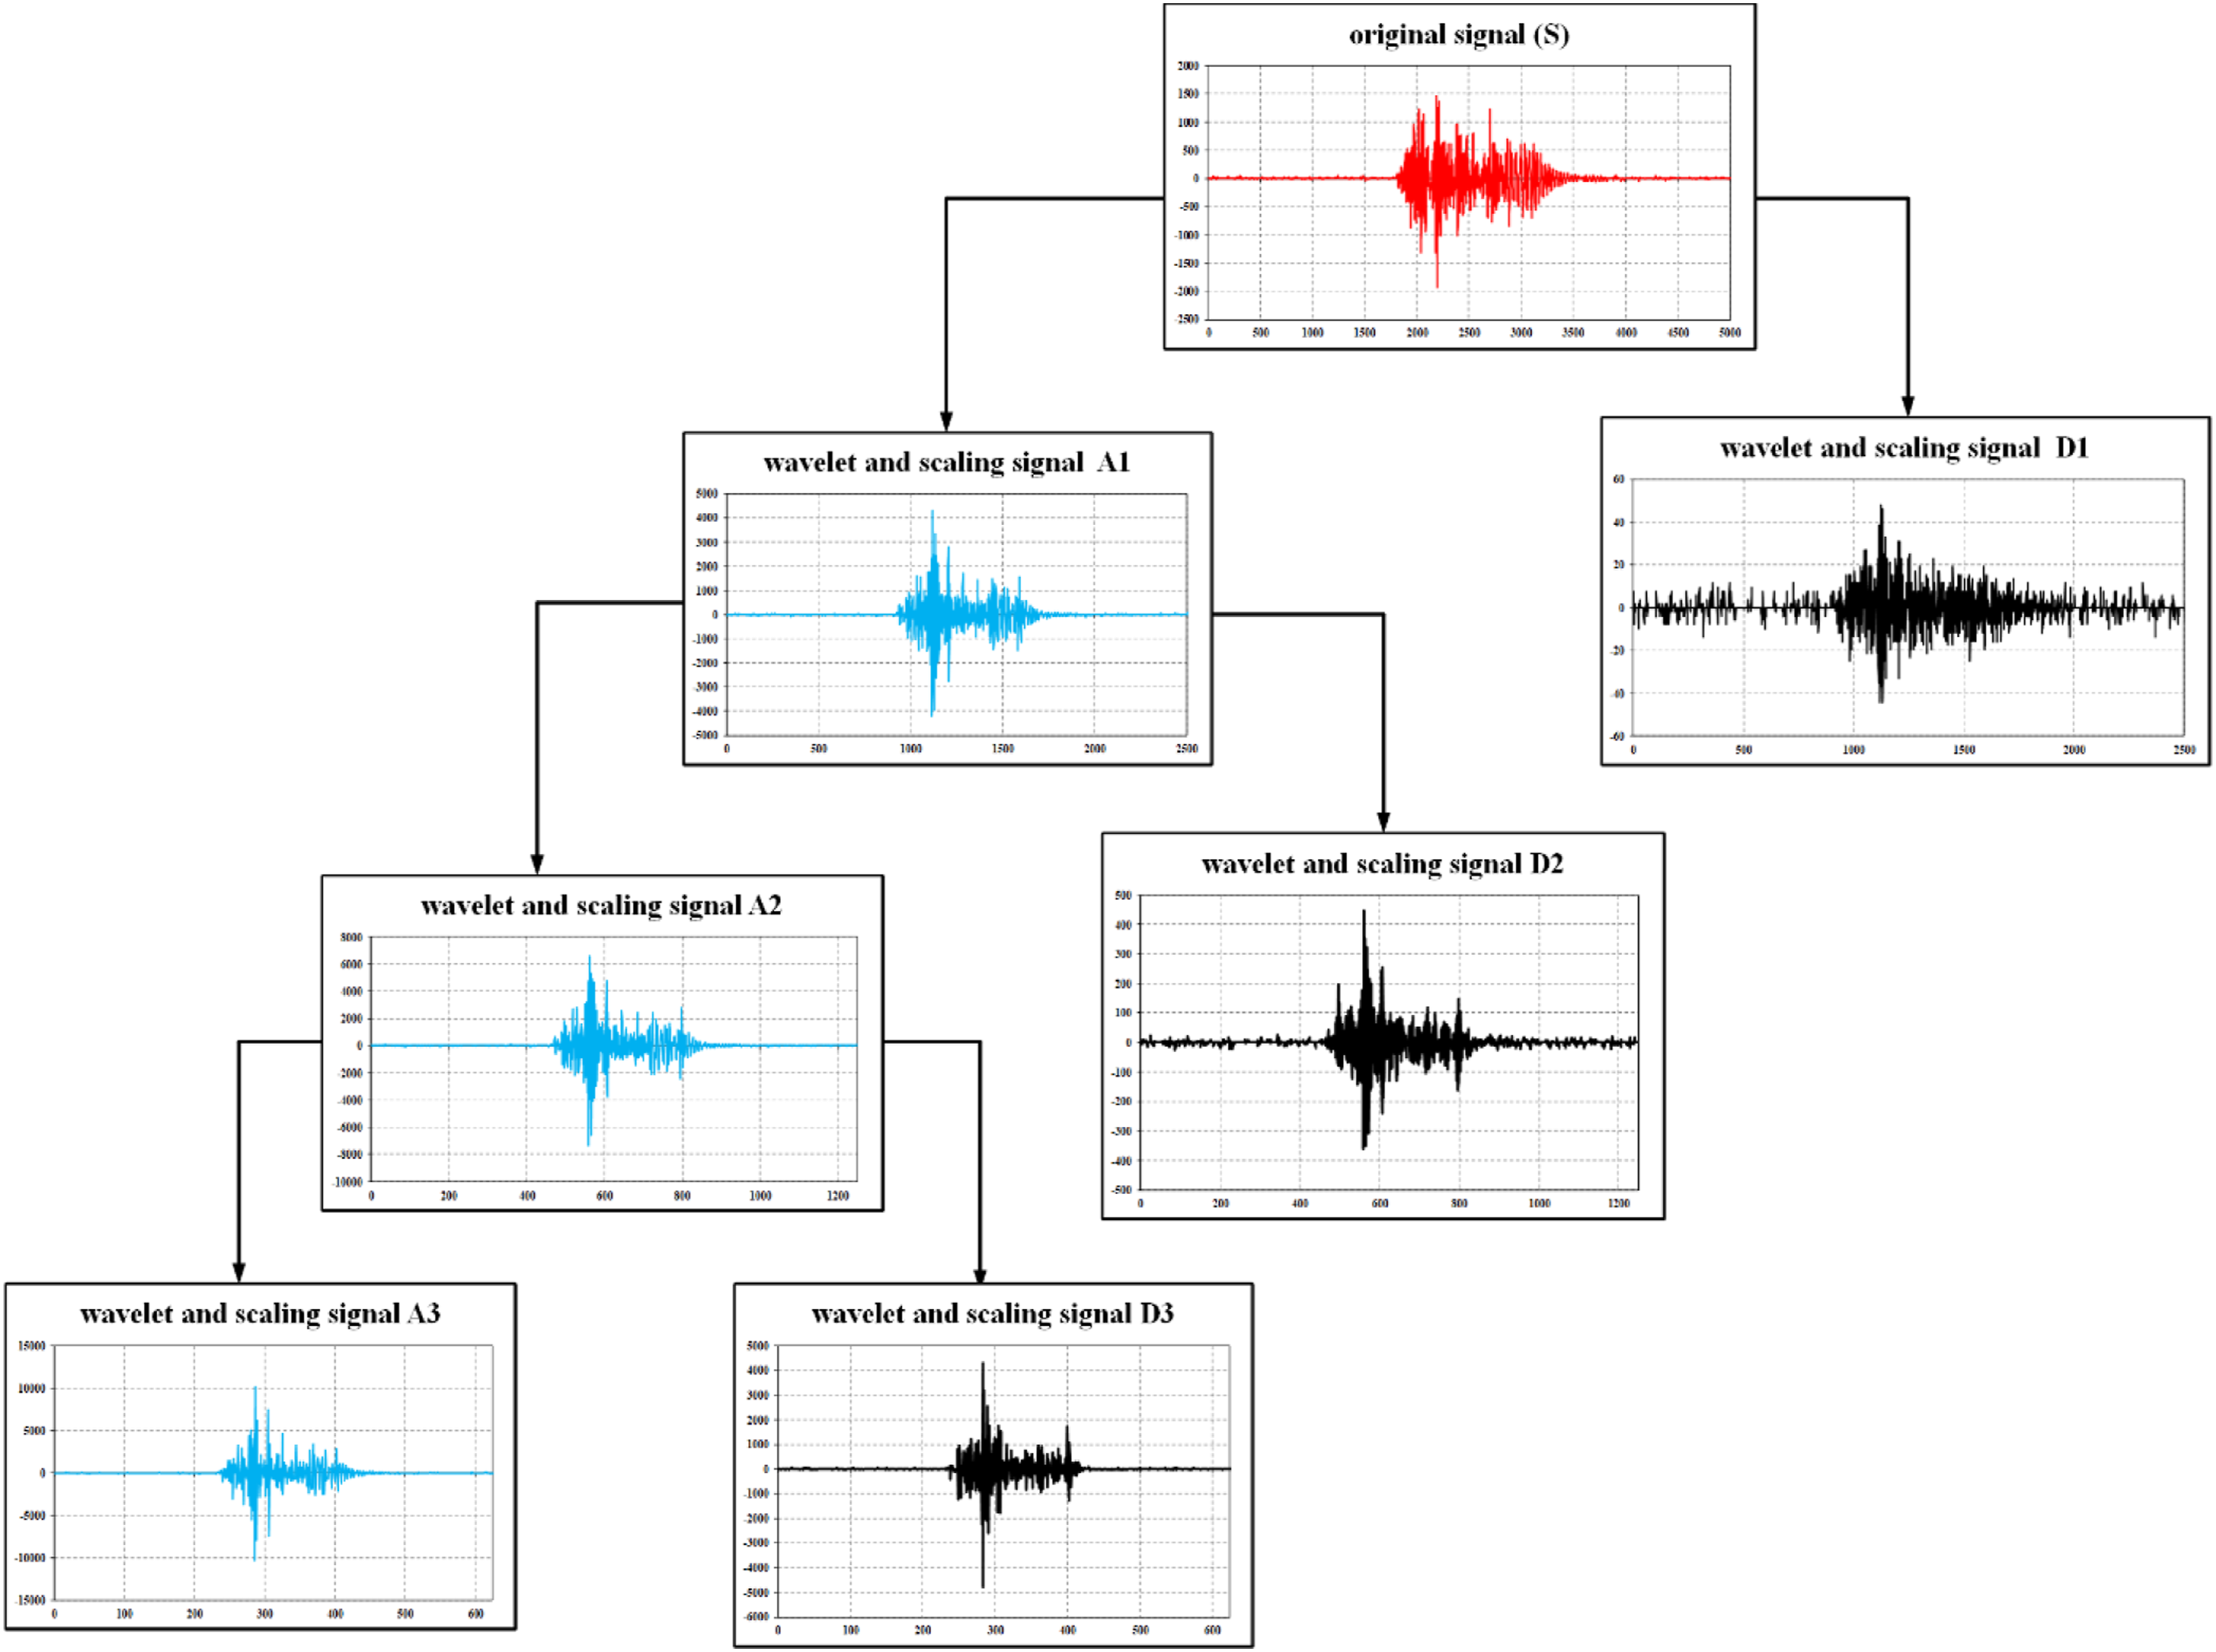
In DWT, the high-frequency filter uses the wavelet function ψ (x) and the low-frequency filter uses the scaling function Φ (x). The relationship between these two functions is given by


At each filtering level, the filtering expression is computed as follows


Fast Fourier transform (FFT)
The fast Fourier transform (FFT) is an efficient algorithm for computing the discrete Fourier transform (DFT) and its inverse as shown in Figure 4. FFT and DWT in beam.
Discrete Fourier transform (DFT)
The discrete Fourier transform (DFT) forms the theoretical basis for the FFT. DFT transforms a discrete signal from the time domain to the frequency domain and is defined by the following formula

Fast Fourier transform (FFT)
FFT was developed to efficiently compute the DFT by reducing the computational complexity from


Discrete wavelet transform (DWT)
DWT allows for signal analysis in both the time and frequency domains by decomposing the signal into high- and low-frequency components using filters. The signal is decomposed into approximation (A) and detail (D) components as follows


Power spectral density (PSD) analysis
Power spectral density (PSD) measures the energy distribution of a signal in the frequency domain

Application of DWT and FFT in beam damage detection
In practice, when a beam is subjected to loading, cracks and damage can appear, causing significant changes in the beam’s vibration characteristics. The vibration process becomes more complex, and the key frequency parameters will vary depending on the level of damage. These changes can be detected by analyzing the vibration signals measured by the sensors. To clarify the damage detection process, we divide it into the following specific steps.
Step 1: collect vibration signals
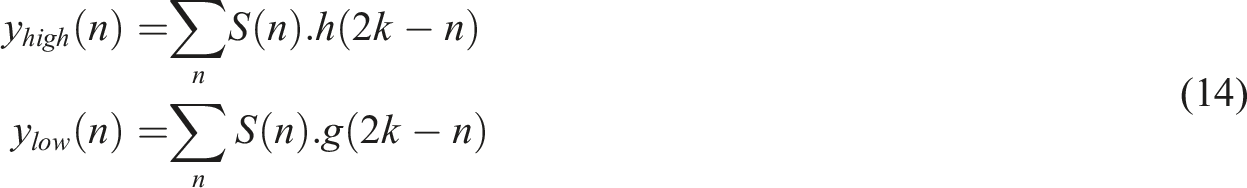
The vibration signals of the beam are collected through sensors attached to the beam as shown in Figure 5(a). When the beam is subjected to loads, the sensors record the vibrations, including signals from damage, such as cracks or deformations. These signals contain information about vibration characteristics, including frequency components related to the beam structure. Even small structural changes, such as the development of a crack, will result in changes in the frequency spectrum of vibration signals. (a) The component signals. (b) Signal analysis using DWT. (c) The applying FFT.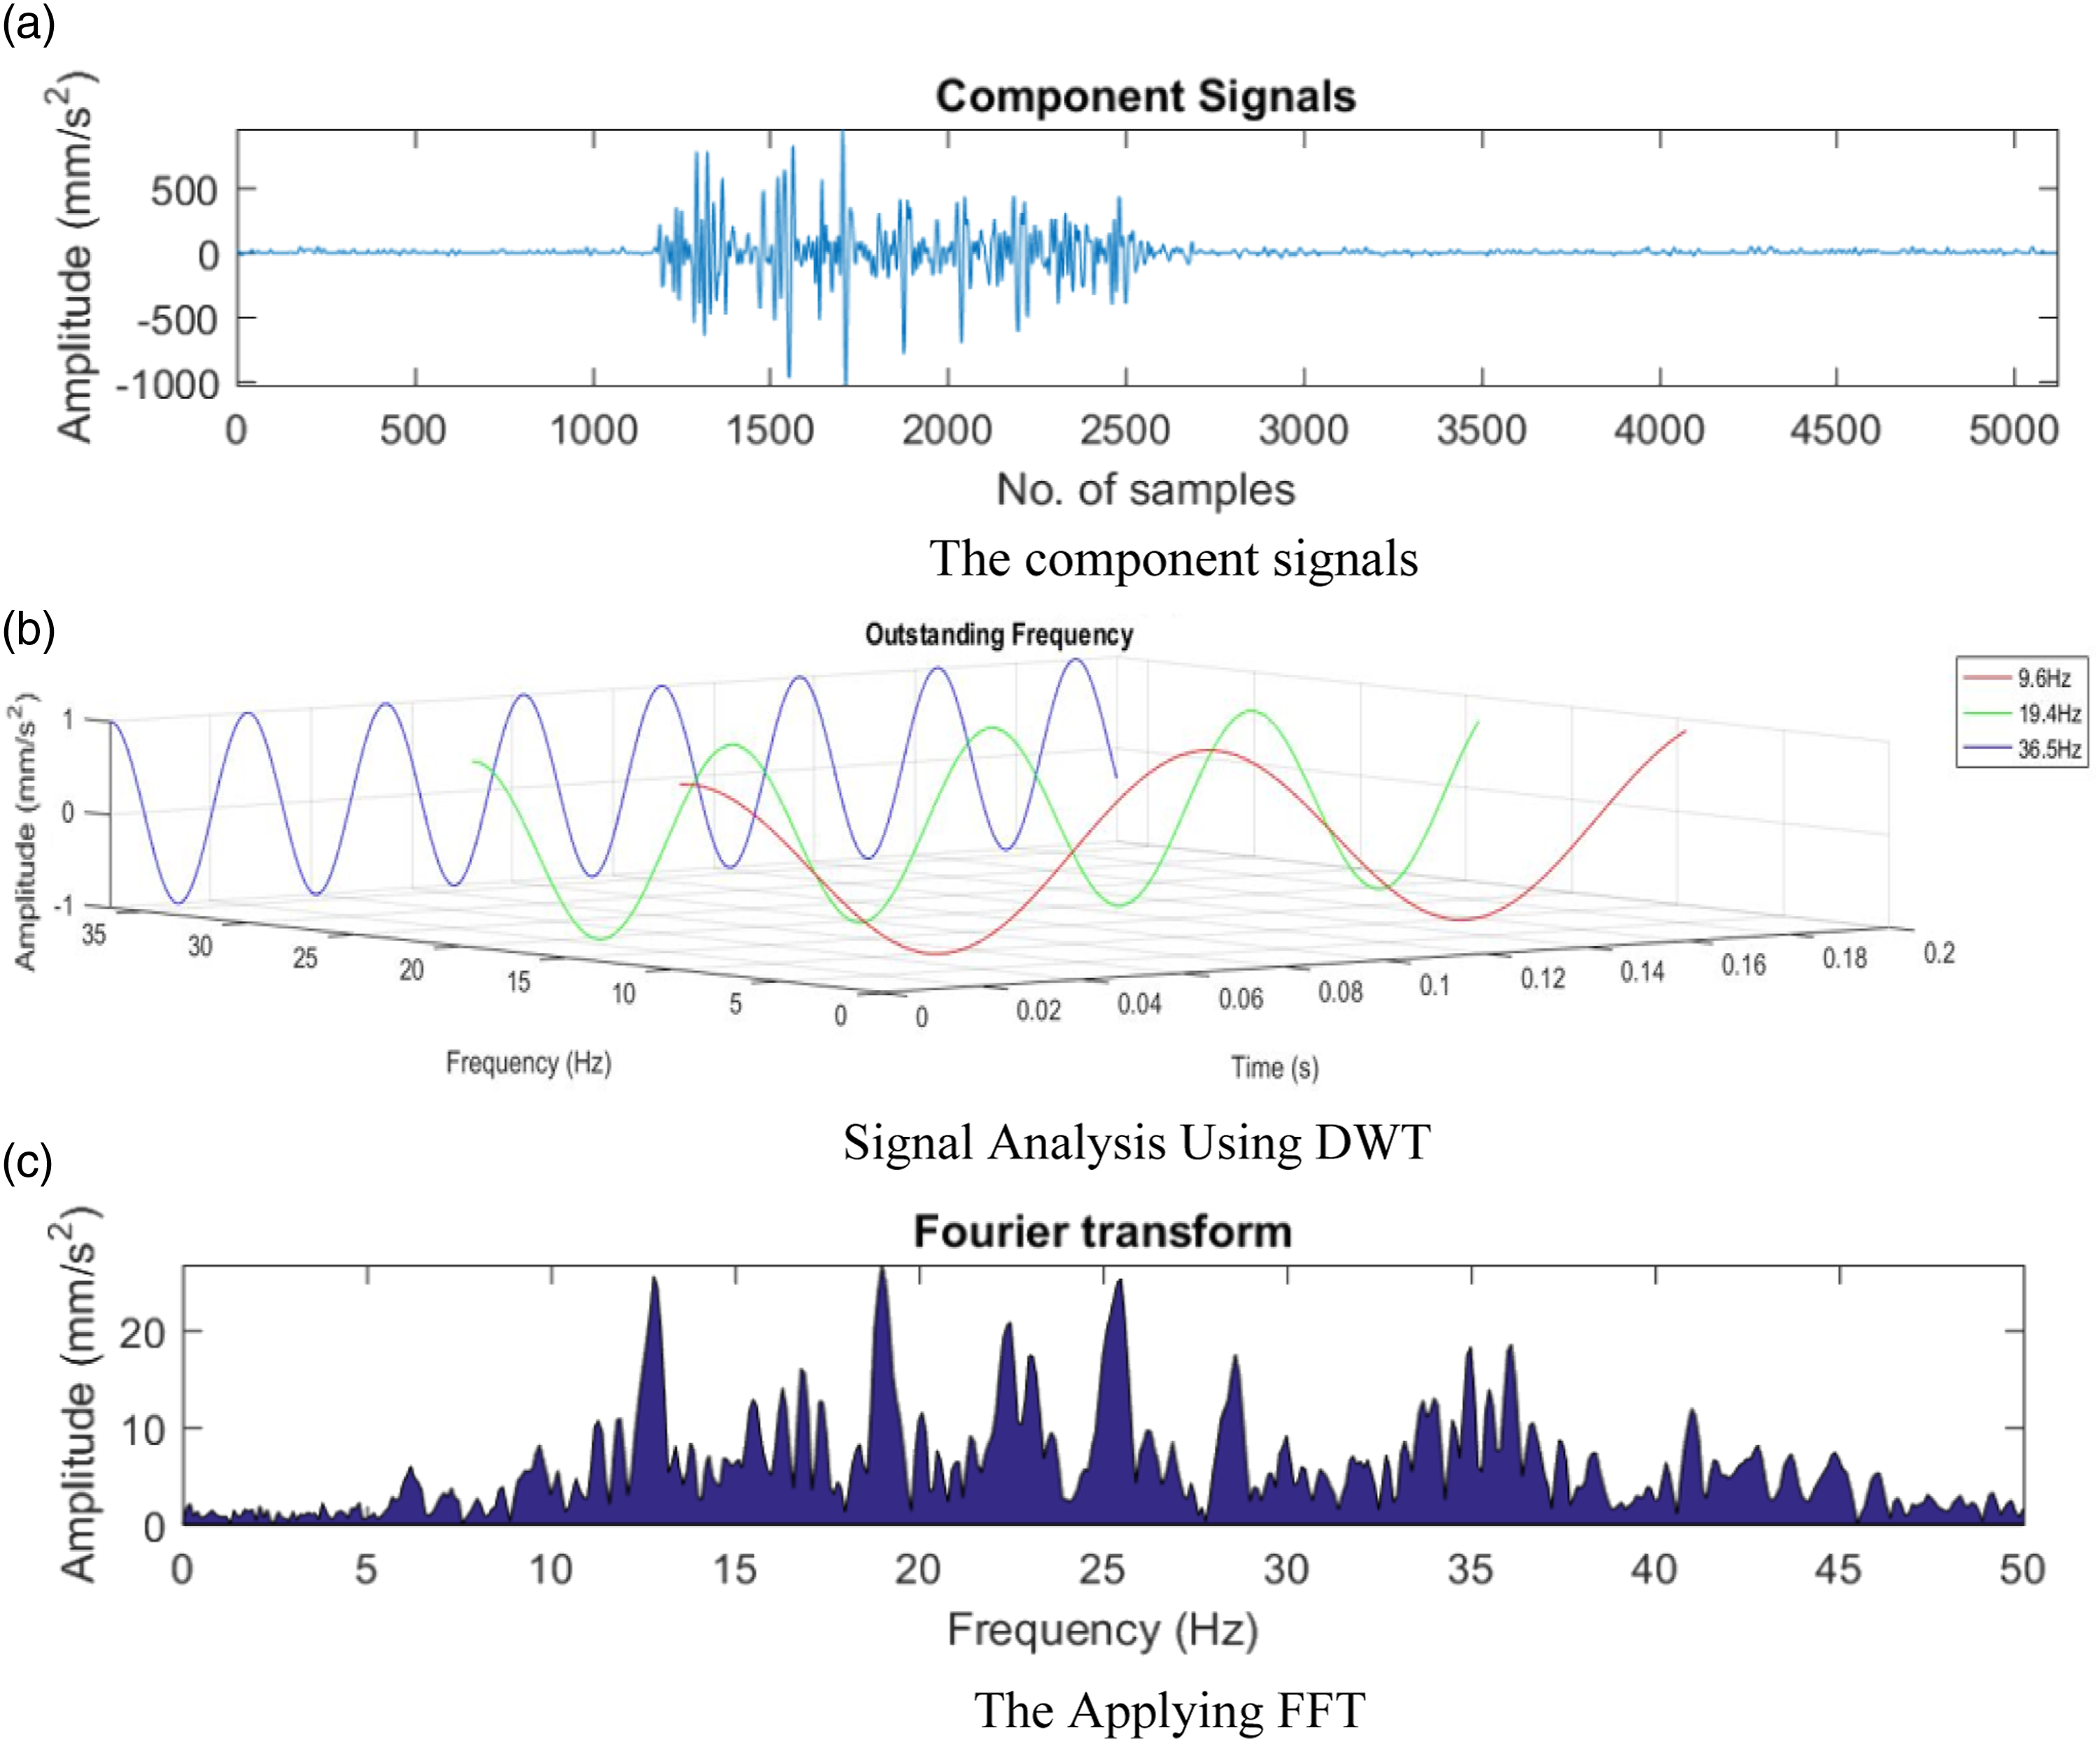
Step 2: signal analysis using DWT
After collecting the signals, we use the DWT to decompose the signal into different frequency components. DWT is a powerful tool for analyzing signals in both time and frequency domains, allowing the signal into low- and high-frequency components. • •
Step 3: applying FFT
After the signal is decomposed using DWT, we apply the FFT to each component to convert the signal from the time domain to the frequency domain as shown in Figure 5(c). • •
Step 4: evaluating the power spectral density (PSD)
The final step in the analysis process is PSD evaluation. PSD measures the energy distribution of the signal in the frequency domain, allowing us to assess changes in the frequency components as the beam suffers damage. • PSD is calculated on the frequency components of the signal analyzed by FFT. Changes in PSD at different frequencies can reflect the presence and extent of damage in the beam. •
Results and discussions
Experimental model and data processing
The experiment was carried out on a steel beam with specific dimensions: a width of 100 mm, a length of 1200 mm, and a thickness of 5 mm as shown in Figure 6(a). The beam was fixed at both ends and subjected to a dynamic load with a mass of 5.2 kg. This load was generated using a drive system powered by a motor combined with an inverter. Vibration measurements were carried out at two inverter frequencies: 50 Hz and 100 Hz. The vibration measurement system included four sensors installed at positions corresponding to 1/5, 2/5, 3/5, and 4/5 of the beam length. (a) The experimental model. (b) Experimental model of the beam without any cuts. (c) Experimental model of the beam with one cut. (d) Experimental model of the beam with two cuts. (e) Signal notation.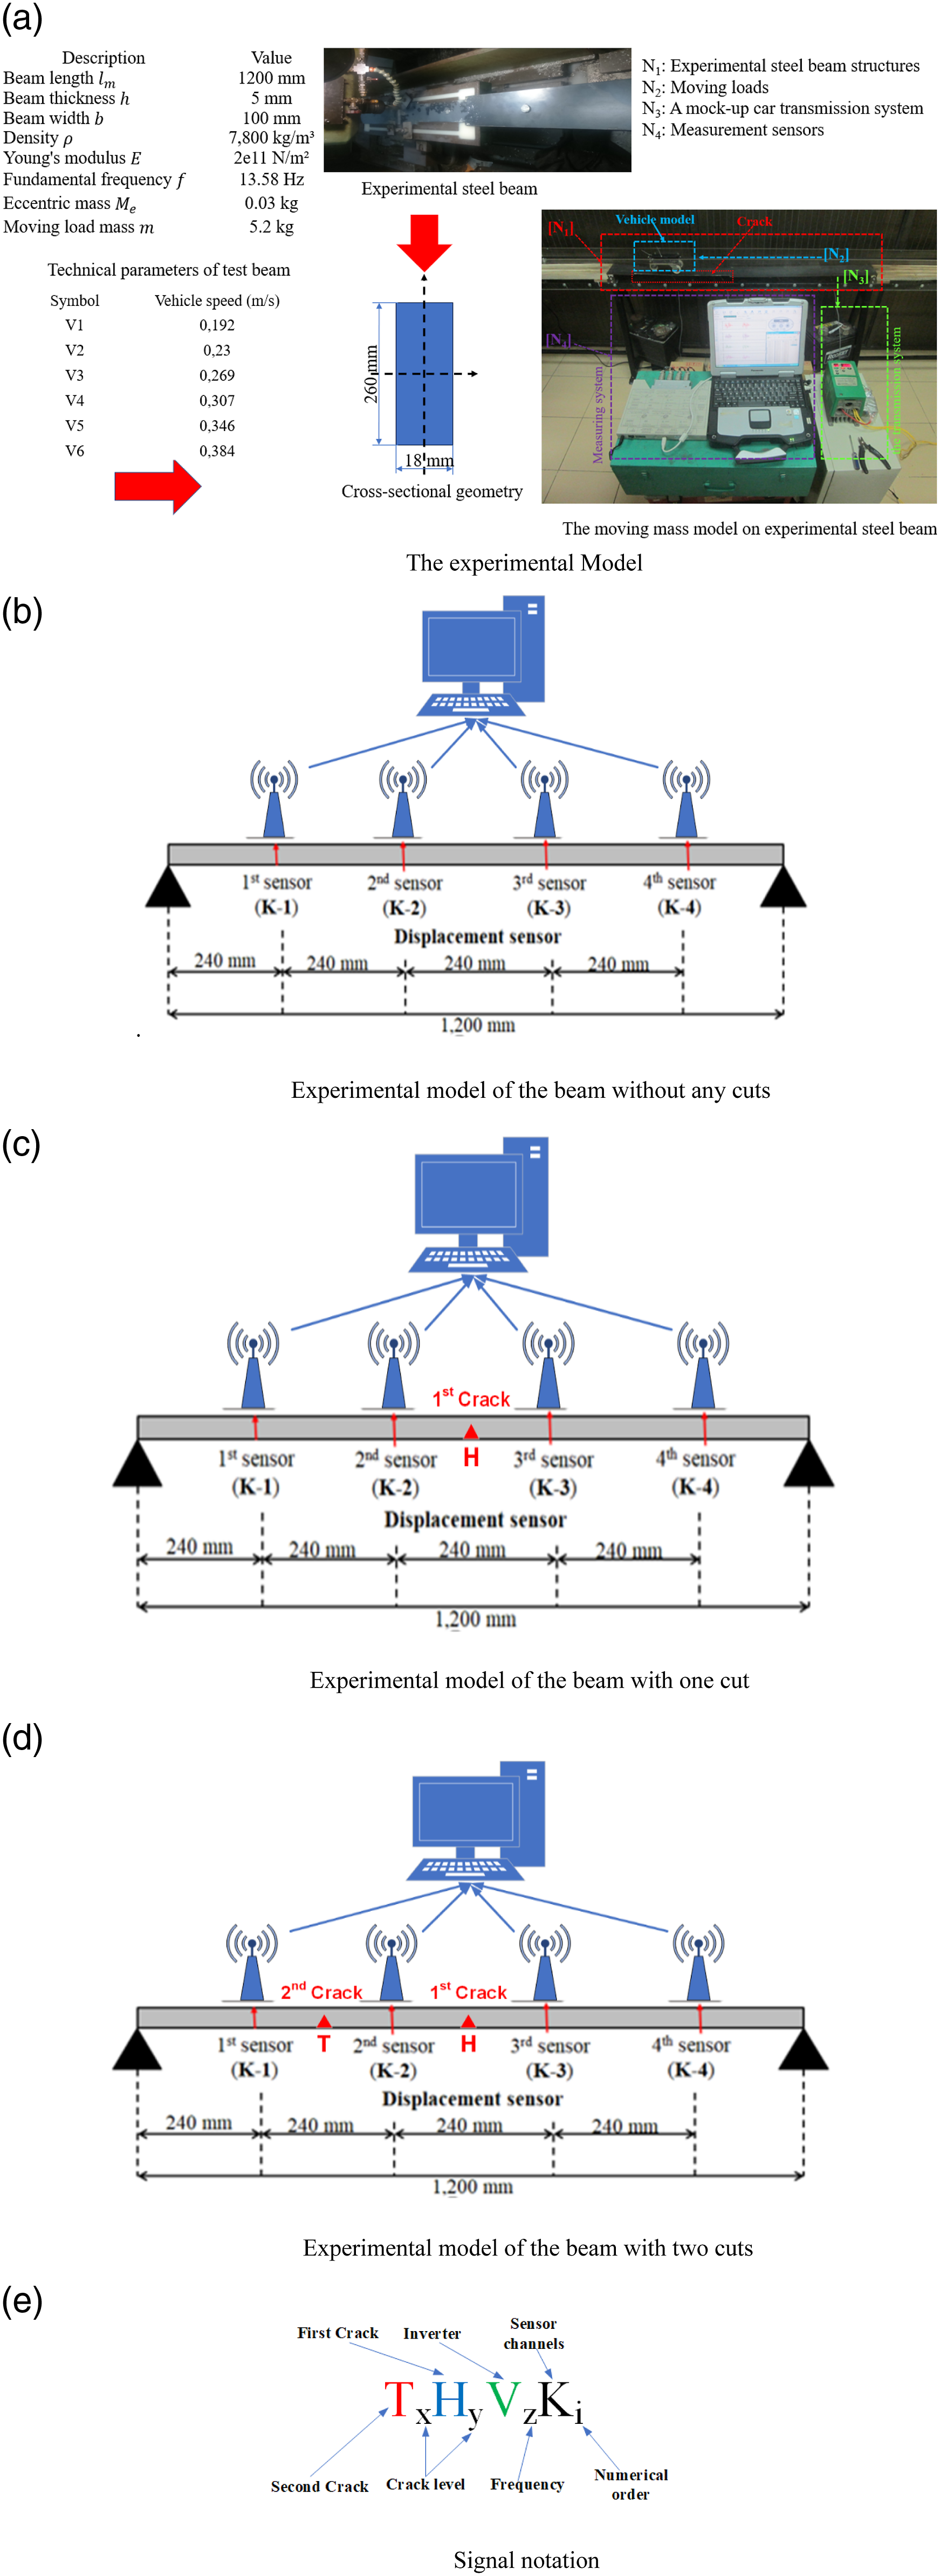
Initially, the experiment was carried out on the beam in its intact state, with no structural damage present (see in Figure 6(b)). The first cut was made at the midpoint of the beam (1/2 of its length), with the depth of the cut gradually increasing through successive measurements, from 4 mm to 24 mm (see in Figure 6(c)). After completing the measurements with the first cut, the experiment proceeded by making a second cut at 1/4 of the length of the beam. The depth of this cut was also incrementally increased in each measurement, ranging from 4 to 20 mm (see in Figure 6(d)). The progressive deepening of both cuts allowed for a detailed study of the impact of damage on vibrations and the ability to detect damage through signals obtained from the sensors.
The notation for the signals obtained from this experiment is defined as follows in Figure 6(e):
The vibration measurements were performed along the z-axis, which is perpendicular to the beam’s surface. After the data, the vibration signals were processed to remove noise, ensuring the accuracy of the measurements. Subsequently, the clean signals were analyzed using DWT, which separates the signal into different components. After DWT analysis, the signal components were transformed from the time domain to the frequency domain using the FFT. This process enables a deeper analysis of the frequency characteristics of the signals. The final result is the PSD plots, displayed in the frequency domain (Hz), providing detailed information on the energy distribution of the frequency components in the vibration signals as shown in Figure 7. Signal processing and average power calculation process.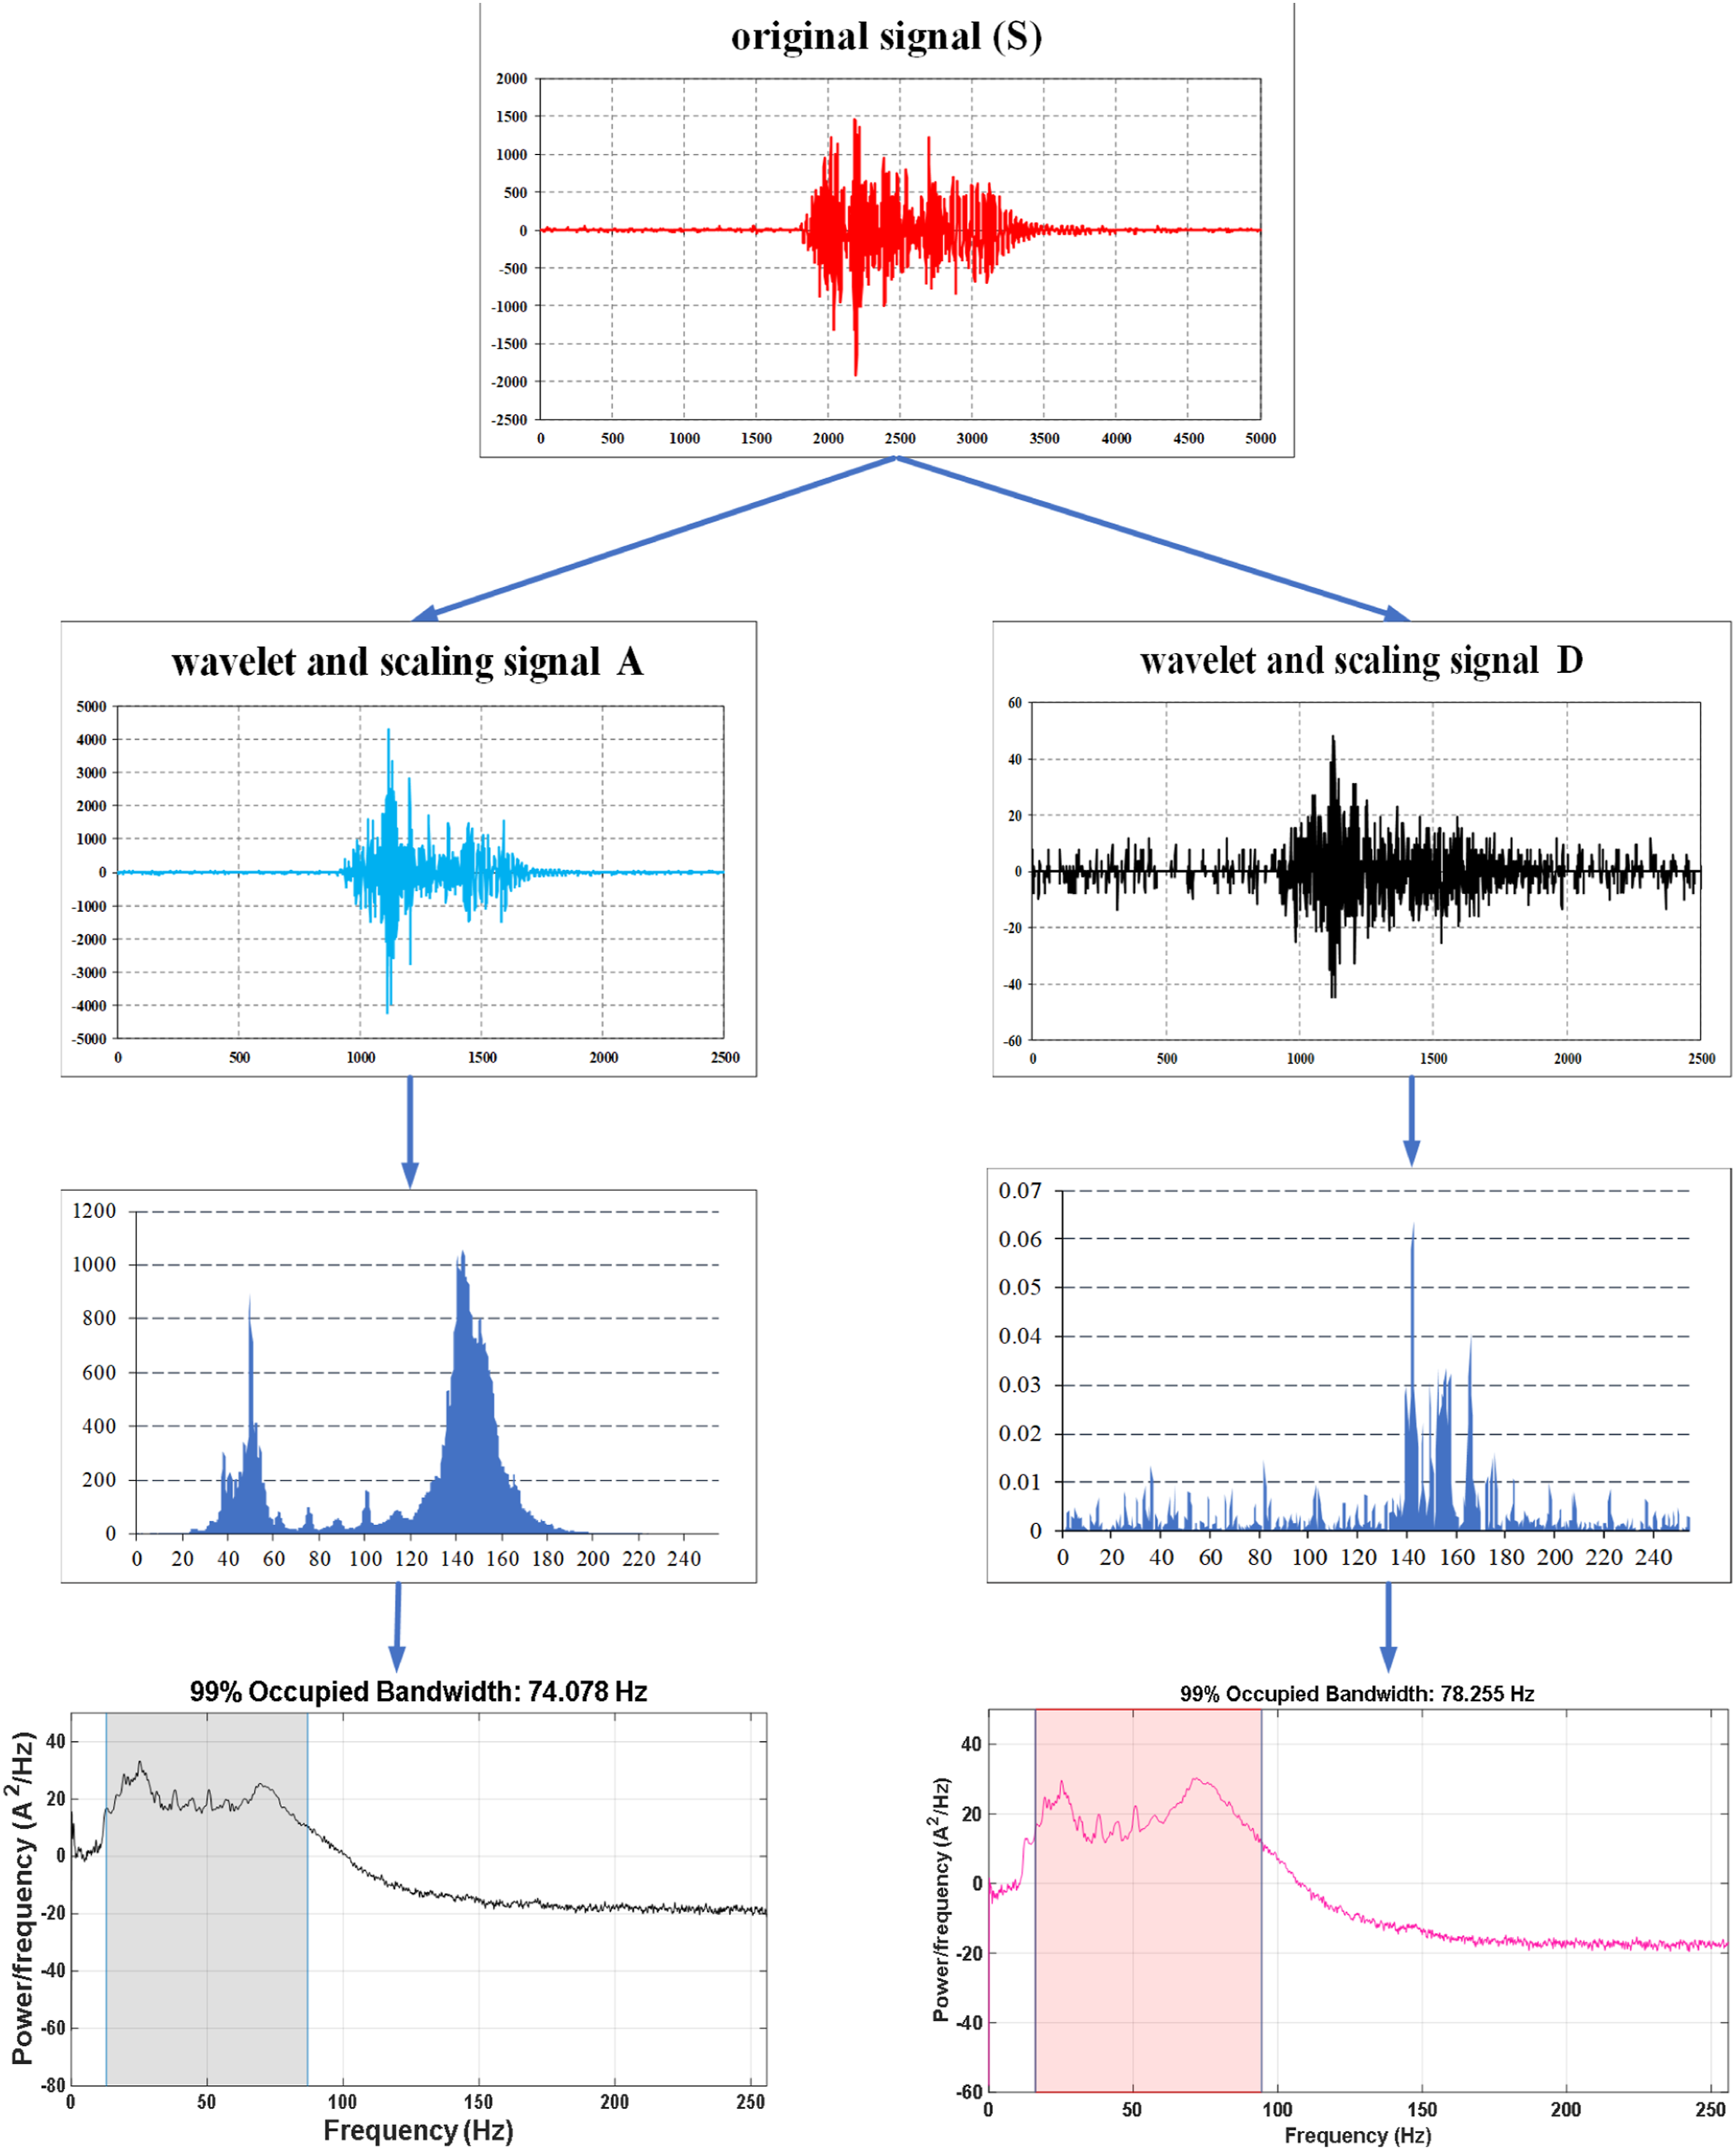
The PSD were calculated by averaging the power distribution across frequency bandwidths. This process helps clarify how vibration energy is distributed across different frequency ranges, providing a comprehensive view of how damage affects the frequency components of the beam

The power value is the average calculated on the most occupied bandwidth. The occupied bandwidth is determined by the frequency difference between the points where the integrated power ranges from 0.5% to 99.5% of the total power spectrum value. The calculation uses a rectangular integration approximation method, with the integral estimated using the midpoint rule. This process allows for the precise identification of the frequency band that contributes the most to the total power and captures changes in vibration energy within the signal. This approach ensures that power analysis is focused on the most critical frequency range, providing a comprehensive view of the energy distribution. The process is illustrated in Figure 8. Diagram of the processing of vibration signals and results.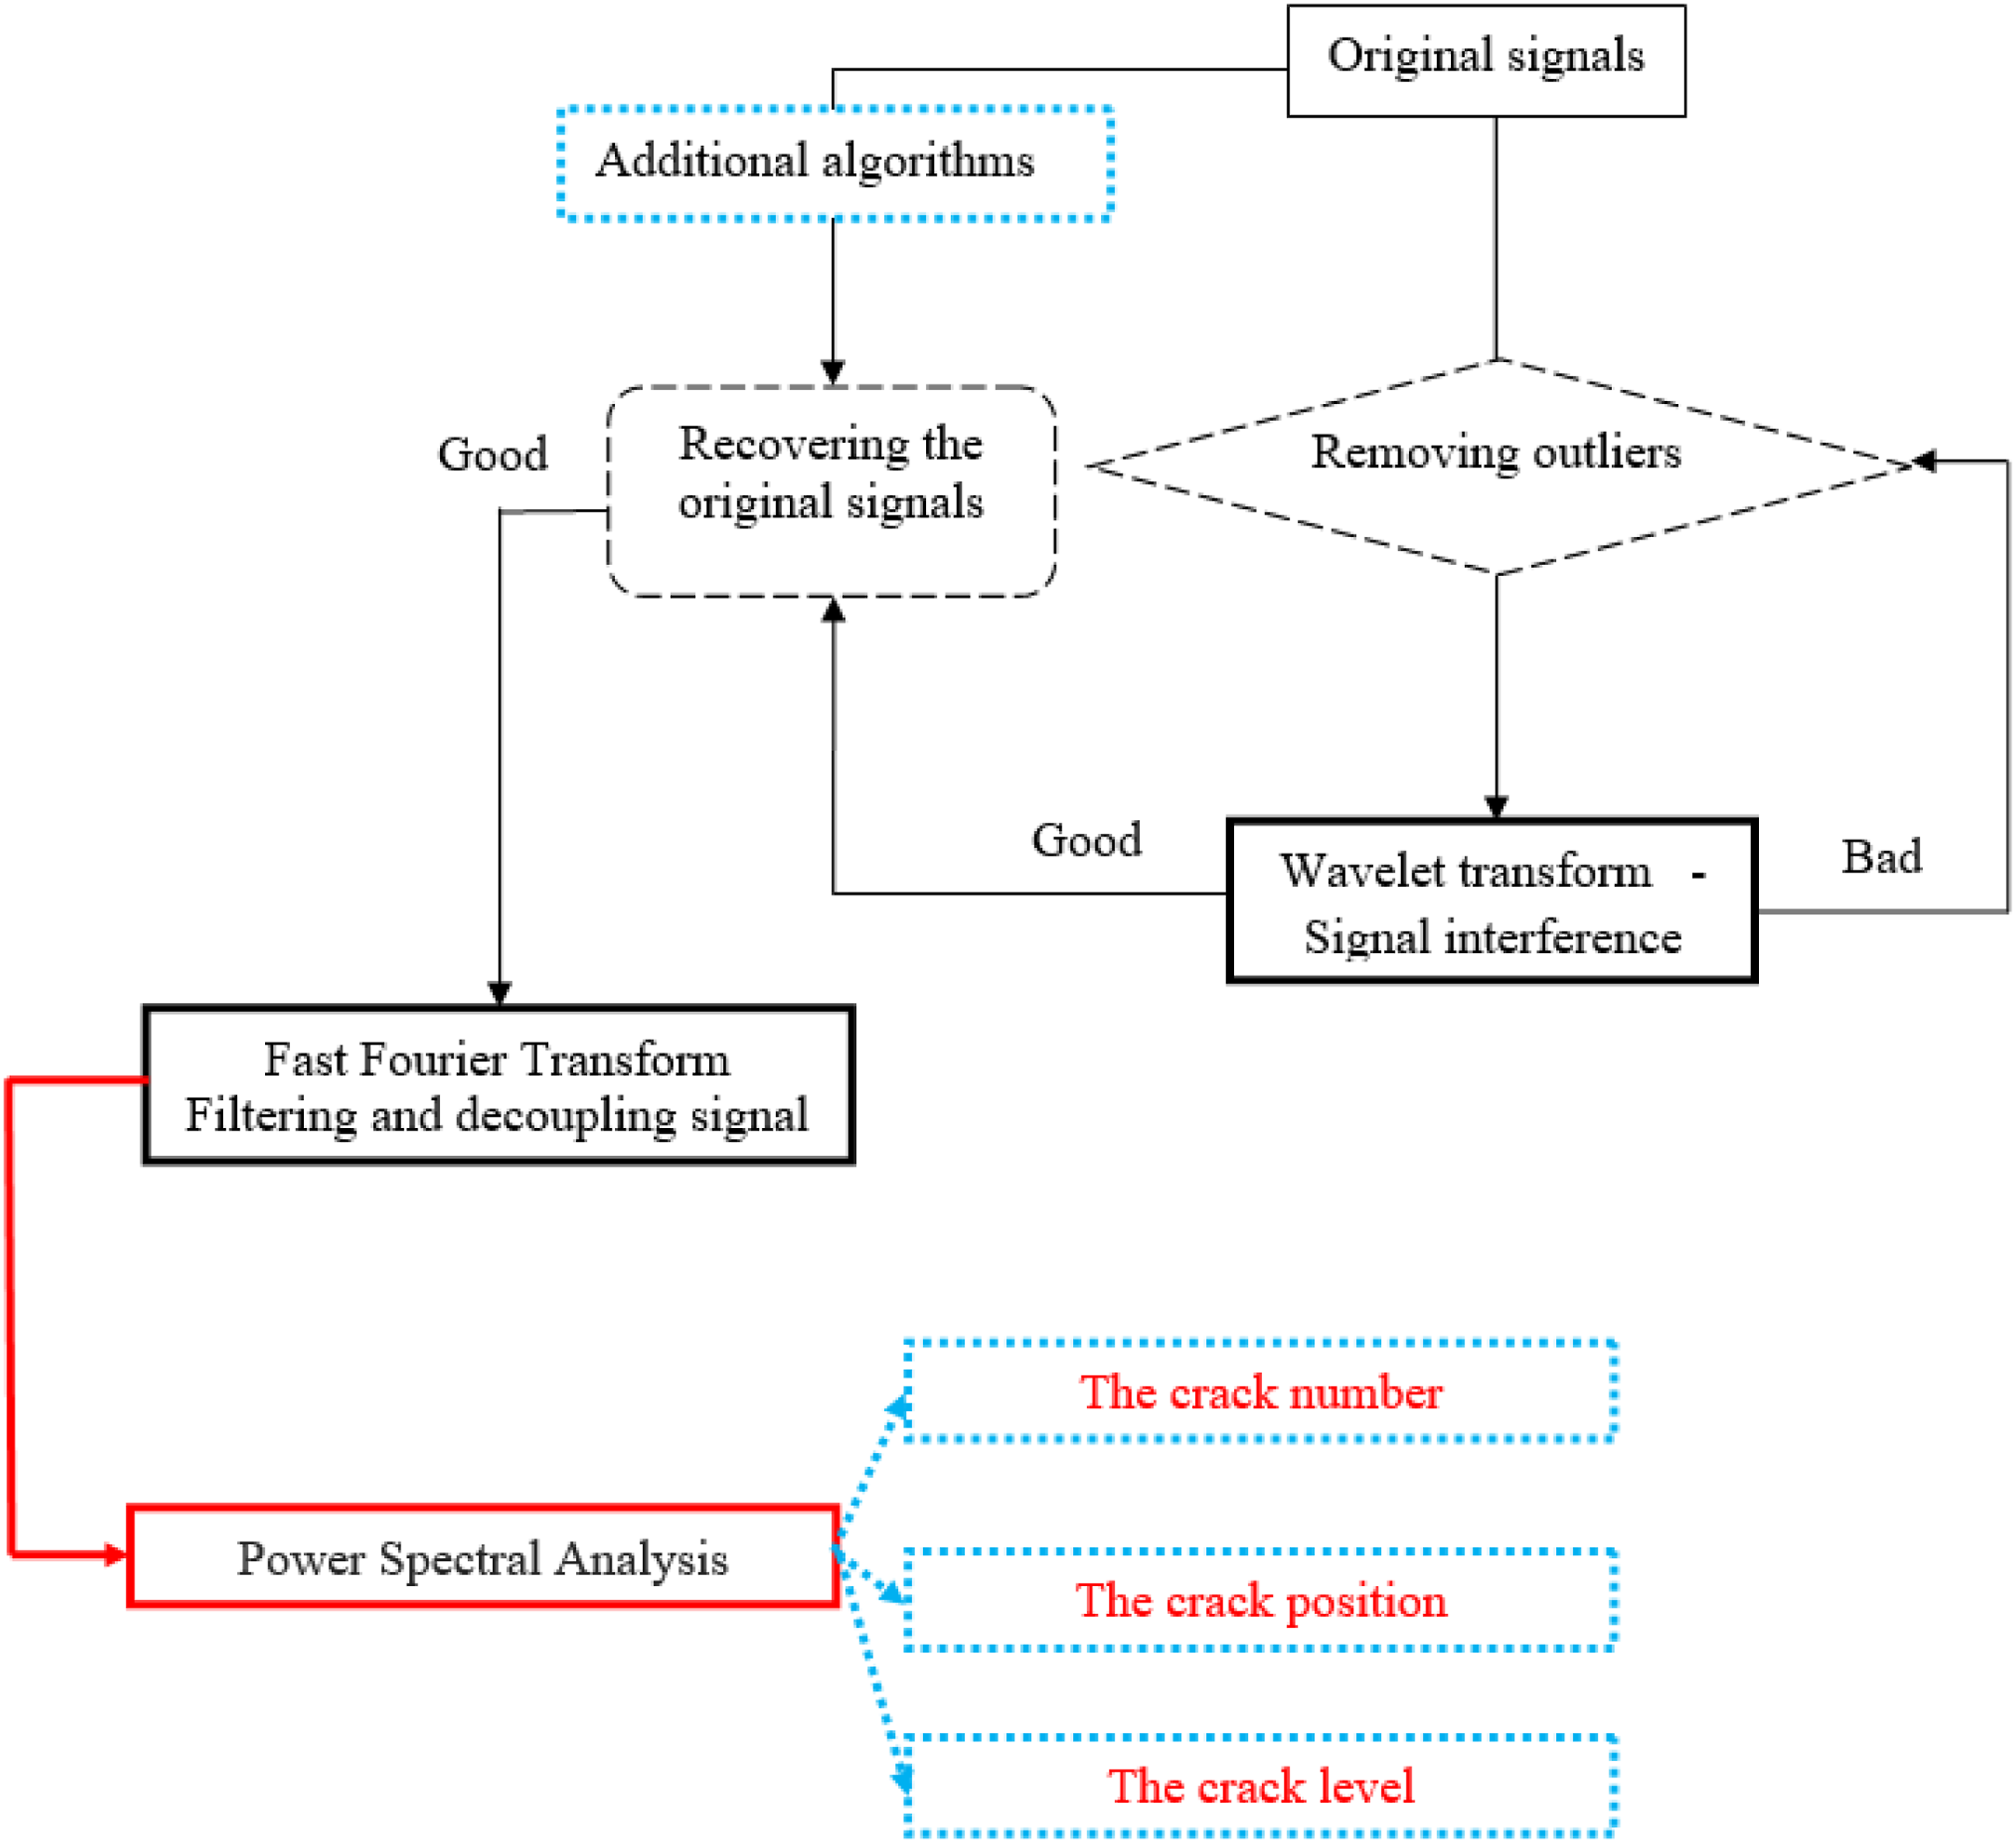
Results and analysis observations
The results of the analysis indicate that the changes in average power across the bandwidth can be used to detect the presence of damage (cracks) in the beam. Additionally, these changes allow monitoring of crack progression over time. The analysis results are consistent with the diagram in Figure 8, showing that the signal separated by the discrete wavelet transform is much more sensitive to changes caused by damage compared to the original signal as shown in Figure 9. Signal analysis results.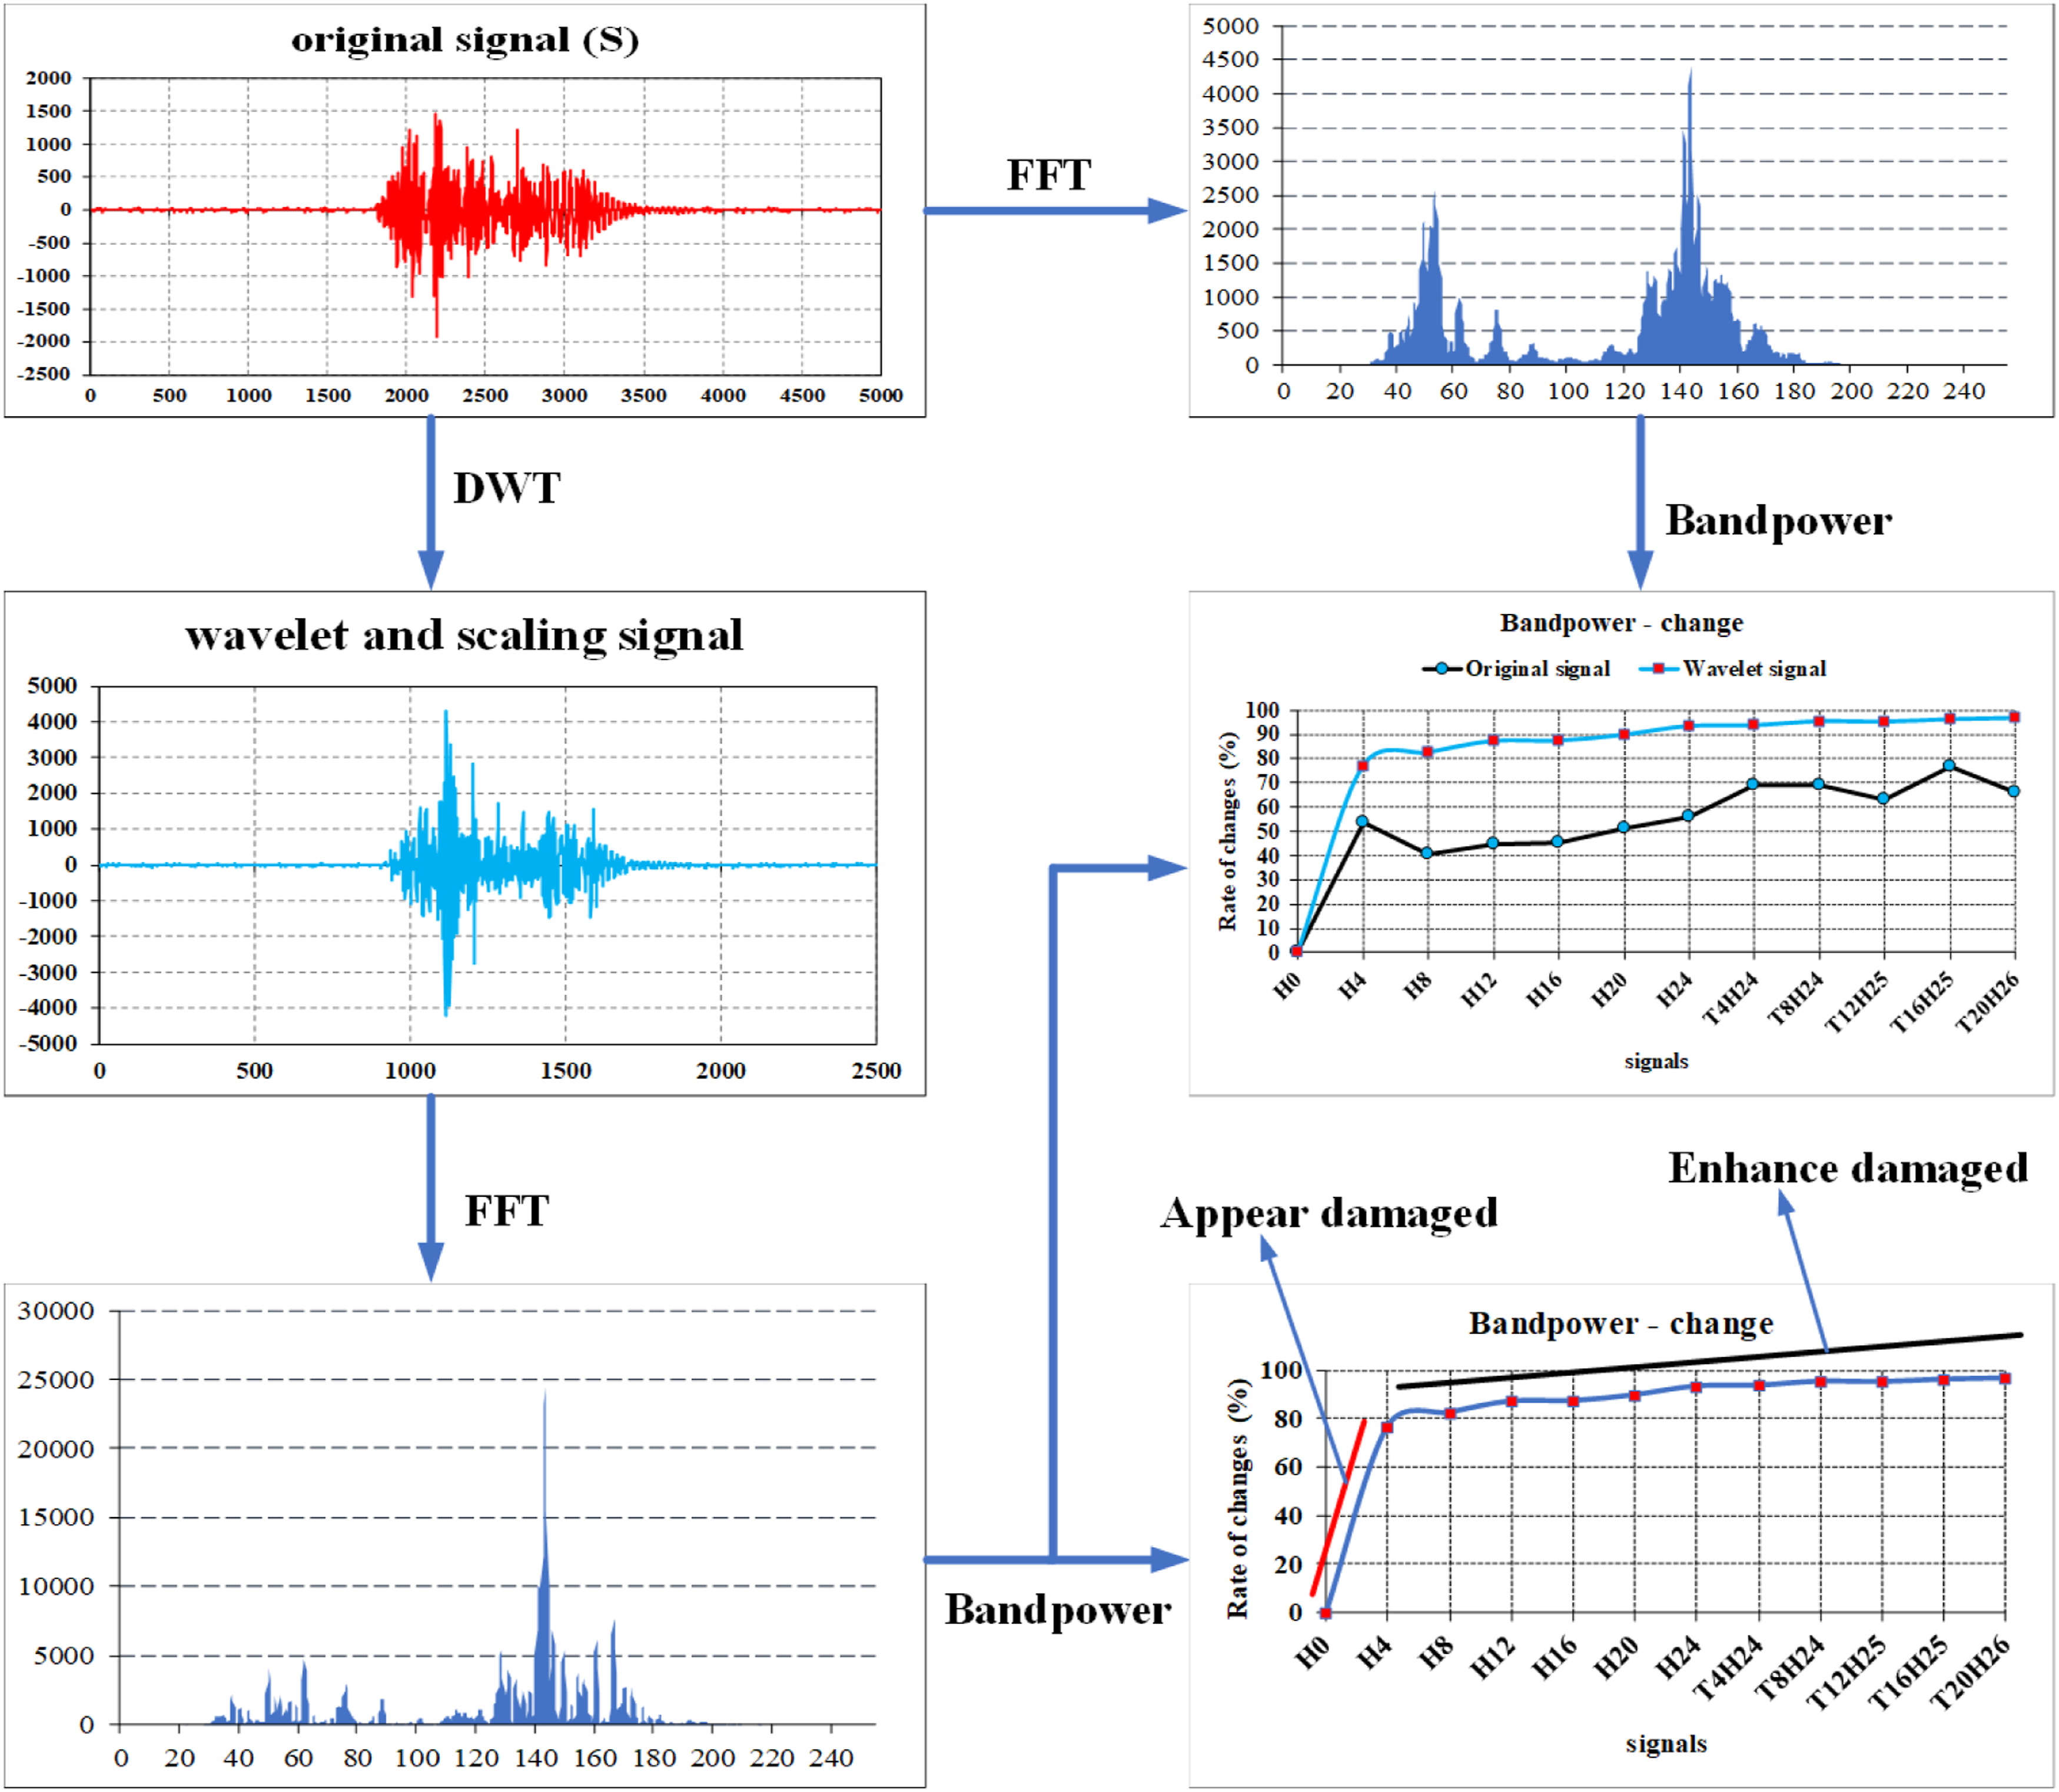
From the analysis, it is clear that the original signal is not sensitive to the appearance and development of damage (cracks). When the depth of the crack increases from 4 mm (H4) to 8 mm as shown in Figure 6(c), the original signal shows inconsistent results: initially decreasing, then increasing, and, in some cases, decreasing again in subsequent stages. This indicates that the original signal does not accurately reflect the crack growth process. In contrast, the signal obtained from multiresolution analysis (DWT) provides much more reasonable and clearer results. When a crack appears, the sudden change in average power is significant, increasing by nearly 80% compared to about 50% in the original signal. This demonstrates that the wavelet signal is more sensitive to the presence of cracks. After the crack appears, its progression can be tracked through the linear trend of the change in average power. The greater the damage, the larger the change in average power across the occupied bandwidth, allowing for a clear identification of crack progression.
In the experiment, two cuts, H and T, were made to simulate the damage to the beam. After applying the signal processing methods described in Section 3.1, the study focused on analyzing the results of the approximation component cA obtained from the wavelet transform. The results show that the change in average power of the signal with each cut was recorded by the sensor channels. These changes were analyzed to clearly identify the impact of each cut on the beam’s vibrations. The difference in average power between cuts demonstrates the effectiveness of signal analysis in detecting and evaluating damage progression.
Based on Figure 10(a)–(d), it can be seen that the analysis results of the approximation component cA at the four channels (i.e., different positions on the beam) show no significant difference. This indicates that the cA approximation signal from the wavelet transform is not sufficiently sensitive to determine the exact location of the crack (whether it is near or far from the crack). This approximation signal only shows sensitivity to damage that affects the entire beam. Therefore, to accurately determine the location of the cD crack, this study uses the detail signal—the high-frequency component of multiresolution analysis (DWT)—to detect localized changes. The cD detail signal is more sensitive to small variations, allowing for more effective crack location detection. (a) Results of the average power change in the occupied bandwidth K1. (b) Results of the average power change in the occupied bandwidth K2. (c) Results of the average power change in the occupied bandwidth K3. (d) Results of the average power change in the occupied bandwidth K4.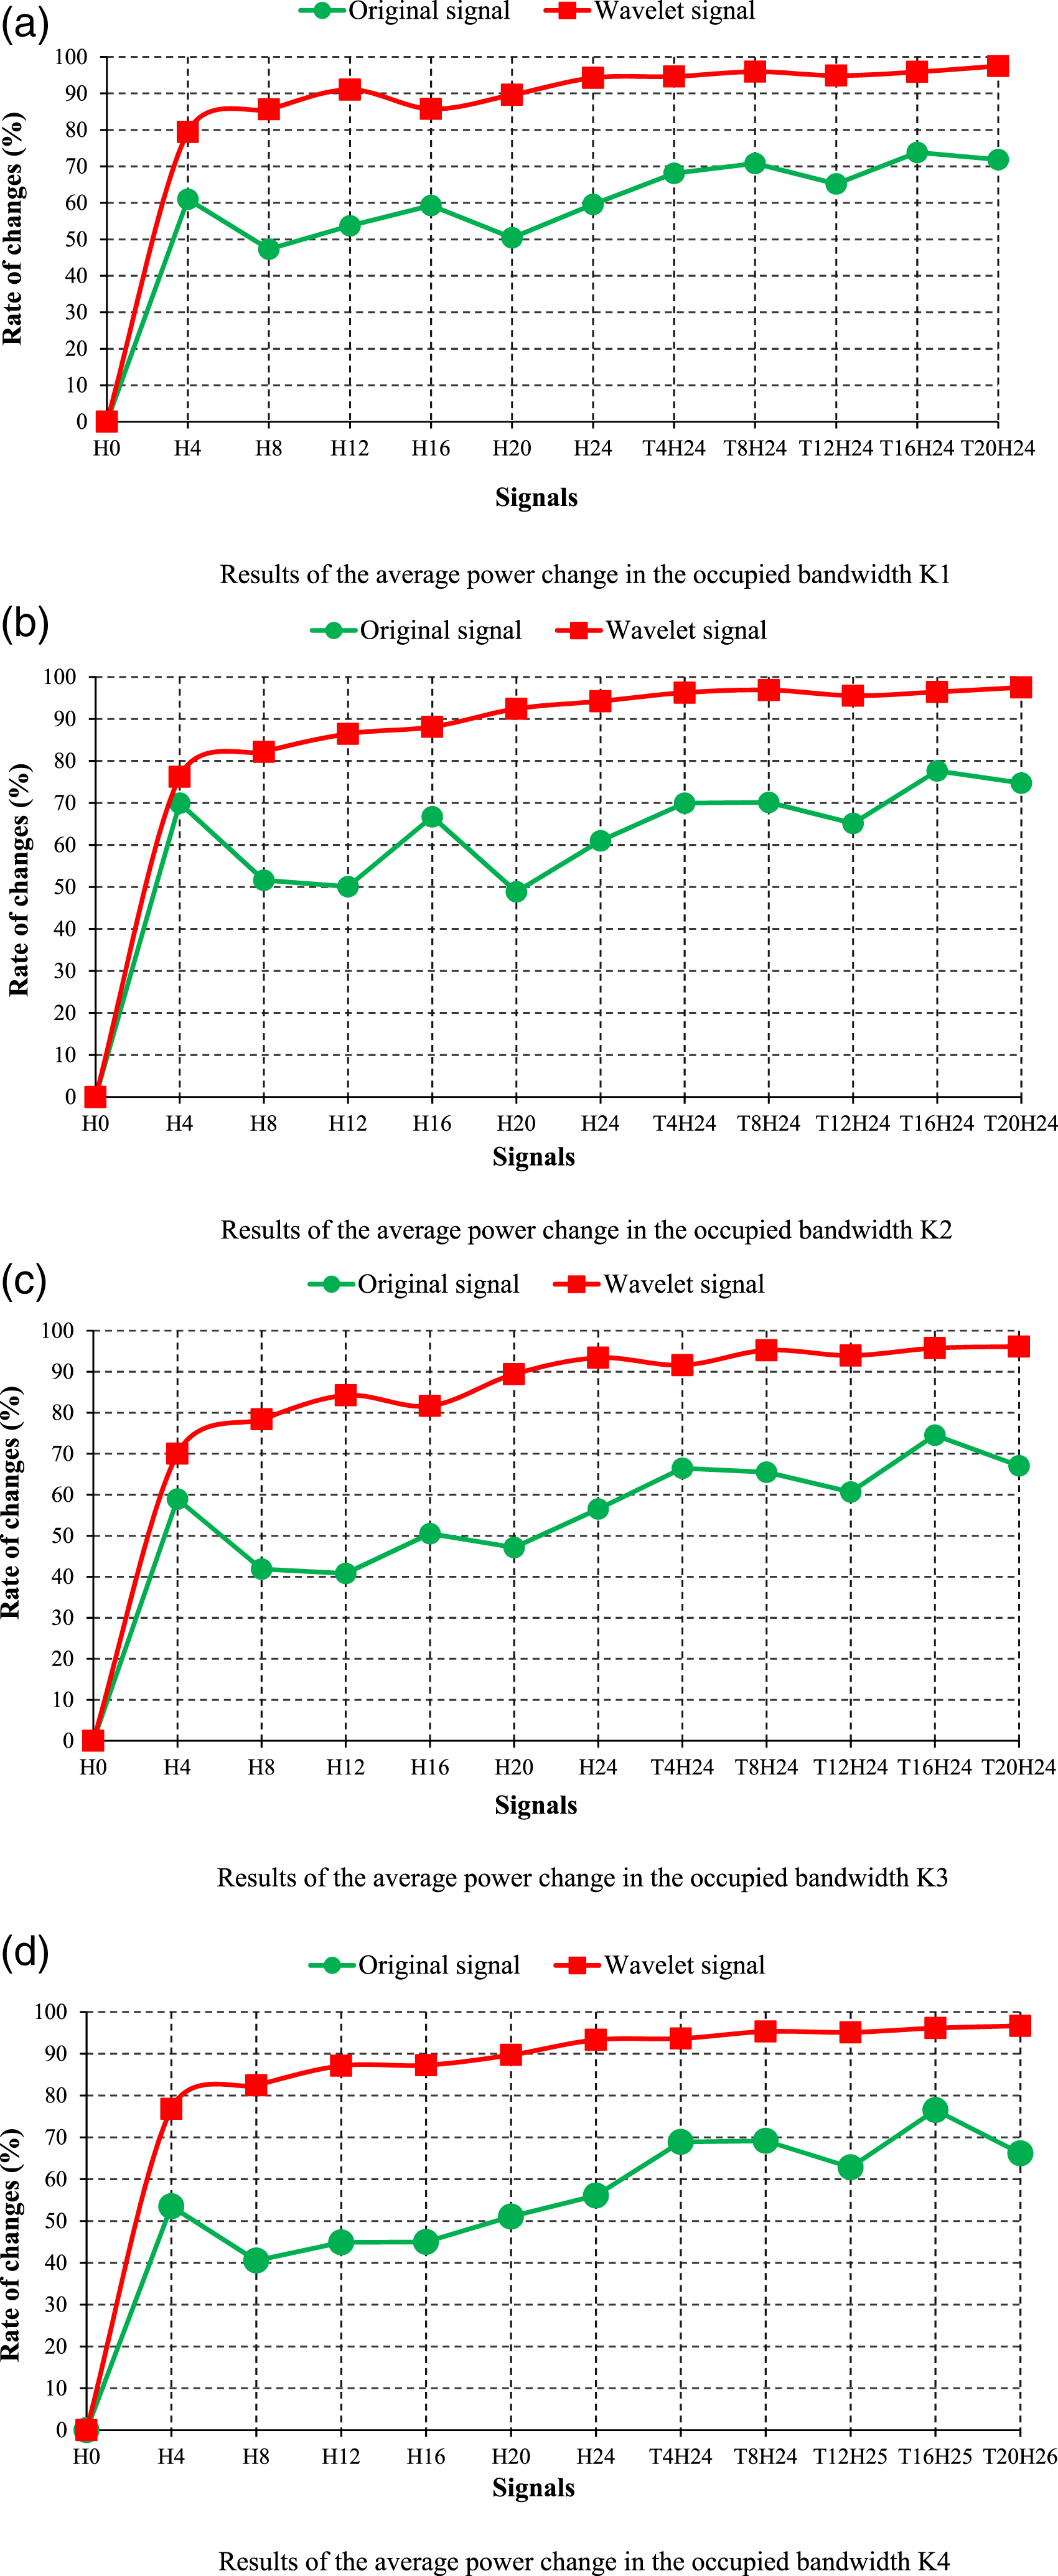
After performing the discrete wavelet transform analysis, the cD detail signal was used to construct the power spectrum using the FFT. On the basis of these power spectra, the occupied bandwidth, which accounts for 99% of the total power, was calculated. The results of this process are shown in Figure 11: Using the occupied bandwidth of the power spectrum to determine the crack location.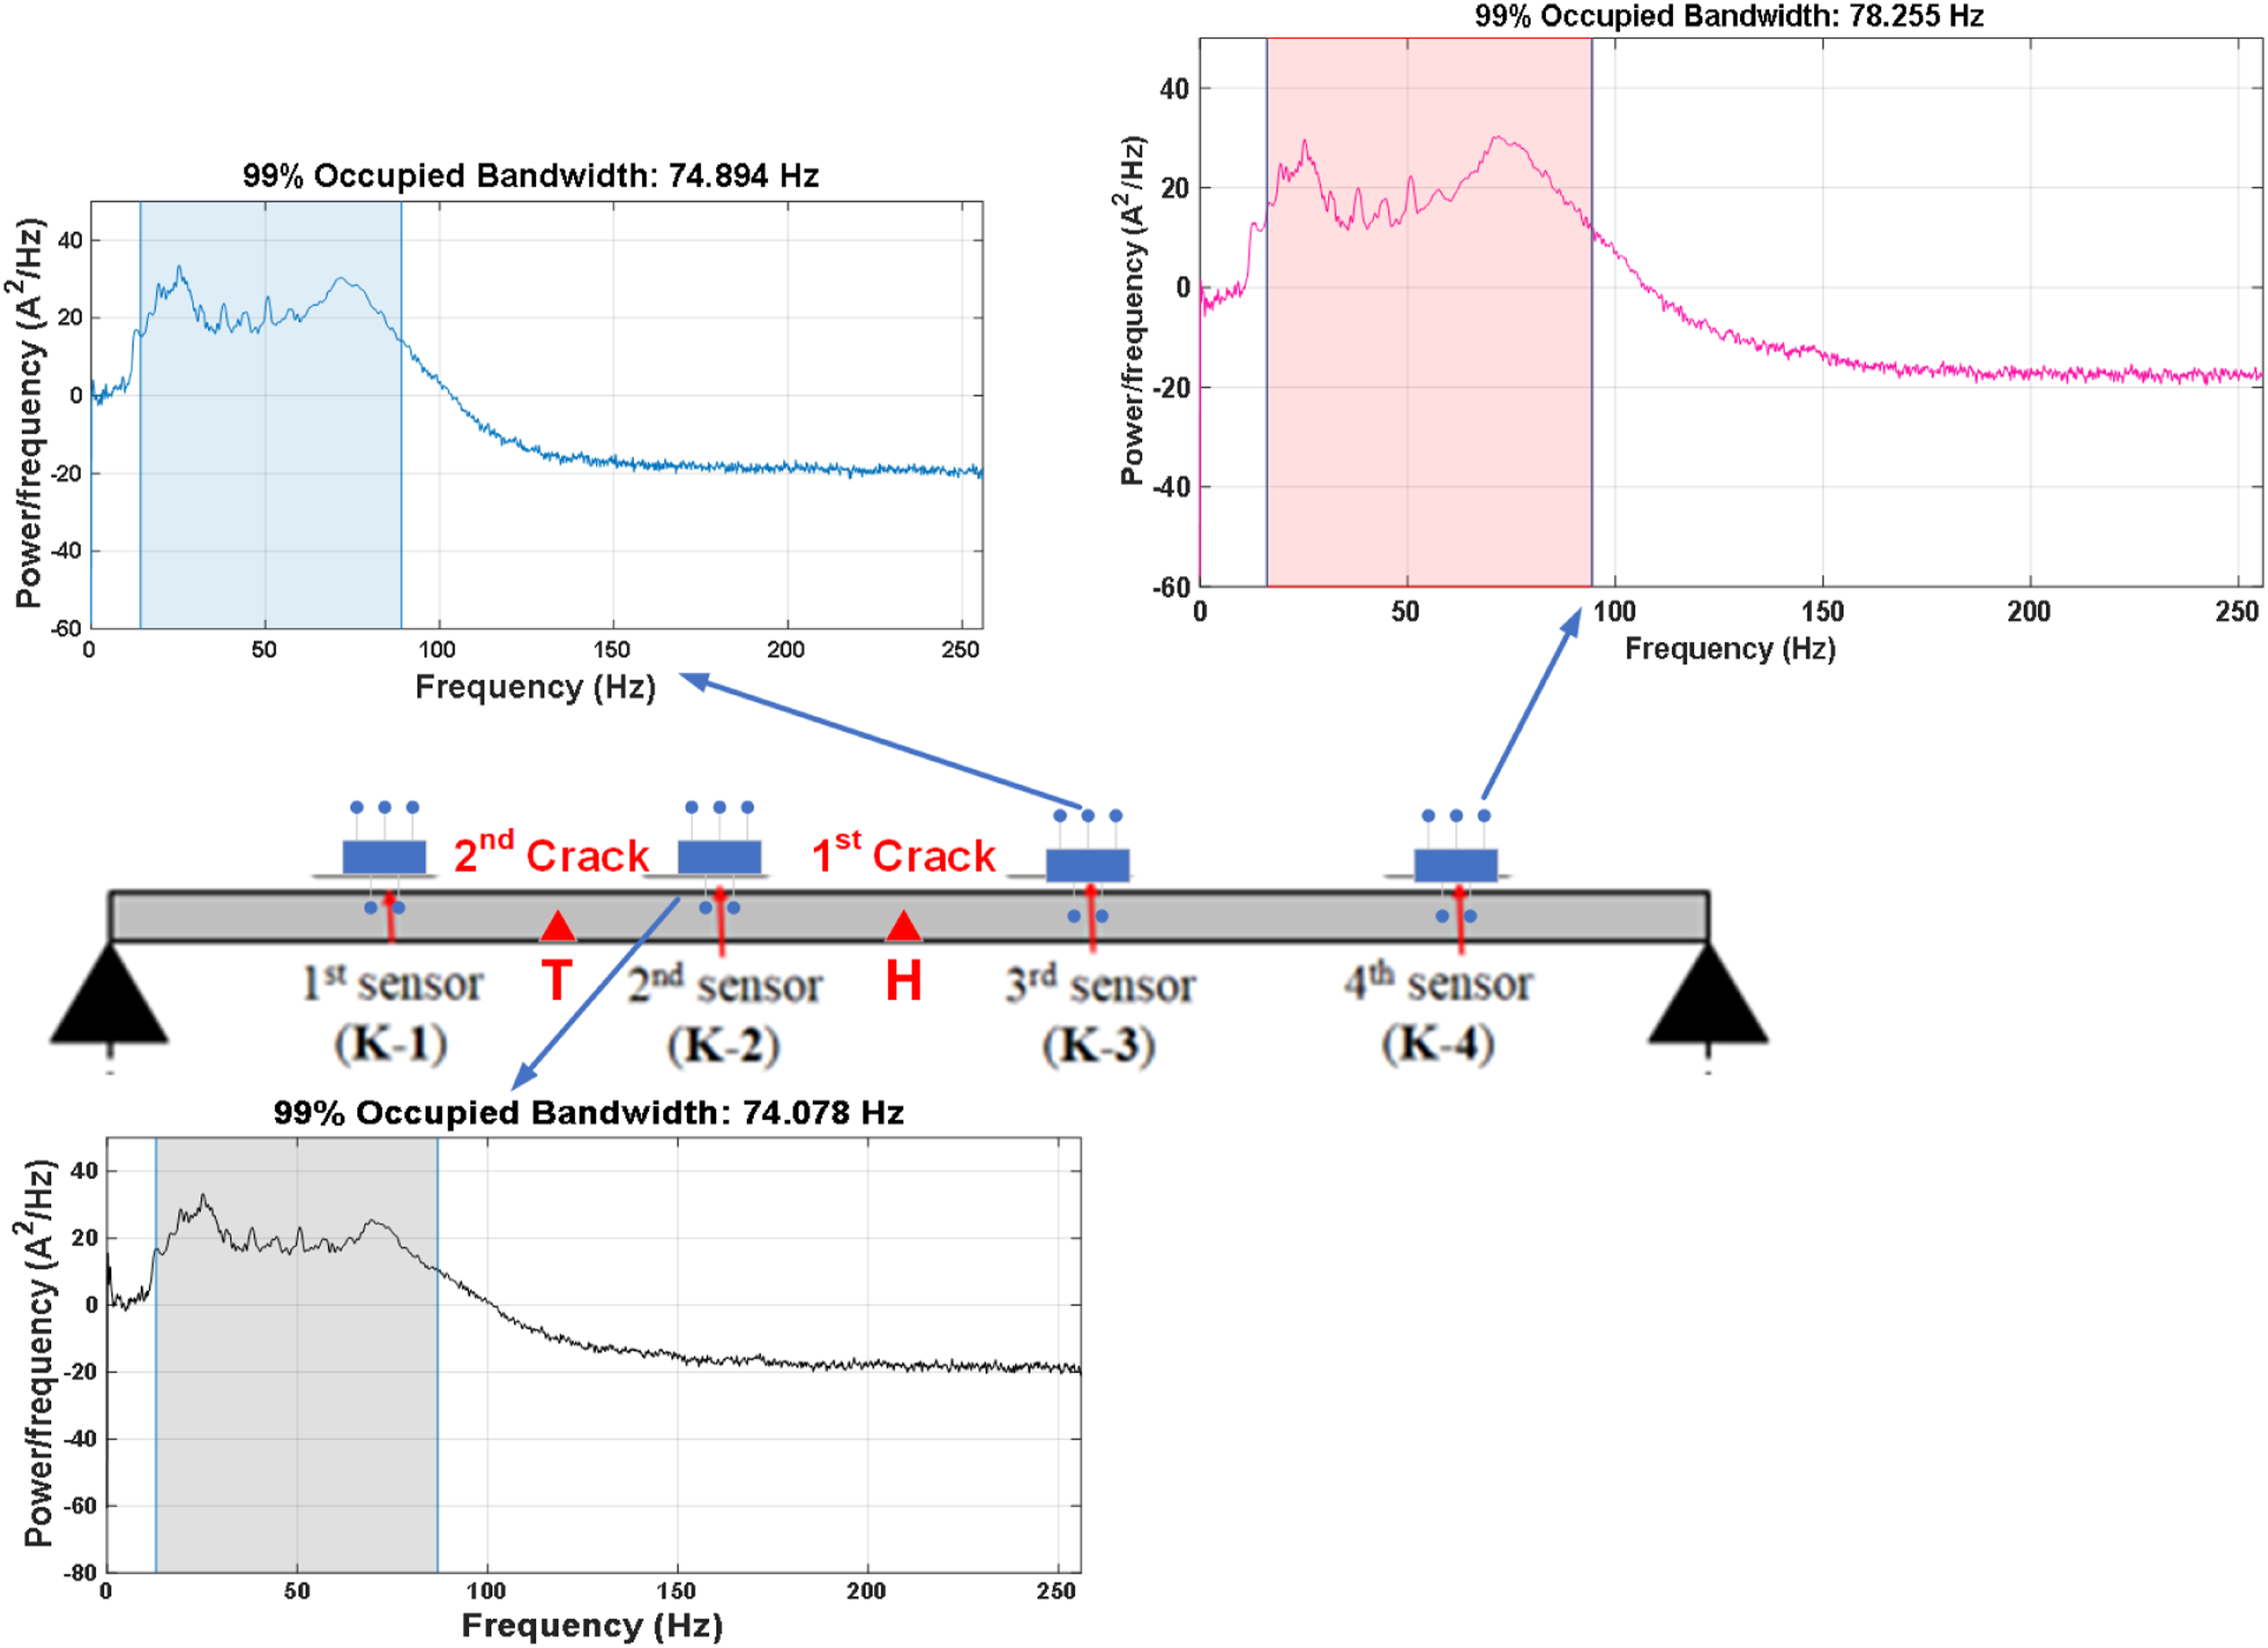
Based on Figure 11, it is clear that positions farther from the crack, such as channel 4 (K4), have the largest occupied bandwidth, reaching 78.255 Hz. The position near one crack (H), such as channel 3 (K3), has a smaller occupied bandwidth of 74.894 Hz. Finally, channel 2 (K2), which is near cracks T and H, has the smallest occupied bandwidth of 74.078 Hz. This shows that the occupied bandwidth can be used to check the crack location: the closer the position is to the crack, the smaller the occupied bandwidth.
Conclusions
This study presented a novel method that combines discrete wavelet transform (DWT) and fast Fourier transform (FFT) to detect and evaluate structural damage in steel beams. The results of the signal analysis demonstrate the ability to accurately detect the presence of cracks and monitor their progression, providing essential information for the evaluation of structural conditions. Specifically, the signal analysis process has shown that - - - -
In conclusion, the study has demonstrated the effectiveness of the proposed method in detecting and monitoring structural damage in steel beams. This opens up numerous opportunities for practical applications in modern structural monitoring and maintenance systems, offering highly accurate solutions for damage prediction and detection, thus improving the safety and efficiency of construction projects.
Footnotes
Declaration of conflicting interests
The author(s) declared no potential conflicts of interest with respect to the research, authorship, and/or publication of this article.
Funding
The author(s) received no financial support for the research, authorship, and/or publication of this article.