
Abstract
Railway systems cause more severe vibration pollution than road systems, and the vibration pollution caused by railway systems has been increasing annually over the past two decades. Despite this, there is limited investigation into the accuracy of train-induced vibration prediction methods. Therefore, the present study investigated the accuracy of the detailed and general procedures proposed by the US Federal Transit Administration (FTA) for predicting train-induced vibrations. The accuracy of these methods was determined by evaluating their predictions against in-situ measurements of ground vibration levels induced by passing trains. The field experiments conducted in this study involved the measurement of train-induced vibration levels, the estimation of line-source transfer mobility (LSTM) by dropping a weight on rail sleepers, the evaluation of force density levels, and the determination of ground LSTM by dropping a weight on the ground. In addition, graphs were plotted to determine the relationships of train-induced vertical vibration levels with train speed, distance from the track centreline, and train length. The study compared measured and predicted vibration levels to assess the accuracy of the FTA’s detailed and general prediction methods. Results indicate that detailed assessments tend to overestimate vibration levels, while an optimized general vibration assessment curve offers a more precise estimate. Additionally, on the basis of the measurement data, the study explored the impact of train length on ground vibration and demonstrated that track ballast can absorb vibration energy along the wave propagation path. A frequency propagation contour plot was also created to analyse vibration energy across different frequencies. These findings enhance the reliability of train-induced vibration prediction methods and provide insights for improving vibration mitigation strategies in urban railway systems.
Introduction
Railways are an efficient and comfortable mode of transportation. However, railway systems are operated on tracks with heavy axle loads, fixed distances between axles, and contact between the train wheel and rail. Consequently, railway systems induce more severe vibration pollution than road systems. The growth of railway networks worldwide has resulted in increasing research regarding railway noise and vibration since the year 2000.1,2 A previous study 1 indicated that 44% and 31% of stipulated minimum levels of vibration and ground-borne noise were exceeded, with similar problems being prevalent worldwide. Contact between the train wheels and rails is a major source of railway vibrations, 3 which are amplified by irregularities in wheels (particularly in wheel roundness) and rail surfaces. Vibration mitigation tracks, for example, floating slab track and high resilient fastener, are used when predicted vibration levels exceed permitted vibration levels.
Accurately predicting and mitigating train-induced vibrations are crucial tasks in urban infrastructure planning. This study examined the accuracy of the FTA’s methods for predicting train-induced vibrations by using field-measured data; these methods involve identifying force density level (FDL) and line-source transfer mobility (LSTM). Field measurements were conducted to capture train-induced vibration levels at various distances from the track centreline. In addition, dropping weight experiments were repeated at precise locations within the track system to evaluate the stability and reproducibility of FDL measurements. Subsequently, ground LSTM, obtained by dropping a weight on the ground, was used for the prediction procedure. Moreover, this study created a frequency propagation contour plot to analyse the vibration energy under different vibration frequencies at various distances. The measured and predicted vibration levels were compared to determine the prediction error. Additionally, the effect of train length on ground vibration was examined. Then, the track ballast within the far and near tracks can absorb ground vibration energy along the wave propagation path was demonstrated. These findings can be utilised to improve the reliability of train-induced vibration prediction methods and to optimise strategies for mitigating vibrations in urban railway systems.
Vibration assessment method
Detailed vibration analysis
The FTA’s detailed vibration analysis method is usually used to assess train-induced ground vibrations in newly constructed railway systems. The predicted vibration

The FDL in vibration analysis is analogous to sound power in acoustic measurement, and each type of train has a unique FDL spectrum. However, the FDL cannot be directly measured and must be indirectly derived using the following equation Method proposed by the FTA for the estimation of the FDL: (a) measurement of train-induced vibration and (b) transfer mobility experiment conducted on a track.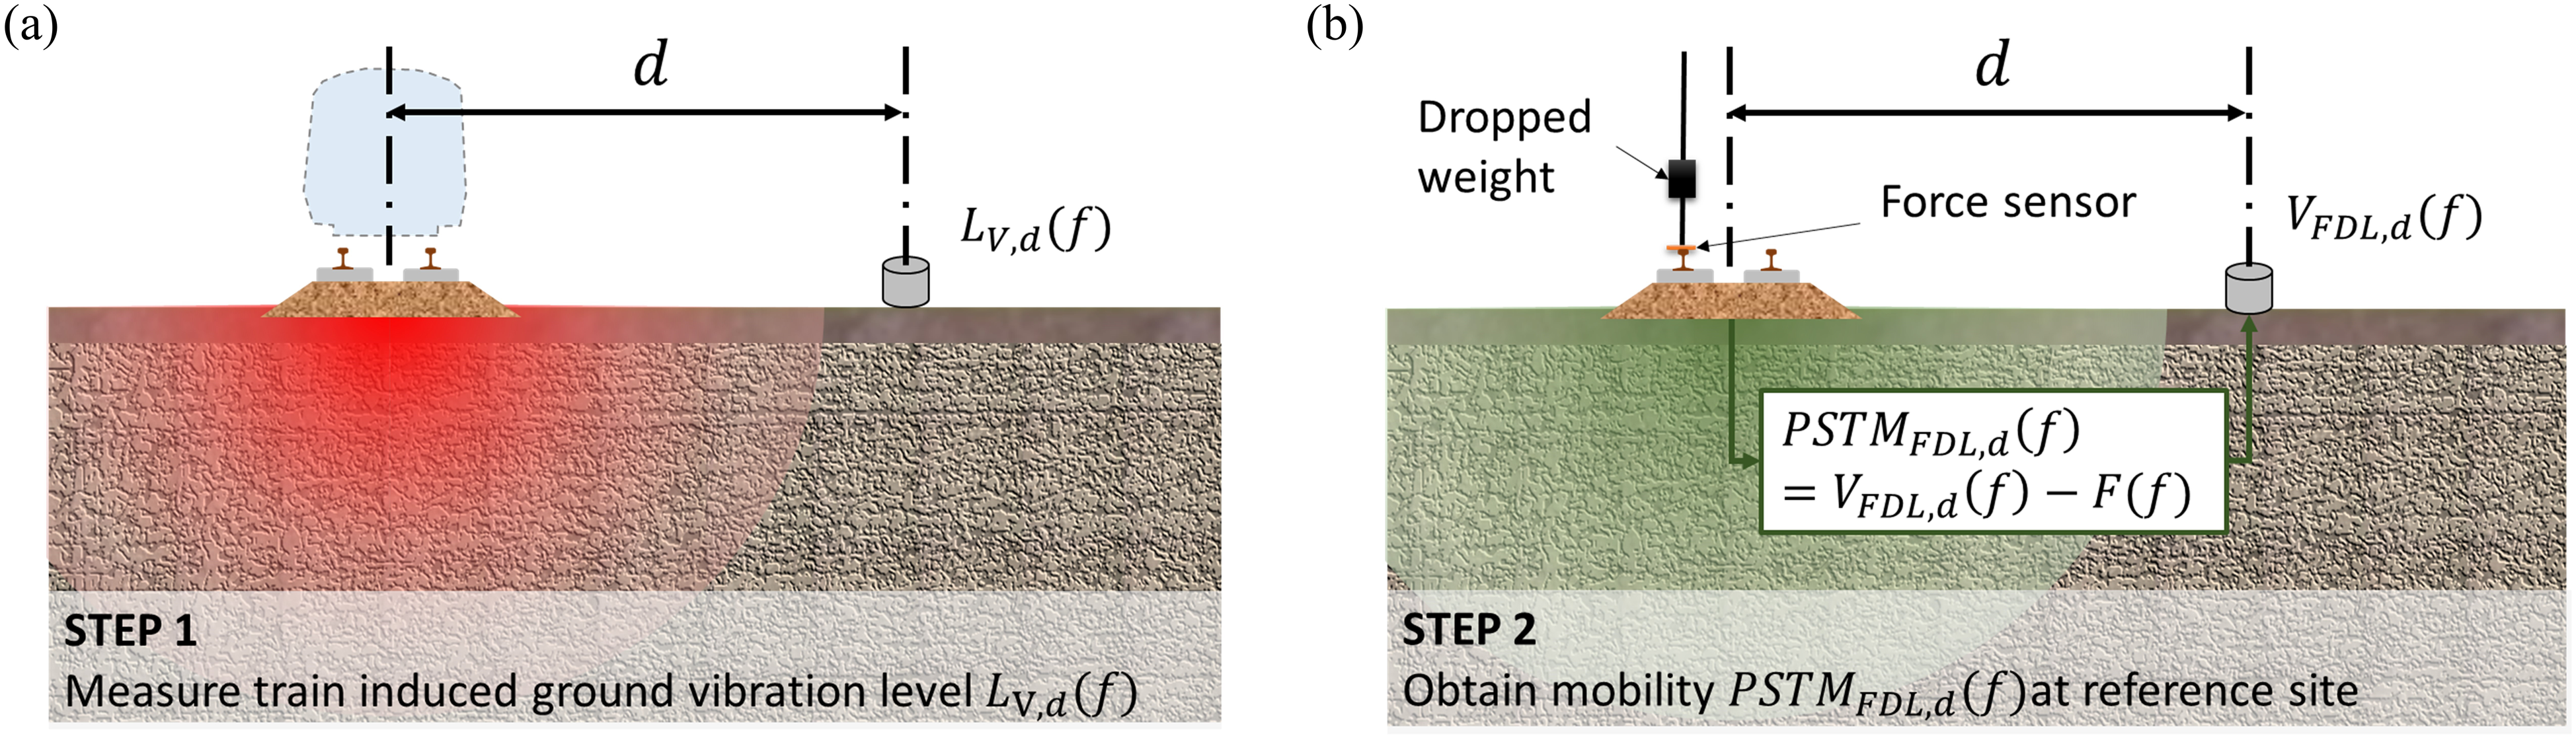

The objective of the FTA’s detailed vibration analysis method is to predict

Field experiment and measurement strategy
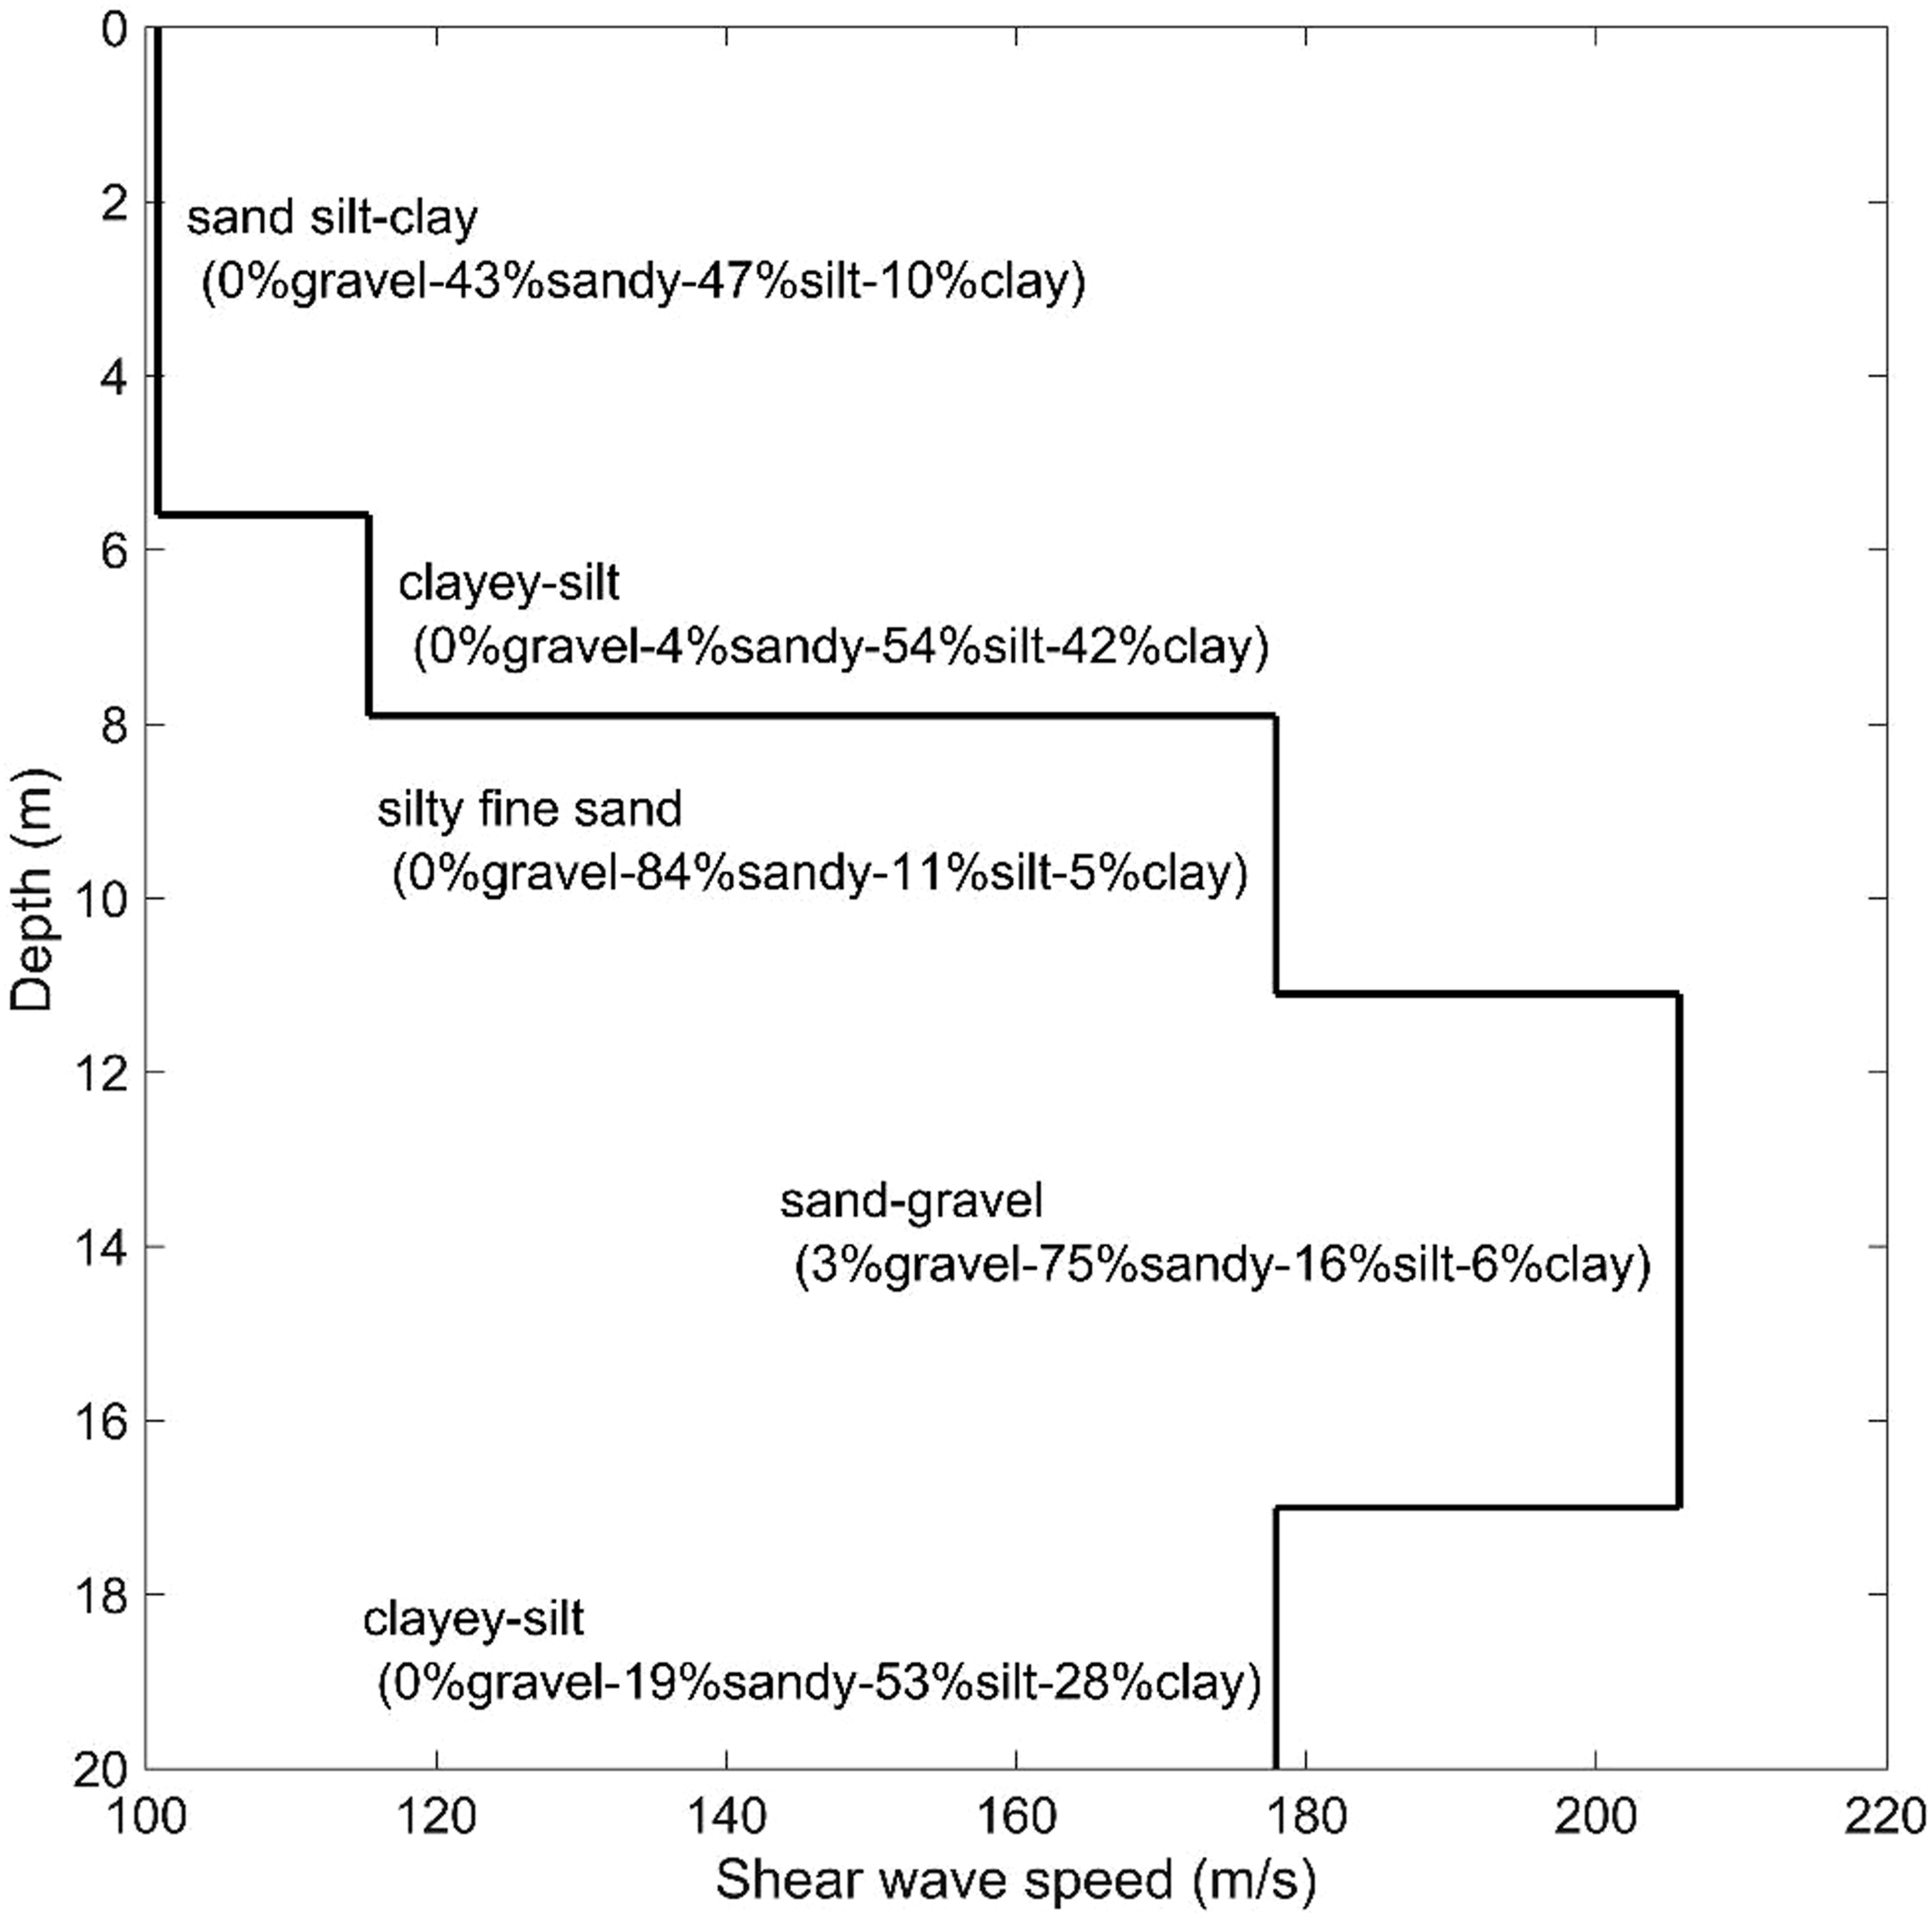
To meet the limitations and requirements outlined in the FTA manual, a sufficiently broad field located close to railway tracks is required to validate the FTA’s detailed vibration analysis method. Therefore, a field located at 24.782403 N and 121.762192 E in Sicheng, Yilan, Taiwan (Figure 2), was selected as the experimental site in this study. This location is adjacent to a conventional double-track railway system, with approximately 800 m of straight continuous welded rail tracks before and after the measurement line. This straight track section does not contain joints and includes special trackwork within 61 m (200 ft). Additionally, the experiment location comprises loose ground that is primarily composed of silt and clay (Figure 3). Measurement field for train-induced vibrations: (a) aerial view of the field, (b) an accelerometer on the ground, (c) PSTM experiment on a ballast sleeper, and (d) PSTM experiment on the ground. Soil profile and shear wave speed at the measurement site.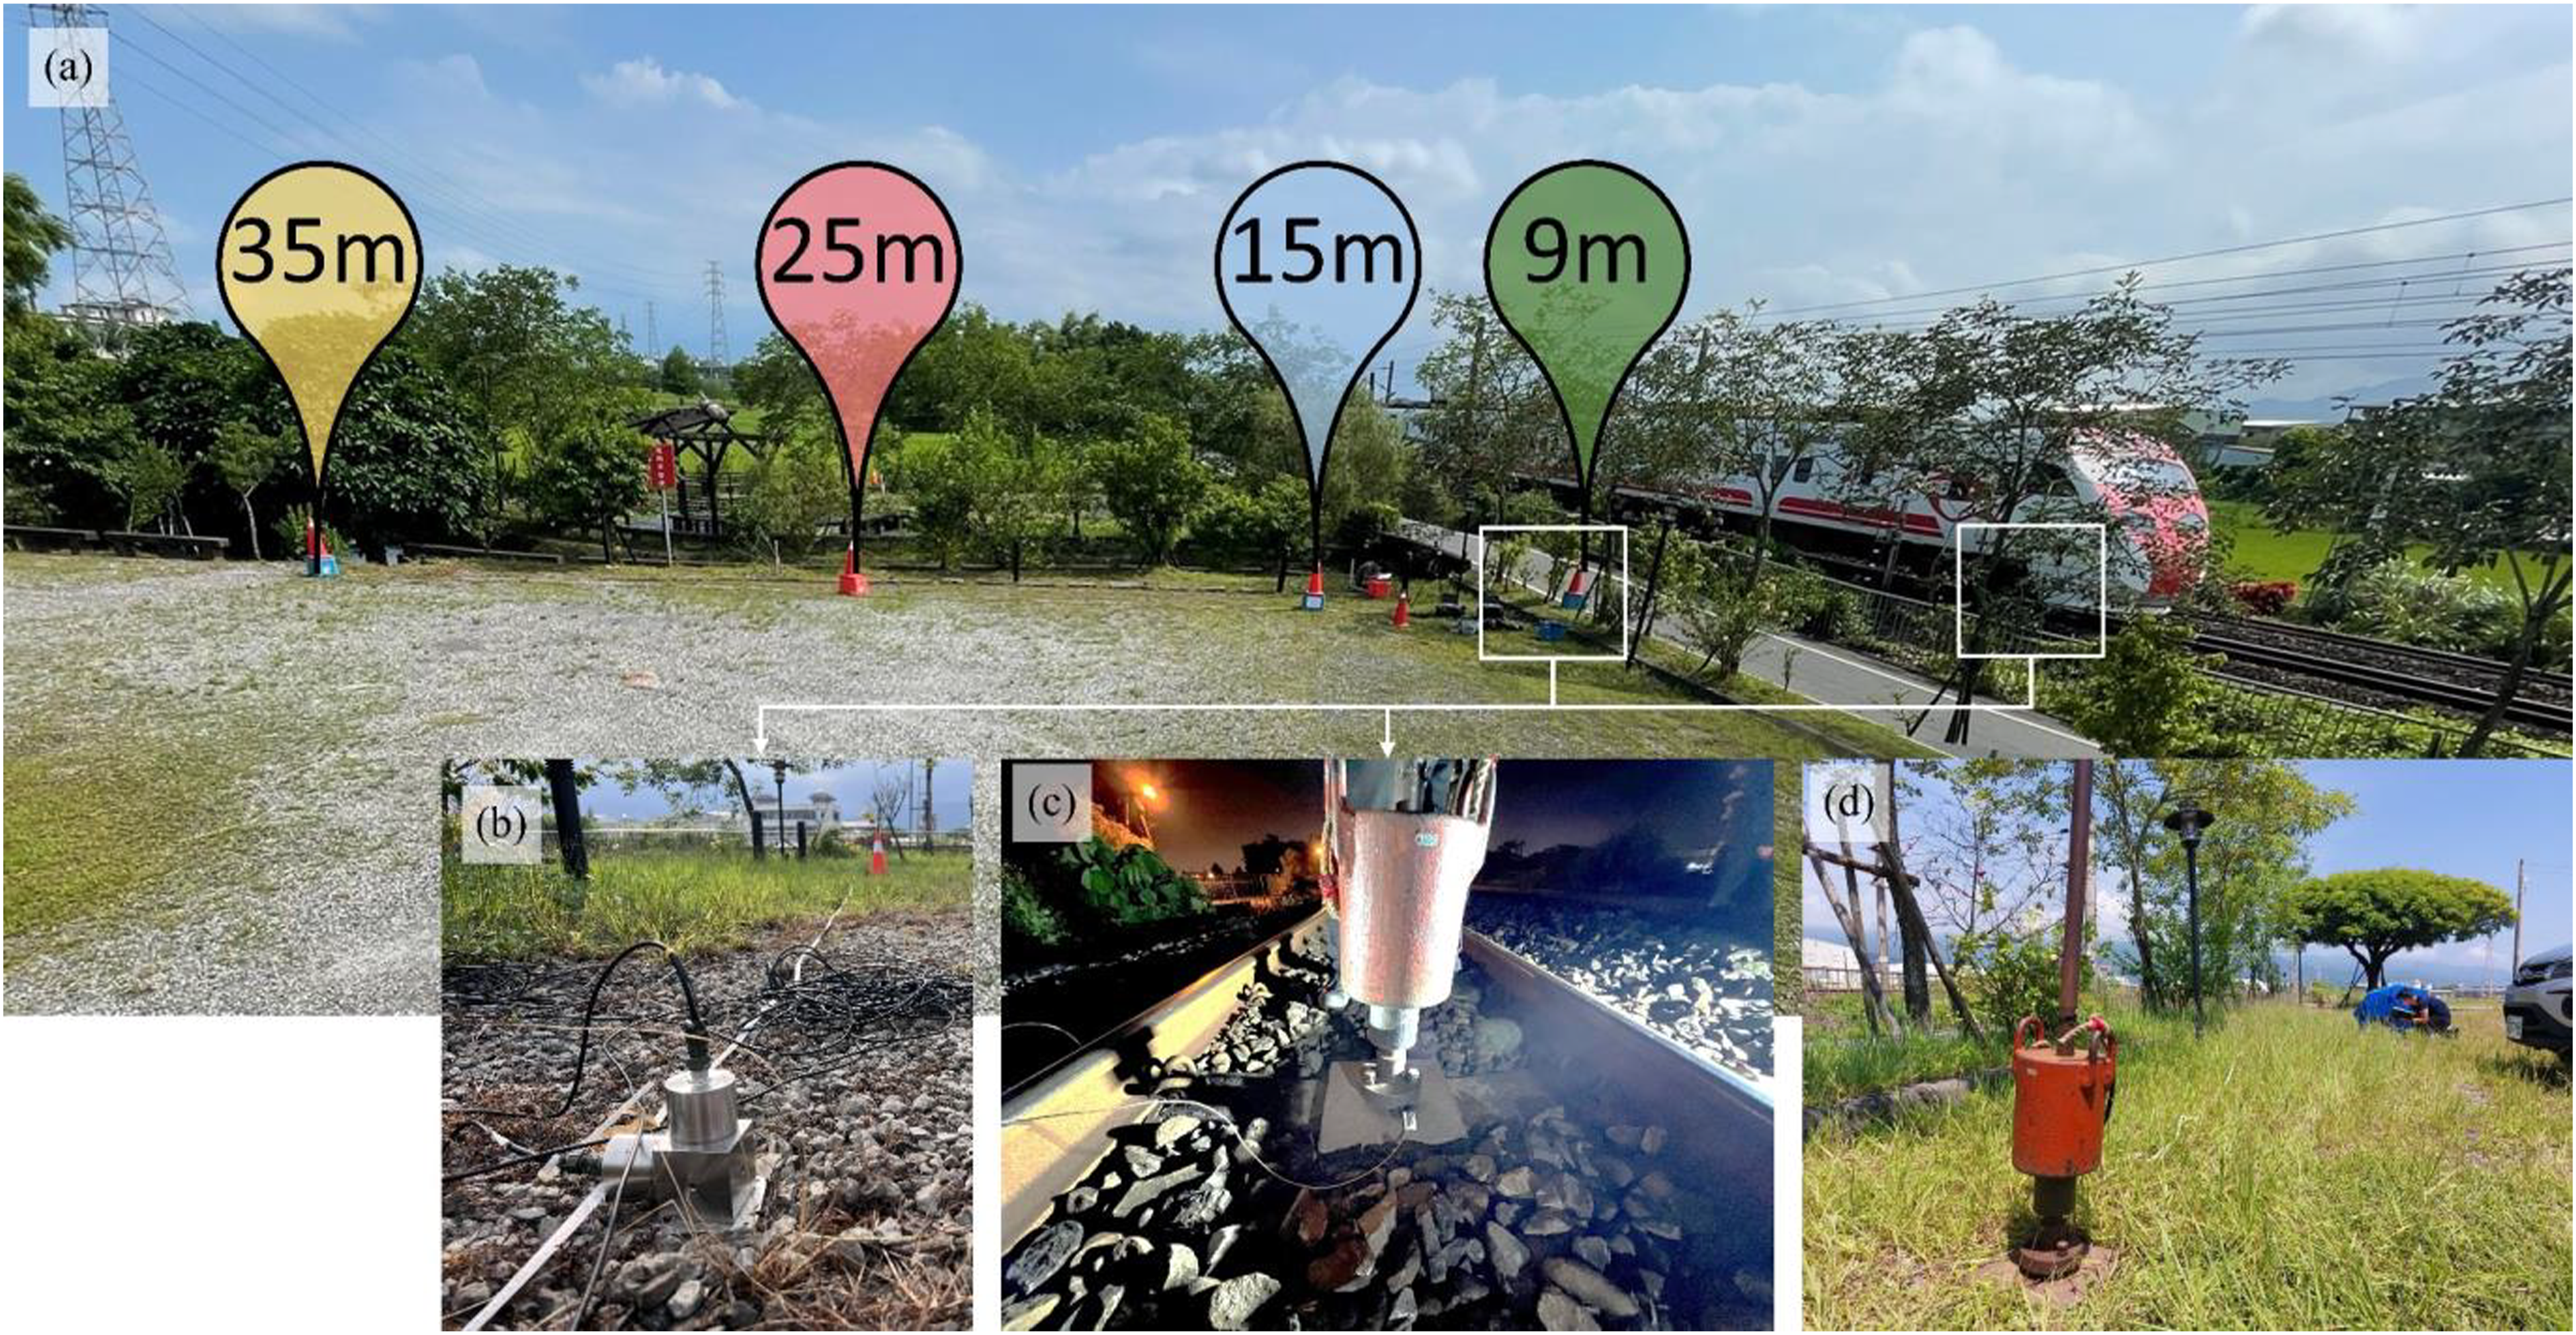
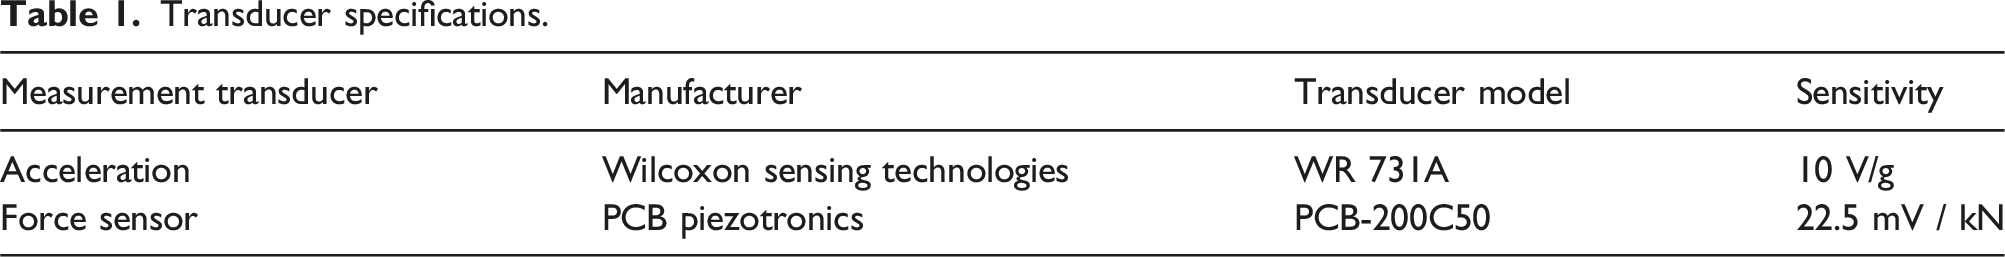
Transducer specifications.
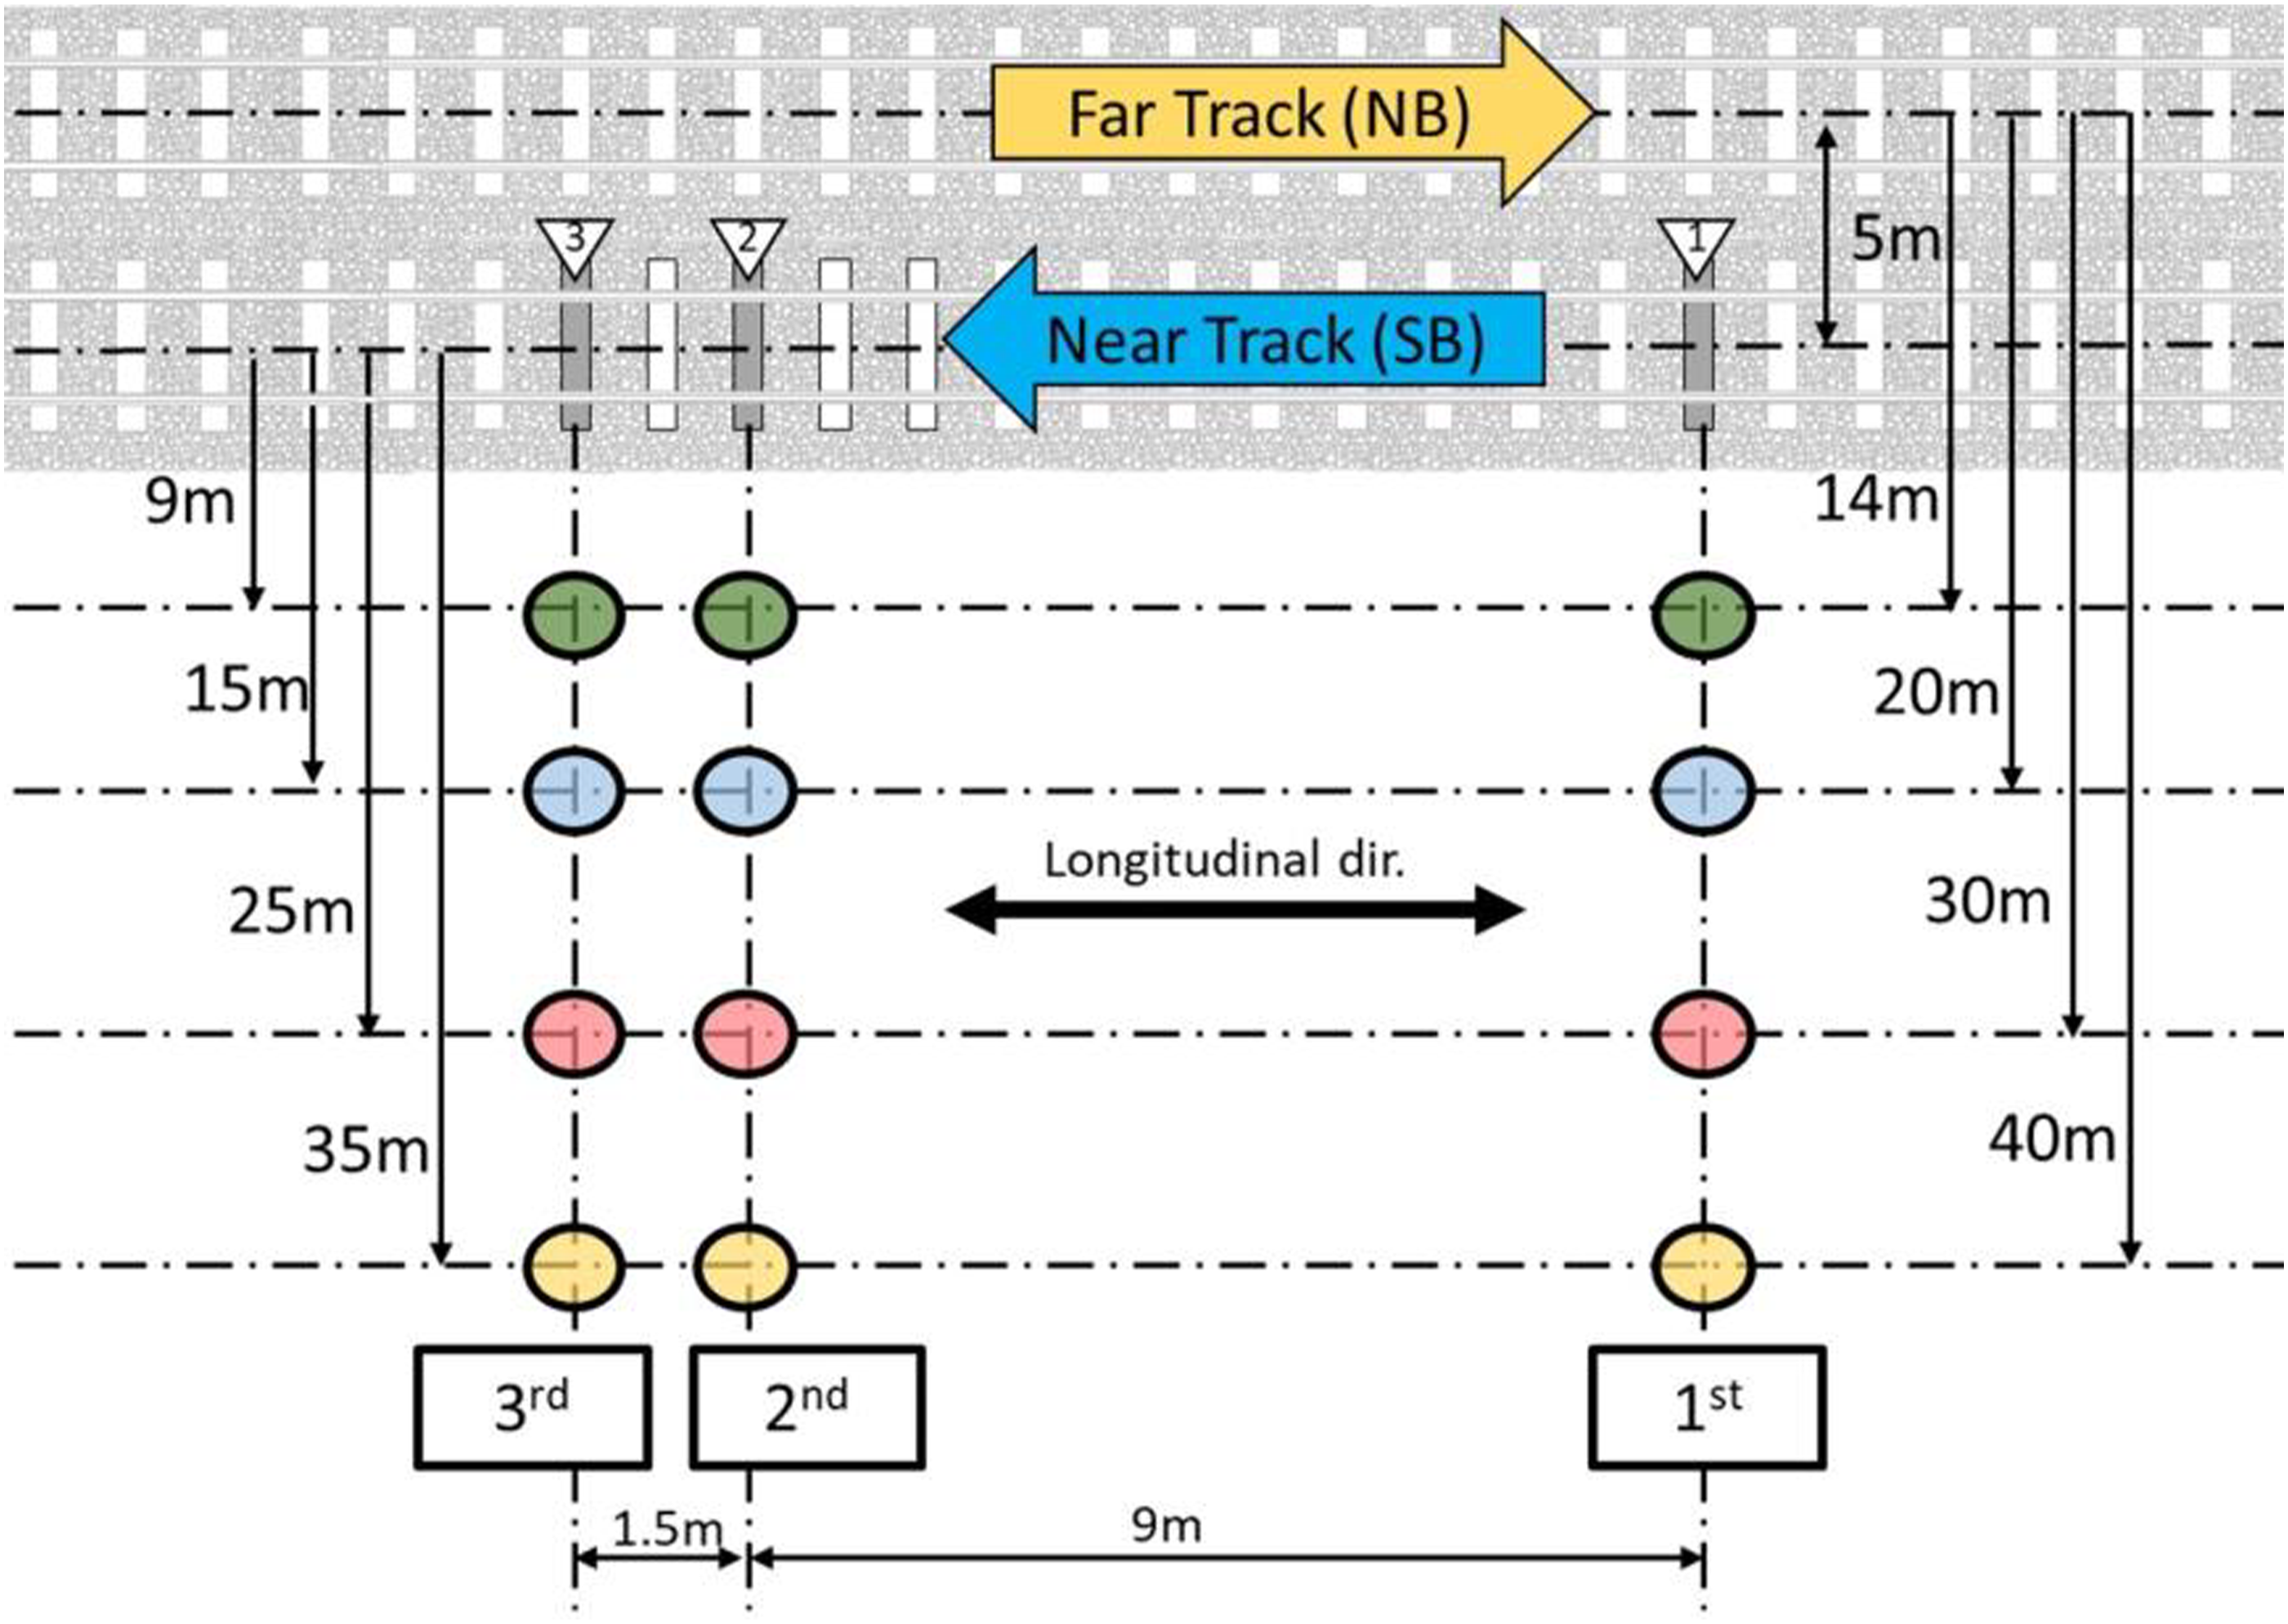
Layout of three in-situ experiments.
To assess the stability and replicability of the FDL,
The trains selected in this study to obtain observations were EMU3000 trains, which are express electrical multiple units. These trains frequently traverse the measurement site and have been used in commercial operations since 2021. Each coach of this train has a weight of approximately 38 tonnes, the end coaches of the train have a length of 21.35 m, the other coaches of the train have a length of 20.3 m, and the total length of the train is 245.7 m.
Measurement of train-induced vibration
Train-induced vibration at the measurement site
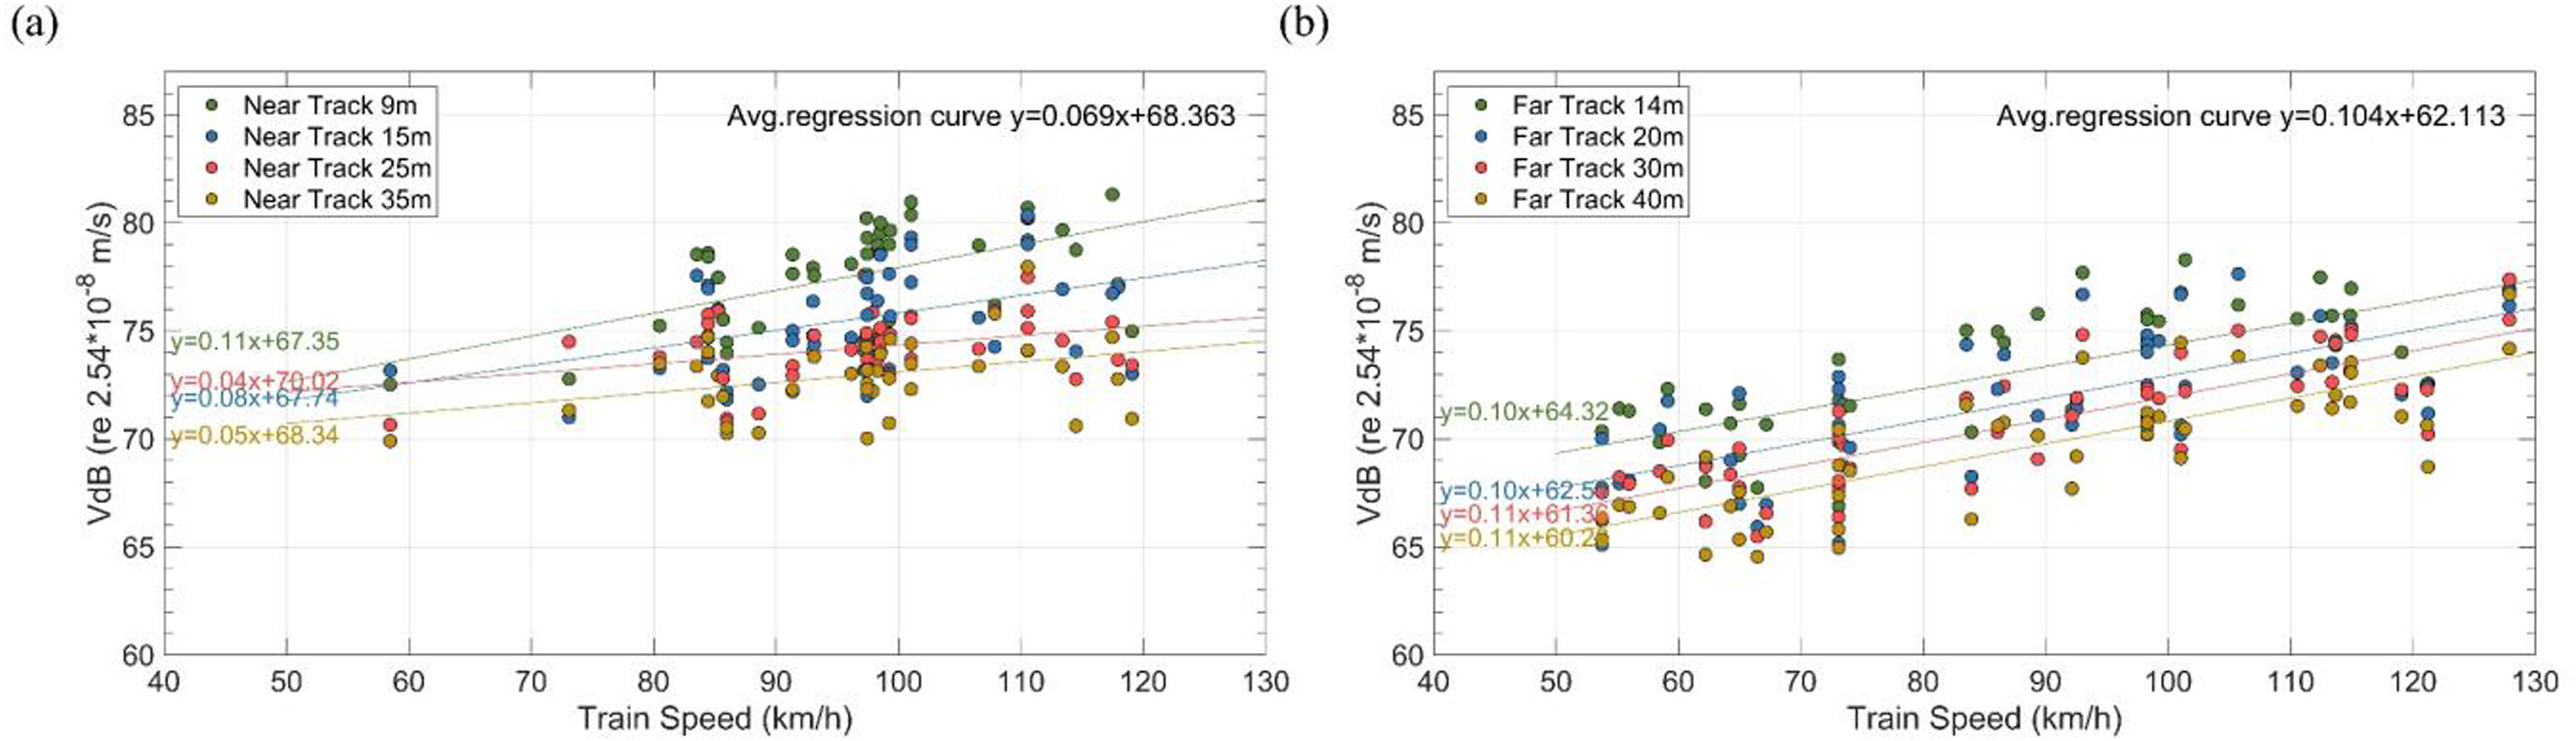
Figure 5 displays the train-induced ground vibration levels under varying train speeds and different distances from the track centreline, encompassing both vertical and longitudinal vibrations. The background vibration velocity was approximately 33–45 VdB. According to the regression curve of distance versus vibration velocity, the train-induced vibrations at positions located 9 m away from the centreline of the near track and 14 m away from the centreline of the far track were 72.5–81.3 and 67.7–78.3 VdB, respectively, under a train speed of 53–119 km/h. When trains pass both tracks, the vibration level positively correlated with the train speed. The average regression slope factor for the relationship between train-induced vibrations and train speed for the near and far track was 0.07 and 0.10 VdB, respectively, indicating a notable difference in both slope and vibration levels. However, for the nearest measured distance from both tracks, the slopes were 0.11 and 0.10 equation (3) VdB, respectively, aligning with the FTA’s proposed train speed adjustment equation,
5
which is expressed as follows Train-induced vibration velocity under varying train speeds at different distances from the track centreline: (a) near and (b) far track.
Additionally, the integration approach used to obtain LSTM involves setting the integration bounds to the length of the train.
16
Research suggests a positive correlation between ground vibration and train length under constant conditions. Figure 6 illustrates the relationships obtained between ground vibration levels and train speed for different train lengths (4–14 cars) during field investigations of conventional railways. Figures 6(a) and (b) indicate that among all investigated trains, most of the four-car commuter trains induced the lowest vibration levels at positions located 9 m from the centreline of the near track and 14 m from the centreline of the far track under a train speed of approximately 58 to 97 km/h, respectively. However, no clear positive correlation was observed between train length and measured vibration levels for longer trains. Vibrations induced by trains with different numbers of cars under varying train speeds: (a) at a position 9 m from the centreline of the near track and (b) at a position 14 m from the centreline of the far track.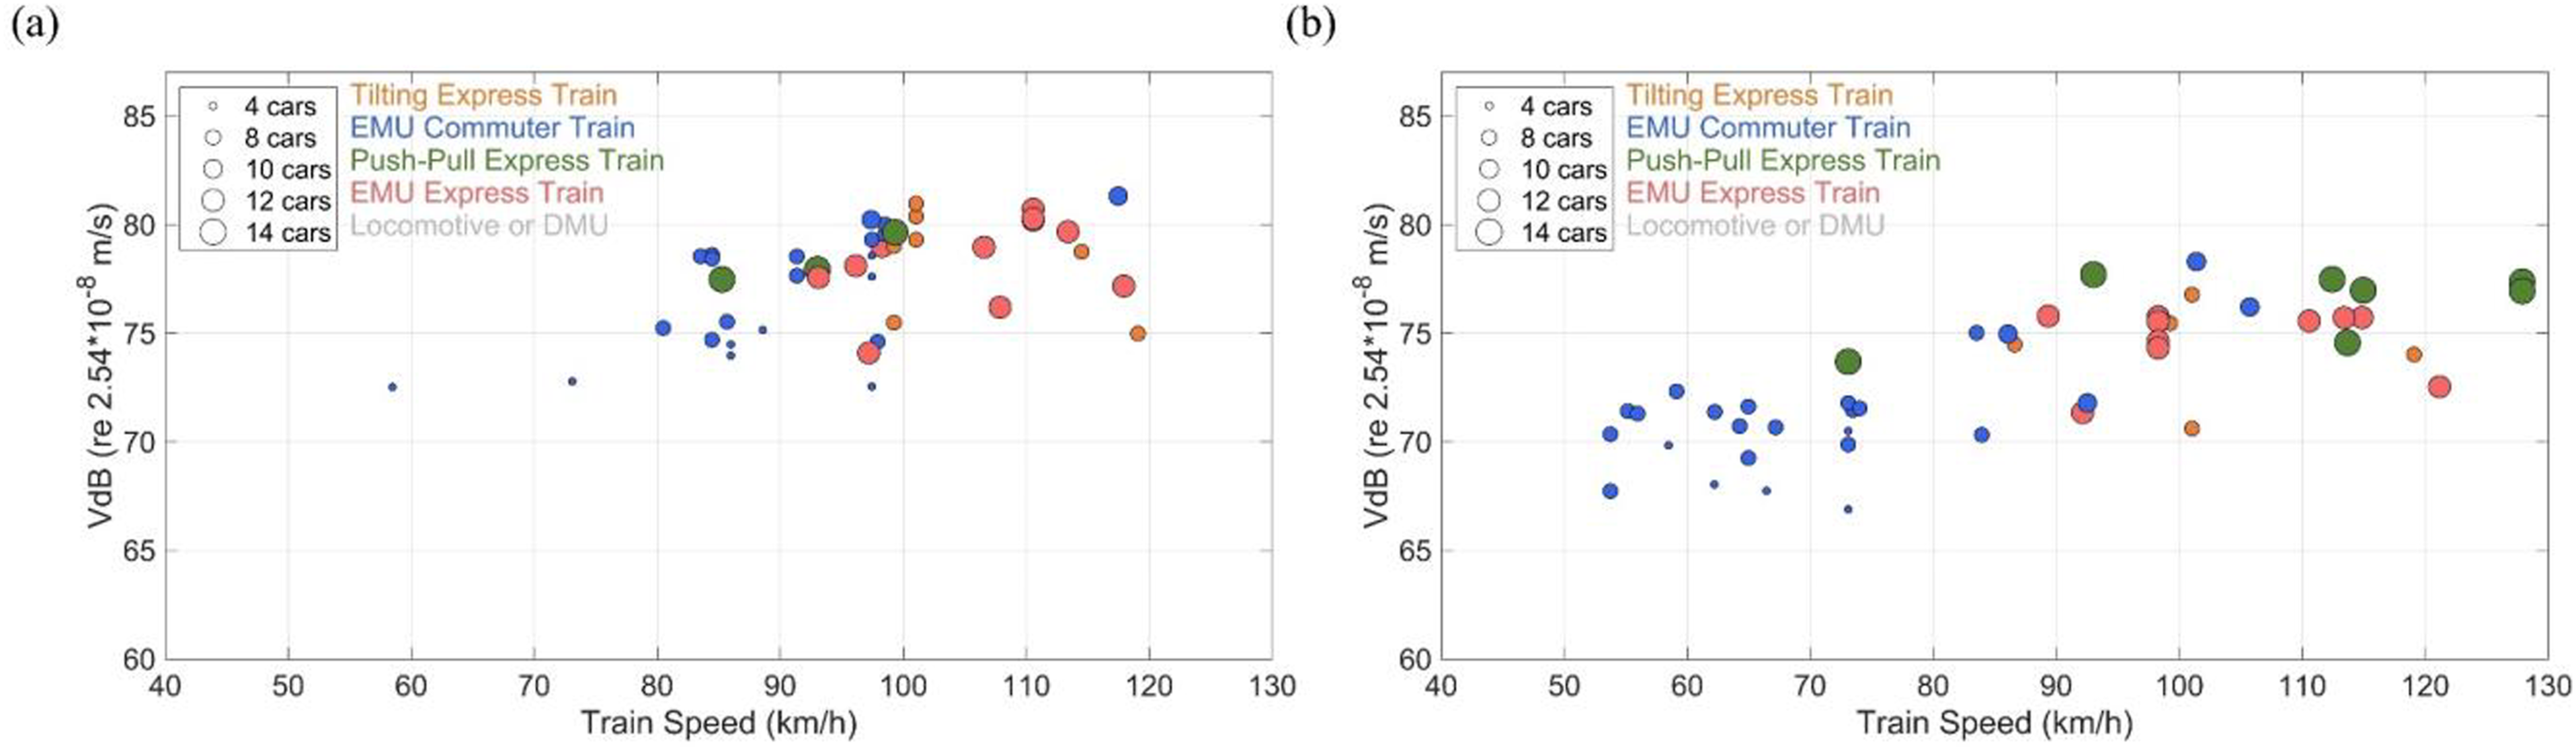
Spectrum of the train-induced vibration
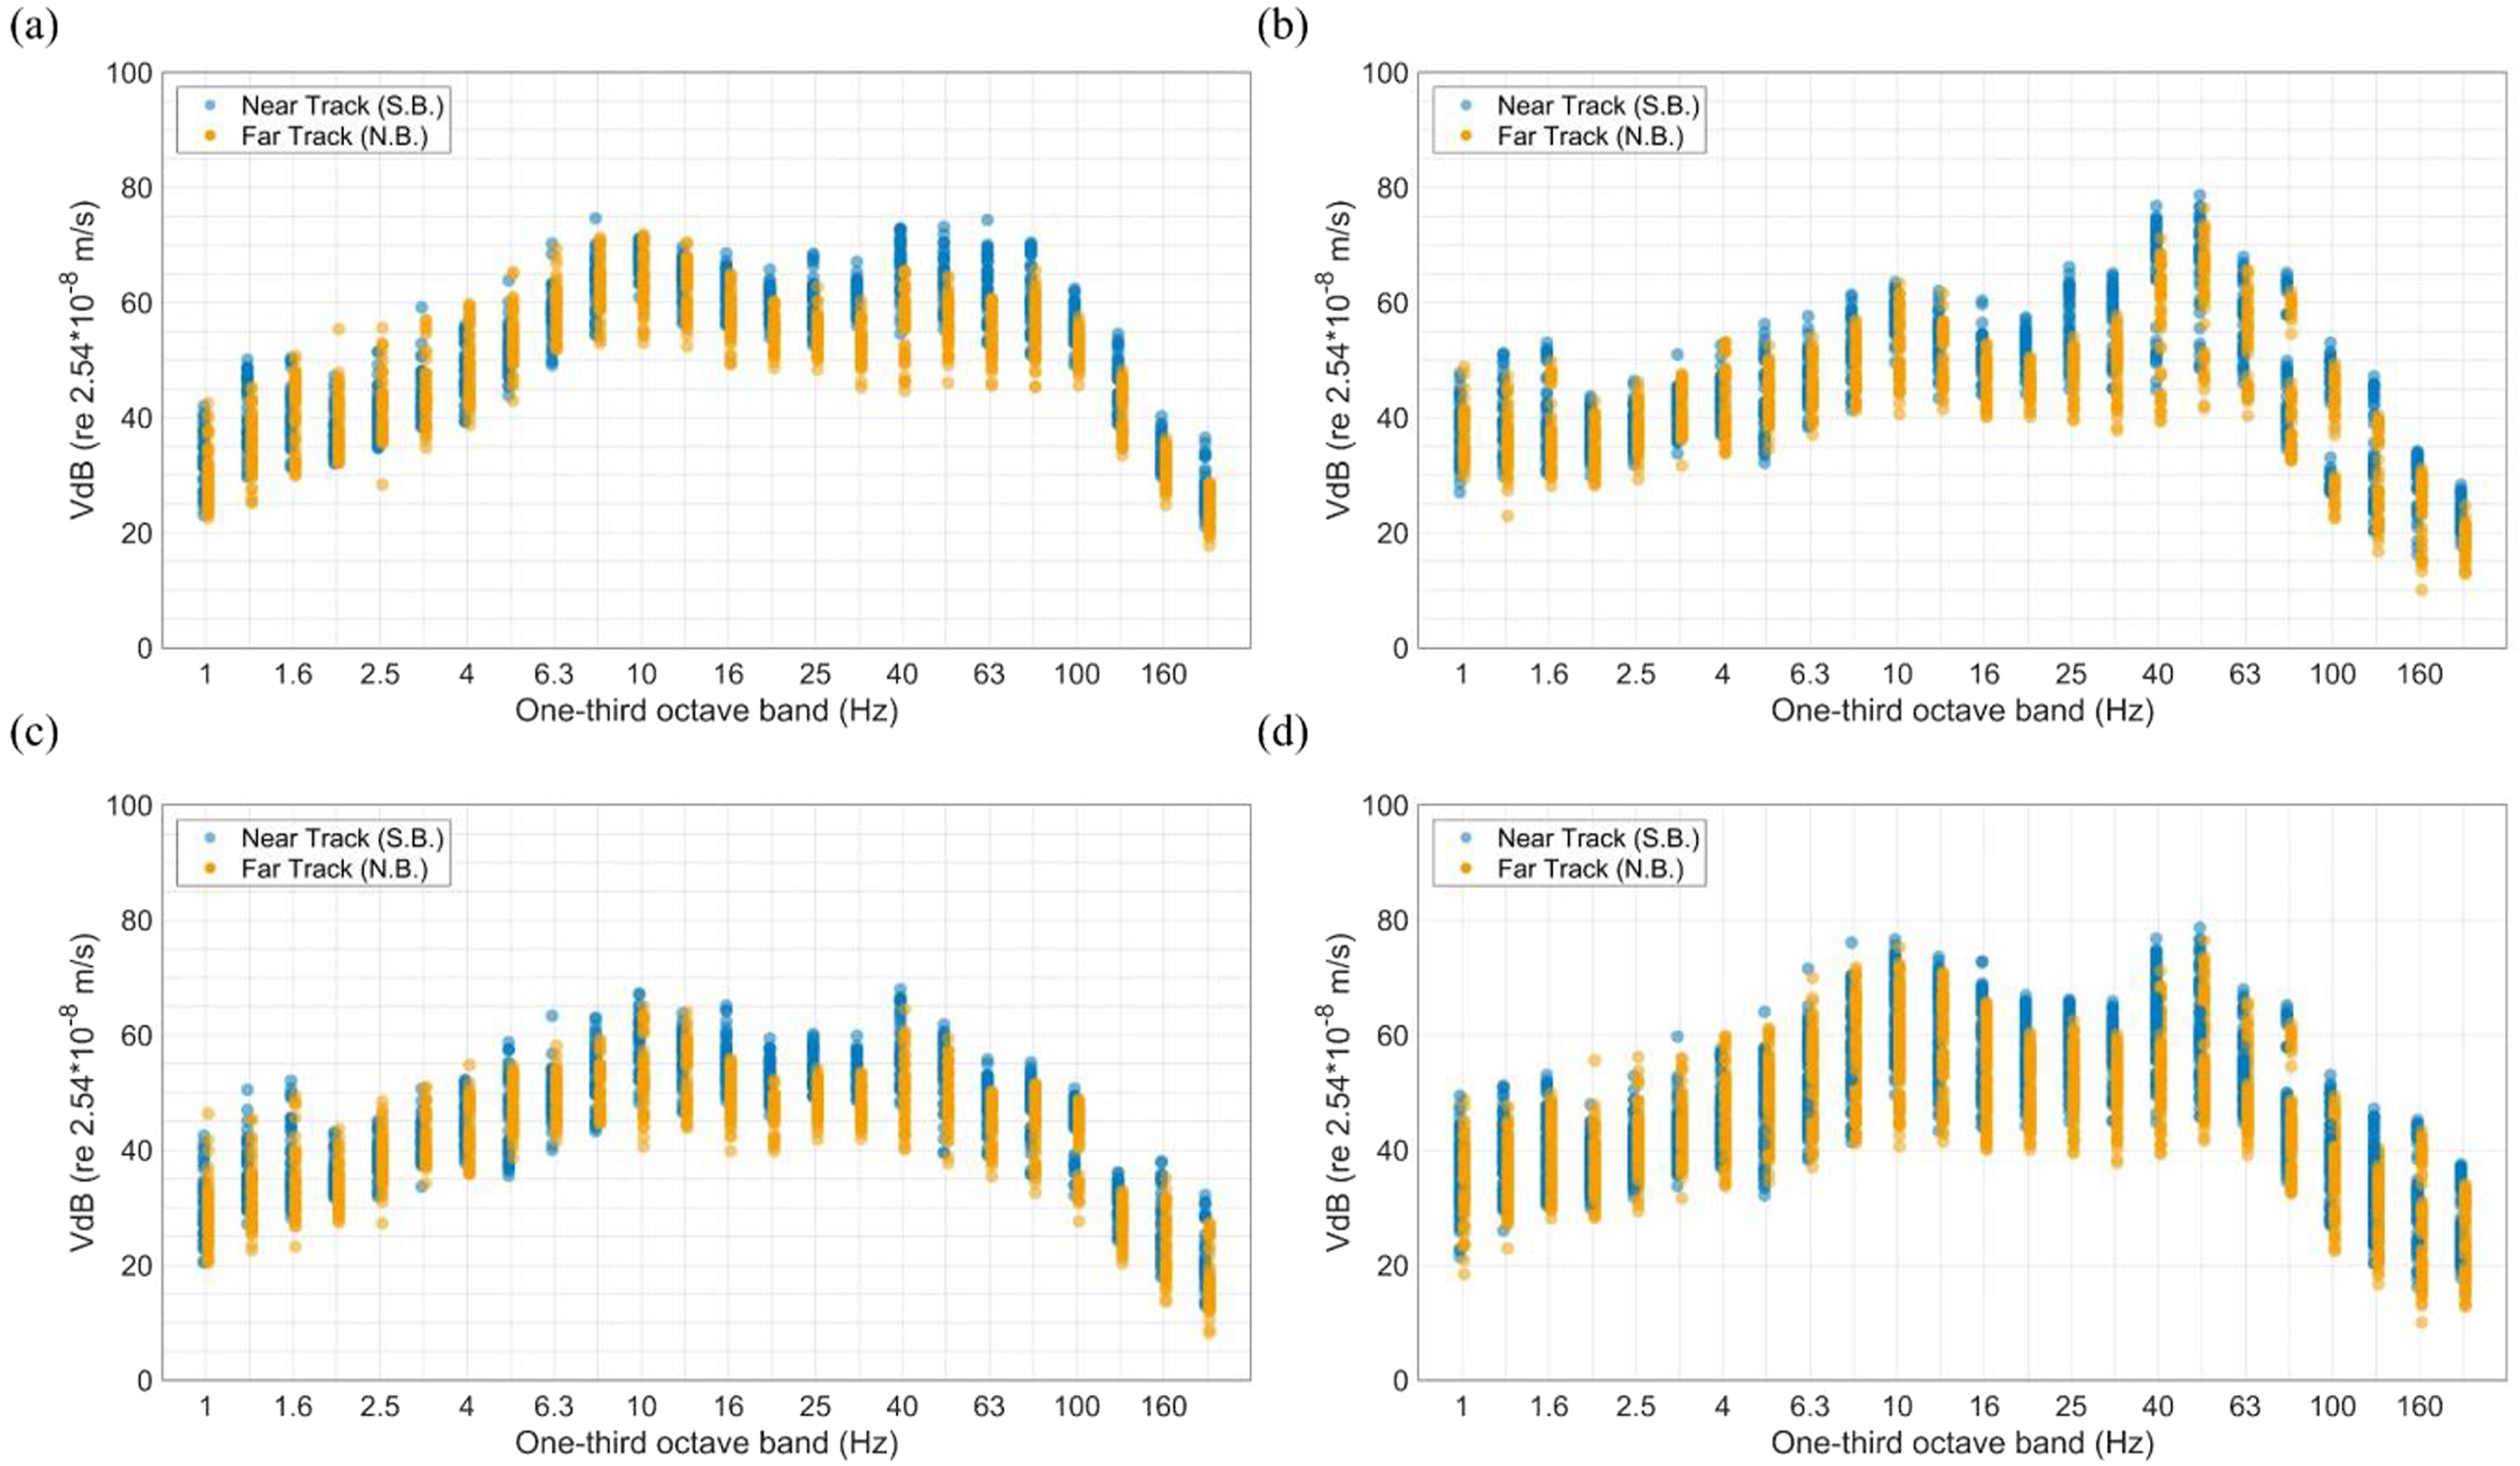
This study conducted repeated field measurements to validate the FTA’s method for assessing train-induced ground vibration. Figures 7(a)–(d) illustrates the vertical ground vibration spectra induced by EMU3000 trains at positions located 9, 15, 25, and 35 m from the centreline of the near track, respectively. Figure 7(e) shows the standard deviation of each frequency band of EMU3000-induced vibrations at the aforementioned positions. Most EMU3000 trains that passed through the experiment location had a speed of 105 ± 5 km/h, resulting in minor differences in the induced ground vibrations due to speed variations. Figure 7 indicates that the trend of train-induced ground vibration level was highly consistent when the vibration frequency was above 8 Hz at each position. The maximum standard deviations in the vibration levels at positions located 9, 15, 25, and 35 m away from the centreline of the near track were 4.3, 3.9, 3.9, and 3.2 dB, respectively. Moreover, the dominant vibration frequency at this measurement site was between 10 and 12.5 Hz. (a)–(d) Ground vertical vibration spectrum induced by 12-car EMU3000 trains at different distances from the centreline of the near track: (a) 9, (b) 15, (c) 25, and (d) 35 m. (e) Standard deviations of the vibration levels at 9, 15, 25, and 35 m from the track centreline.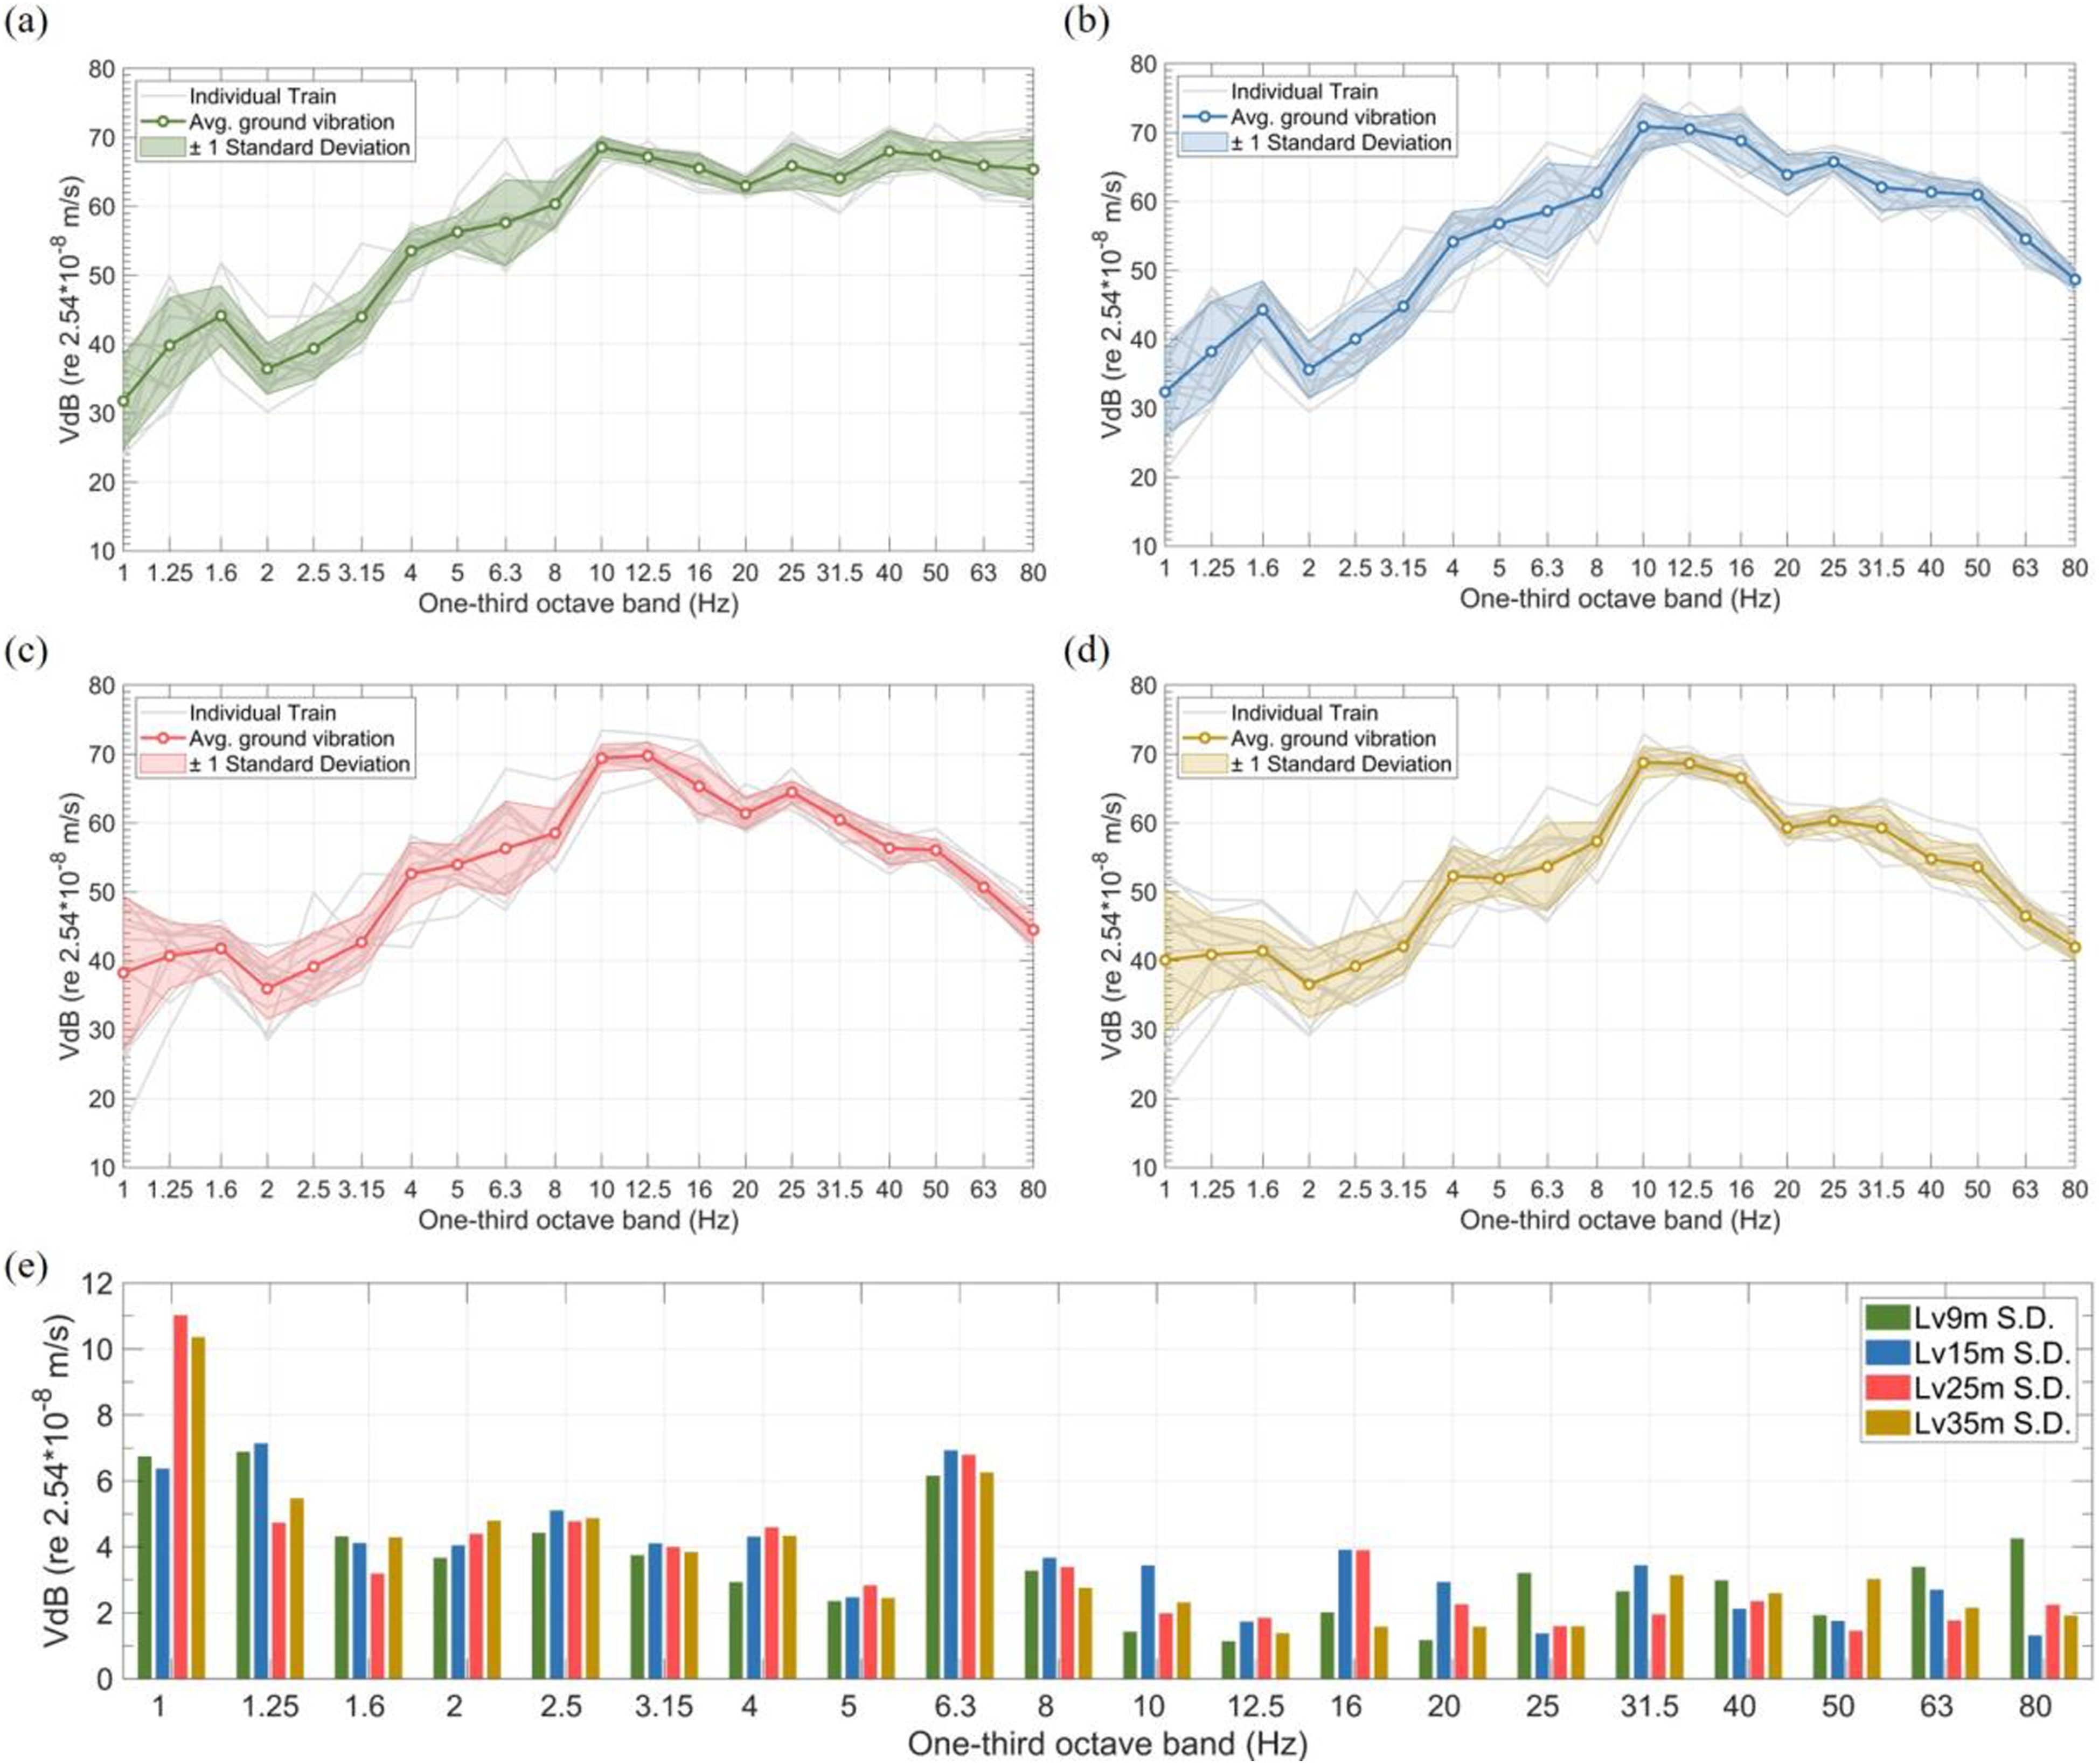
The vertical vibration energy decreased with distance from the track centreline (Figure 7). The energy decay was negligible for frequencies below 4 Hz, moderate for frequencies between 4 and 31.5 Hz, and significant for frequencies above 31.5 Hz, particularly between 9 and 15 m from the track centreline. The spectrum of train-induced vibrations and the energy decay pattern depend on the ground composition, 25 and the observations of the present study were consistent with the pattern of vibration energy decay on soft ground. Nevertheless, the spectrum decay rates corresponding to different soil compositions should be further investigated in the future.
FDL and LSTM
Determining LSTM by dropping a weight on ballast track sleepers
After the train-induced ground vibration level and vibration spectra were obtained through direct measurement, the detailed vibration analysis method of the FTA was applied. The FDL must be derived before this method is used. First, the measured
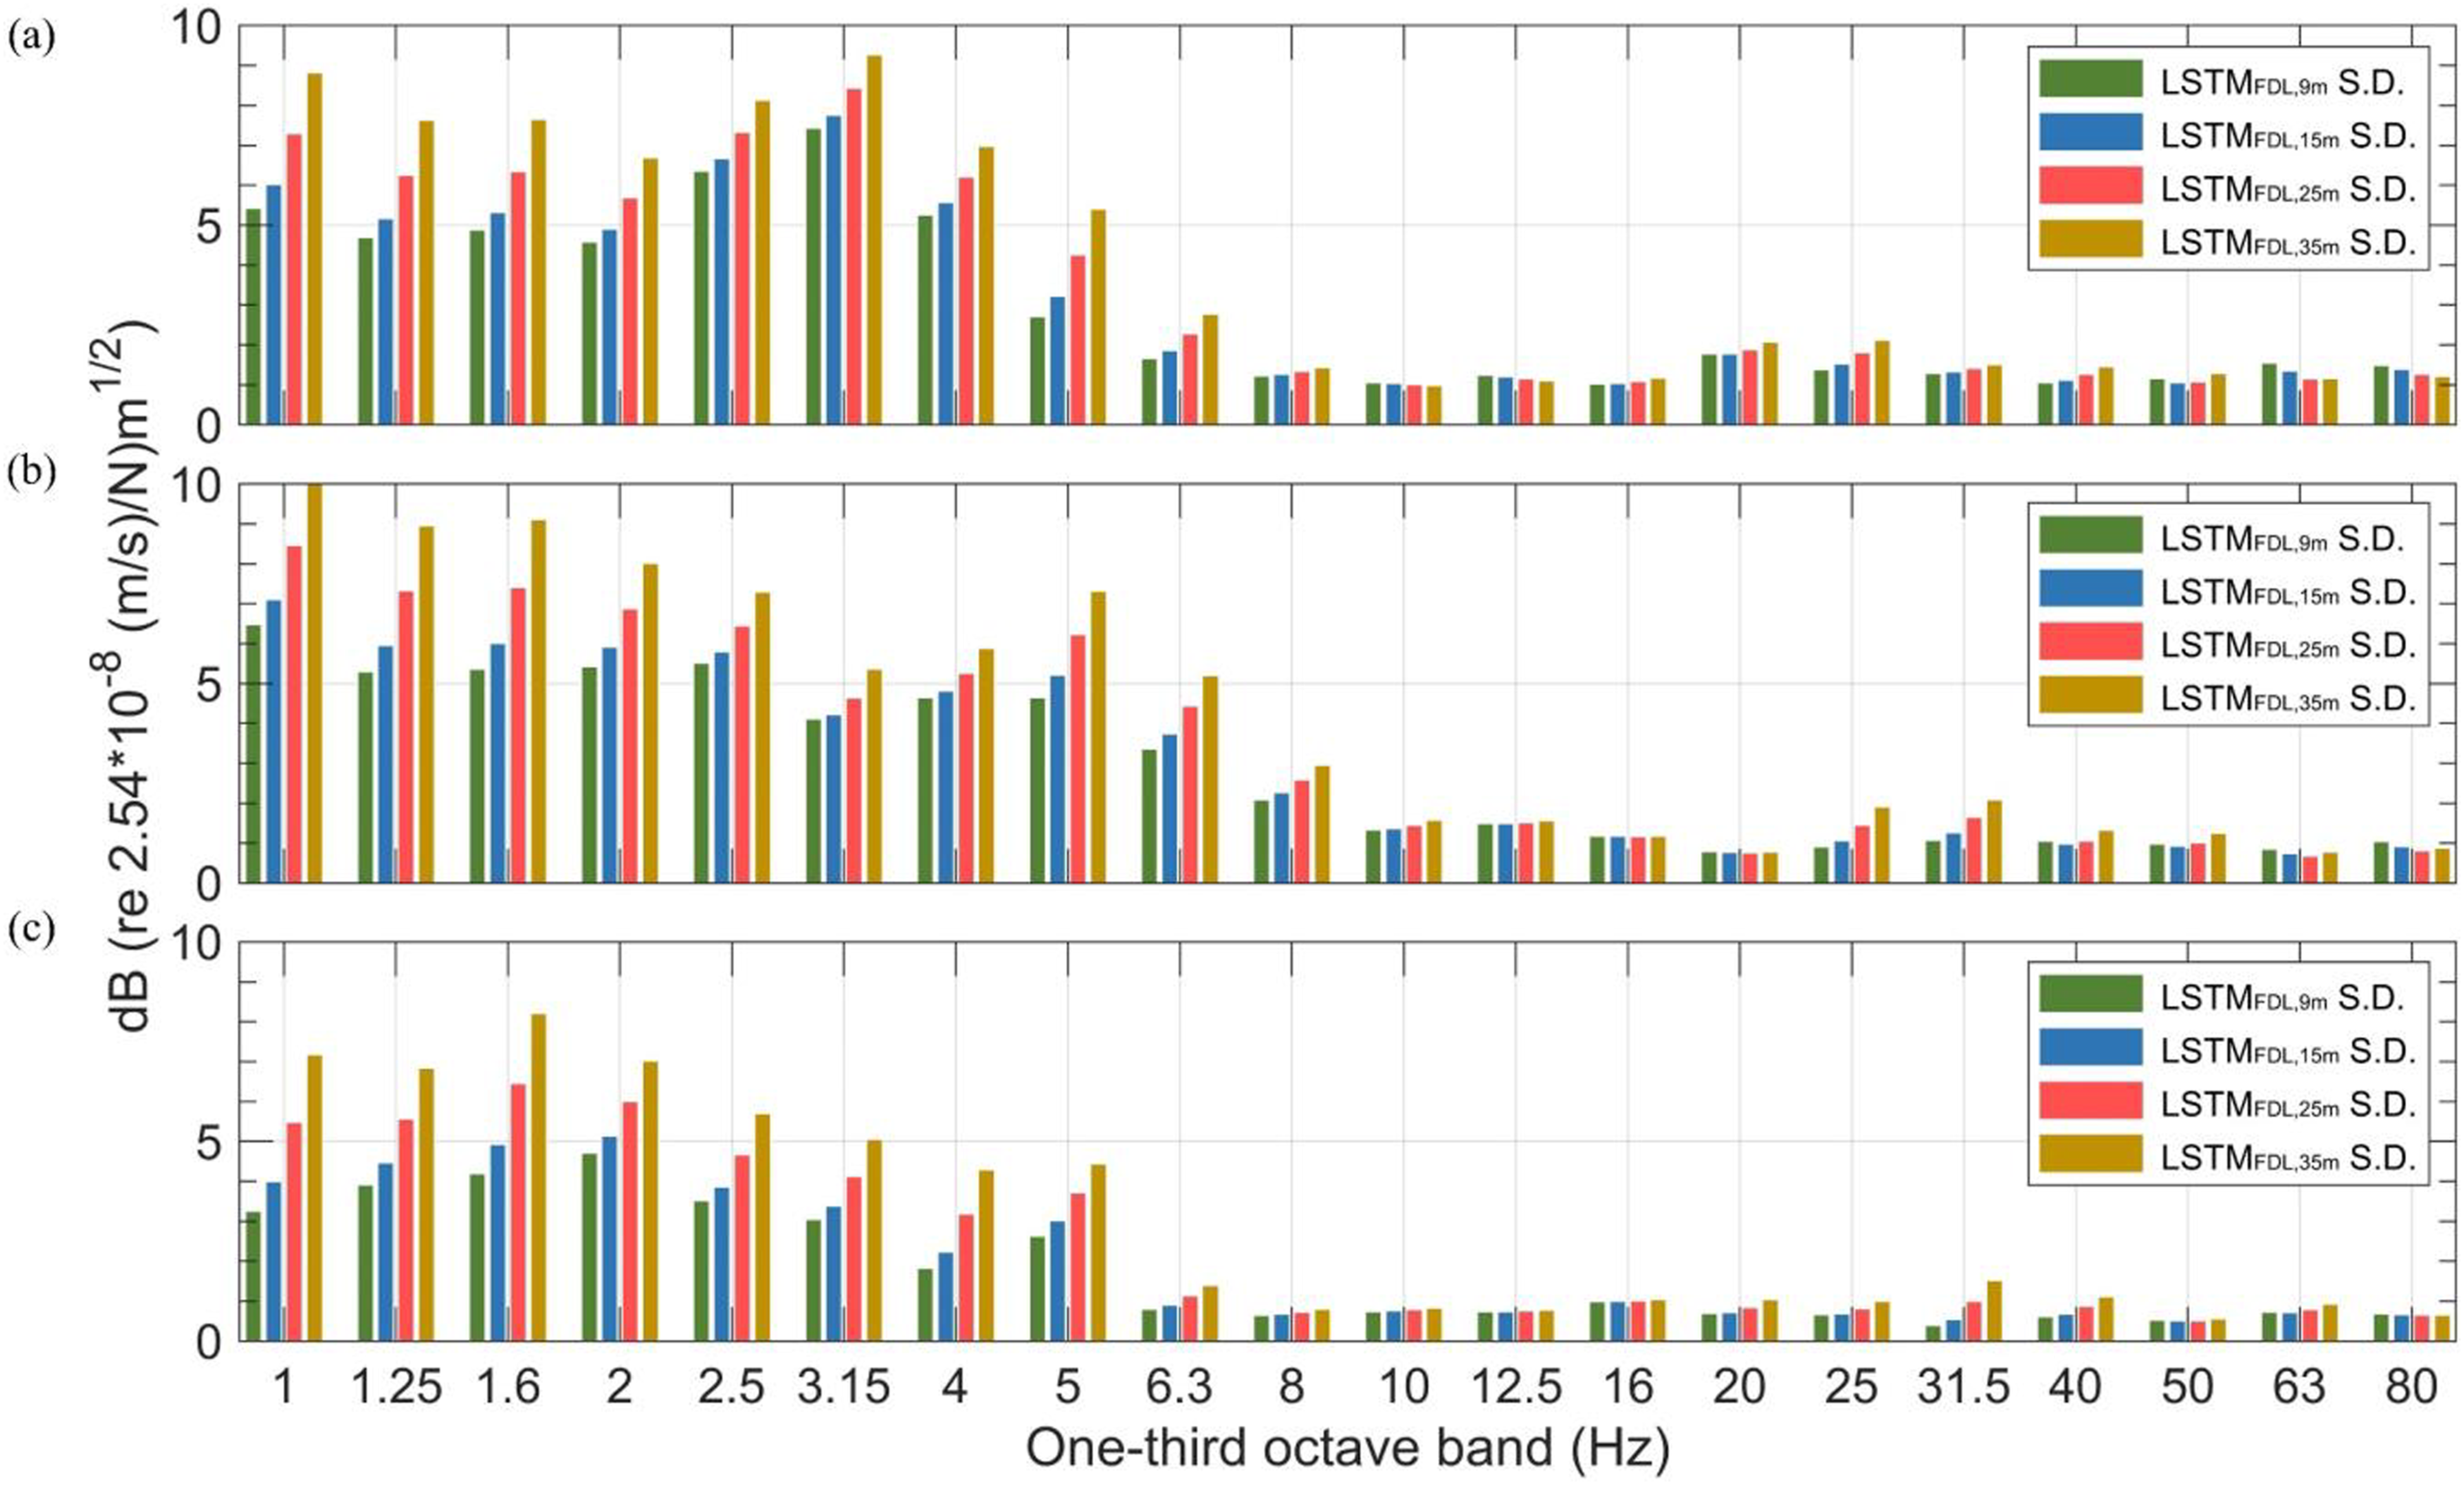
The obtained LSTM obtained through experiments involving the dropping of a weight on ballast track sleepers: LSTM for positions located at (a) 9, (b) 15, (c) 25, and (d) 35 m from the centreline of the near track. Standard deviations of the LSTM obtained through experiments involving the dropping of a weight on ballast track sleepers: (a) first measurement, (b) second measurement, and (3) third measurement.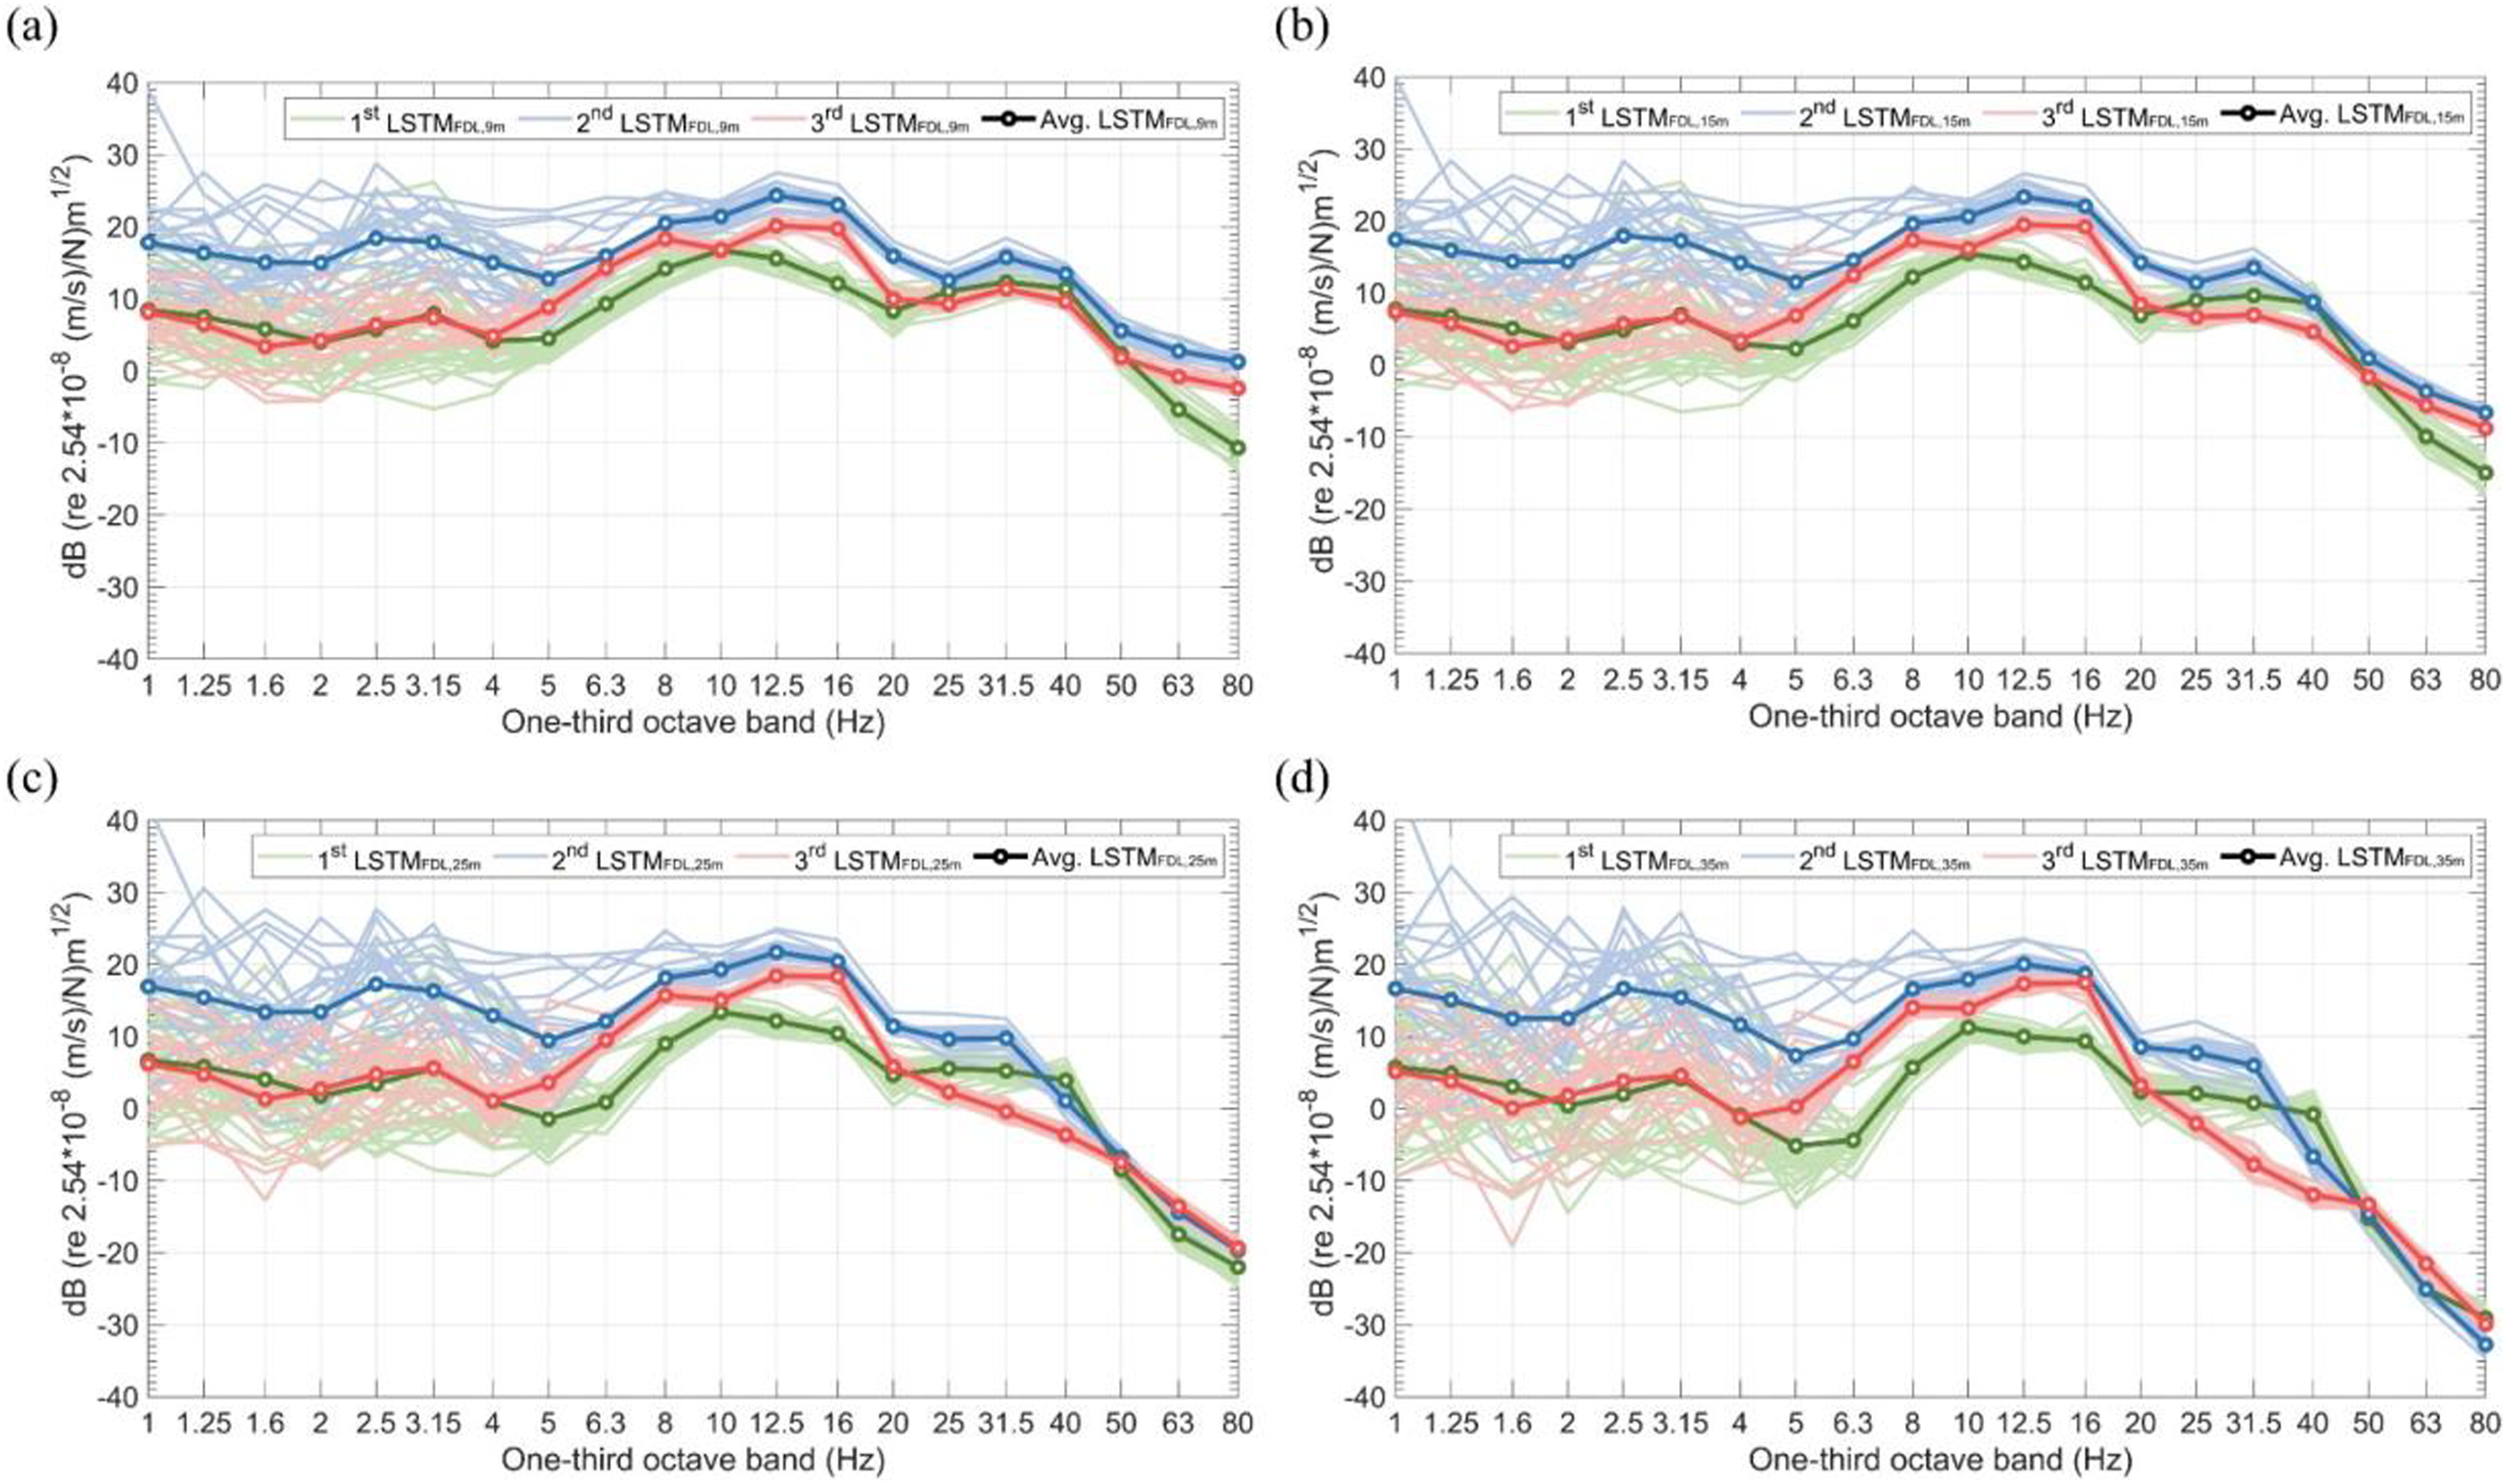
Derivation of FDL
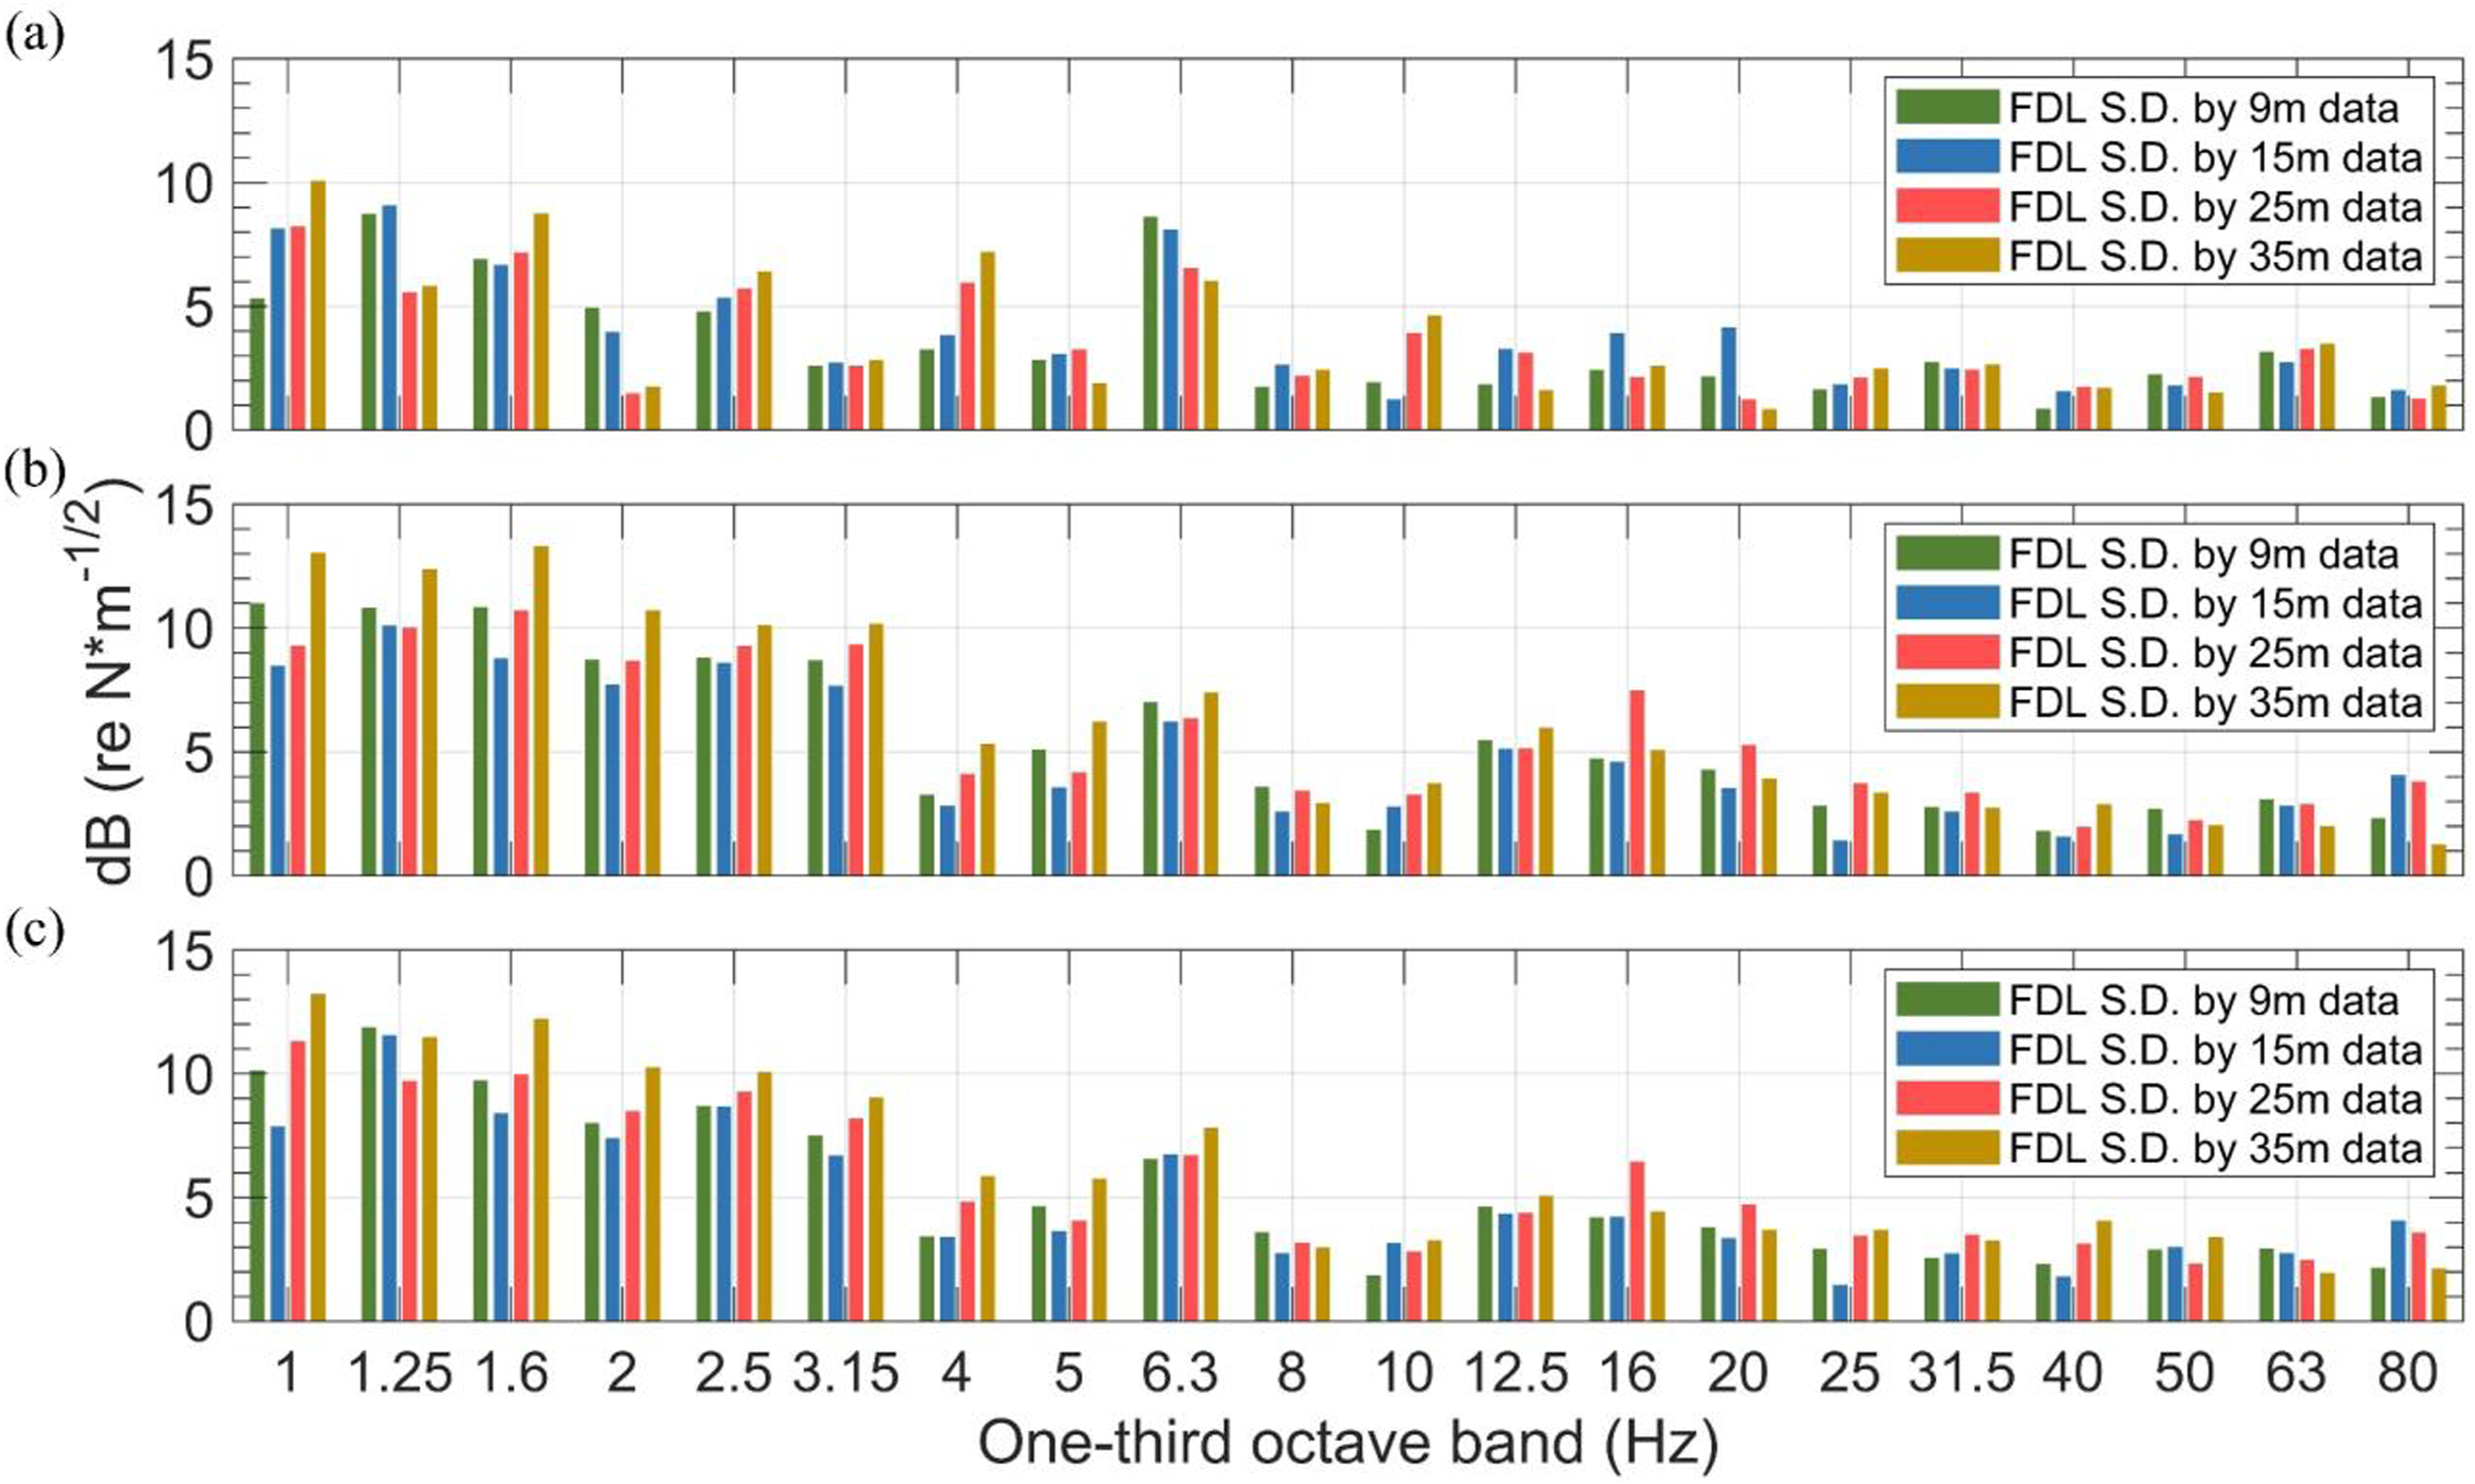
The terms FDL spectra in three experiments each at different locations: (a) first, (b) second, and (c) third experiments. Standard deviations of FDL in three experiments each at different locations: (a) first, (b) second, and (c) third experiments.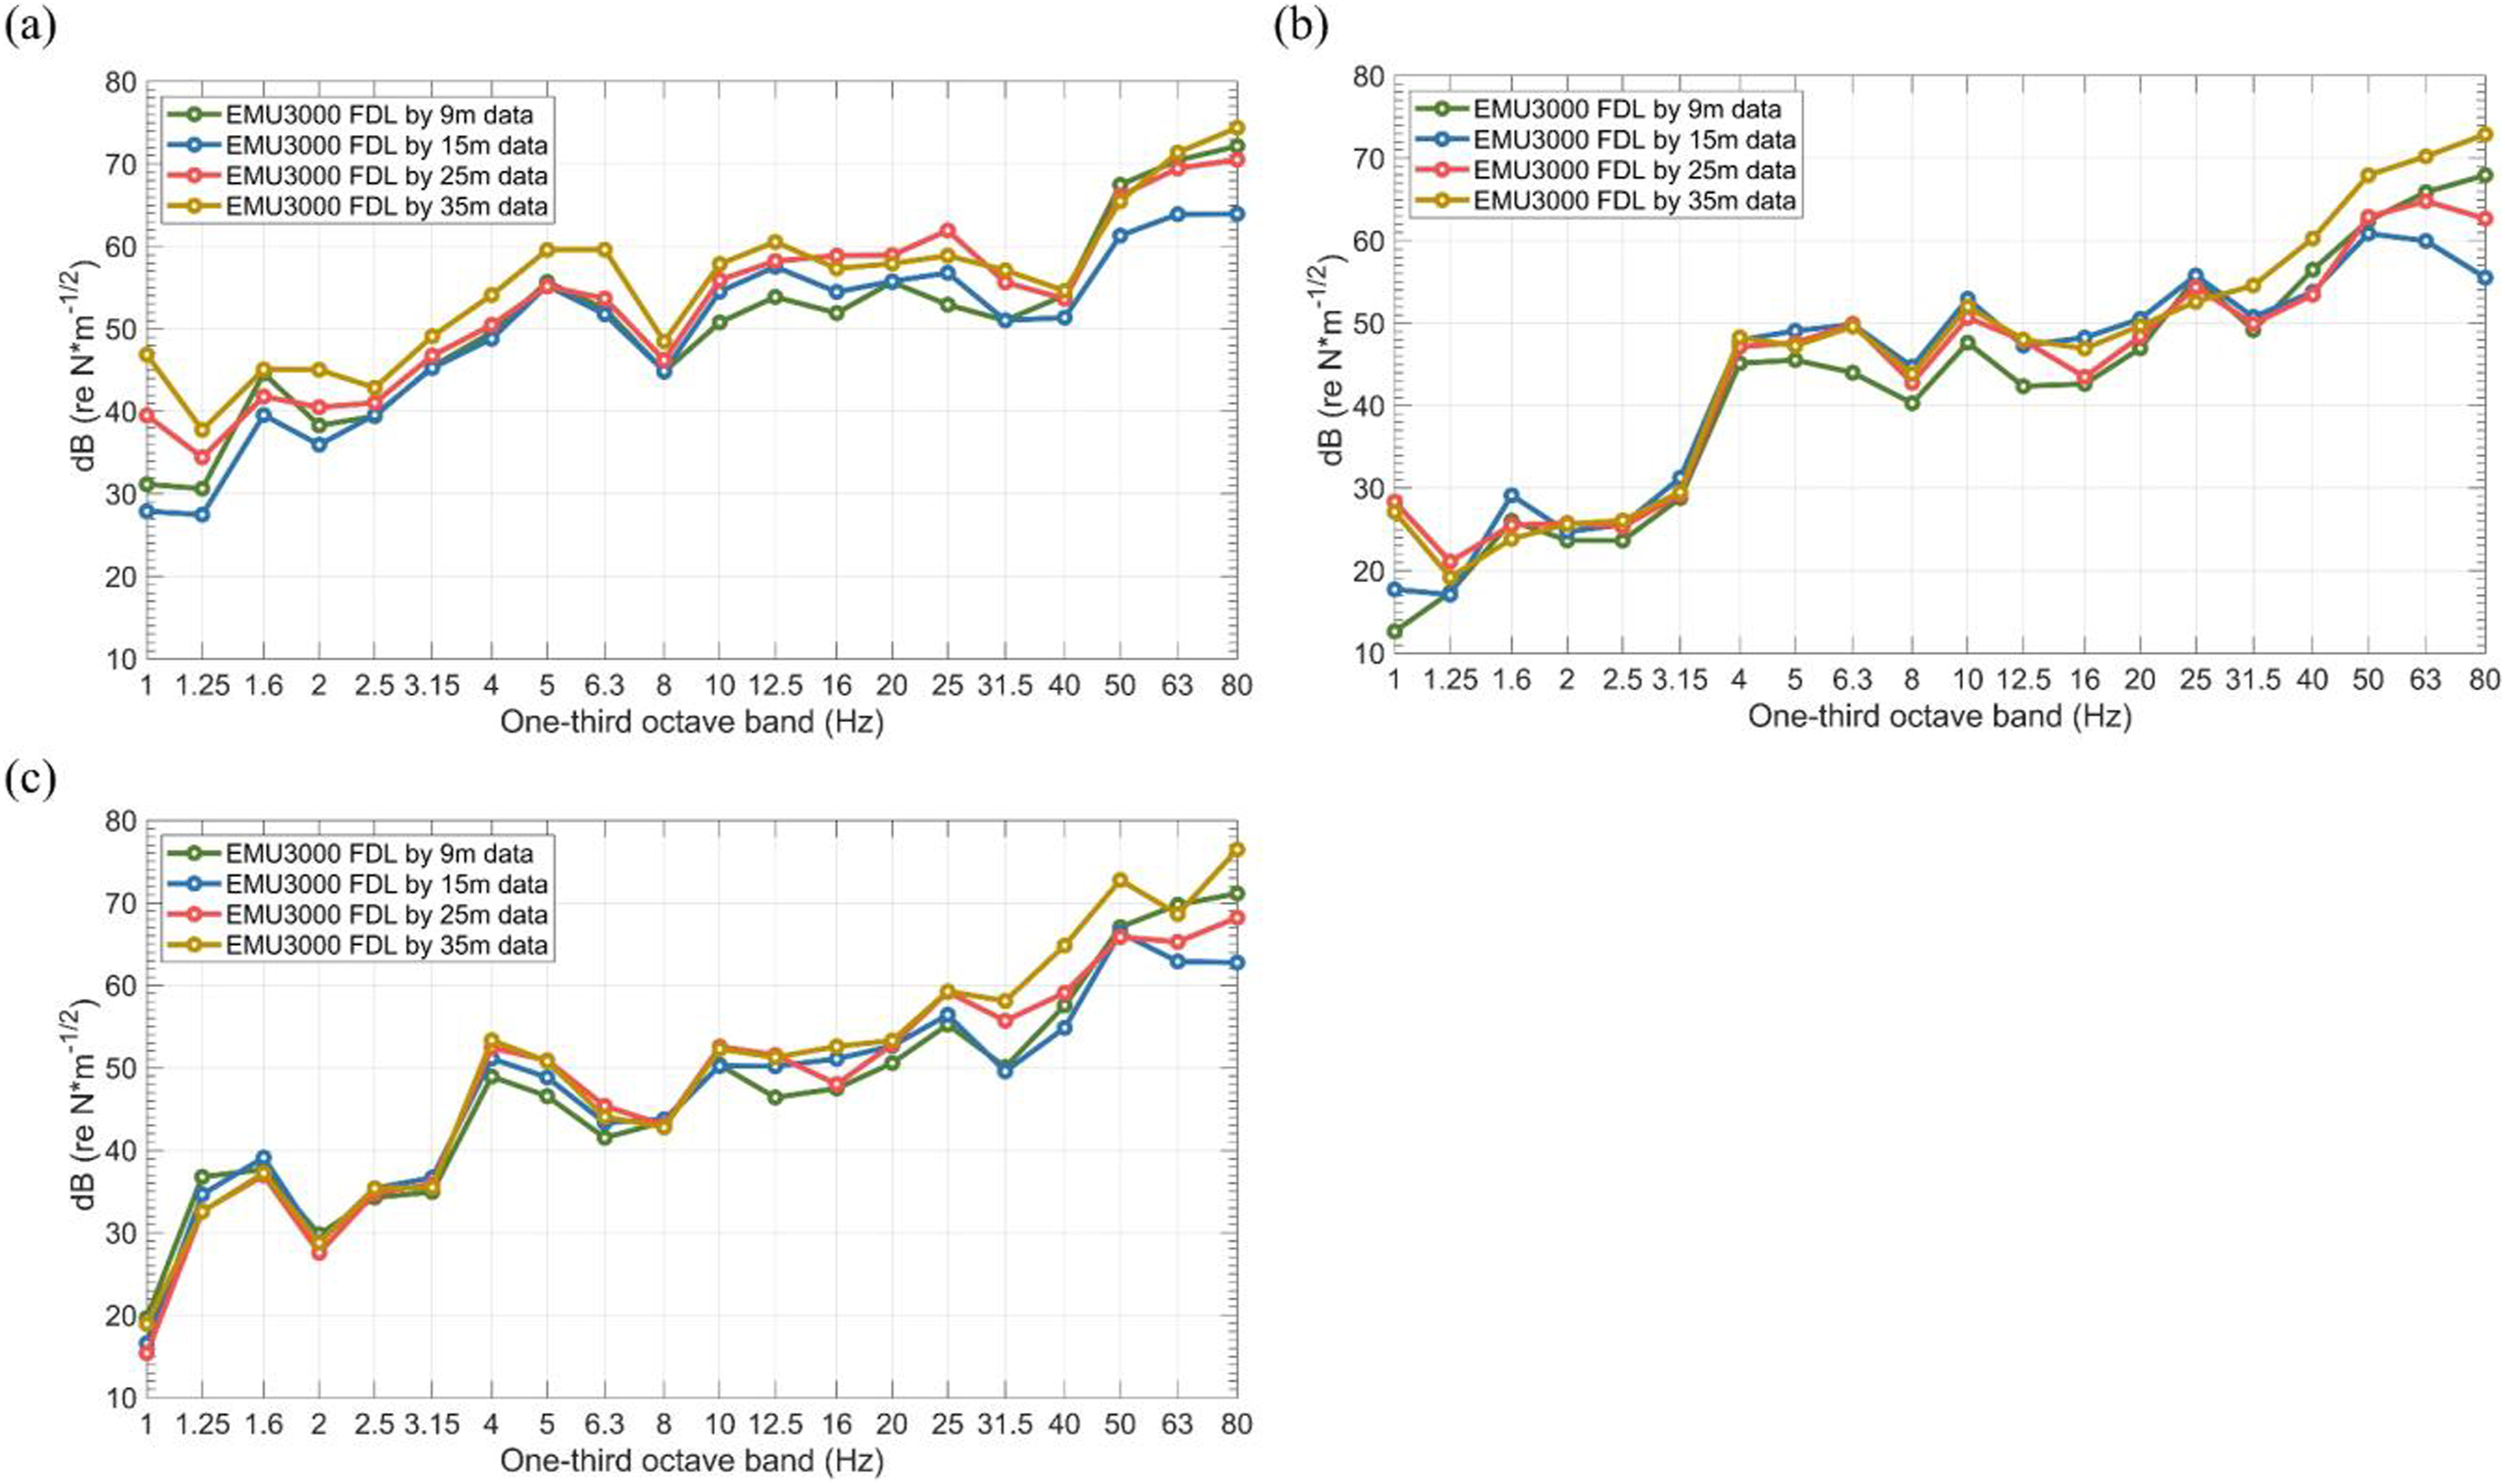
Ground LSTM at the experiment location
The term Ground LSTM spectra: (a) LSTM spectra obtained for each test and (b) standard deviations of LSTM.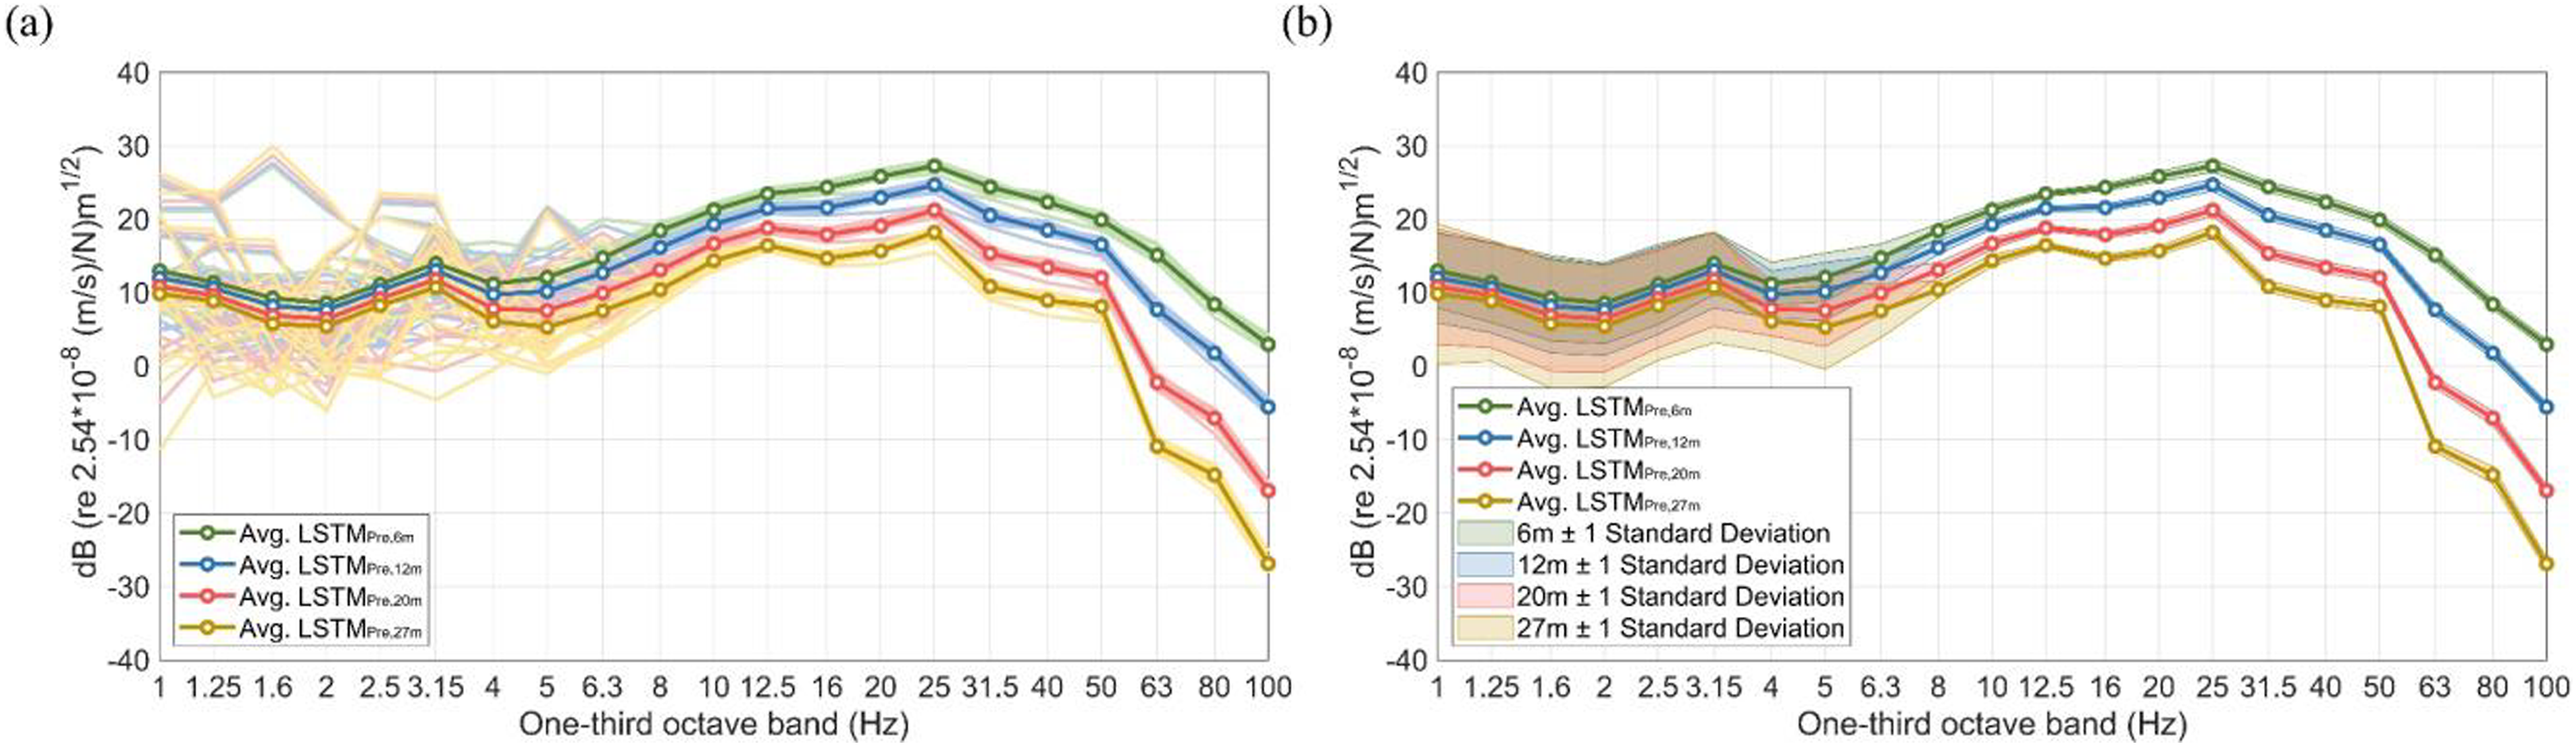
Comparison of prediction and measurement results
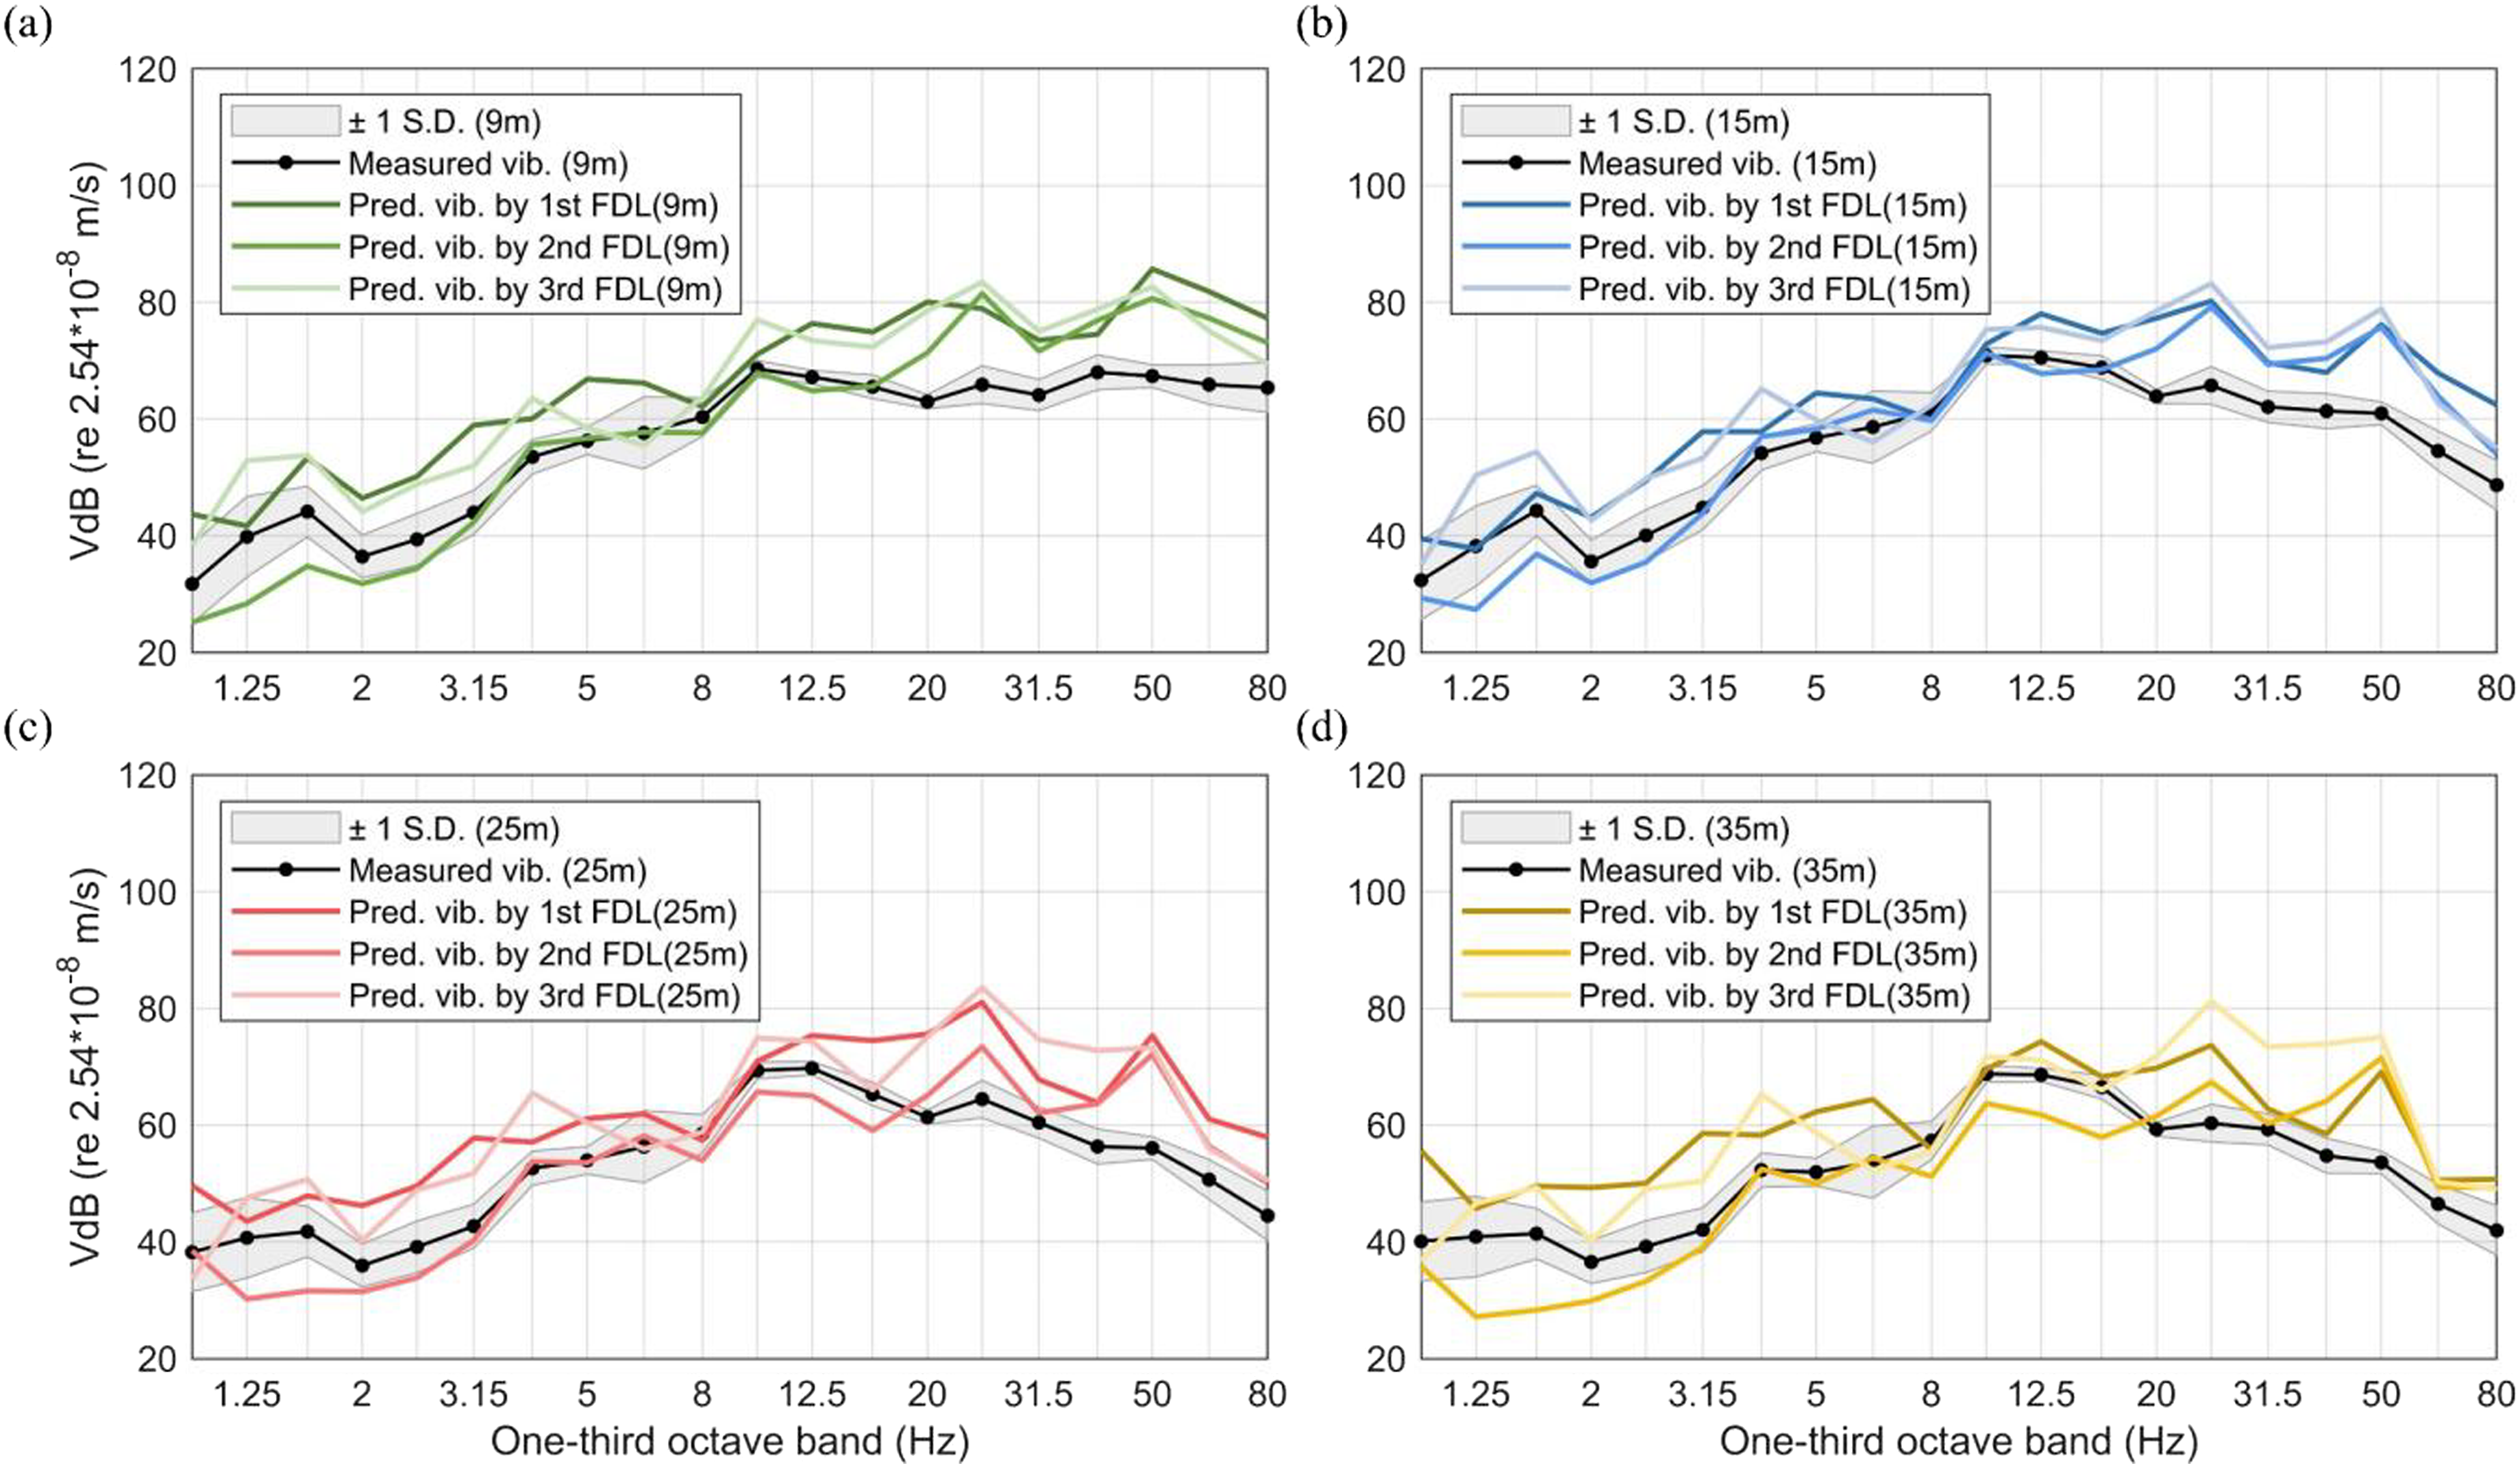
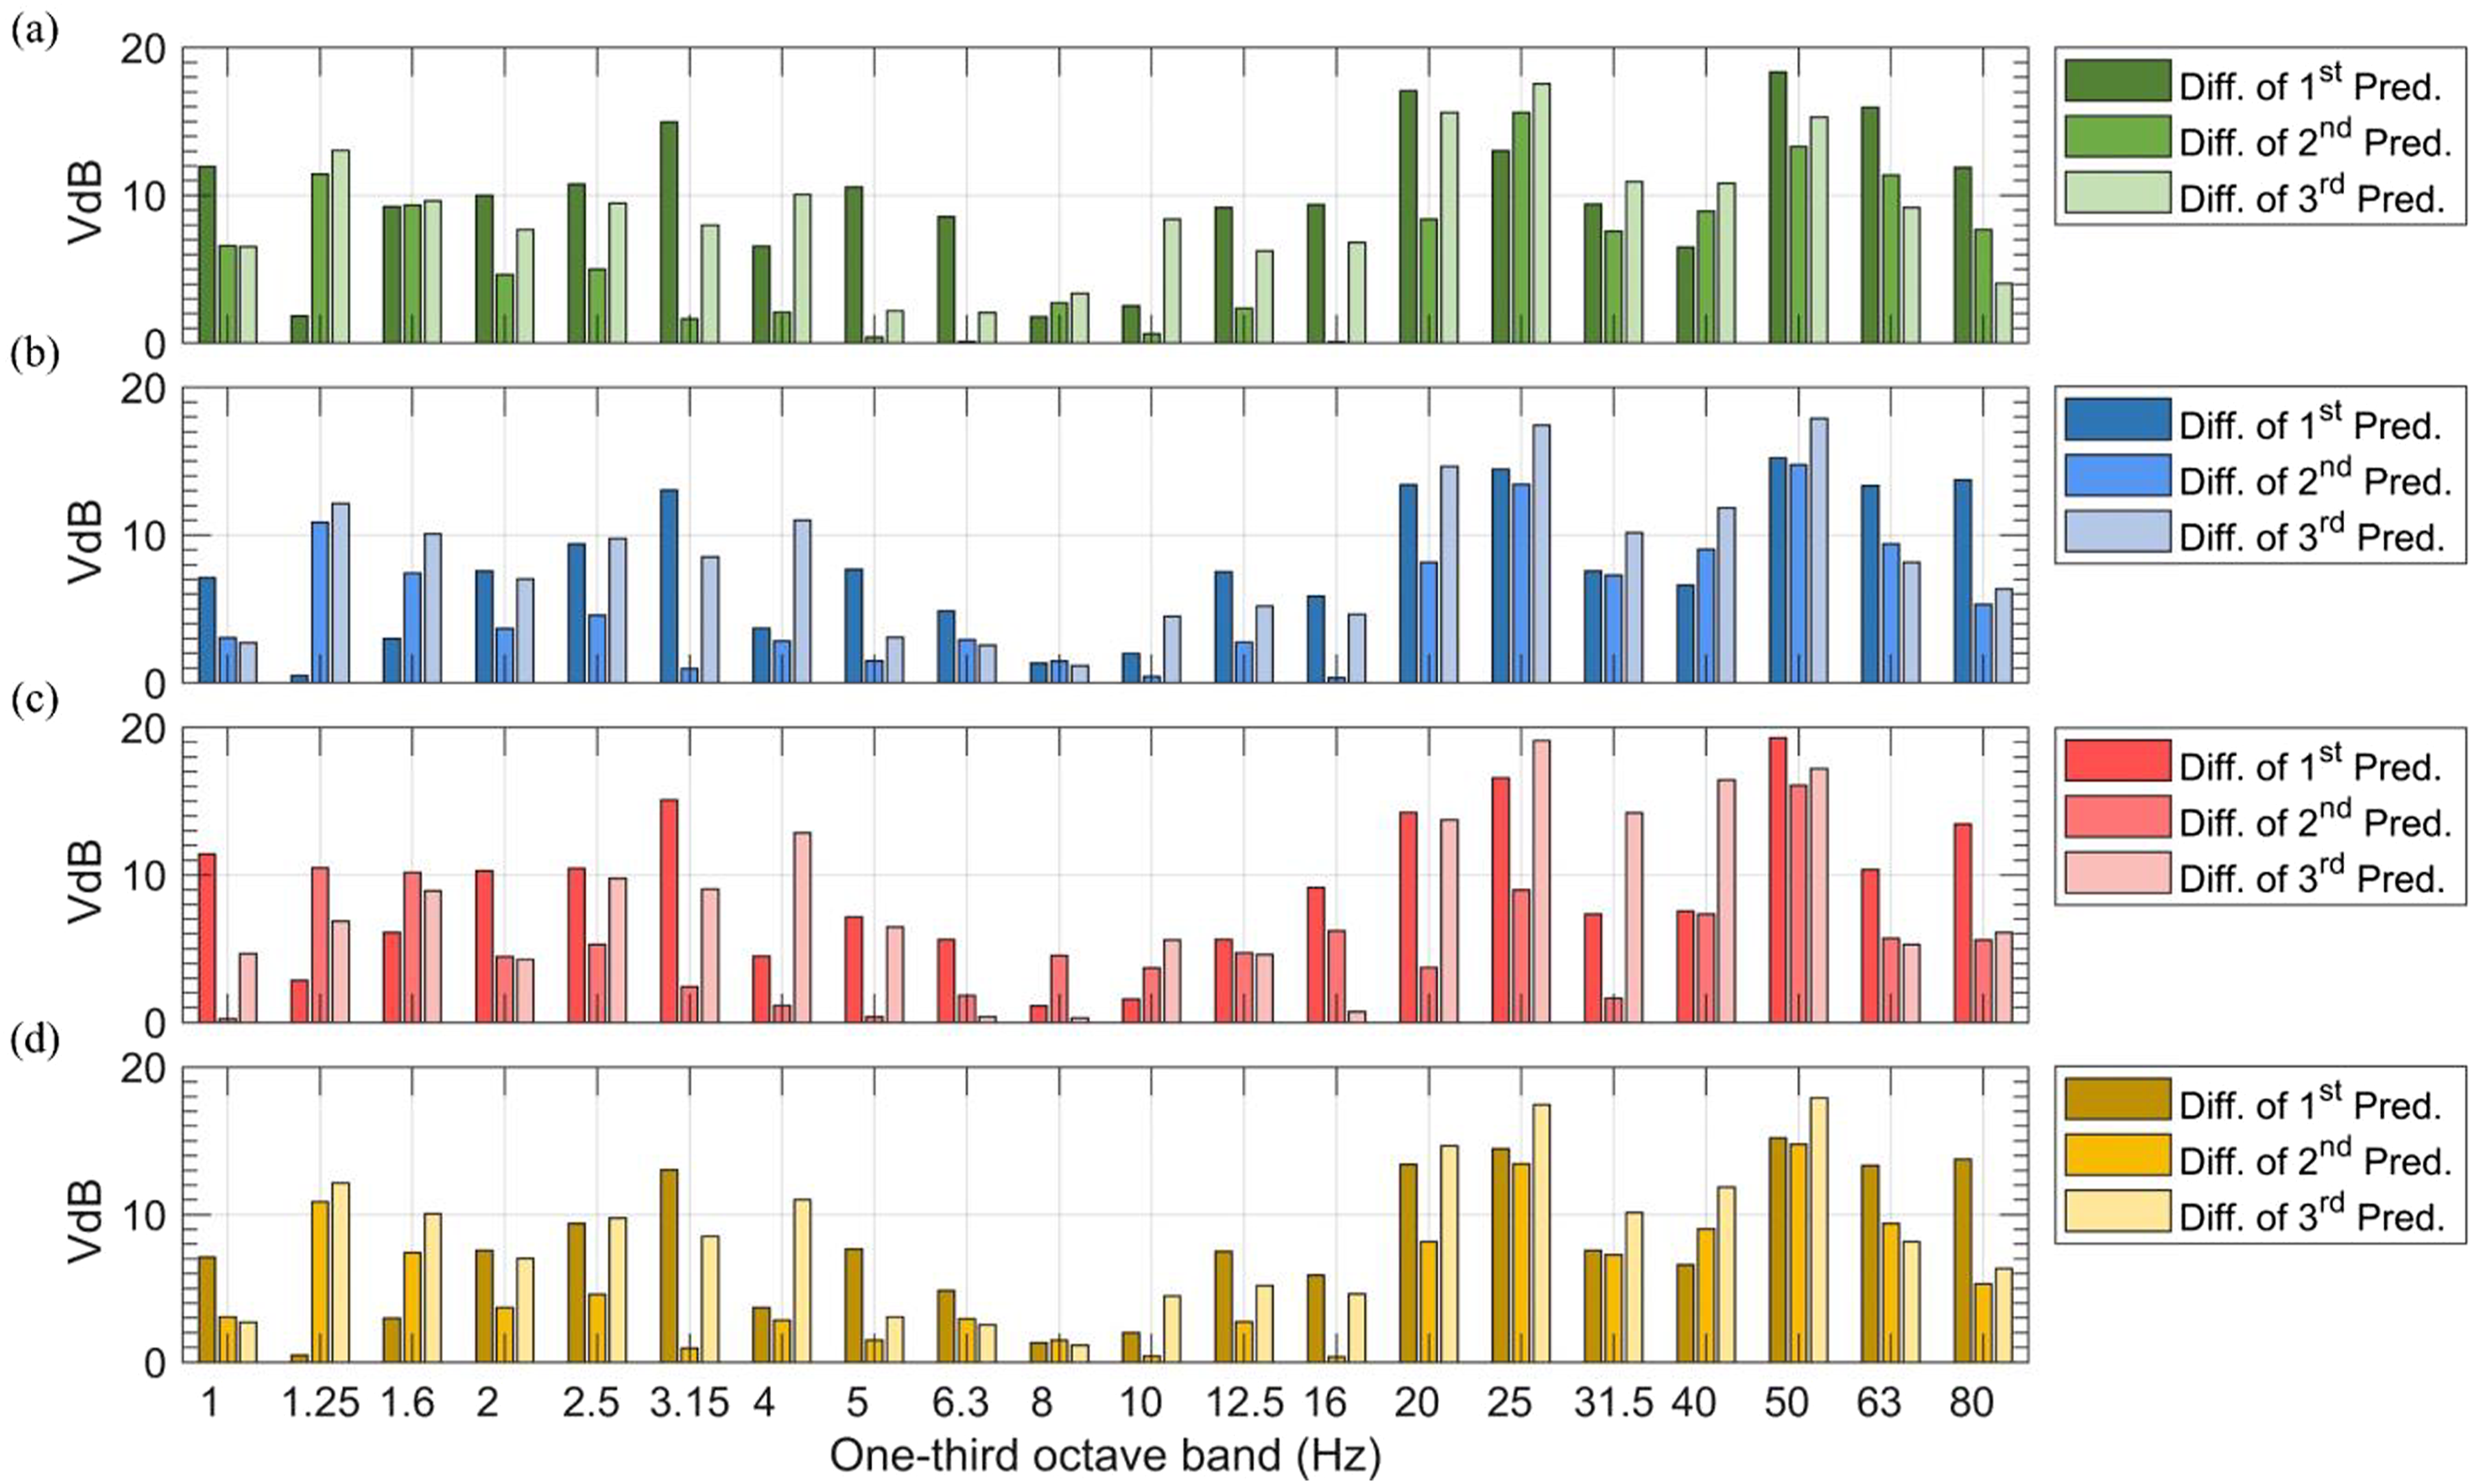
After FDL and Average FDL spectra over three experiments at positions located 9, 15, 25, and 35 m from the centreline of the near track. Comparison of the measured and predicted train-induced vertical vibration levels at different distances from the centreline of the near track: (a) 9, (b) 15, (c) 25, and (d) 35 m from the track centreline. Differences between the predicted and measured train-induced vertical vibration spectra: (a) 9, (b) 15, (c) 25, and (d) 35 m from the centreline of the near track.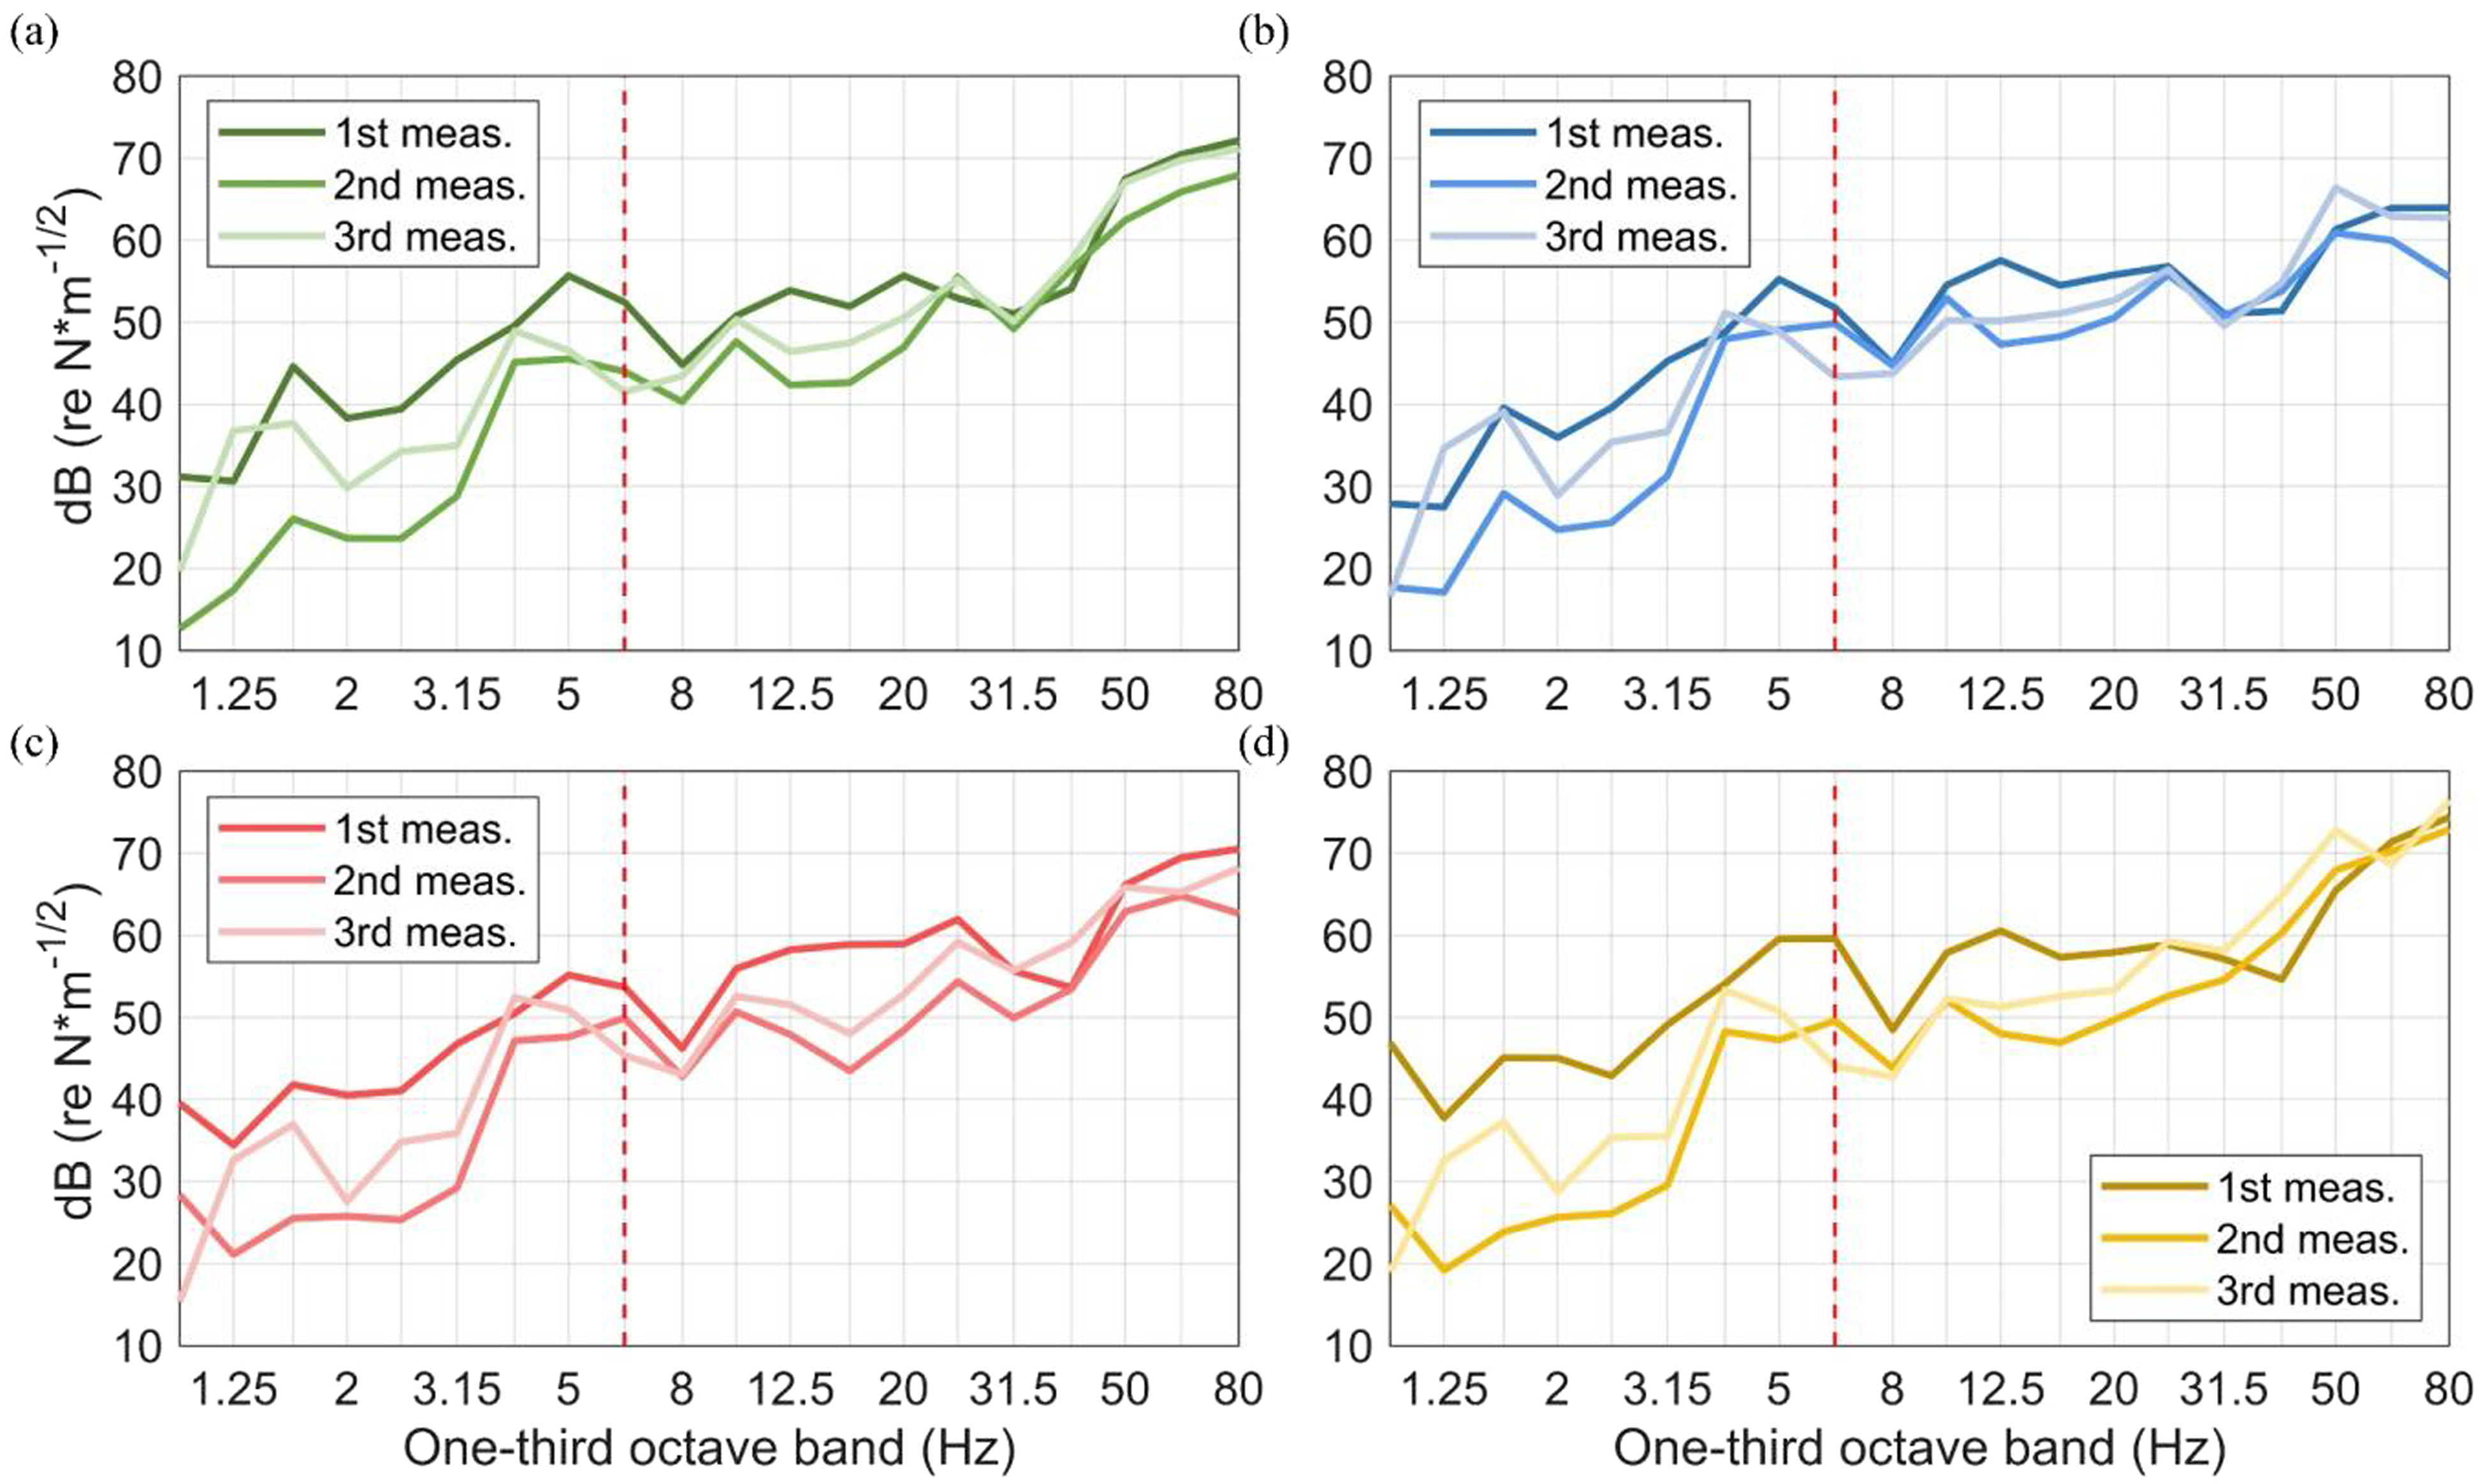
Major parameters influencing the vibration predictions
At-grade track vibration propagation and validation of general vibration assessment
A comparison of Figures 5(a) and (b) indicated that the vibration level did not strictly correspond to the distance from the centreline of the tracks. The distinction between the near and far tracks also influences the train-induced vibration trend. Figure 16 depicts the train-induced vibrations (combining vertical and longitudinal directions) at different distances from the near and far tracks under different train speeds. It is evident, that the vibration level of the near track (circular dots in Figure 16) was higher than that of the far track (square dots in Figure 16), even when the distance from the centreline of the near track was greater than that from the centreline of the far track. Therefore, the general vibration assessment method proposed by the FTA represented by equations (5), and (6) will need to be optimised when applied to multiple-track system. Equation (5) is the locomotive-powered passenger curve (L-curve), and equation (6) is the rapid transit/light rail vehicle curve (R-curve). These curves provide the following relationships between distance from the track centreline and vibration level Comparison of general vibration assessment and train-induced vibration levels at different distances from the near and far tracks under different train speeds.

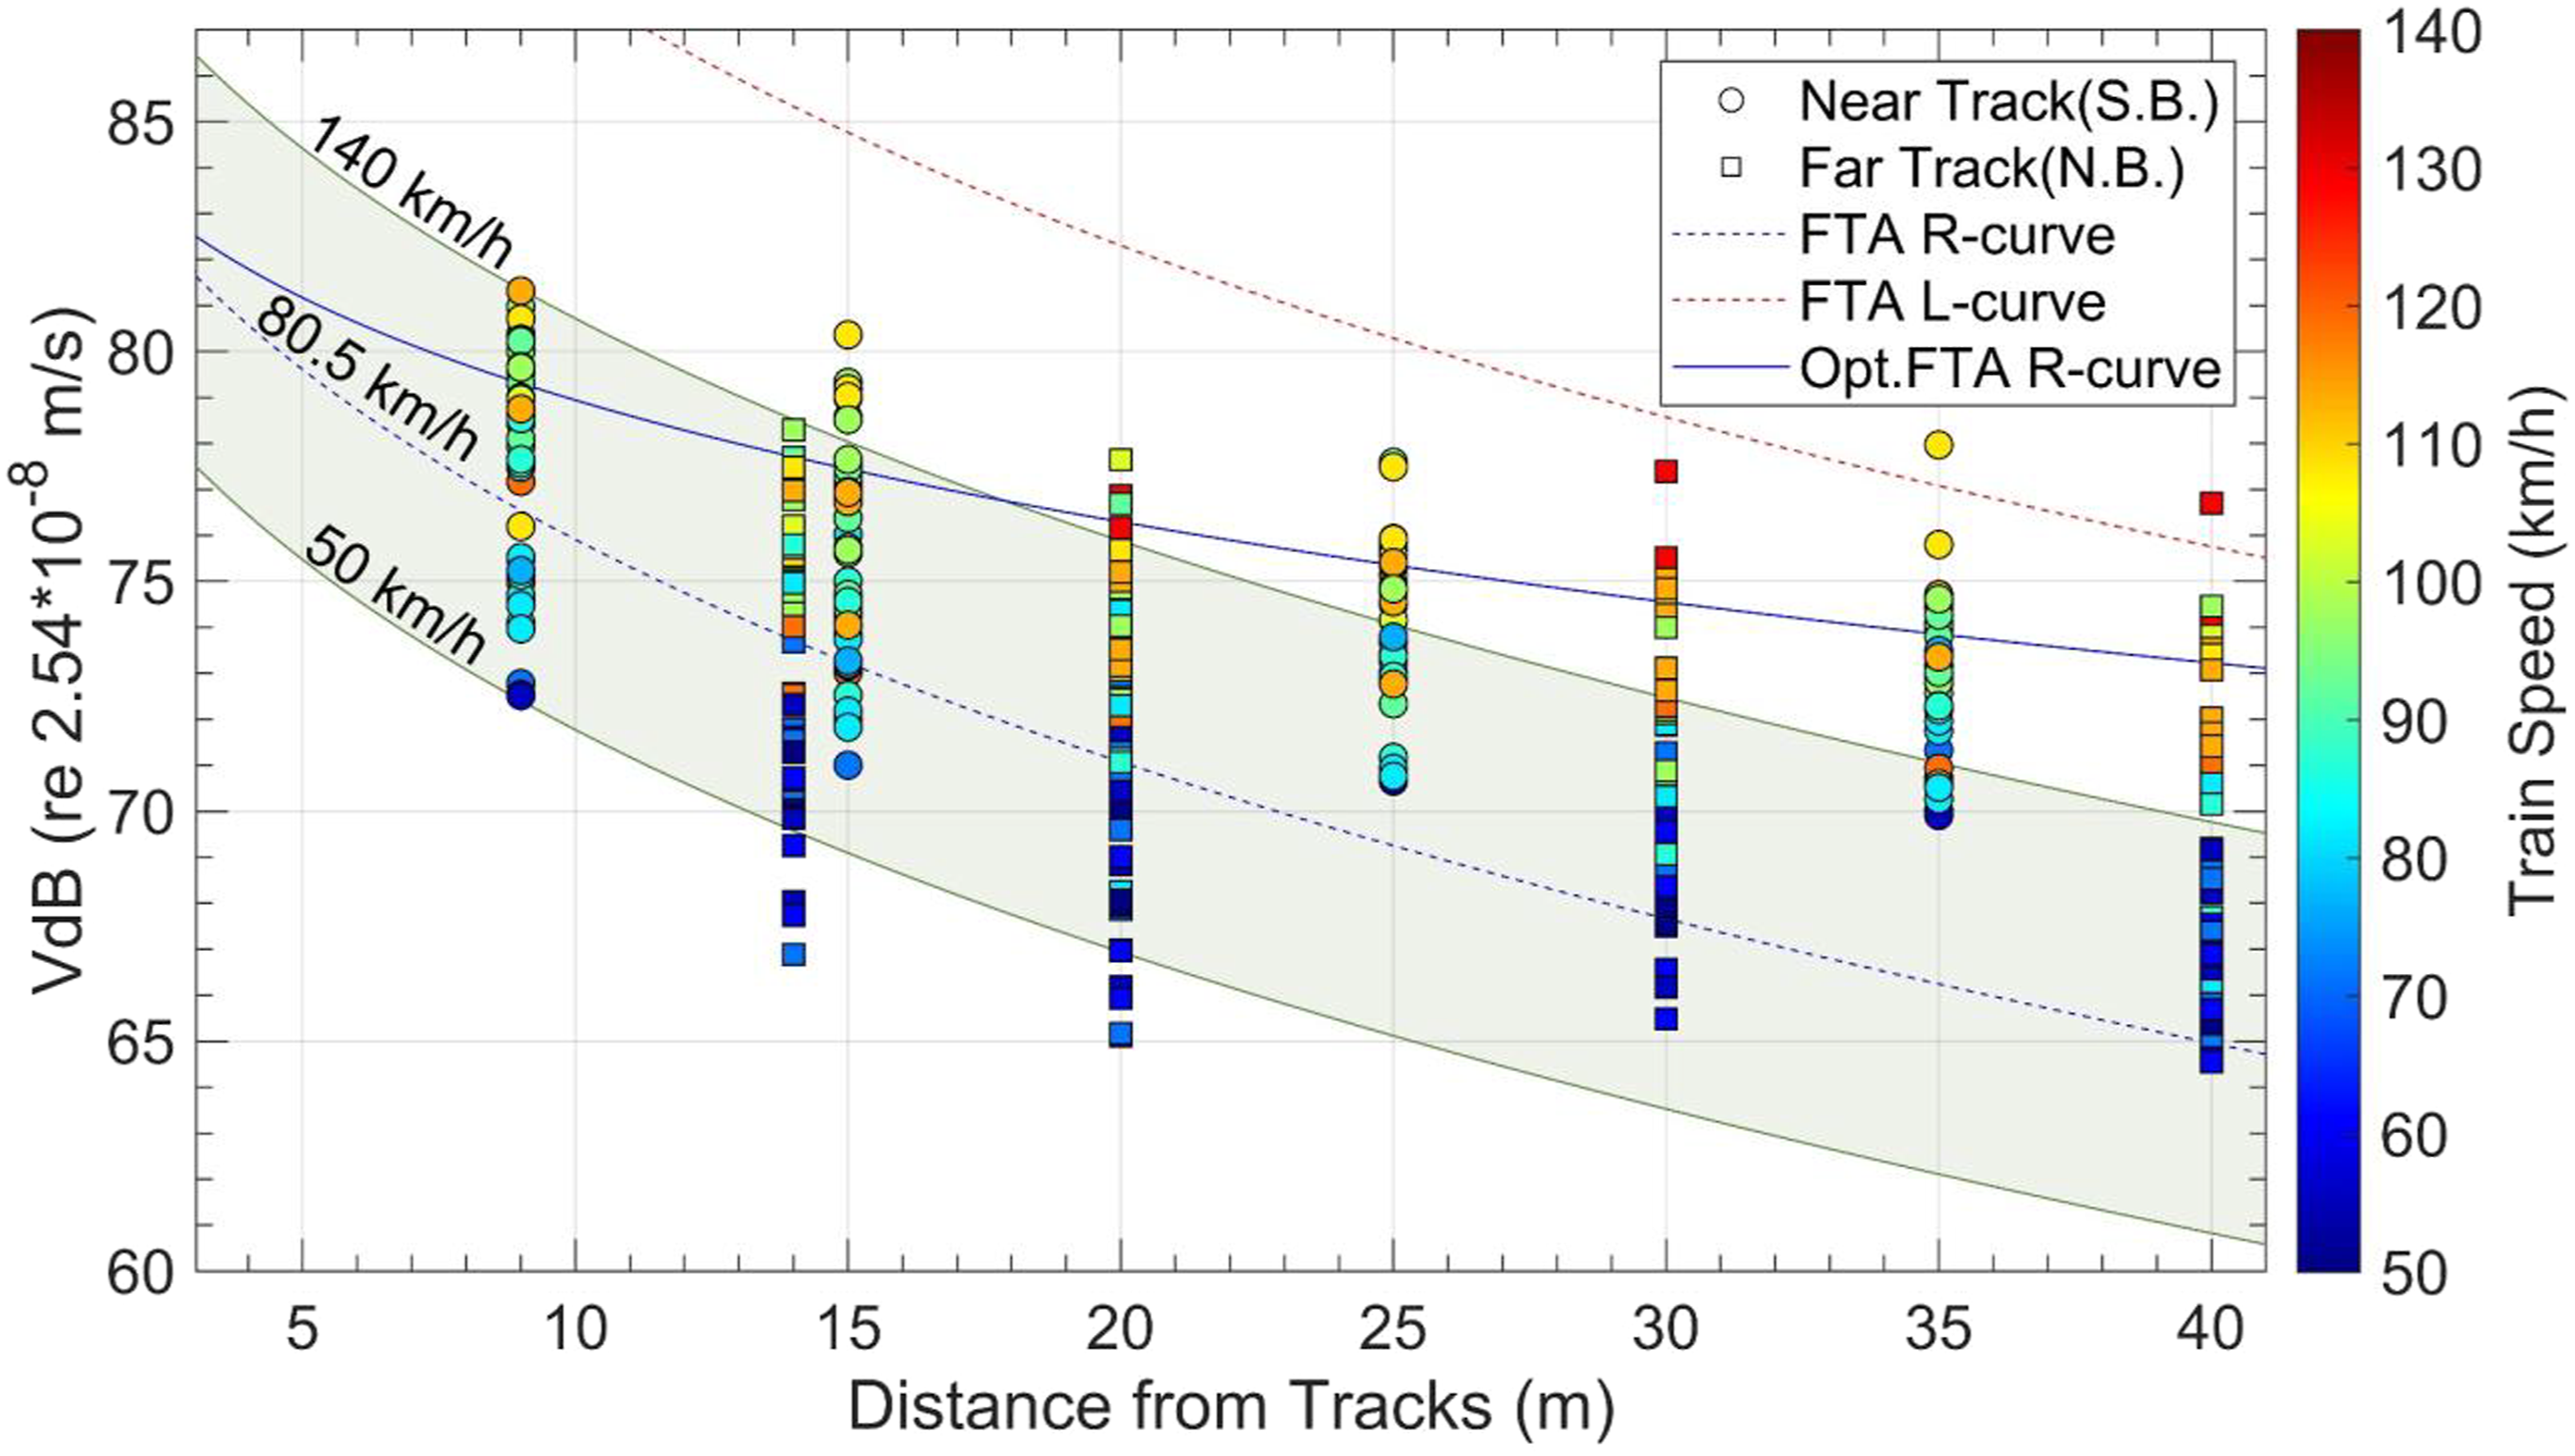
The aforementioned curves, based on a reference train speed of 80.5 km/h (50 mph), were adjusted for a train speed of 50 and 140 km/h by using equation (4). Figure 16 shows the vibration levels obtained through the general vibration assessment method were different from the measured levels, which is similar to the results obtained in Ref. 2. Among the two curves, the R-curve was closer to the measured results of the far track but was unconservative for the near track of this measurement site. Consequently, the solid blue line in represents the optimised curve for the near track vibration levels Comparison of train-induced vibration frequency bands between the near track and far track (a) vertical direction at 9/14 m (b) longitudinal direction at 9/14 m (c) vertical direction at 15/20 m (d) longitudinal direction at 15/20 m.
Frequency propagation contour plot
The detailed vibration analysis method of the FTA requires the FDL and Frequency propagation contour plot.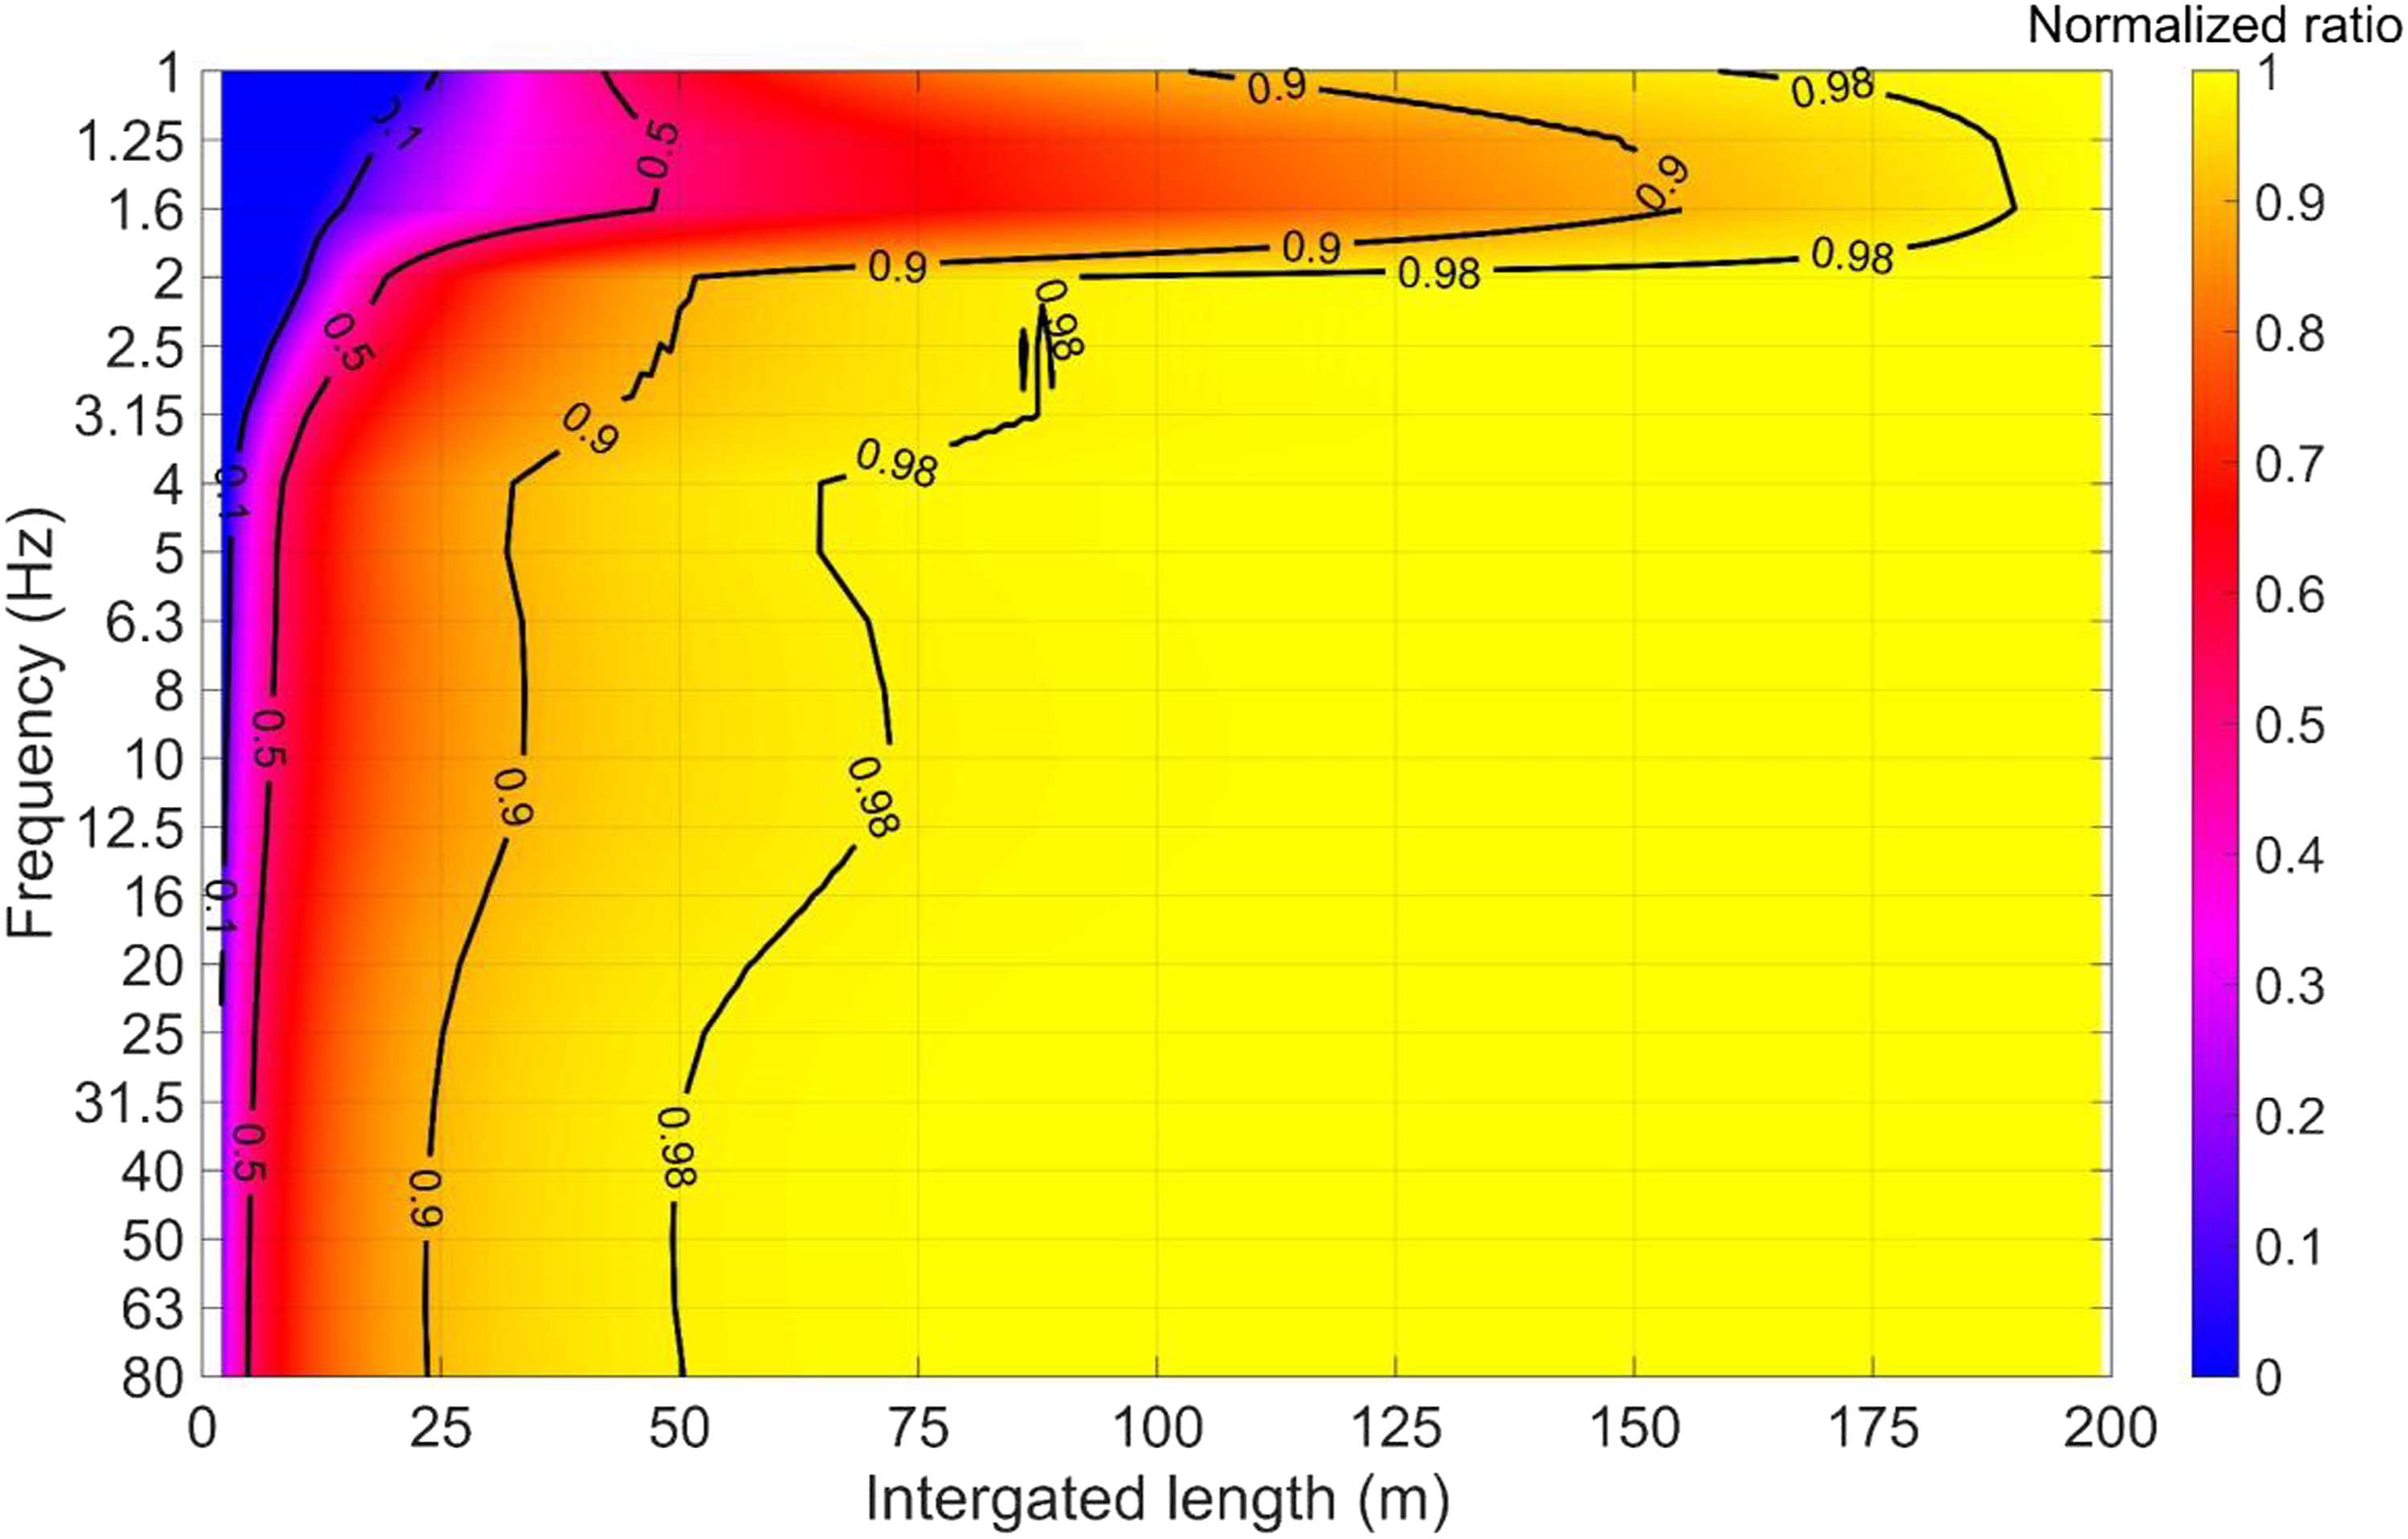
Furthermore, Figure 18 offers insights into the influence of integration length. For instance, when the train length was less than 80 m, the vibration energy showed significant sensitivity to variations in train length. Conversely, for longer train lengths, energy propagation tended to converge, indicating reduced sensitivity of vibration energy to train length. These observations align with the results in Figure 6, which demonstrate that train length did not correlate positively with vibration intensity for trains with more than four-car. To further confirm the impact of train length on vibration energy propagation, Figures 19(a)–(c) present in-situ data of train-induced vertical vibrations, including short-time Fourier transform spectrum and vertical vibration history data for 12-car express train (EMU3000), eight-car tilting train (TEMU2000), and four-car commuter train (EMU500), respectively. In these figures, the red lines denote the arrival and departure times of the first and last axles at the measurement line, whereas the grey lines indicate the time 2 s before and after axle passage. Figure 19 confirms that the train-induced vibrations dissipated to an undetectable level 2 s before and after each train passed, which are approximately 54.5, 60.1, and 49.2 m away from the measurement line. Short-time Fourier transform spectrum and vertical vibration history data for (a) an EMU3000 12-car express train, (b) a TEMU2000 eight-car tilting train, and (c) an EMU500 four-car commuter train.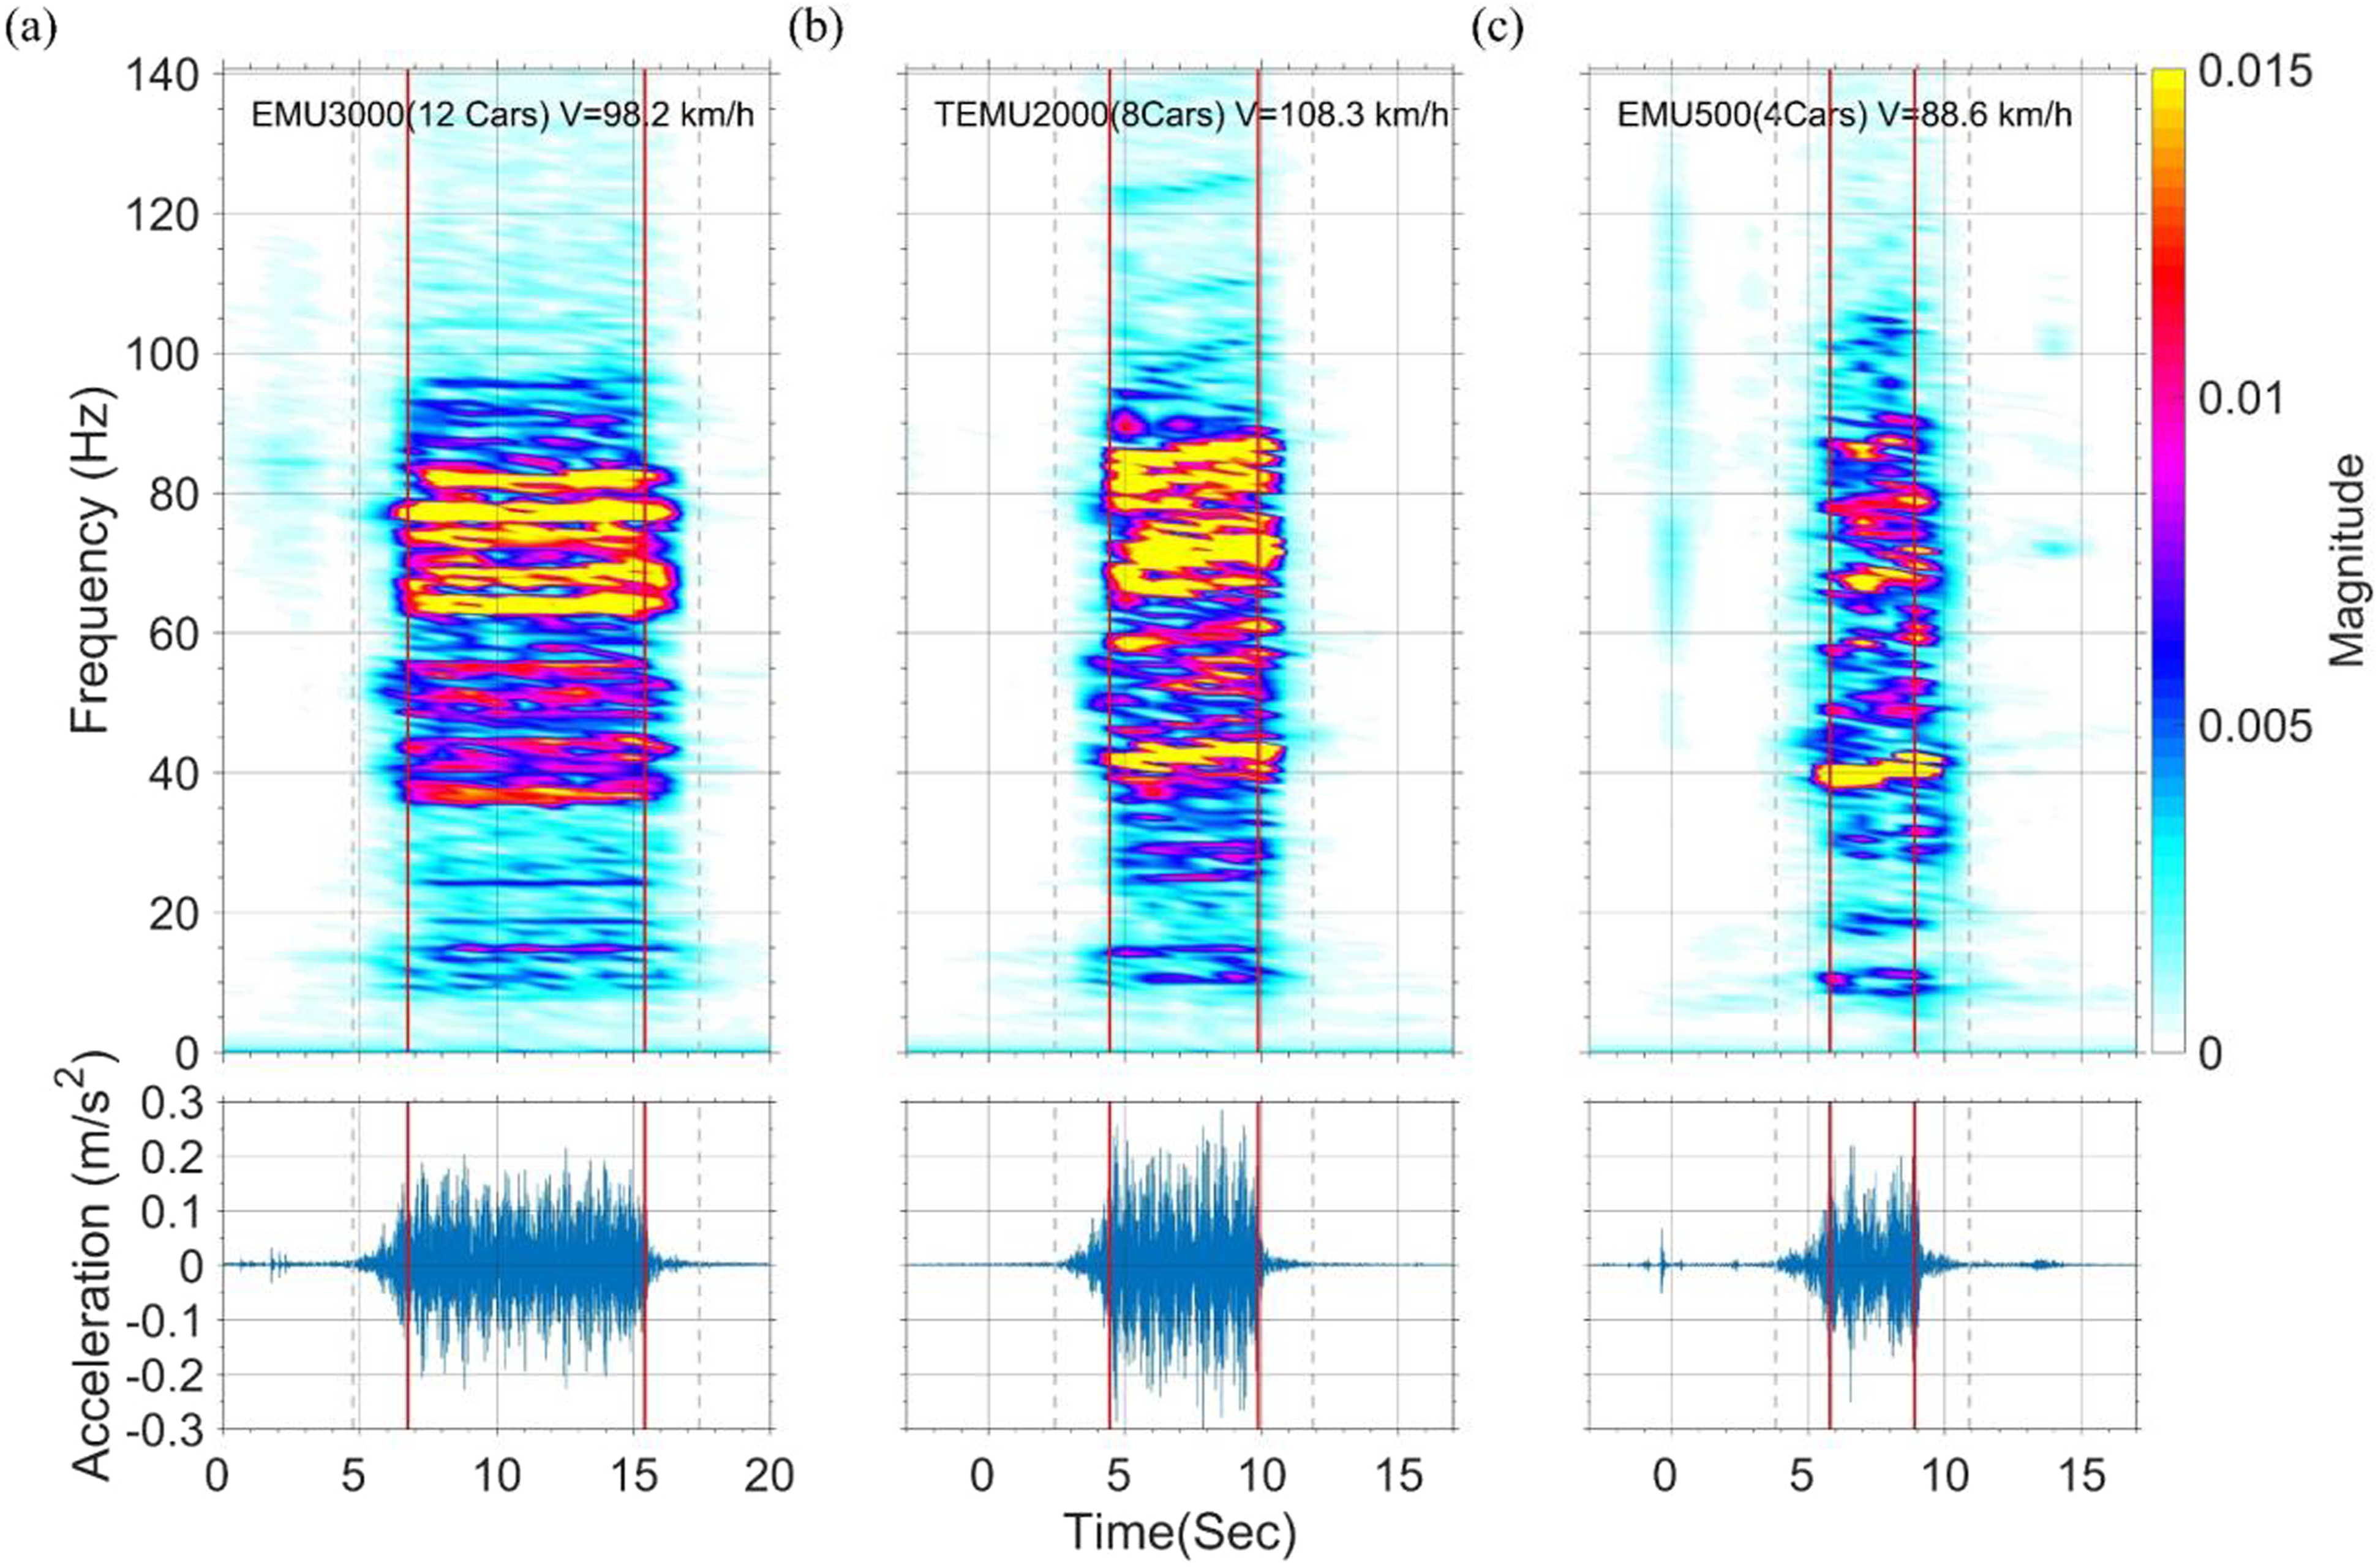
Comparison of predicted and measured train-induced vibration levels
Figure 20(a) displays the measured and predicted train-induced vibration levels at various distances from the centreline of the near track. Under a train speed of approximately 100 km/h, the attenuation in the vertical vibration level with the distance from the centreline of the near track was minimal at low vibration frequencies. The predicted ground vibration levels, which were obtained from the average FDL spectra obtained from three experiments, exhibited larger attenuation with distance than the measured ground vibration levels. This discrepancy is primarily due to the standard deviation of the FDL. The variation in the FDL was influenced by Comparison of the measured and predicted train-induced vibrations: (a) vibration spectrum comparison and (b) vibration level comparison.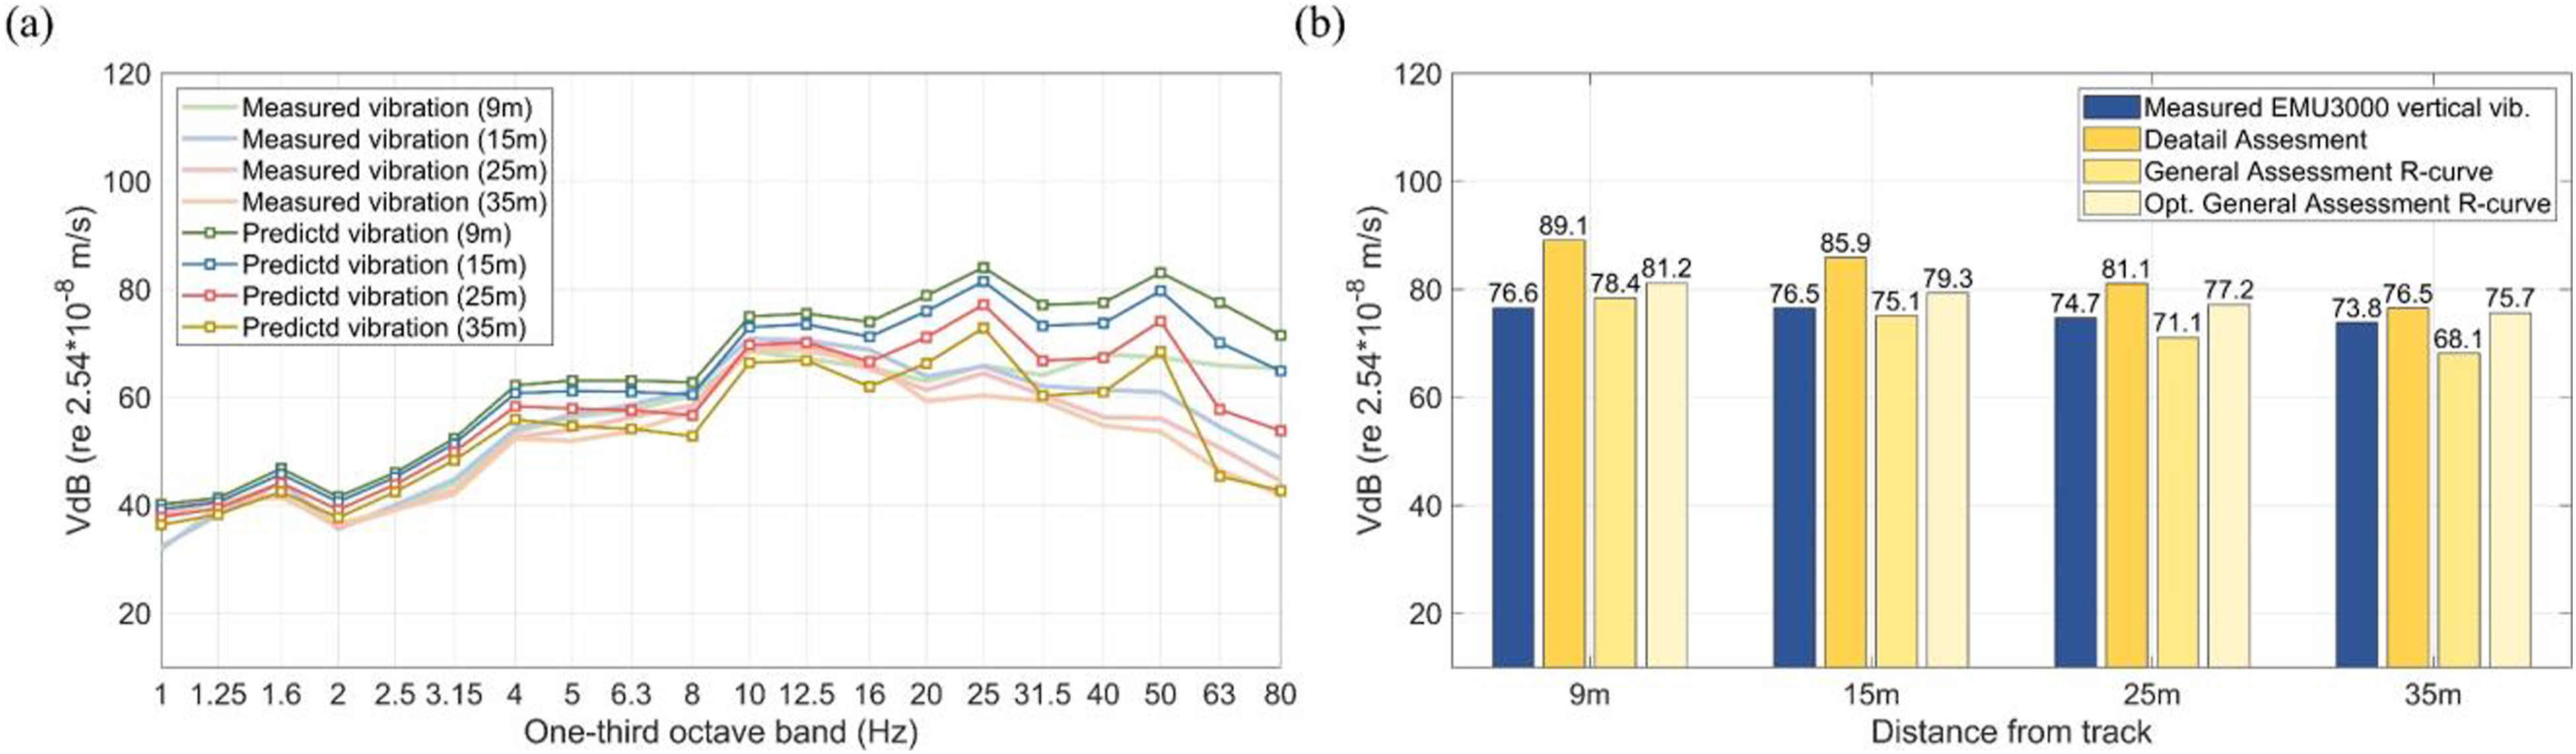
To further evaluate the prediction results, the train-induced vibration levels were determined through the general vibration assessment method of the FTA, which involves plotting an R-curve and an optimised R-curve by using equations (6), and (7), respectively. Figure 20(b) displays the train-induced vibration levels determined using the FTA’s detailed and general vibration assessment methods. The detailed vibration analysis method overestimated the vibration level at distances of 9–35 m from the centreline of the near track by 12.5–2.7 VdB, even though it only considered vertical vibrations. The degree of overestimation decreased at distances further from the centreline. The vibration levels predicted by R-curve and optimised R-curve, at distances of 9–35 m from the centreline of the near track differed from the corresponding measured vibration levels by 1.8–5.7 VdB and by 4.6–1.9 VdB, respectively. Figure 20 shows that the detailed vibration assessment tends to overestimate the vibration level, whereas the optimised R-curve provides a more precise and conservative estimation of vibration levels. The aforementioned validation was conducted at a single site; therefore, further validation should involve multiple sites.
Conclusions
This study utilized field measurements of train-induced vibration levels, LSTM, and FDL to validate the FTA’s general and detailed methods for predicting train-induced vibrations. Train-induced vibrations were analysed under different train speeds, distances, and lengths. On the basis of the measurement data, a frequency propagation contour plot was created to analyse the vibration energy under different vibration frequencies at various distances. The measured and predicted vibration levels were compared to determine the accuracy of the prediction methods. This study has the following main findings. 1. The FTA’s train speed adjustment equation was validated for the closest measured distances from both tracks, with slopes of 0.11 and 0.10 VdB, respectively. 2. The ground vibration attenuation trends caused by trains passing over the near and far tracks differ at this measurement site. These observations indicate that high-frequency vibrations from the near track contribute more significantly to the overall vibration energy than those from the far track. Further research is needed to investigate the differences in attenuation on both sides of a multiple ballast track system. 3. Regarding the FTA detailed vibration analysis method, FDL standard deviations varied significantly, reaching 5.5–7.5 dB at distances away from the centreline of the near track. These standard deviations were influenced by variations in 4. The maximum differences between the measurement and FTA detailed vibration analysis predicted spectra ranged from 18.3 to 19.3 dB at distances from the near track centreline, specifically within 20–50 Hz. Additionally, the detailed vibration analysis method overestimated total vibration levels by 12.5–2.7 dB at 9–35 m distances from the near track centreline. On the other hand, the FTA’s general vibration assessment method yielded more accurate predictions after optimising the R-curve, with differences ranging from 4.6 to 1.9 VdB compared to measurements, offering a more precise estimation. 5. This study generated a frequency propagation contour plot to understand energy propagation trends under specific vibration frequencies, aiding in developing effective mitigation measures. The measurement results indicated that the four-car commuter train (shortest train) produced the lowest vertical vibration levels. However, no discernible clear correlation existed between train length and vibration intensity for longer trains.
Footnotes
Declaration of conflicting interests
The author(s) declared no potential conflicts of interest with respect to the research, authorship, and/or publication of this article.
Funding
The author(s) disclosed receipt of the following financial support for the research, authorship, and/or publication of this article: this work was supported by the National Science and Technology Council; NSTC 112-2221-E-019-019; NSTC 113-2221-E-019-021.