
Abstract
In order to improve the accuracy of dynamic torque model of engine, a simulation model of quasi-transient engine dynamic torque under all operating conditions was established considering the influence of throttle opening. Firstly, the calculation model of engine output torque and cylinder pressure is established according to the kinematic relation of crank linkage mechanism. Secondly, BP neural network is used to establish the mapping relationship model of throttle opening, rotational speed, and cylinder pressure ratio data. In order to solve the contradiction between calculation accuracy and efficiency of engine cylinder pressure interpolation, a quadratic interpolation method is proposed, which refines data to improve interpolation accuracy, and improves calculation efficiency by online adjacent interpolation, and completes the construction of dynamic torque simulation model of engine in all working conditions. Finally, the experimental data of dynamic torque characteristics of the engine at different speeds are used to verify the accuracy of the model calculation. By using the verified engine model, the dynamic operating characteristics of variable valve opening and variable speed are simulated and analyzed. The results show that the model established in this paper can effectively reflect the dynamic characteristics of the engine, and the model is suitable for the simulation of the torsional vibration of the vehicle powertrain under steady and unsteady conditions.
Introduction
The torsional vibration of the powertrain is one of the main sources of NVH problems in the whole vehicle, 1 and the irregularity of the engine output torque is the main reason for the torsional vibration of the powertrain. 2 The dynamic torque fluctuation of the engine can easily lead to serious torsional vibration of the vehicle powertrain with multi-degrees of freedom and nonlinear characteristics, 3 and then induce many vibration and noise problems in the vehicle,4,5 including the durability of parts, and even lead to the deterioration of the power performance and fuel economy of the whole vehicle. The accurate simulation analysis of the torsional vibration of the powertrain can effectively find and avoid the possible torsional vibration of the powertrain through the powertrain simulation in the early stage of design. The key to this is the accurate modeling of the dynamic torque fluctuation of the engine. 6
Scholars have done a lot of research work on the modeling of engine dynamic characteristics. Park et al. 7 proposed a method based on engine cylinder pressure indicated torque estimation and load torque observation algorithms; Potenza and Franco et al. have carried out research on the accurate estimation of frictional resistance torque during engine operation8,9; The use of air mass flow sensor to improve the estimation accuracy of engine average torque has been proposed by Hong et al. 10 The joint modeling method of GT-Power® and MATLAB/Simulink® was used by Jung et al. 11 to establish the steady-state performance and fuel consumption calculation model of a certain type of turbocharged diesel engine. The results show that the prediction ability is better than the average model. And the calculation time is fast enough to simulate the engine over the entire engine operating range. The Elman neural network was used in the reference 12 to establish the engine indicated torque calculation model. The test results show that the average absolute error is within 6%, and the maximum error is 15%.
The above research work focuses on the modeling and estimation of engine average torque and load torque, which are mainly used in engine control and power distribution of hybrid electric vehicles. The engine average torque calculation model does not consider the engine torque fluctuation component, so it is not suitable for the simulation of torsional vibration in the automobile powertrain.
Hajnayeb, Shangguan and Yang et al. used the method of trigonometric function fitting to establish the calculation model of engine dynamic torque fluctuation.13–15 Gomez et al. used Fourier series to fit and model torque fluctuations of a six-cylinder engine. 16 Idehara et al. used a polynomial fitting method to fit the measured output fluctuating torque of the engine, and then carried out a simulation analysis of the torsional vibration of the powertrain. 17 Tametang et al. established a dynamic torque model of a four-cylinder engine considering the inertia torque and gas torque of the engine, modeled the torque fluctuation of the motor, and analyzed the nonlinear torsional vibration characteristics of the series hybrid power system caused by the torque fluctuation of the engine and the motor in detail. 18 According to the kinematic relationship of engine crank-connecting rod mechanism, Wu et al. calculated the output torque of engine crankshaft by using the measured cylinder pressure curve. At the same time, considering the engine friction, the engine quasi-transient model is established, which further improves the accuracy of the engine torque simulation results. 19
Through the above literature analysis, it can be seen that the existing dynamic torque model does not consider the dynamic influence of the engine throttle opening and crankshaft speed changes on the engine output torque, so there will be simulation errors in the study of the torsional vibration of the drive train under different engine working conditions. Therefore, this paper obtains the test data of the engine output characteristics under all working conditions. Neural network was used to construct a nonlinear mapping model of engine throttle opening to cylinder pressure, which further improved the simulation accuracy of the engine under multiple working conditions. At the same time, the data amount and interpolation accuracy were improved by offline moving least-square interpolation, and the calculation efficiency was improved by online adjacent interpolation, and the calculation accuracy and efficiency of the engine dynamic torque model were synchronously improved.
The main research content of this paper is to establish the calculation model of engine output torque and cylinder pressure. Firstly, a double interpolation method of off-line moving least square interpolation and on-line adjacent point interpolation is proposed to synchronously improve the calculation accuracy and efficiency of cylinder pressure in the simulation process. Secondly, the mapping relationship model of throttle opening, speed, and cylinder pressure ratio data is established by BP neural network; The influence of engine internal friction on output torque is considered, and a complete engine dynamic torque output model is established. Finally, the accuracy of the model is verified by experiments, and the dynamic characteristics of the engine are simulated and analyzed.
Quasi-transient engine model structure
The torsional vibration of the powertrain is mainly caused by the fluctuation of engine output torque. Therefore, the torque fluctuation of the engine must be considered when modeling and analyzing the torsional vibration problem. The quasi-transient engine model uses the engine cylinder pressure curve as the input to calculate the dynamic output of the engine, which can effectively reflect the dynamic characteristics of the engine output torque and meet the requirements of analyzing torsional vibration problems. However, the cylinder pressure of the engine is directly related to its working speed and throttle opening. Firstly, according to the throttle opening, engine speed, and engine crankshaft angle, the engine cylinder pressure is obtained in this model, Then, due to the kinematic relationship of the engine single cylinder crank connecting rod mechanism, the engine output inertia torque and the gas torque produced by combustion are calculated, Finally, the output torque of the multi-cylinder engine is obtained through the crank phase angle of the multi-cylinder engine, and the influence of friction on the output torque of the engine is also considered. The overall structure of the engine model is shown in Figure 1. Schematic diagram of engine model structure.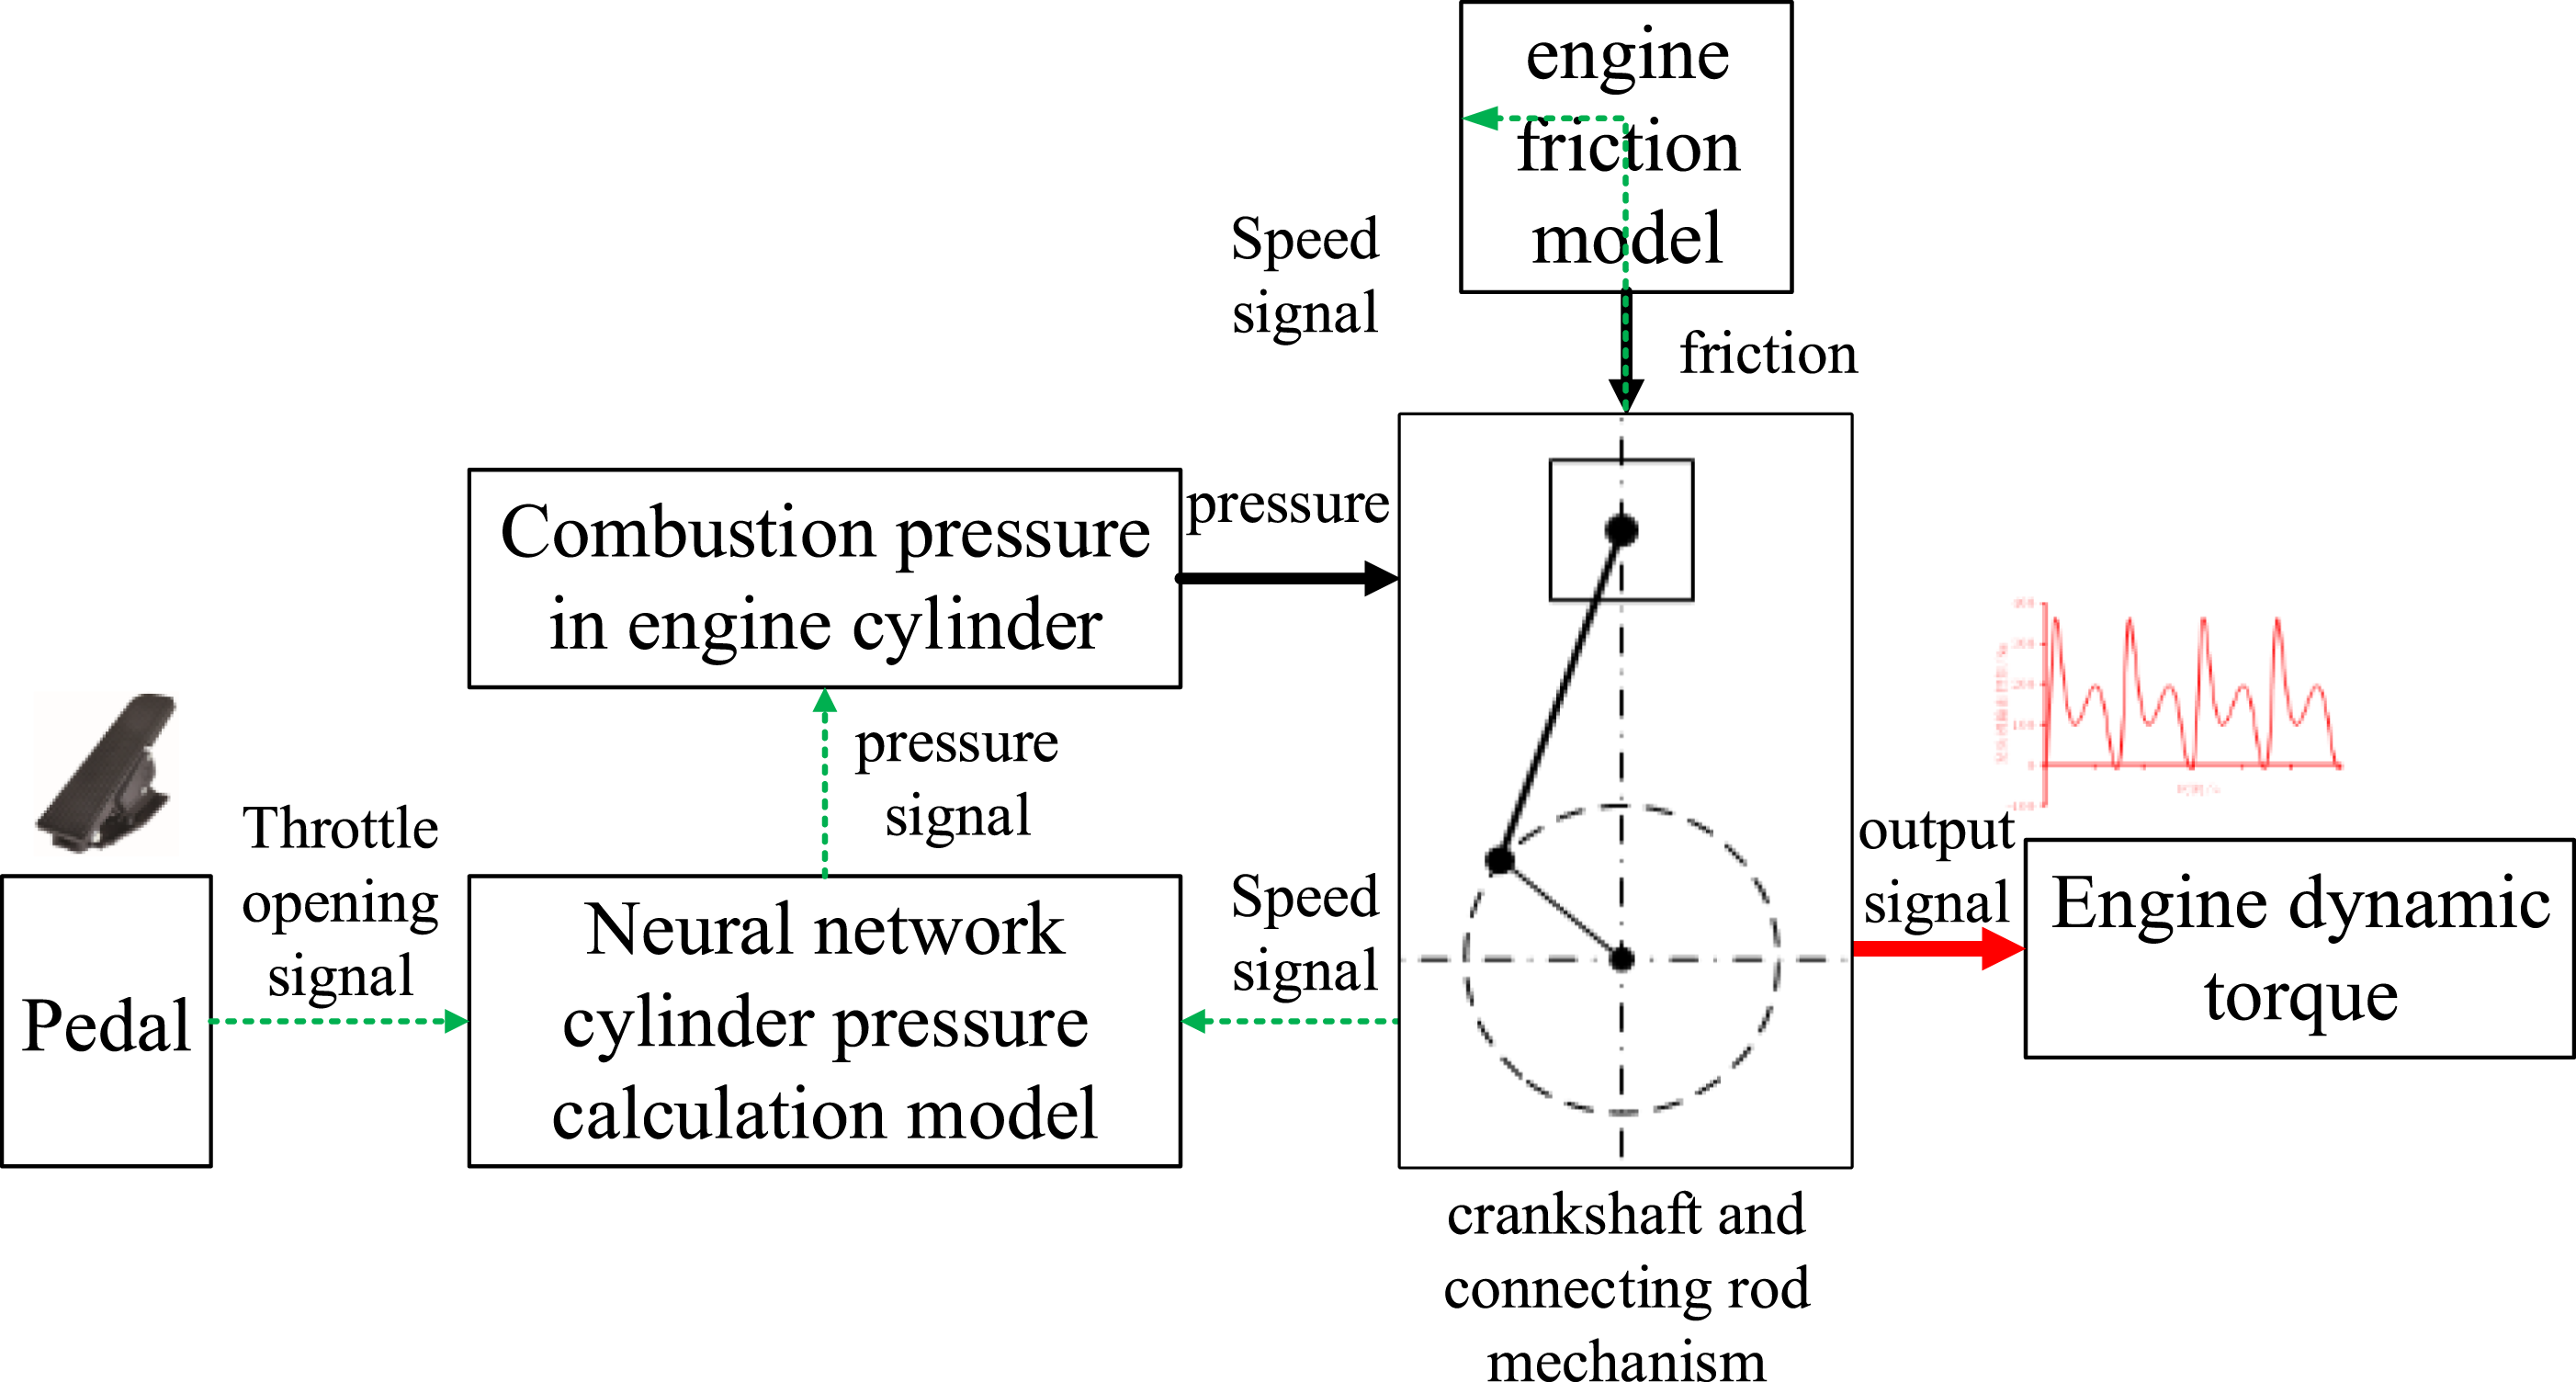
Quasi-transient engine model
Single-cylinder engine torque model
The engine crank connecting rod mechanism is a complex system composed of the piston, connecting rod, and crankshaft; its structural motion diagram is shown in Figure 2219.
α is the crankshaft angle, β is the swing angle of the connecting rod, r is the crank radius, L is the connecting rod length, m
p
is the equivalent mass of the length of the piston, piston ring, piston pin, and connecting rod part, F
g
is the positive pressure generated by the pressure in the cylinder on the end face of the piston. The relationship between crankshaft angle and piston displacement can be obtained from the kinematic relationship in Figure 2 Diagram of engine crank connecting rod mechanism.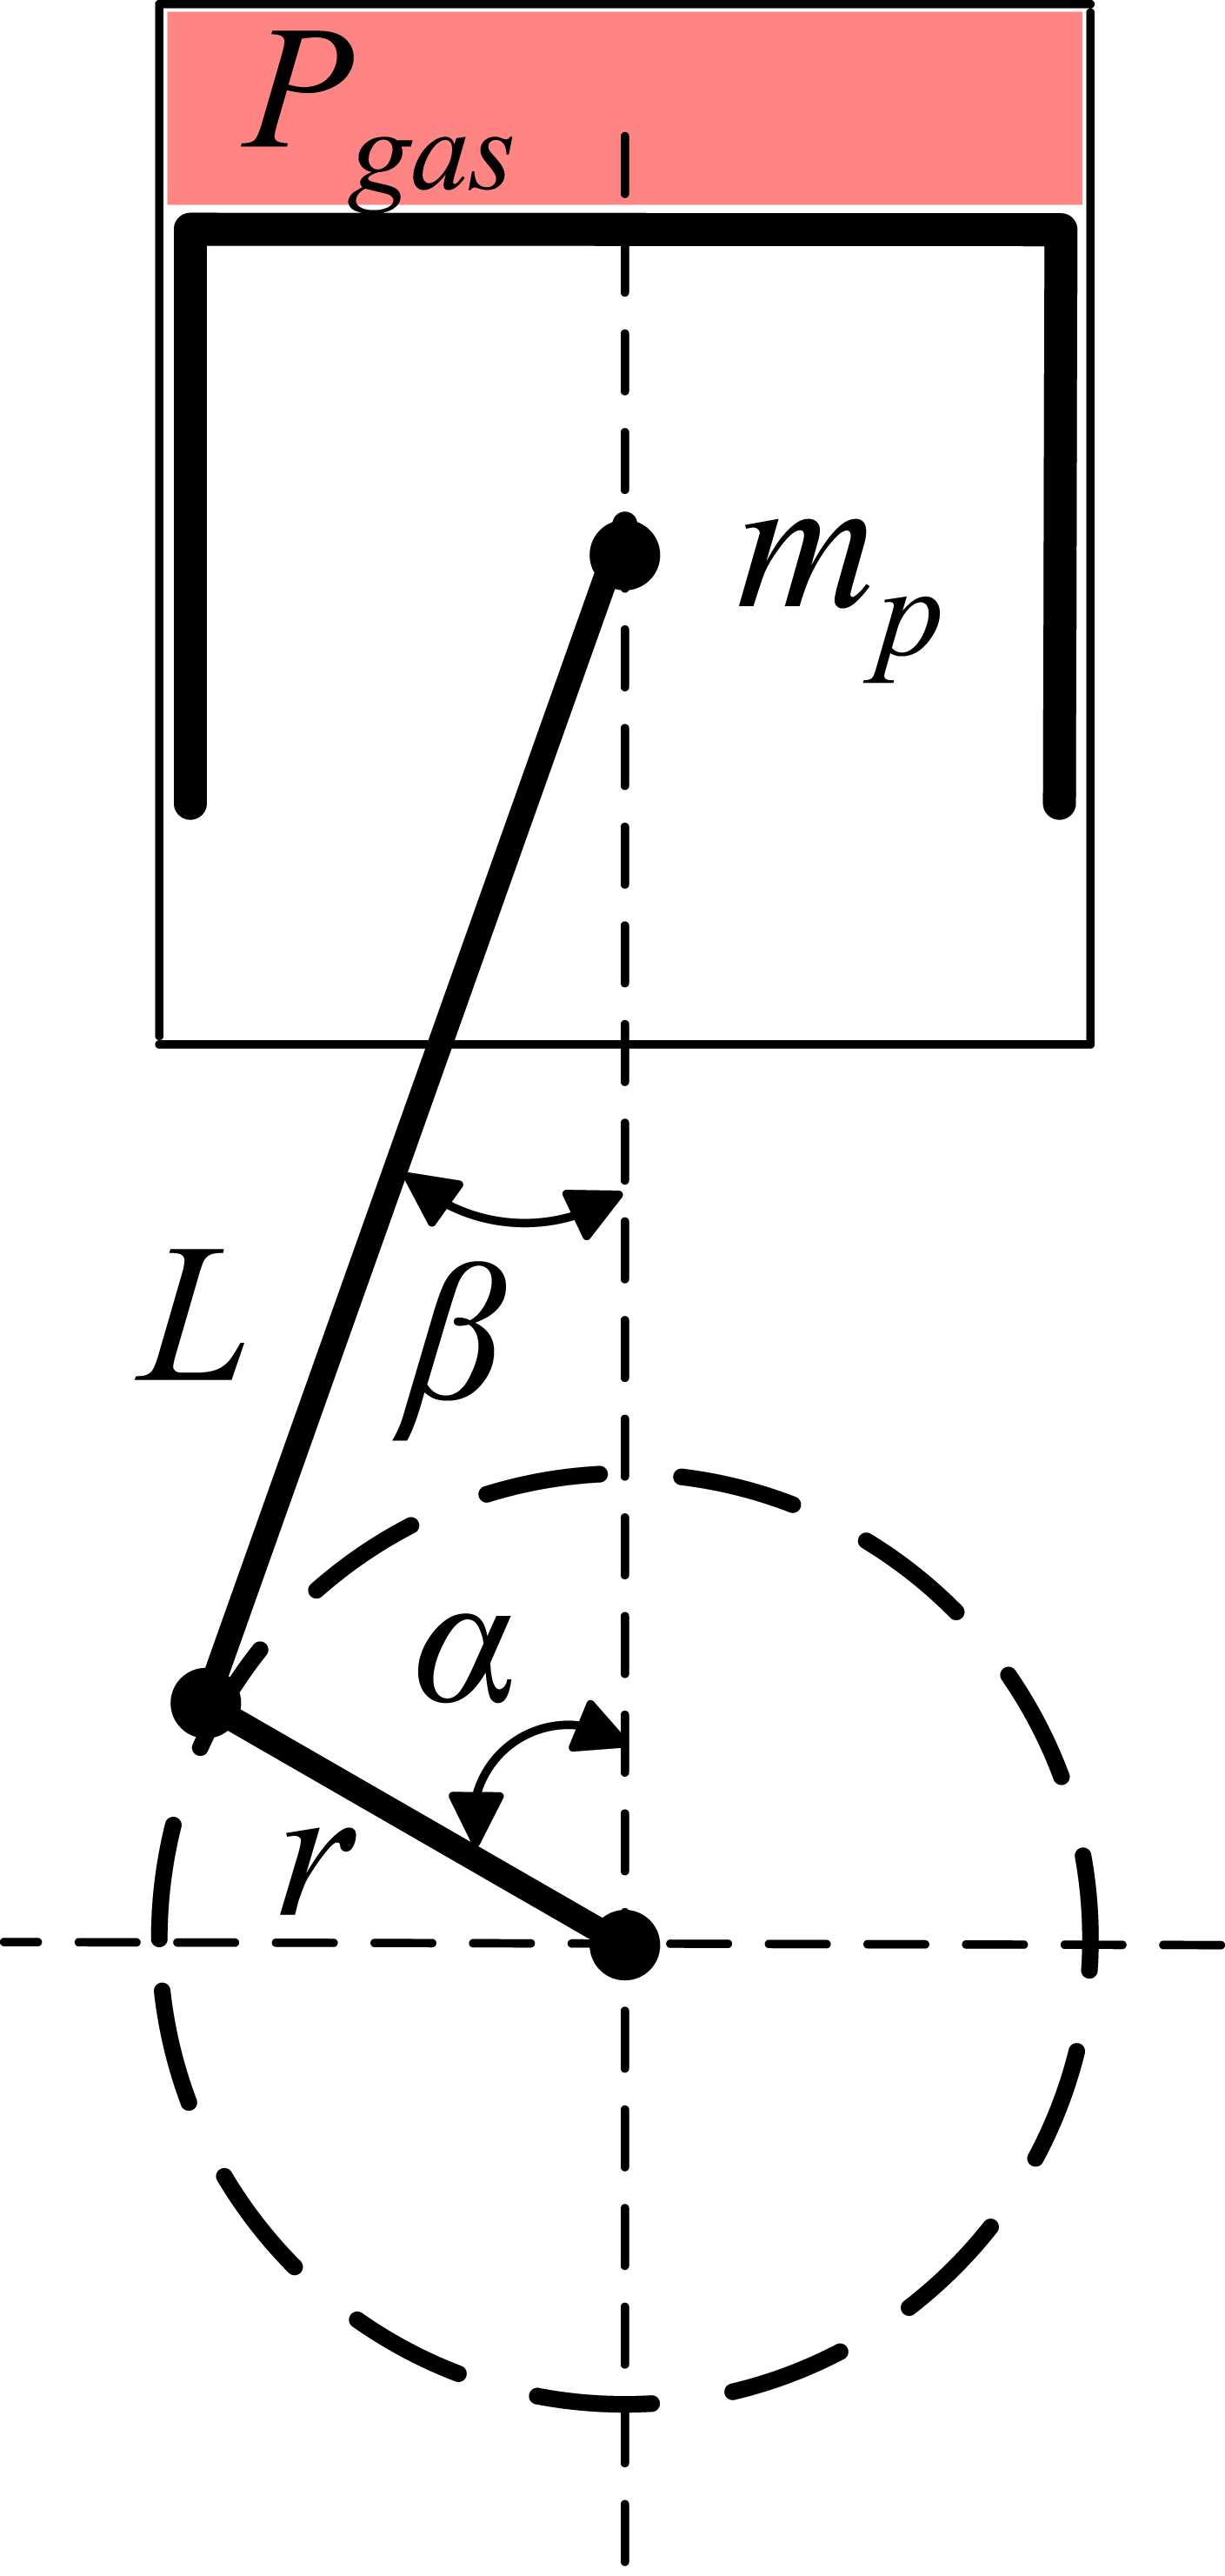

The root part of the above formula can be approximately expanded by series, and the first two terms are taken as

Set the crankshaft angular velocity to be

According to equations (3) and (4), the reciprocating inertia force is

The gas force generated by the combustion pressure in the engine cylinder is

The torque generated by the reciprocating inertial force of the engine and the gas force on the crankshaft is calculated as


T pi is the inertia moment generated by the ith cylinder, and T gi is the gas moment generated by the ith cylinder。
Engine cylinder pressure quadratic interpolation fitting
The acquisition of the in-cylinder pressure value of the engine is the key to calculating the dynamic output torque, and the in-cylinder pressure of the engine is not only related to the crankshaft angle but also has a nonlinear relationship with the engine speed and the accelerator opening. When simulating and analyzing the torsional vibration of the powertrain in the existing literature, the commonly used method is to use a group of cylinder pressure curves of speed to simulate and analyze all working conditions of the powertrain (constant speed steady-state and acceleration and deceleration unsteady state). The difference in the in-cylinder pressure of the engine when the engine works at different speeds and the influence of throttle opening on the in-cylinder pressure of the engine is not considered. In this paper, to further improve the accuracy of the quasi-transient model of the engine and the simulation accuracy of the torsional vibration of the whole vehicle driveline, the effects of the engine speed and the throttle opening are considered separately.
The method to deal with the change of engine cylinder pressure with speed is to obtain the cylinder pressure angle curve under a limited set of speeds according to the test data, and then use the interpolation function for real-time interpolation, to realize the simulation of the engine under variable working conditions. In practice, it is found that due to factors such as the test cycle and time cost, the test measurement of the engine cylinder pressure curve can only measure a limited set of data. The test in this paper is taken as an example. Six groups of test data with an engine speed of 1000–6000 r/min and interval of 1000 r/min under full throttle (WOT) are obtained to improve the interpolation accuracy and smoothness in the simulation process, cubic equation interpolation is used online, which leads to a sharp increase in the amount of calculation, low efficiency, and long time; To improve the calculation efficiency, adjacent point interpolation or linear interpolation is adopted. However, due to the insufficient amount of test data, the surface formed by the interpolation results is not smooth and discontinuous, and the simulation results are not accurate enough to meet the simulation requirements of the engine under full operating conditions.
To overcome the above problems, the moving least squares (MLS) method proposed in this paper is used to perform offline interpolation fitting on the test data to obtain the engine cylinder pressure curve with higher speed density and finer surface; Then, the offline interpolation result is used as the known quantity of online interpolation, and the adjacent point interpolation method with high computational efficiency is adopted in the online interpolation simulation process, to improve the computational efficiency and ensure the computational accuracy.
Figure 3 is the cylinder pressure surface drawn by the test data obtained from the test, and the engine cylinder pressure surface refined by the moving least-squares method is shown in Figure 4. Where the engine speed refinement interval is 1r/min, and the crankshaft angle refinement interval is 0.5°. Pre-interpolation cylinder pressure curve. Interpolation cylinder pressure curve.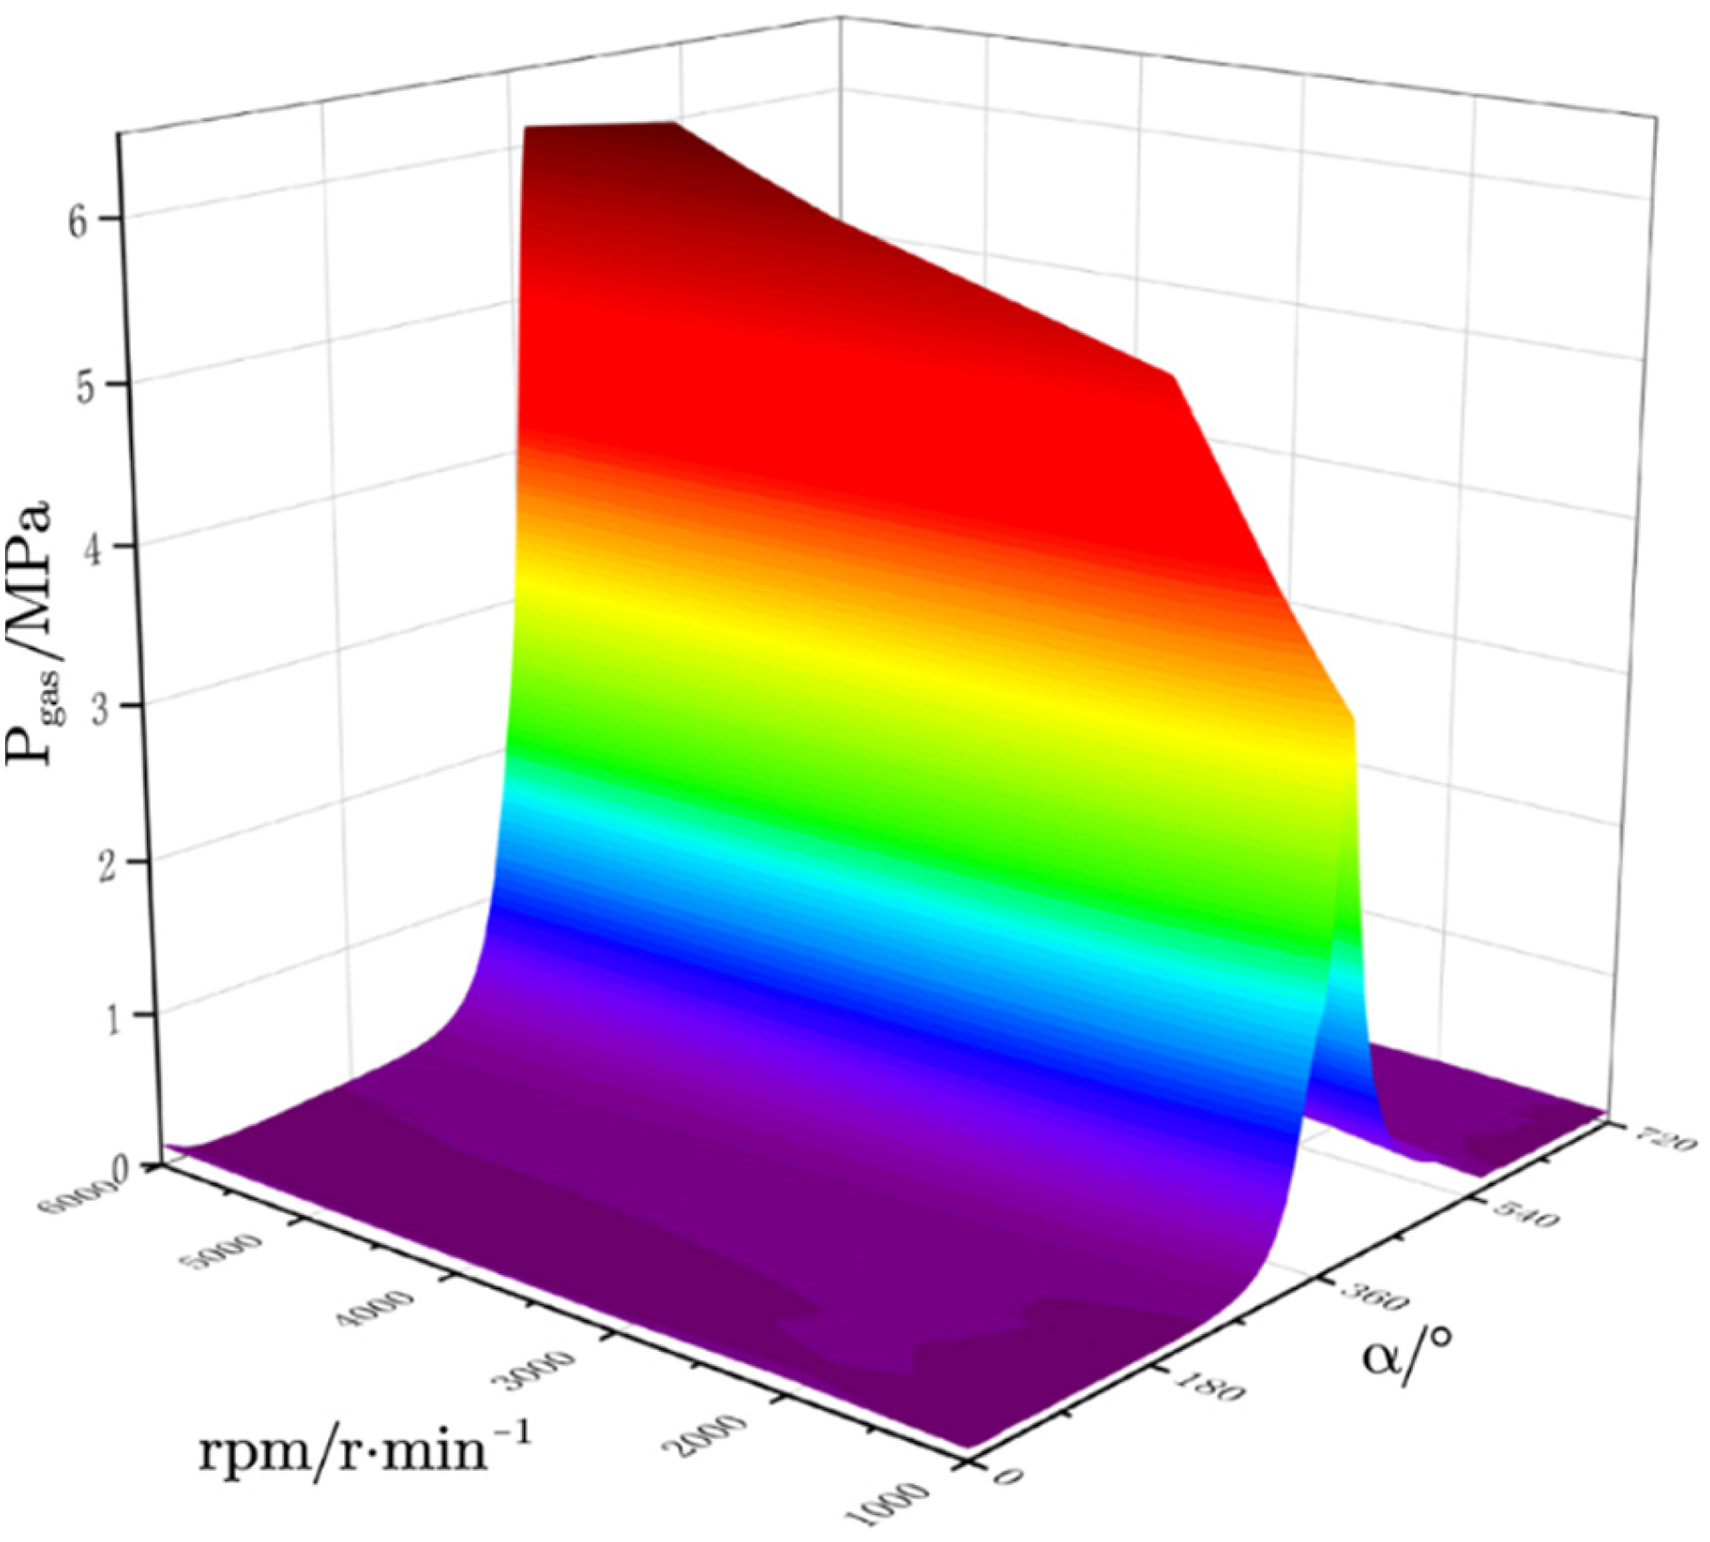
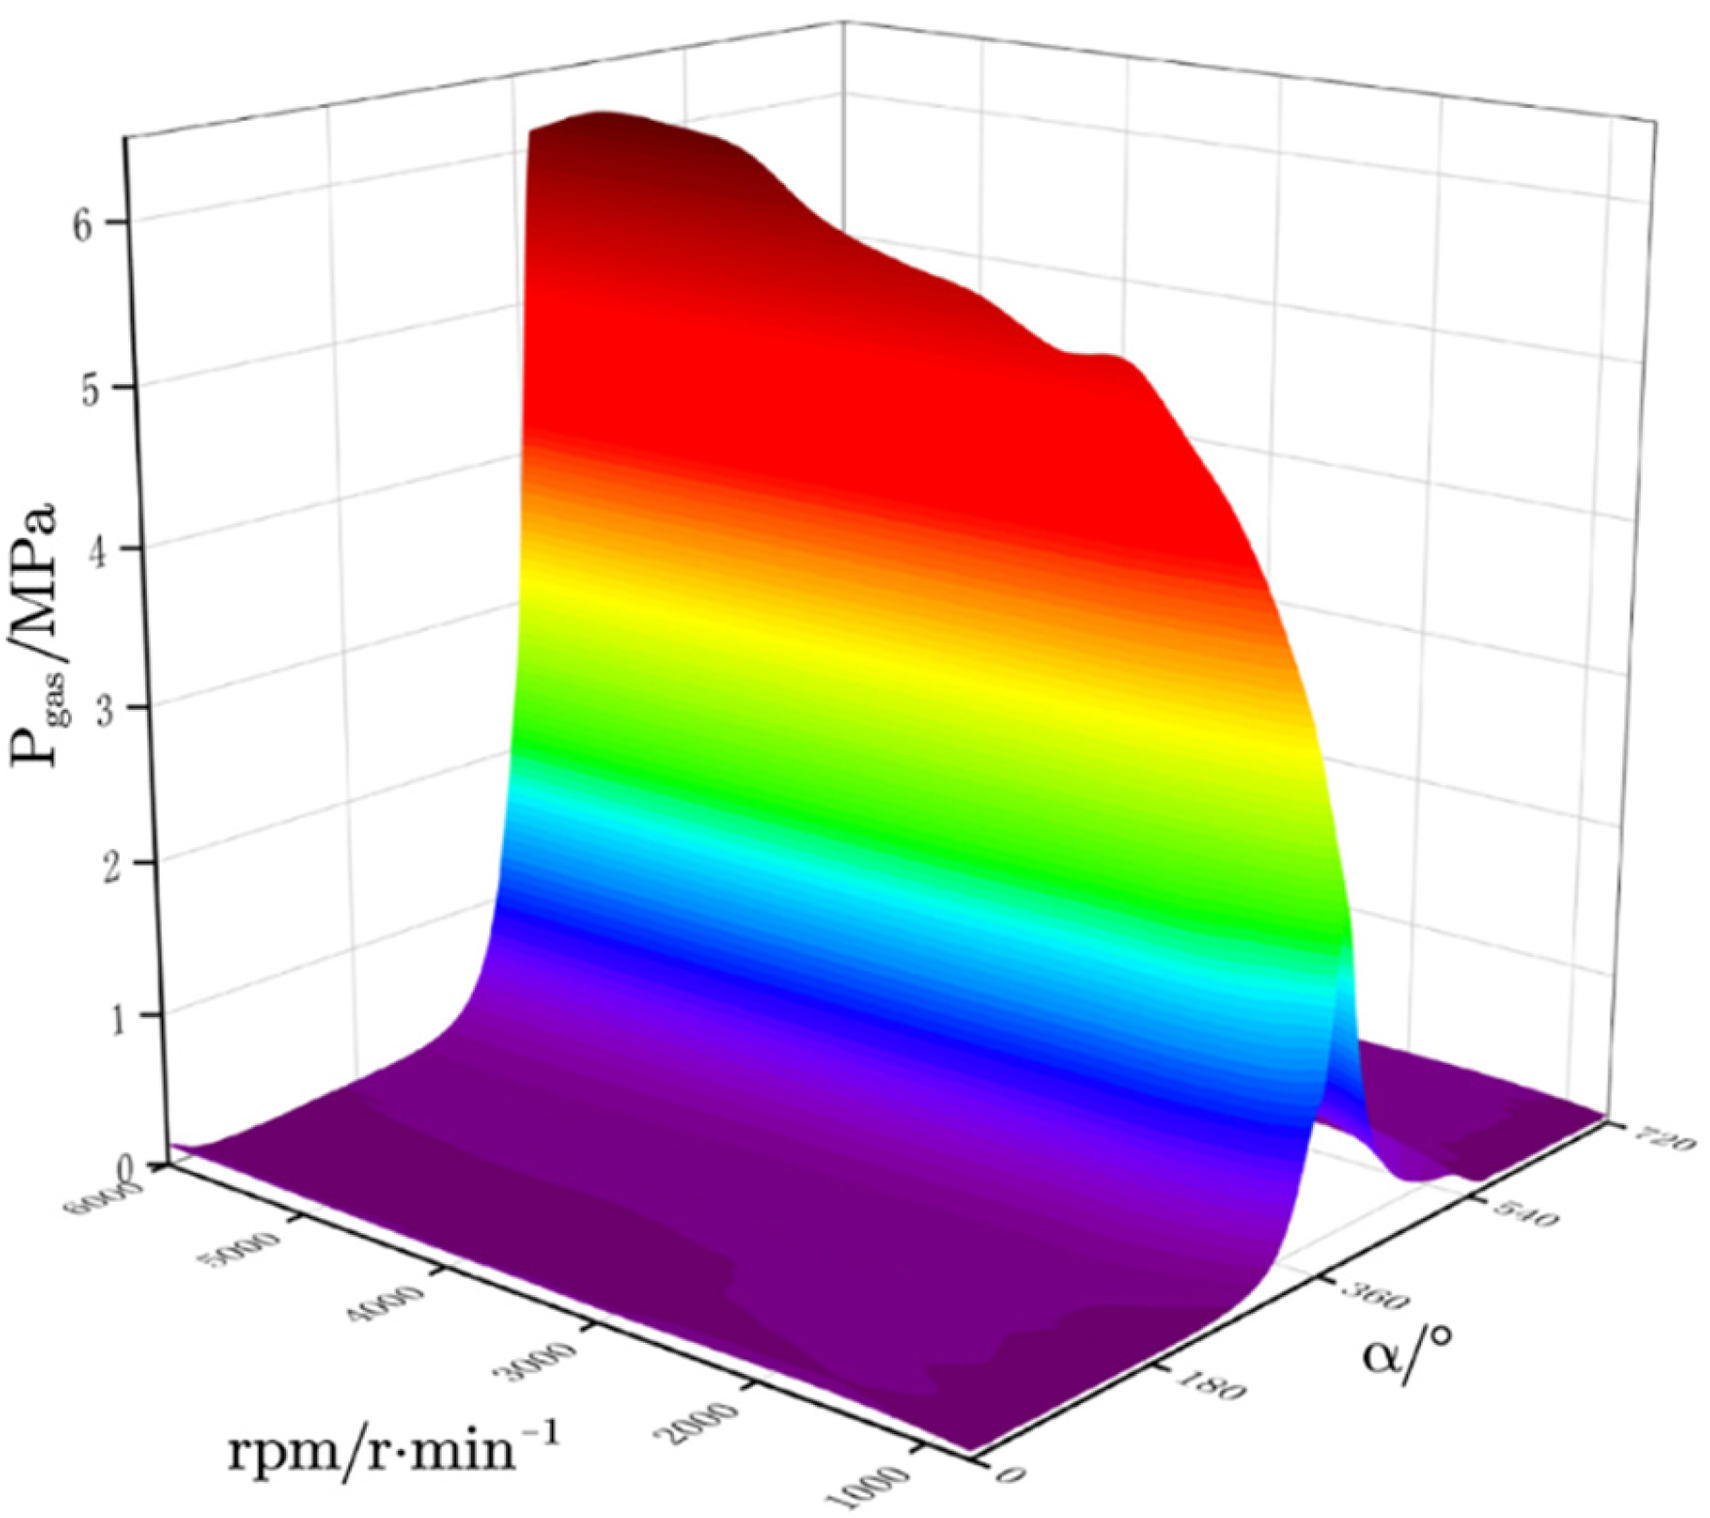
By comparing Figures 3 and 4, it can be seen that the cylinder pressure surface obtained from the test data is not smooth and continuous due to the small amount of data and obvious stepped transition between different speeds. The cylinder pressure surface interpolated and refined in Figure 4 makes the transition of the cylinder pressure change smooth and continuous. To verify the accuracy of the interpolation results, the cylinder pressure curves of 1500 r/min and 2500 r/min obtained by separate tests and the cylinder pressure curves obtained by fitting and interpolation were compared in this paper, and the results are shown in Figure 5. Error analysis of interpolation results.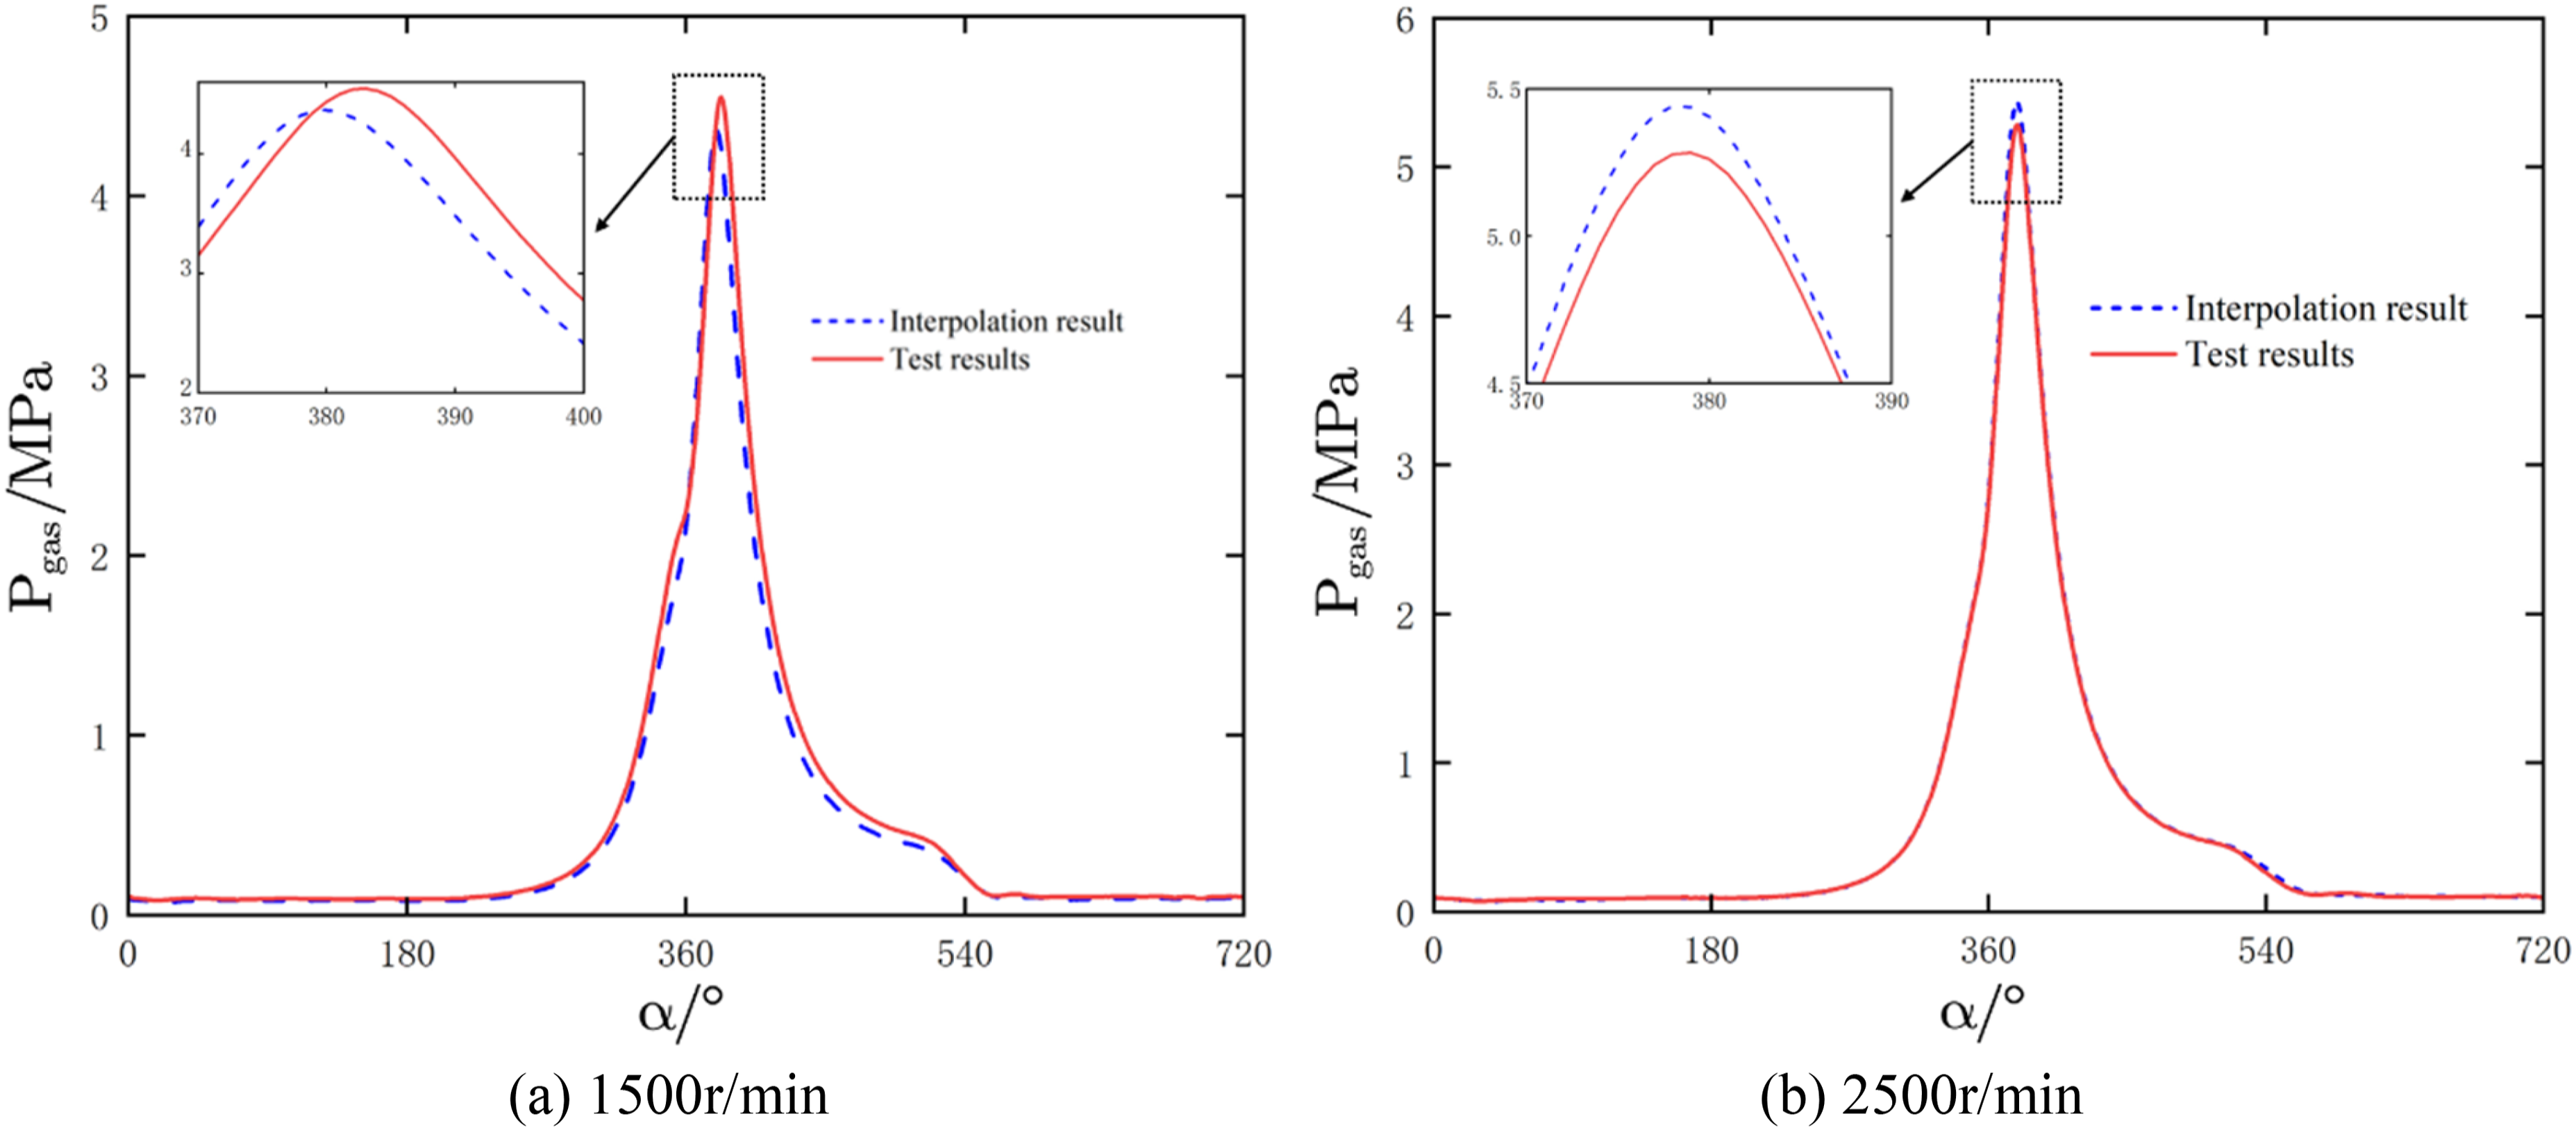
It can be seen from Figure 5 that the interpolation results are consistent with the test results, and the error is the largest at the peak value of cylinder pressure. Taking 250 r/min as an example, the peak value of the test cylinder pressure is 5.442 MPa, the peak value of the interpolation result is 5.284 MPa, and the error is only 2.9%, which meets the needs of engineering applications, indicating that the method achieves the expected goal.
Modeling of engine throttle opening
The throttle opening influences the engine cylinder pressure. In this paper, the curve of throttle opening and cylinder pressure is to be dealt with as the following functional relationship

It can be seen from equation (8) that the real-time cylinder pressure curve is obtained by interpolation of the current speed and the engine crankshaft angle signal through the adjacent point, and then the cylinder pressure proportional coefficient value under the current throttle pedal opening is calculated by the throttle opening model. The dynamic real-time cylinder pressure value of the single-cylinder engine can be obtained by multiplying the two, and then the torque output value of the single-cylinder engine can be calculated. Therefore, the establishment of the functional relationship of throttle opening becomes the key point. Firstly, the proportional coefficient values under different speeds and throttle opening are obtained through the test, and the proportional coefficient when the throttle is fully open is defined as 1. The test results are shown in Figure 6. Test cylinder pressure surface.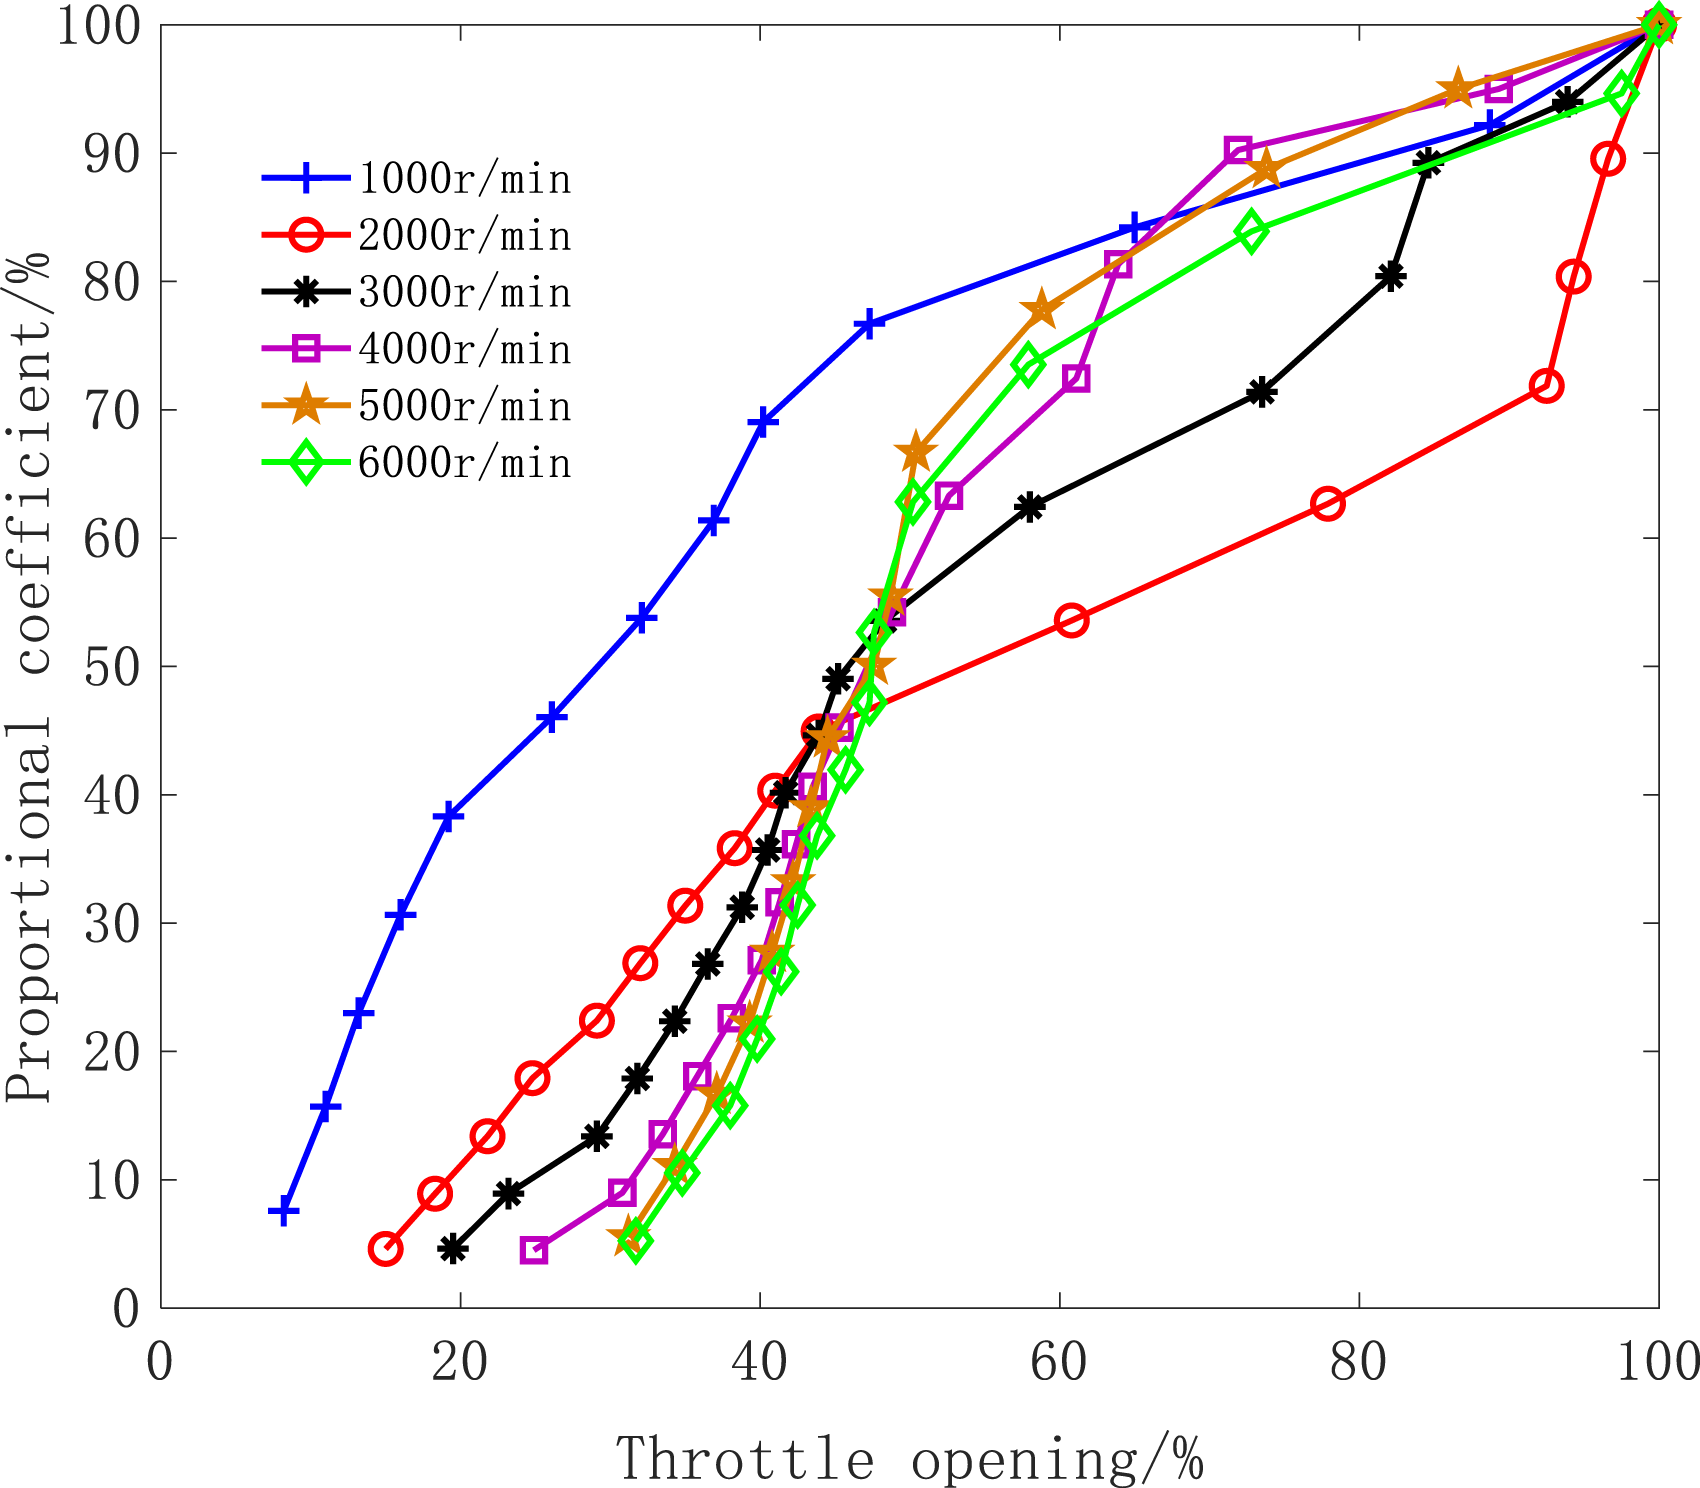
It can be seen from Figure 6 that there is a positive proportional relationship between the throttle opening and the engine cylinder pressure proportional coefficient. In this paper, the proportional coefficient is defined as 100% when the throttle is fully open; Under different speeds, the change rate of the proportional coefficient with throttle opening is different, indicating that the rotating speed has an influence on the proportional coefficient under the same throttle opening; As the speed increases, the minimum throttle opening also increases, as shown in Figure 7. The speed is linear with the minimum throttle opening. Fitting cylinder pressure surface.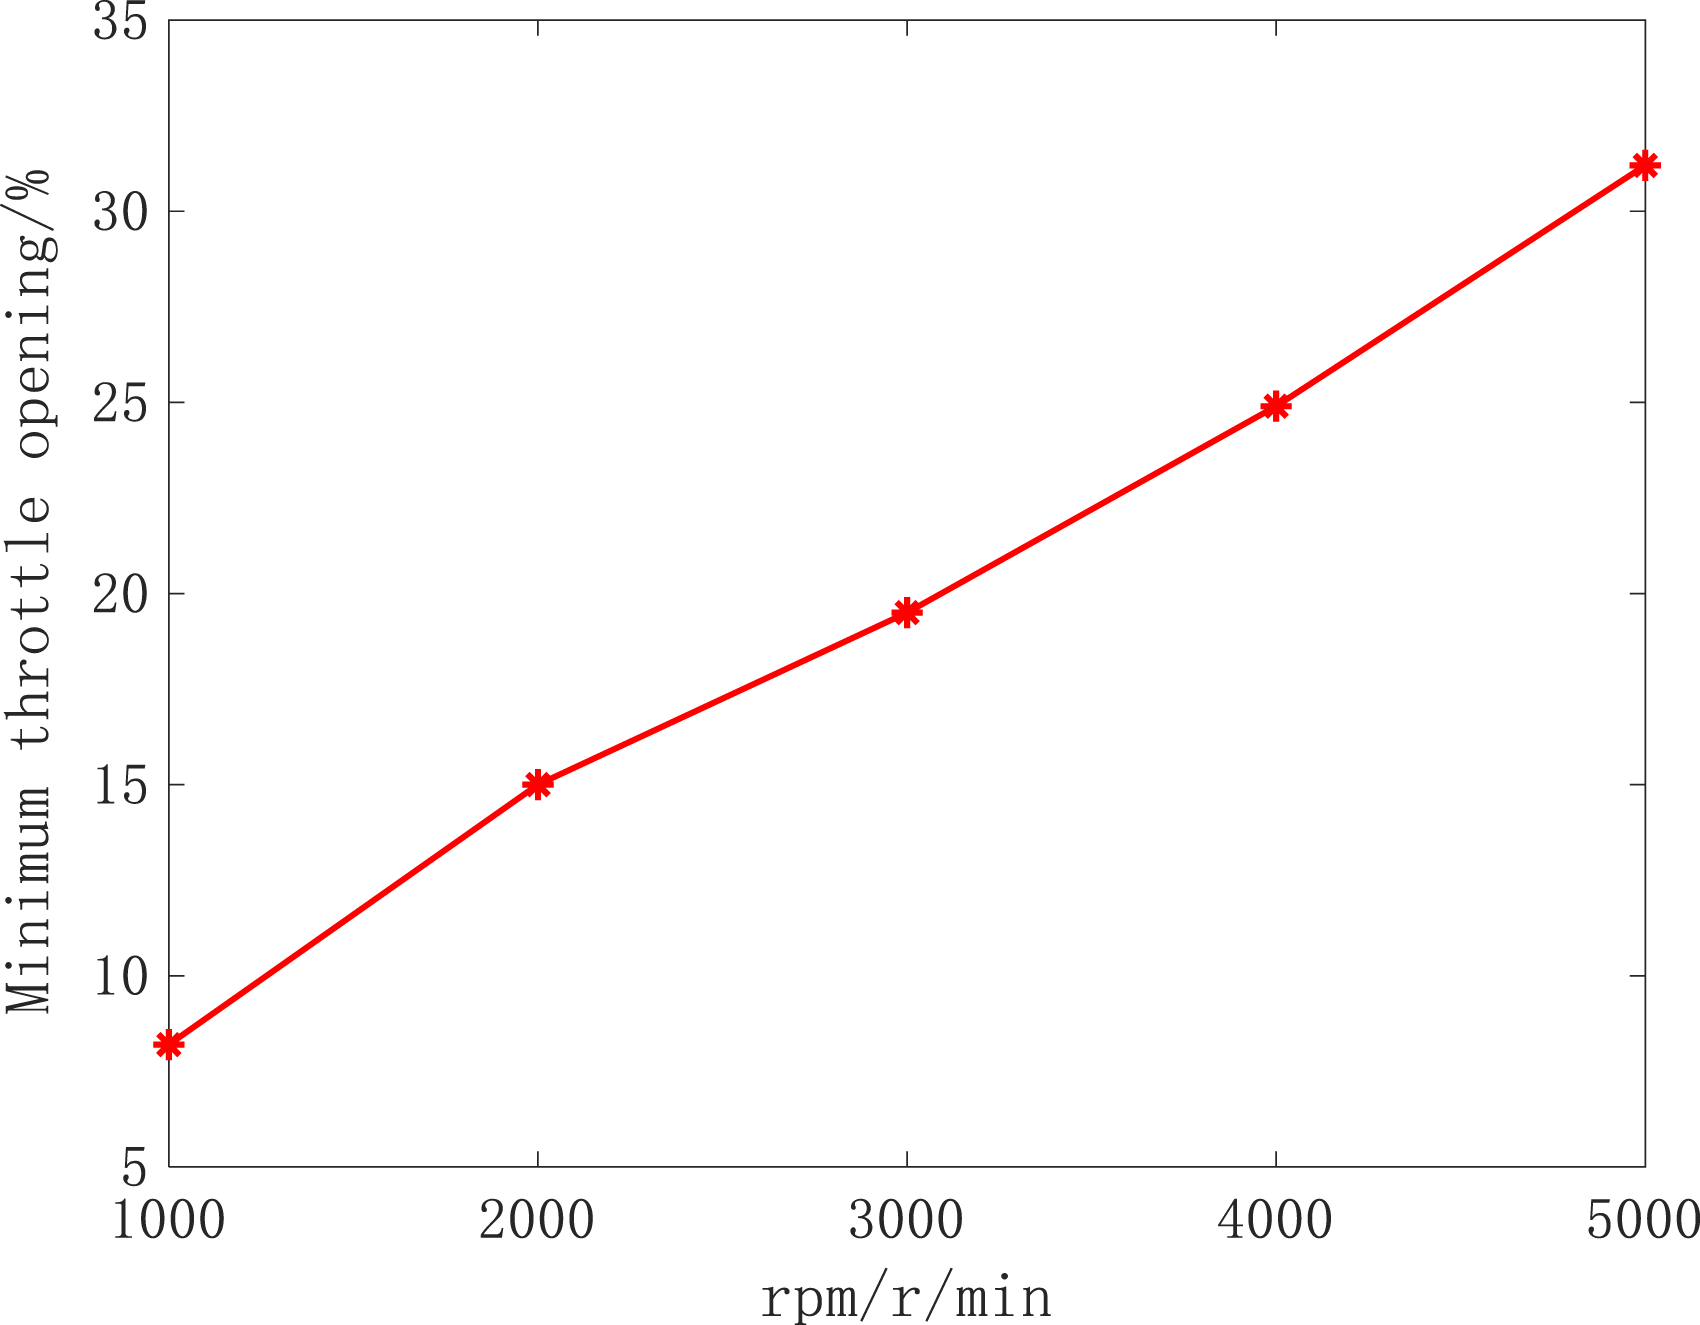
It is found from Figure 6 that the proportional coefficient of engine cylinder pressure has a strong nonlinear relationship with the throttle opening and engine speed, and it is difficult to establish a linear fitting model directly, while the neural network has a very strong nonlinear fitting ability. In this paper, the neural network is used to construct the calculation model of throttle opening and cylinder pressure proportional coefficient.
The input signal of the cylinder pressure proportional coefficient calculation model in this paper is the engine speed signal and the throttle valve opening, and the output signal is the cylinder pressure proportional coefficient. Therefore, BP neural network is a two-input-one-output neural network. The number of hidden layers and the number of nodes has a great influence on the accuracy of the model. Through simulation experiments on different hidden layers and numbers of nodes, the hidden layer is finally selected as two layers. The numbers are 3 and 8, respectively, and the network structure of the BP neural network is 2-3-8-1 type.
The tangent S-shaped function Tansig is used as the node transfer function; Trainlm function is used as the training function; The learning rate is 0.001; Non-zero random number is adopted by the initial weight.
After the parameters of the BP neural network model are set, the cylinder pressure ratio data is obtained through experiments at different speeds and throttle openings. The BP neural network model is trained with samples. Before training, the test data needs to be normalized and inverse normalized before training to reduce the network prediction error caused by the order of magnitude difference in the input parameters. The normalization calculation formula adopted in this paper is

After using the above formula to normalize and de-normalize the input and output data, the established neural network is trained. The training results are shown in Figures 8 and 9. Error curve. Linear regression curve.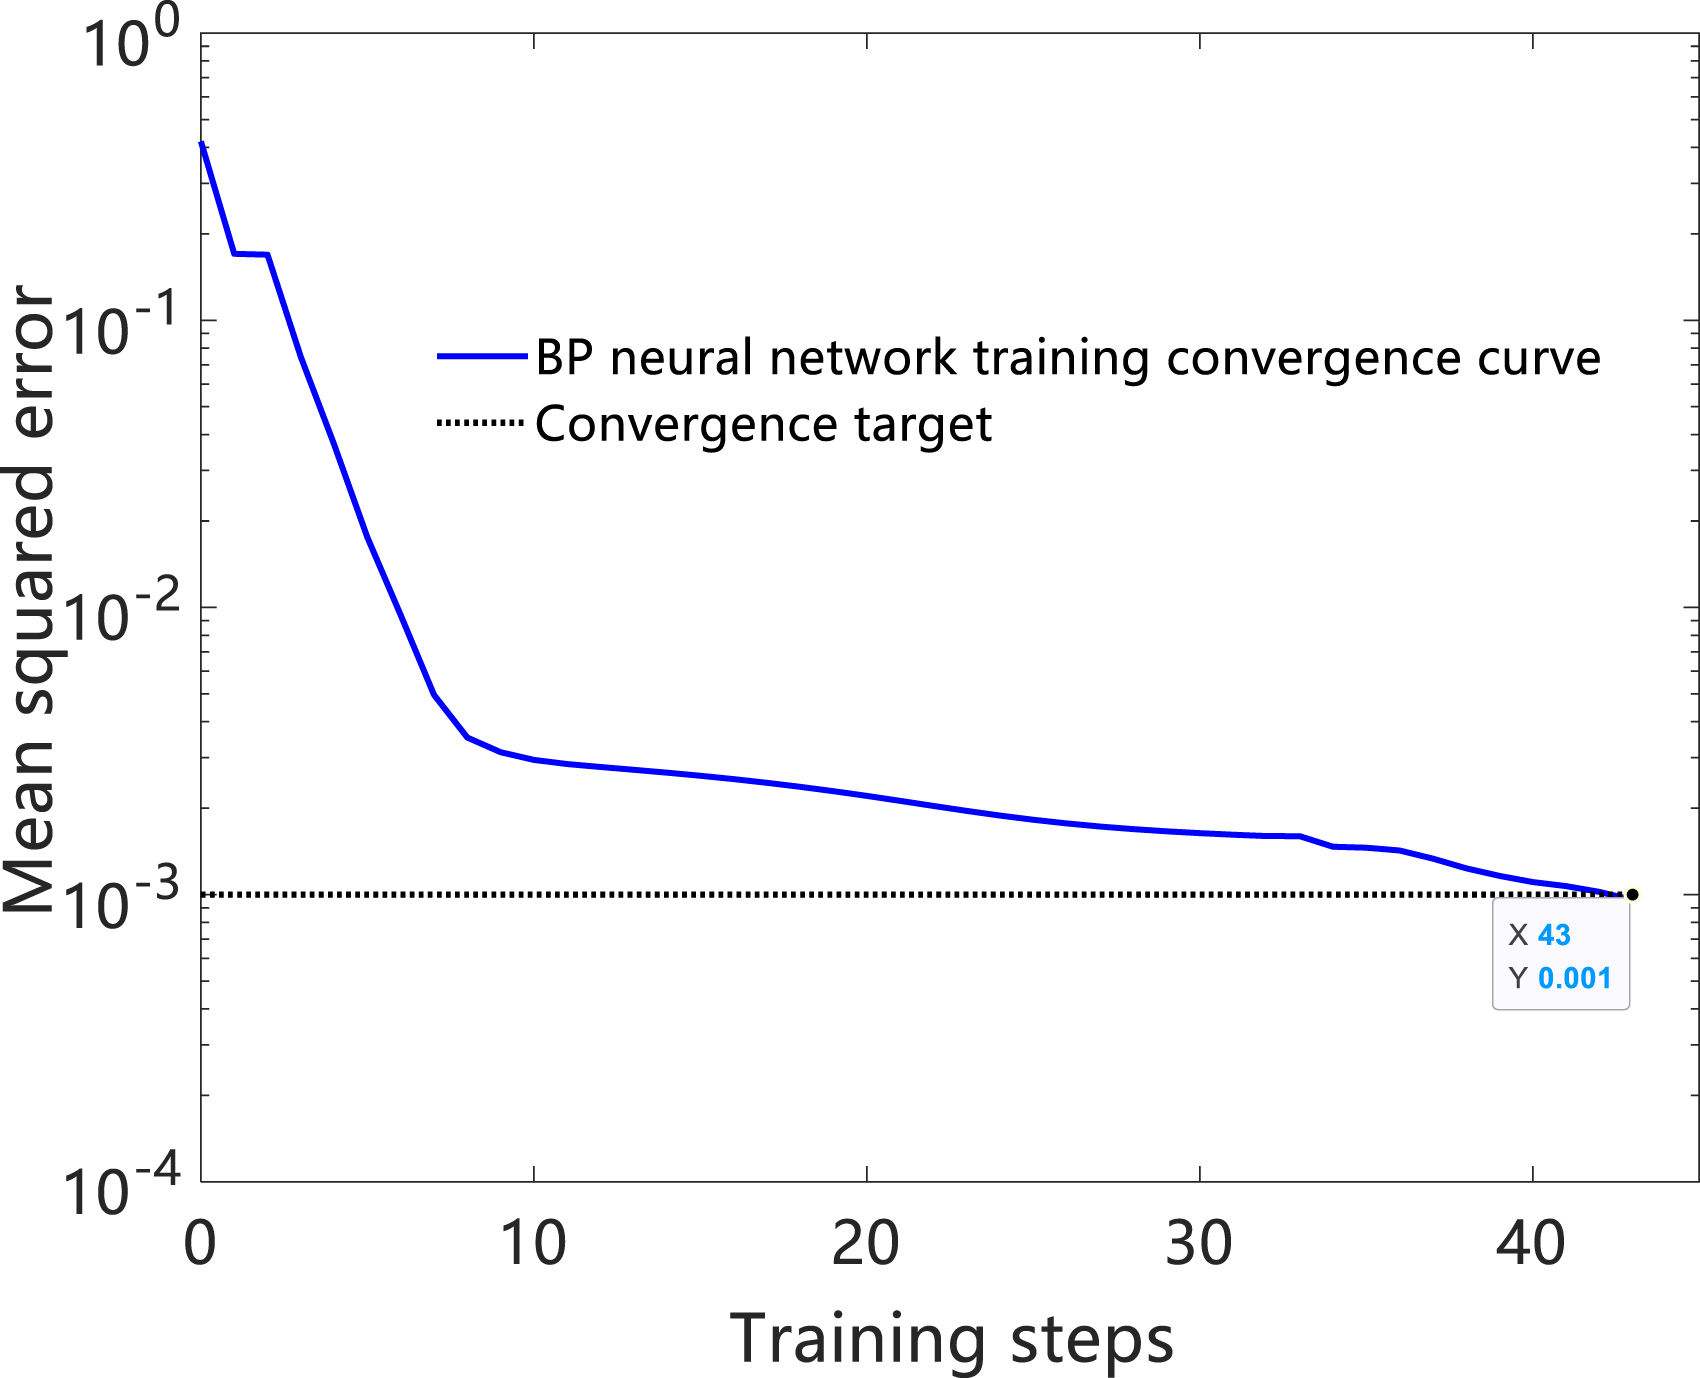
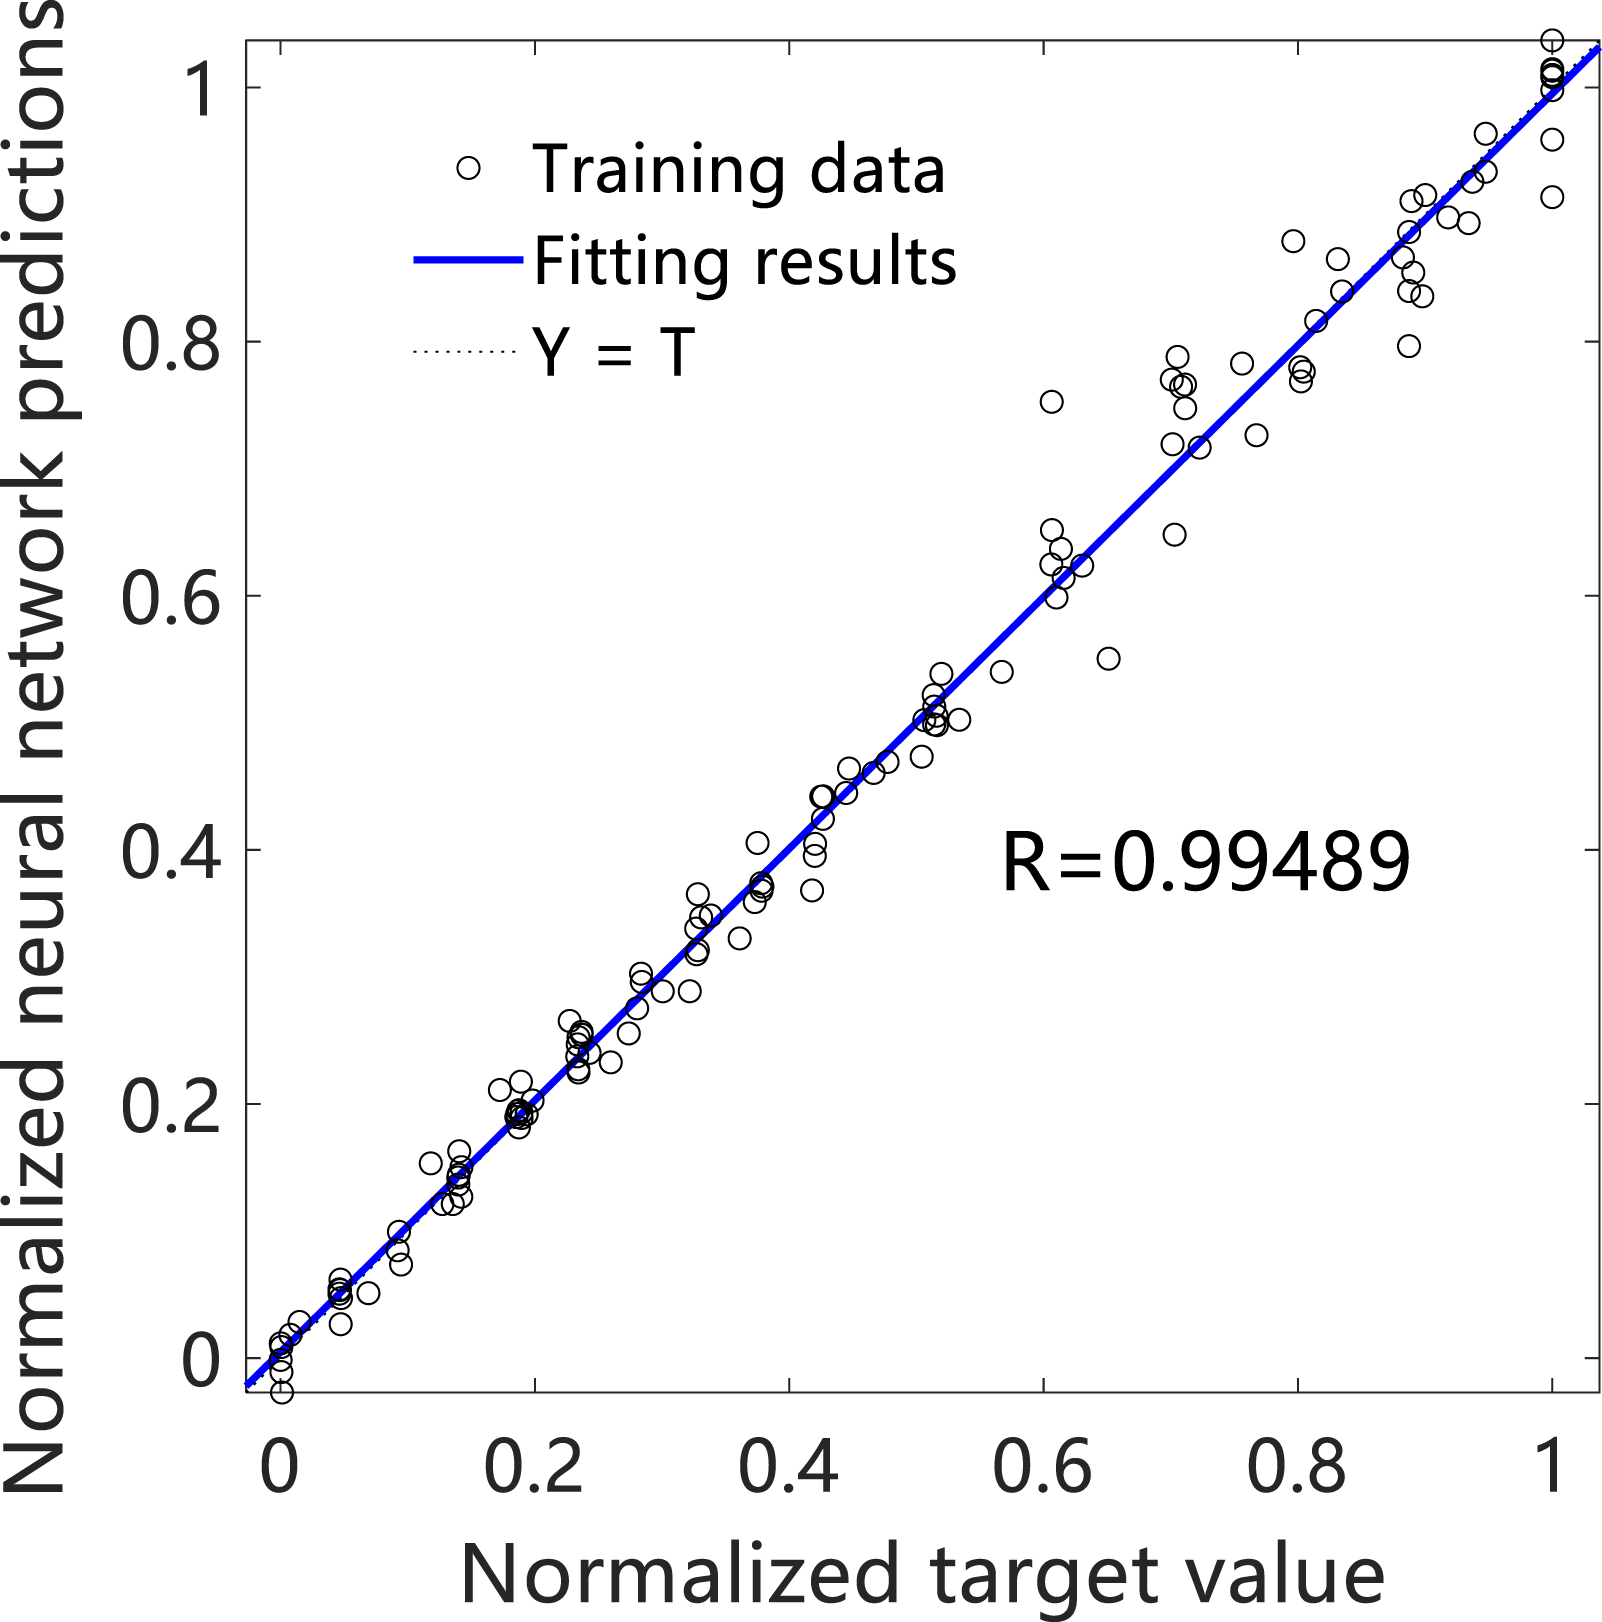
As shown in Figure 8, when the training reaches 43 steps, the training error reaches the convergence target of 0.001 set in this paper; Figure 9 shows the fitting between the training data output of the BP neural network and the corresponding expected output. The R value is 0.99707, indicating that the training model has sufficient training accuracy. In order to verify the prediction accuracy of the model, the test data of the cylinder pressure proportional coefficient when the rotational speed is 1500 r/min and 2500 r/min are taken, and the trained BP neural network model is used for prediction. The prediction results are shown in Figures 10 and 11. Model prediction results. Model prediction results.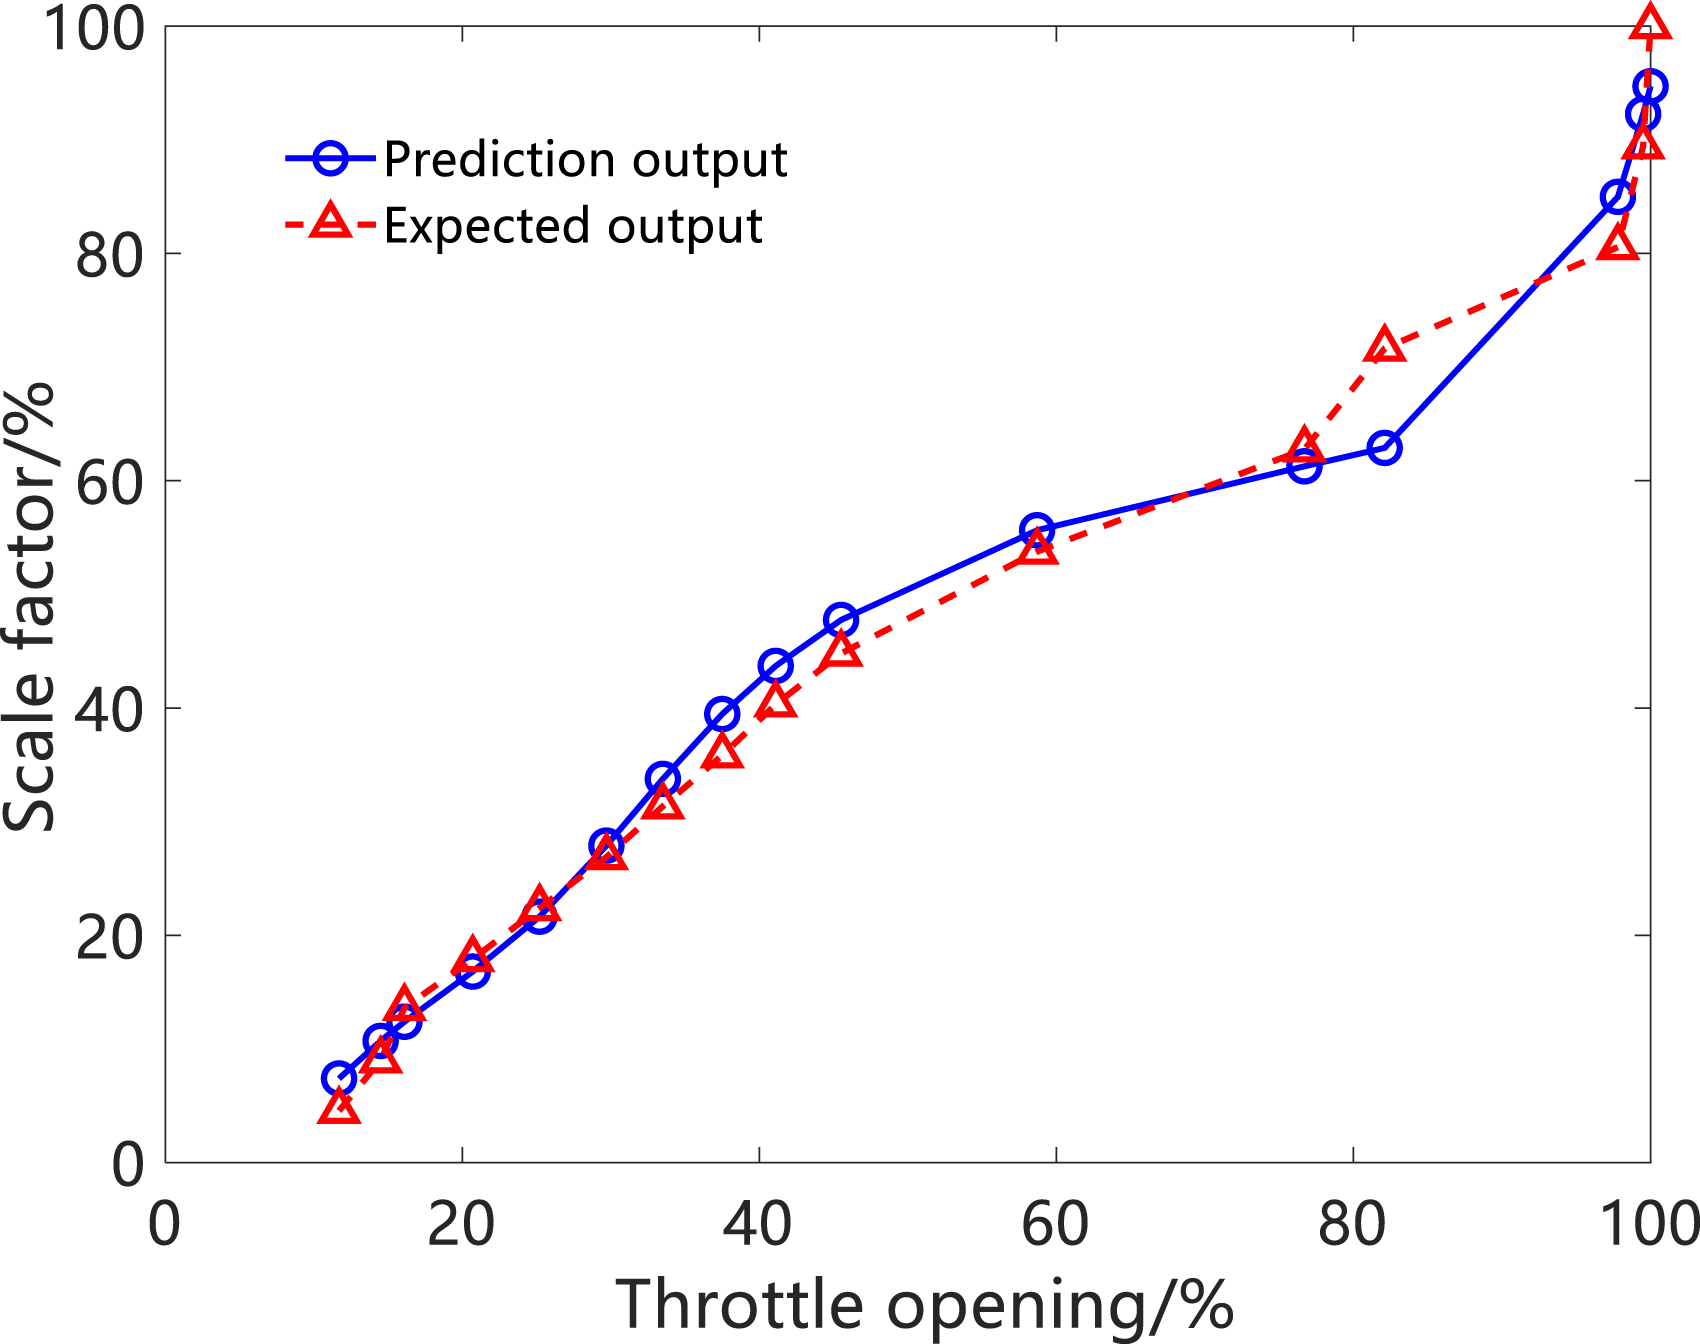
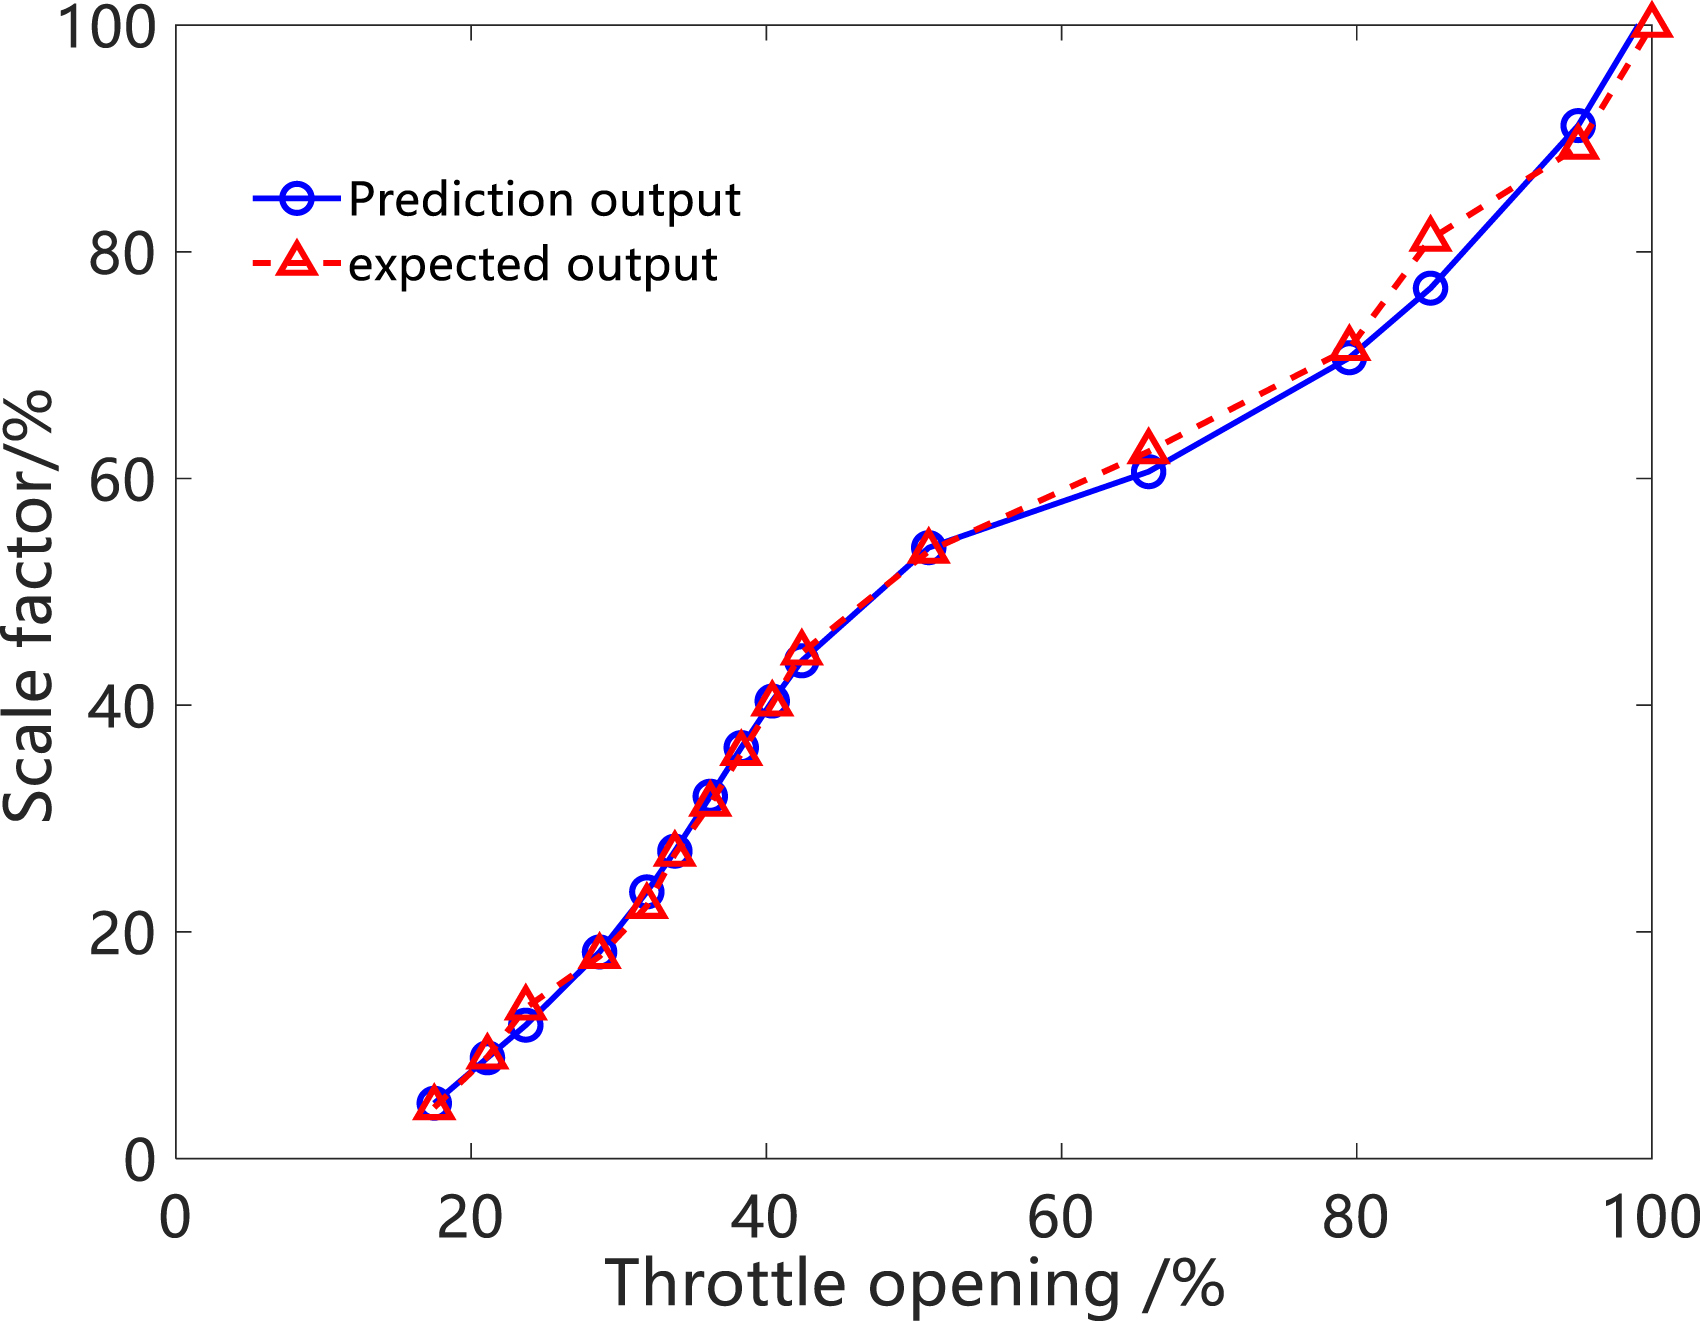
The Figure 11 shows that the prediction results of the model are very close to the experimental results, which shows that the calculation model of cylinder pressure proportional coefficient established by the BP neural network is feasible. To quantify the calculation error of the model, the prediction error percentage is calculated through the formula, and the calculation formula is

The prediction error of the BP neural network model is calculated according to equation (10), and the results are shown in Figure 12. Model prediction error.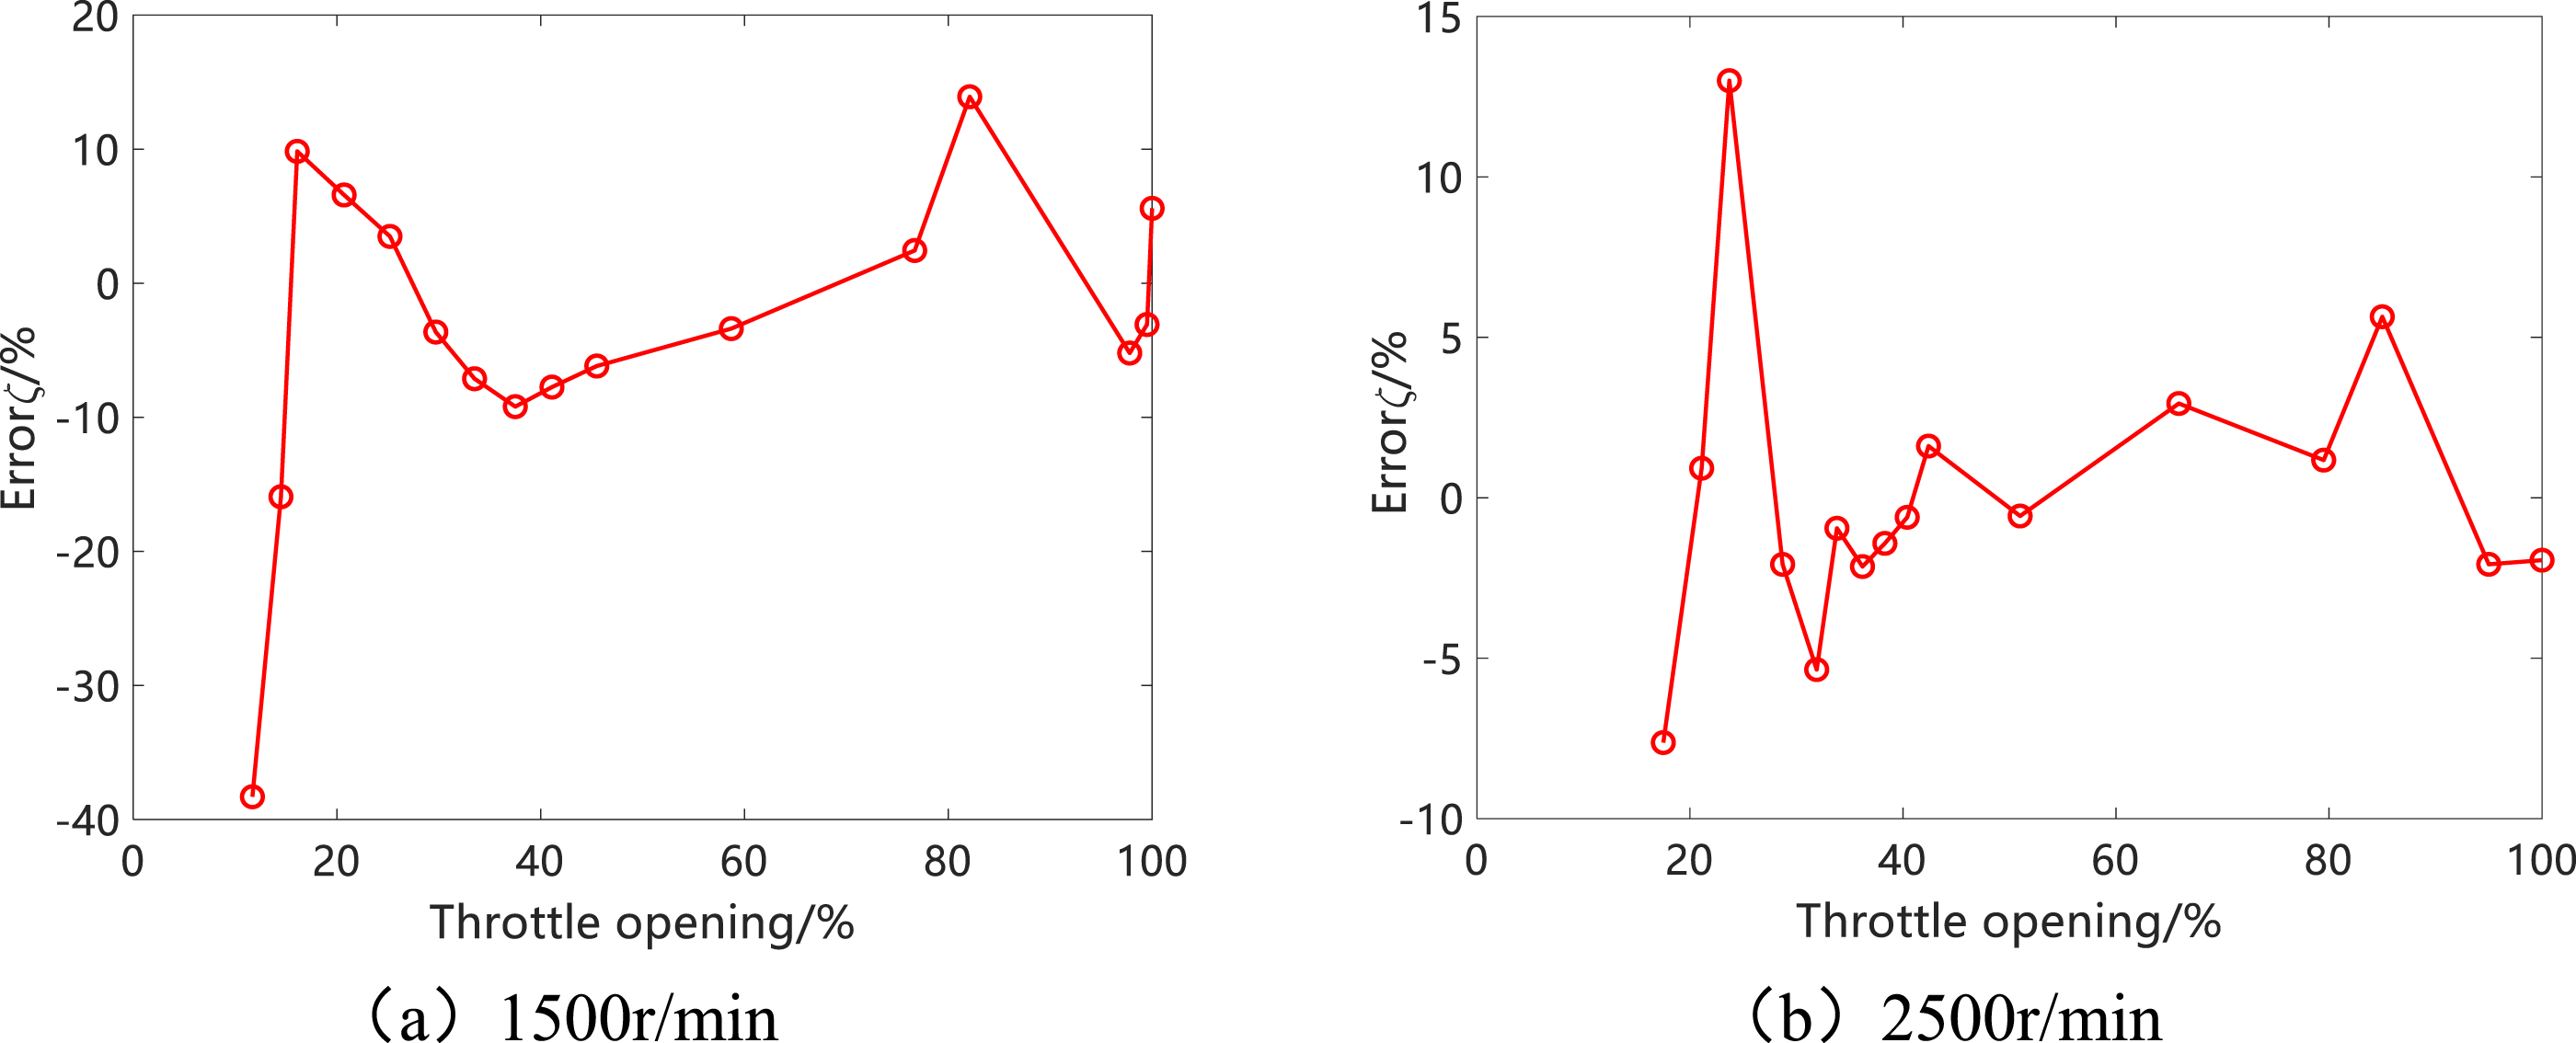
It can be seen from Figure 12 that the maximum error at different speeds occurs when the throttle opening is small. This is because when the throttle opening is small, the value of the cylinder pressure proportional coefficient is small. As long as there is a certain prediction error, the base number is small, and the percentage error will be large. When the throttle opening is the smallest at 1500 r/min, the test value of the cylinder pressure proportional coefficient is 0.0457, while the predicted value of the model is 0.0632. The average error results show that the average absolute error a of 1500 r/min is 8.85%, the average absolute error B of 2500 r/min is 3.13%, and the errors are less than 10%. Therefore, the model meets the simulation requirements of this model.
Single-cylinder engine friction model
Based on the engine output torque model, the loss of the output torque caused by the internal friction of the engine is also considered in this paper. The engine friction model divides the friction torque into several parts, respectively: Piston ring viscous friction torque T
f1
, Piston ring mixed friction torque, T
f2
, Friction torque of piston skirt, T
f3
,Valve friction torque T
f4
, Attachment friction torque T
f5,
and main bearing friction torque T
f6
; detailed calculation of each part can be found in the reference20,21. In summary, the total friction torque of a single cylinder of the engine can be obtained as
Four-cylinder engine model
In terms of the previous analysis, the output torque of each cylinder of the engine can finally be obtained from equations (7)–(11). Due to the phase angle relationship of the four-cylinder engine, the translation method is used to obtain the total output torque of the engine as

Engine model test verification and performance simulation
Test verification
The established engine model is verified by experiments in this section, and the accuracy of the established model is analyzed. The schematic diagram of the engine test bench is shown in Figure 13. The cylinder pressure sensor is Kistler 6052c, Tach-torque sensor is Sichuan Chengbang YB2. The verification conditions are with the throttle fully open, and the speed is 2500 r/min, 3500 r/min, and 4500 r/min, respectively. Engine test diagram.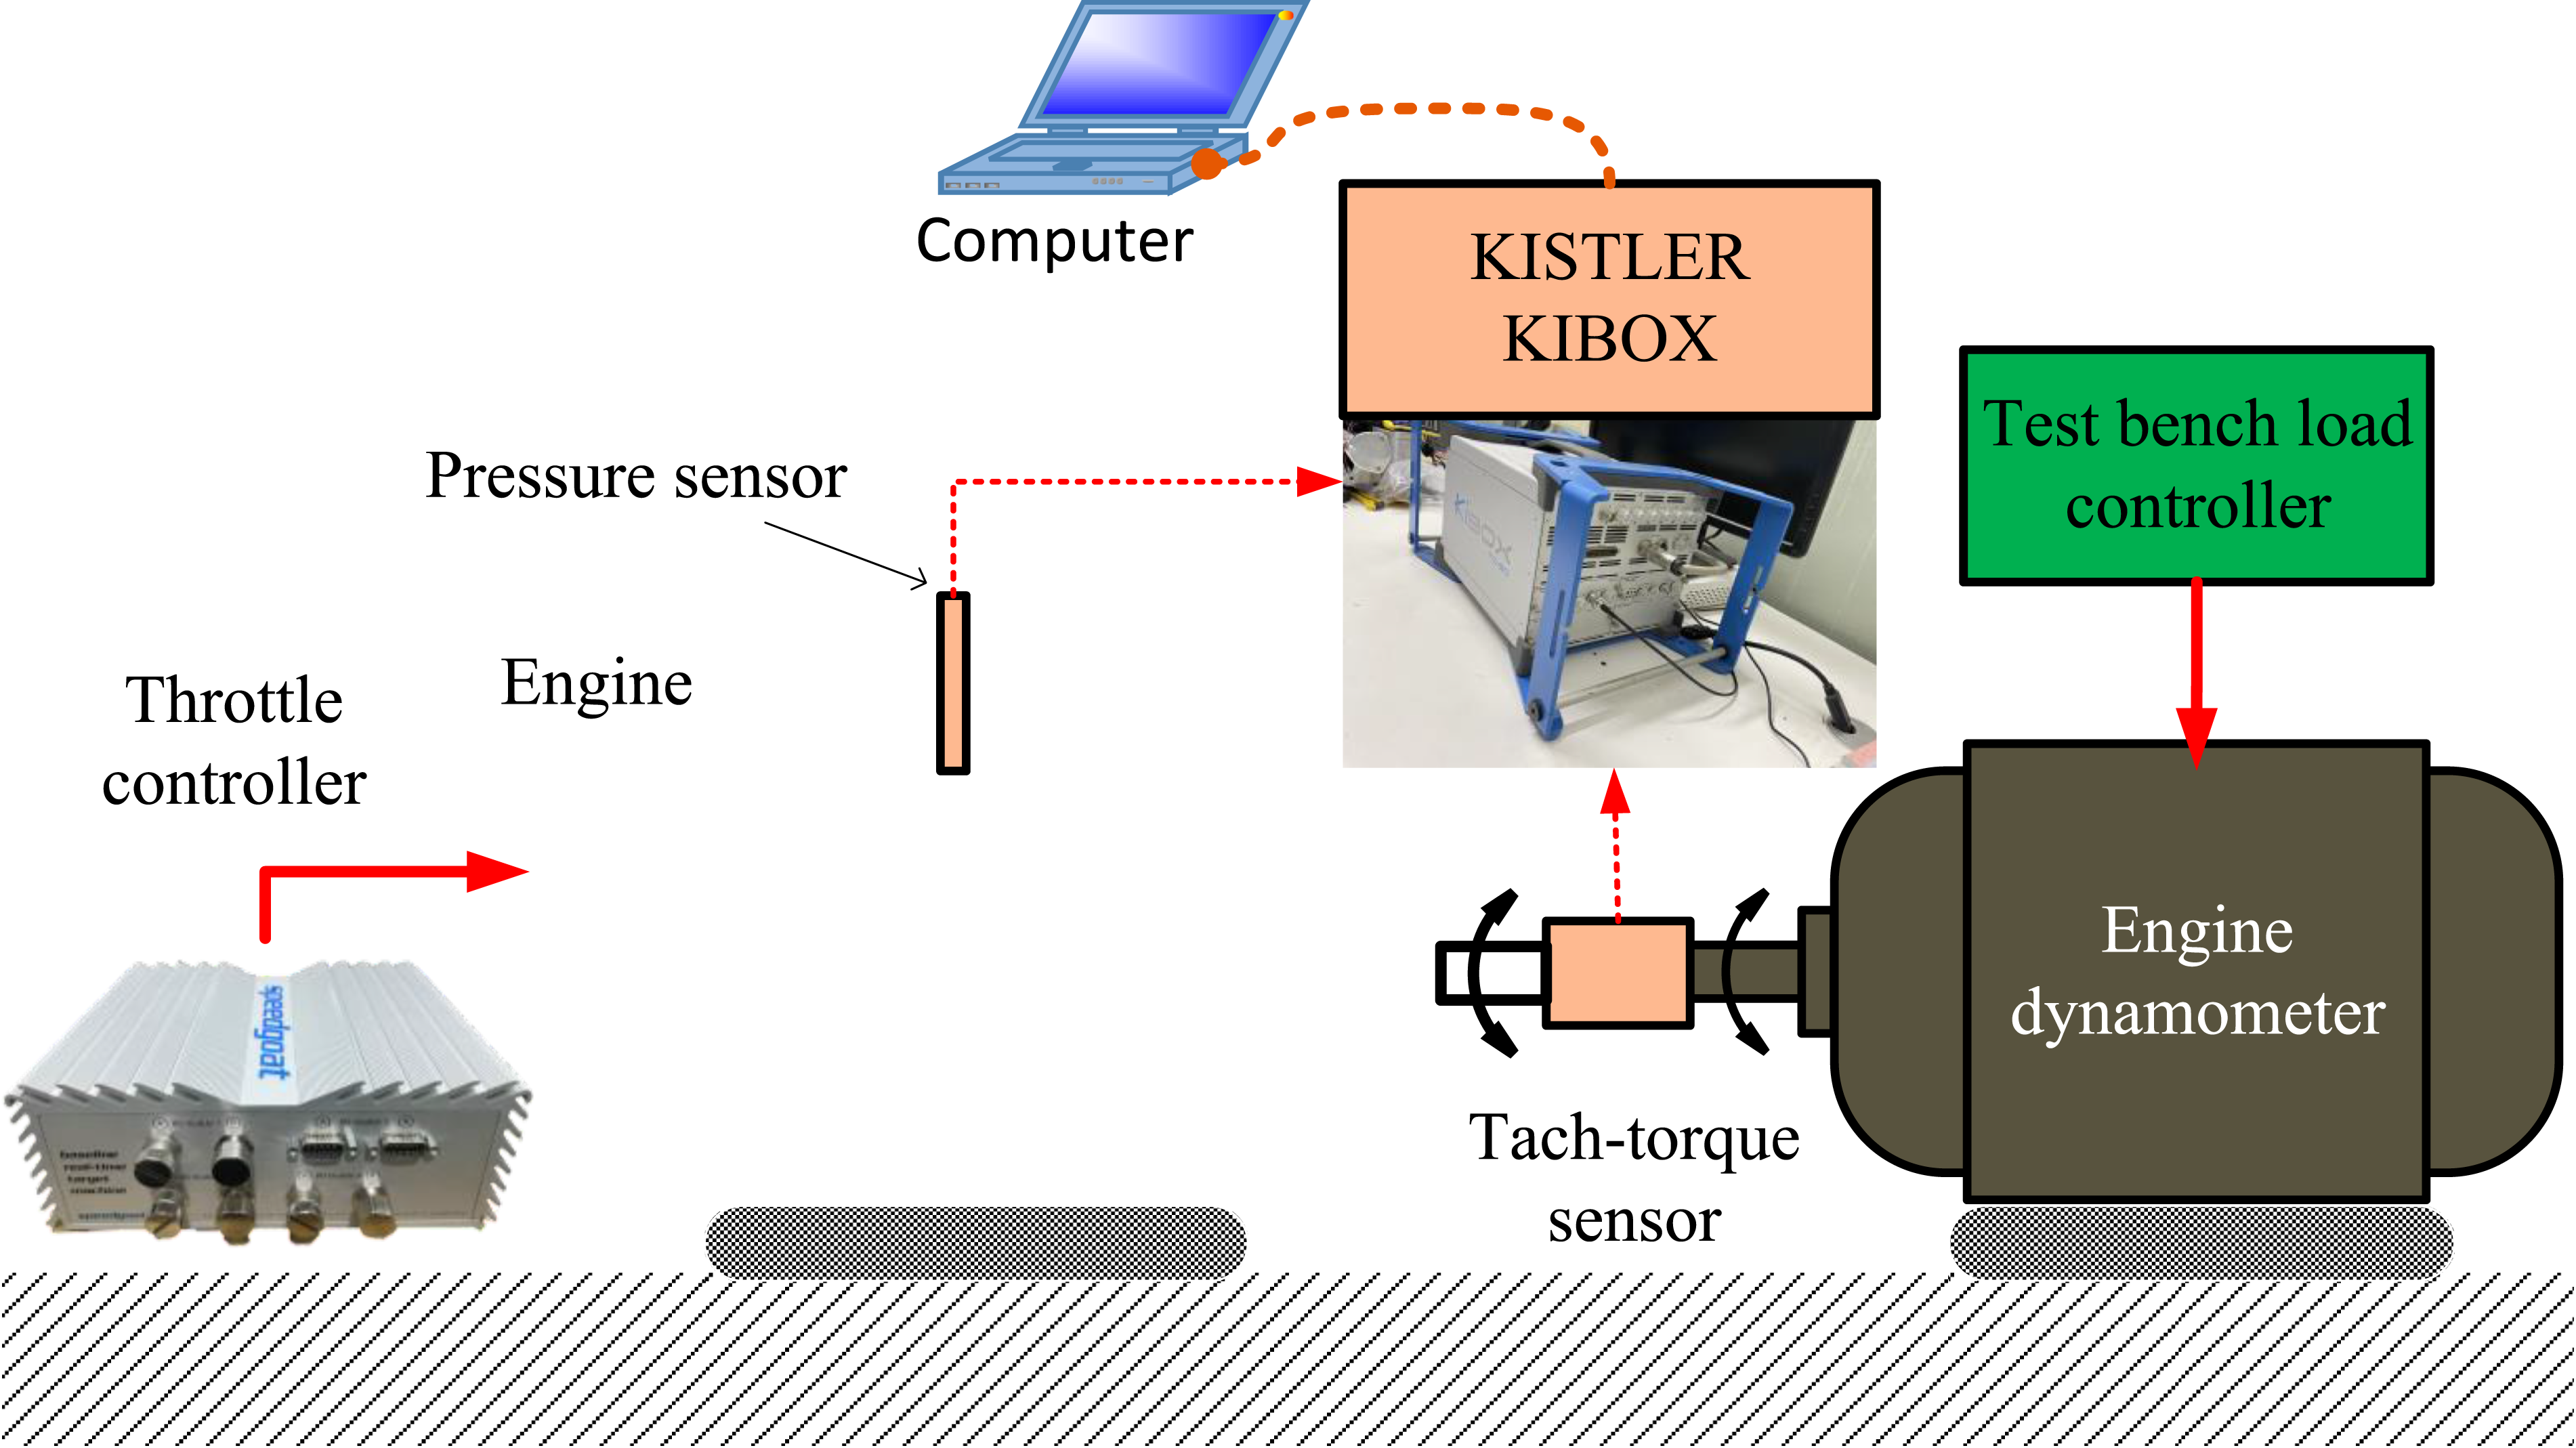
The comparison results of the engine dynamic output torque simulation and test are shown in Figure 14. Engine dynamic torque output at different speeds.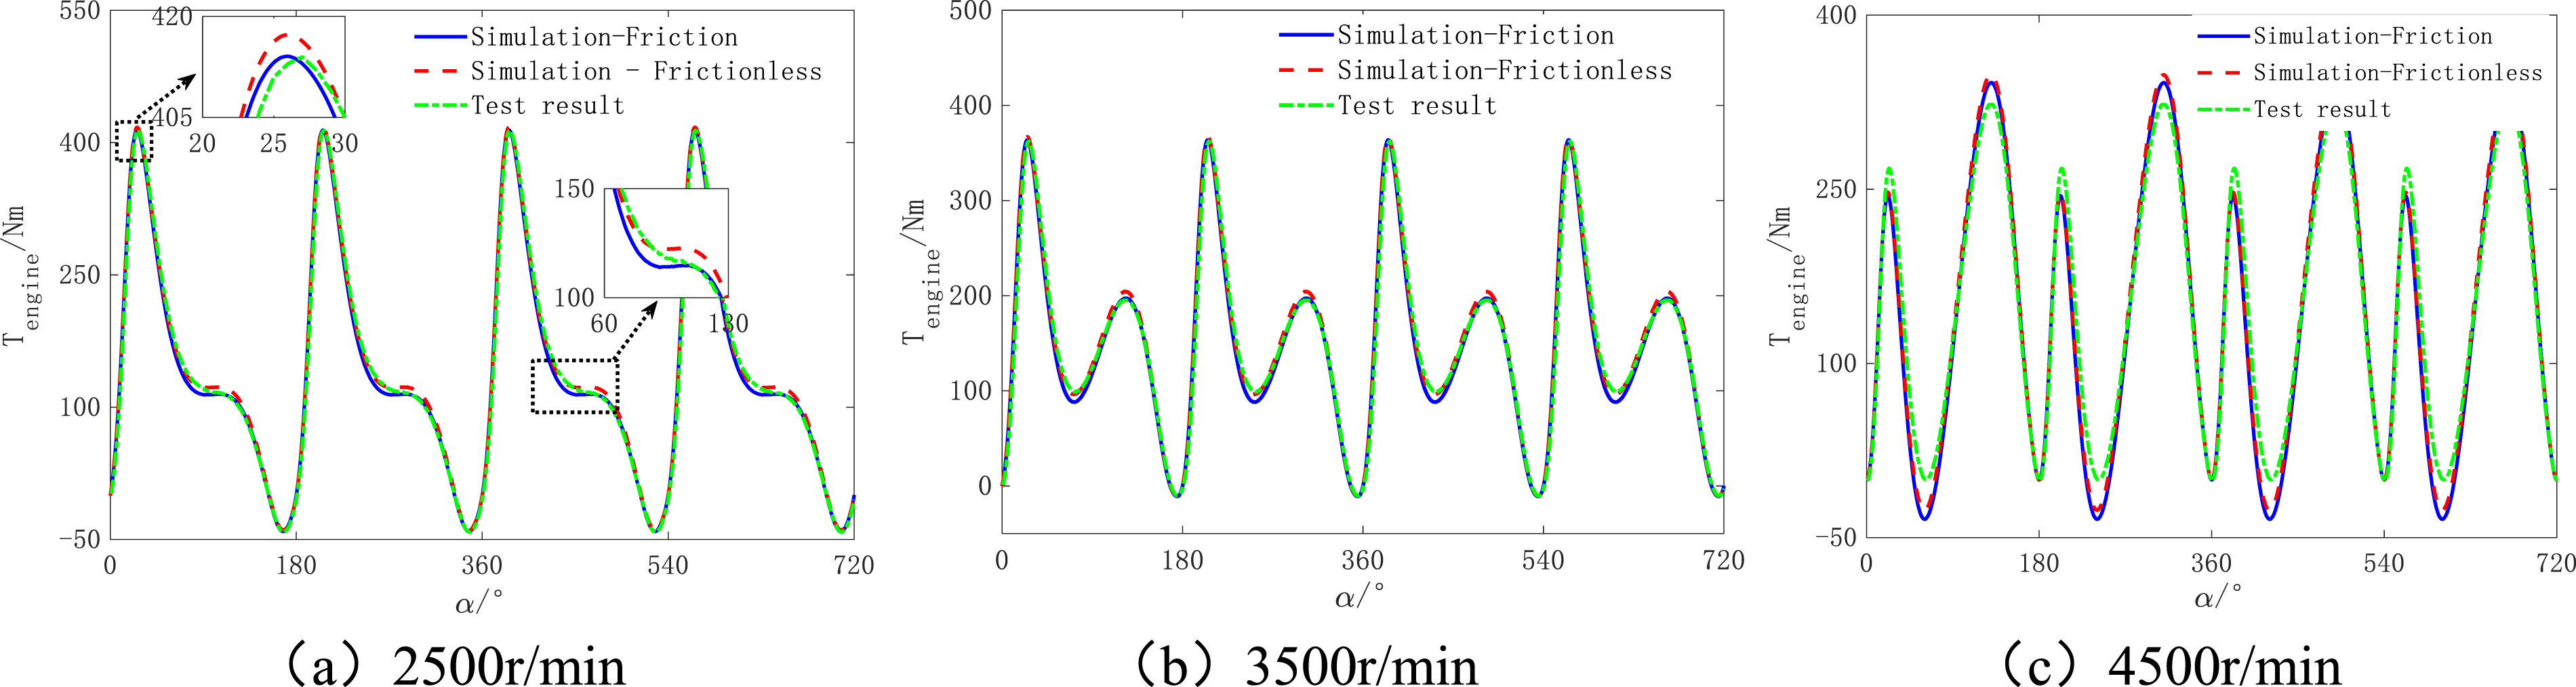
Figure 14 shows the comparison between the simulation and test results of the engine at full throttle and different speeds. It can be seen from the figure that the simulation results are in good agreement with the test results, and the dynamic output torque of the engine can better reflect the actual dynamic characteristics of the engine, which lays a foundation for the subsequent simulation of the torsional vibration of the drive train. The engine simulation results with and without the friction model are compared, and it can be seen that the engine model with friction considered is closer to the test results, so the engine model with friction considered is more accurate and more realistic. At the same time, by comparing the engine dynamic torque output results at different speeds, it can be found that the model error tends to increase with the increase in speed. This may be due to the error between the engine friction model and the actual, and the damping is greatly affected by the rotational speed, resulting in a larger output torque error of the engine model as the rotational speed increases, but in general, the error is mainly concentrated at the instantaneous torque peak, and the overall torque fluctuation trend of the engine is consistent with the waveform, so the accuracy of the model meets the subsequent simulation requirements of this paper.
Simulation analysis
The engine output torque under the condition of partial open throttle and the engine output torque under variable speed is simulated and analyzed. Figure 15 shows the simulation results of engine output torque under different throttle openings, and Figure 16 shows the simulation output results of dynamic torque under non-steady-state variable speed conditions. Simulation results of different throttle opening. Torque output during engine acceleration.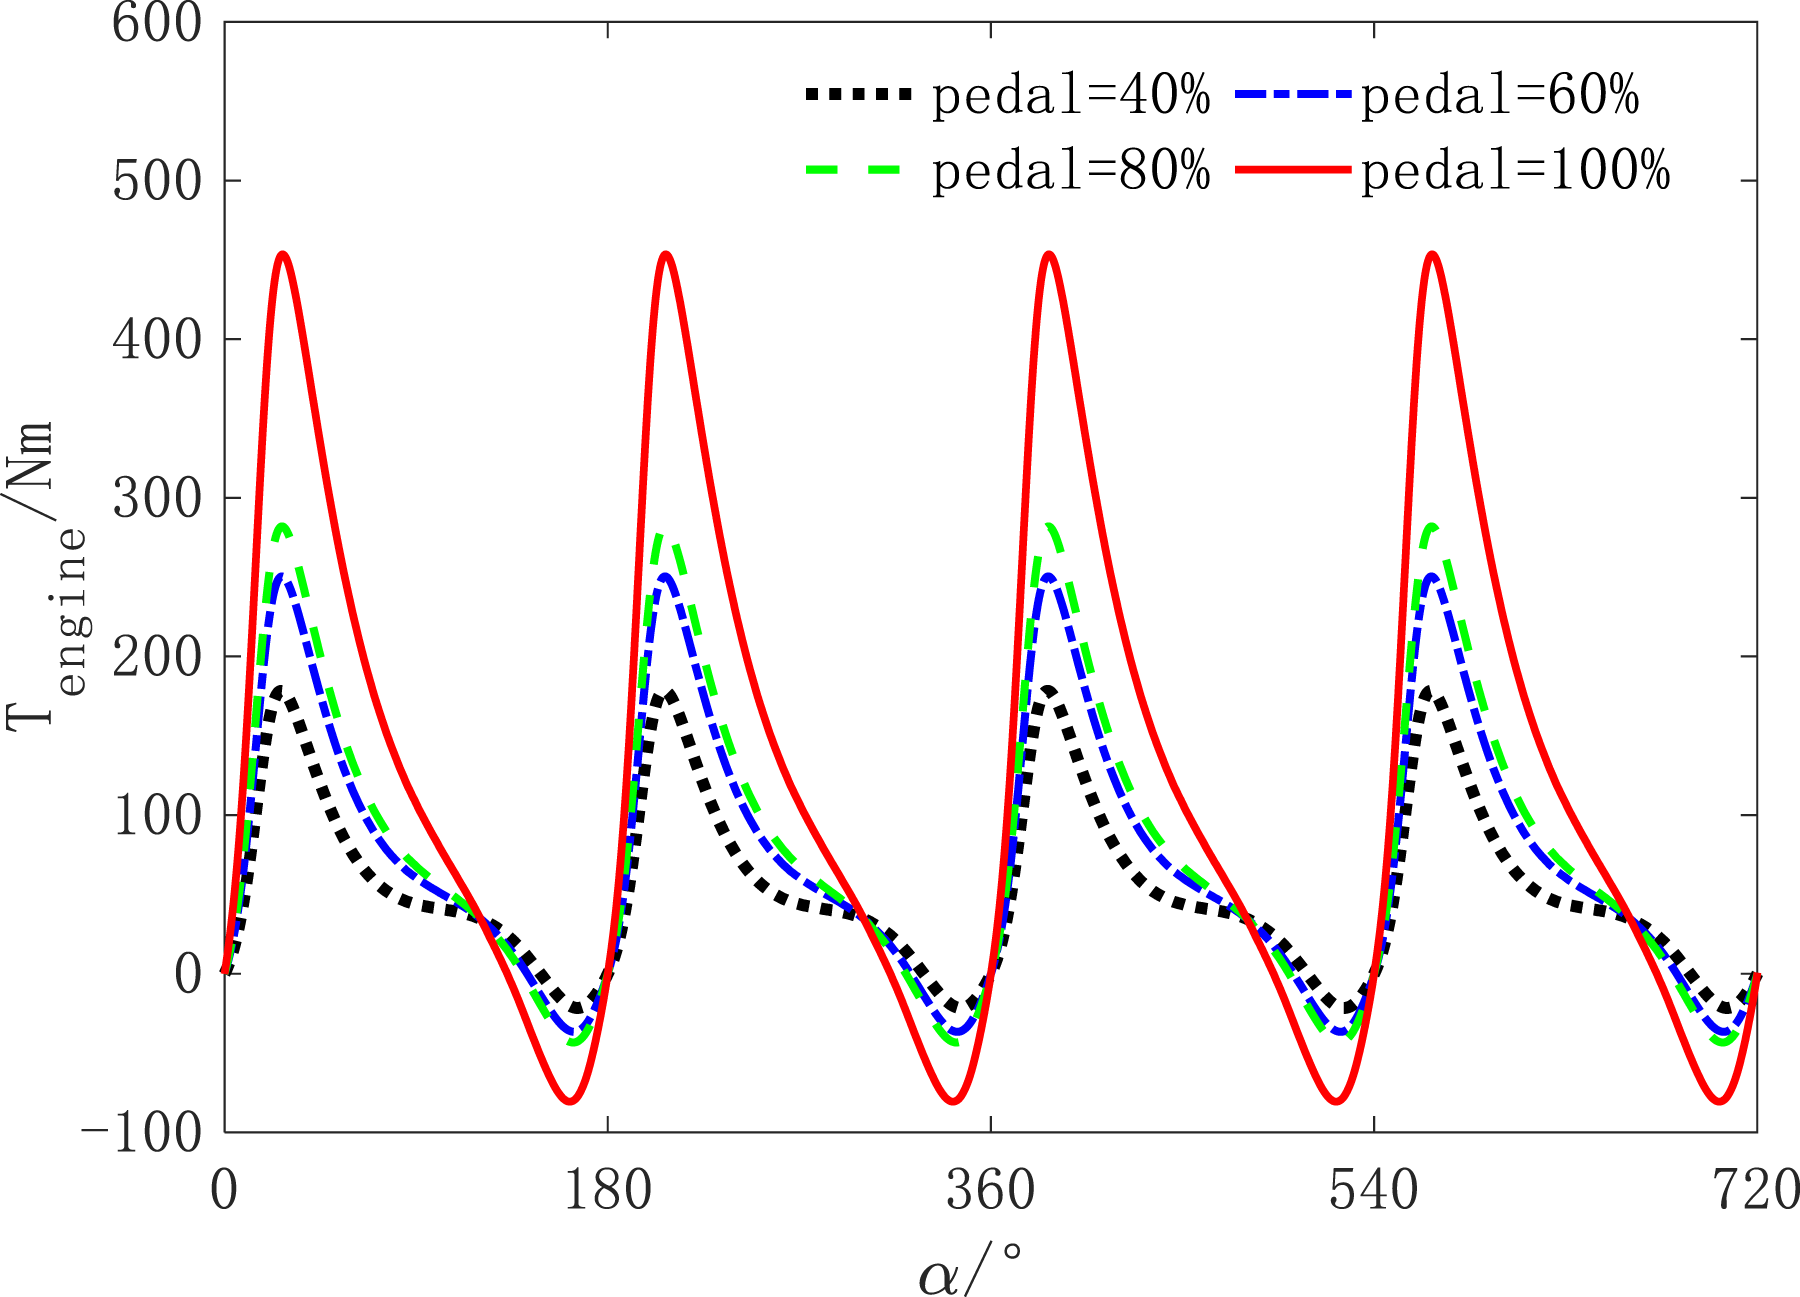
As shown in Figure 15, the engine speed is 1500r/min. As an example, the engine output torque also changes greatly with the change of throttle opening; With the decrease of throttle opening, the reduction rate of engine output torque peak shows a fast-slow-fast changing trend. Combining with Figure 16, it can be seen that the cylinder pressure proportional coefficient calculated from the throttle opening decreases as the throttle opening decreases. Its changing trend also showed a decreasing trend of fast-slow-fast. When the throttle valve opening is in the two ranges of 10%–50% and 80%–100%, the cylinder pressure proportional coefficient is more sensitive and the slope is large; in the 50%–80% range, the change is relatively gentle. The engine output characteristics are reflected in that when the throttle valve opening is reduced from 100% to 80% and from 60% to 40%, the engine output torque is greatly reduced. While the throttle opening is reduced from 80% to 60%, the reduction of engine output torque is small, which also proves the accuracy of the engine model established in this paper.
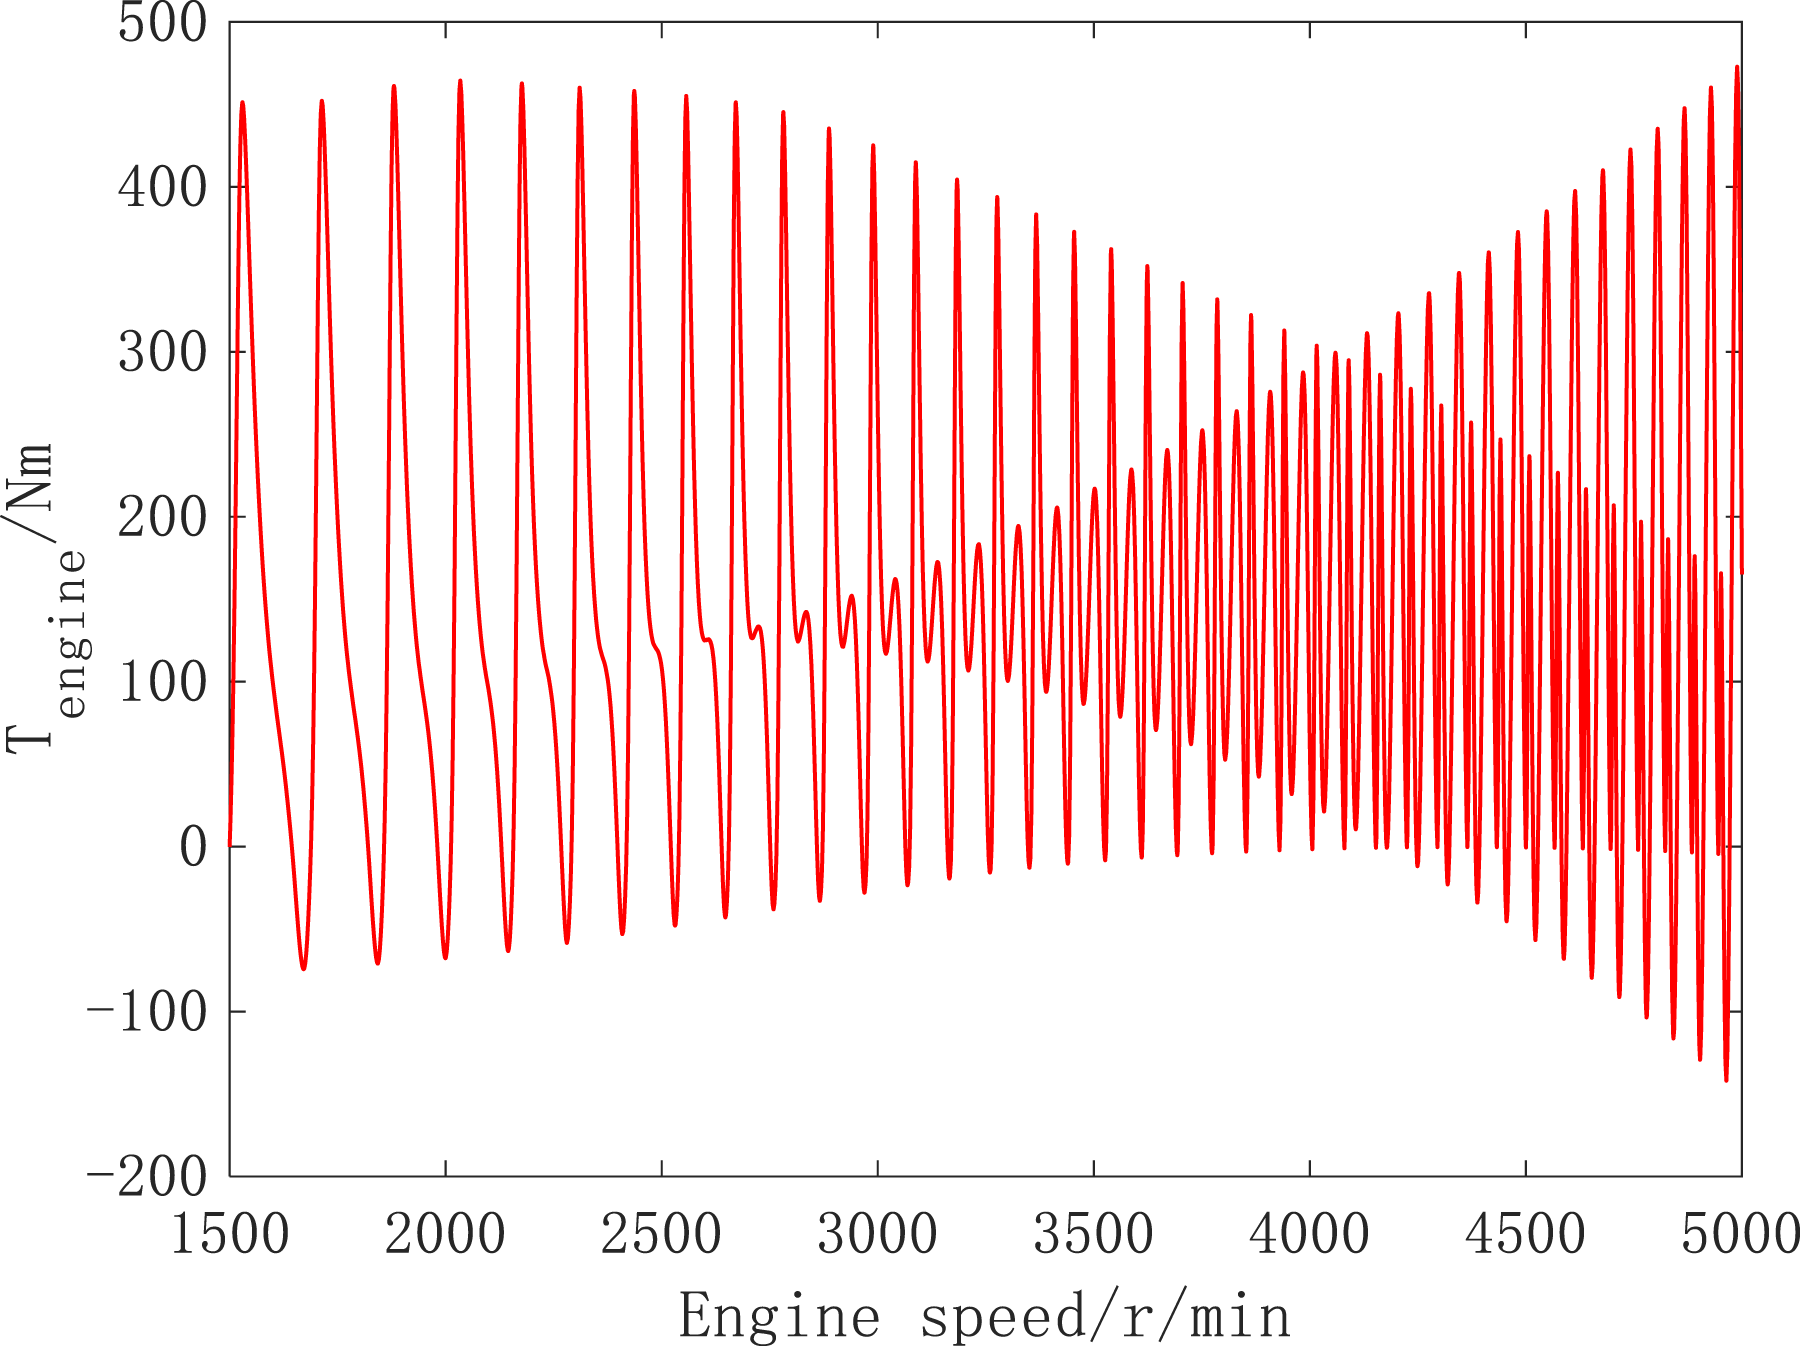
Figure 16 shows the simulation of the engine unsteady working conditions. With the change of engine speed, the engine output torque also changes, which shows that the model in this paper can reflect the dynamic characteristics of the engine, The model in this paper can be used to simulate the transient and unsteady conditions of the powertrain, such as ignition condition, starting condition, acceleration condition, and deceleration condition, to make a more comprehensive simulation analysis of the torsional vibration of the powertrain.
Conclusion
(1) In view of the problems of the small amount of data on the cylinder pressure surface of the engine and the contradiction between the accuracy and efficiency in the online interpolation calculation, in this paper, a method of offline + online quadratic interpolation of engine cylinder pressure surface is proposed, which effectively improves the efficiency of simulation calculation, and the calculation peak error is only 2.9%. (2) In this paper, the influence of the throttle opening on the dynamic torque output of the engine is considered, and the calculation model of the cylinder pressure proportional coefficient is established by using the BP neural network. The test verifies that the average prediction error of the model is less than 10%, which meets the needs of engineering simulation. (3) In the dynamic torque model of the engine established, the influence of factors such as throttle opening, speed, and friction are comprehensively considered. The simulation results are compared with the experimental data to verify the accuracy of the model. The model comprehensively reflects the characteristics of the dynamic torque fluctuation of the real engine with the change of throttle opening and speed. It can be used for the simulation analysis of torsional vibration of automobile powertrains and improve the accuracy of simulation results.
Footnotes
Declaration of conflicting interests
The author(s) declared no potential conflicts of interest with respect to the research, authorship, and/or publication of this article.
Funding
The author(s) disclosed receipt of the following financial support for the research, authorship, and/or publication of this article: This work was supported by the National Key R&D Program of China (No.2020YFB1314001), the Fundamental Research Program of Shanxi Province (No.20210302124119), the Foundation of State Key Laboratory of Automotive Simulation and Control (No.20210218) and the China Postdoctoral Science Foundation (No. 2024M753542).