
Abstract
The dissertation proposes a prediction model that enhances the BP (Backpropagation) neural network using the WOA (Whale Optimization Algorithm) to address the issue of local convergence during prediction. The model optimizes the initial weights and thresholds of the network using the whale optimization algorithm, resolving the problem of BP’s local convergence. Feature data is selected using the correlation coefficient theory to obtain the model inputs. Bearing performance degradation assessment is conducted using the predicted remaining life index. The superiority of the model is validated by comparing its predictions with those of BP and LSTM prediction models.
Introduction
Rolling bearings are indispensable components in rotating machinery, which are extensively utilized in industrial production. They serve as a crucial element in guaranteeing the smooth and efficient functioning of the machinery. The rapid development of modern industry has made large machinery and equipment tend to be automated, complex, and high-precision, and the operating environment is highly concentrated, so that the damage and failure of any parts and components will cause the stop of mechanical equipment, resulting in the stagnation of enterprise production and bringing huge economic losses. Rolling bearings are a frequent place for accidents in mechanical equipment, according to relevant statistics, about 30% of mechanical equipment failures are due to rolling bearing performance failure. Therefore, the prediction and evaluation of rolling bearing performance is highly important. For the diagnosis of composite faults of roller bearings, Pan proposed a method of kurtosis deconvolution based on periodic component tracking, which minimizes the influence of large energy noise on periodic estimation. 1 A method was proposed by Feng to evaluate the reduction in the operational efficiency of rolling bearings. Using adaptive sensitive features, which addressed the issue of the redundant information in the signal not being able to accurately reflect the degradation performance evaluation of various indicators of rolling bearings. 2 To enhance the precision of forecasting the service life of rolling bearings, Chen proposed an optimal mathematical function search method using genetic algorithm for high-precision prediction. 3 Wang proposed an Attention-LSTM method for improving rolling bearing performance degradation assessment and prediction. 4 Hou put forward a novel approach that combines a genetic algorithm with a chaotic algorithm to optimize the BP model. This innovative method effectively enhanced the diversity of the initial population, leading to remarkable improvements in both convergence speed and solution quality. 5 The beetle algorithm was employed by Xiao to enhance the computing of the BP neural network model, resulting in superior identification of bearing faults. A remarkable ability to converge to the global minimum error value in a shorter time frame was demonstrated by the beetle algorithm, in contrast to the particle swarm optimization algorithm, leading to a substantial reduction in the training time. 6 The Backpropagation algorithm was employed by Yang to prognosticate the degradation trajectory of rolling bearings, and GA (Genetic Algorithm) was integrated to fine-tune the parameters of the BP. Furthermore, a comparative analysis was conducted between the optimized BP model and the prognostication outcomes obtained through PSO (Particle Swarm Optimization) BP network parameters. 7 A long short-term memory network based residual life prognostication methodology was employed by Wang to tackle the issue of rolling bearing residual life prediction. 8 An enhanced Kalman filter was proposed by Li, which effectively mitigates the impact of stochastic noise and was integrated with the Wiener model to predict the residual lifespan. 9 The method proposed by Wang involves the utilization of the SSA for the optimization of the parameters of the VMD (Variational Mode Decomposition) technique. The robustness and efficiency of the VMD method are enhanced through the adaptive adjustment of parameters using SSA (Sparrow Search Algorithm), ultimately leading to more precise and reliable fault diagnosis results. 10 Cor-MLE based parameter estimation approach proposed by Liu can be utilized to obtain more accurate and refined parameter estimates for Weibull distribution, thereby improving the precision and reliability of the statistical analysis. 11 Rui Jiao proposed a feature extraction and fault diagnosis method based on fractional-order backpropagation neural networks. The vibration signals are optimized by a novel sine-cosine algorithm for variational mode decomposition, and fault feature vectors are selected and constructed through singular value decomposition. Inspired by fractional calculus, fractional-order backpropagation neural networks are employed for fault classification. 12
To enhance the predictive accuracy of the BP model and address its drawbacks such as poor stability and susceptibility to local optima, the excellent global search capability of the Whale Optimization Algorithm is utilized to refine the network’s weights and thresholds. This paper validates the excellent predictive capability of the newly proposed model using the PHM2012 dataset.
Theory
Back propagation neural network theory
Back propagation neural network consists of multiple neurons and transmission channels, which are designed based on the neural characteristics of biological organisms.
13
The neural network architecture comprises an initial input layer receives and preprocesses the input data, an intermediate hidden layer performs complex computations and feature extraction, and a final output layer produces the desired output or prediction. The process of training neural networks involves the continuous adjustment of the connection weights and bias values between neurons, thus, the discrepancy between the output outcomes and the anticipated results is progressively diminished. The training process of the BP model primarily comprises two phases: the data forward propagation stage, which involves the transmission of information through the network, and the data backward propagation stage, which entails the iterative adjustment of network parameters based on the error gradient. Forward propagation refers to the process of data flowing from input to output in a model. In the model, each neuron applies a set of weighted and nonlinear transformations to the input data, resulting in an output. The synaptic weights and bias terms linking each layer of neurons undergo iterative adjustments via the backpropagation algorithm, which relies on the discrepancy between the output values and the intended target values. The objective of this procedure is to substantially diminish the discrepancy between the anticipated outcome and the factual outcome, thereby augmenting the precision and efficacy of the neural network. After multiple experiments, the structure of the BP neural network model was set to three input ports, one output port, and two hidden layers. The three-layer topology of BP in this study is shown in Figure 1. The three-tier topology of the BP in this research is shown in Figure 1. Network topology.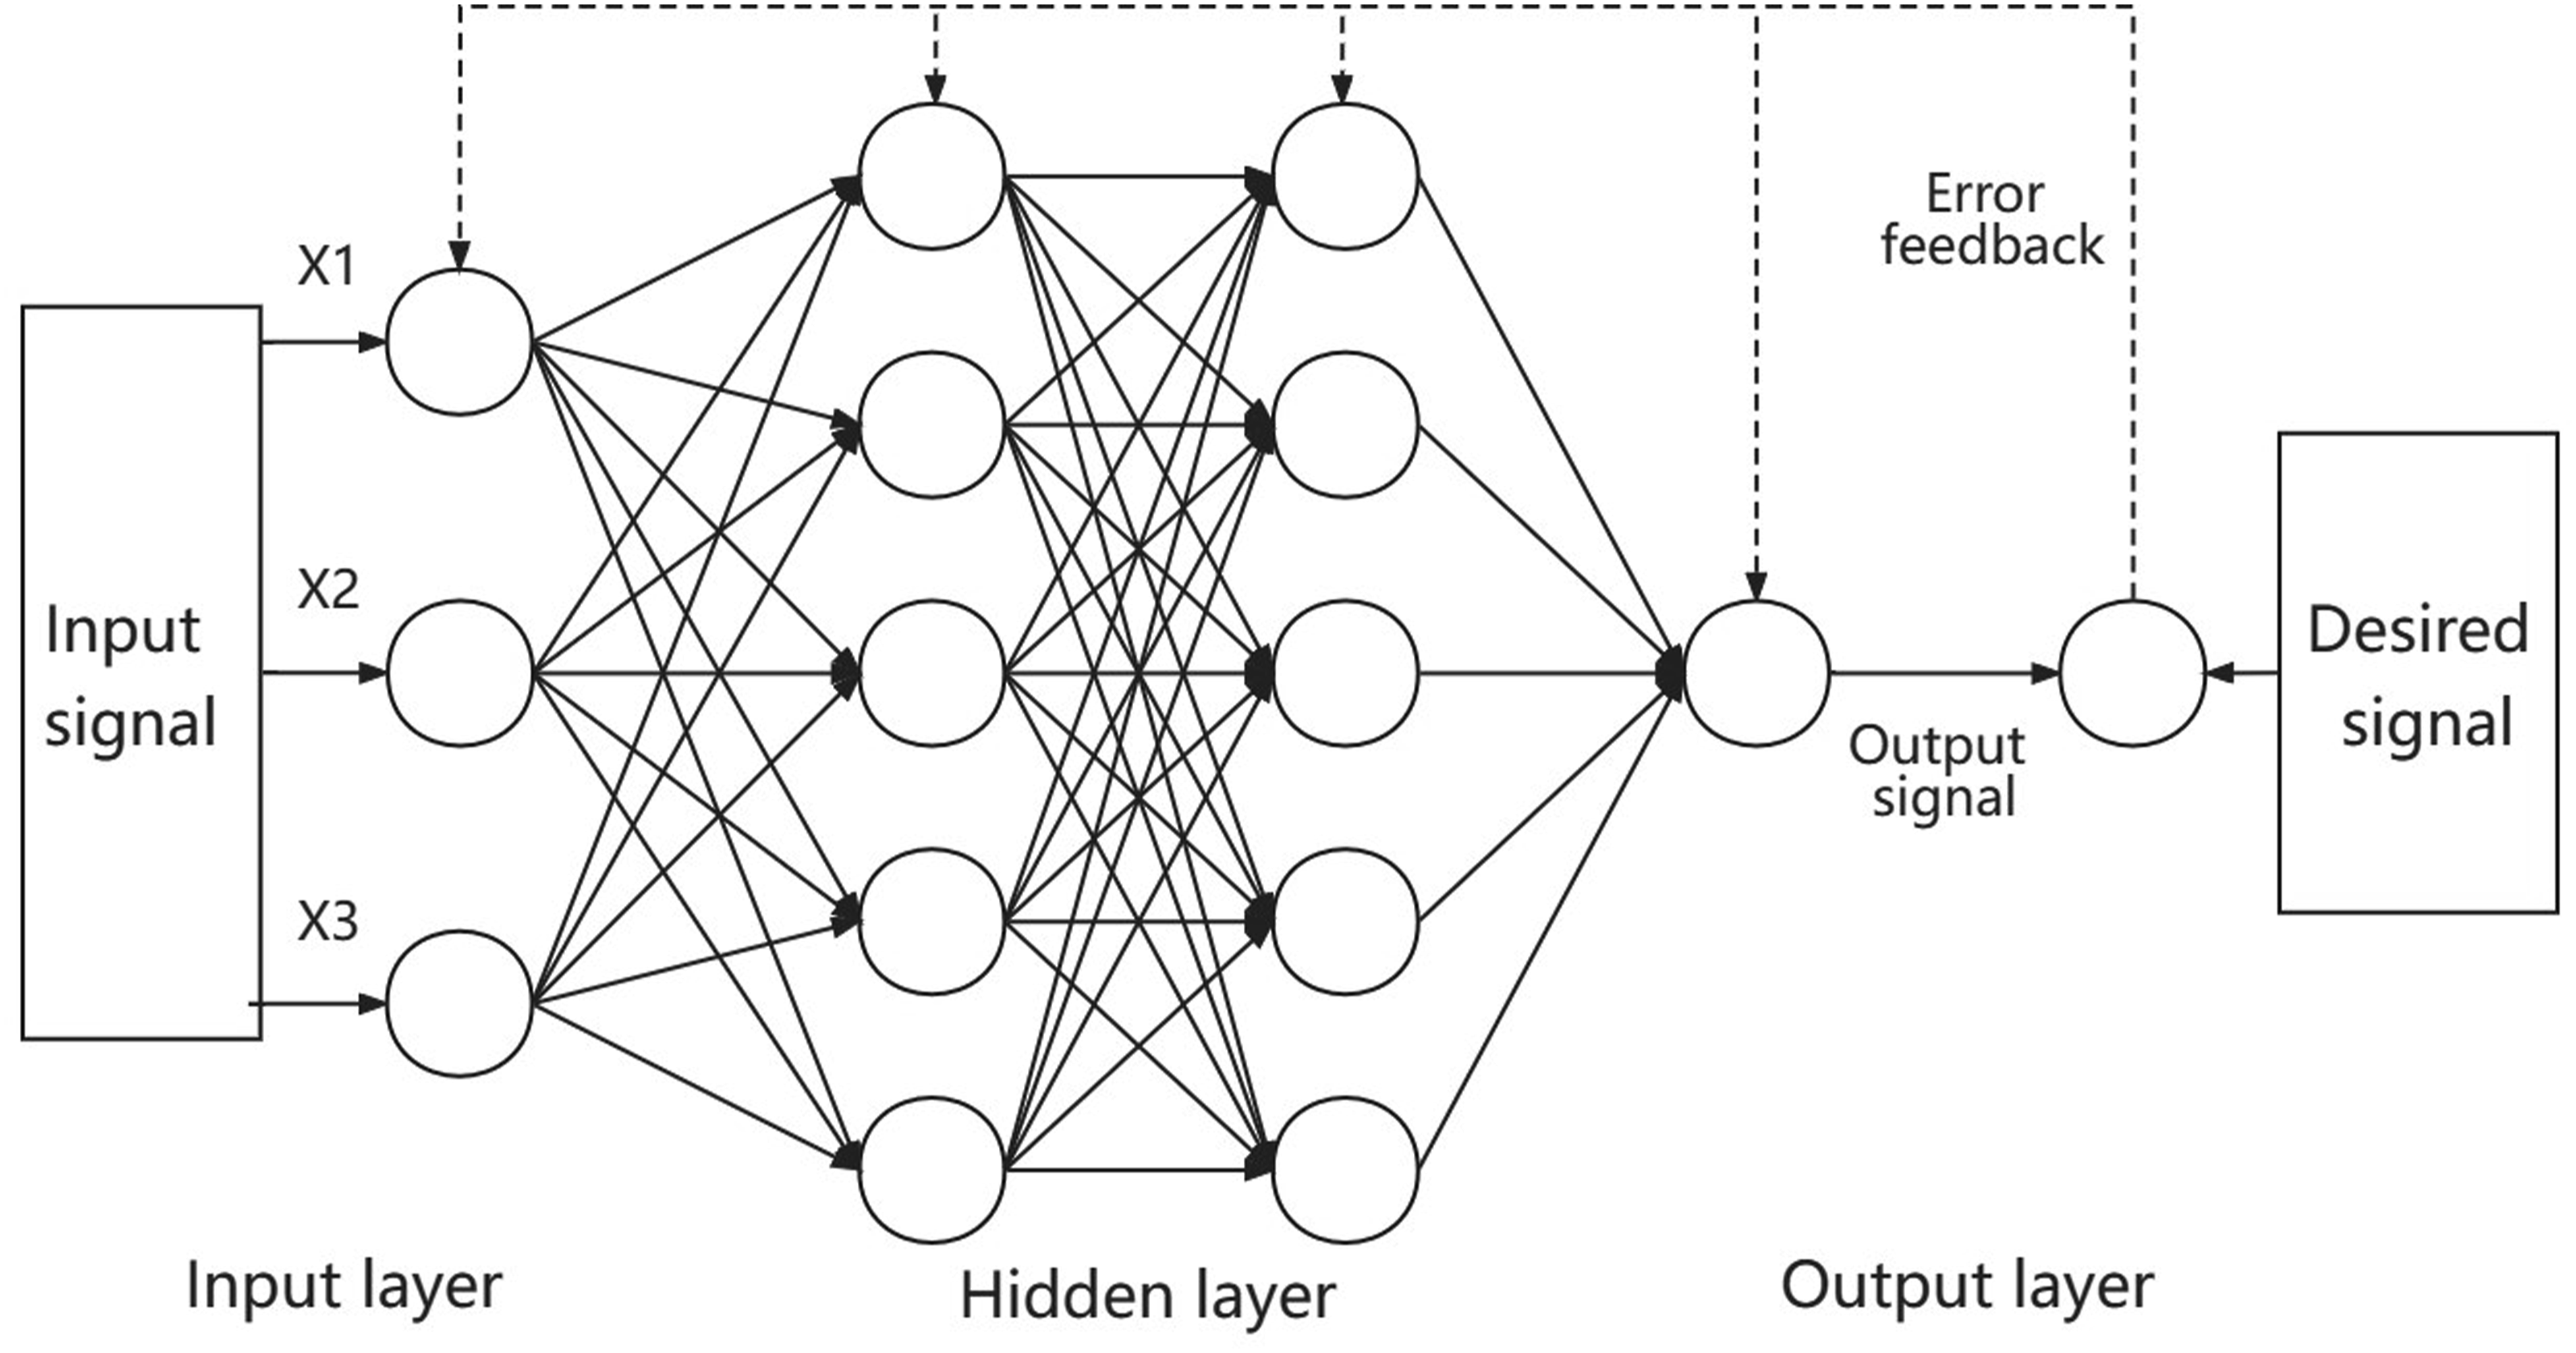
Selection formula of hidden layer:

The number of hidden neurons is represented by
The forward propagation process: assume that the weight between the two nodes is


Back propagation process: The backpropagation algorithm for BP neural networks is derived from the Widrow-Hoff learning rule. Modifying the weights between neurons can effectively adjust the difference, thereby minimizing overall error. Let the realized output value be denoted as

The iterative procedure of updating the weights and biases connecting the hidden layer and output layer is entailed by the gradient descent algorithm. The gradient of the loss function with respect to these parameters is computed. The optimal values of the weights and biases are identified through a systematic search of the parameter space, seeking to minimize the discrepancy between the predicted output and the ground truth, the formula is as follows:


The weights and thresholds between network neurons are adjusted through the following process:


WOA algorithm
The full name of WOA is whale optimization algorithm. 14 WOA is an optimization heuristic grounded in the emergent properties of whale populations in nature. The algorithm models diverse behaviors exhibited by whale populations to attain optimization objectives. The algorithm includes three parts: encircling prey, capturing prey, and searching prey.
Encircling prey: the whale’s search area encompasses the entire global solution space, and the optimal position of the prey must be identified prior to encirclement. The calculation formula is


Catching prey: Whale hunting habits are gradually narrowing the enclosure along the spiral path, and in the process of shrinking, bubbles are continuously spewed out for “bubble net attack.” The calculation formula is


Let
Search for prey: In order to make the whale fully search in the solution space, the algorithm updates the position according to the distance of the whale individual feedback, and randomly selects the feasible solution to expand the search space. The calculation formula is


Prediction methods and processes
Experimental data platform
PRONOSTIA is a sophisticated accelerated life testing platform designed specifically for the purpose of verifying and validating advanced algorithms for detecting, diagnosing, and predicting bearing faults. The platform is designed by FEMTO-ST Institute AS2M. Change the operating conditions of the bearing to make it wear and fault more quickly, and install different types of sensors to collect the vibration signal, temperature, load and other operating data in real time during the bearing experiment. Its basic structure is shown in Figure 2. Experimental platform structure.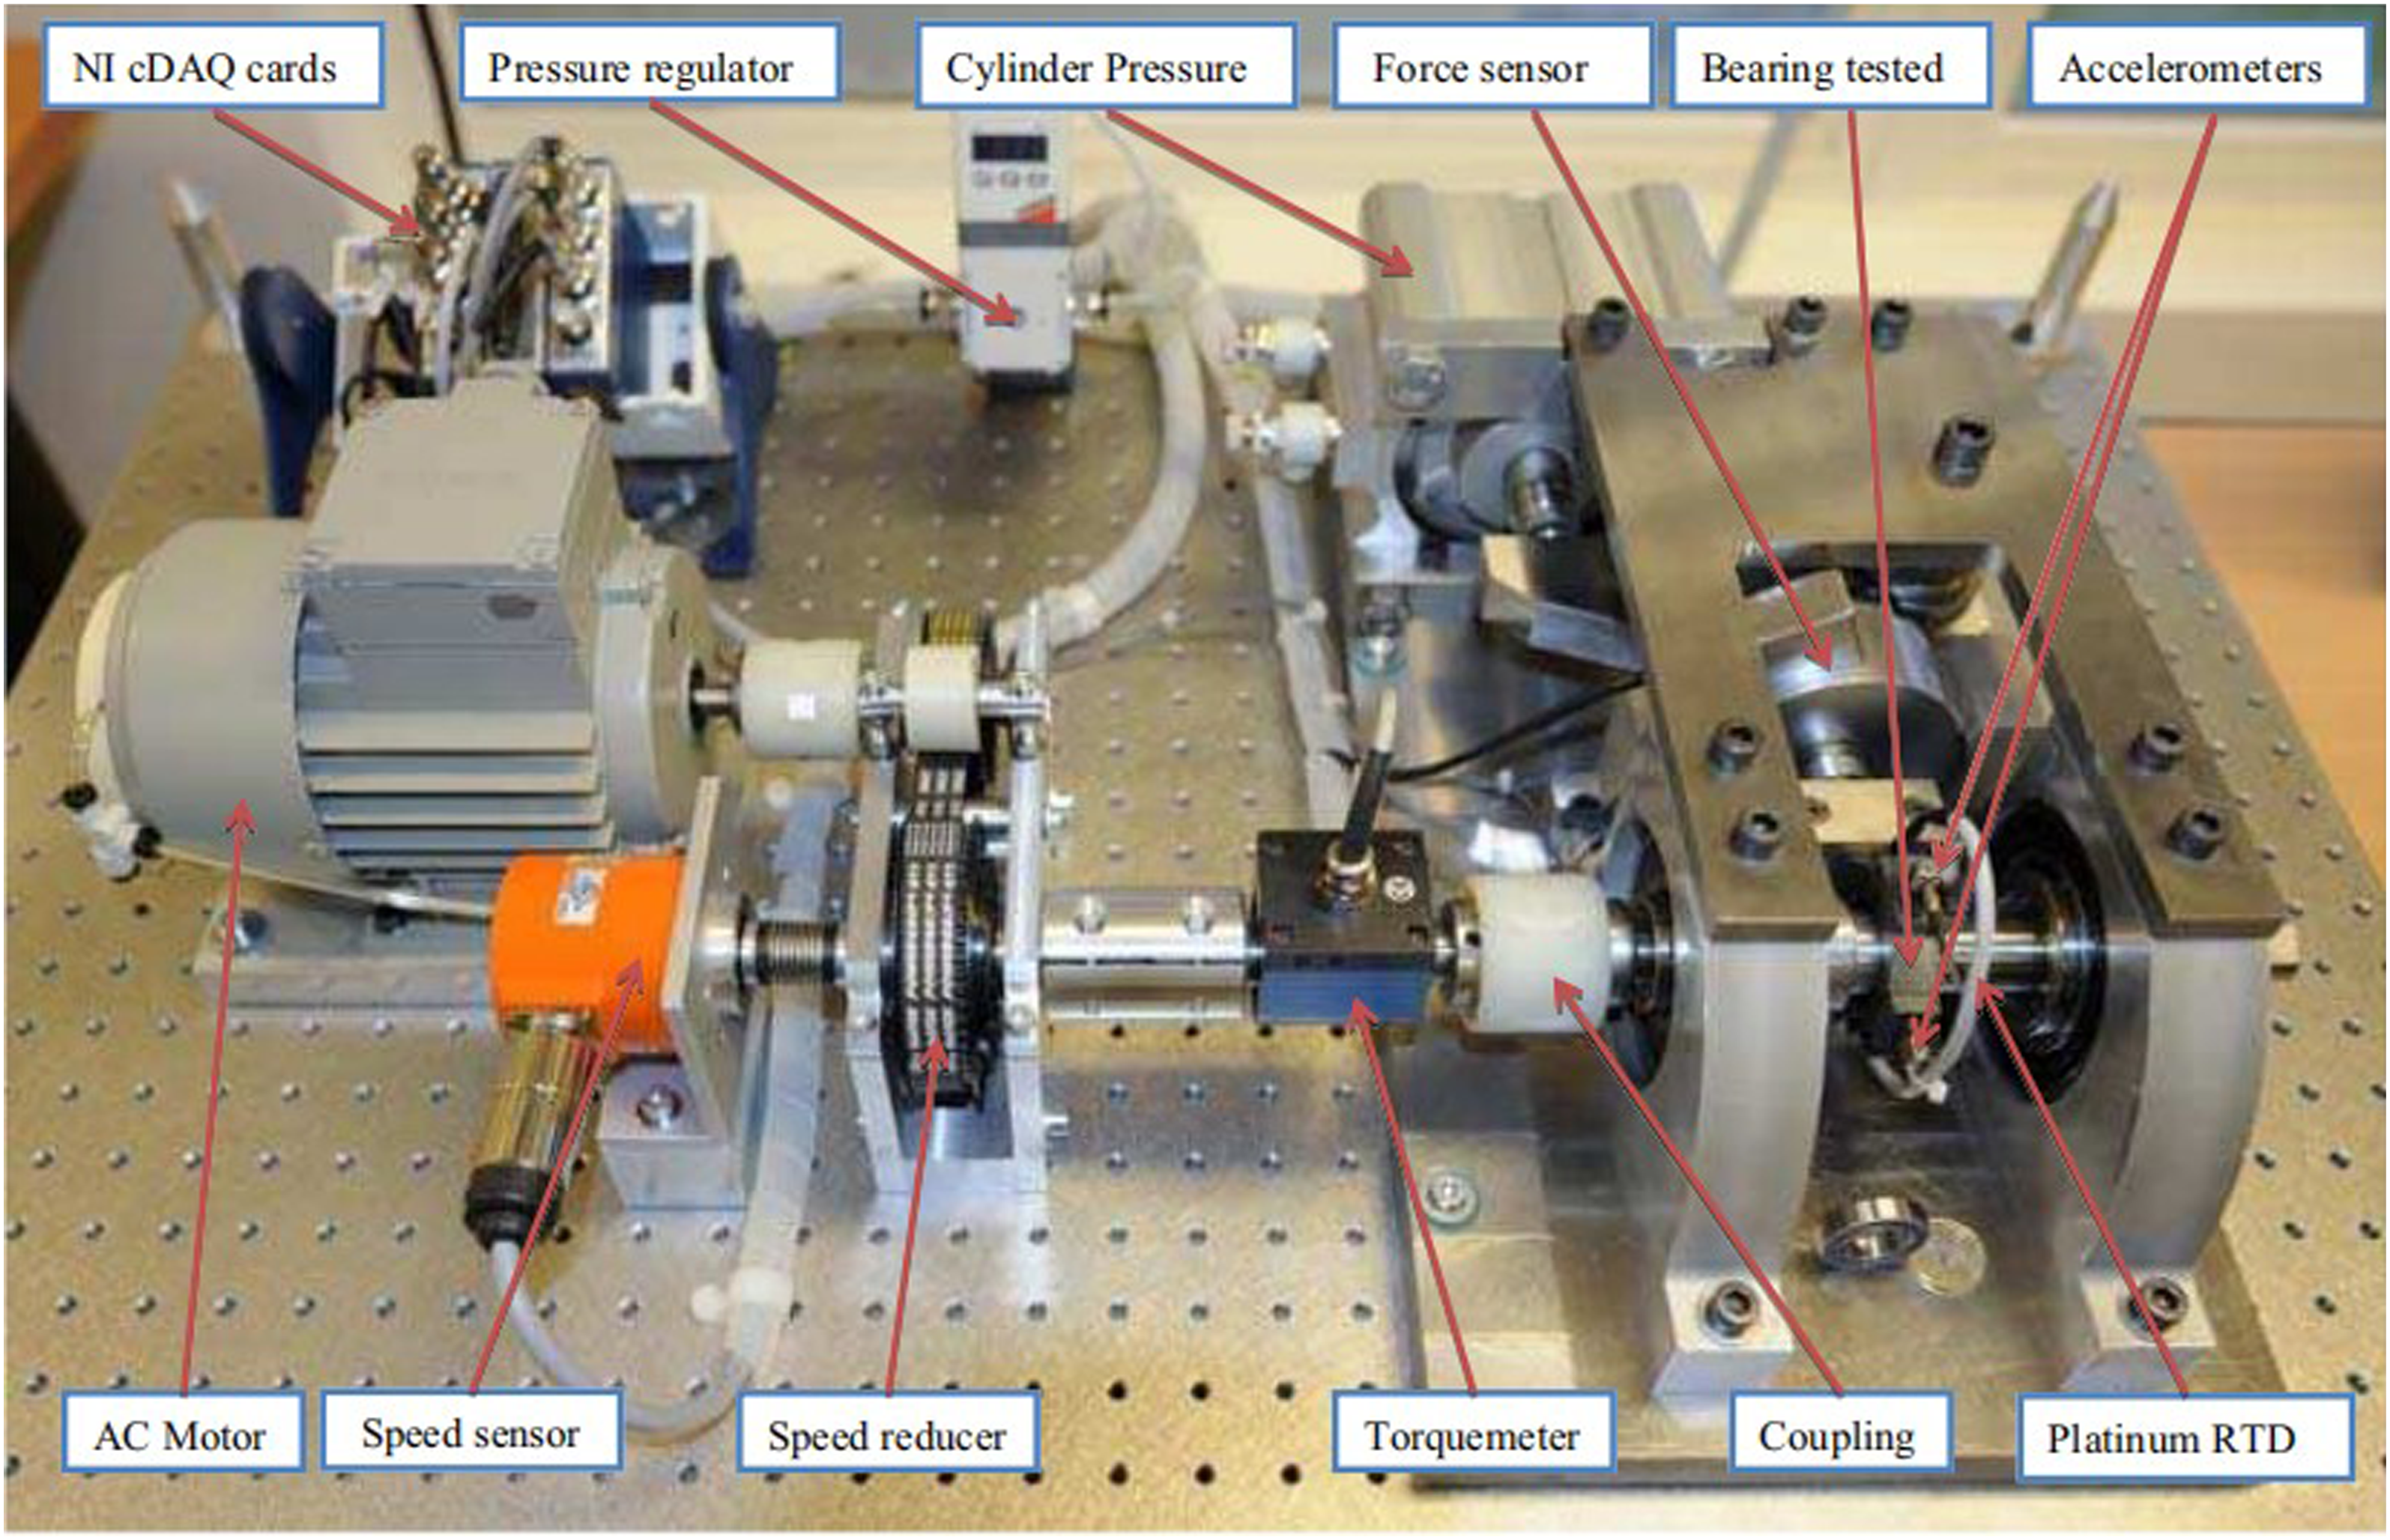
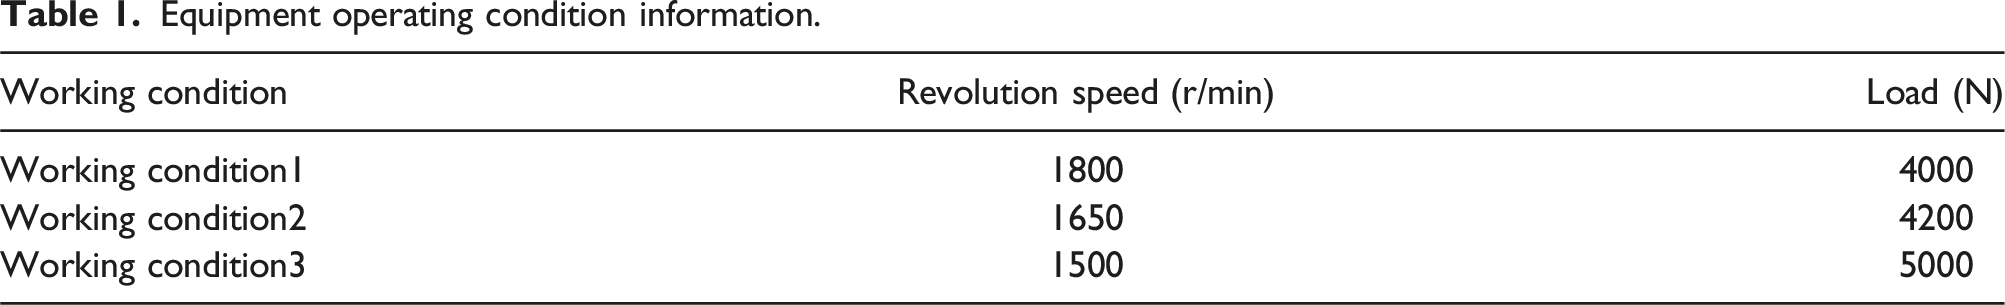
Equipment operating condition information.
Vibration data noise reduction
The original bearing vibration signal generally contains more noise. These noises may come from mechanical structure, parts damage and other factors. Noise will interfere with the analysis of bearing vibration signals. Therefore, before processing vibration signals, preprocessing must be performed to eliminate noise interference and extract meaningful feature information. The commonly used preprocessing methods include filtering, noise reduction, detrending, etc. Noise reduction methods include wavelet denoising, signal smoothing, etc. The detrending method can be realized by polynomial fitting. These preprocessing methods can effectively improve the quality of bearing vibration signals and provide a reliable data basis for subsequent fault diagnosis and health monitoring.
16
In this research, Select third-order wavelet denoising, set the threshold to 50%, and set the denoising frequency to 3, wavelet denoising is used. The vibration signal after denoising is shown in Figure 3. Vibration data after noise reduction.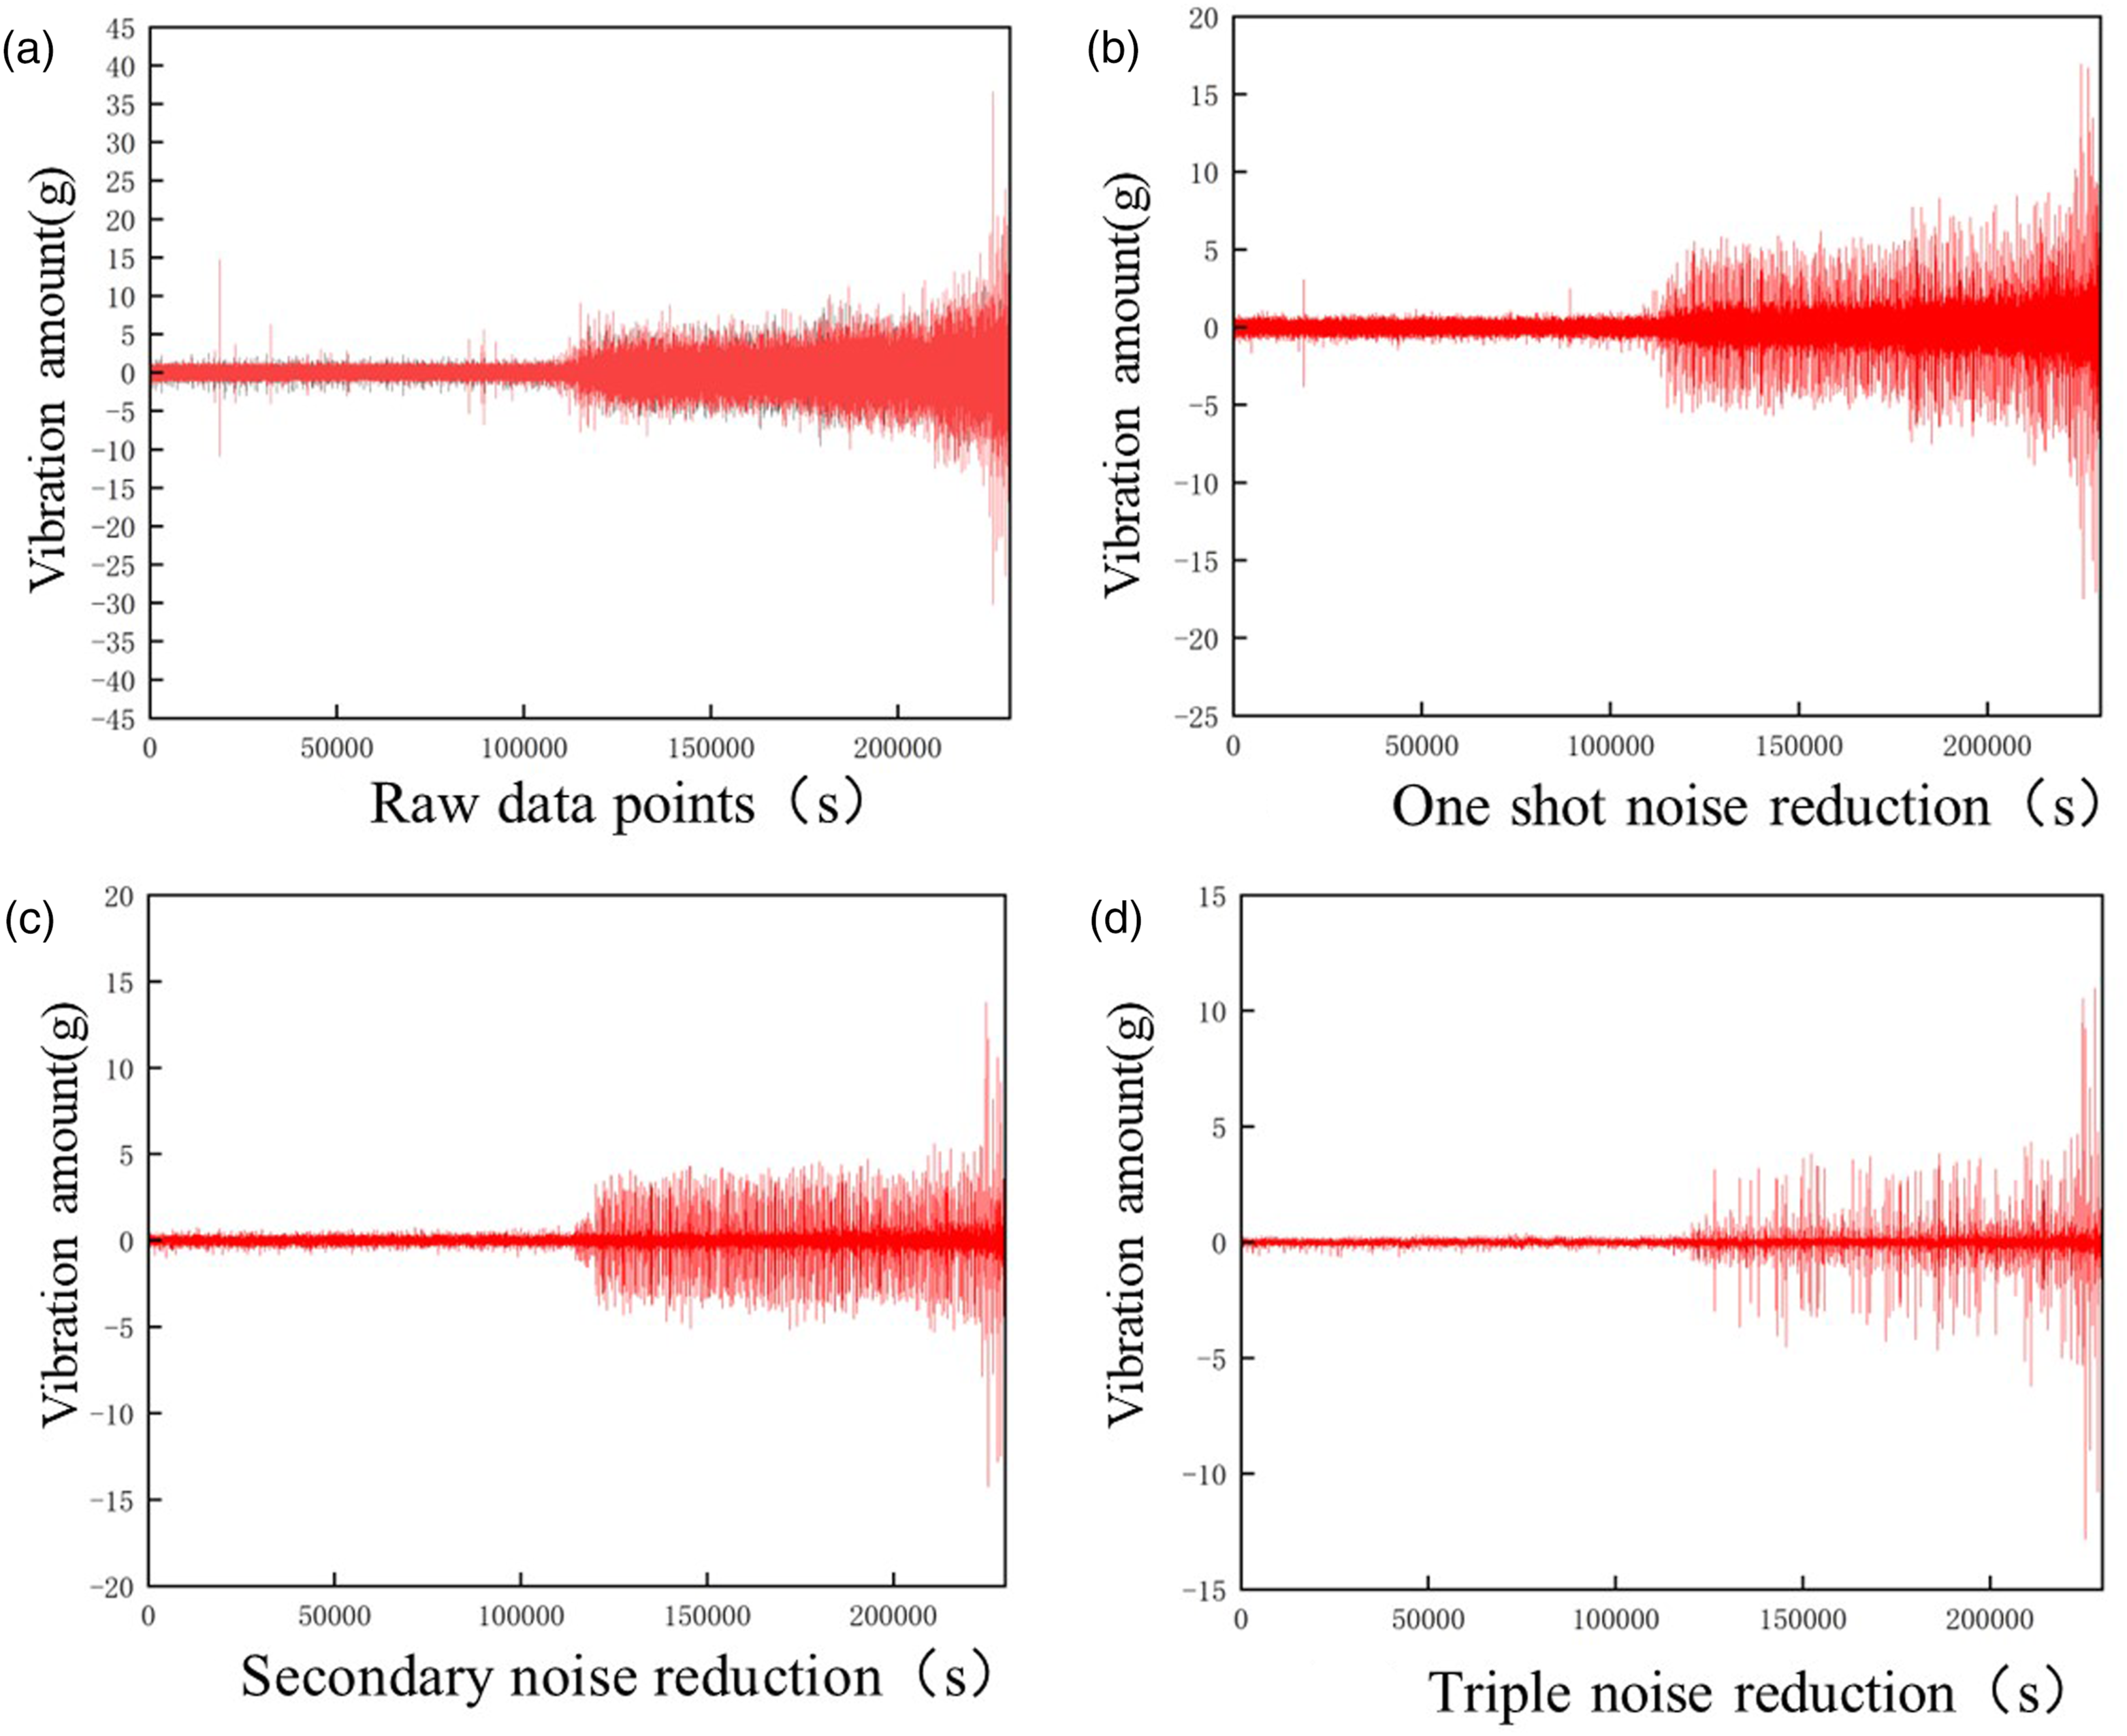
Construction of feature data set
Identifying characteristic parameters to accurately represent the degradation state and assess the health status is a critical aspect in predicting the residual life of rolling bearings. Choosing the most representative indicators is essential when dealing with a large number of features. In this study, the most fault-sensitive features for life prediction were identified through a comprehensive analysis. The selected features, which included kurtosis, variance and so on, were optimized using the correlation coefficient method to reduce the dimensionality of the data.
17
The correlation coefficient is proposed by the statistician Karl Pearson, which is used to measure the degree of linear relationship between two data variables.
18
When the correlation coefficient falls within the interval of 0 to 1, the nearer the absolute value approaches 1, the more pronounced the correlation between the two variables becomes, signifying a more substantial linear association. The calculation formula is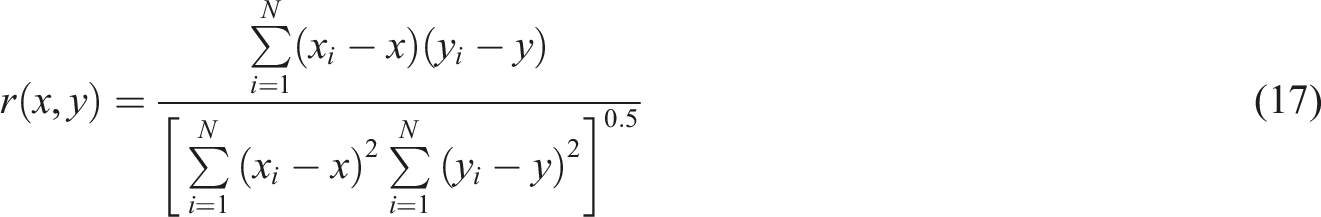
If the difference between the eigenvalues is great, it will have a negative impact on the prediction performance. To mitigate the impact of varying magnitudes on the prediction error, it is necessary to standardize the extracted eigenvalues. The normalized formula is
The
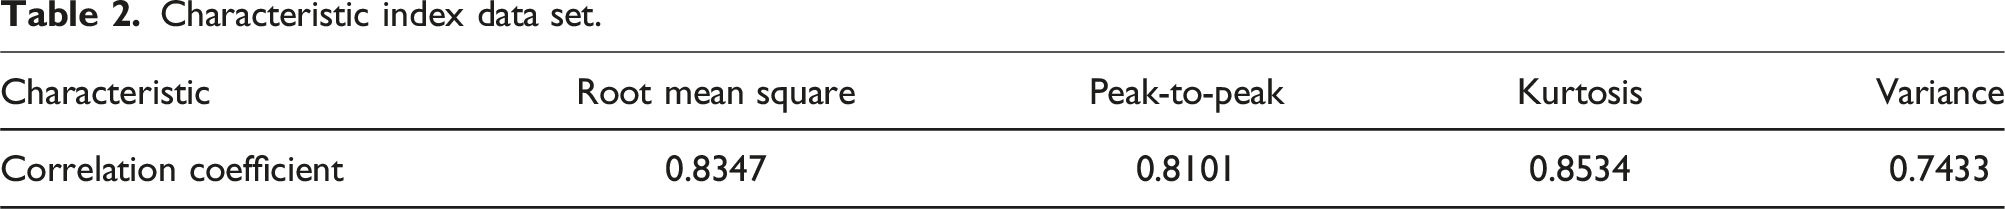
Select root mean square, peak-to-peak, kurtosis, and variance as input feature sets, as shown in Figure 4. Input feature set.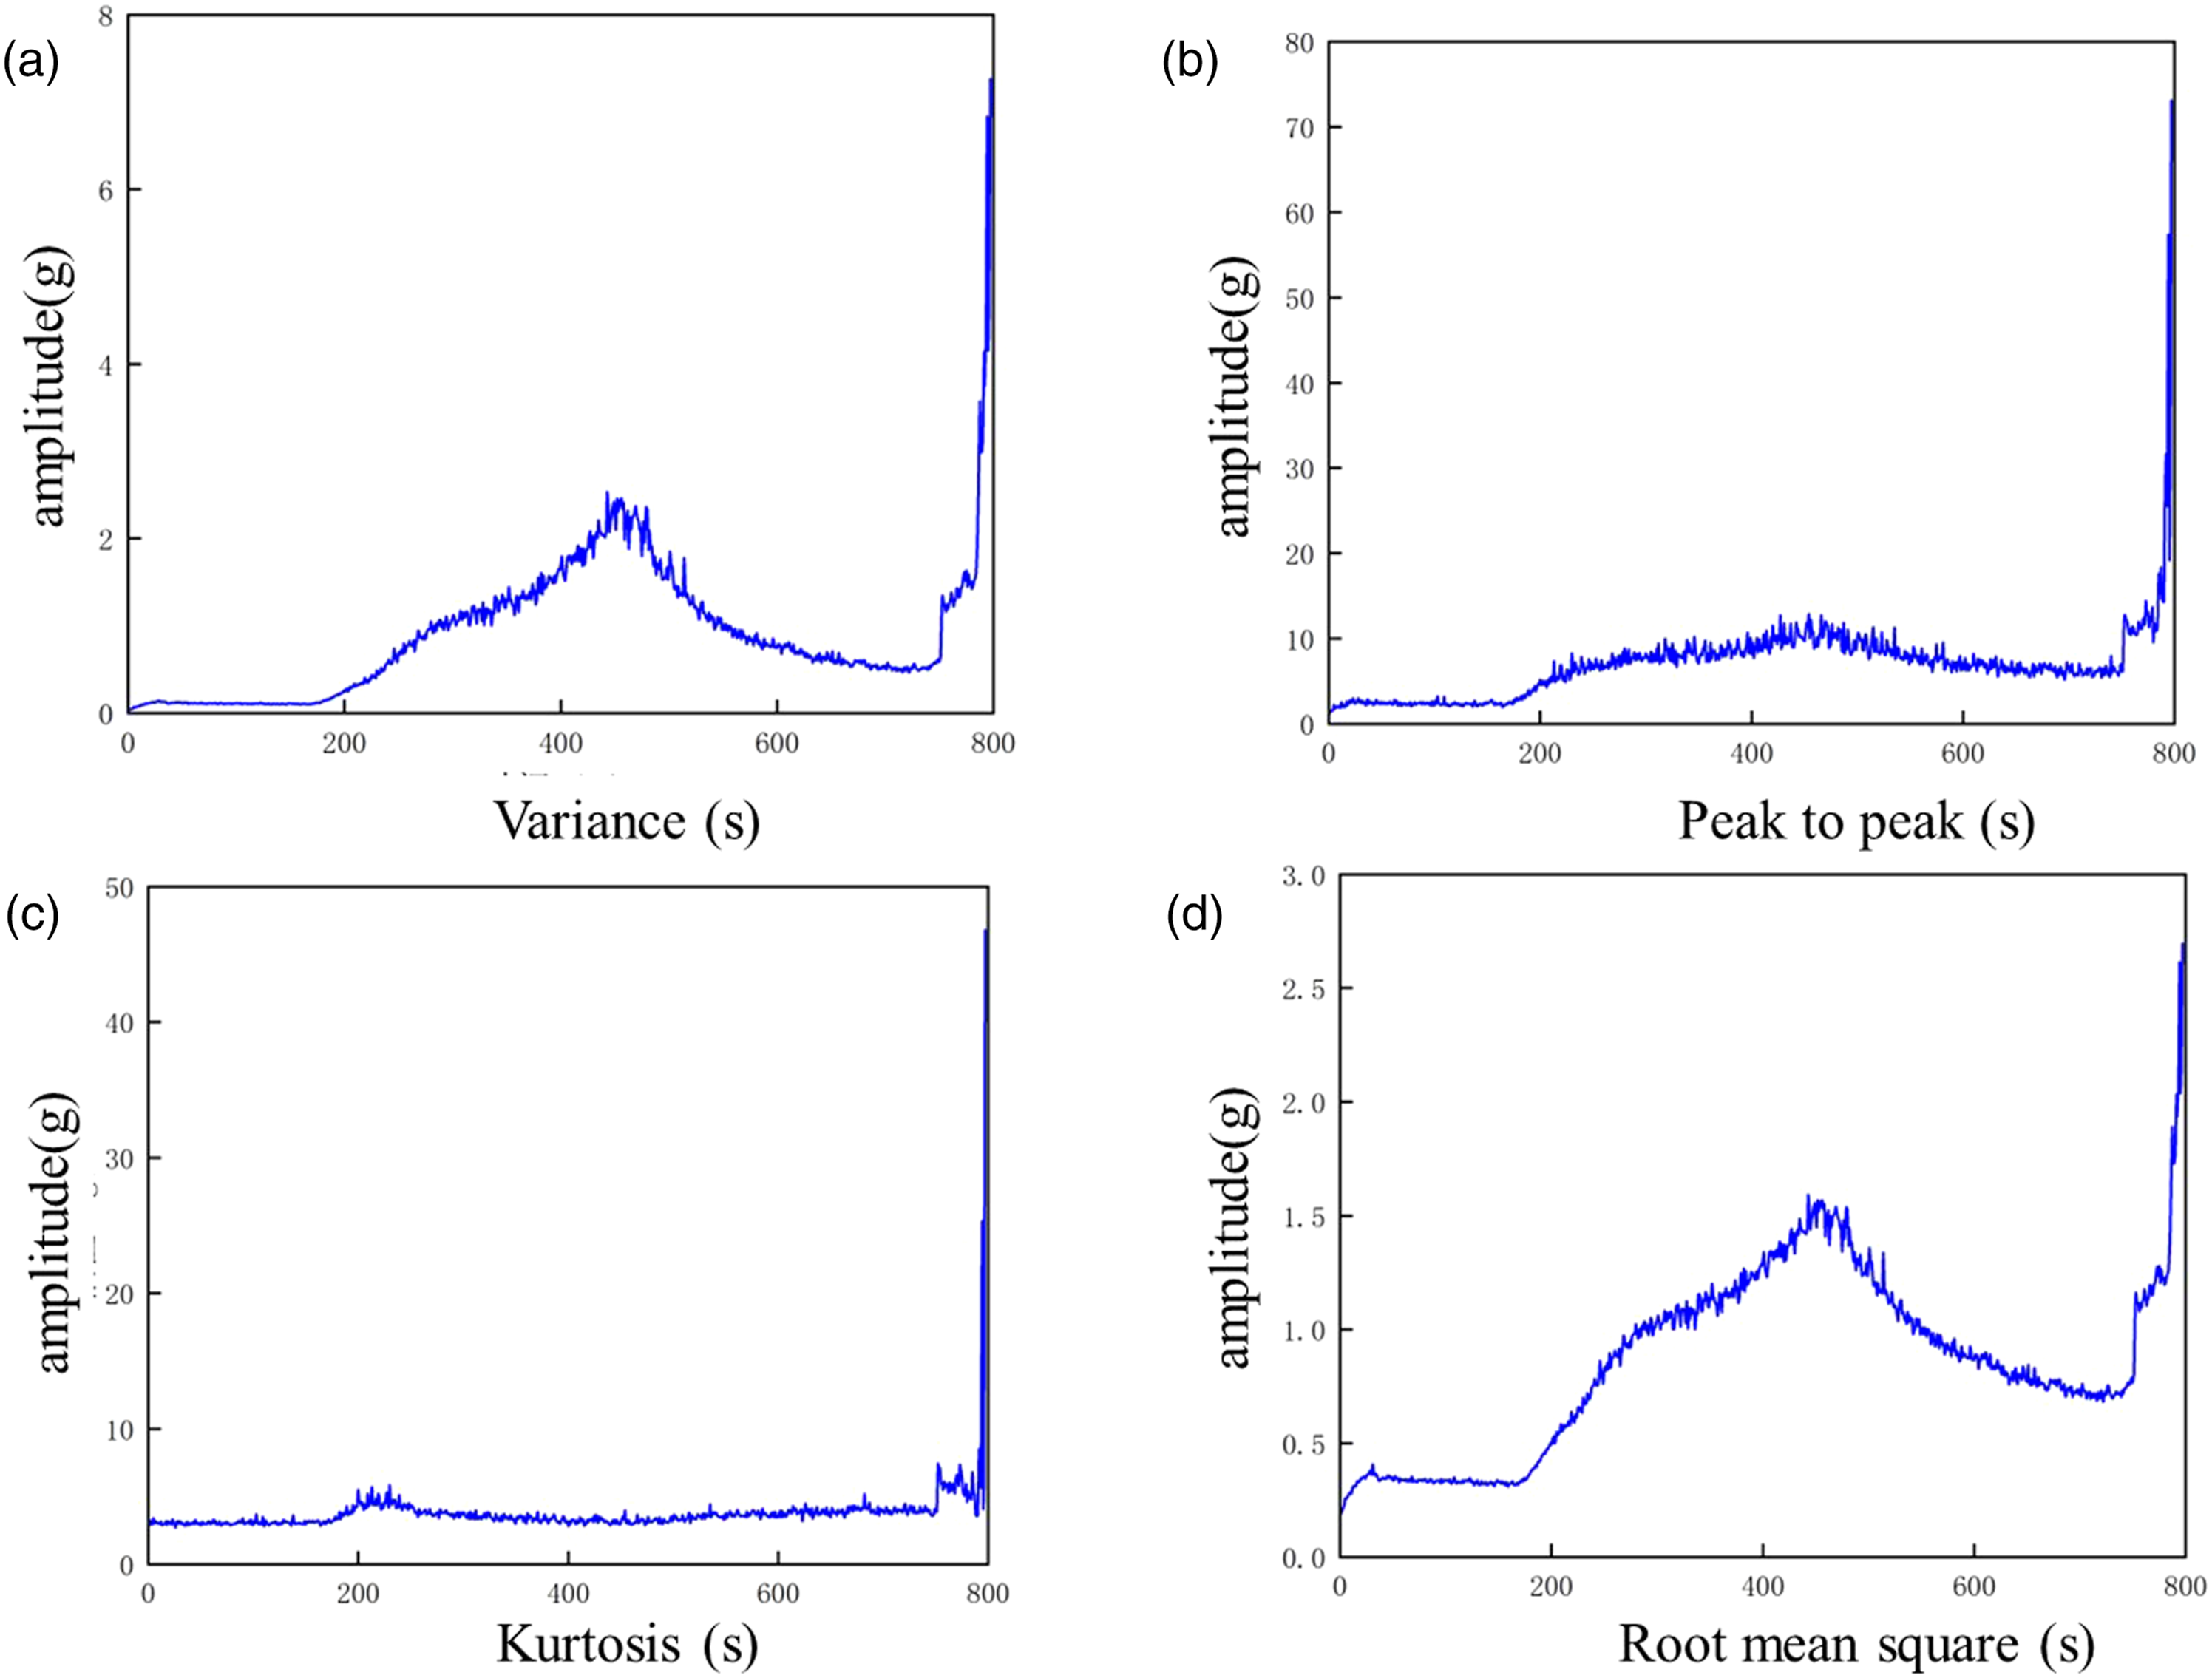
Characteristic index data set.
Establish WOA-BP model
To optimize the precision of prognosticating the lifespan of rolling bearings, an enhanced backpropagation prognostication model founded on the Whale Optimization Algorithm is proposed to tackle the challenges of neural network instability and local optima. The WOA’s superior global search capability is leveraged to overcome the limitations of traditional prediction. The process of predicting using the model is illustrated in Figure 5. Model prediction flow chart.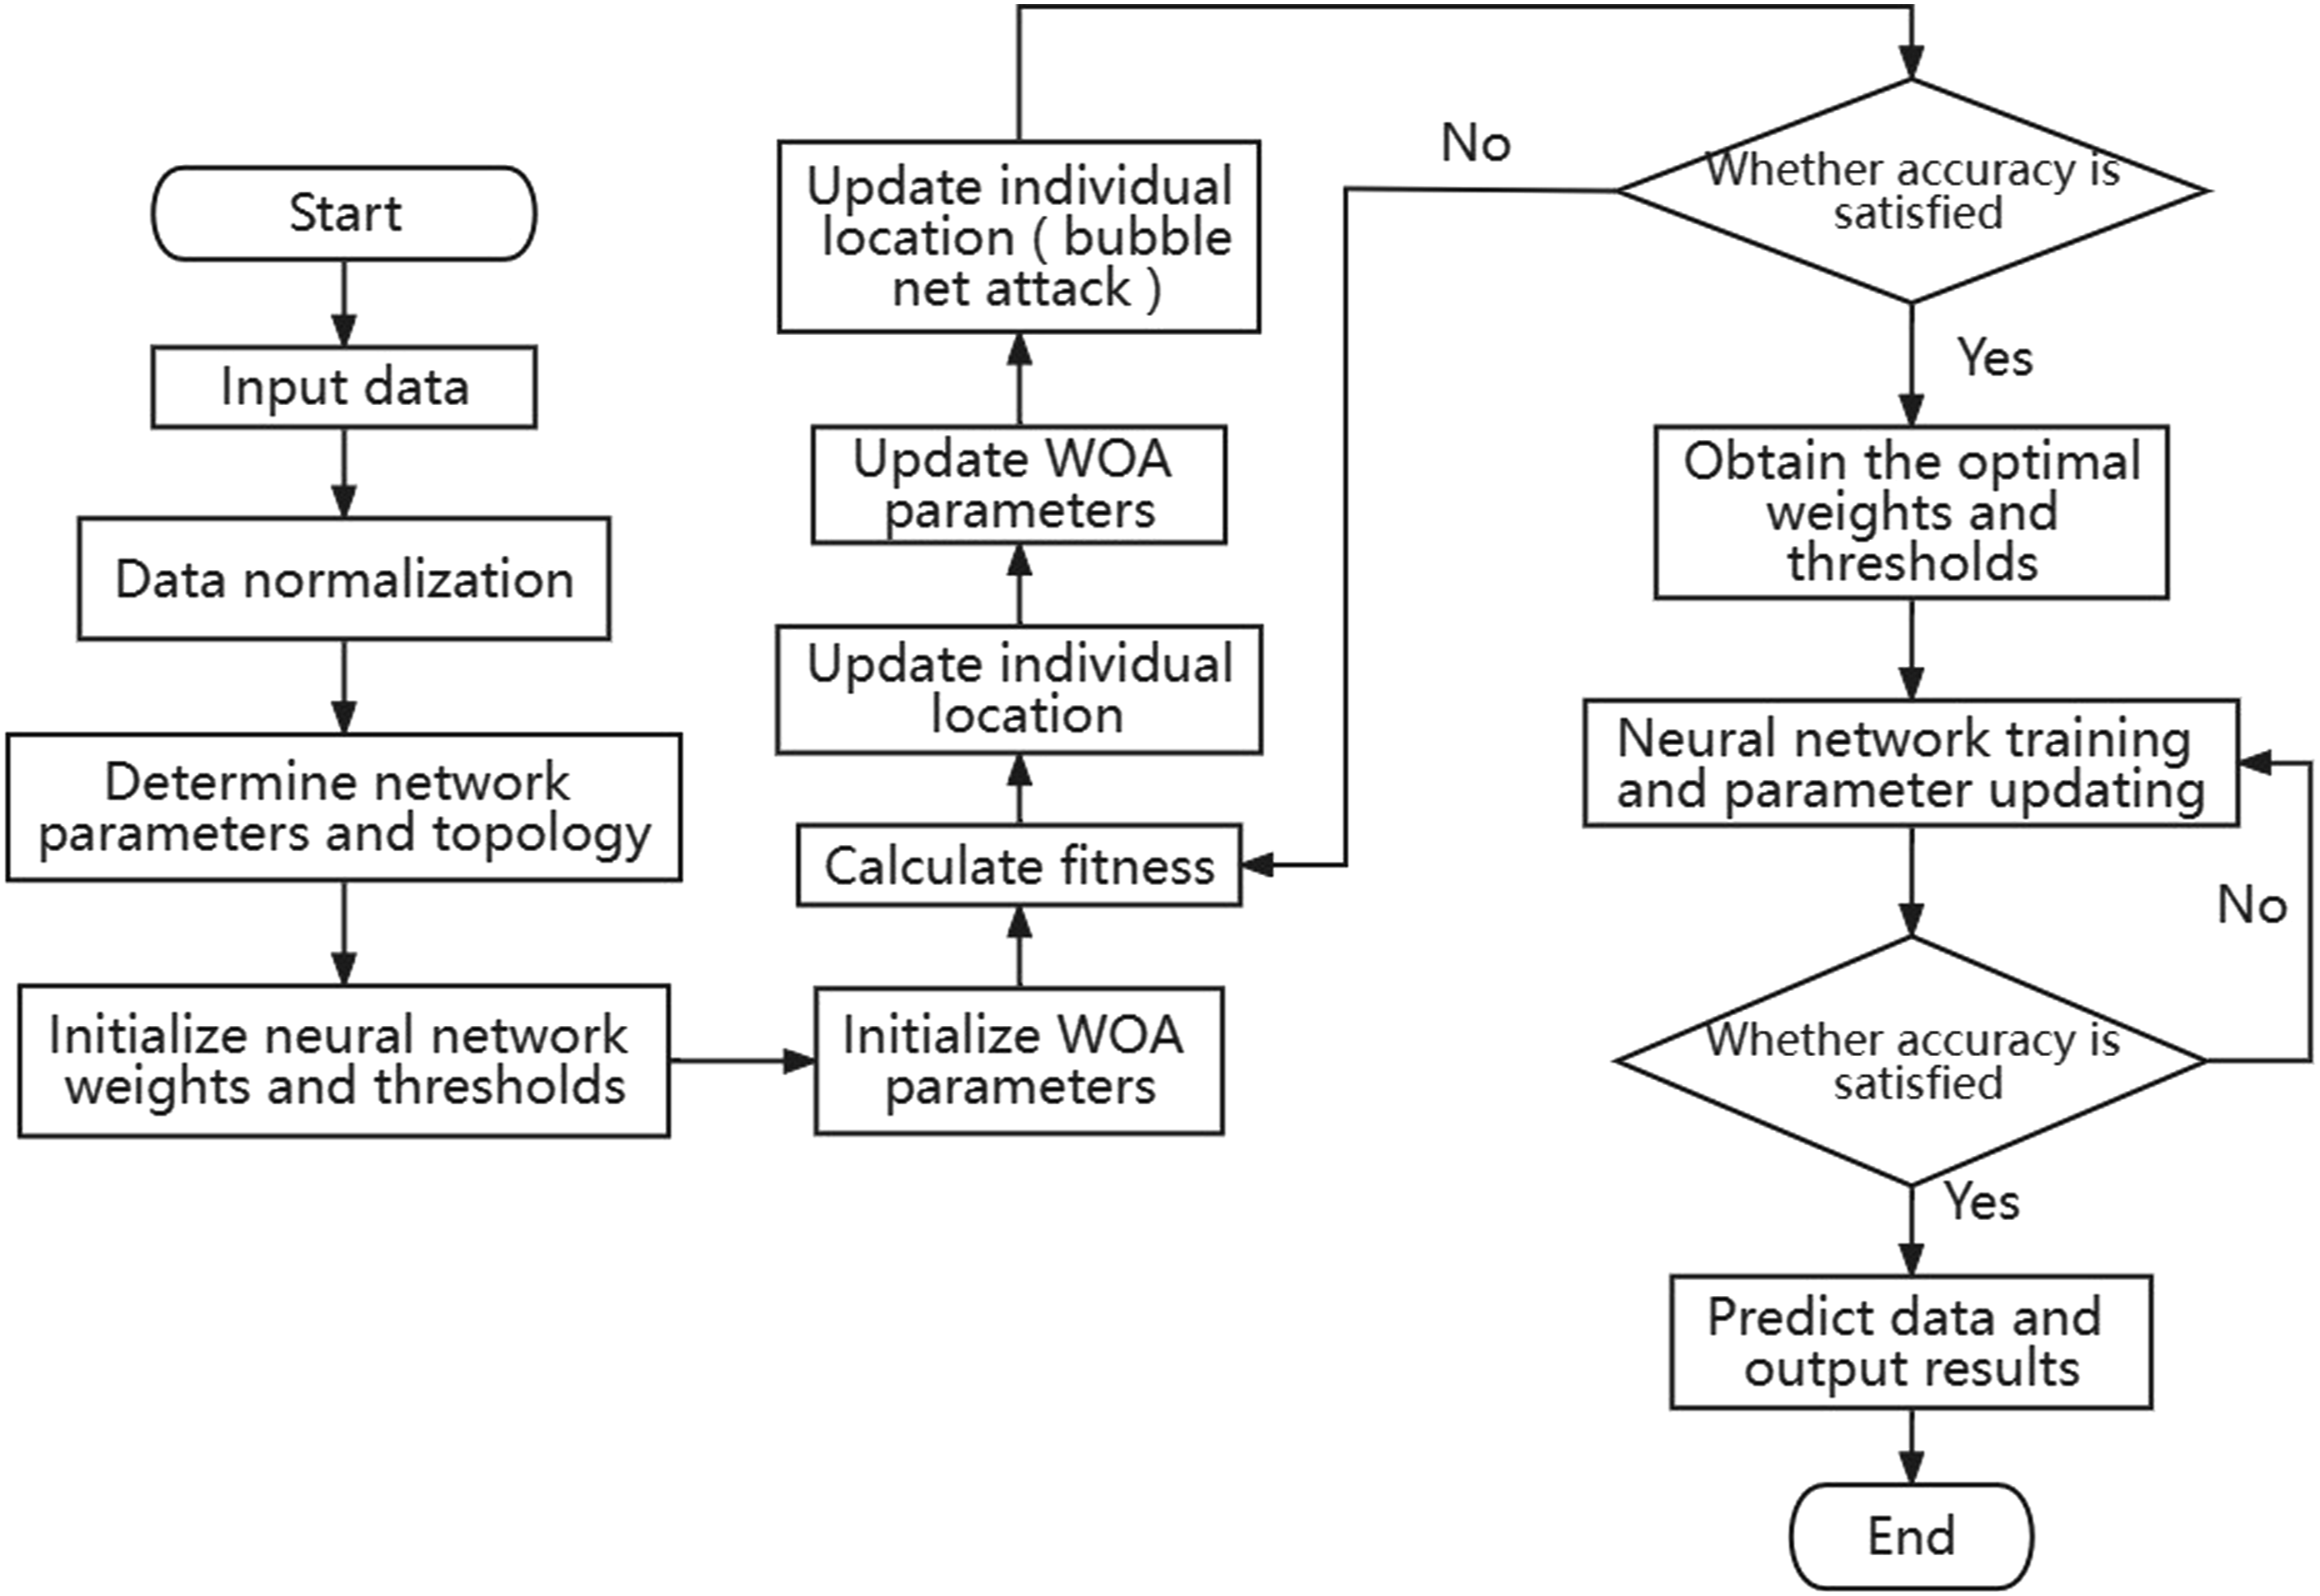
The process of prediction outlined in this research is broken down into the following stages: (1) Select vibration data from public datasets for preprocessing, identifying time-domain and frequency-domain feature parameters that can clearly reflect the health status of bearings. Use these parameters to construct degradation features. To ensure uniformity of feature values, apply the min-max normalization method for standardization. (2) Import the data into the model and split it into training and testing sets. (3) Determine the number of nodes for the neural network’s input layer, hidden layers, and output layer. The model has three nodes in the input layer and one node in the output layer. Based on comparing the mean squared error of the training set, determine the optimal number of nodes in the hidden layer to be 10. (4) Adjust the parameters of the WOA, inputting initial weights and initial thresholds or weights and thresholds calculated from the previous generation. Select mean squared error as the objective function and perform optimization through iterative refinement. (5) Once the maximum number of iterations is reached or the error precision requirement is met, the optimization process will stop. Apply the obtained optimal weights and thresholds to the network to obtain the best model. (6) Train the optimized neural network with the partitioned training set data and use the testing set data for prediction.
Experimental results and analysis
Model-evaluation index
MSE, RMSE, MAE, R-square were used as model-evaluation indexes. RMSE reflects the expected value of the square of the model error. The value range of R-square is [ 0, 1 ]. The formula is as follows:

Experimental parameter settings
In this model, 1000 training cycles are undergone by the backpropagation algorithm with a learning rate of 0.01 and a minimum training target error of 0.000,001. The optimal hidden layer node is constructed with a learning rate of 0.01, a momentum factor of 0.01, and a maximum number of failures of 6. The parameters of the WOA model are configured as follows: a population size of 30 is initially set, and the maximum evolutionary generation is 50. Figure 6 is the fitness function evolution curve. WOA evolution curve.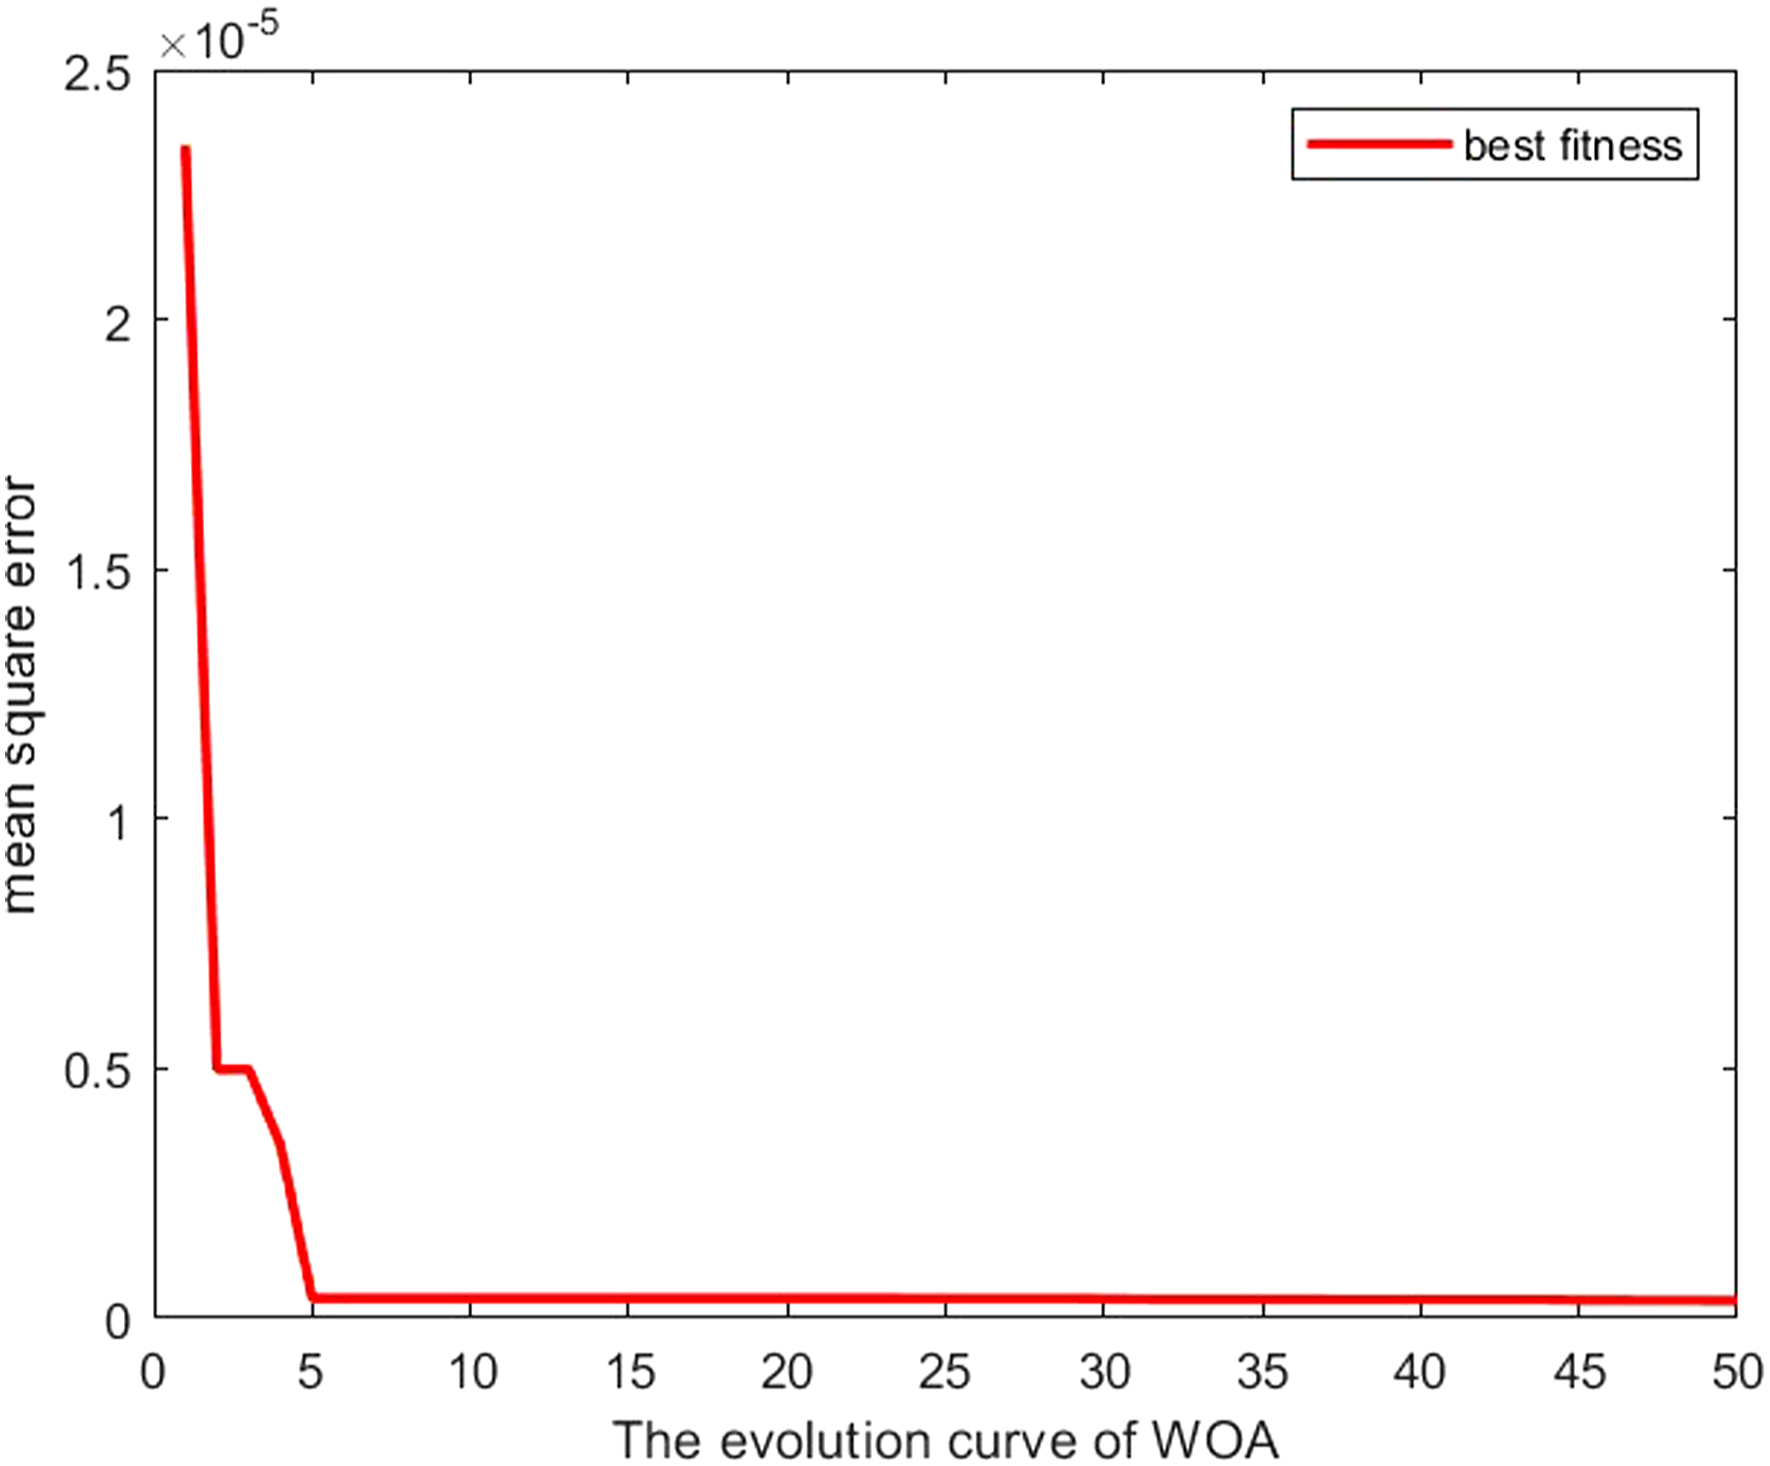
Experimental result
Comparing the prediction error of the 145th sample point in Figure 7, it can be seen that the prediction error of the BP neural network without any improvement and optimization will suddenly increase. This is because the model will fall into local extremum during operation, resulting in an increase in error. The method of adjusting weights in BP neural networks is to improve the performance of the network through local optimization. This method can easily trap the network into local optima, causing the weights to converge to local minima, thereby affecting the prediction accuracy and stability of the neural network. The prediction error of the neural network model improved by the whale algorithm is smaller. Comparison chart of prediction error.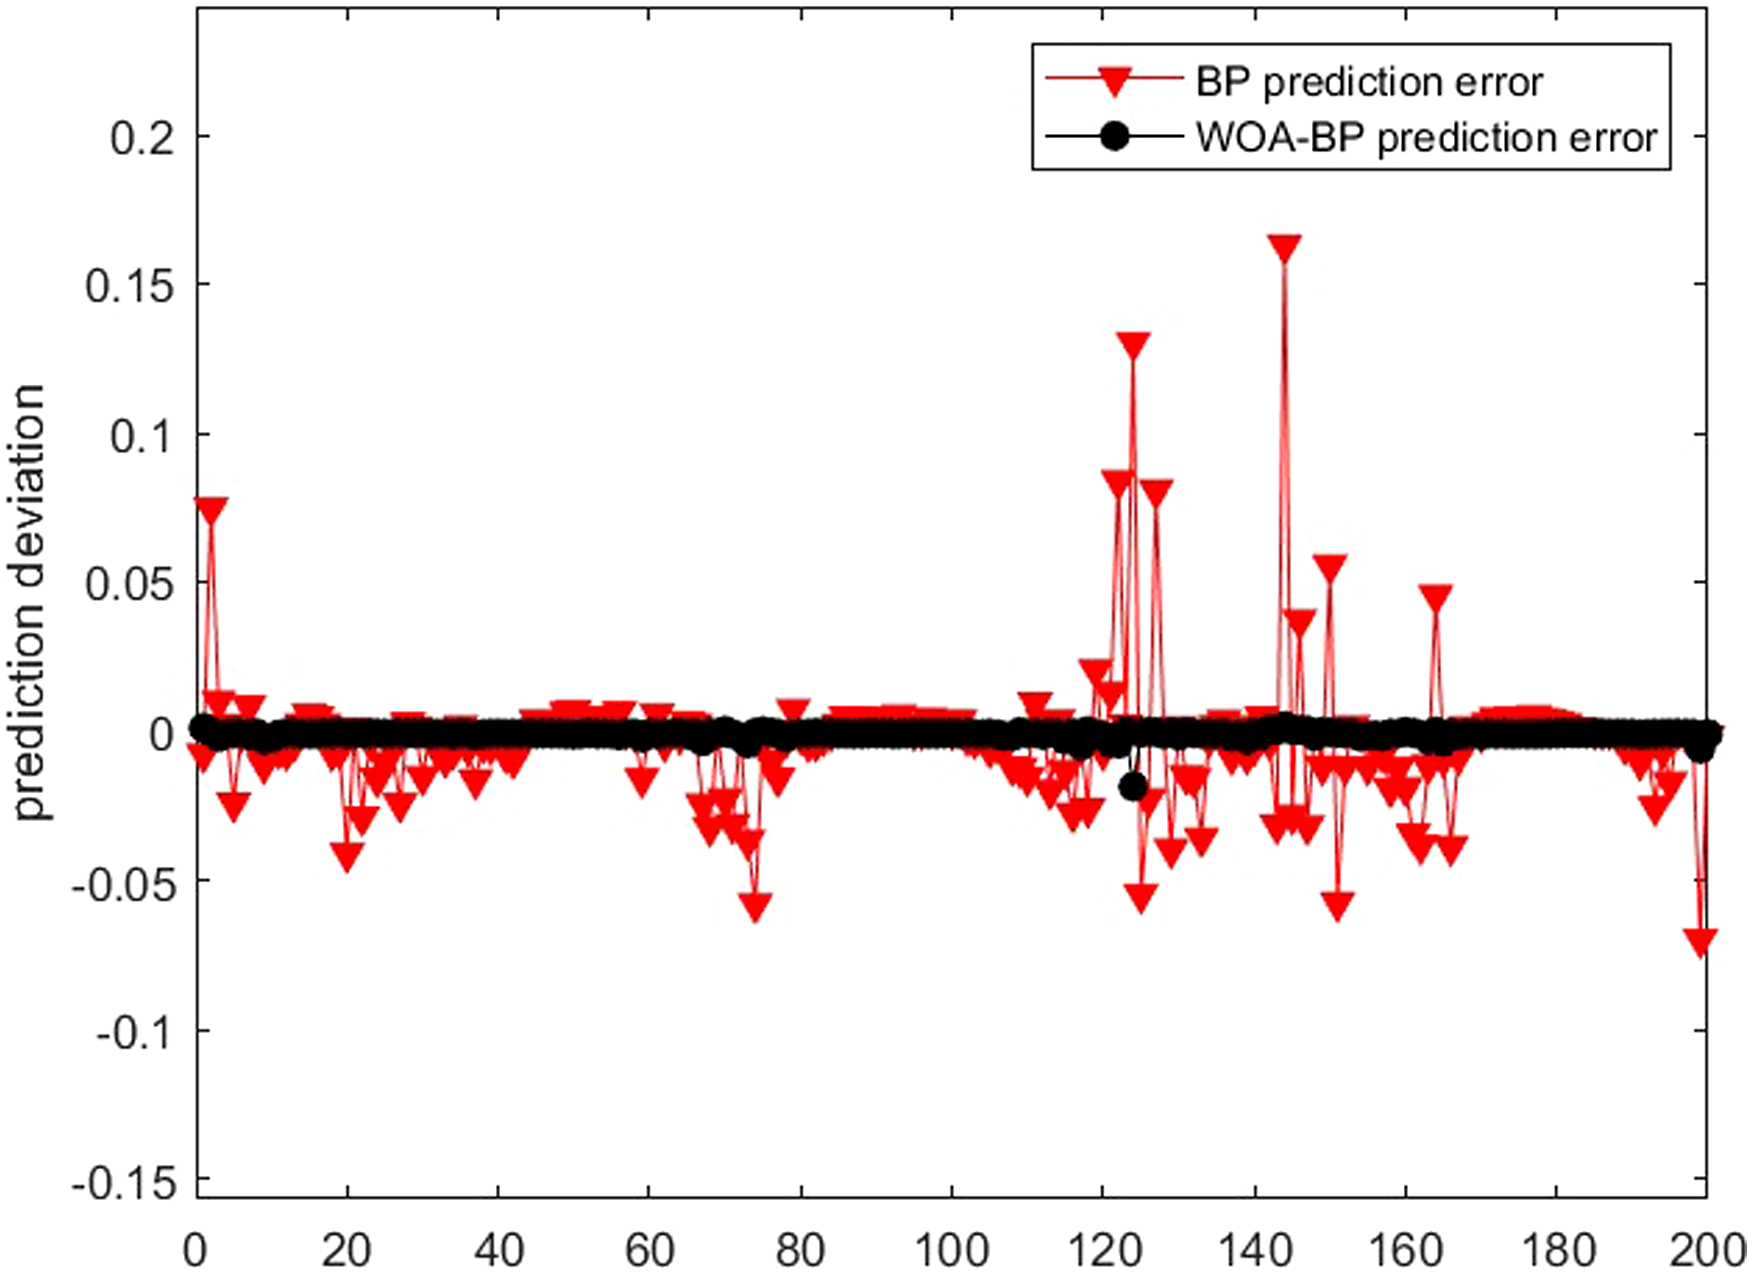
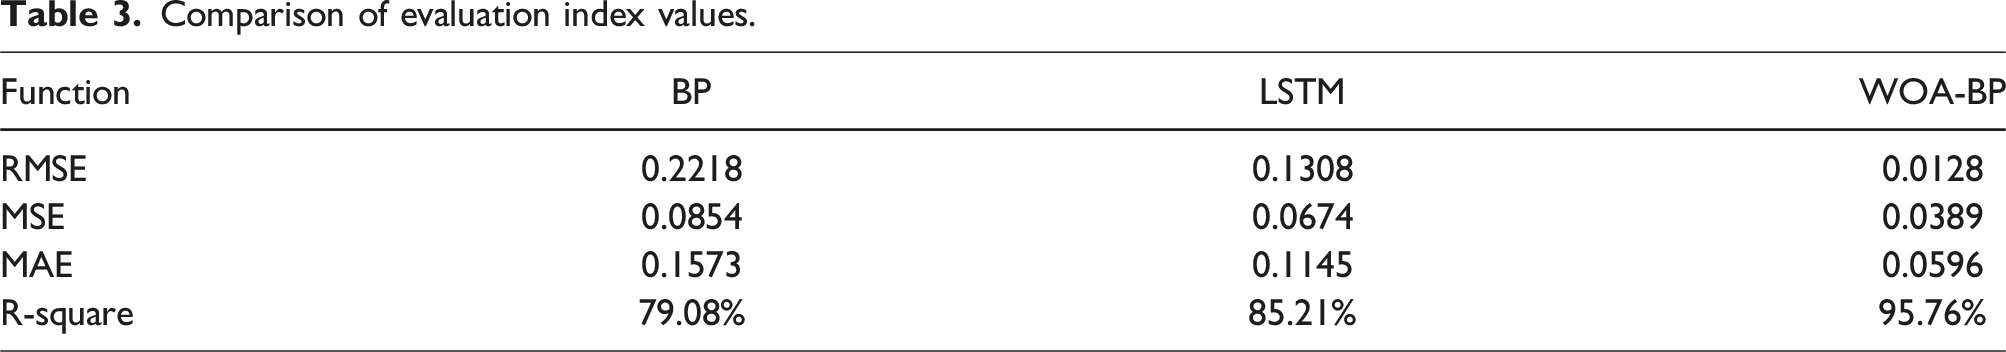
Comparison of evaluation index values.
In order to evaluate the in-service performance of rolling bearings, the signal characteristic data of the upcoming performance degradation period of rolling bearings are input into a trained neural network model, and the degree of performance degradation of in-service bearings is evaluated by predicting the remaining fatigue life index. The results are shown in Figure 8. Prediction of bearing performance degradation.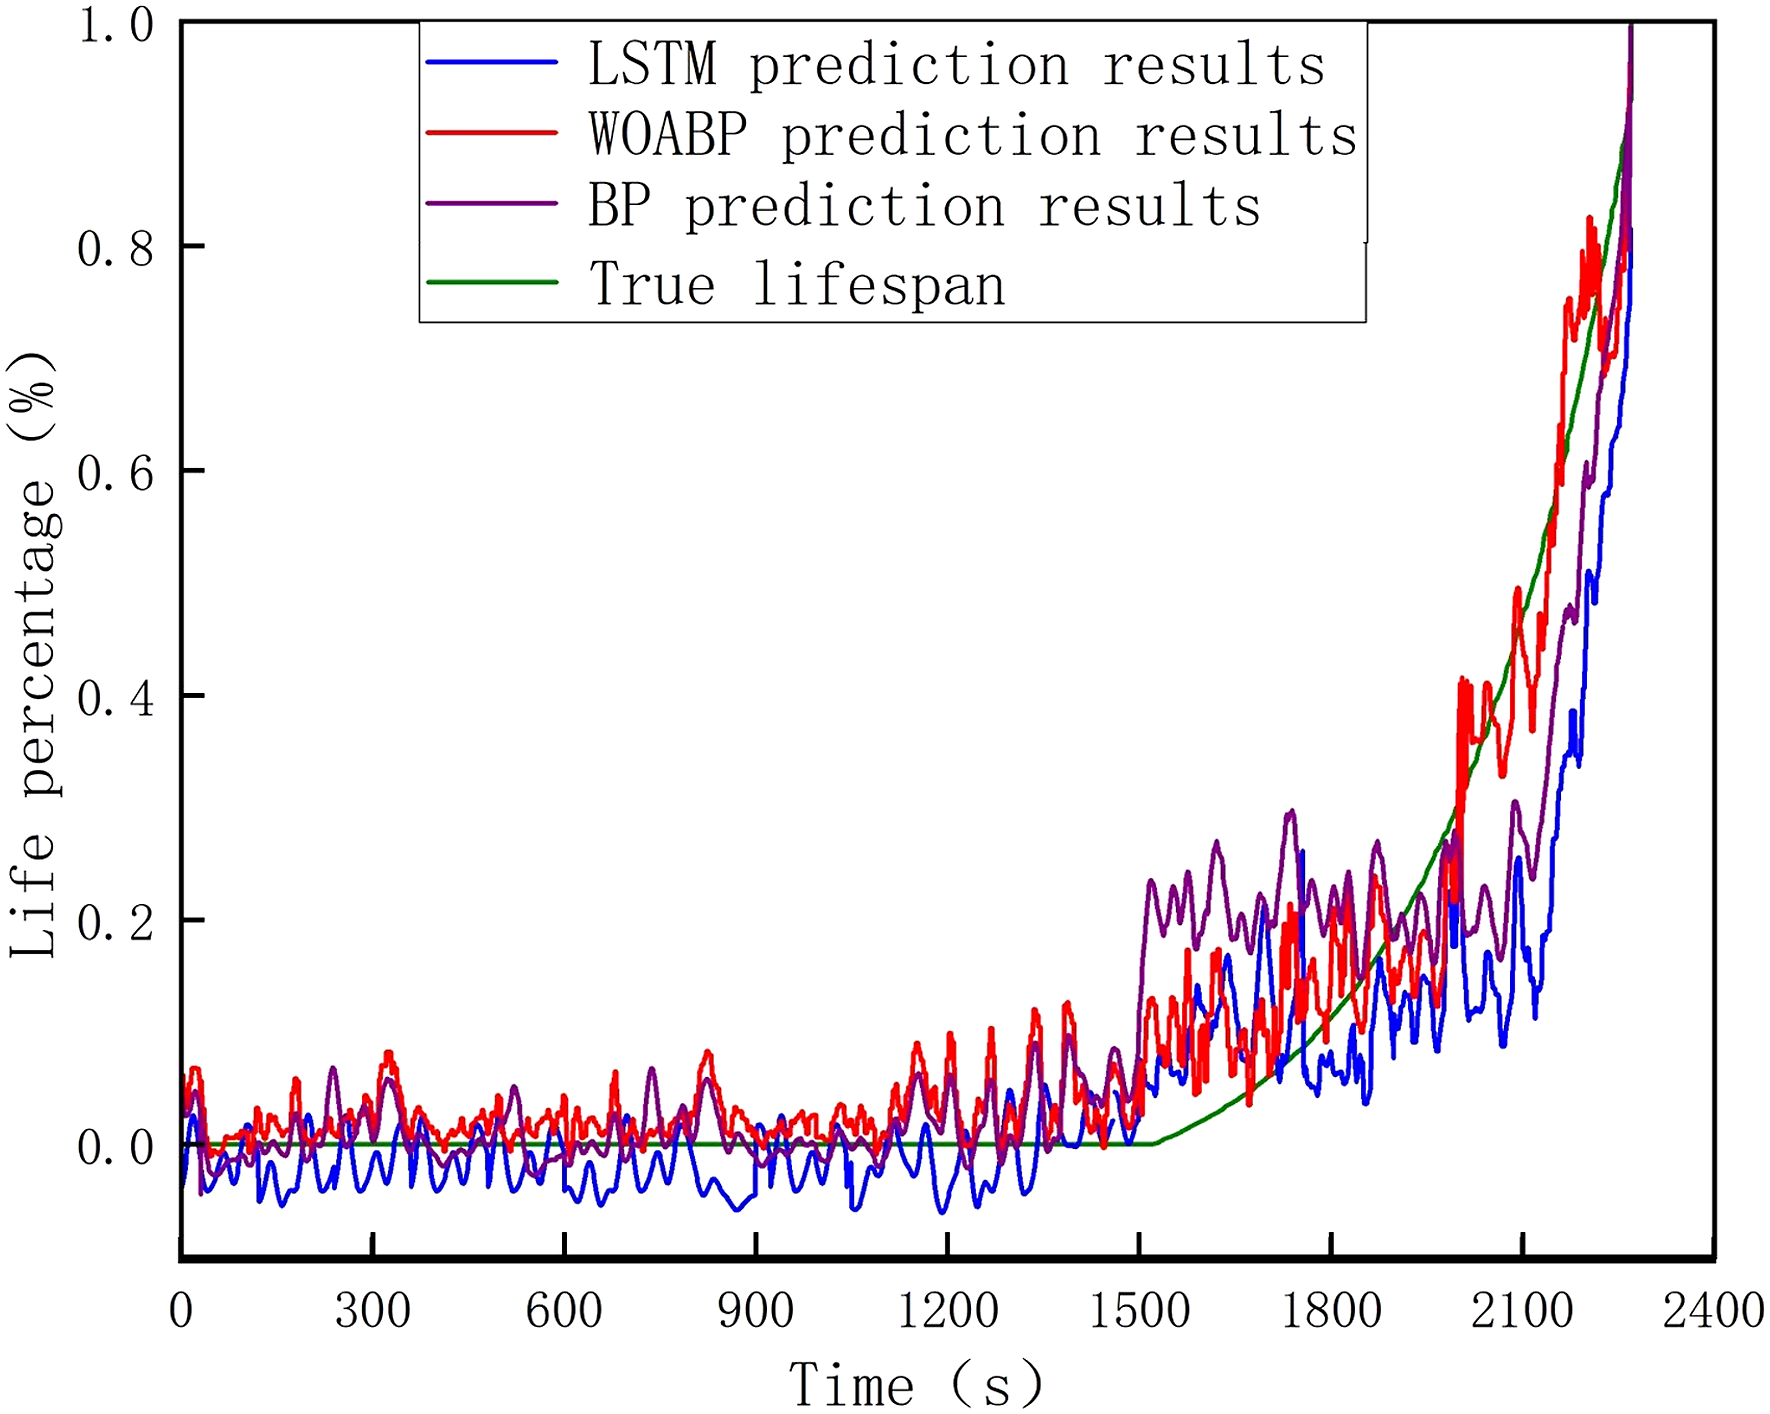
Select the second set of vibration data under working condition 2, preprocess it, and determine the starting time of bearing degradation as 1500 points. Set all service life before this point to 0, and establish a label for the remaining service life of the in-service bearing. The maximum value for selecting the lifespan label is 1, which means that the bearing is 100% used and the lifespan is 0. As shown in Figure 8, the predicted values show some fluctuations due to the alternating stage of slight failure and recovery of the rolling bearing. This stage is an inevitable part of the bearing degradation process. During this period, due to the bearing grinding the fault point flat during rotation, the vibration amplitude decreases, resulting in fluctuations in the extracted features. At 1500 o’clock, the predicted line of the model showed a rapid upward trend, indicating that 1500 o’clock is the starting point for performance degradation of rolling bearings. This method can effectively predict the start time of degradation, providing favorable references for bearing degradation warning and maintenance measures. After multiple iterations of training, the model gradually selects feature points that can characterize the degradation of bearing performance based on input data. Based on the comparison of the full life cycle diagram of the bearing, it predicts that the bearing will undergo one-time performance degradation after 1500 data points, achieving the prediction of in-service performance degradation of rolling bearings.
Conclusion
To address the challenges of performance deterioration and residual life estimation of rolling bearings, a pioneering prognostication model is introduced, which is leveraged by an enhanced backpropagation neural network and whale optimization algorithm. By integrating the WOA algorithm into the model, the limitations of the traditional approach are overcome, and the strengths of the WOA algorithm, such as its strong global search capability, are leveraged. Empirical evidence indicates that the WOA-BP model exhibits a superior predictive performance, with an R-square value exceeding 99%, when compared to alternative prediction techniques, and has higher accuracy and fitting ability. It presents a novel approach to monitor the operational state of machinery and equipment and to sustain their well-being. The model also achieved the prediction of in-service performance degradation of rolling bearings by inputting 1000 previous characteristic points, which can contribute to the safe warning of bearing performance. This experimental model can predict and diagnose faults in other rotating components besides bearings, including transmission gears, engines, compressors, wind turbines, etc. It plays a crucial role in industries such as automotive and energy by enabling predictive maintenance and fault diagnosis for various rotating parts.
Footnotes
Acknowledgments
The article greatly appreciates the data provided by the FEMTO-ST research institute.
Author contributions
J.W., is responsible for the overall conception and structure of the manuscript, Y.H., is the first draft author of the paper. J.W., J.D., are the paper funding contributor. H.W., is responsible for the revision of the manuscript. C.Y., provided comments during the revision of the manuscript.
Declaration of conflicting interests
The author(s) declared no potential conflicts of interest with respect to the research, authorship, and/or publication of this article.
Funding
The author(s) disclosed receipt of the following financial support for the research, authorship, and/or publication of this article: This study is supported by the open research project of the State Key Laboratory of Traction Power TPL2310, Liaoning BaiQianWan Talents Program 2020921031, Natural Science Foundation of Liaoning Province of China 2020-MS-216.