
Abstract
To realize a fault diagnosis of rolling bearings in a real R2R printing unit, a method based on Siamese Network is proposed in this work. First, vibration signals in rolling bearing were changed into a series of time–frequency spectra with Continuous Wavelet Transform, and thus the frequency components with time in various scales can be reflected as images. Siamese Networks with sub-nets composed of both Convolutional Neural Network (CNN) and Depth-wise Separable Convolution Network (DSCN) were proposed and established for fault diagnosis; meanwhile, fault samples were divided into sample twins to solve the problem of small samples. As to a database of rolling bearings, different kinds of faults with various degree, rotary speed and added noise were distinguished with both SN-CNN and SN-DSCN models successfully. Then an experiment for a R2R unit in printing press is also taken, there are all 7 classes of samples to be identified, and each group contains few numbers of samples. From this work, it can be seen that SN-CNN and SN-DSCN both can realize a fault diagnosis of rolling bearings in printing units based on 20 samples, which can be seen as a limited sample learning mission. Besides, SN-DSCN is proved to have a less time in training process compare to SN-CNN.
Keywords
Introduction
As an important part of the manufacturing industry, the printing industry has irreplaceable substitutes in the fields of education and scientific research, commodity consumption, cultural communication, packaging and transportation, and financial functions. In recent years, with the rapid development of printing machines and printing materials, a series of new printing machines have shown great potential in many fields, such as flexible electronic device manufacturing, high-precision functional material coating, and functional material surface performance improvement. Although there are now many kinds of different printing machines, a similar basic structure, named as Roller-to-Roller (R2R) Printing Units, can be found in all of them as the core part in printing equipment. As shown in Figure 1, current printing equipment is always composed of one or more R2R units, which can be divided into offset printing units, gravure printing units, flexographic printing units, screen printing units, coating units and many other types. The working principles in different types printing units are basically similar. The pre-printed pattern is made on the printing plate and the printing plate is installed on the surface of the printing plate cylinder. All kinds of inks are uniformly attached to the surface of the printing plate. With the pressure between the impression cylinder and the printing plate cylinder, the ink can be transferred on various substrates as a predetermined pattern and then a printed product can be obtained. A series of R2R printing units.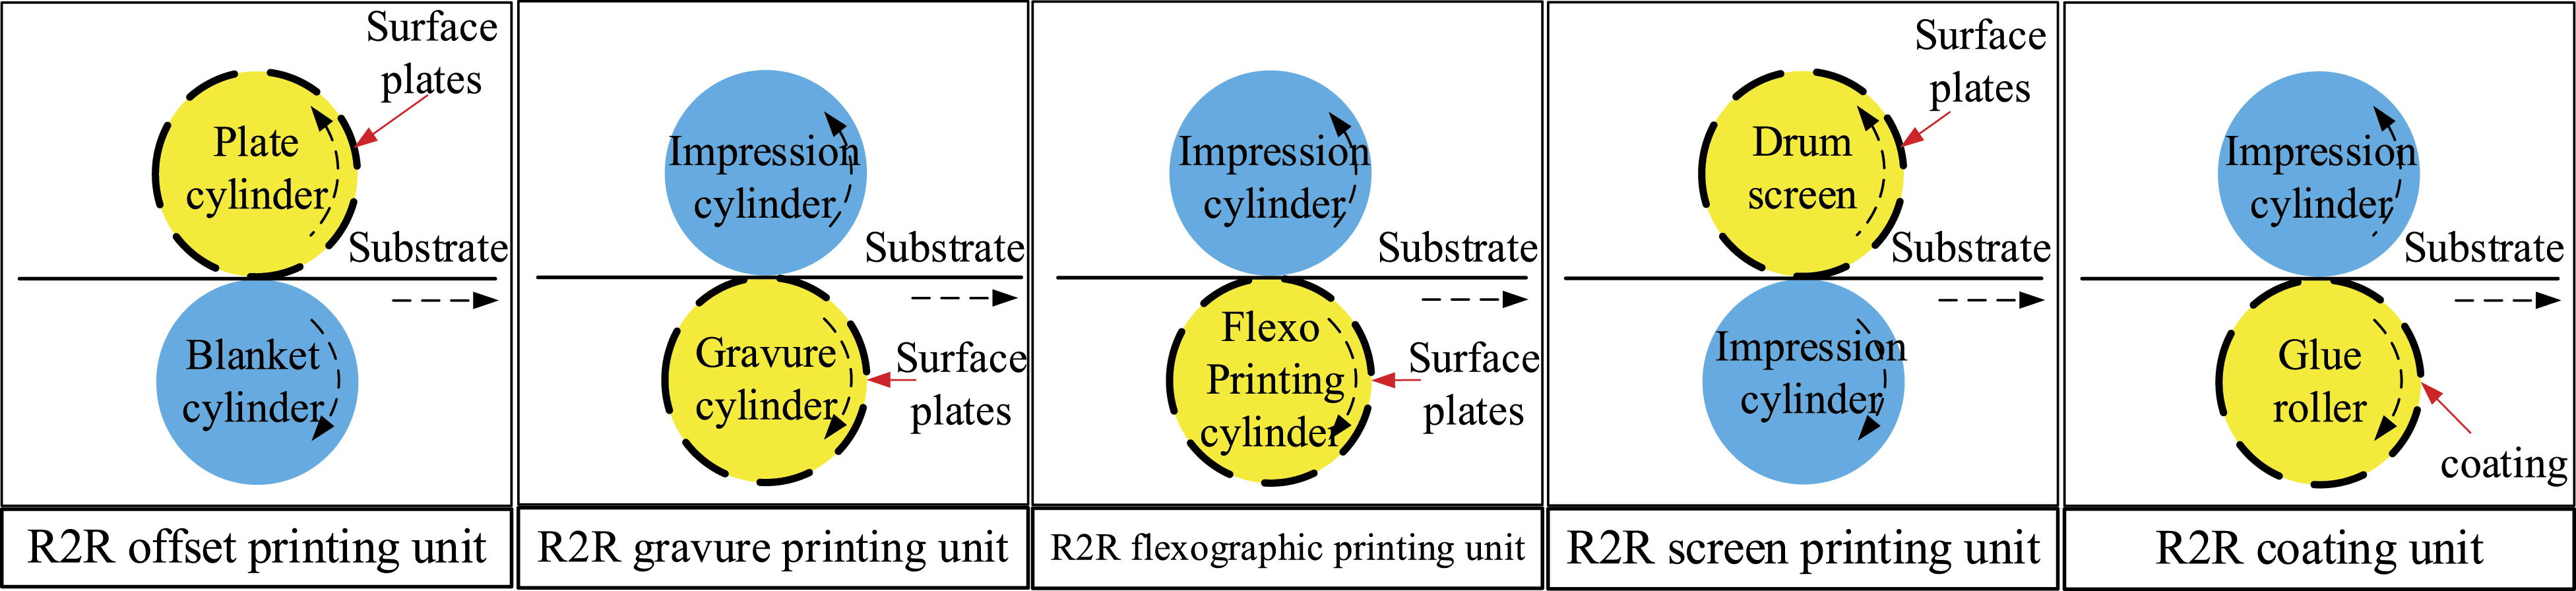
The R2R unit is mainly composed of a large number of high-speed rotating rollers, such as impression cylinders, plate cylinders, rubber rolls, anilox rollers, and ink rollers. Therefore, many rolling bearings are used in this kind of units, and a high-speed and stable production of printing is based on the rolling bearings in a large degree. Due to factors such as high pressure between rollers, high-speed moving, chemical solvents, and other factors involved in printing, the work conditions of bearings are relatively poor. Any weak failure or damage in machine will cause a failure in printed product. Therefore, researches on fault diagnosis in printing plays an important role in the improvement of the reliability for printing.
Recently, the technology of mechanical fault diagnosis is rapidly developing with artificial intelligence. The model of machine learning used in fault diagnosis in early times is always rely on processed signals and extracted features artificially.1,2 This kind method is depended on humane experience in a large degree. With the development of deep learning, fault diagnosis is making a great progress. Due to the strong abilities in model training and data mining of deep learning, the fault diagnosis can be realized more easily and correctly with much fewer fault samples and little human experience. 3
Two steps are always contained in early fault diagnosis models, signal processing and fault classification. In signal processing, many classical methods can be chosen to get effective fault features such as Empirical Mode Decomposition, Wavelet Transform, and Fast Fourier Transform.4-7 In fault classification, many models with strong nonlinear learning abilities are always used such as Support Vector Machine, Artificial Neural Networks, and Naive Bayes8-10 These methods in early works are always restrained and affected by empirical interference easily, and they are limited in many areas and working conditions. With the development of deep learning, there is an obvious changing in fault diagnosis. In fault diagnosis, methods based on deep learning mainly always include Convolutional Neural Network, Generative Adversarial Networks, Long Short-term Memory Networks, Deep Belief Networks, and some improved networks based on them.11-16 In order to improve the speed of fault diagnosis, Shuffle Network and Mobile Network are improved for fault diagnosis.17,18 Meanwhile, unsupervised methods play more important roles in the diagnosis of rotating machinery under strong noise and varying rotational speeds such as Parallel Sparse Filtering and Auto Encoder.19-21 New types of networks are also generated for sparse fault samples, such as Caps Network and Prototypical Network.22,23
As to printing units, there are some special problems such as small number of fault samples, weak fault signals, and strong environmental noise. To realize a fault diagnosis of rolling bearings in a real R2R printing unit, a method based on Wavelet Transform and Siamese Network is proposed in this work.
The main contents are shown in Figure 2 and as following. First, the vibration signal is transformed into a time–frequency image based on CWT to obtain time–frequency information of various faults. Then, the fault diagnosis model of Siamese Network is constructed, and the net is used to amplify the small differences of similar fault samples to realize model training under small samples. In order to simplify the parameters in deep learning model and improve the efficiency of calculation, both Convolutional Neural Network (CNN) and Depth-wise Separable Convolution Network (DSCN) are introduced to reduce the amount of model parameters and calculations with high accuracy. Finally, the effectiveness of the proposed method is verified with a fault database of rolling bearings, and then the method is applied to fault diagnosis of rolling bearings in two different R2R printing units successfully. Flowchart of fault diagnosis.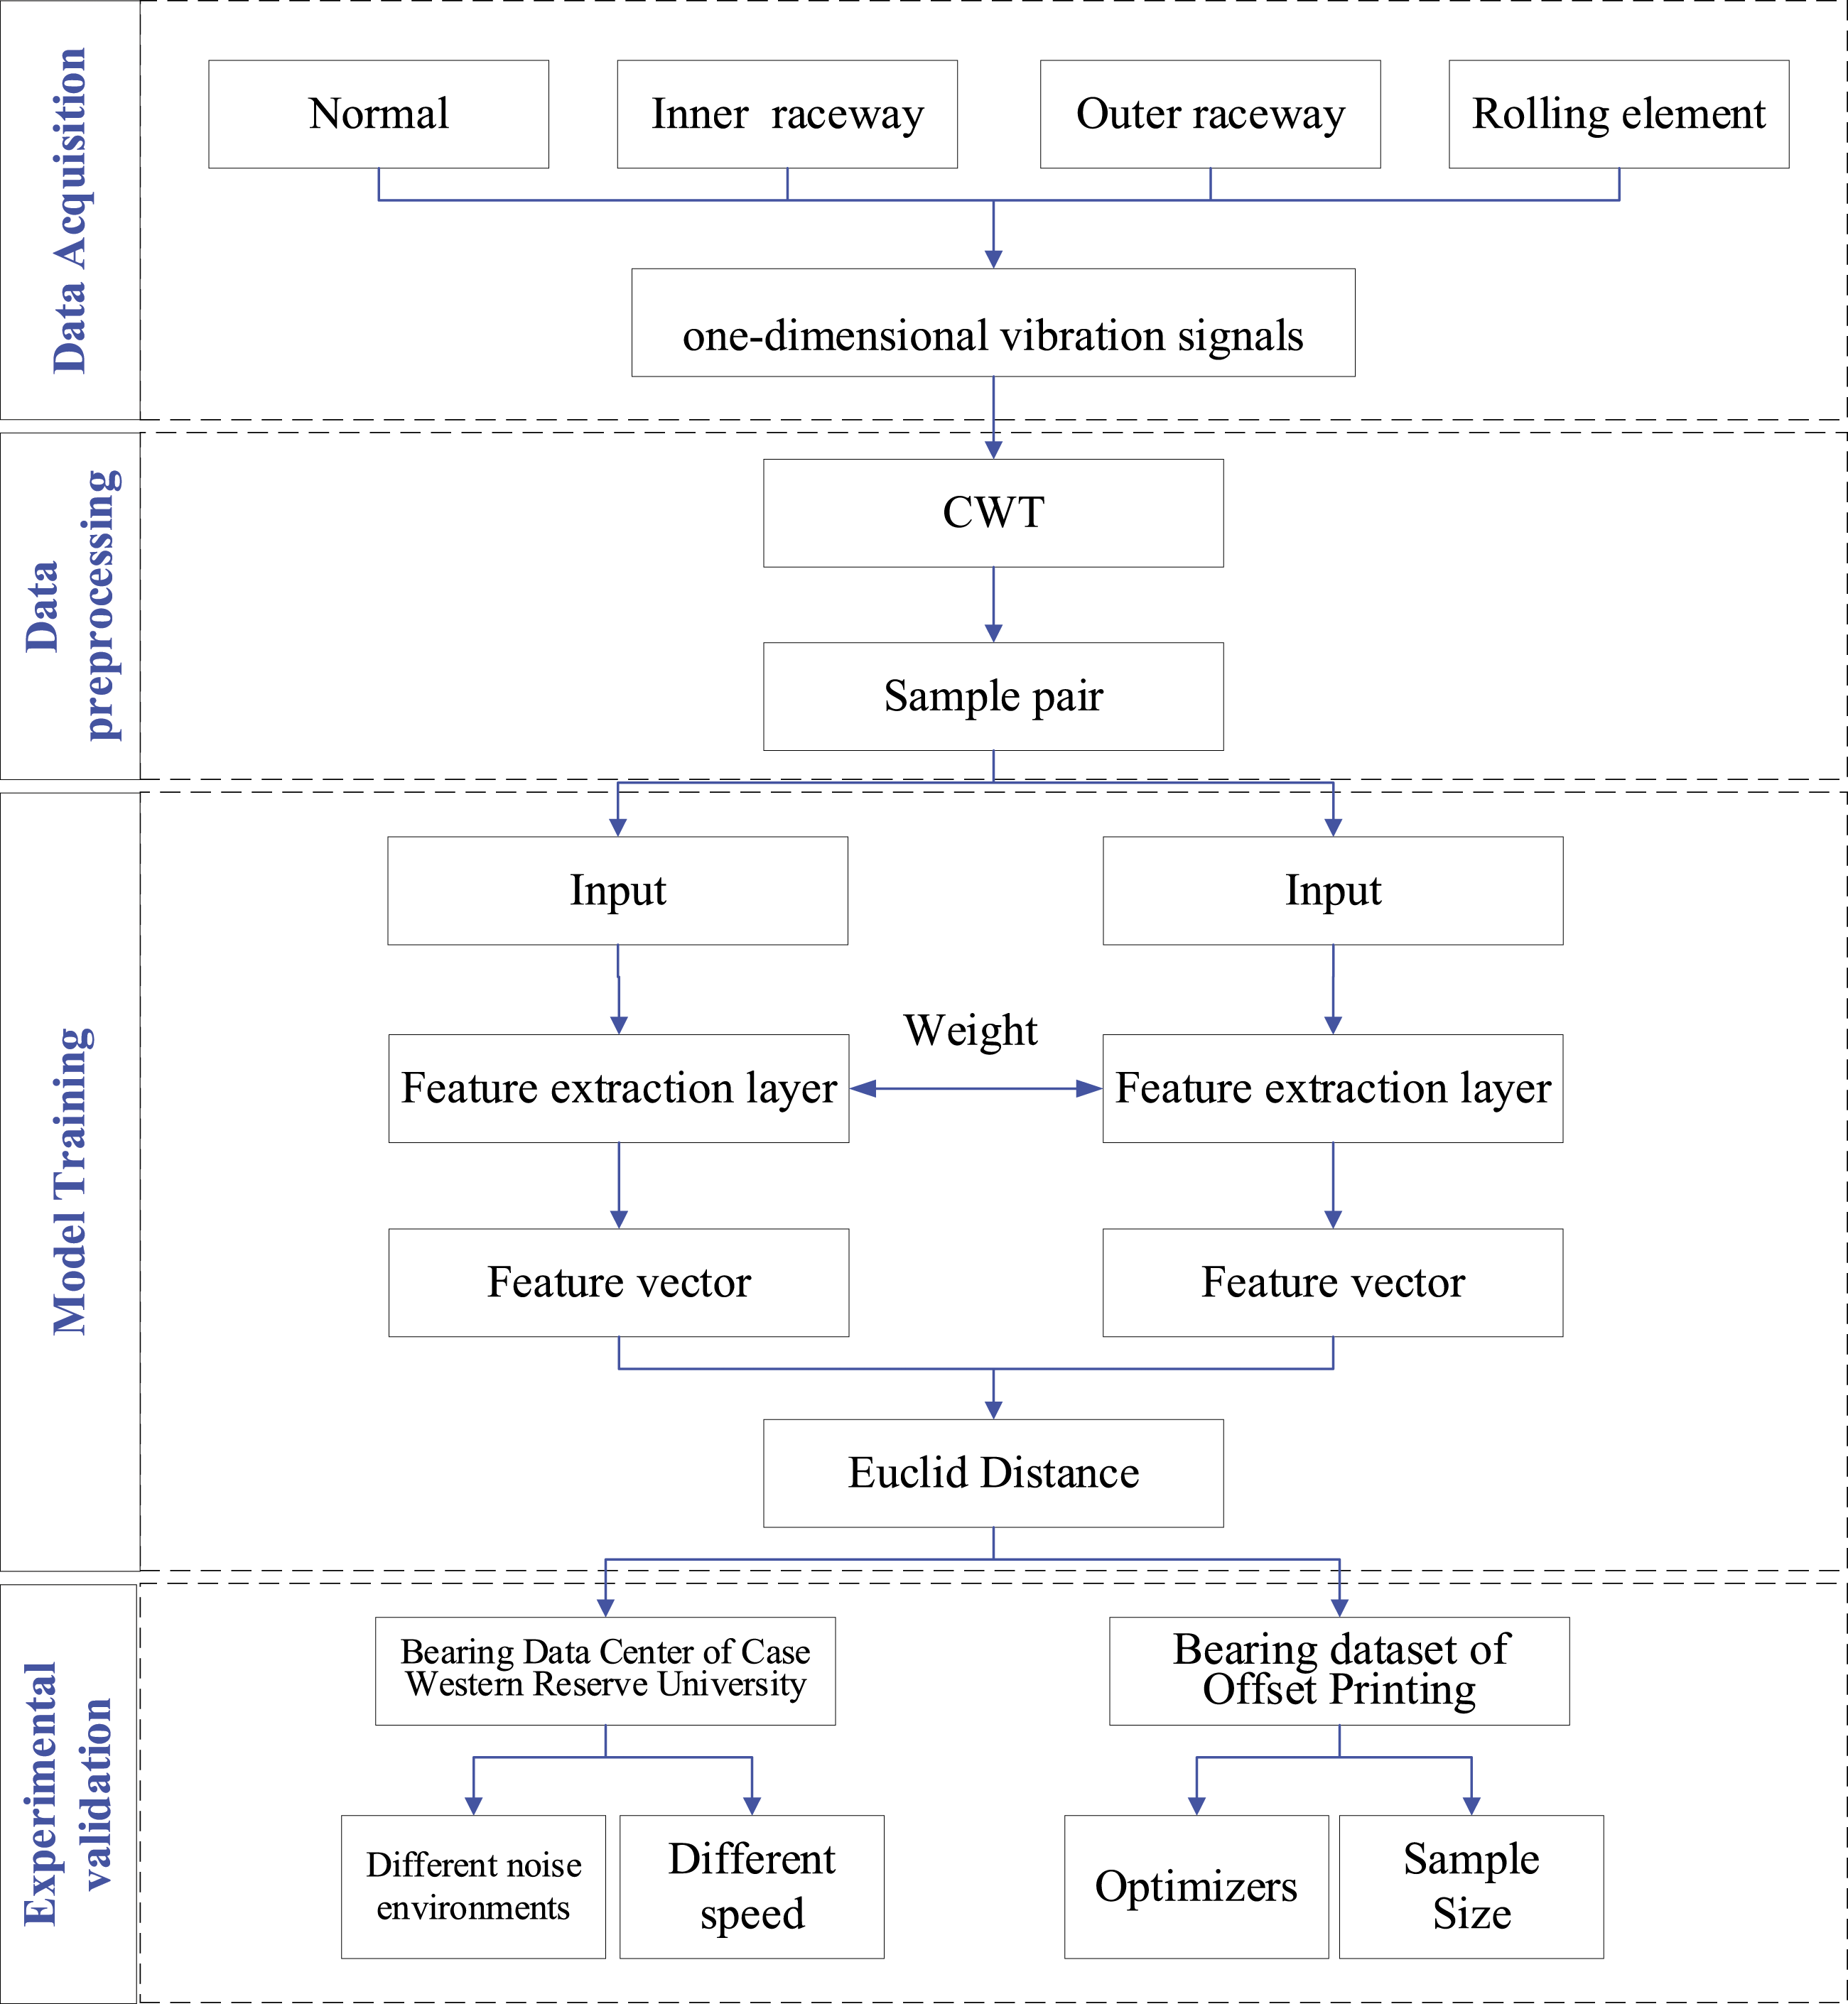
The main novelties and contributions of this paper are summarized as follows.
Two deep learning models based on parallel structure with Convolutional Neural Network and Depth-wise Separable Convolution Network are proposed named as SN-CNN and SN-DSCN.
A method of fault diagnosis based on continuous wavelet transform and proposed models is given, thus advantages in image recognition in CNN and DSCN can be played.
The fault diagnosis for rolling bearing with small samples in R2R printing units is realized with a high accuracy with given methods in experiments.
The remaining parts of this paper are organized as follows. Section 2 reviews methods used in the processing of fault signals. The theoretical background of Continuous Wavelet Transform is described and a detailed calculation is also described in this section. In Section 3, a Siamese Network is established, and then a new structure of Siamese Network for fault diagnosis is proposed and analyzed here. Both DSCN and CNN are introduced in Siamese Network as a sub-net to enhance the ability of training. In Section 4, three groups of experiments were taken to realize the fault diagnosis of rolling bearings, two kinds of samples from real R2R printing units. With the advantages of Siamese Network, a high accuracy is obtained from small fault samples under different noises. The given method is proved to be effective and conclusions are recorded in Section 5.
The processing of fault signals
Continuous wavelet transform is used here to get images from vibration signals, and these time–frequency spectra can be used for model training in CNN models effectively. In our earlier work for fault diagnosis of rolling bearings, CWT got an effective result with CNN models. Therefore, it is chosen here for Siamese Network with CNN structures here. 24
Continuous wavelet transform
Fault signals can be analyzed on different scales by basic wavelet functions. The continuous wavelet transform is defined as equation (1). Here

In CWT, the high-frequency information in the signal usually contains in the fast-changing part of time domain, such as steep leading edges and sharp pulses. As to this part of signal, an enough time resolution is necessary to meet the fast changing in short intervals. In contrast, the low-frequency information contains in the slow-changing part and therefore a higher frequency resolution is required. The mother wavelet function always decays quickly with a finite length, then a series of wavelet basis functions can be obtained from the mother wavelet function with different values of time shift and scale factor.25,26
Information with different scales from time–frequency relationships can be obtained according to different mother wavelet functions. Considering that Morlet wavelet basis has a strong ability in time–frequency analysis, it is chosen as the wavelet basis in following works.27,28 The Morlet wavelet basis used here can be expressed as equation (2)

Realization of continuous wavelet transform
CWT has a good property of time–frequency localization. With the help of a series of wavelet basis functions, it has unique advantages in the processing of sudden signal. 29 A given signal can be analyzed under different times and frequencies scales with CWT, and a time-frequency image can be obtained from the result.
According to the relationship between scale and frequency, a time–frequency image always reflects the change of frequency components with time in various scales. Since different faults will make the distribution of frequency components in signals to be different, and there is also a difference between those time–frequency diagrams. Thus, a problem of fault diagnosis can be seen as a pattern recognition for images. Then deep learning models can be used to realize this image recognition for fault diagnosis.
As in Figure 3, a vibration signal of normal rolling bearings is converted into a time–frequency diagram based on CWT with the Morlet wavelet. The transform based on CWT.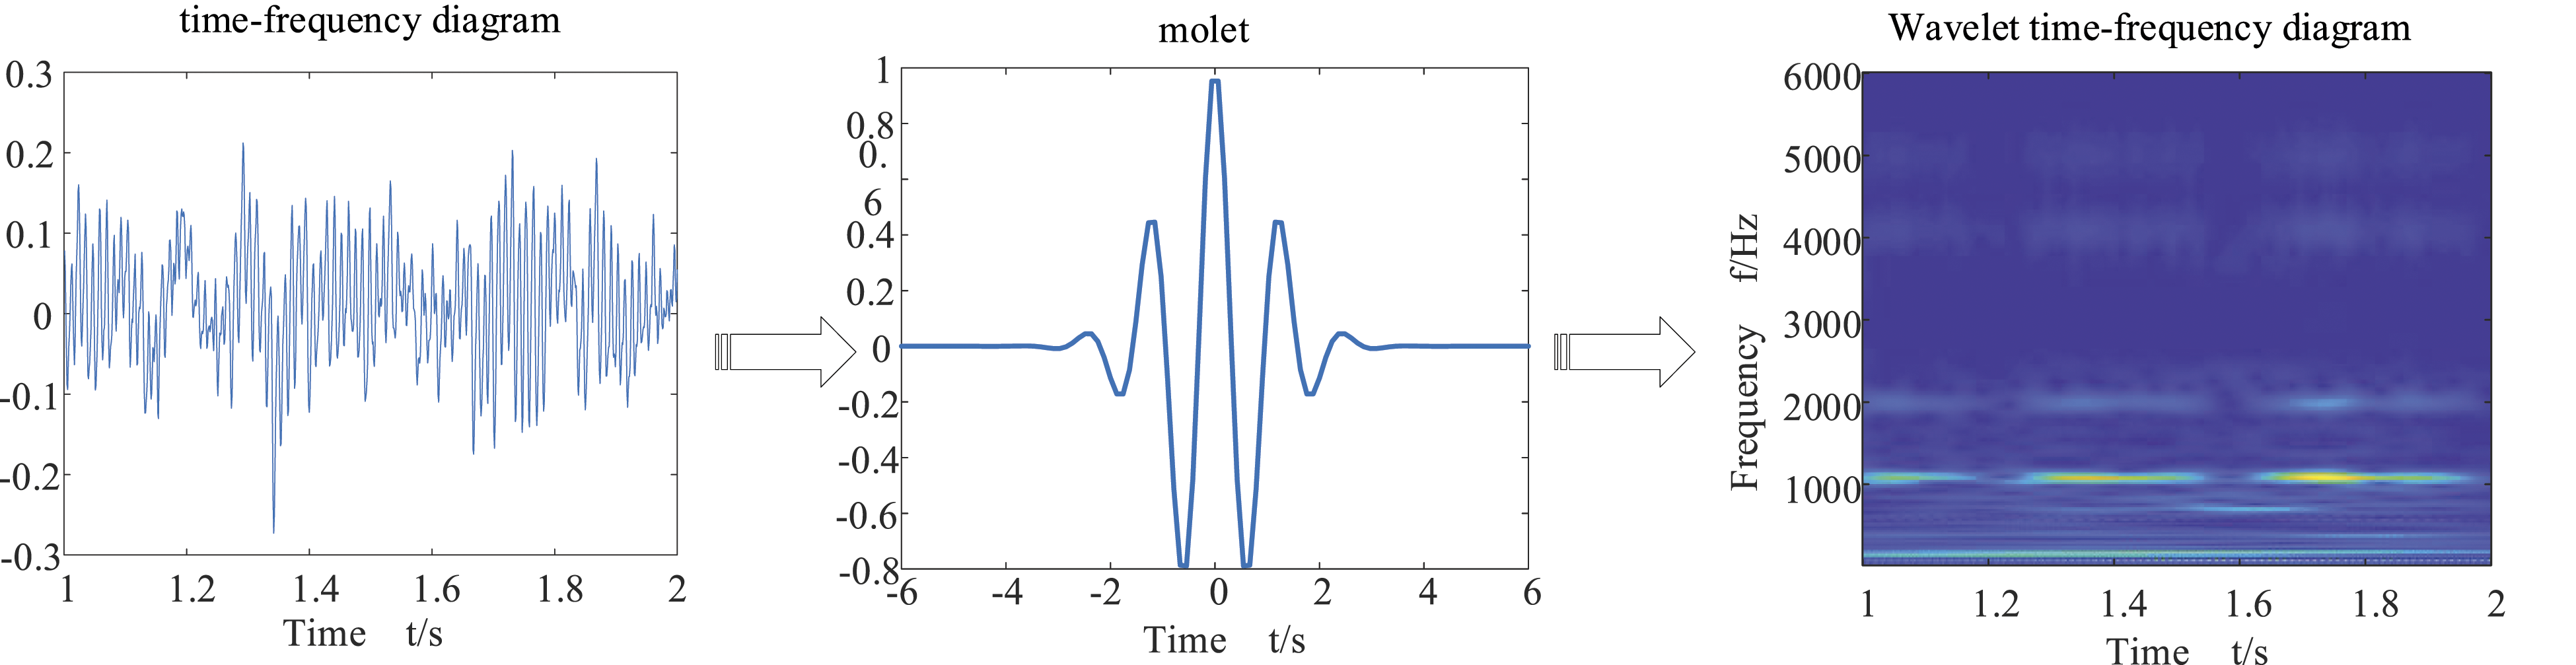
The deep network for fault diagnosis
Two deep learning models are proposed named as SN-CNN and SN-DSCN, and a method of fault diagnosis based on continuous wavelet transform is given in this part.
The structure of Siamese Network
Those small differences in fault samples can be amplified in the Siamese Network, and this property is very useful in the early bearing fault diagnosis. Siamese neural networks employ a unique structure to naturally rank similarity between inputs. In general, SN is composed of two sub-networks. The unique network consists of these twin networks which accept distinct inputs but are joined by an energy function at the top. This function computes some metric between the highest-level feature representation on each side. The parameters between the twin networks are tied, thus the structure of network is symmetric.
The structure of Siamese Network used here is shown in Figure 4. Two similar parts of network should be established, and then they can be composed together to form a whole model. In Siamese Networks, the weights can be shared during training and results from two sub-networks can be evaluated by a distance function. The property of a SN is decided by the structure of sub-network in a large degree, and it is important to choose a suitable structure for a specific work. Compared with a single neural network, the parameters are increased in the Siamese Network due to its structure expansion in the topology, which will increase additional calculations. The structure of Siamese Network.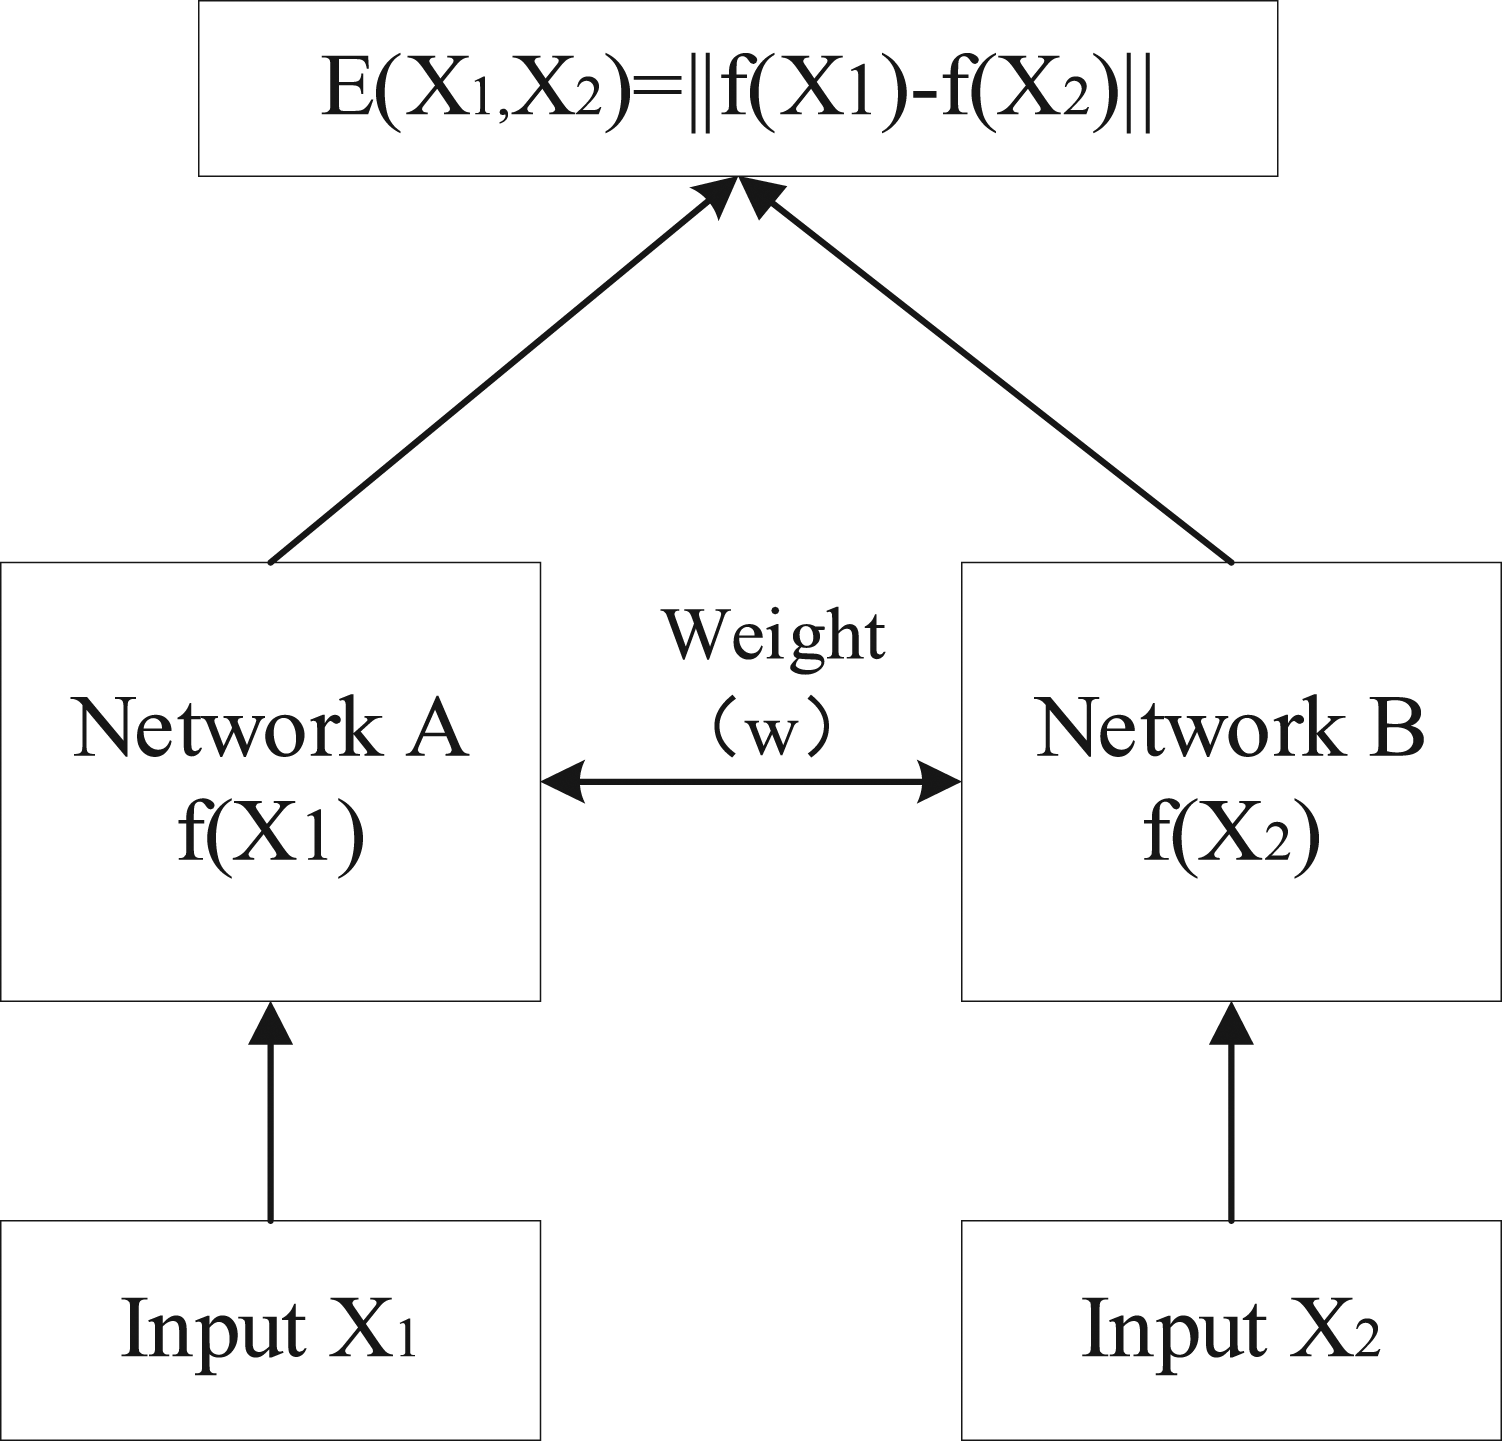
As to the fault diagnosis of rolling bearings in printing units, fault samples from equipment are limited due to the cost of experiment. Considering that the samples are converted into images in part 2, CNN can be chosen since it has a strong ability of recognition for images. However, in the following fault diagnosis of small samples, CNN cannot realize the classification.
Then Siamese Network with CNN model is suitable for this small samples problem, but a more amount of calculation should be solved at first. To improve this problem, a DSCN is then introduced to form the sub-nets. DSCN can be seen as an improvement of CNN, and it can reduce the size and computational cost in some degree. Both structures were considered in following work.
The principle of Siamese Network
As Figure 4, the whole learning process can be divided into four steps, including the input, feature extraction, distance measurement, and fault recognition. Two identical feature extraction sub-networks consist of the whole Siamese network.
Once a pair of samples named (


Adopting this strategy can significantly increase the amount of data used to train the model and reduce effectively reliance on the fault samples.
In this paper, we adopt L1 distance as our distance matrix. The distance between a sample pair of (

Depth-wise Separable Convolution Network
DSCN and global max pooling are proposed to reduce the number of model parameters, and the calculation speed can also be improved. A standard convolution can be decomposed into a depth-wise convolution and a pointwise convolution as shown in Figure 5. The effeteness of on reducing the number of parameters with DSCN can be seen by comparing a CNN sub net directly. Depth-wise separable convolution.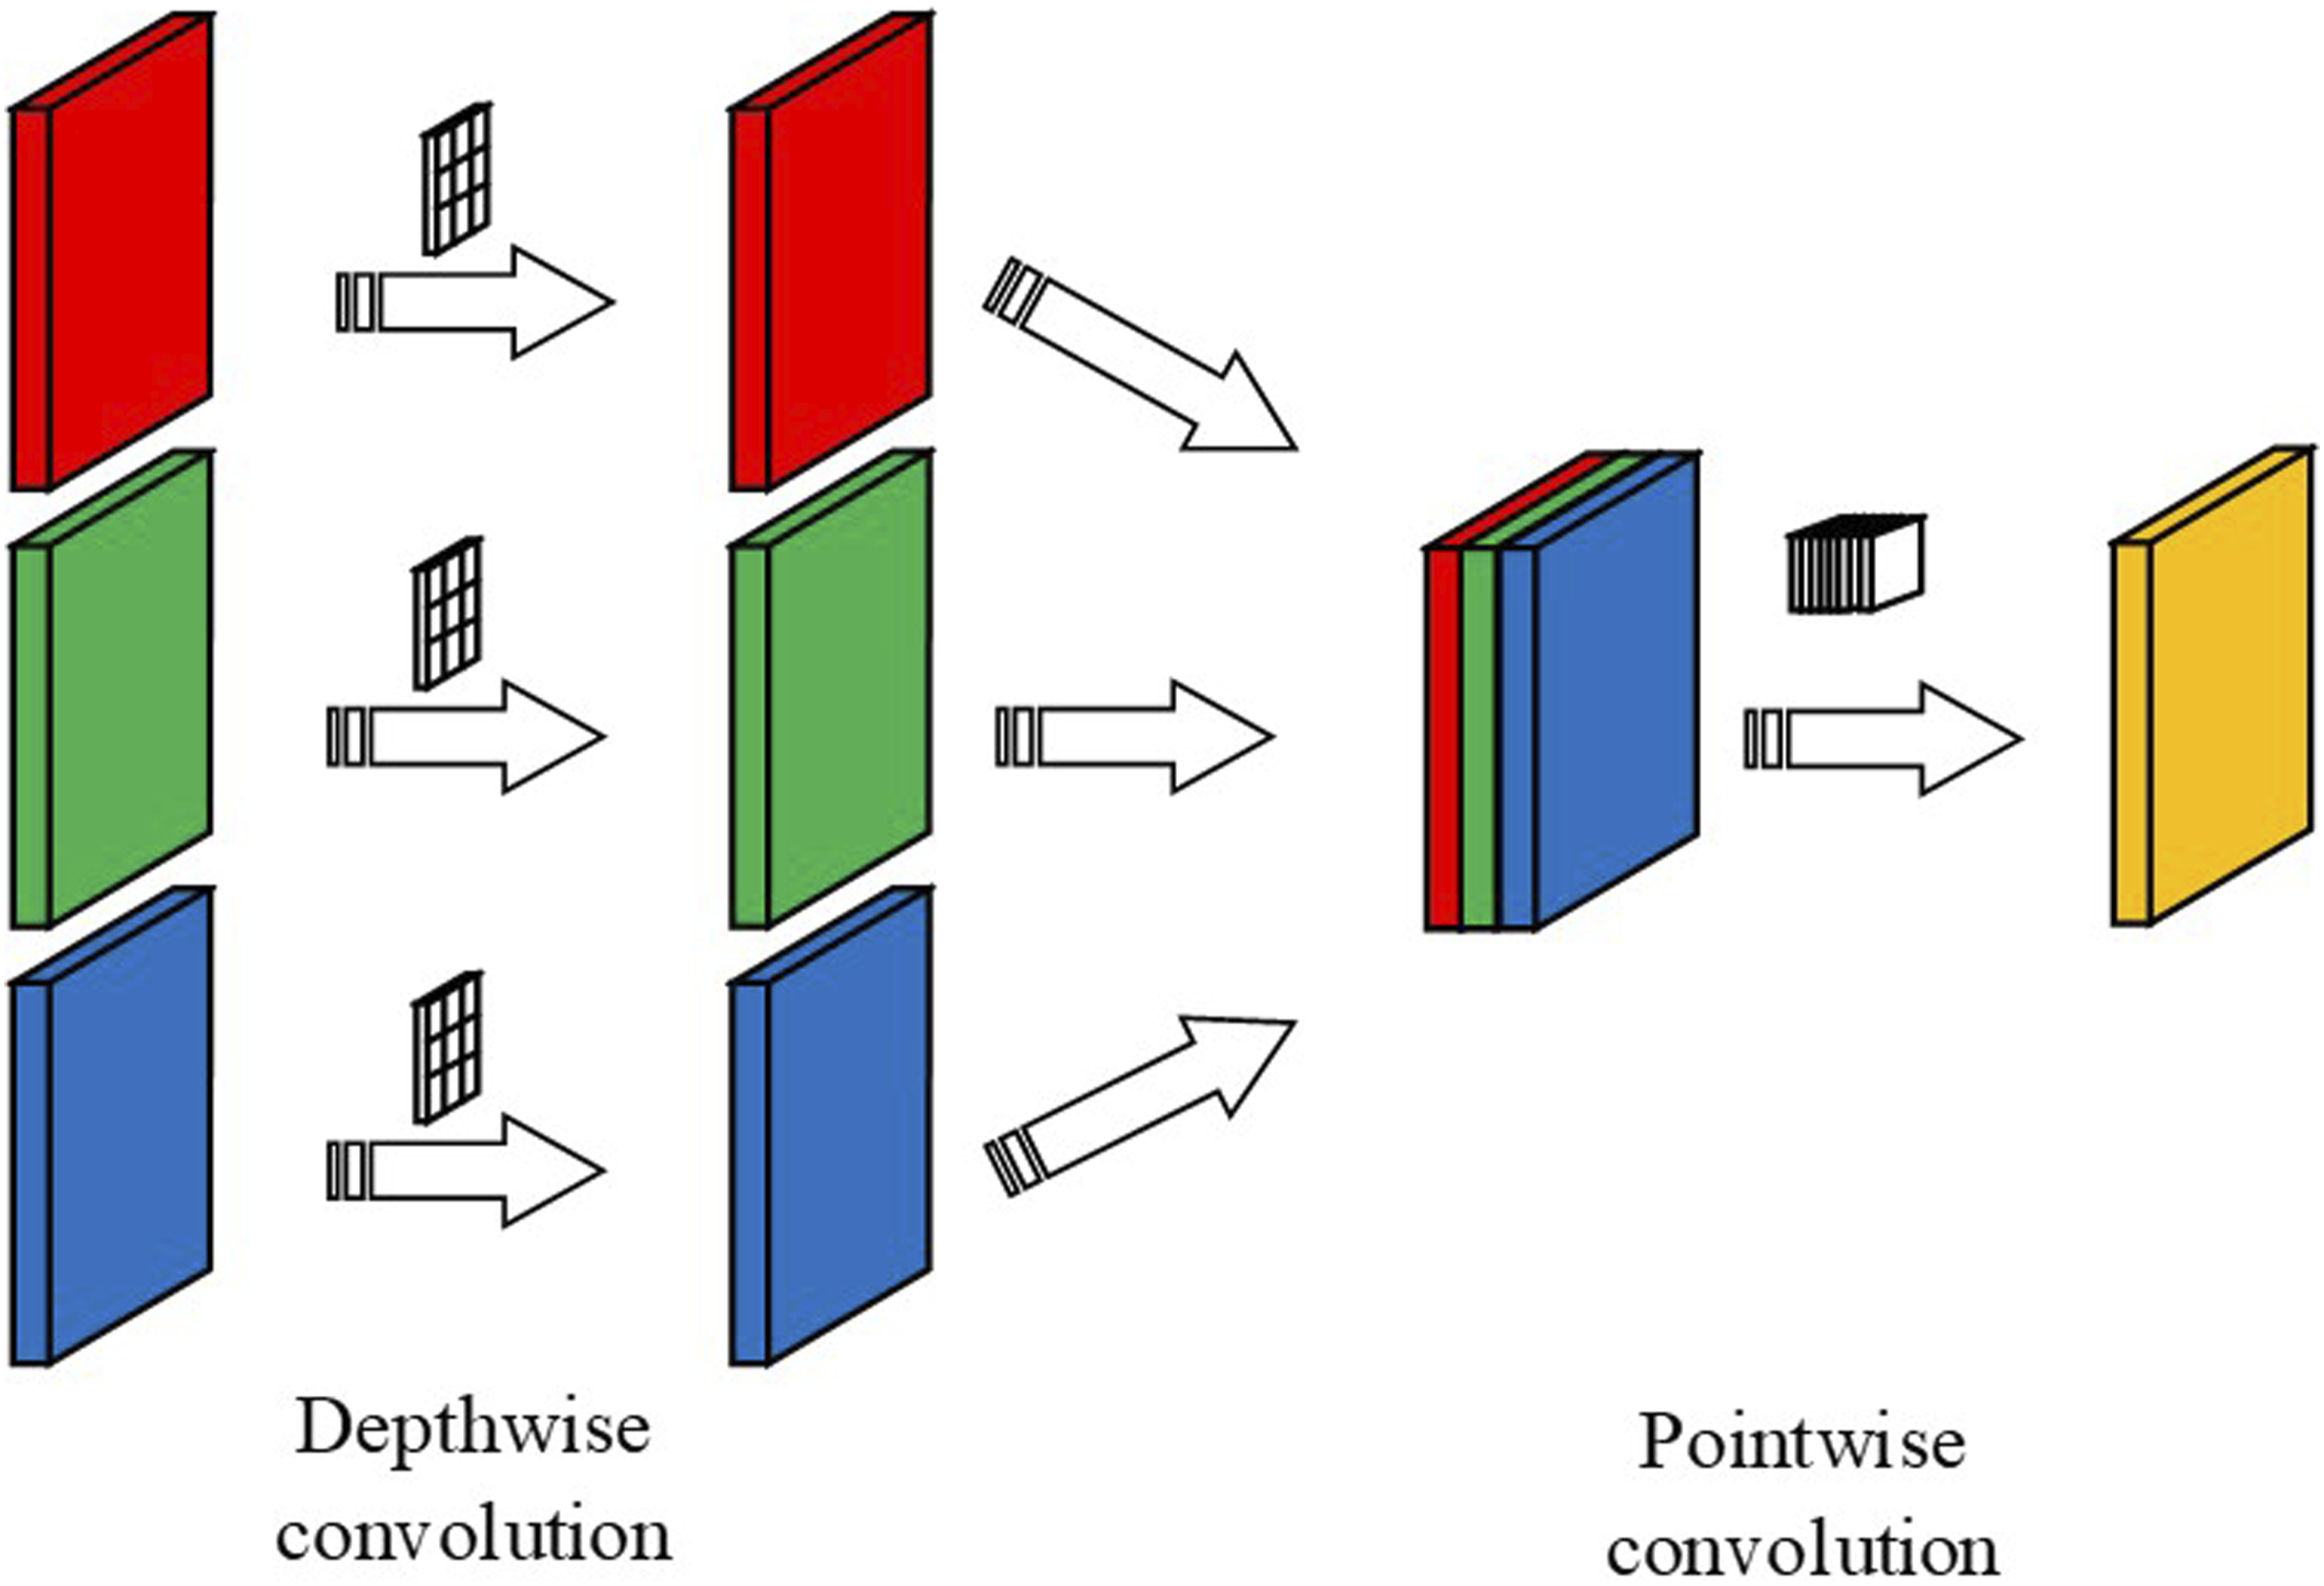
A CNN layer takes an image with the size of
Meanwhile, global max pooling is used here. As shown in Figure 6, it computes only a single max value for each input channel. This pooling mode can greatly reduce the number of parameters. Whereas in a CNN model, the fully connected layer has too many parameters, which can easily cause over-fitting. Flatten Layer can be replaced by Global max pooling block, and then the fully connected blocks of CNN can also be improved with less parameters. Global max pooling.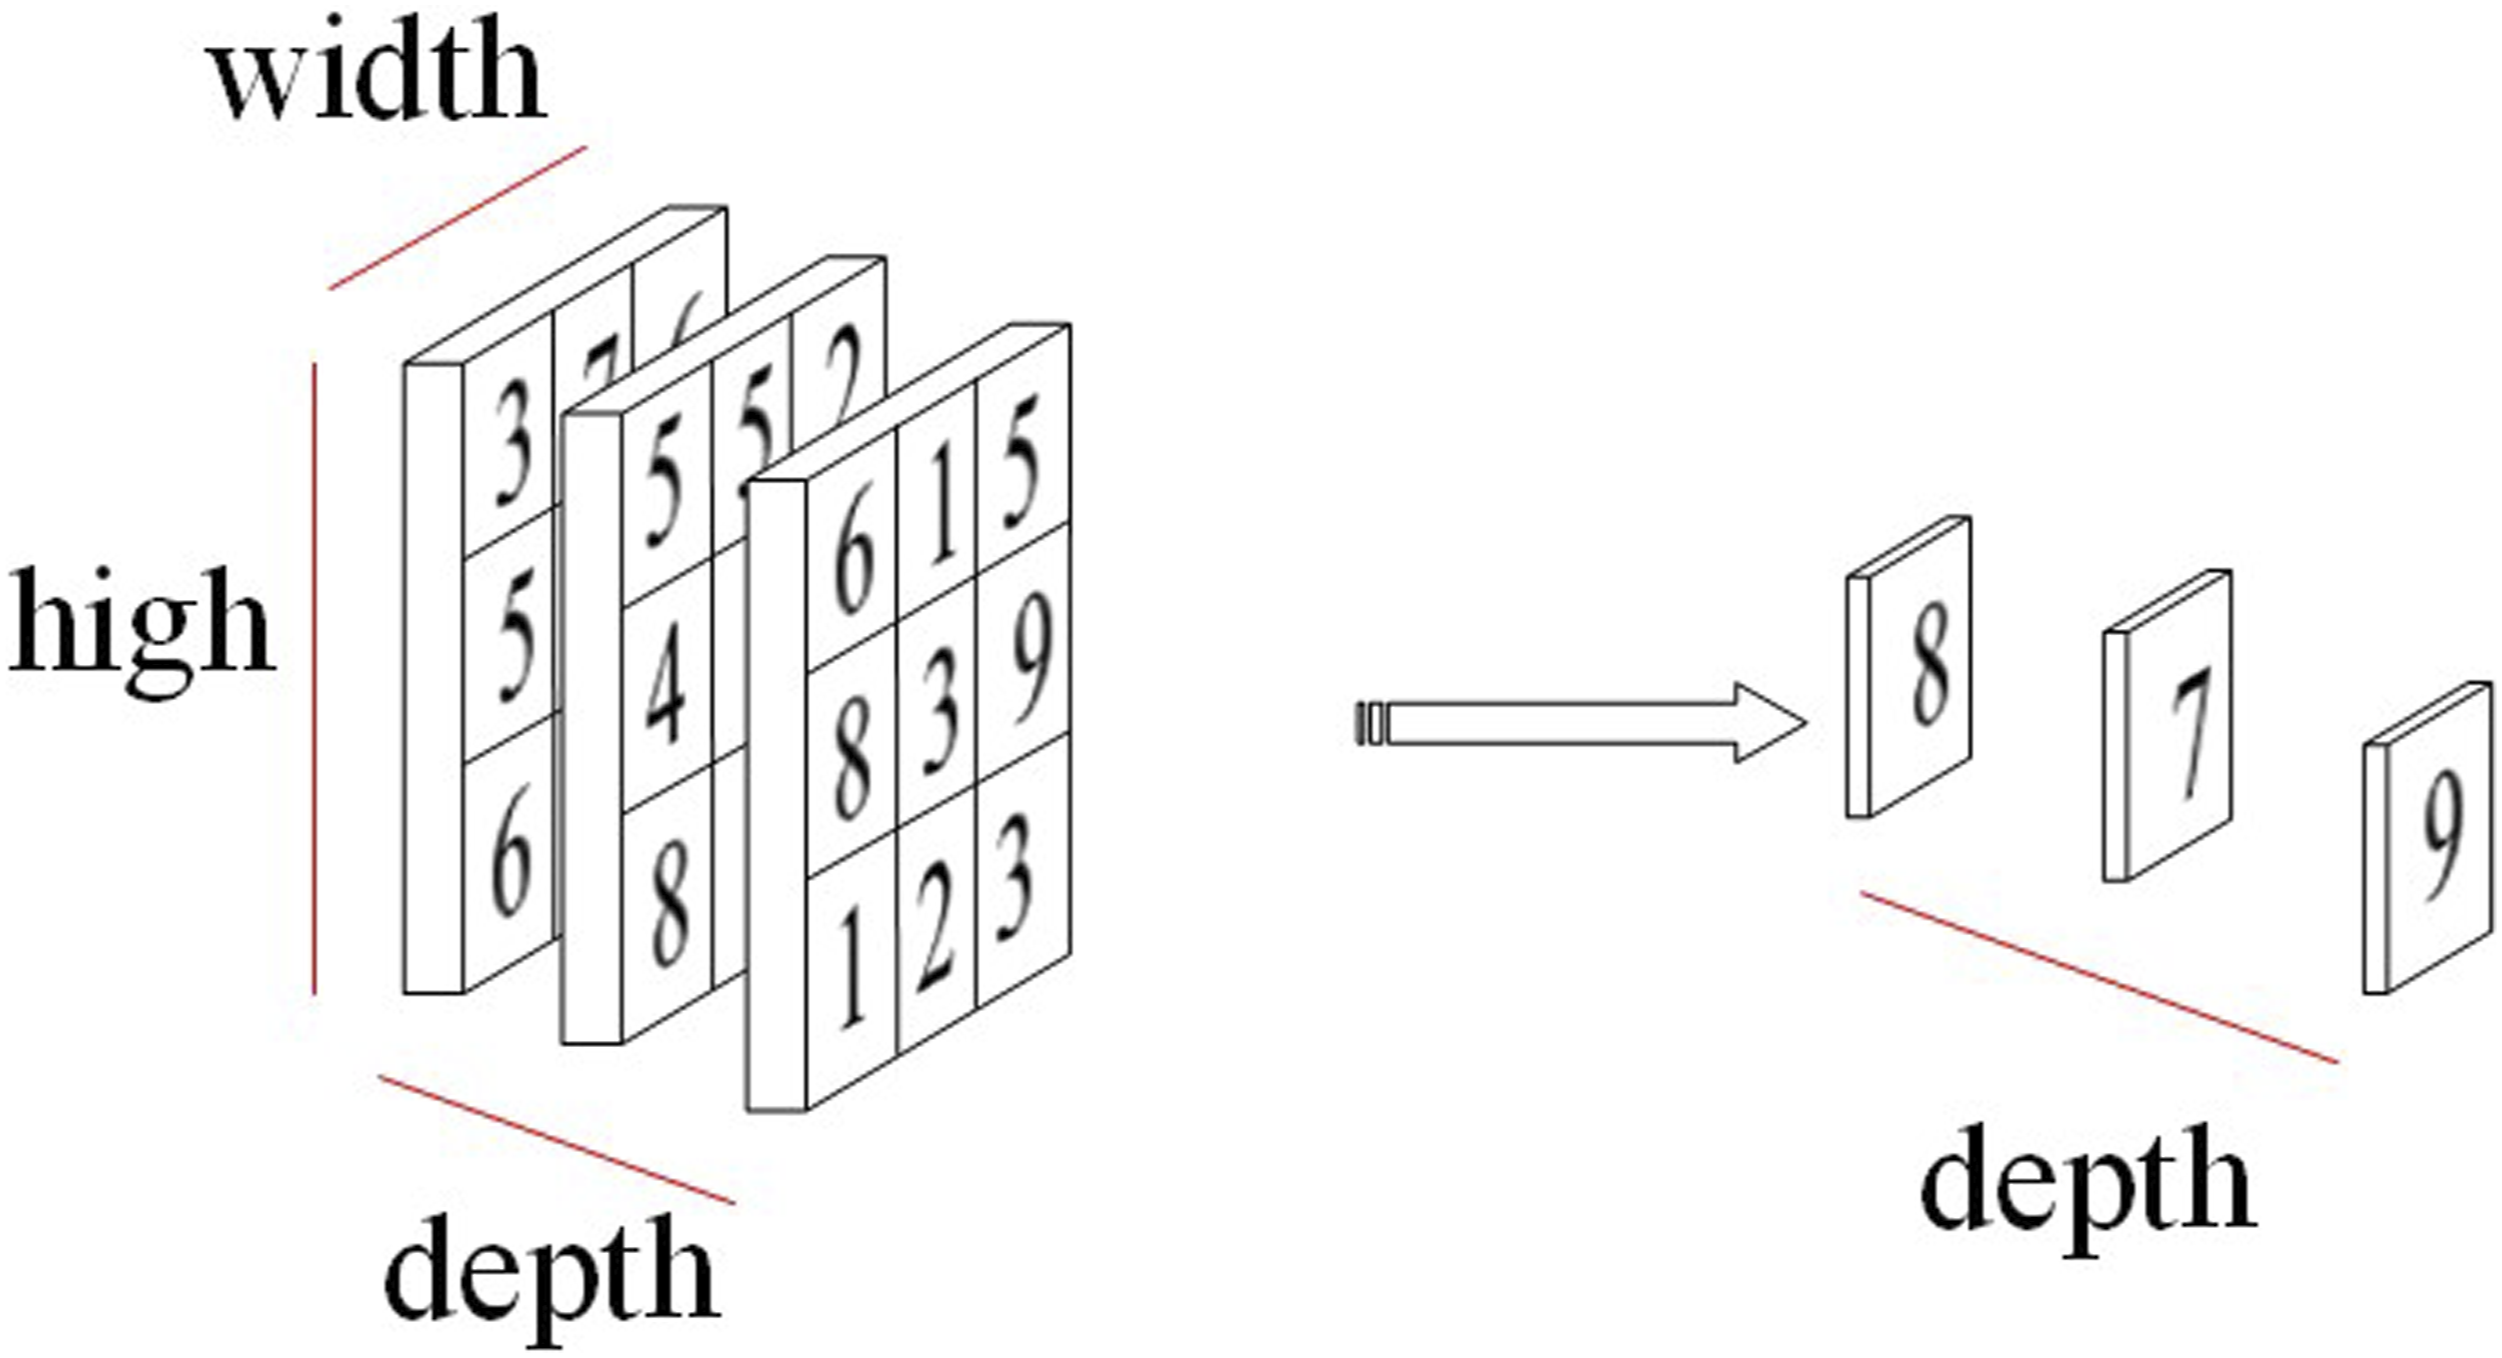
In the training process, the weights of networks are needed to be adjusted by a loss function. In this work, the Cross-Entropy Loss is selected and defined as equation (6).

Here T represents number of training examples,
Besides a Siamese Network with two sub-nets of CNN (SN-CNN), a model based on Siamese Network with two sub-nets of DSCN is also established (SN-DSCN) for the fault diagnosis in this work. The specific structure is recorded in Figure 7 and main stages are given and labeled. And their time consumptions are also analyzed and compared. The SN-DSCN model for fault diagnosis.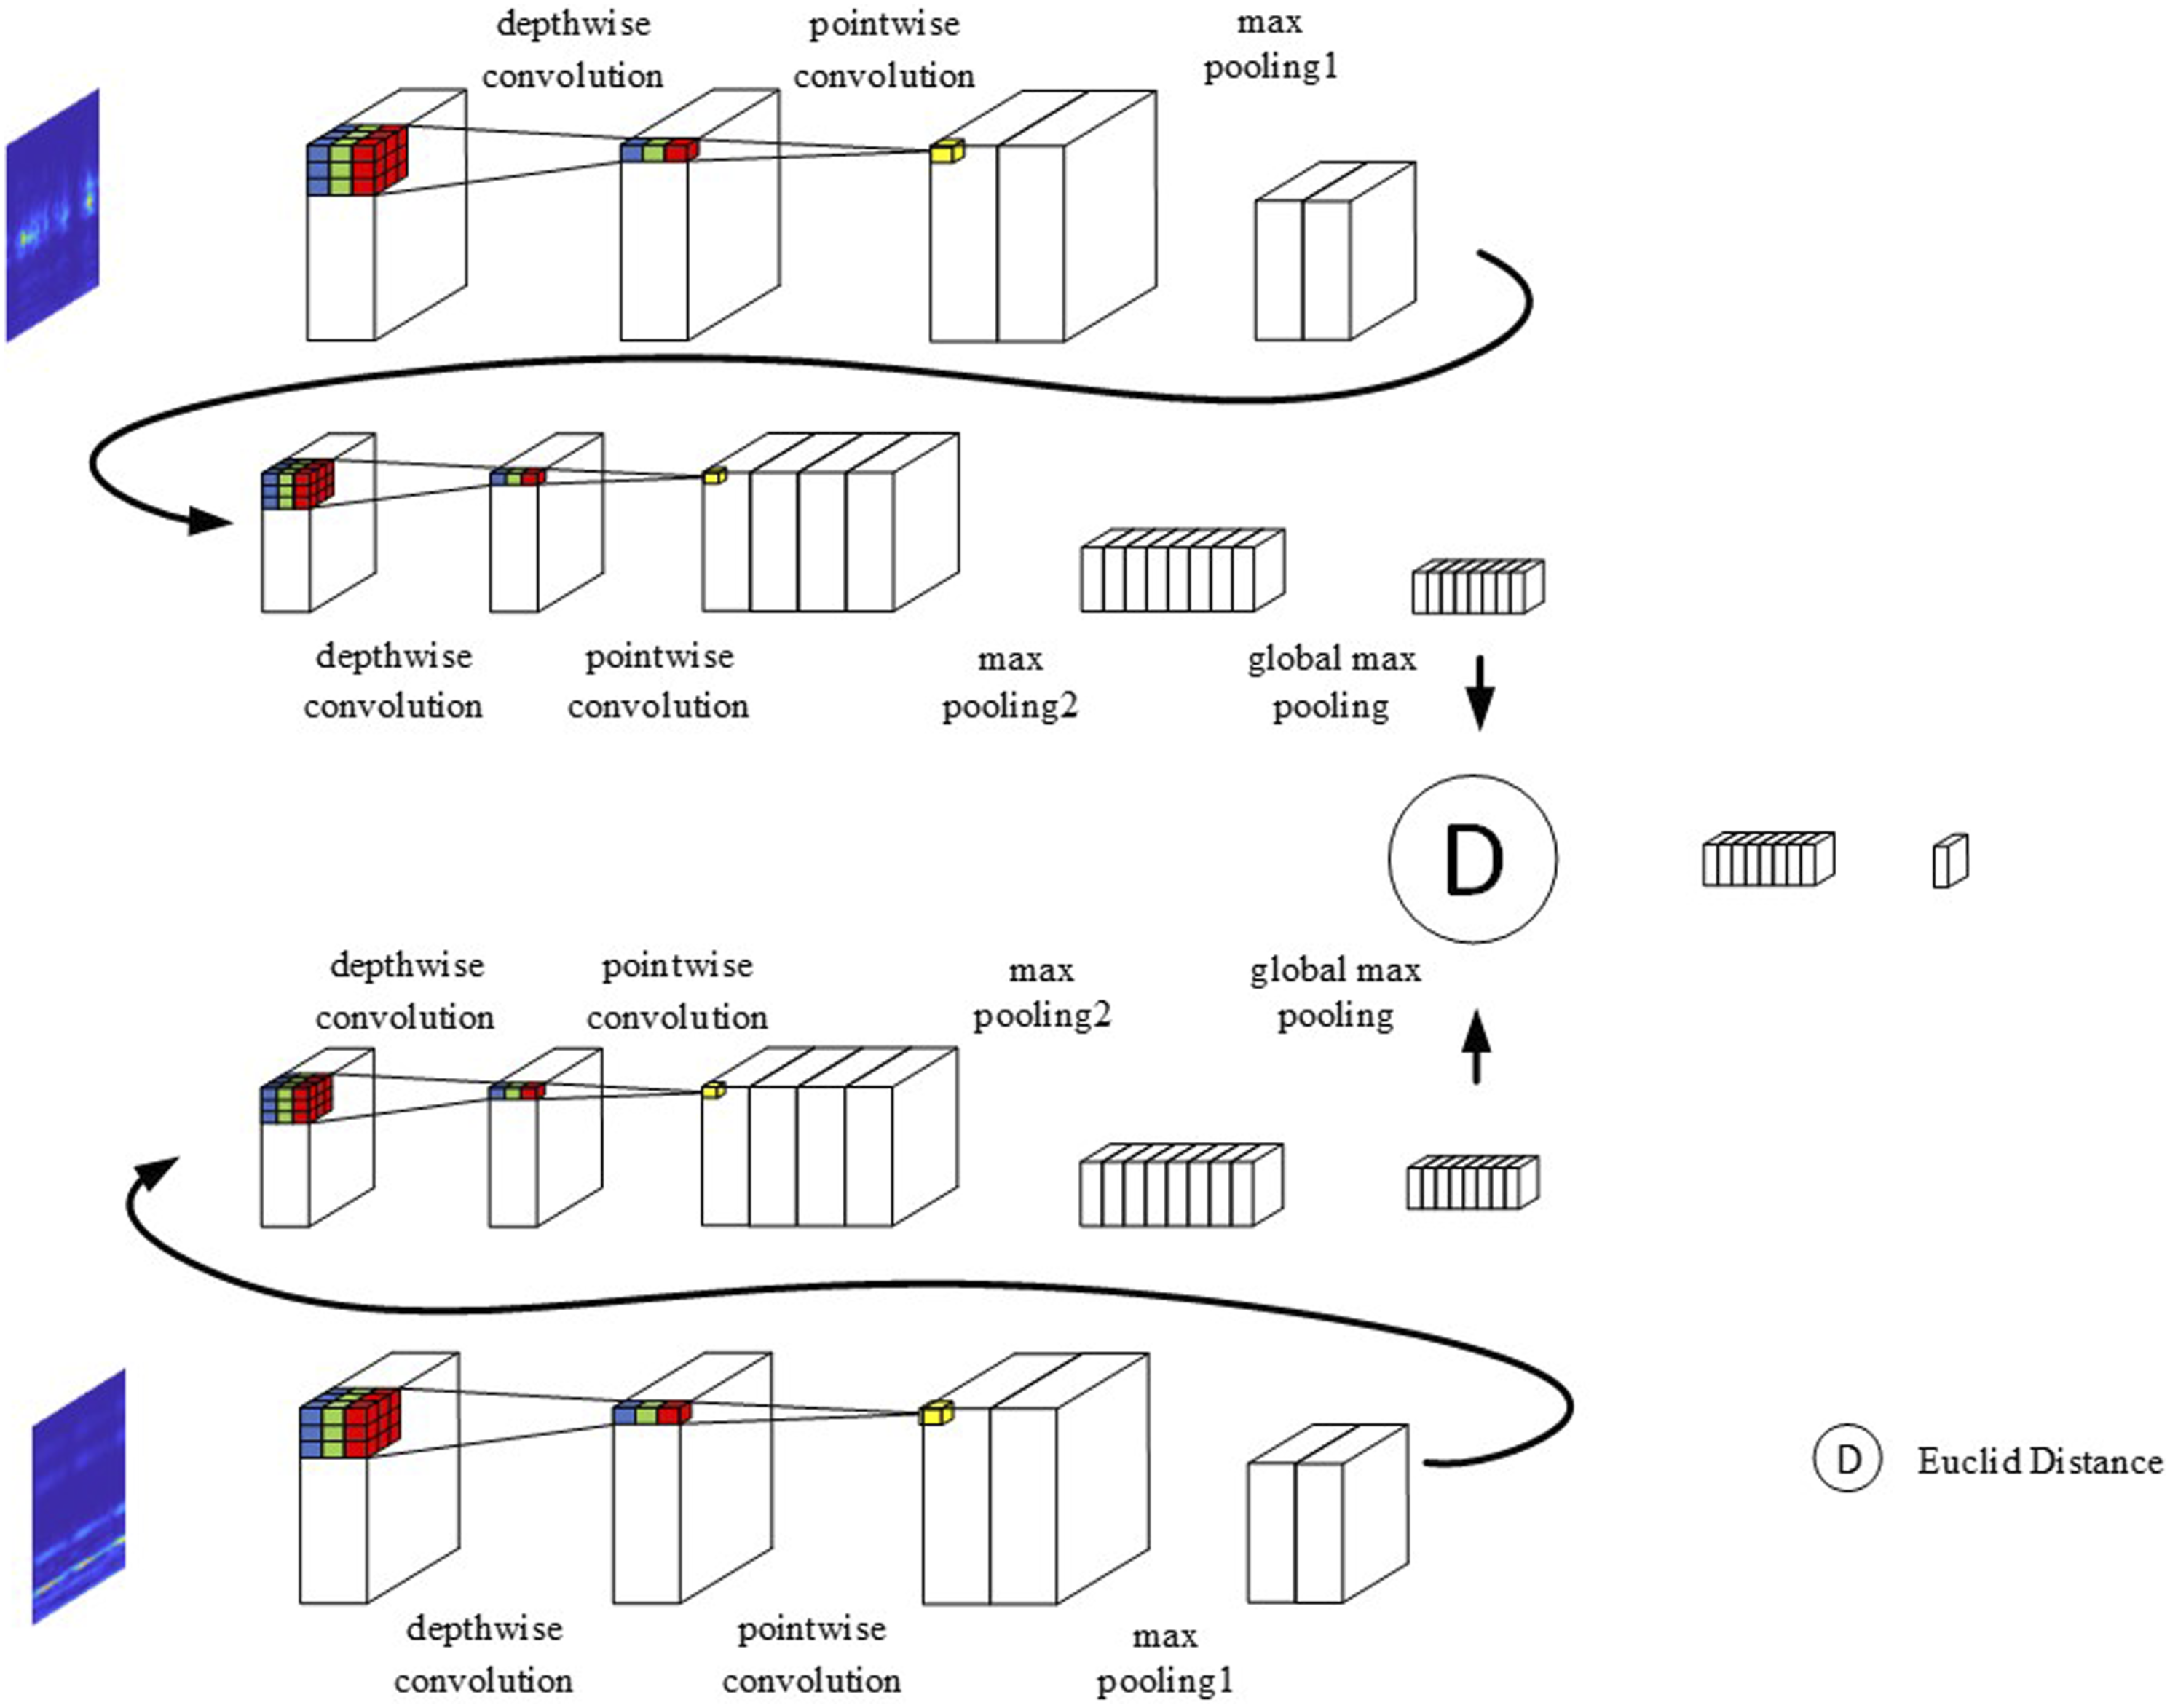
Fault diagnosis with SN-DSCN and SN-CNN
Now a method of fault diagnosis based on proposed SN-CNN and SN-DSCN models with CWT. Fault signals can be changed into a series of images by CWT, therefore, advantages in image recognition of CNN and DSCN in can be played fully.
The given method is used for the fault diagnosis of rolling bearings in both a rotor system and a R2R unit. The flow chart of fault diagnosis is shown in Figure 8. To realize the fault diagnosis, training and verifying data should be obtained and changed into frequency spectra to establish the models. Then unknown signals to be identified will be put into trained models to make a classification for fault classes. The proposed method for fault diagnosis.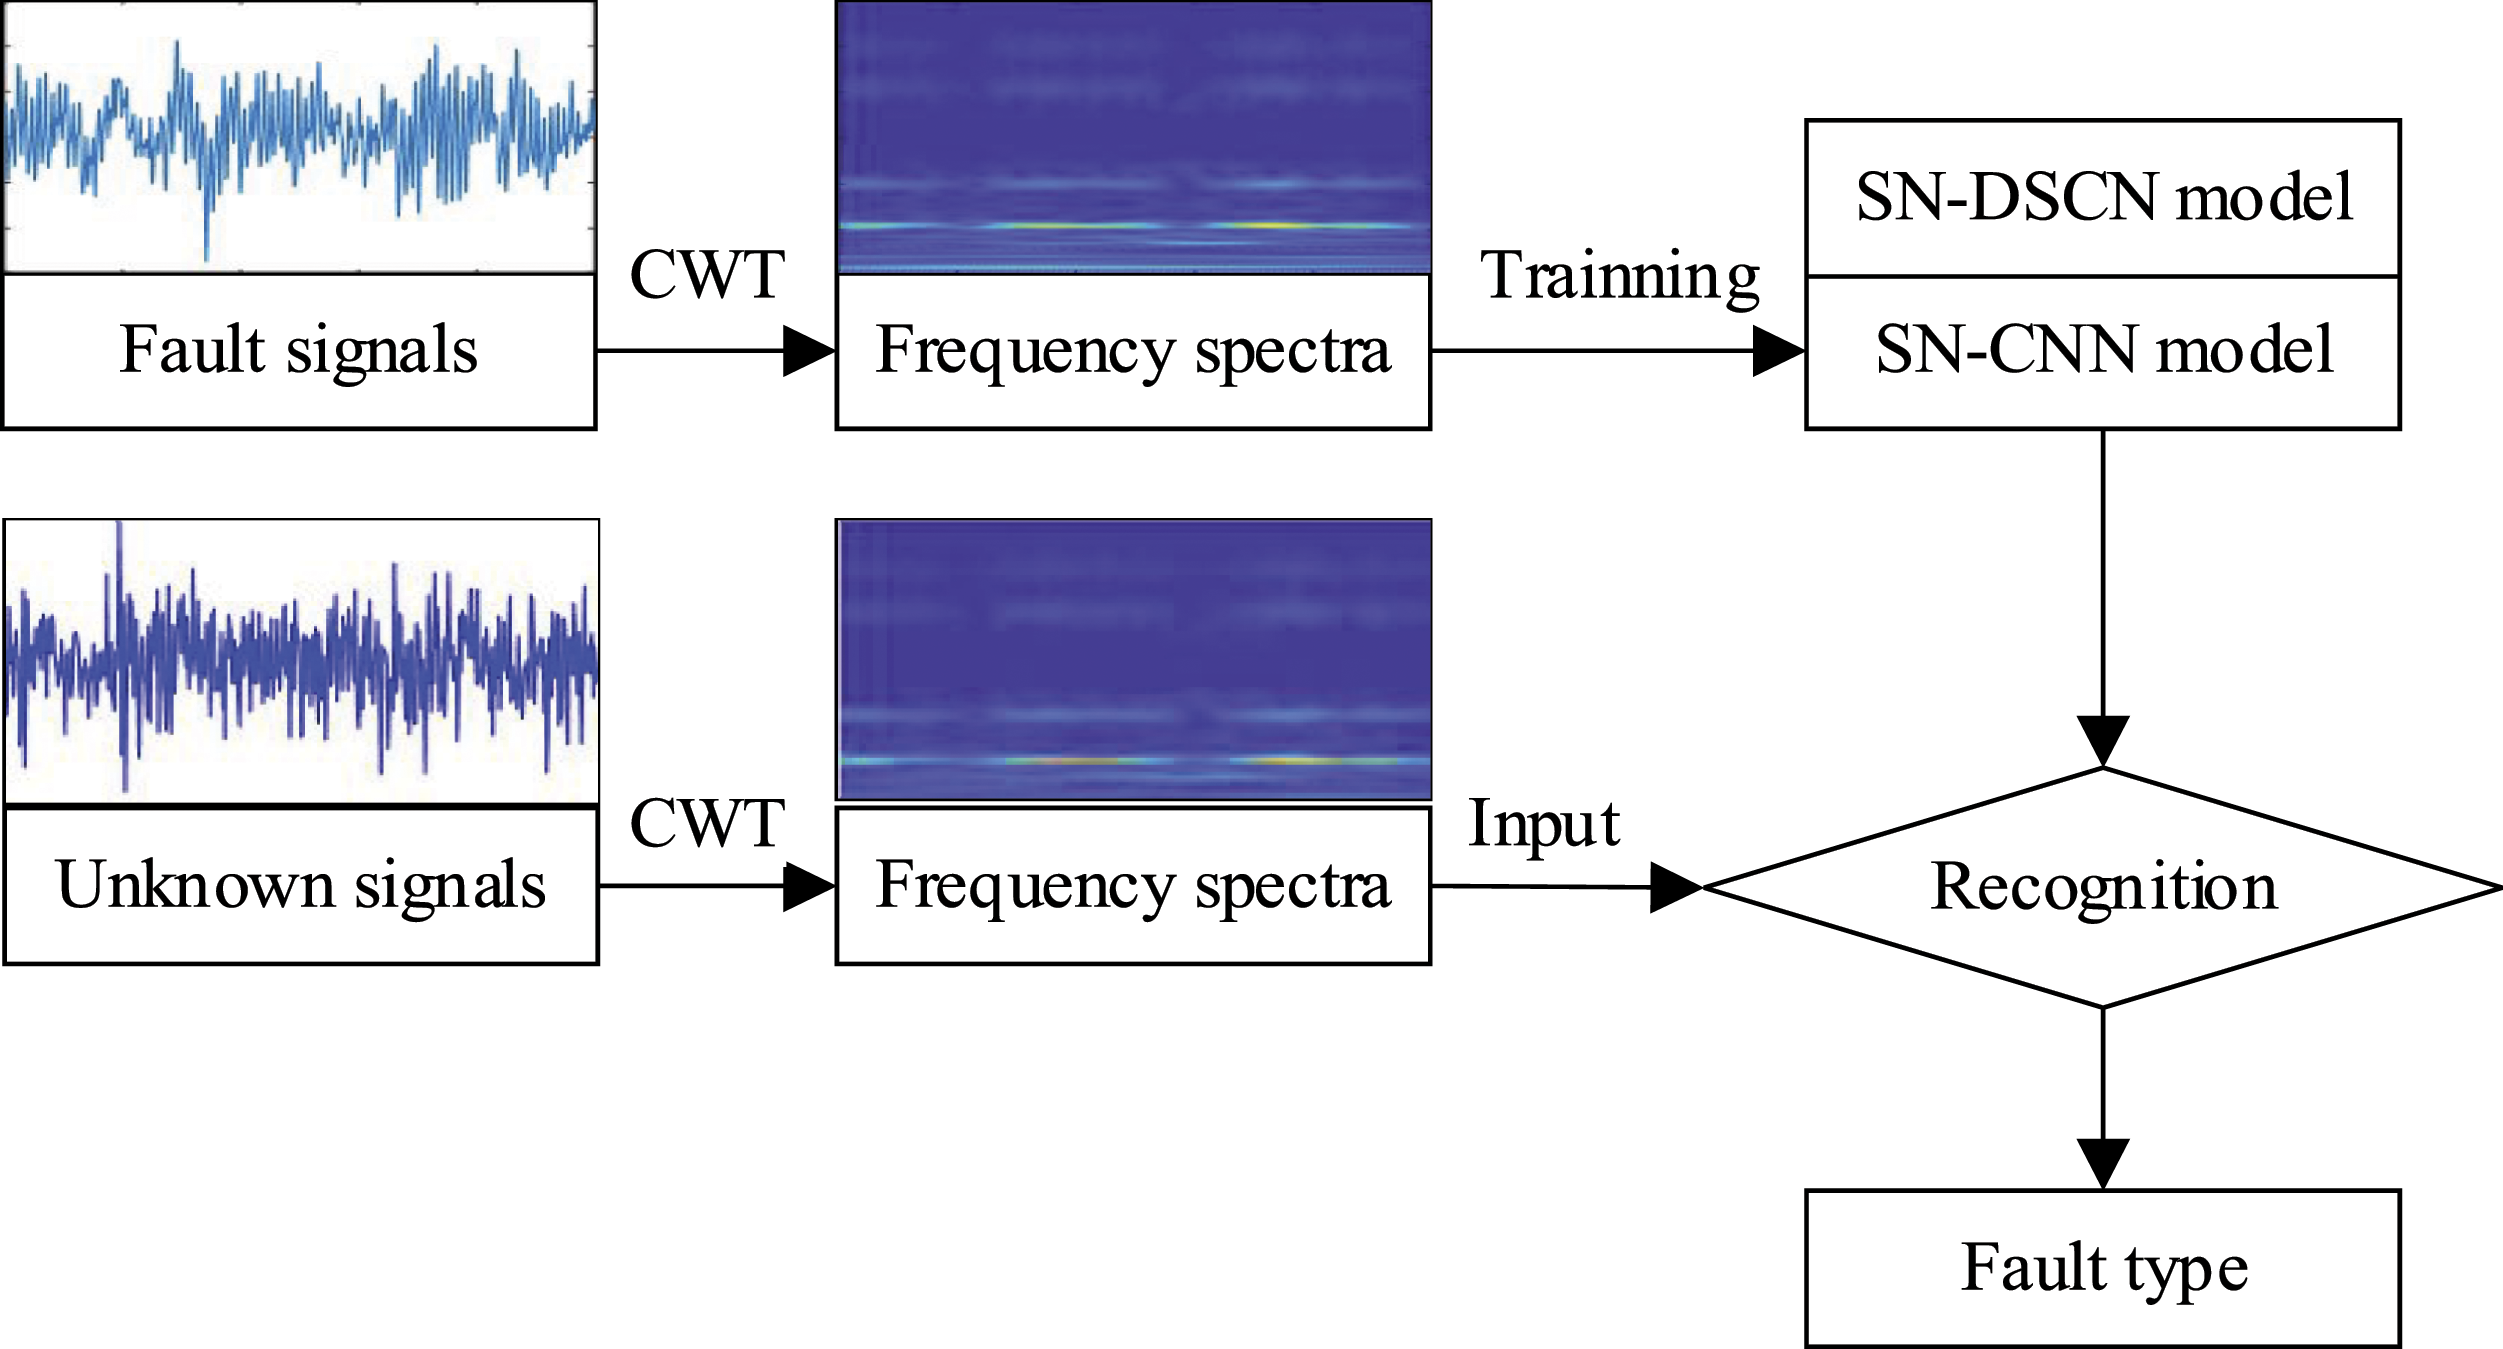
Experiment
In order to verify the effectiveness of SN-DSCN and SN-CNN model proposed in this paper, fault samples from the Bearing Data Center of Case Western Reserve University are used here. Then the fault bearing samples from a printing unit are used to reflect the effect in working.
Bearing Data Center
The experimental equipment is shown in Figure 9. A motor is on the left side, the right side is a dynamometer, and a torque transducer is between them. Motor bearings were seeded with faults using electro-discharge machining. Fault bearings of SKF6205 were reloaded into the test motor, and the vibration signals were recorded with a sampling frequency of 12 Hz. Both normal bearings and fault bearings were taken, three kinds of faults were studied with varying degrees, 0.178 mm, 0.356 mm, 0.533 mm, and 0.711 mm (outer race without 0.711 mm). The damage in outer raceway, inner raceway and rolling element are all considered in experiment. The experimental equipment.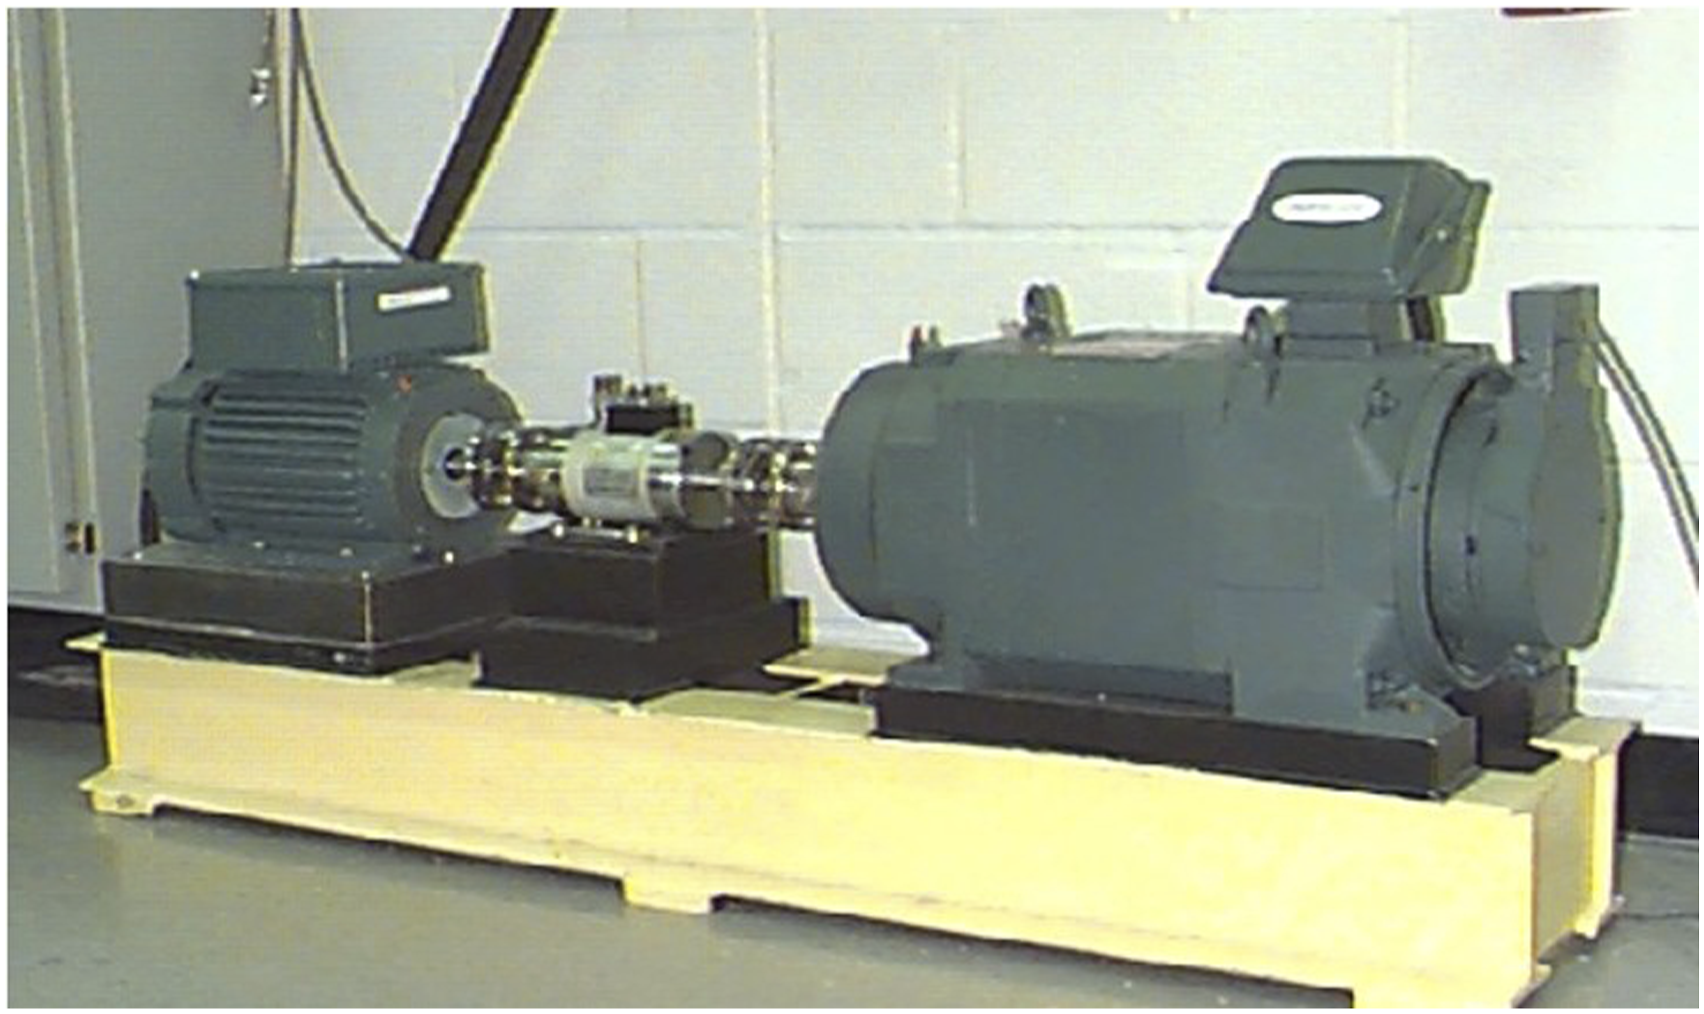
Bearing failures under noisy environment
As to bearing data, it is obtained under an environment relatively ideal. In order to simulate a complex industrial environment for fault diagnosis, Gaussian white noise is added into data manually since it is near to the real noise. The bearing data under 0 horse power of motor is selected to add Gaussian white noise with different signal-to-noise ratio (SNR).
Comparison between samples from original signal and modified signal with Gaussian white noise of 2 dB are shown in Figure 10, and the signal of inner raceway is chosen here as an example. It is more confused in noisy signals, since the amplitudes are less obvious than original one. The added noise is also converted into image together with vibration signal and it is a disadvantageous factor for models. Noise with different degrees were combined, including −4 dB, −2 dB, 2 dB, 4 dB, 6 dB, 8 dB, and 10 dB. Comparison between inner and noise.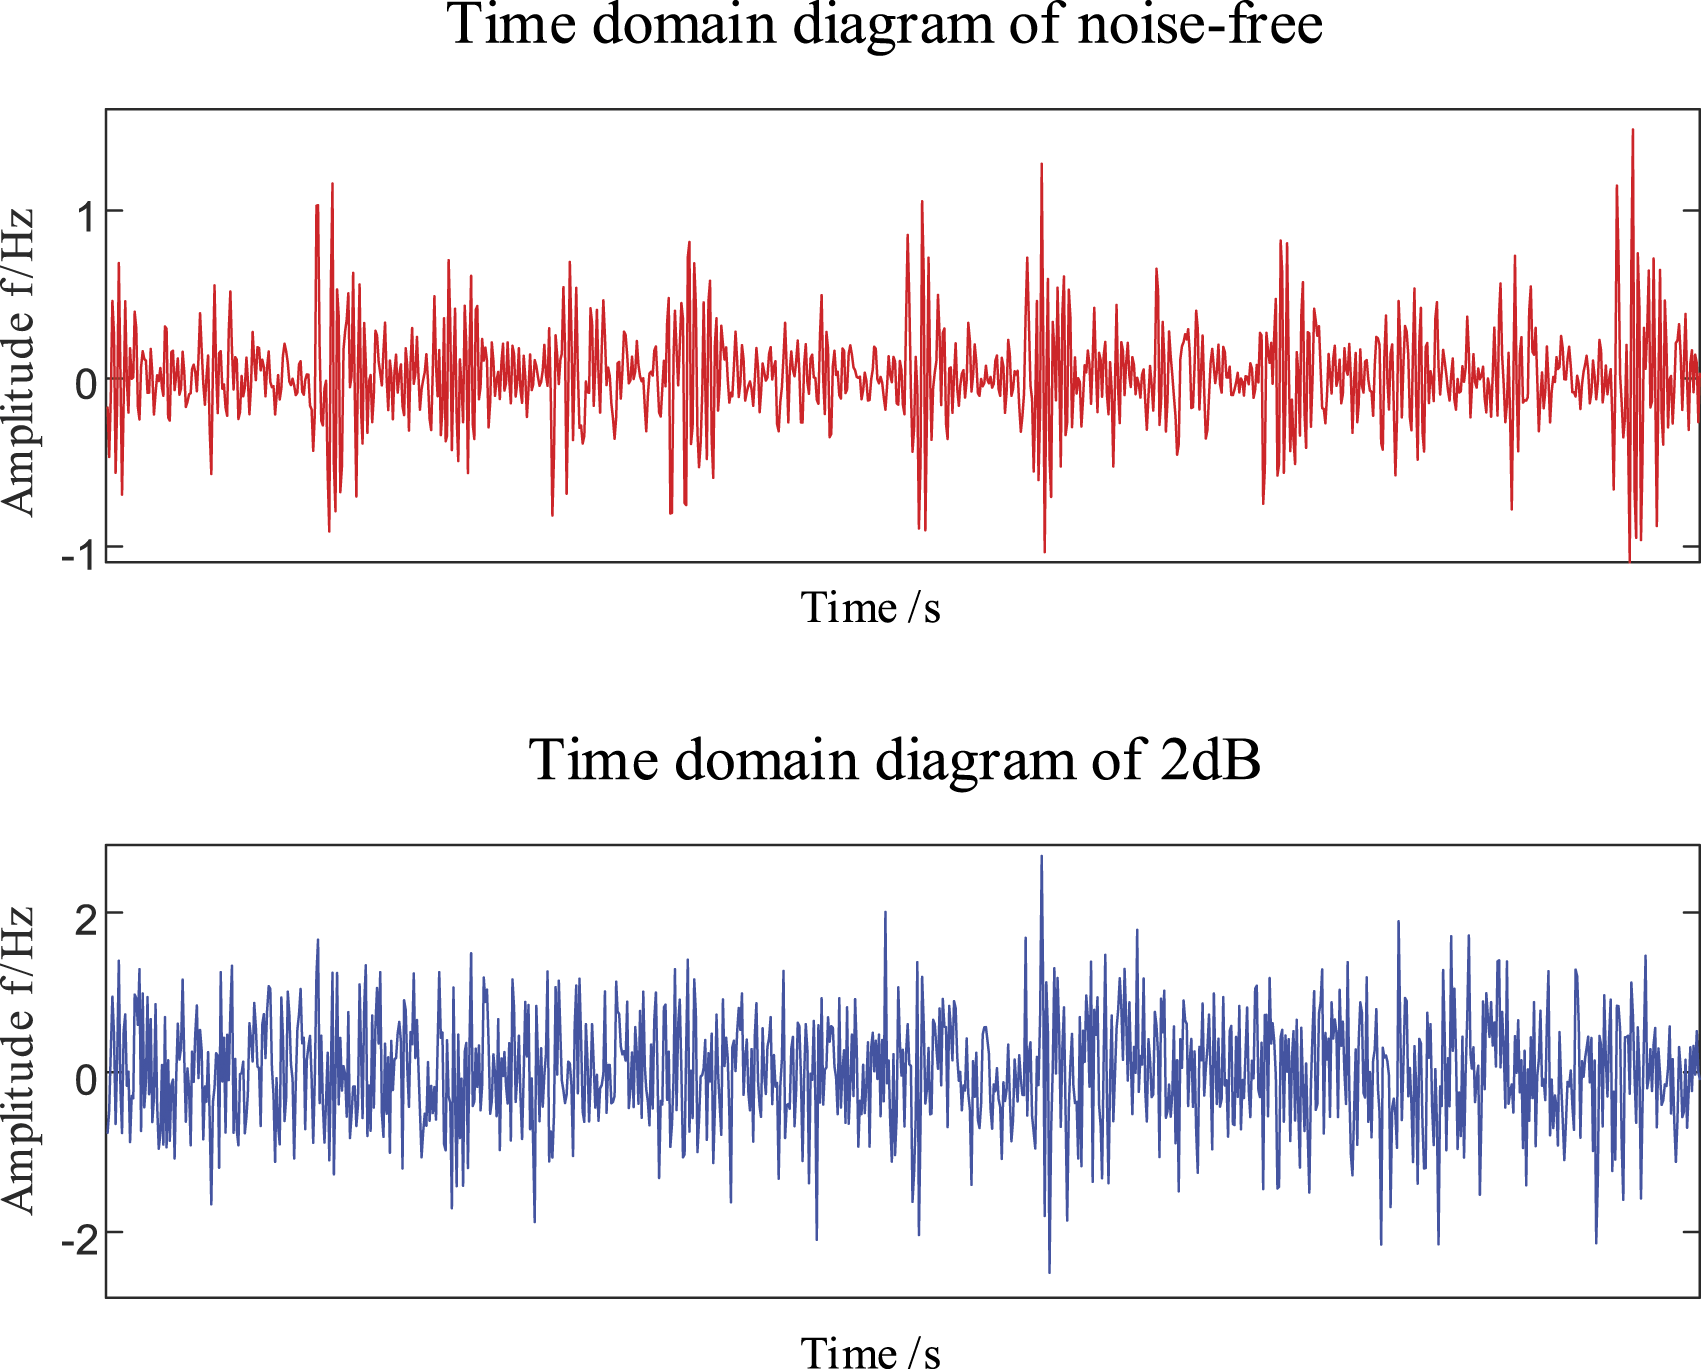
As to each kind of SNR, 12 groups of samples were used, normal state and three kinds of faults samples, contained faults of outer raceway, inner raceway and rolling element with various degree (0.178 mm, 0.356 mm, 0.533 mm, and 0.711 mm, outer race without 0.711 mm), were considered. It should be pointed out that there are only 23 samples for each group and the whole number of samples for each SNR is 276, and they are divided into 207 samples for training and 69 pairs of samples for verifying. This number of samples is relatively small for diagnosis and hard to training a model such a CNN model, still the fault diagnosis can be realized based on SN.
In this part, the number of iterations is set to 20, and the batch size is set to 32. From Figure 11 it can be seen that the accuracy reaches to a high level over 99.5% when the number of iterations is over 20, and the improvement with a bigger value is not obvious here, thus it is set to 20. Batch size is also a key parameter in model training, and an ideal selection is to find a balance between efficiency and capacity in memory. If the batch size is too small, the training data will be difficult to converge and lead to an under fitting. The processing speed will be faster with a bigger value, but the required memory capacity will also increase quickly and the result is more like to get into a local optimum. Besides, GPU plays a better performance with a 2
n
value of batch size such as 16, 32, 64, and so on. Considering the time consumption and compute power of the workstation, batch size in this paper is set as 32 at last.31,32 The relationship between accuracy and iteration without added noise.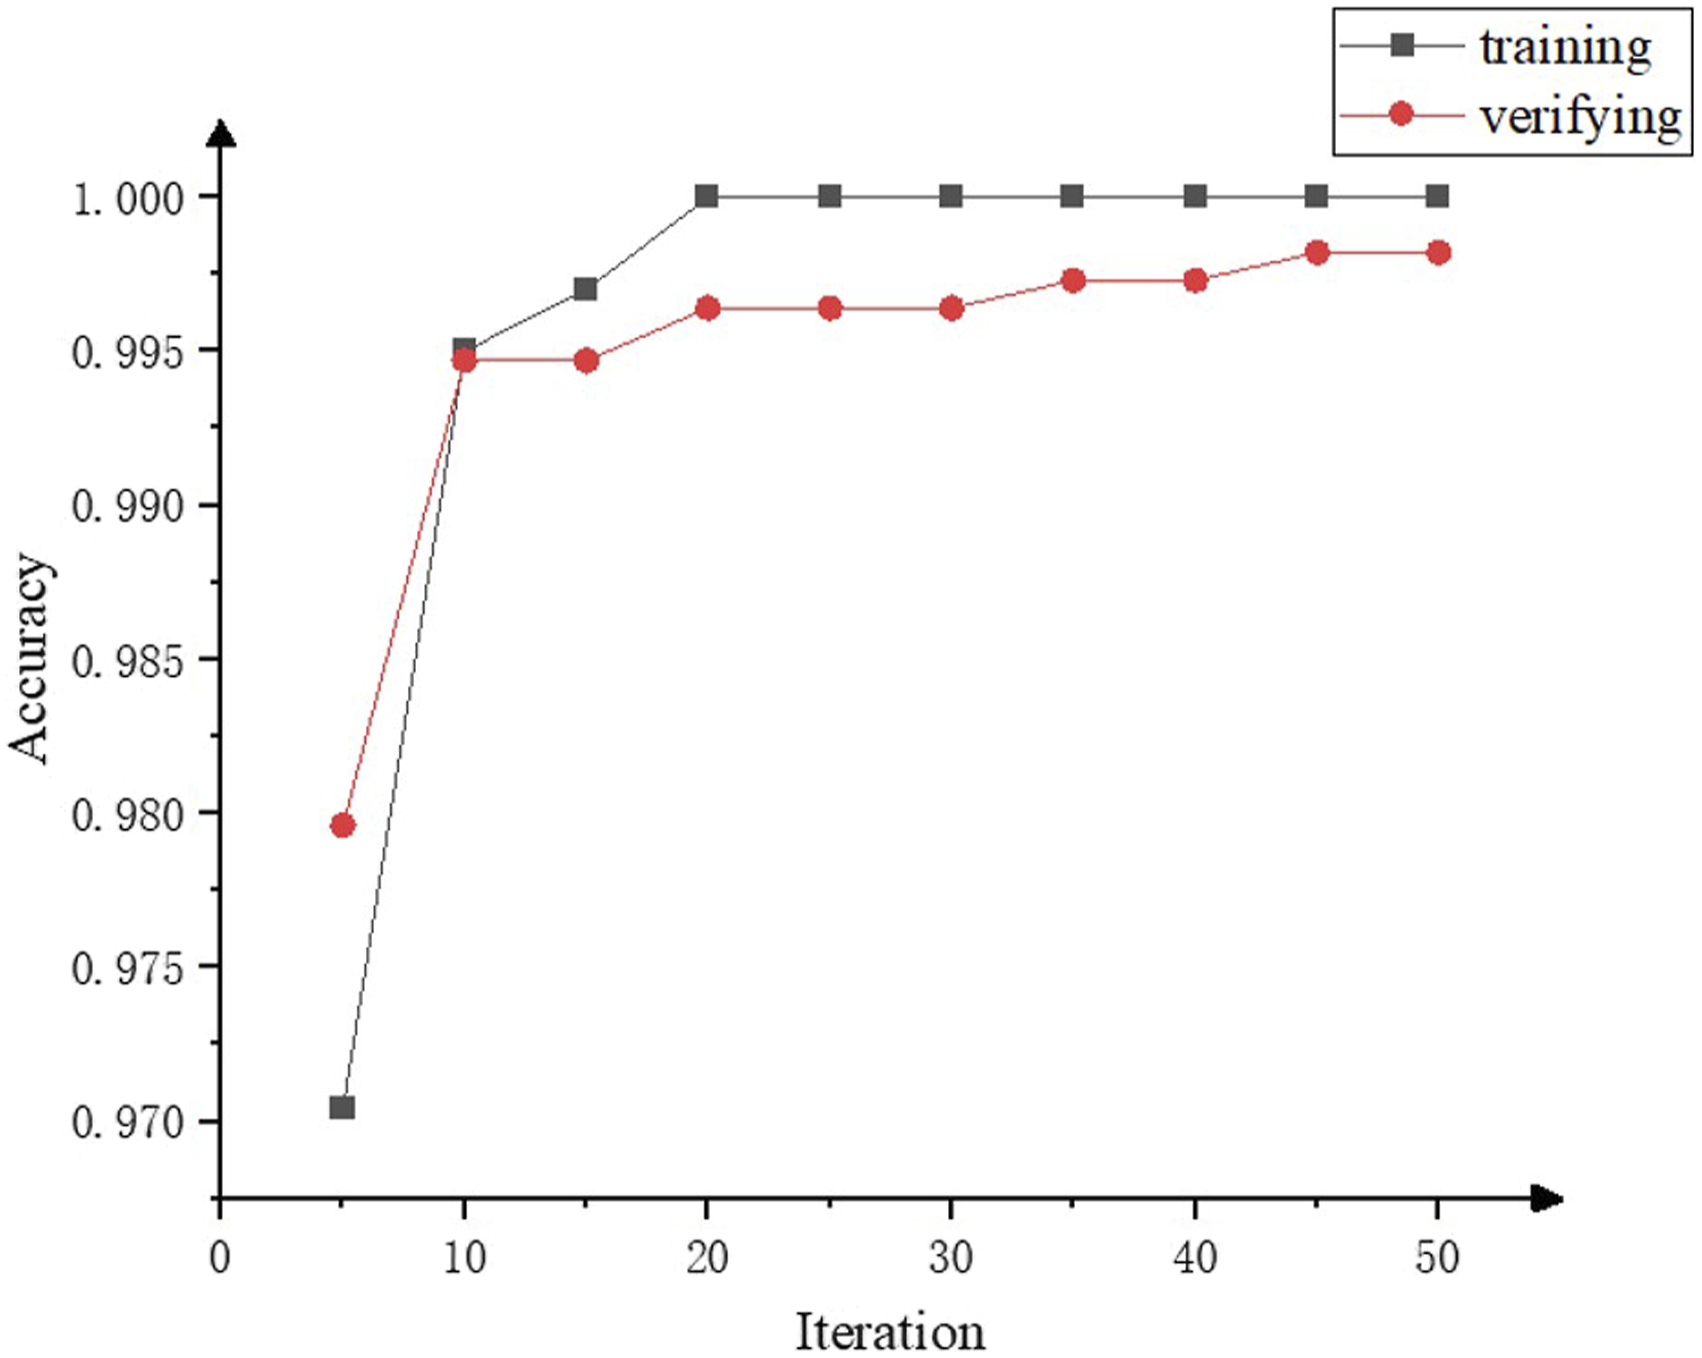
With trained model, 480 samples were taken to realize a fault diagnosis and they are independently from training and verifying data. To make a more specific analysis about diagnosis results, the confusion matrix is used to evaluate the performance in proposed model.33,34 The confusion matrix can reflect the total result between real class in fact and predicted class in model testing. Matrix with a max SNR of 10 dB was chosen here and shown in Figure 12, which the most difficult condition in Table 1, values in row mean the true labels and values in column mean predicted labels. Confusion matrixes under different SNR. (a) SN-CNN (b) SN-DSCN. Diagnosis results of different SNR.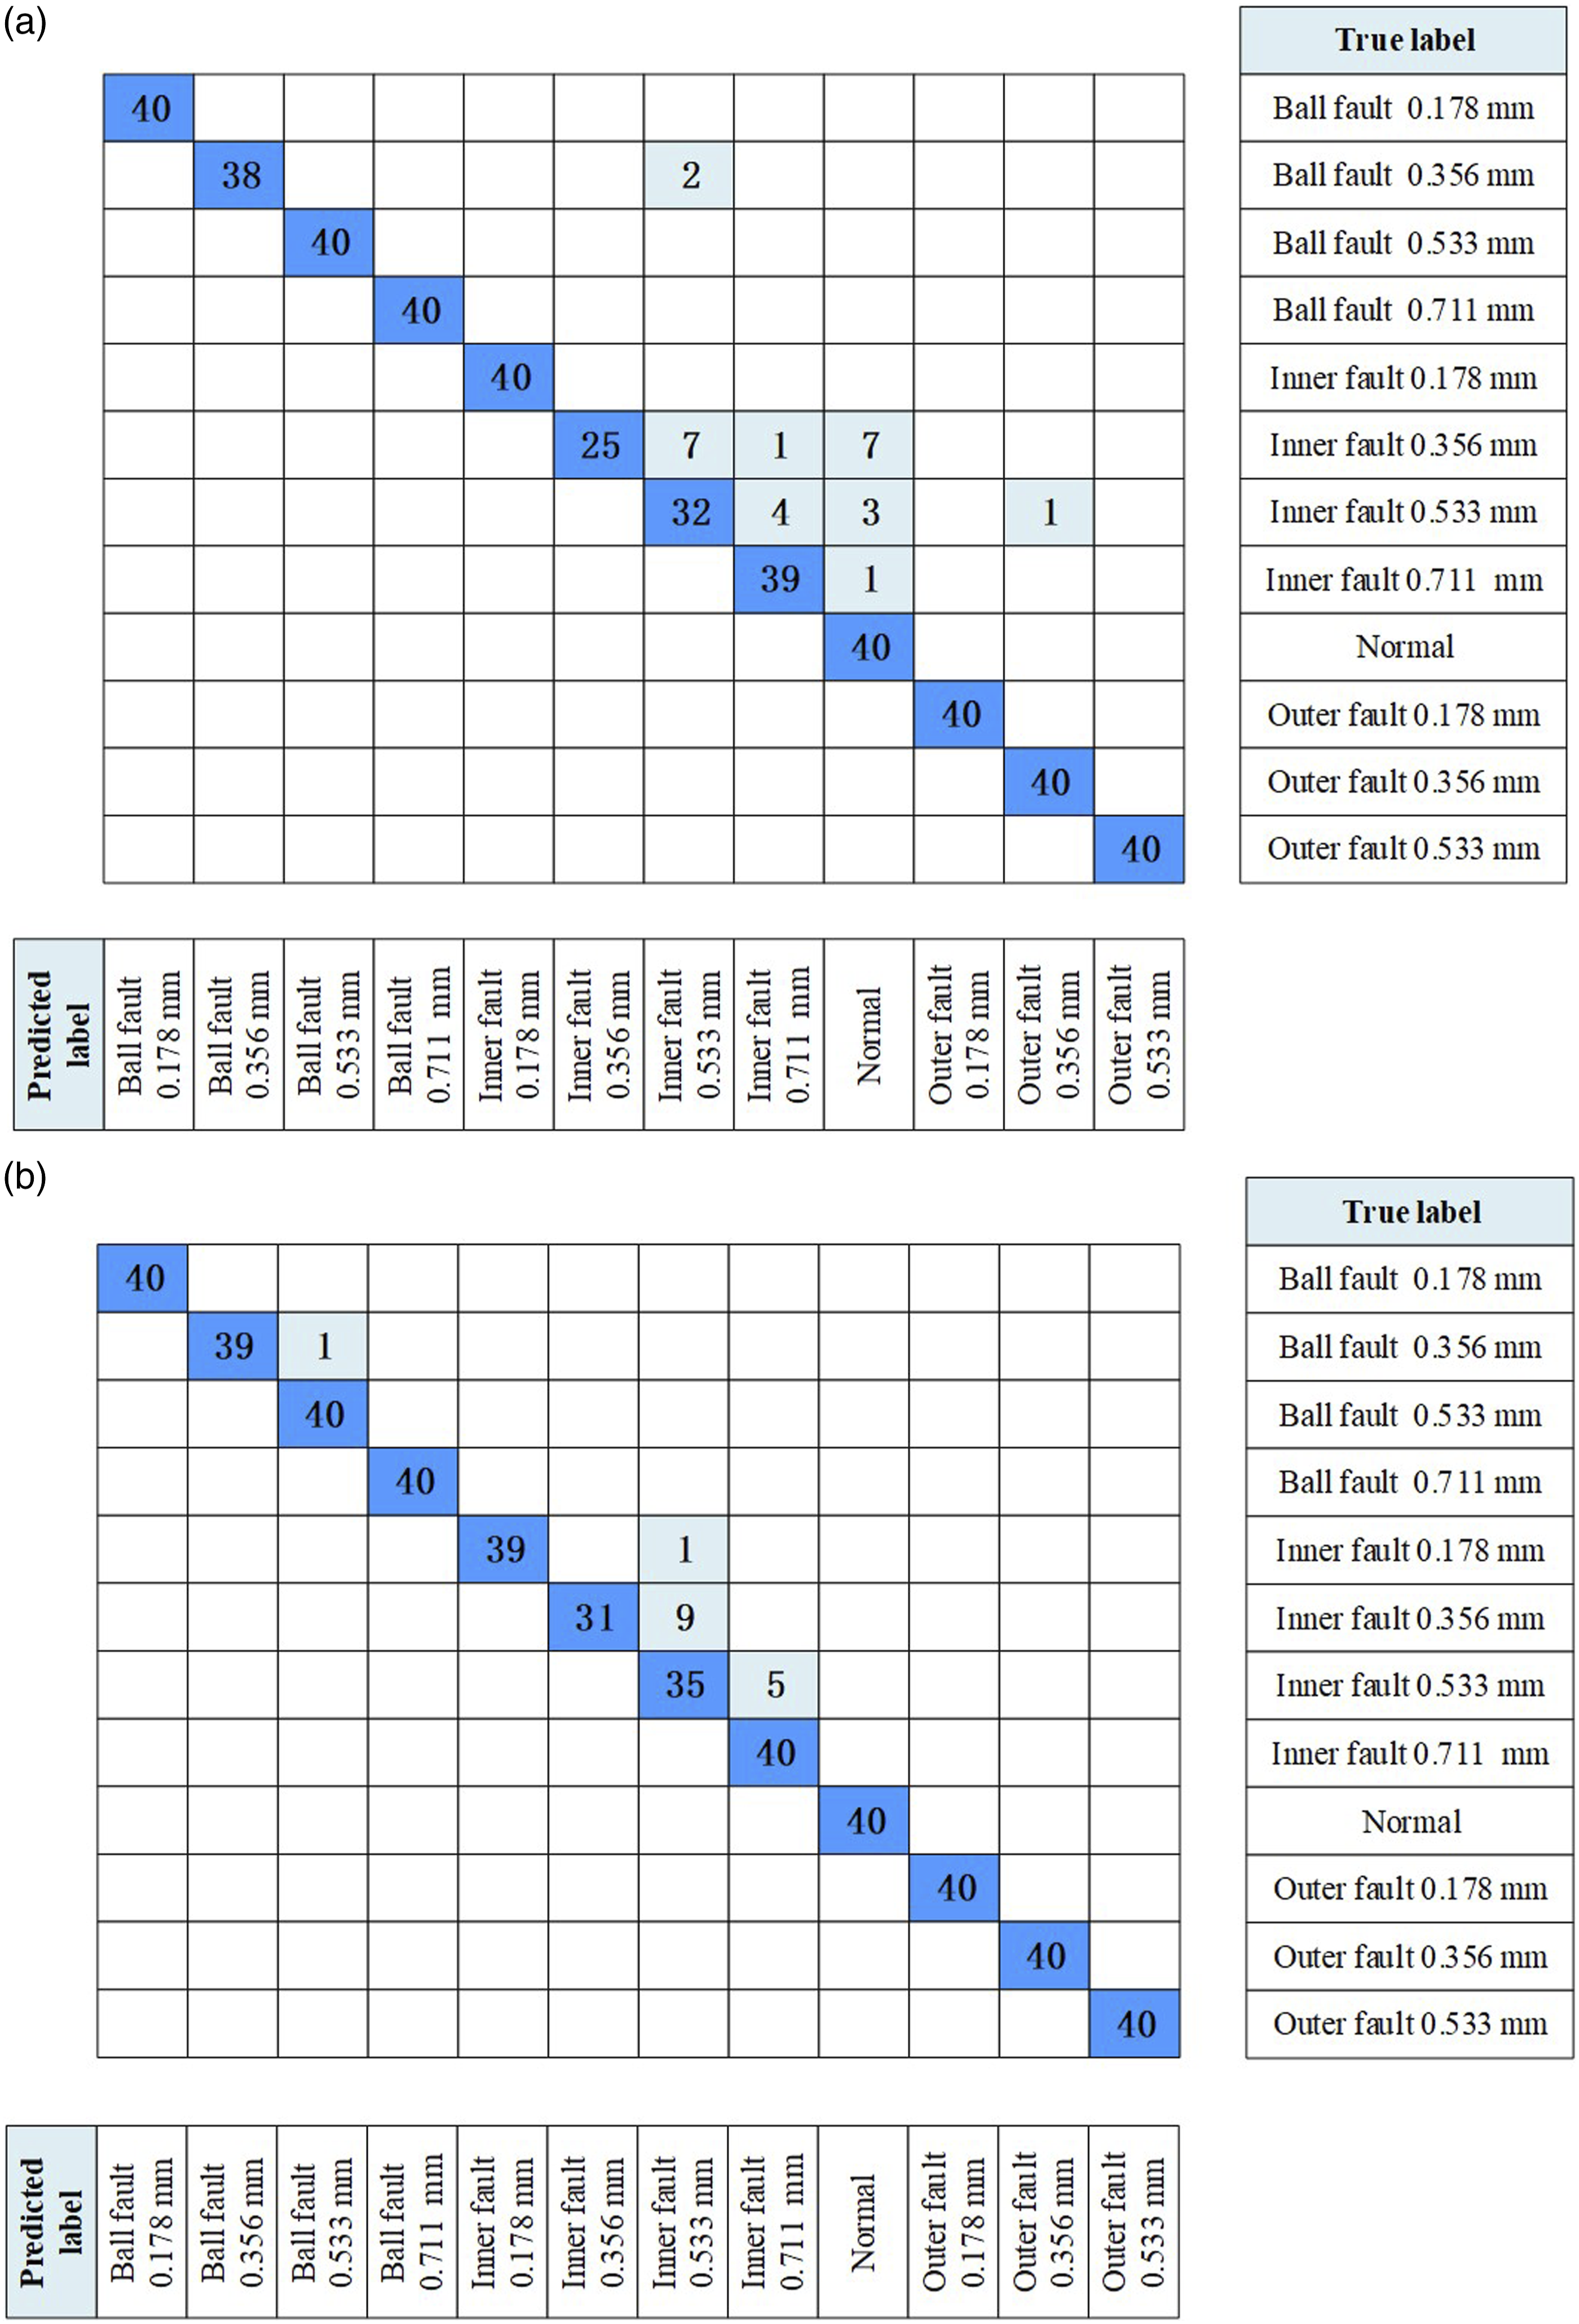
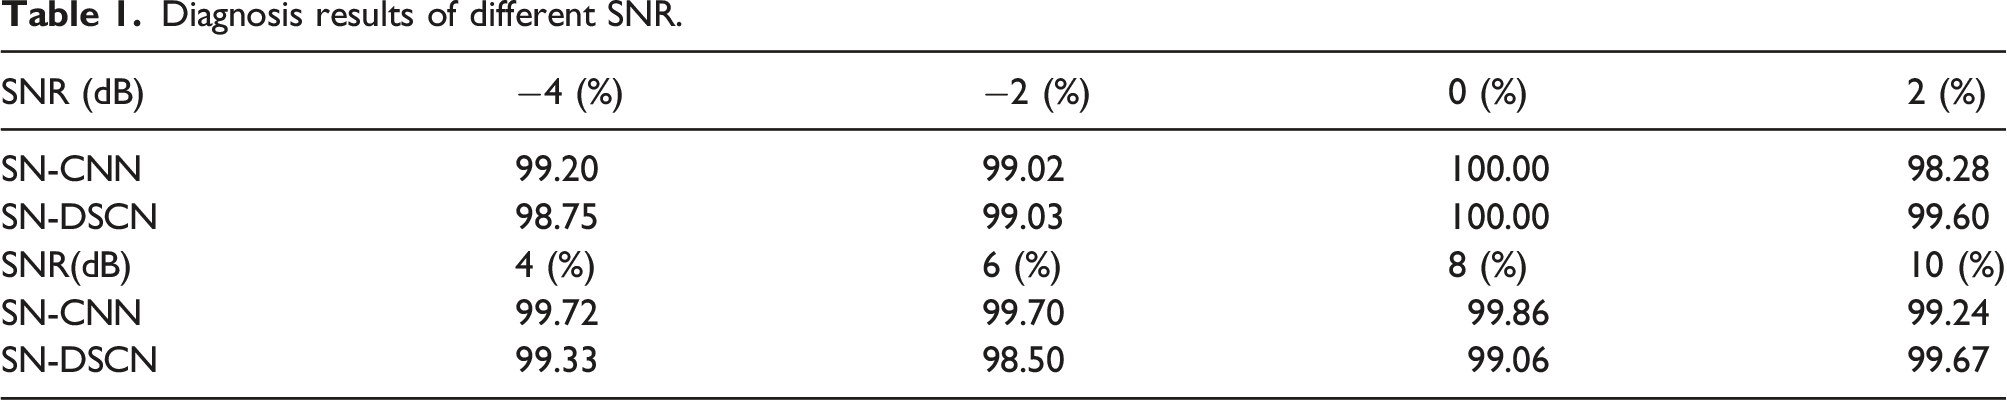
In both SN-CNN and SN-DSCN, most of samples are on the diagonal which represent a correct result in diagnosis. SN-DSCN model in Figure 12(b) make a better result with an accuracy of 96.67% and a precision of 97.02%, which are 94.58% and 95.22% in the SN-CNN model, respectively. From confusion matrixes, samples with different degrees of inner faults are difficult to recognize, however inner fault can still be distinguished from other faults.
Bearing failure under variable speed
Diagnosis results under different rotational speeds.
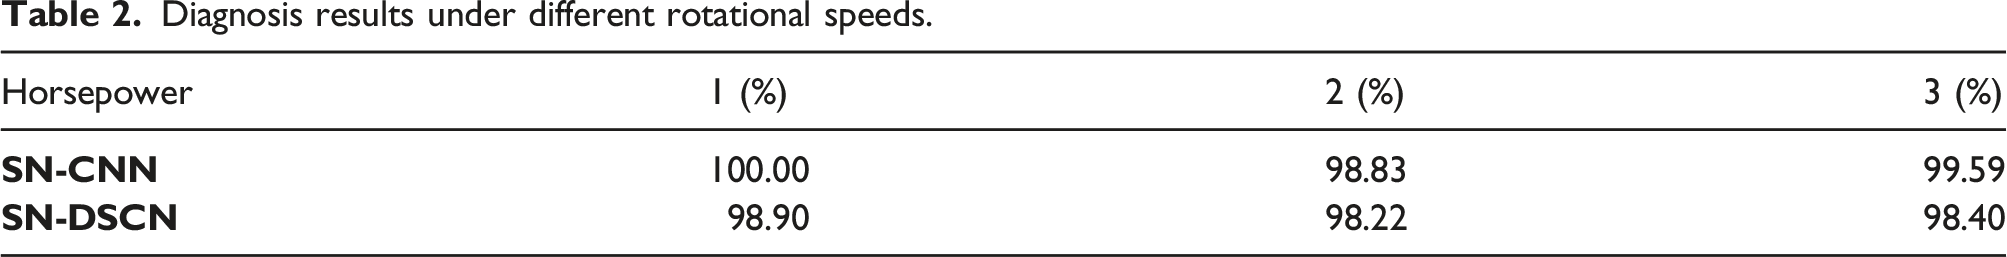
It can be seen that the accuracy of the SN-CNN is higher than SN-DSCN, but the accuracy in SN-DSCN model is still generally above 98%, which basically realizes the trade-off between speed and accuracy. In total, both them can be proved to be effective with a high accuracy.
Fault diagnosis in offset printing units
Experiment description
Two groups of experiments were finished in two kinds of R2R units from Offset Printing machines (GUANGHUA 605, made in China). The faults were also introduced by an electro-discharge machining. As to the first group of data, NSK 6001Z rolling bearings were mounted on both ends of ink rollers. The bearing fault in a printing press is normally easy to be damaged since the printing process involves a large number of chemical solvents such as ink, alcohol, embossing liquid. The printing pressure also shortens the service life during the contact between rollers. 35
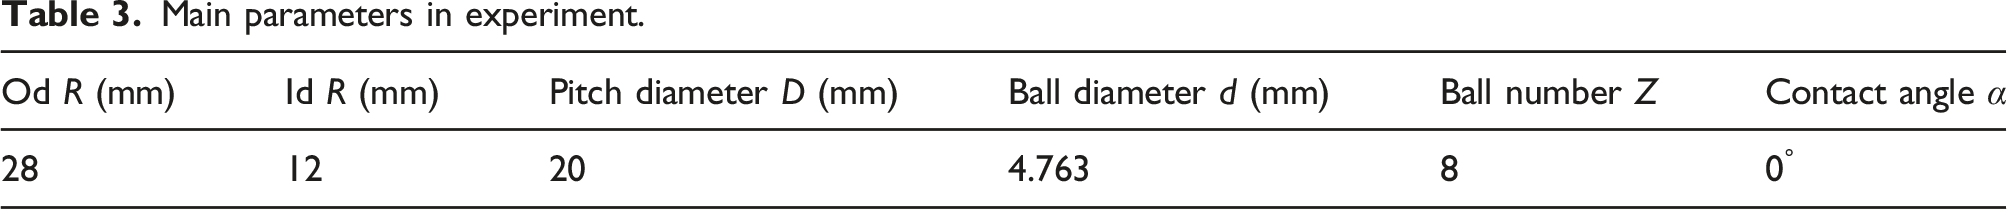
The testing system of offset printing is shown as Figure 13, a mobile workstation, a data acquisition device and acceleration sensors were used to obtain vibration signals. The speeds of bearings were 4 rad/s and the sampling frequency was 3200 Hz. Main parameters selected for this experiment are recorded in Table 3. Three fault sizes were chosen, 0.1 mm, 0.3 mm, and 0.5 mm, on inner raceway and outer raceway of bearings. Adding normal sample, there are all 7 groups of samples. The testing system of offset printing. Main parameters in experiment.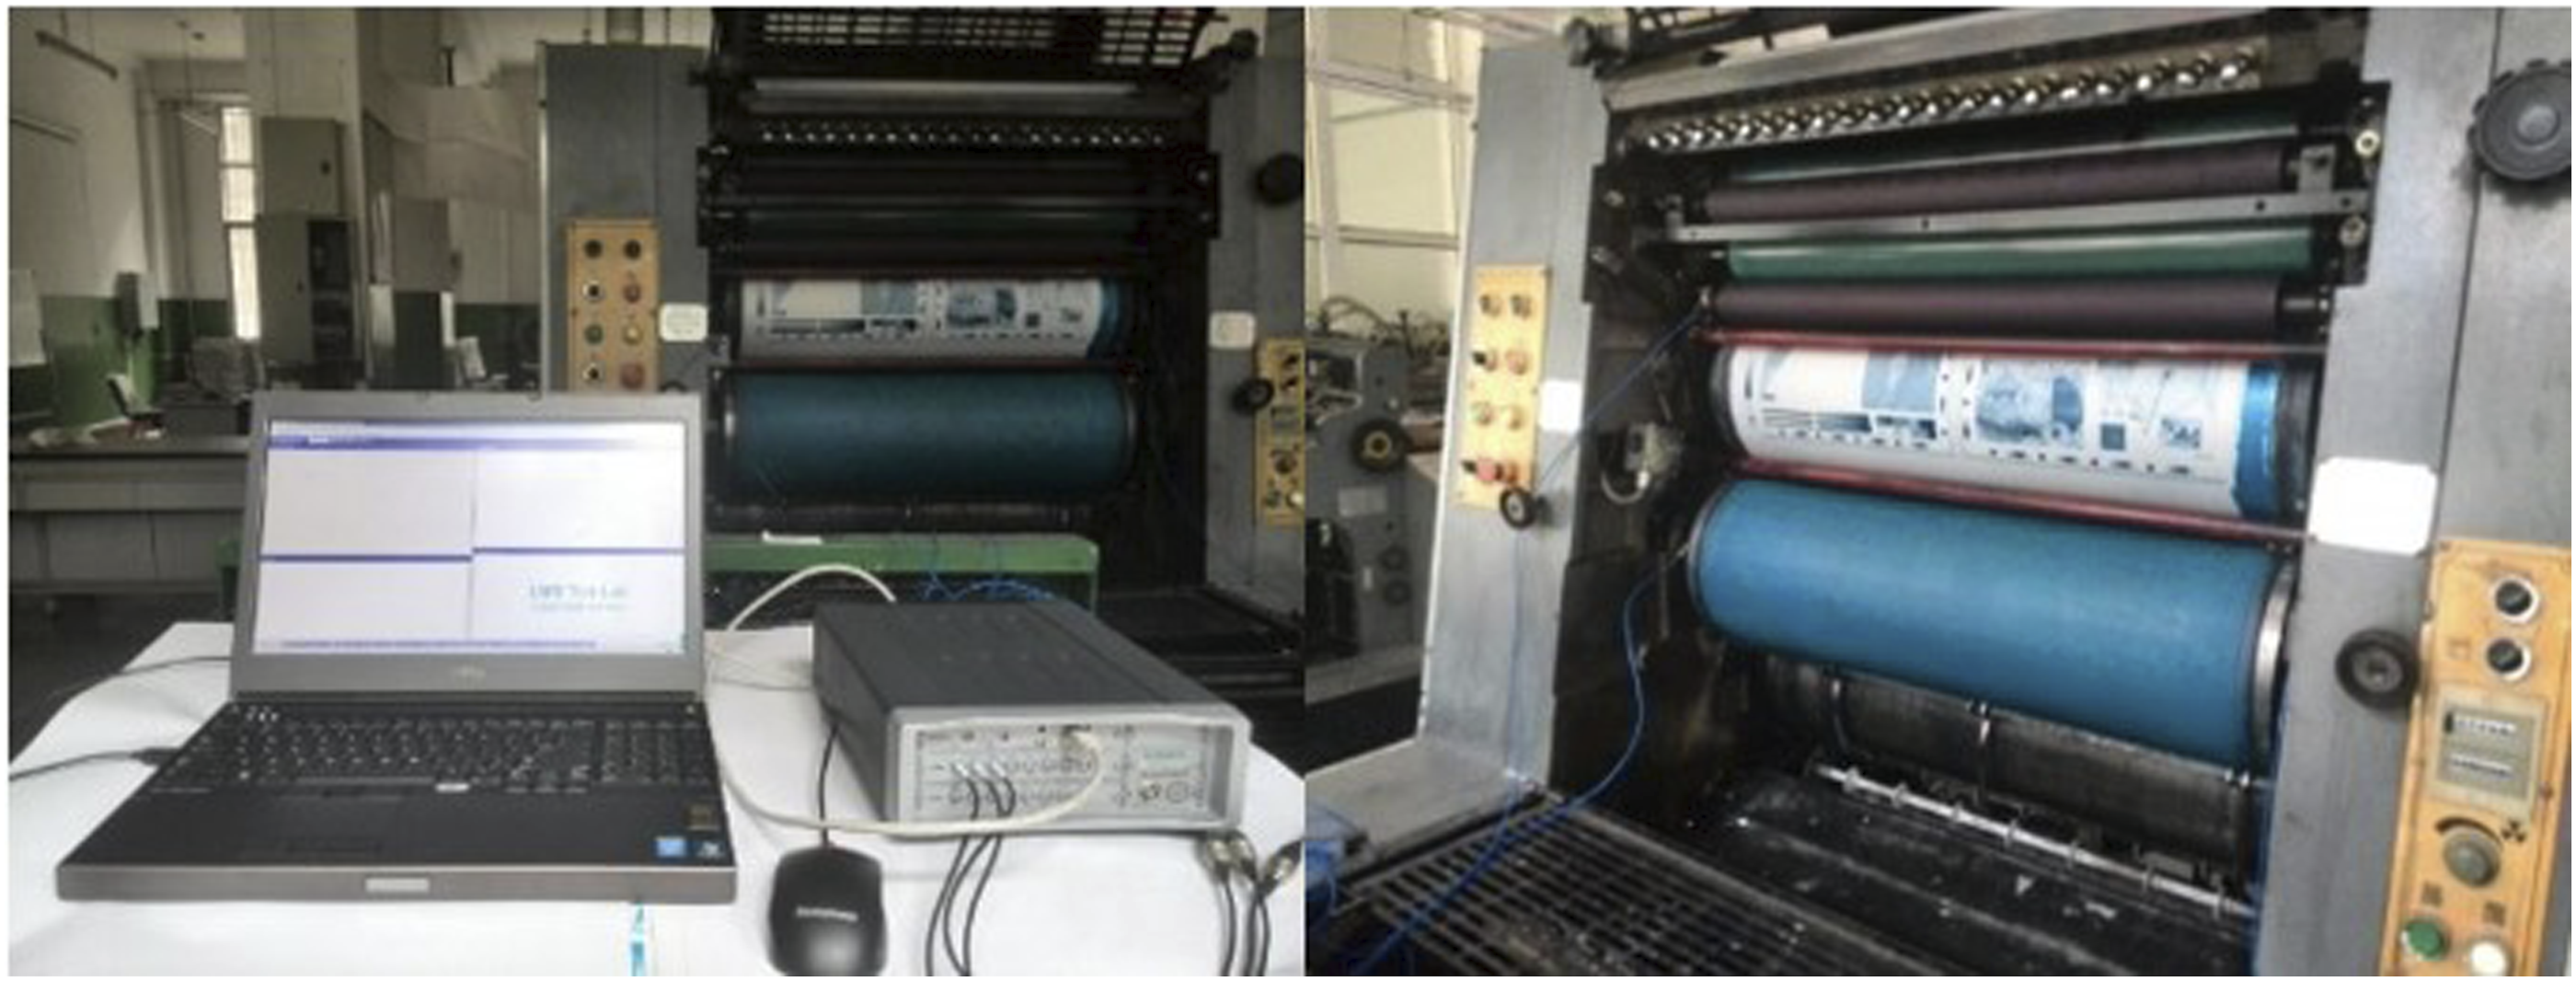
Fault diagnosis in this work belongs to few-shot learning, which is suitable for network training in the form of a full data set. The direction determined by the full data set can represent the population more well, and the gradient is easier to move to the direction of the extreme value.
In the training process, the learning rate is sometimes automatically modified along with the training process to speed up. 20 samples from each group of samples to form a positive sample pair and a negative sample pair. In order to have a better result, Adam, Adamax, RMSprop, and Nadam optimizer algorithms are taken and compared.
In Figure 14 the accuracy of training and verification based on all optimizers shows an overall increasing trend with the increasement of iterations. Among these algorithms, Nadam optimizer has a higher accuracy and it is chosen in following work. The mutation at 90 times with Nadam optimizer is obviously in Figure 14(b) since the Y-axis is enlarged in some degree. The value of mutation with Nadam is still near about 91%. The mutation is caused by a setting of learning rate and batch size. When the learning rate is too big, the fluctuation will be more obvious since the step in gradient descent is too large. The effect of batch size is hard to describe clearly and a smaller one always leads to a smoother result. Besides, similar mutation can be overcome with enough iteration times. The accuracy can still reach a high accuracy over 99% when the iteration time is enough. Influence of different optimizers on accuracy. (a) Accuracy in training data (b) Accuracy in verifying data.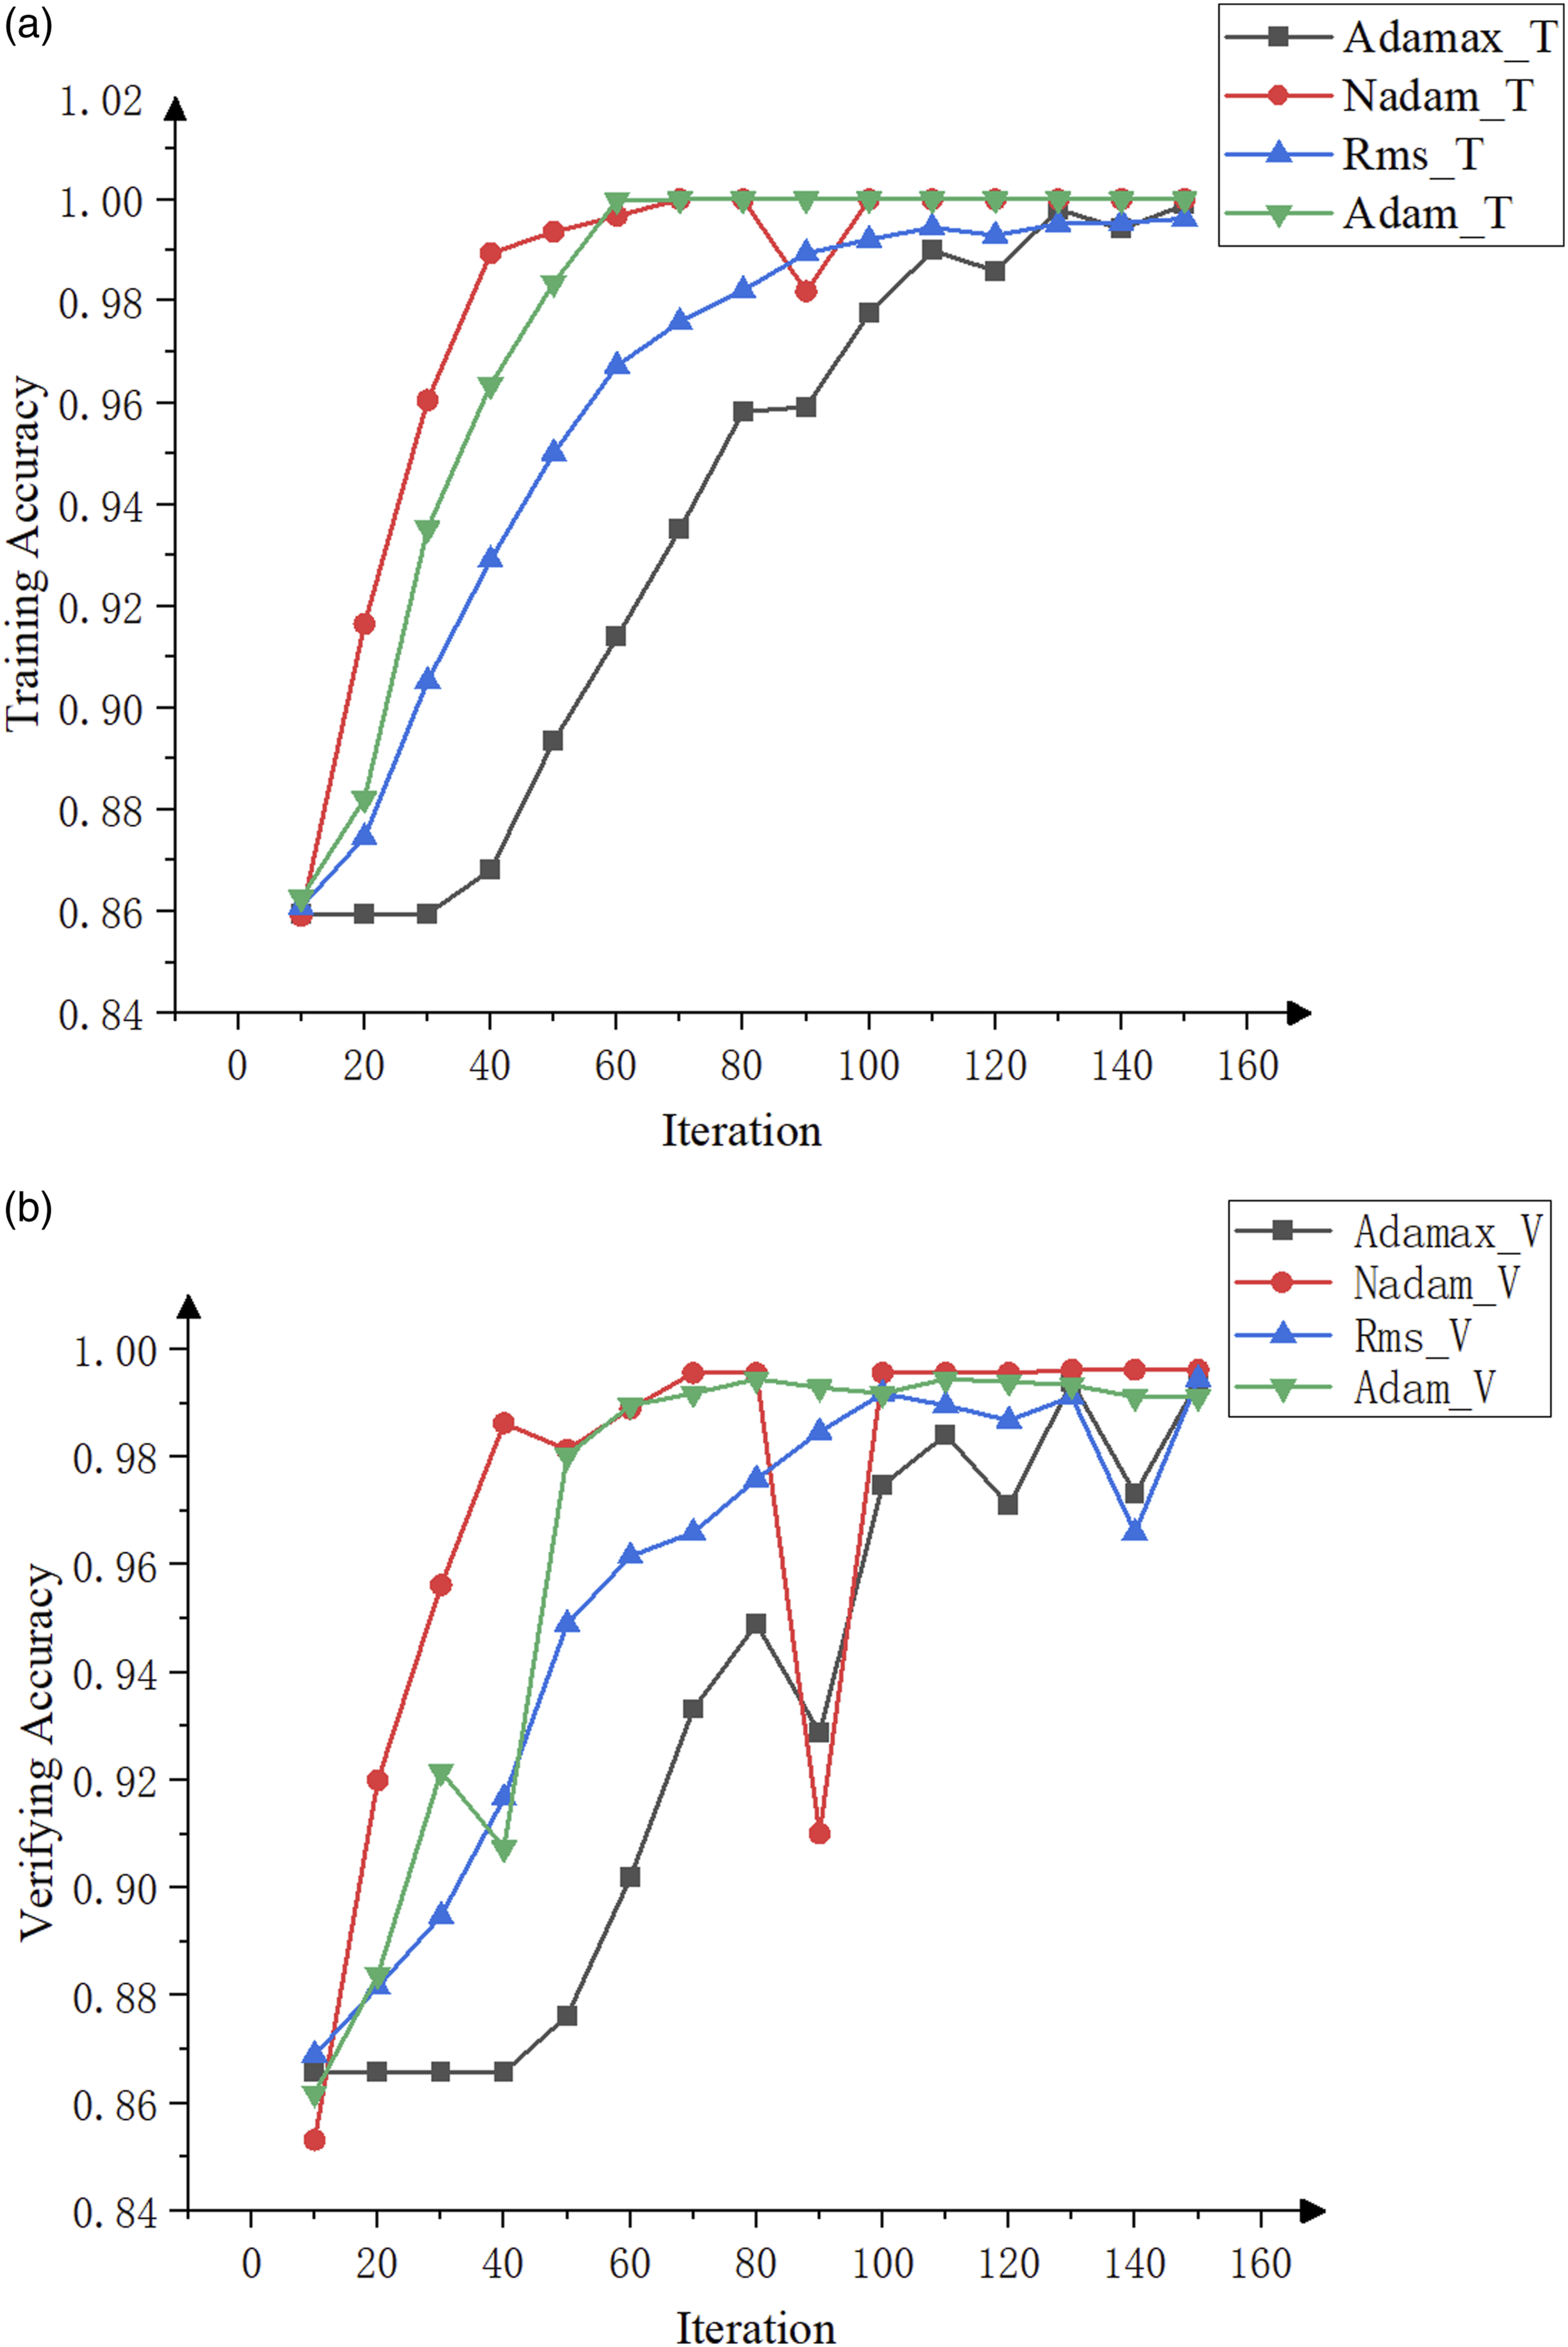
Result with different sample sizes
Besides realizing the fault diagnosis, the influence of sample size is also considered and four sets with different sizes are carried out in this paper. Both kinds of SN models were all used in this part.
The accuracy of bearing fault diagnosis under different sample sizes is shown in Figure 15. There are some obvious trends in Figure 15(a) and (b). First, it can be seen that the accuracy will increase rapidly with iteration times, and then they will keep in a high level of over 95% after 130 iteration times training. Meanwhile, both training and verifying accuracy get to a high value quickly and steadily with more samples such as 16 and 20 samples. When the size is 8 and 12, results fluctuate more frequently. Influence of different sample size on accuracy. (a) Accuracy of training data (b) Accuracy in verifying data.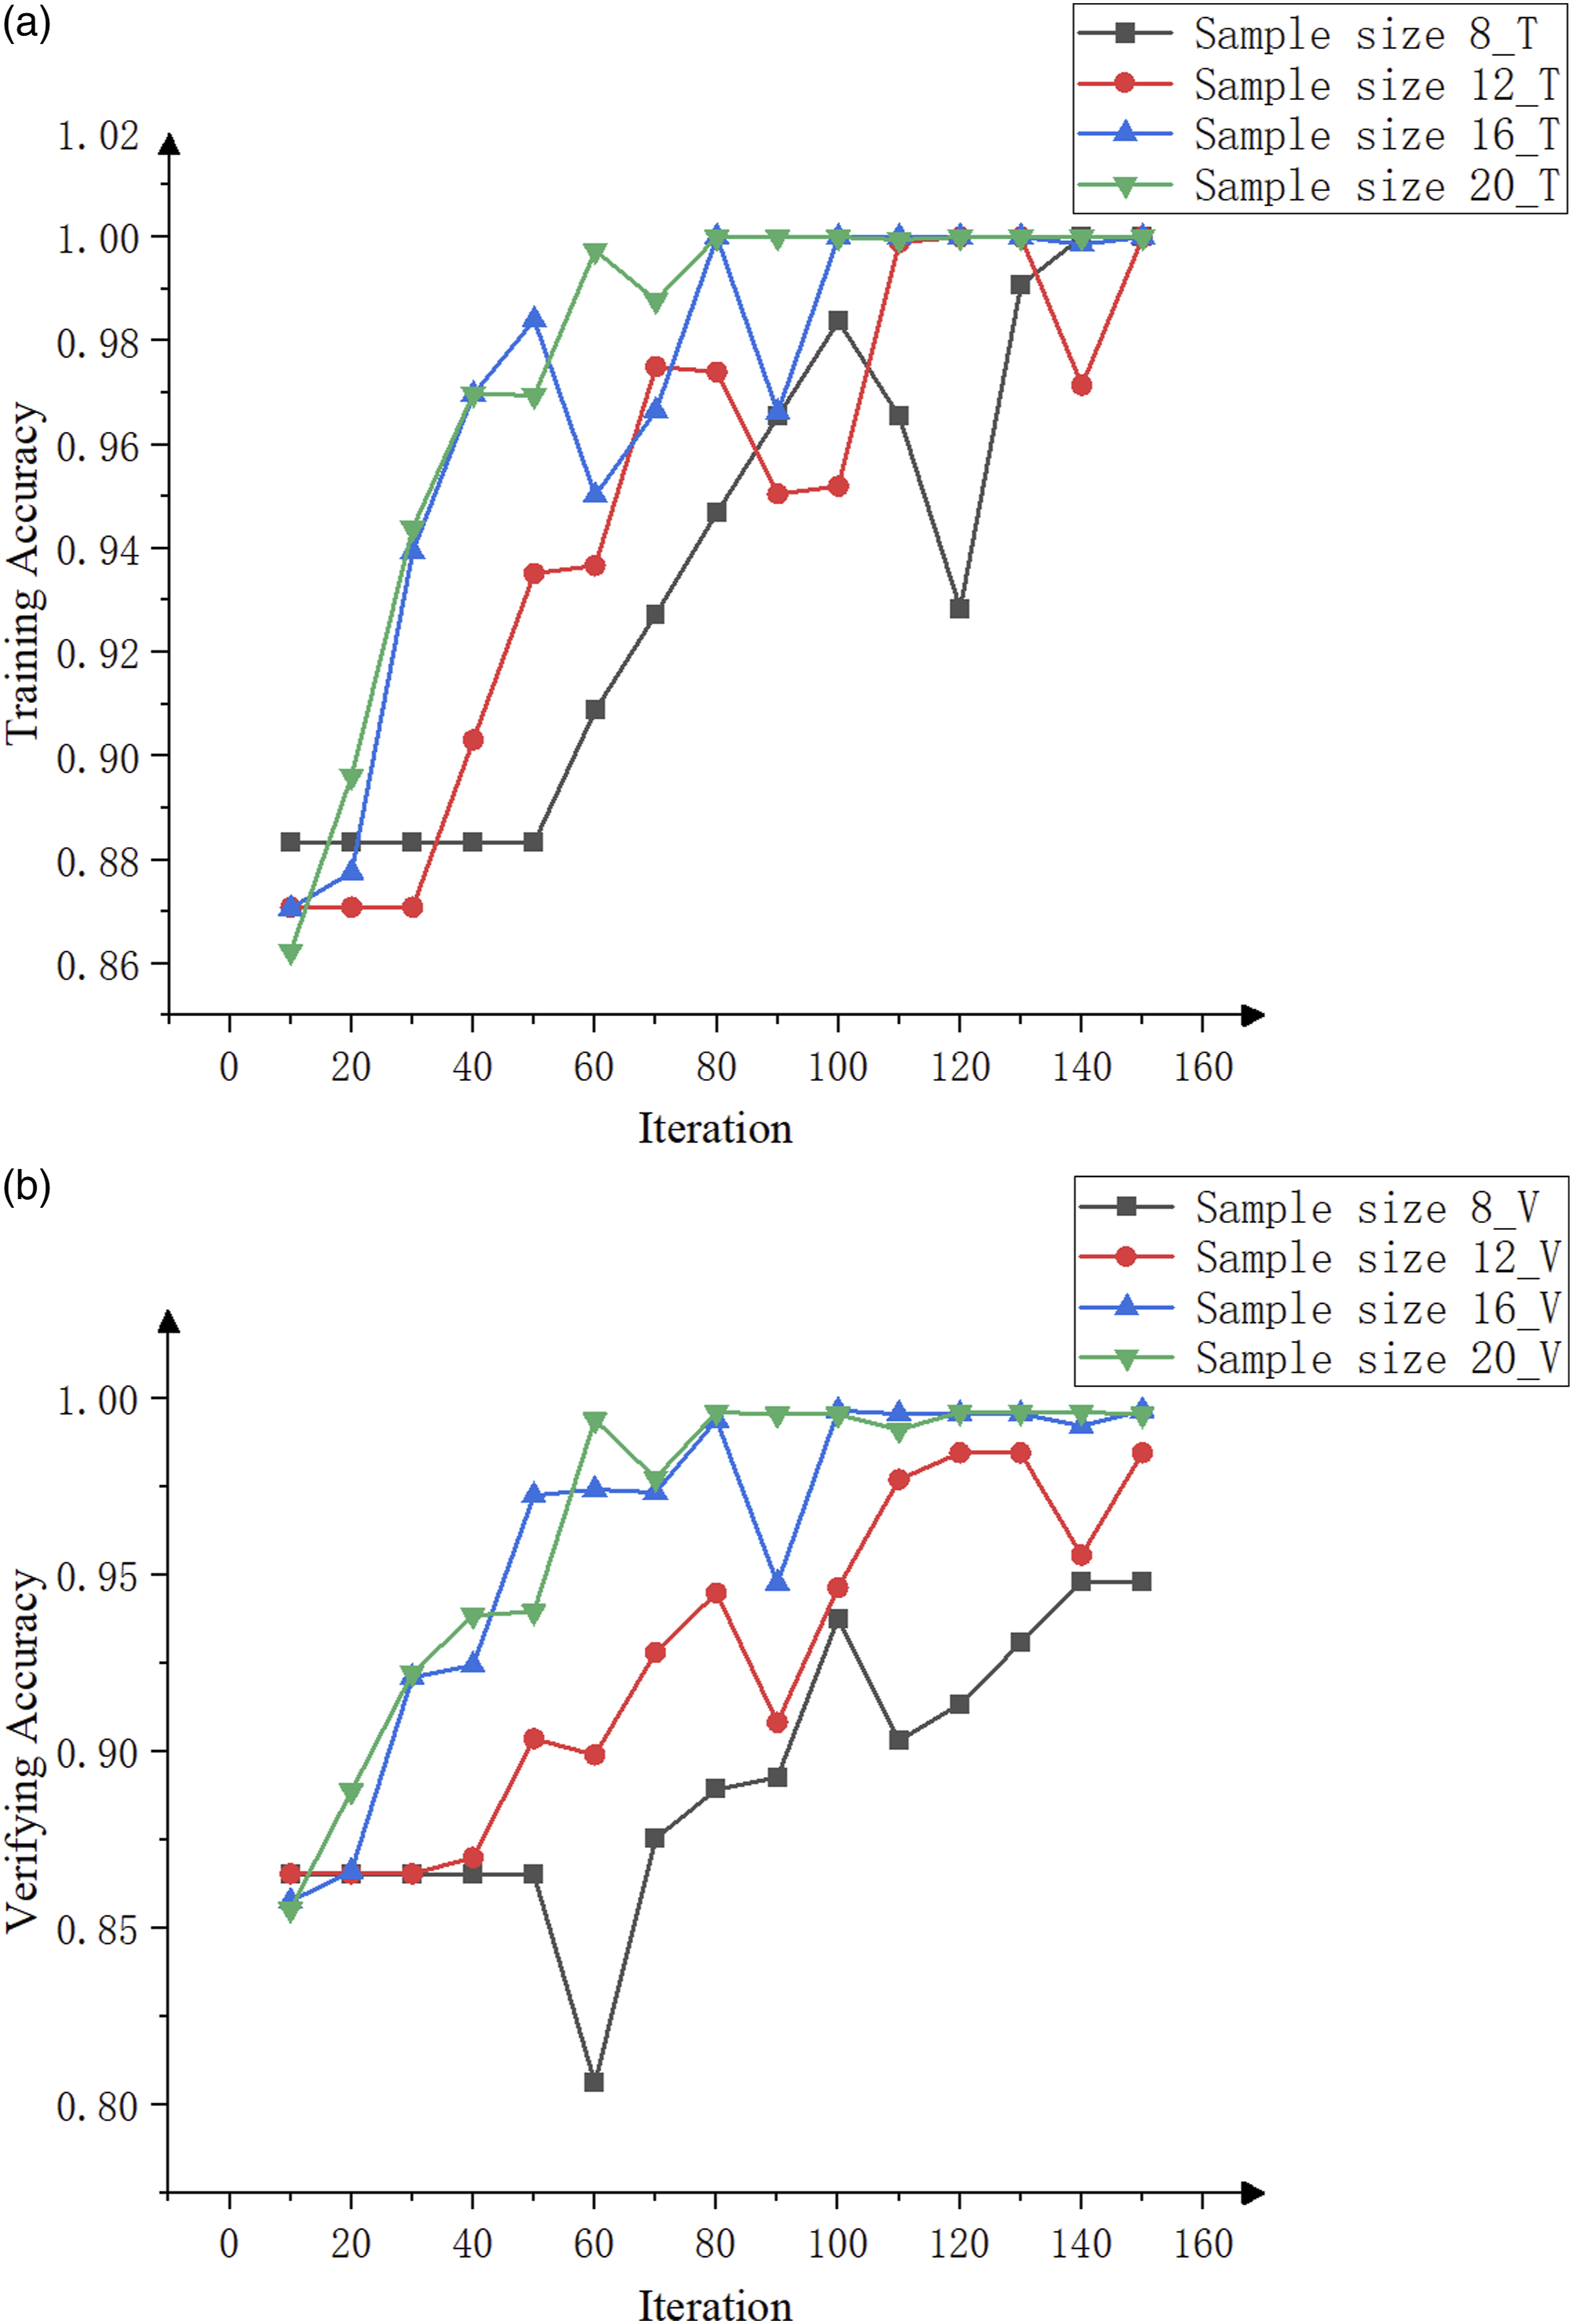
However, proposed method still can reach a high accuracy with small samples, once the iteration times is enough, and can be proved to be effective in experiments. To achieve an ideal result of diagnosis more quickly and steadily, the number of sample size for each kind of fault can be set more than 16 at least.
The trained model based on database D was used to realize a fault diagnosis for 280 unknown samples, contained 7 kinds of status and each has 40 samples. These samples are as twice as training data. The confusion matrix in fault diagnosis is shown in Figure 16. In overall, the accuracy is 94.64% from predicted result, the precision is 95.35% and the recall is 94.64%. Therefore, the model has an ability to identify faults under different degrees. As to inner fault with a size of 0.5 mm, it is sometime classed as normal one and there is a lower accuracy than other samples. Still, the whole accuracy is near to 95% for 7 kinds of samples. Therefore, proposed method can be used in practical applications under limited samples effectively. Confusion matrixes under different sample sizes (SN-DSCN).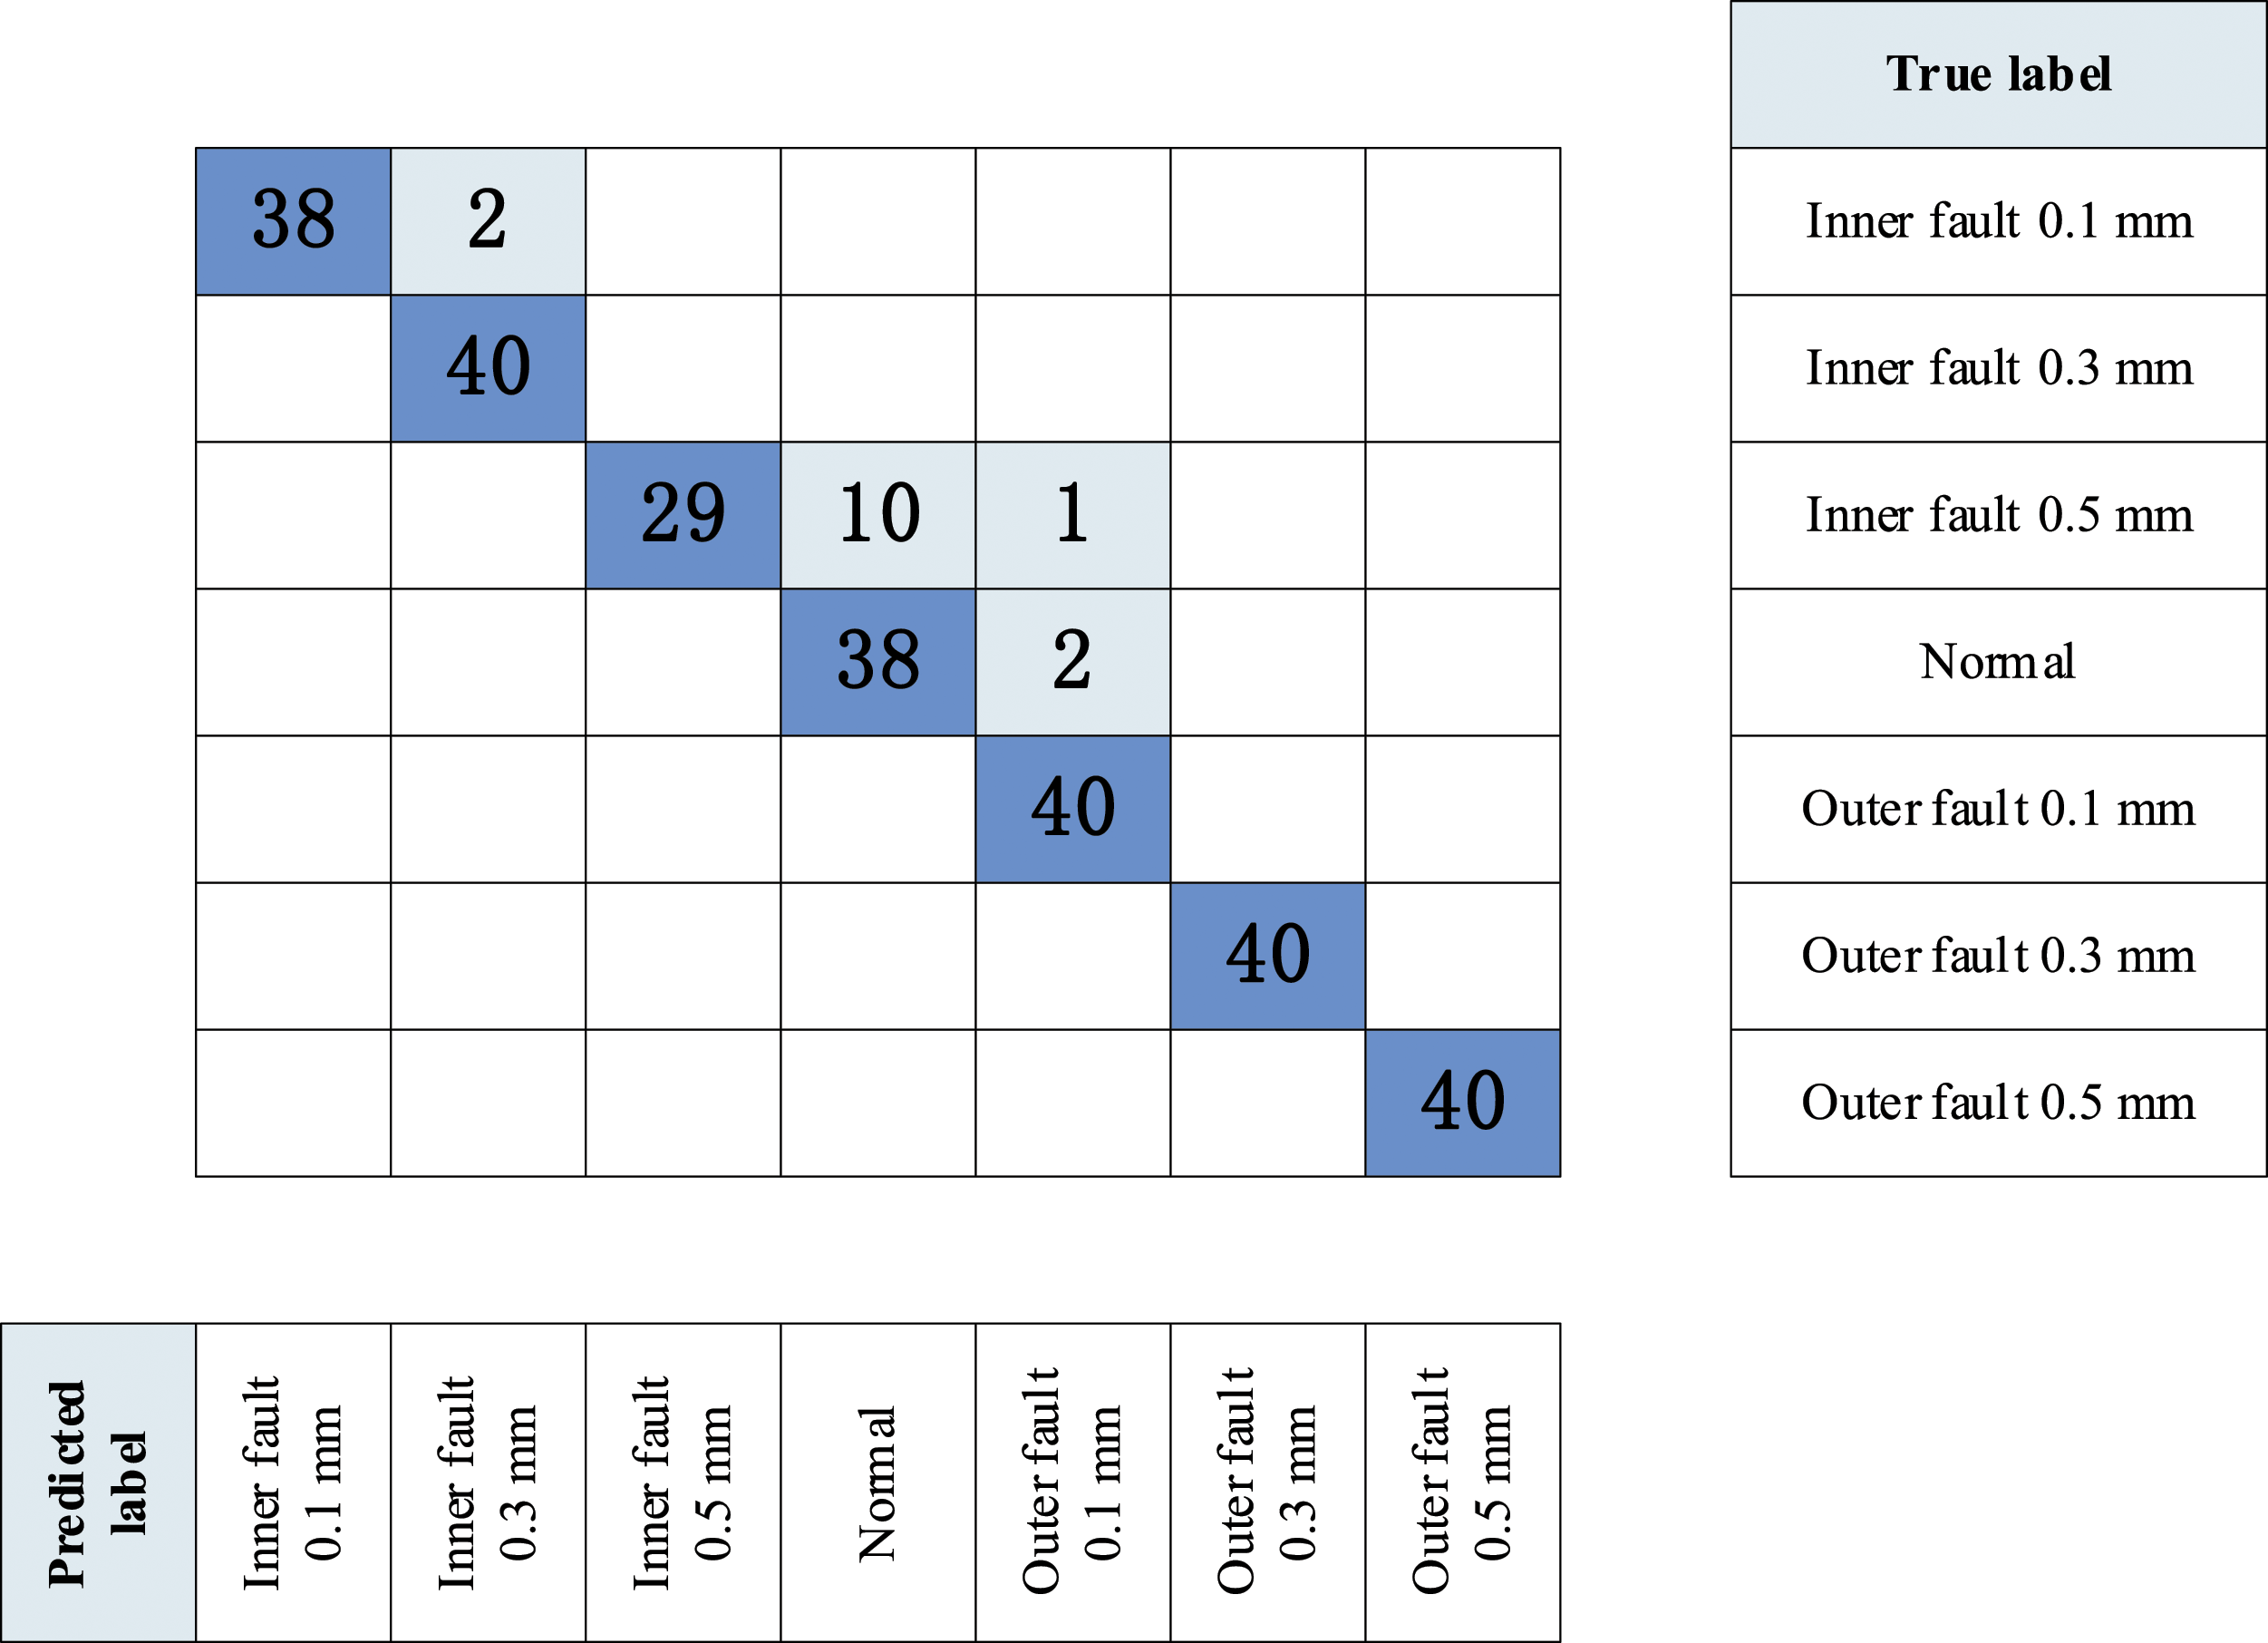
Comparison of calculation time
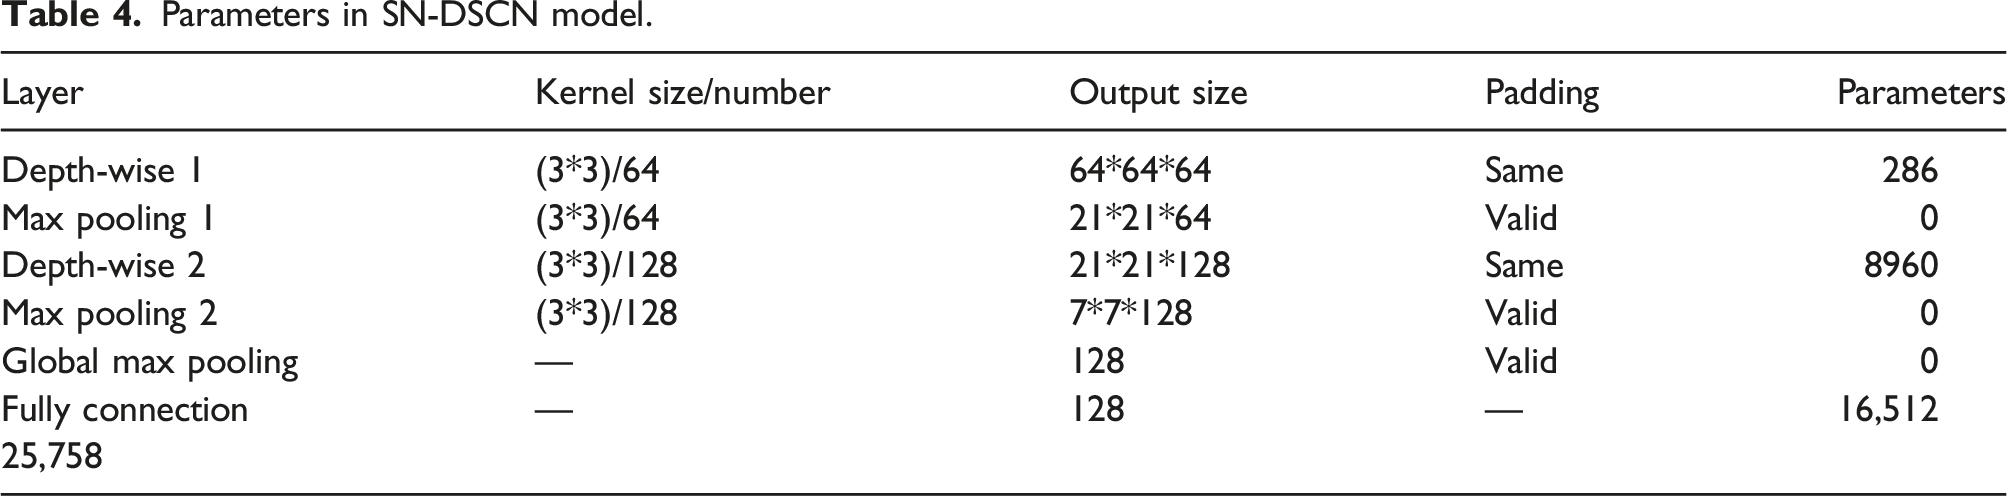
Parameters in SN-DSCN model.
Parameters in SN-CNN model.
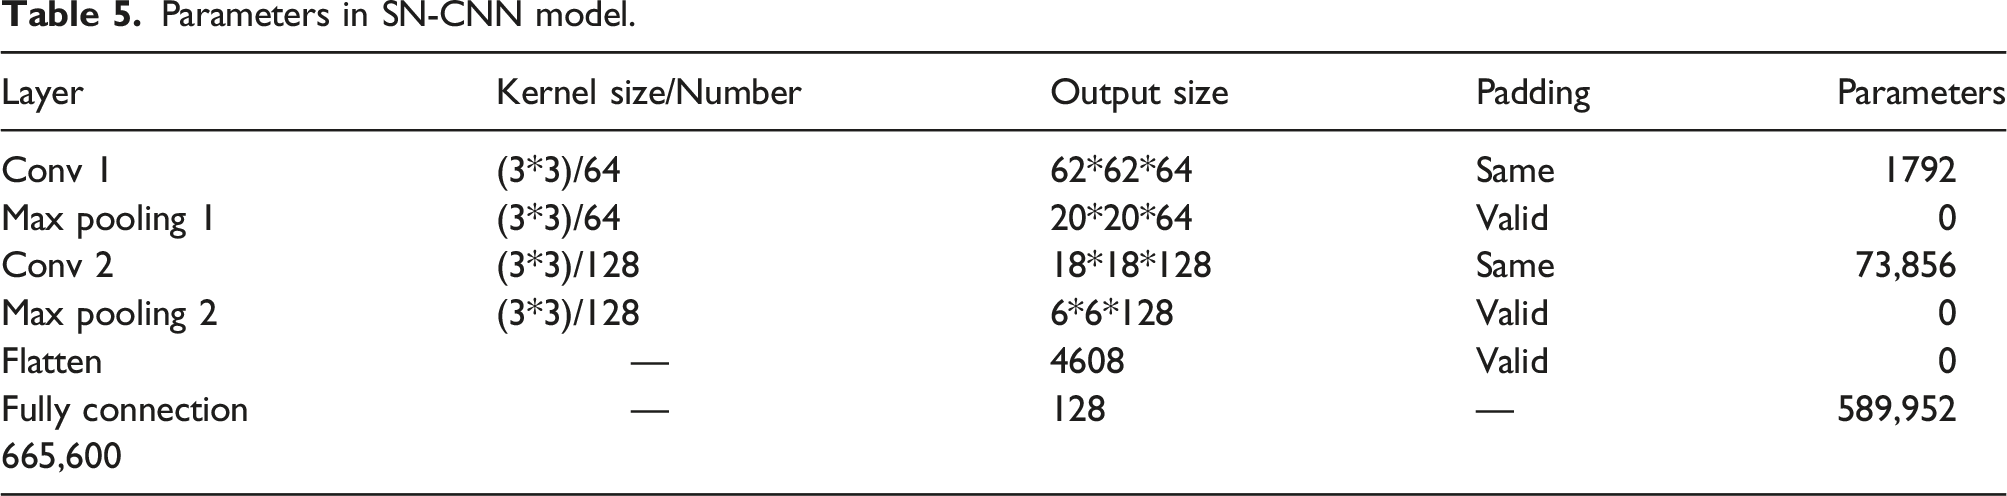
In a comparison from Tables 4 and 5, it can be seen clearly that the total number of parameters in CNN is nearly 25 times to DSCN model as a sub-net. Therefore, the consumption of calculation can be reduced in some degree.
Comparison for time consumption.
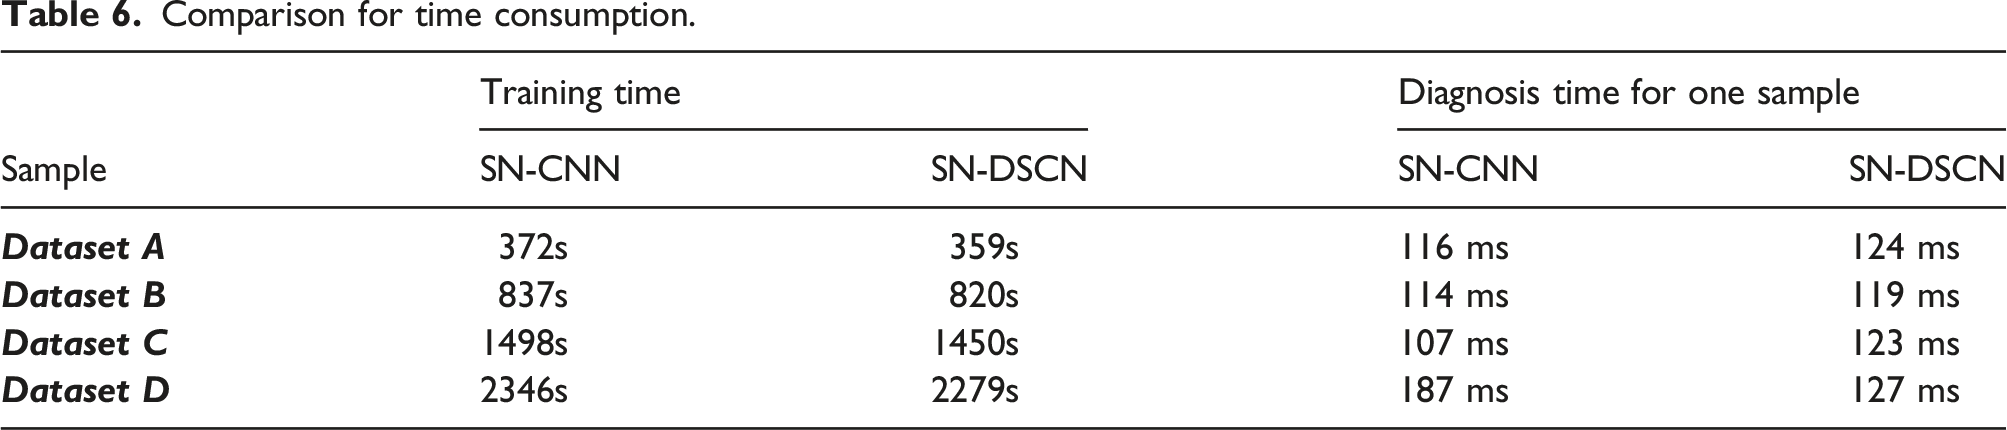
The experiment takes the time–frequency diagram of wavelet transform as the input feature, based on the Siamese network with DSCN, to realize fault diagnosis. The accuracy rate in verifying of rolling bearings in offset R2R unit in proposed model is 99.32%, and the test accuracy rate of the lightweight fault diagnosis model based on the Siamese network is 96.67%, which indicates SN-DSPN has a similar accuracy compare to SN-CNN while reducing the number of parameters.
From the analysis of parameters, there should be a much clearer acceleration for DSCN, however, the structure of SN will also cost lots of calculation resources. As the growing of parameters in many more complex problems, the advantage in SN-DSCN will be much more important and useful. Above all, there is still an improvement in SN-DSCN.
Conclusion
To realize a fault diagnosis of rolling bearings in a real R2R printing unit, a method based on Siamese Network is proposed to solve the small-sample learning problems. The fault signals are changed into time–frequency spectra by CWT and then the problem of fault diagnosis can be seen as a pattern recognition of images. However, this mission is very difficult when there is no enough sample. Therefore, Siamese Networks based on both Convolutional Neural Network and Depth-wise Separable Convolution Network are constructed to fulfill this question. Then a series of fault diagnosis for rolling bearings were taken, fault samples from Bearing Data Center and a R2R unit in printing press were identified successfully. The proposed method, SN-CNN and SN-DSCN were both proved to be effective in the small-sample learning with only very few samples.
From two groups of experiment, faults in rolling bearings were identified with small-sample based on SN with an accuracy over 96.67%, only about 20 samples for one status to training, and this is hard to finish in other deep learning models under same condition. Fault samples from a database with various degree, rotary speed and added noise were all diagnosed successfully. Then the influence for result from optimizer algorithms and samples size were all compared and analyzed, and the fault diagnosis for bearings in a R2R printing unit was realized with only 16 samples for training.
From this work, it can be seen that the SN model has a strong ability in fault diagnosis and can be used in a R2R printing unit for various conditions. SN-CNN and SN-DSCN both can finish this mission with 20 samples, which can be seen as a limited sample learning mission.
Footnotes
Acknowledgments
We also thank Dr Heping Hou for providing experimental devices and suggestions for our work.
Declaration of conflicting interests
The author(s) declared no potential conflicts of interest with respect to the research, authorship, and/or publication of this article.
Funding
The author(s) disclosed receipt of the following financial support for the research, authorship, and/or publication of this article: This work is supported by the National Key Research and Development Program of China (No.2019YFB1707203), the project of technology innovation and guidance in Shaanxi Province-the regional innovation guidance plan (No.2020QFY03-06), the China Postdoctoral Science Foundation (No.2019M663783), Natural Science Basic Research Plan in Shaanxi Province of China (Grant No. 2021JM-334) and Scientific Research Program of Shaanxi Provincial Department of Education (No.16JS081).