
Abstract
To study the interaction mechanism of shaking table-test structure in shaking table test, an analytical model of shaking table array-test structure was established. Based on the analytical model, the influence of structure damping, frequency, and shaking table output on the accuracy of shaking table test was analysed. The analysis showed that compared with the actual frequency and theoretical response of the test structure, the measured structure frequency is decreased by 6.3%, and the peak value of seismic response of test structure is amplified 1.96 times. The interaction leads to 32% reduction of the waveform reproduction performance of shaking table. At the structure frequency and its surrounding frequency bands, the amplitude–frequency characteristic of shaking table is amplified 5.26 times, and the phase lag is 122.38° in the phase–frequency characteristic of shaking table. Based on the above results, it was indicated that the method that taking the output of shaking table as the input of structure will cause significant accuracy reduction when the interaction cannot be ignored. Finally, suggestions were given to improve the accuracy of shaking table test.
Introduction
Shaking table is an important test equipment in the field of civil engineering,1,2 which is widely used to test the dynamic properties of structural system, 3 examine the seismic measures of structure, 4 study the response characteristics of structure,5,6 and damage mechanisms of structure 7 under seismic excitation. Due to shaking table-test structure interaction (STTSI), the control performance and test accuracy of the shaking table need to be further improved.8–11 Wang analysed the STTSI between shaking table and single-degree-of-freedom steel frame. 12 The study showed that the acceleration response is amplified by 24.54%, and the waveform reproduction accuracy of shaking table decreases by 5.73%. It can be seen that the impact of STTSI brings great challenges to shaking table test and shaking table control. In response to the above challenges, many scholars have conducted studies on the effects of the STTSI between one single shaking table and the test structure.
Blondet and Esparza found out that it is possible to study the STTSI effects on the system model of shaking table and test structure in physical mechanical viewpoint. 13 Based on the above finding, researchers studied the STTSI effects under different physical mechanical characteristics. Taking mass ratio, structural damping ratio, and structural frequency as key factors, Blondet and Esparza 13 investigated the STTSI effects on the shaking table model (MST). The investigation revealed that the STTSI effect is positively correlated with structural frequency but negatively correlated with structural damping ratio. Wang et al. 14 explored the sensitivity of various structural characteristics on the MST. The exploration turned out that the frequency of structure exerts the most substantial influence, followed by the damping ratio of structure, while the mass ratio factor has the least impact. Conte and Trombetti15,16 conducted an investigation into the dynamic coupling among the base, platform, and structure. Their findings suggest that the structure exerts a notable impact on the MST in comparison to the base. Conte 16 and Chen 17 enhanced the modelling accuracy of shaking tables and structures by integrating the physical representation of damping and stiffness. The enhancement indicated that physical representation of damping and stiffness has impact on the MST. Huang 18 studied the STTSI between single-degree-of freedom structure and shaking table, revealing a resonance peak at the structure’s frequency that affects the shaking table’s control performance.
Tang et al. 19 analysed the STTSI effect between a shaking table and a multi-degree-of-freedom structure, demonstrating that SSI influences the Modal Strain Transformation (MST) at the structure’s natural frequency. Guo et al. 20 investigated the STTSI effects on shaking table tests. The investigation emphasises the notable impact of structural nonlinearity on the MST and the subsequent decrease in control accuracy of the shaking table. Trombetti et al. 16 studied the sensitivities of control gain and servo valve delay on the MST, which emphasises their significant impact on the MST. Li et al. 21 analysed the stability of the MST under various parameters and suggested that better system stability can be achieved by adjusting the no-load control parameters. Zhang 22 studied the various mechanical installation errors, displacement measurement errors, and servo valve biases on the MST. The study concluded that the MST is primarily related to the servo valve bias. Yan 23 explored the influence of the exciter’s mass on the MST, noting an increase in the STTSI effect with exciter mass. Xie 24 investigated the impact of hinge stiffness on the MST, recommending an increase with stiffness. Maoult et al. 25 employed finite element modelling to investigate the reduction of structural frequency in large-scale shaking table experiments. The study attributed the STTSI effect to the deformation of the shaking table. Wang 12 and Li 26 examined the STTSI effect between dual shaking tables and structures, highlighting the notable influence of the coupling effects between the two shaking tables on the modal strain energy within the frequency range of the structure. In addition, Ma 27 investigated that the degree of guideway smoothness affects the accuracy of the MST. The coupling characteristics between the cradle and shaking table are important features of the centrifuge shaking table system model. 28 Zheng 29 pointed out that in the modelling process of an underwater shaking table system, it is necessary to consider the water-depth ratio.
To date, many studies have been conducted to investigate the STTSI effects. However, the previous studies need to be further explored in terms of research parameters and research chain. In terms of research parameters, most of the studies have taken one single shaking table and test structure as the research object. In shaking table array test, there exist complex mechanical and control couplings, which will further affect test accuracy. In other words, the conclusions drawn from one single shaking table test cannot be fully generalized to shaking table array test. In terms of research chain, most previous studies have only analysed the STTSI effects on shaking control performance (shaking table output) in mechanical control viewpoint but have not analysed the STTSI effect on structural seismic response in civil engineering test viewpoint. From the perspective of signal transmission (from ground motion signal to shaking table output signal, and then to structural seismic response signal), the previous research studies have carried out the step of ground motion signal to shaking table output signal and have not investigated the step of shaking table output signal to structural seismic response signal. More importantly, some studies take the output of shaking table as the input of structure. But the applicability of the above method needs to be further explored.
Based on the above review, this paper intends to establish a systematic refinement model of shaking table array-test structure and study the STTSI on the seismic response of structure under different test structure characteristics (damping ratio and frequency) and shaking table output, so as to discover the influence law of the STTSI, reveal the mechanism of STTSI effects on shaking table test, and explore the applicability of the experimental method of taking the output of shaking table as the input of structure. This paper is organized as follows: System modelling section establishes analytical model of shaking table array-test structure, the analysis of the STTSI effects on structure test response was conducted in STTSI effects on structure test response section, the STTSI effects on shaking table performance were studied in STTSI effects on shaking table performance section, and Conclusion section concludes the main points and contributions.
System modelling
To establish a refined model of the shaking table array-test structure system, the composition of the system and its characteristics were considered comprehensively. Figure 1 shows the basic composition of the system, mainly including three parametric controllers, servo valves, hydraulic cylinders, exciters, shaking table, and test structure. According to Figure 1, the whole system is driven by two shaking tables in horizontal direction. Therefore, there are mechanical and control couplings between two shaking tables, and the system model to be constructed is a multi-input multi-output model. Diagram of the shaking table array-test structure.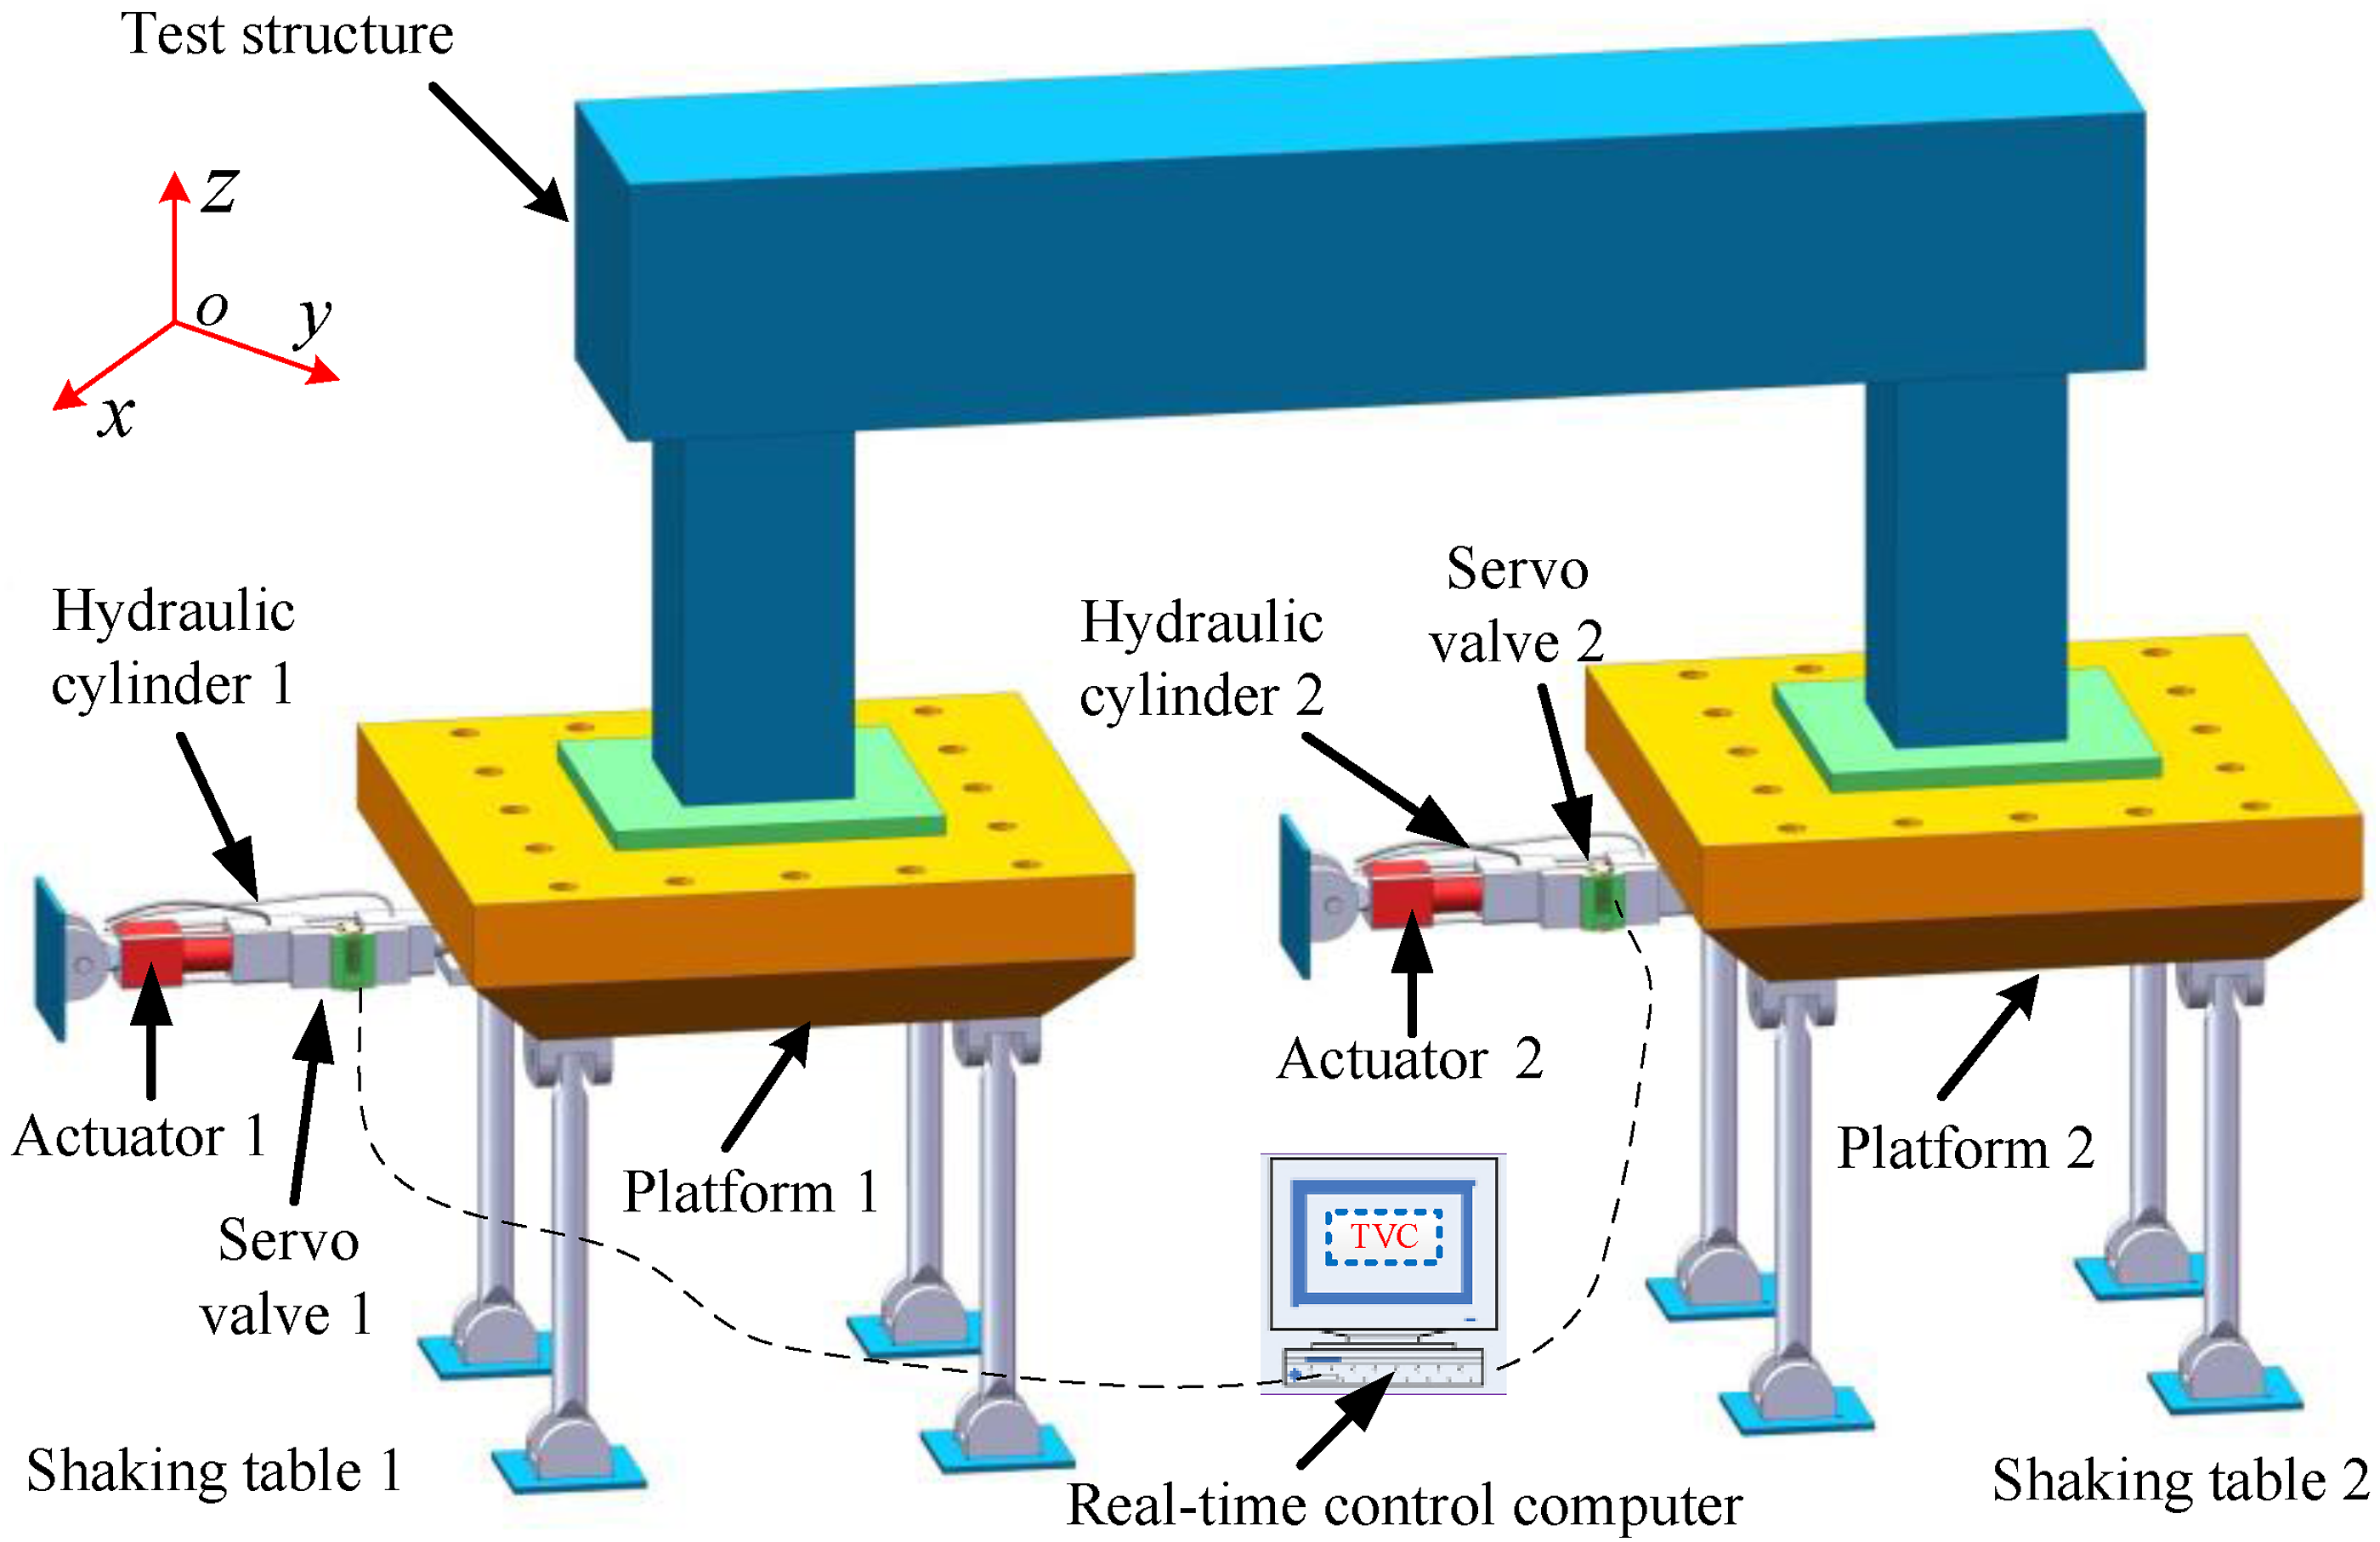
The system model was established following the modular method depicted in Figure 2. The modular method divides the system into three main sub-models, including the dynamic model, hydraulic-driven model, and TVC model.
30
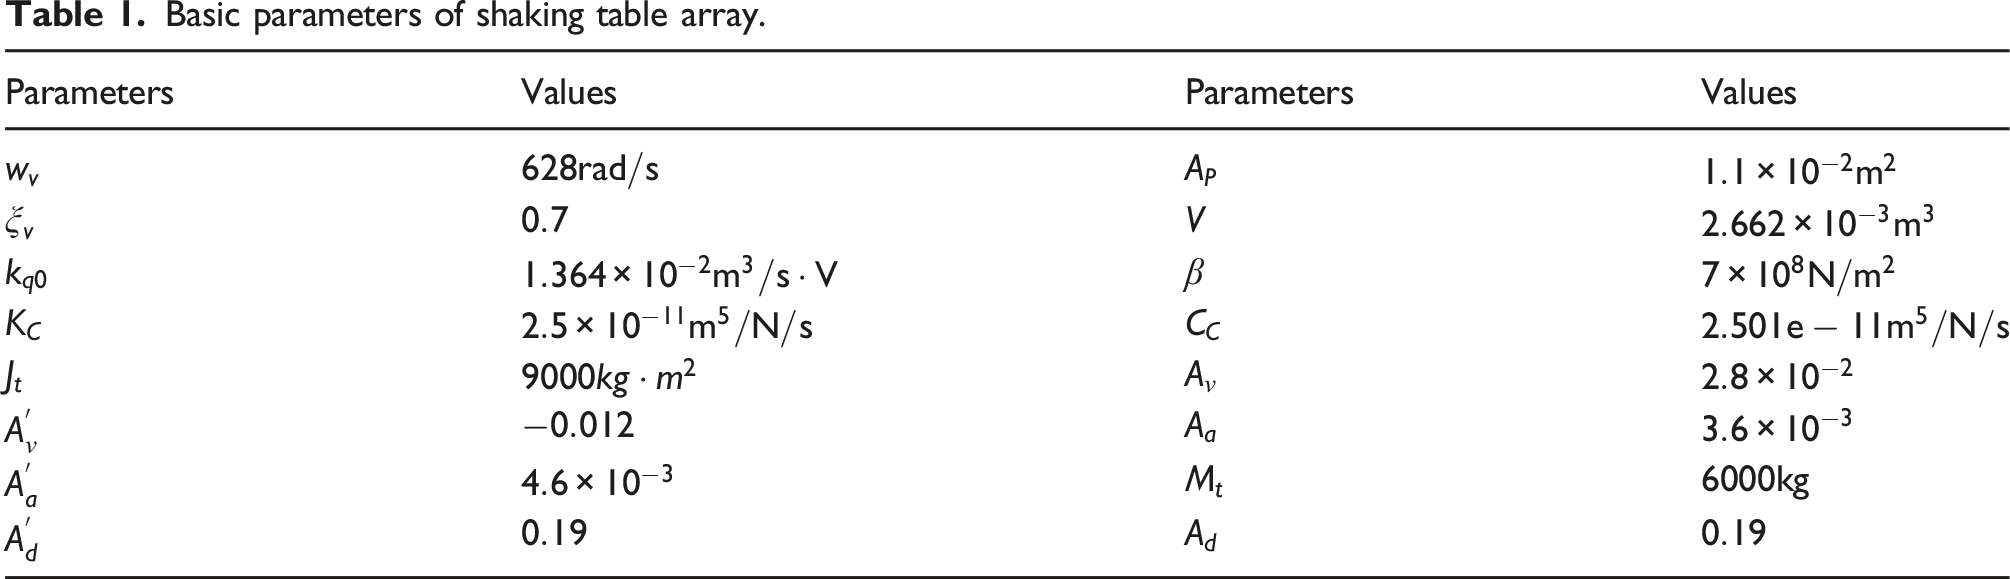
They are the motion mechanism part, the hydraulic-driven part, and the control part of the system. In the process of establishing the system model, the compositions and physical characteristics of the three sub-models are considered comprehensively. The parameter sizes and physical properties of the system components are shown in Table 1, and the specific symbolic descriptions are given in the following modelling process. Three-sub model systems of the shaking table array-test structure. Basic parameters of shaking table array.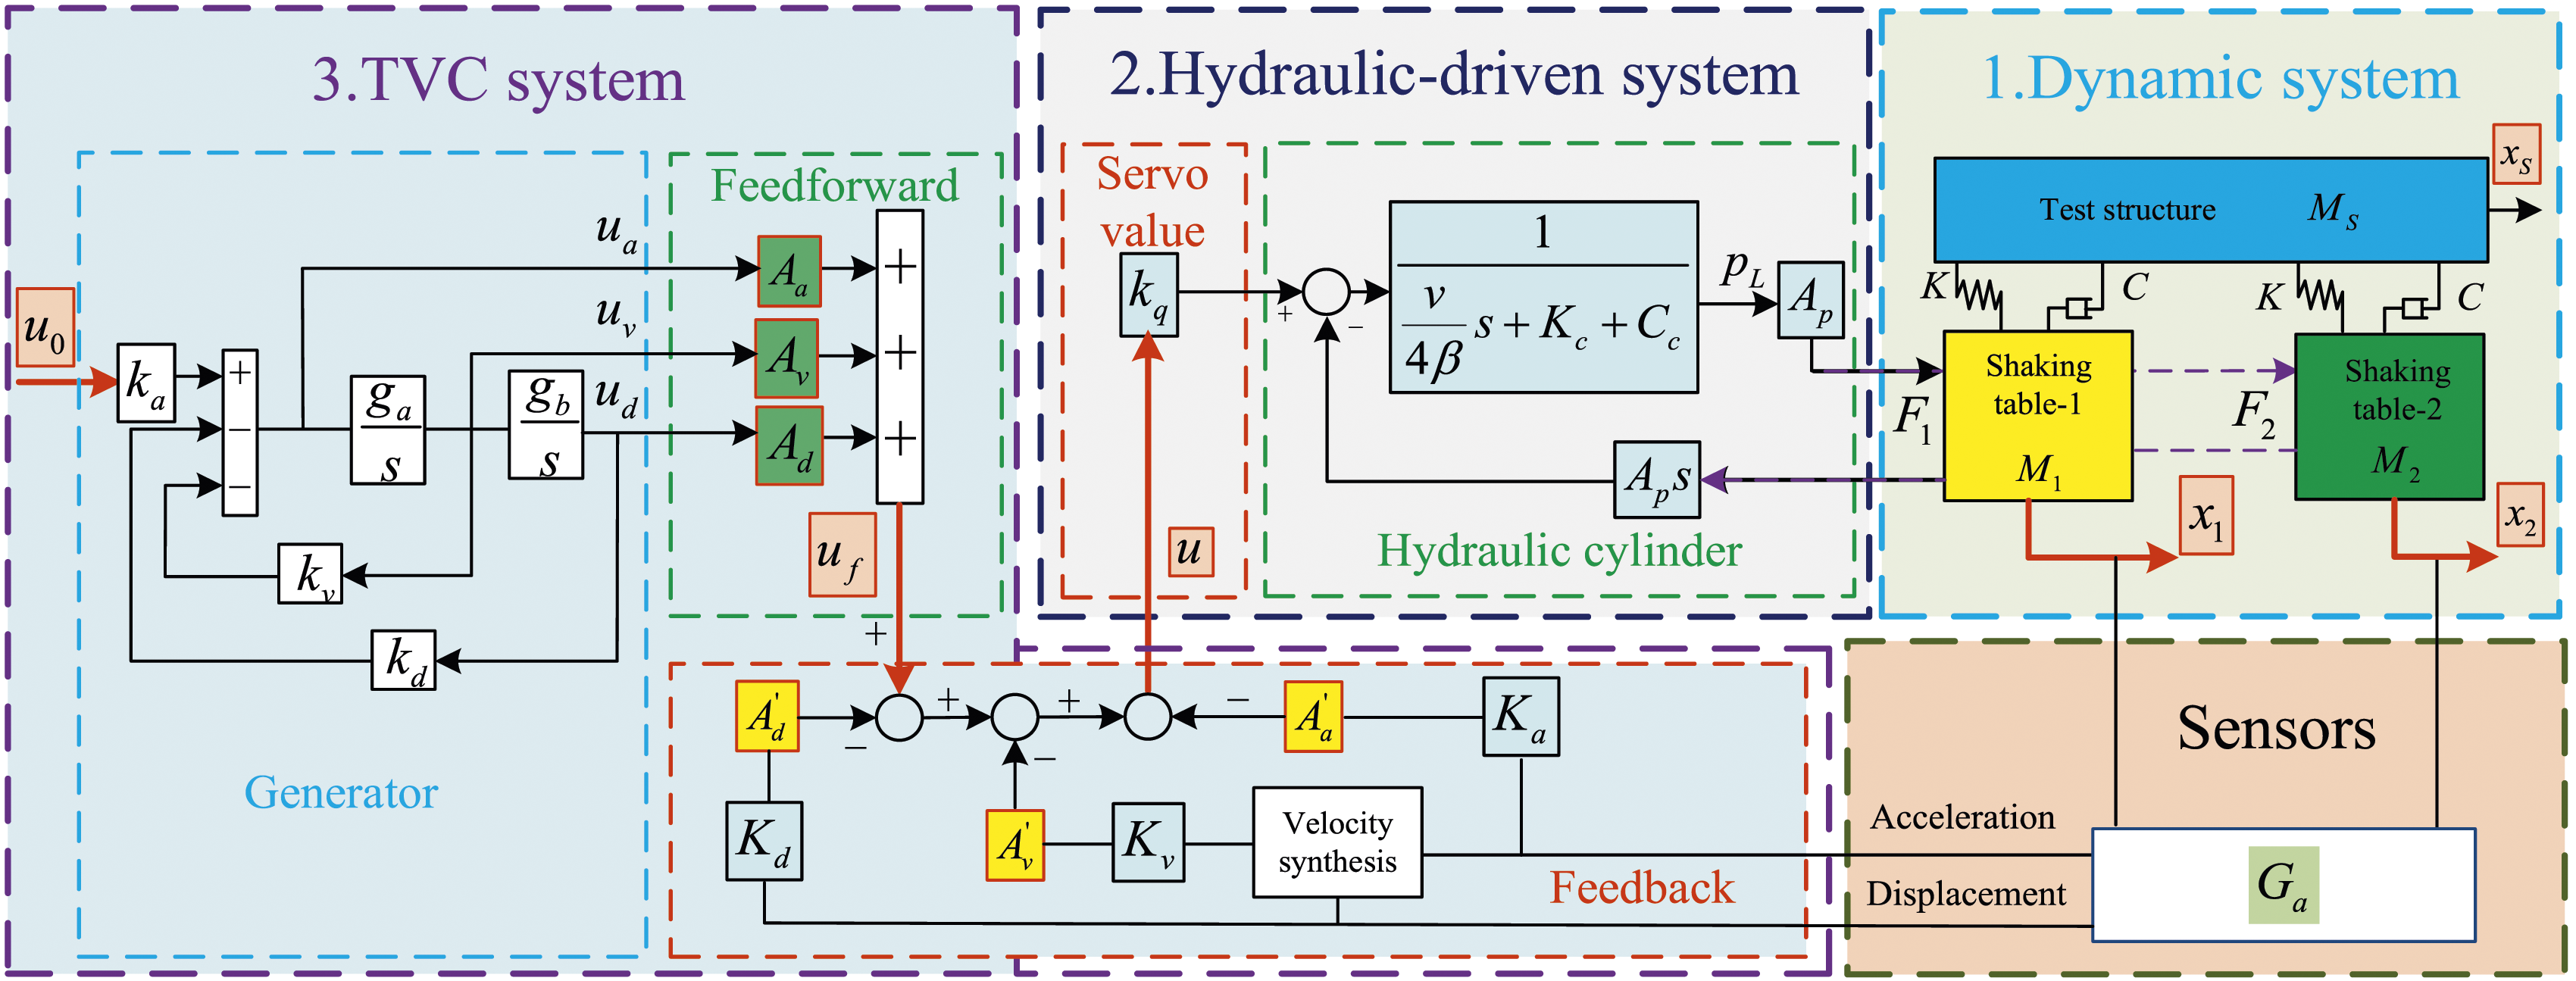
Dynamic system modelling
The dynamic model of the shaking table and eccentric load can be regarded as an integrated whole. The integrated whole is an equivalent model of the dynamic model, the schematic diagram of which is presented in Figure 3. Influence of different damping ratios.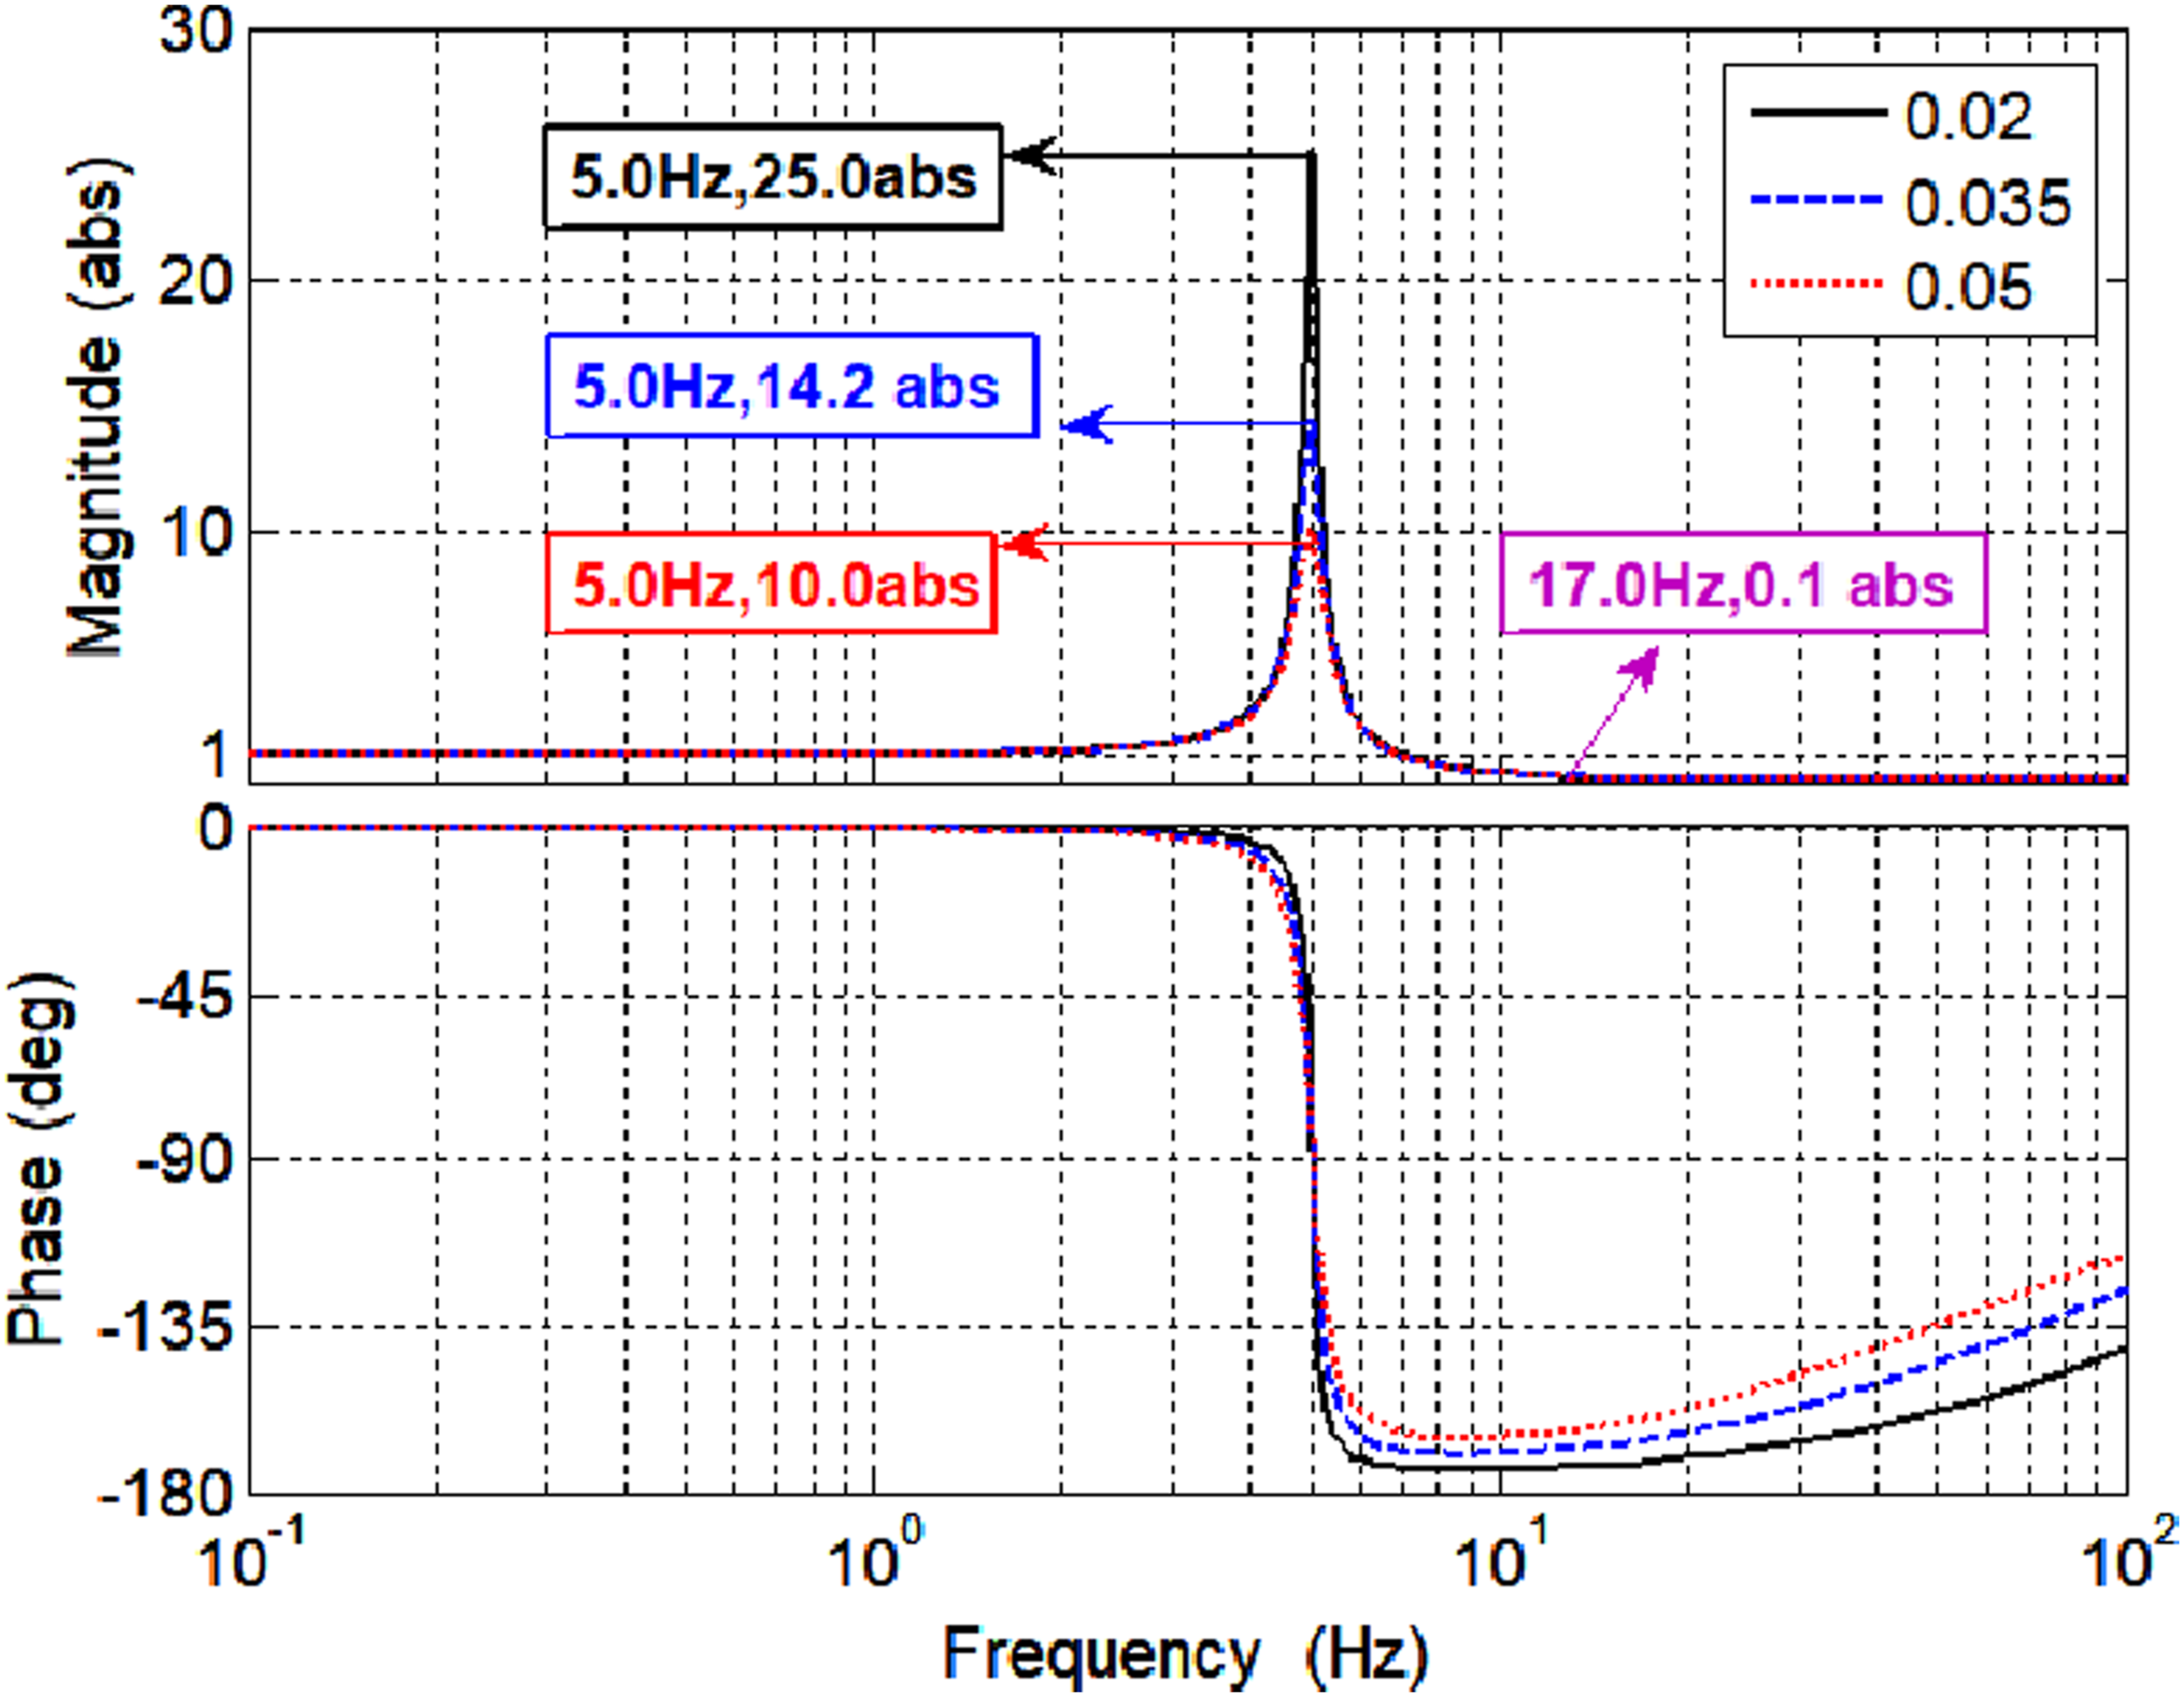
The dynamic model of the shaking table array-test structure is shown in Figure 2. The symbols are described in detail as follows:
Based on Newton’s second law, the system dynamics is as follows
18
: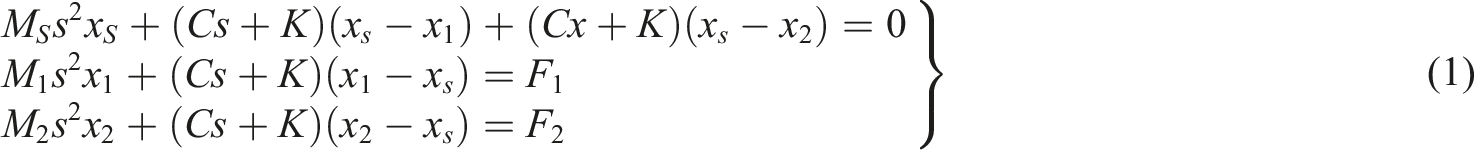
Hydraulic-driven system and TVC system modelling
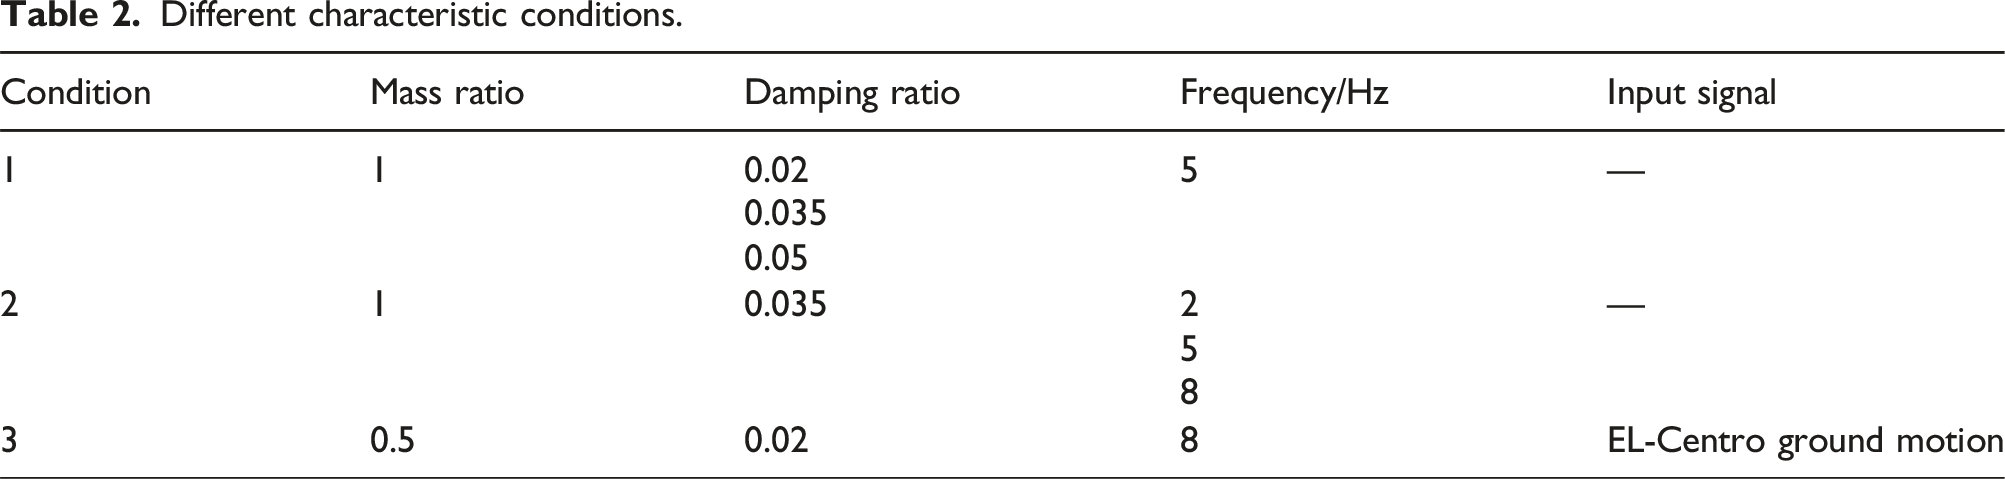
Different characteristic conditions.
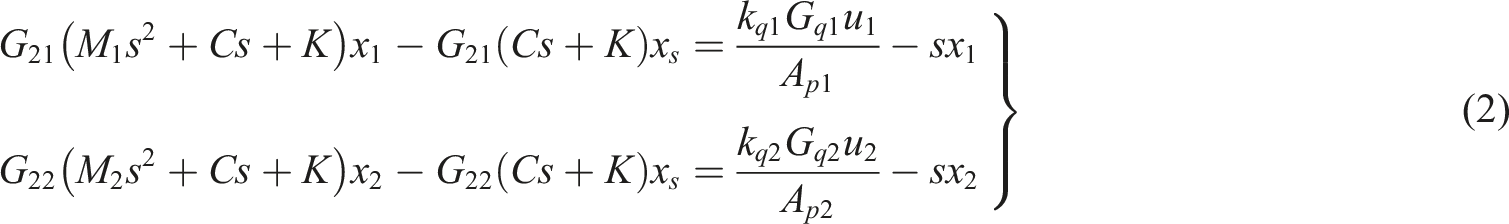
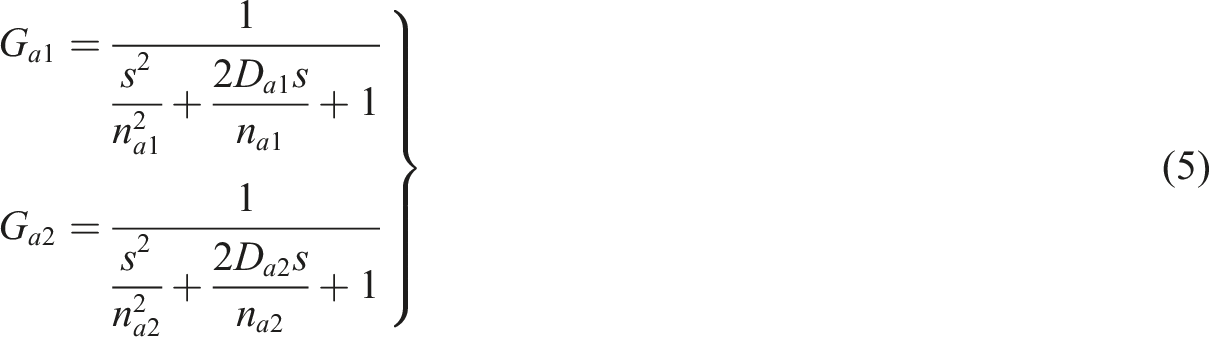
Based on the TVC modelling process given in Reference 31, TVC model of two different shaking tables and test structure can be obtained. Then, the control error signal is given as follows:
Transfer function matrix modelling
Based on the three sub-models, the transfer function matrix of the shaking table and test structure is established. Combining equations (1) and (2) to get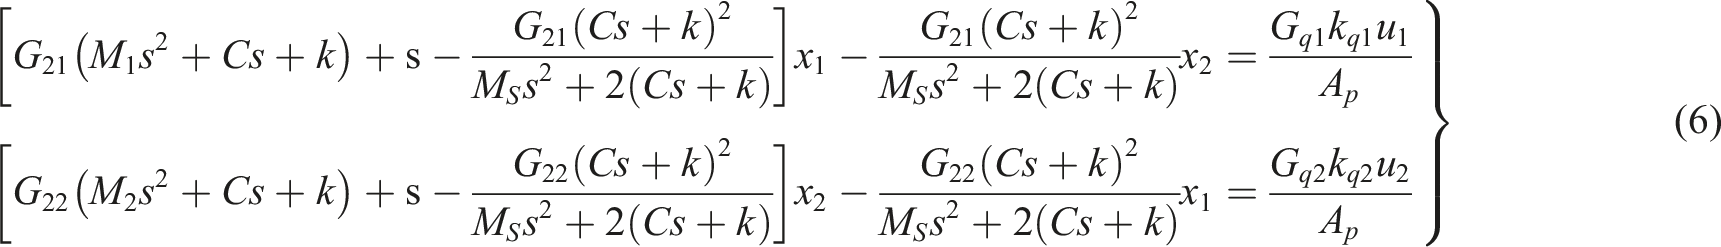
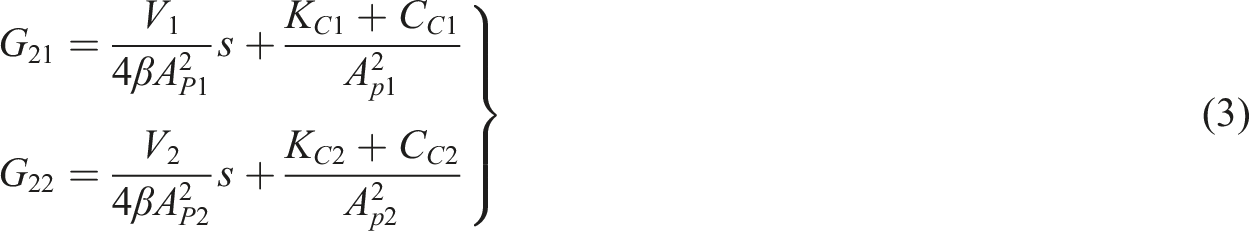
Substituting equations (4) and (5) into equation (6), the analytical transfer function can be obtained as follows: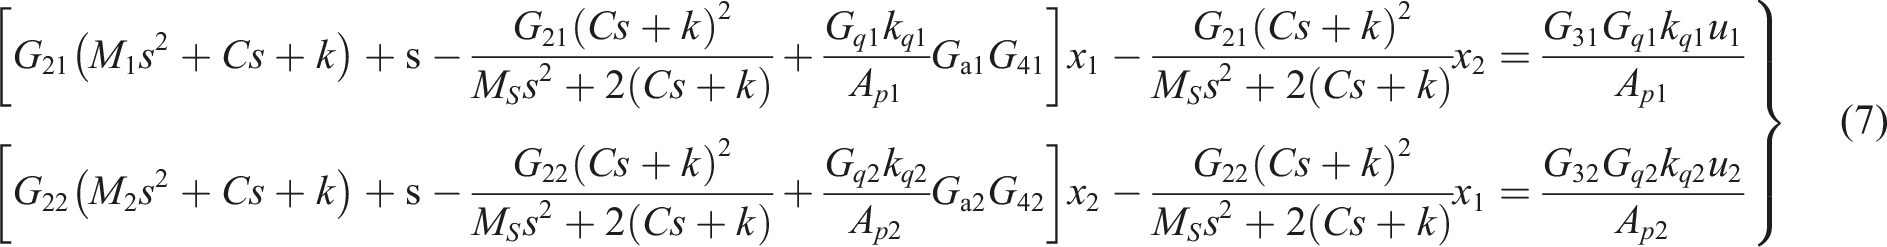
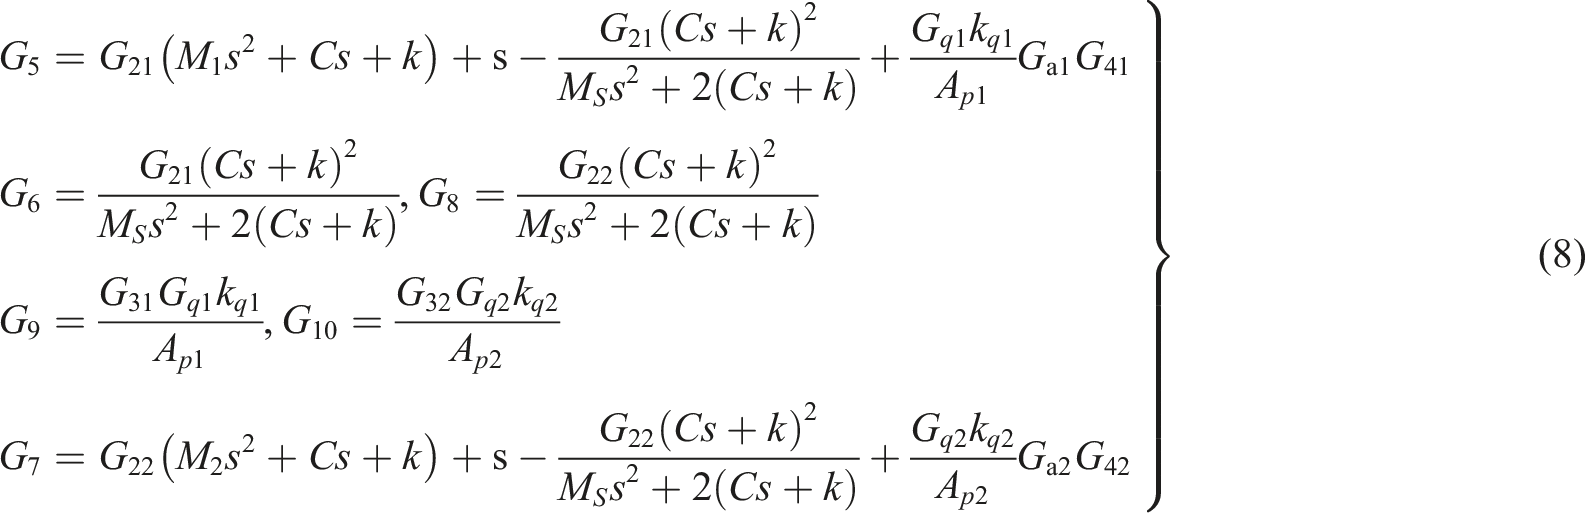

Finally, the transfer function of the shaking table array-test structure can be obtained as follows: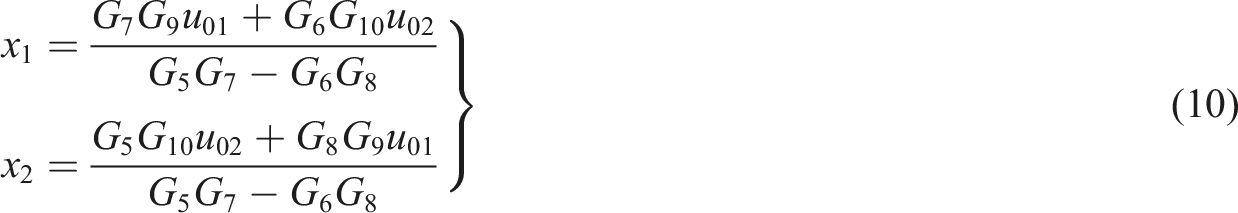
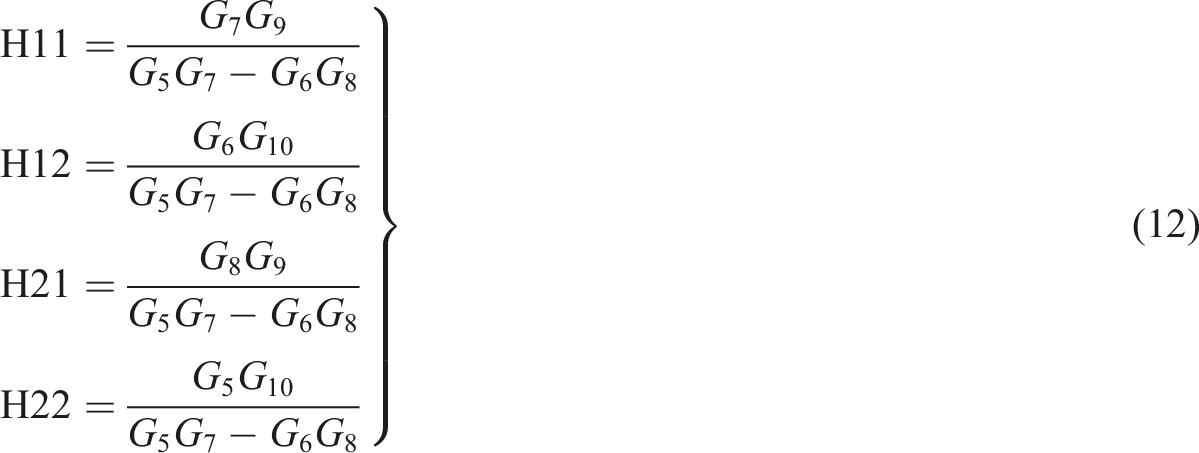
Rewriting equation (10) into the form of transfer function matrix to obtain equation (13):
Given 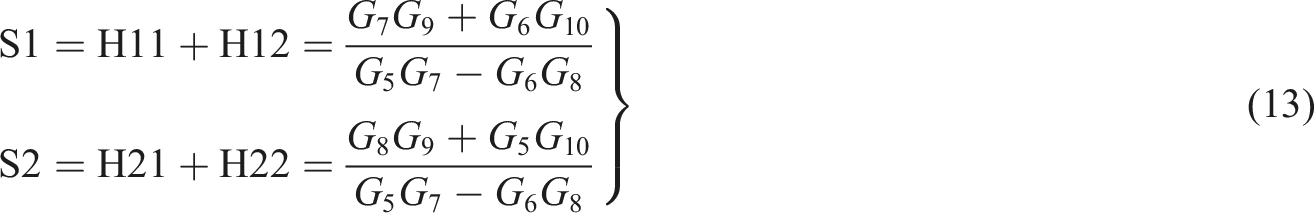
Seismic response of the test structure
According to the modelling procedure given in Reference 18, the response of the test structure is as follows:
To investigate the interaction mechanism between the shaking table array-test structure, the complex problem was further simplified. Assuming that the two shakings are identical, then the response of the structure is as follows:
It can be seen from equation (15) that the mass, the damping coefficient, the stiffness coefficient, and shaking table output are the factors affecting the structural response. Equation (15) can be further simplified as follows:
Equation (16) shows that the damping ratio of test structure, the frequency of test structure, and the output of shaking table are important factors affecting the response of the structure. It is worth pointing out that when the STTSI can be ignored, some shaking table tests usually take the output of shaking table as the input of structure to obtain the seismic response of the structure.
System parameters
Based the above deduction, the model of the shaking table array-test structure and the seismic response model of structure were established. The values of the model parameters are shown in Table 1, which have clear physical meanings in actual shaking table tests.
STTSI effects on structure test response
To investigate the interaction mechanism of the damping ratio of test structure, the frequency of test structure, and the output of shaking table on the seismic response of structure, three sets of conditions were used to analyse structure test response under different characteristics. The conditions are shown in Table 2.
Analysis of damping ratio and frequency effect
The response of test structure under different damping ratios was given in Figure 3. It can be observed from Figure 3 that at a frequency of 5 Hz, when the damping ratio is 0.02, 0.035, and 0.05, the amplitude is 25 abs (abs represents the absolute value, namely, the value of the output over the input), 14.20 abs, and 10.00 abs, respectively. According to the above data, the seismic response of the structure increases with the damping ratio of test structure. The response of the structure is 0.1 abs at 17.0 Hz, which means that the seismic response of test structure decreases to 1/10 of the seismic input.
The response of the structure under different frequency conditions is given in Figure 4. It can be seen from Figure 4 that the amplitude of the response is 14.20 abs when the frequency of test structure is 2 Hz, 5 Hz, and 8 Hz under the condition of damping ratio of 0.035. According to the data collected, it can be seen that the amplitude of the structural response remains constant as the frequency of the structure increases, and the region of influence is shifted flatly. Influence of different frequencies.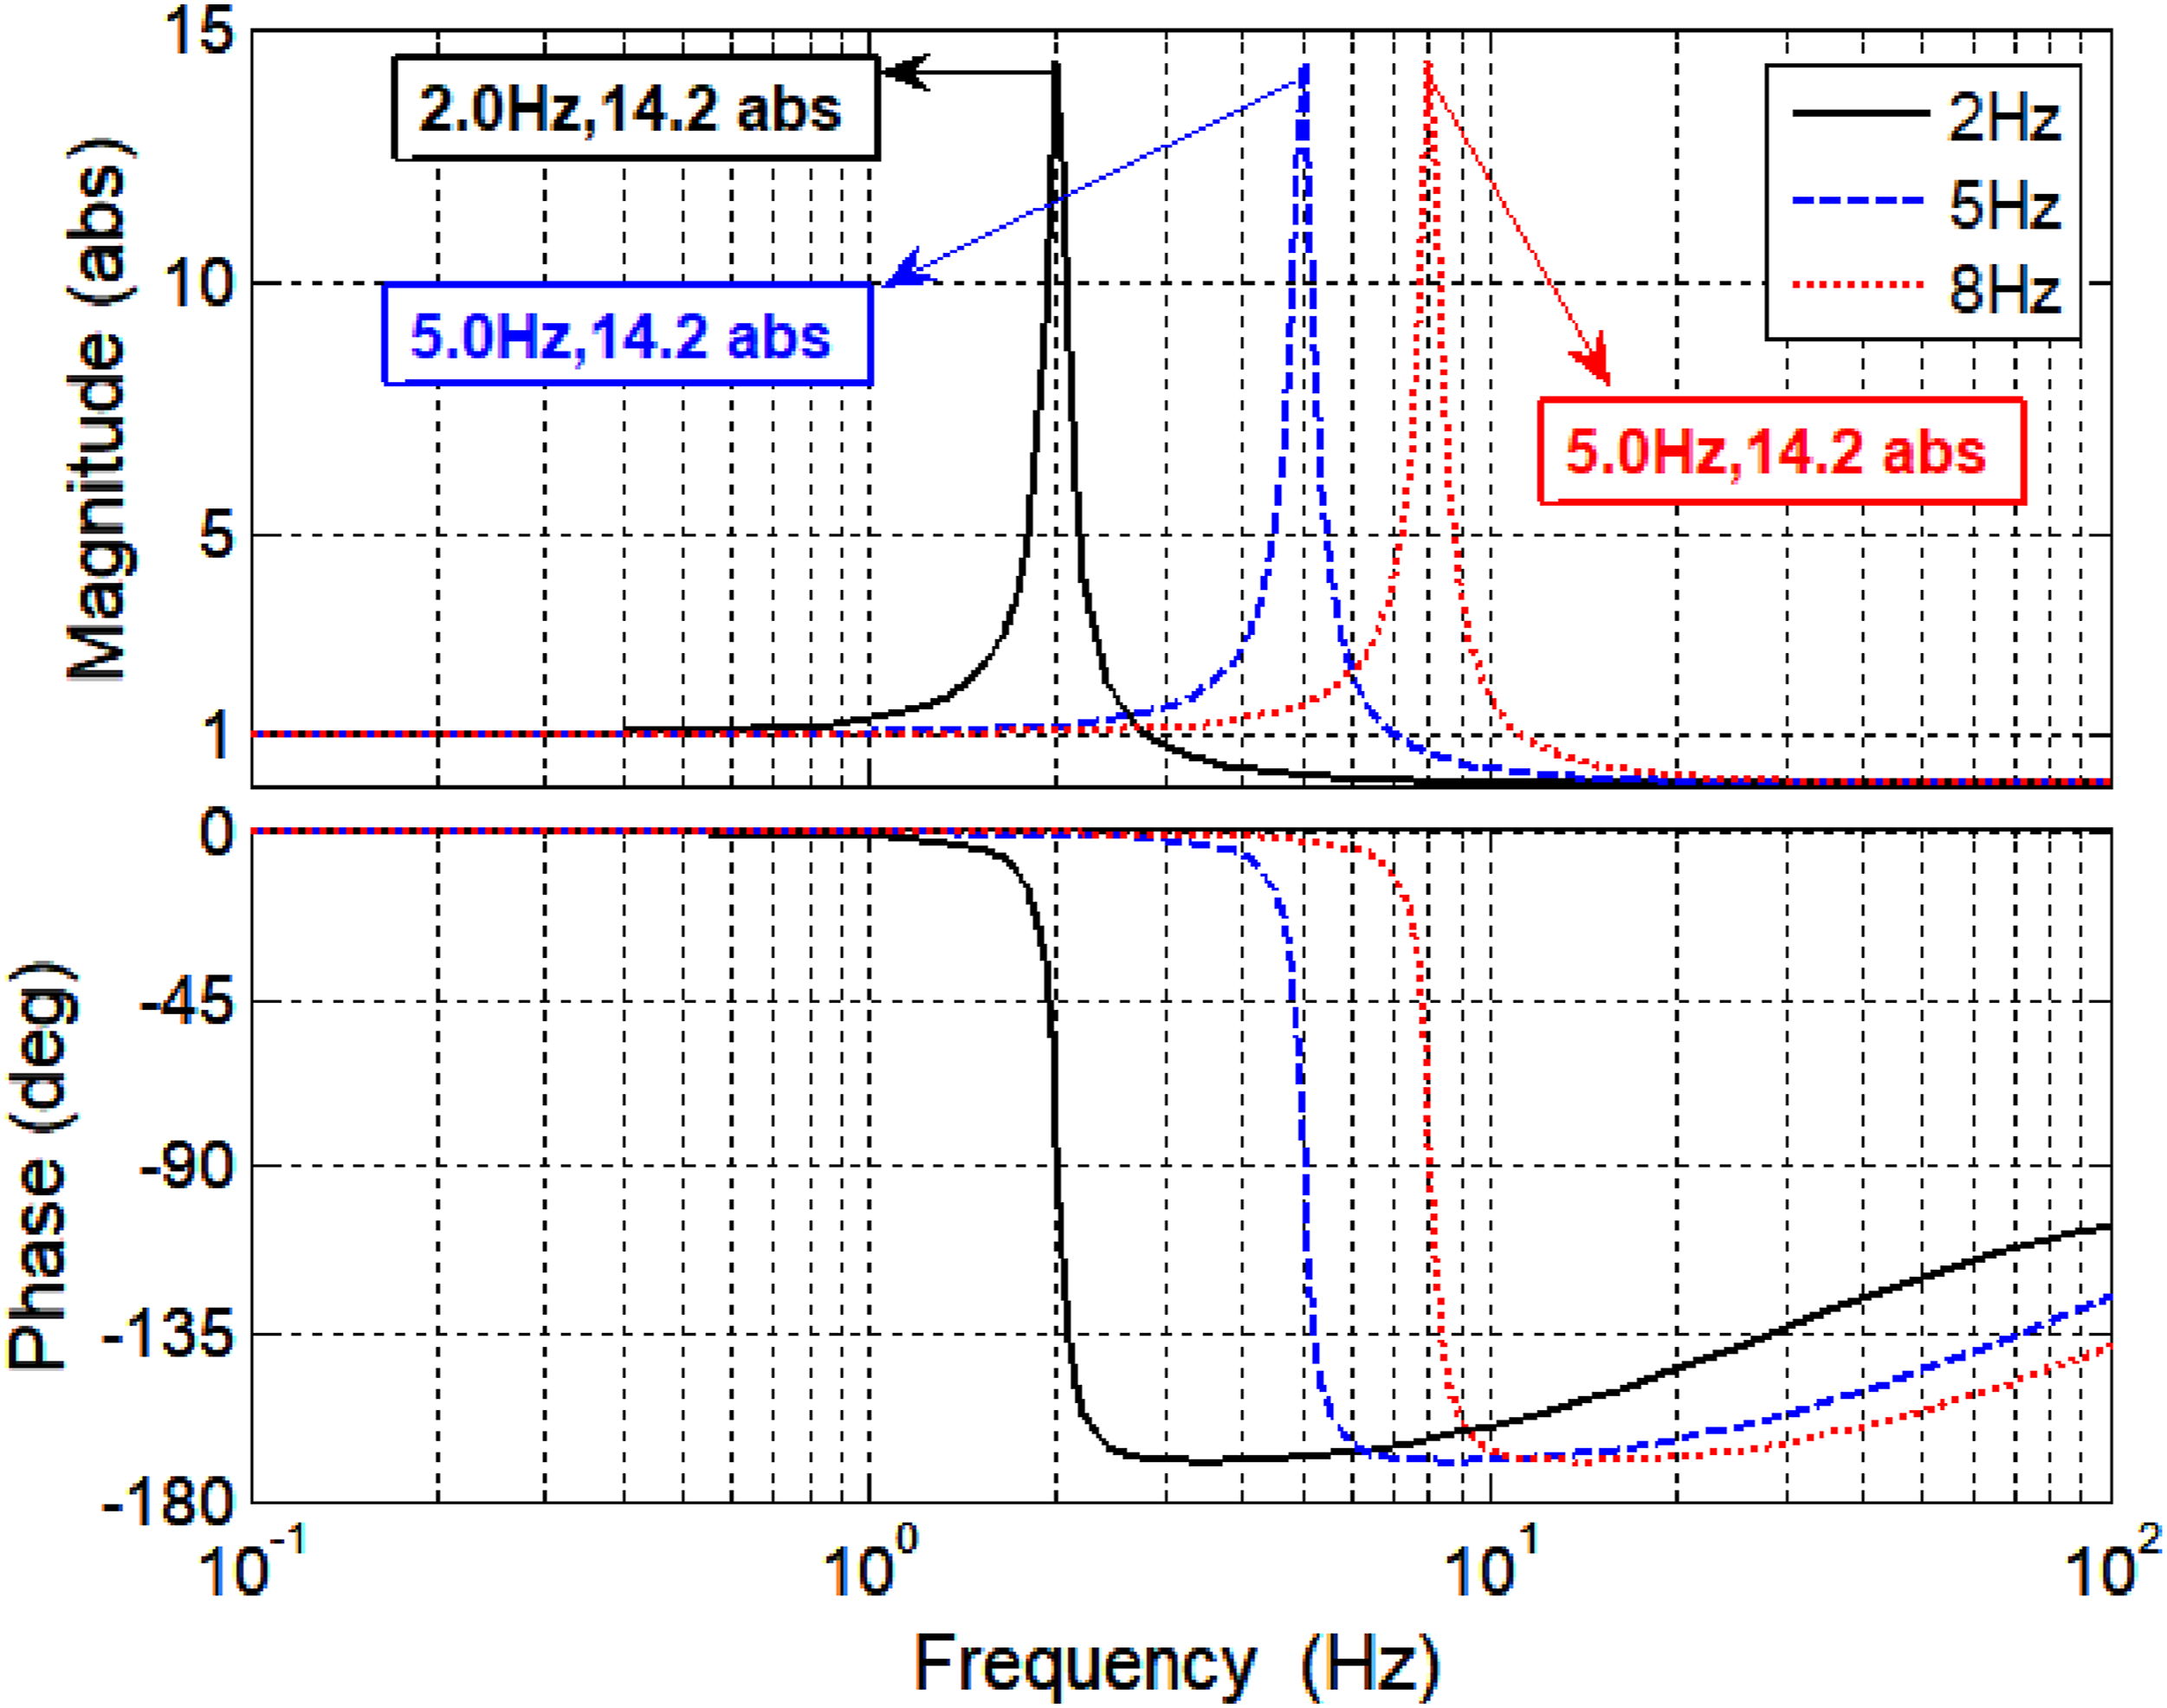
In addition, the analysis of the above data shows that the accurate test data can be obtained without considering the STTSI effect on shaking table output. In other words, without considering the STTSI, we can obtain the real response of structure by taking the output of shaking table as the input of structure.
Analysis of shaking table out effect
According to the equations (15) and (16), it can be seen that the structural mass affects the shaking table output. Therefore, we used test structure mass as a quantification to investigate the effect of the shaking table output on the seismic response of structure. In condition 3, the mass ratio of the test structure to the shaking table array was 0.5 (6000/12000), the structural damping ratio was 0.02, the structural frequency was 8 Hz, and the reference signal was 3 times compressed EL-Centro ground motion record.
The output of shaking table was regarded as the input of test structure, and the seismic response of test structure is shown in Figure 5. As can be seen from Figure 5, the structural test response is larger than theoretical response due to the interaction. For further observation and comparison, we intercepted the structural test response at 3.1–3.3 s and quantitatively analysed the response. In the time range of 3.16–3.17 s, the structural theoretical response is Response of test structure.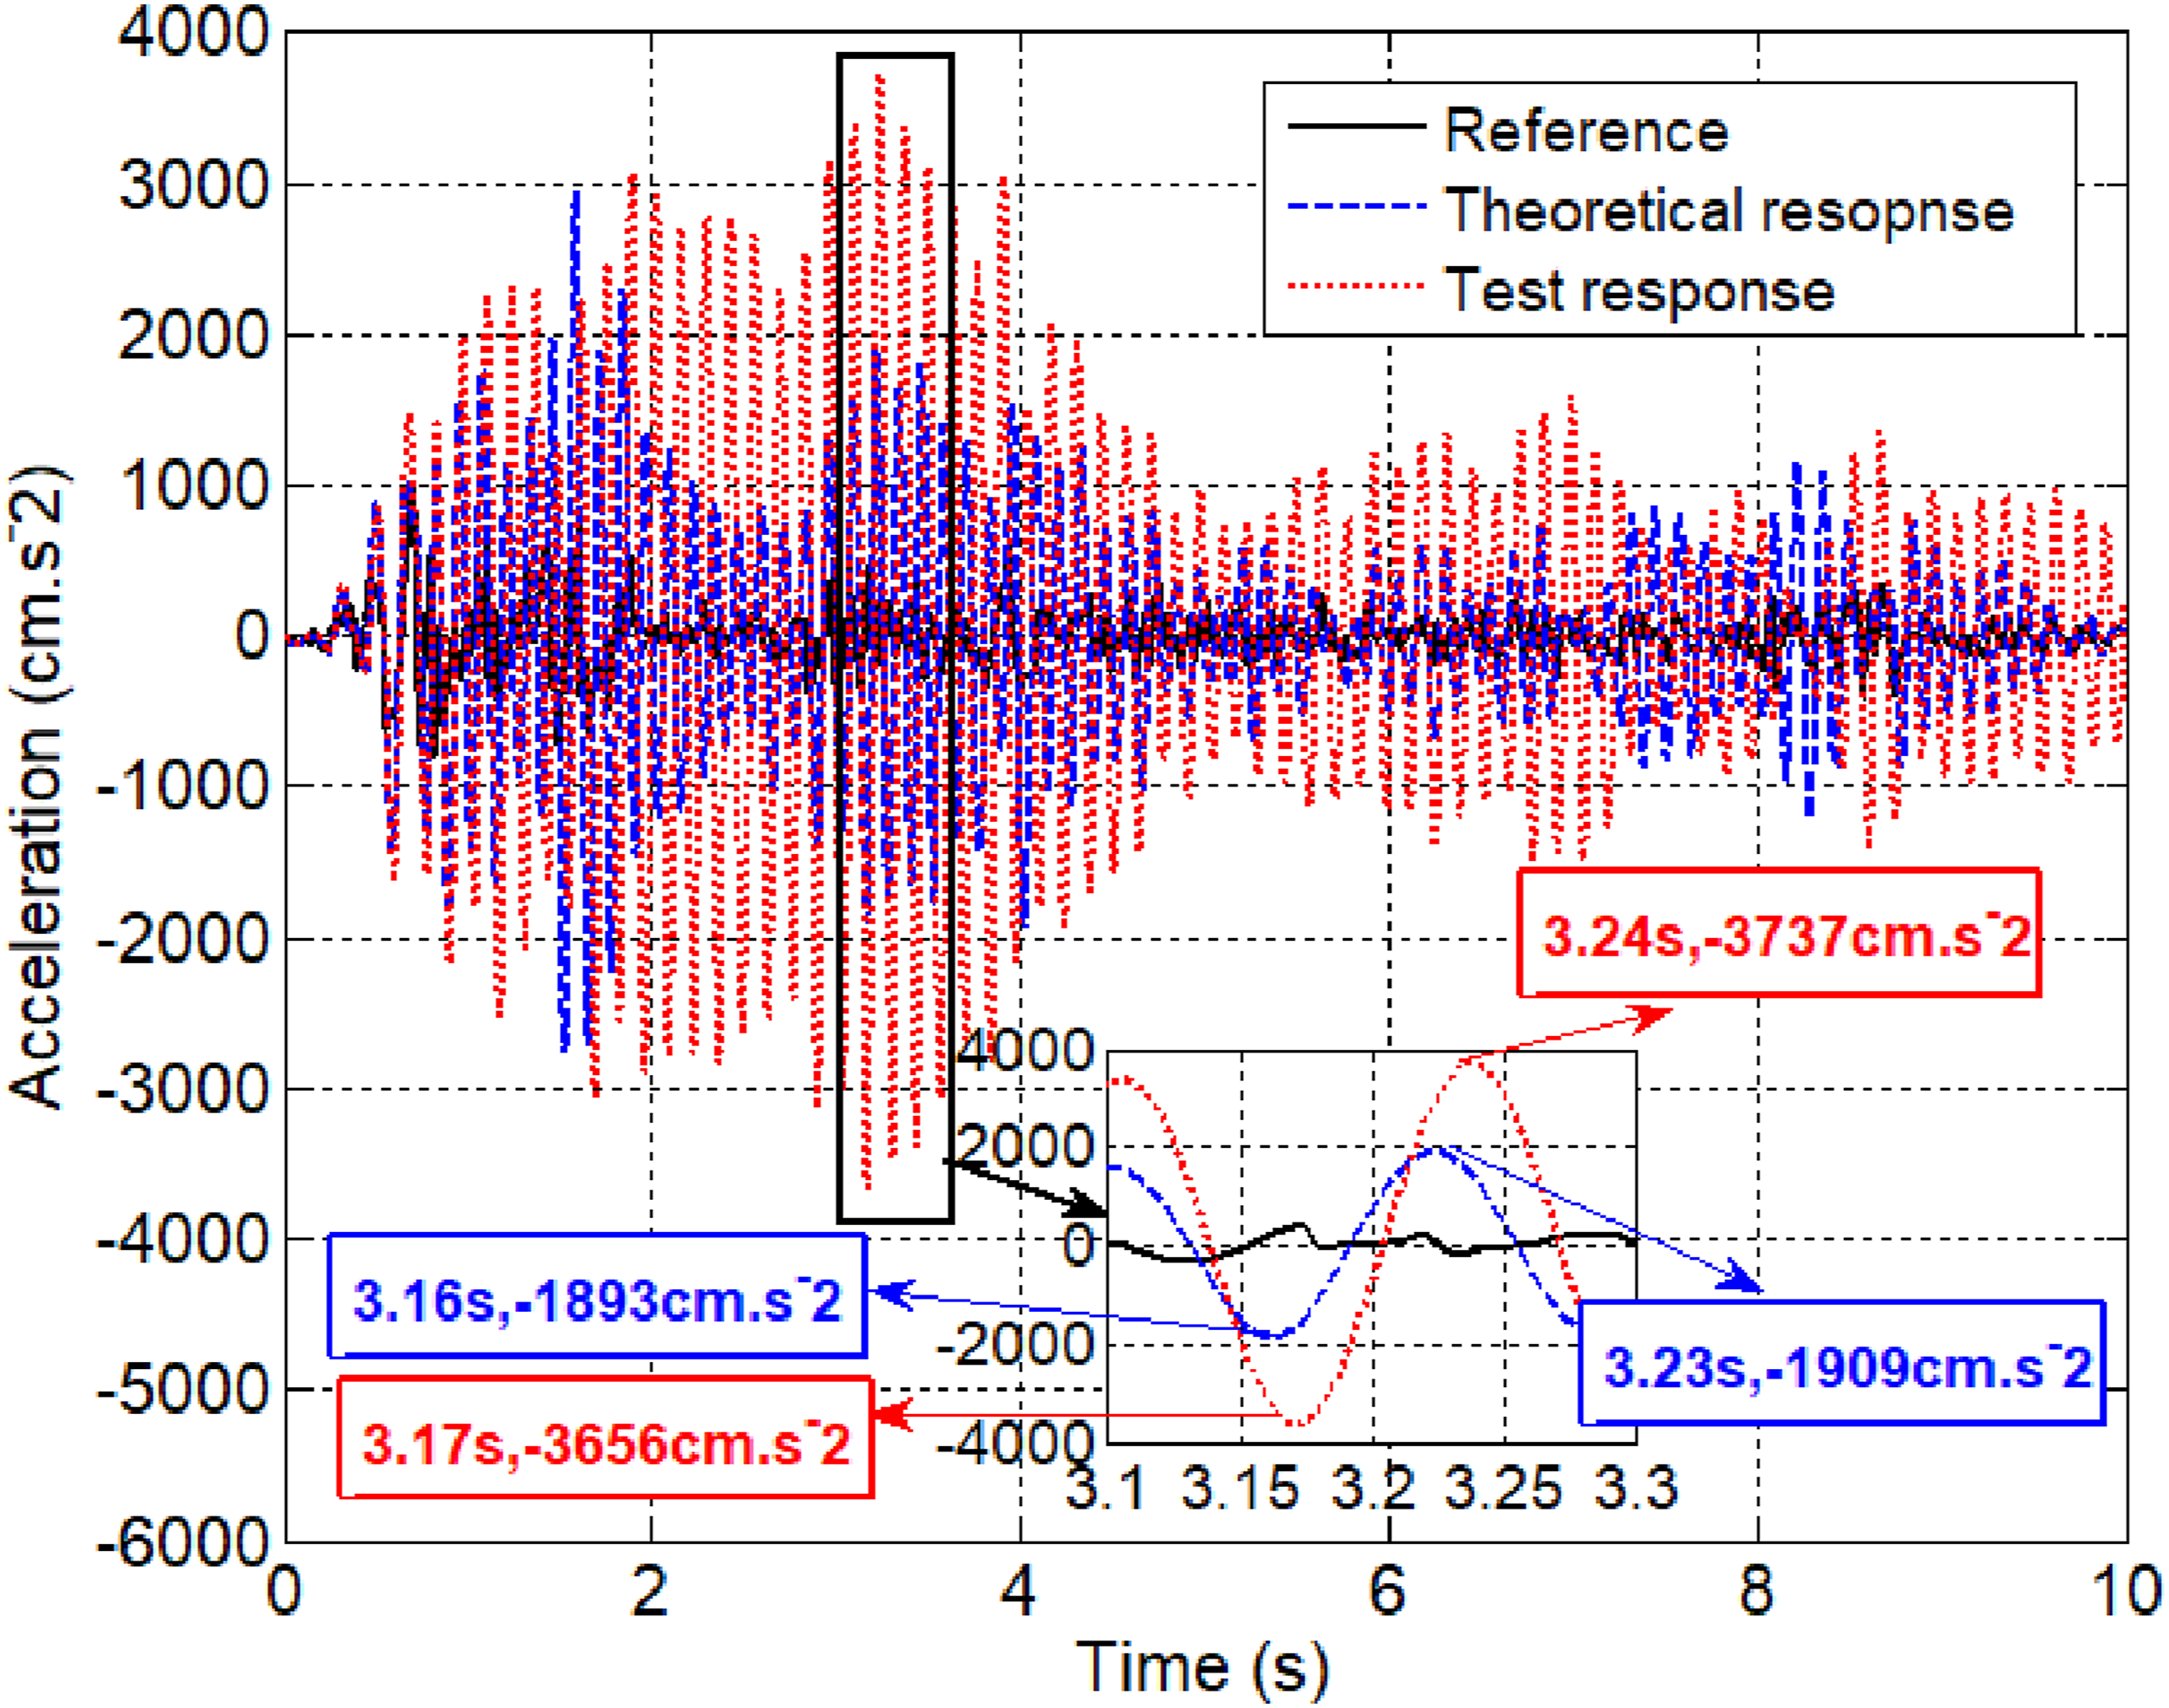
In order to analyse the impact of the method that taking shaking table output as the input of test structure more comprehensively, the structural seismic response in frequency domain was analysed. The analysis is shown in Figure 6. As can be seen from Figure 6, at 7.5 Hz, the Fourier amplitude of structural theoretical response is Spectrum analysis of structural seismic response.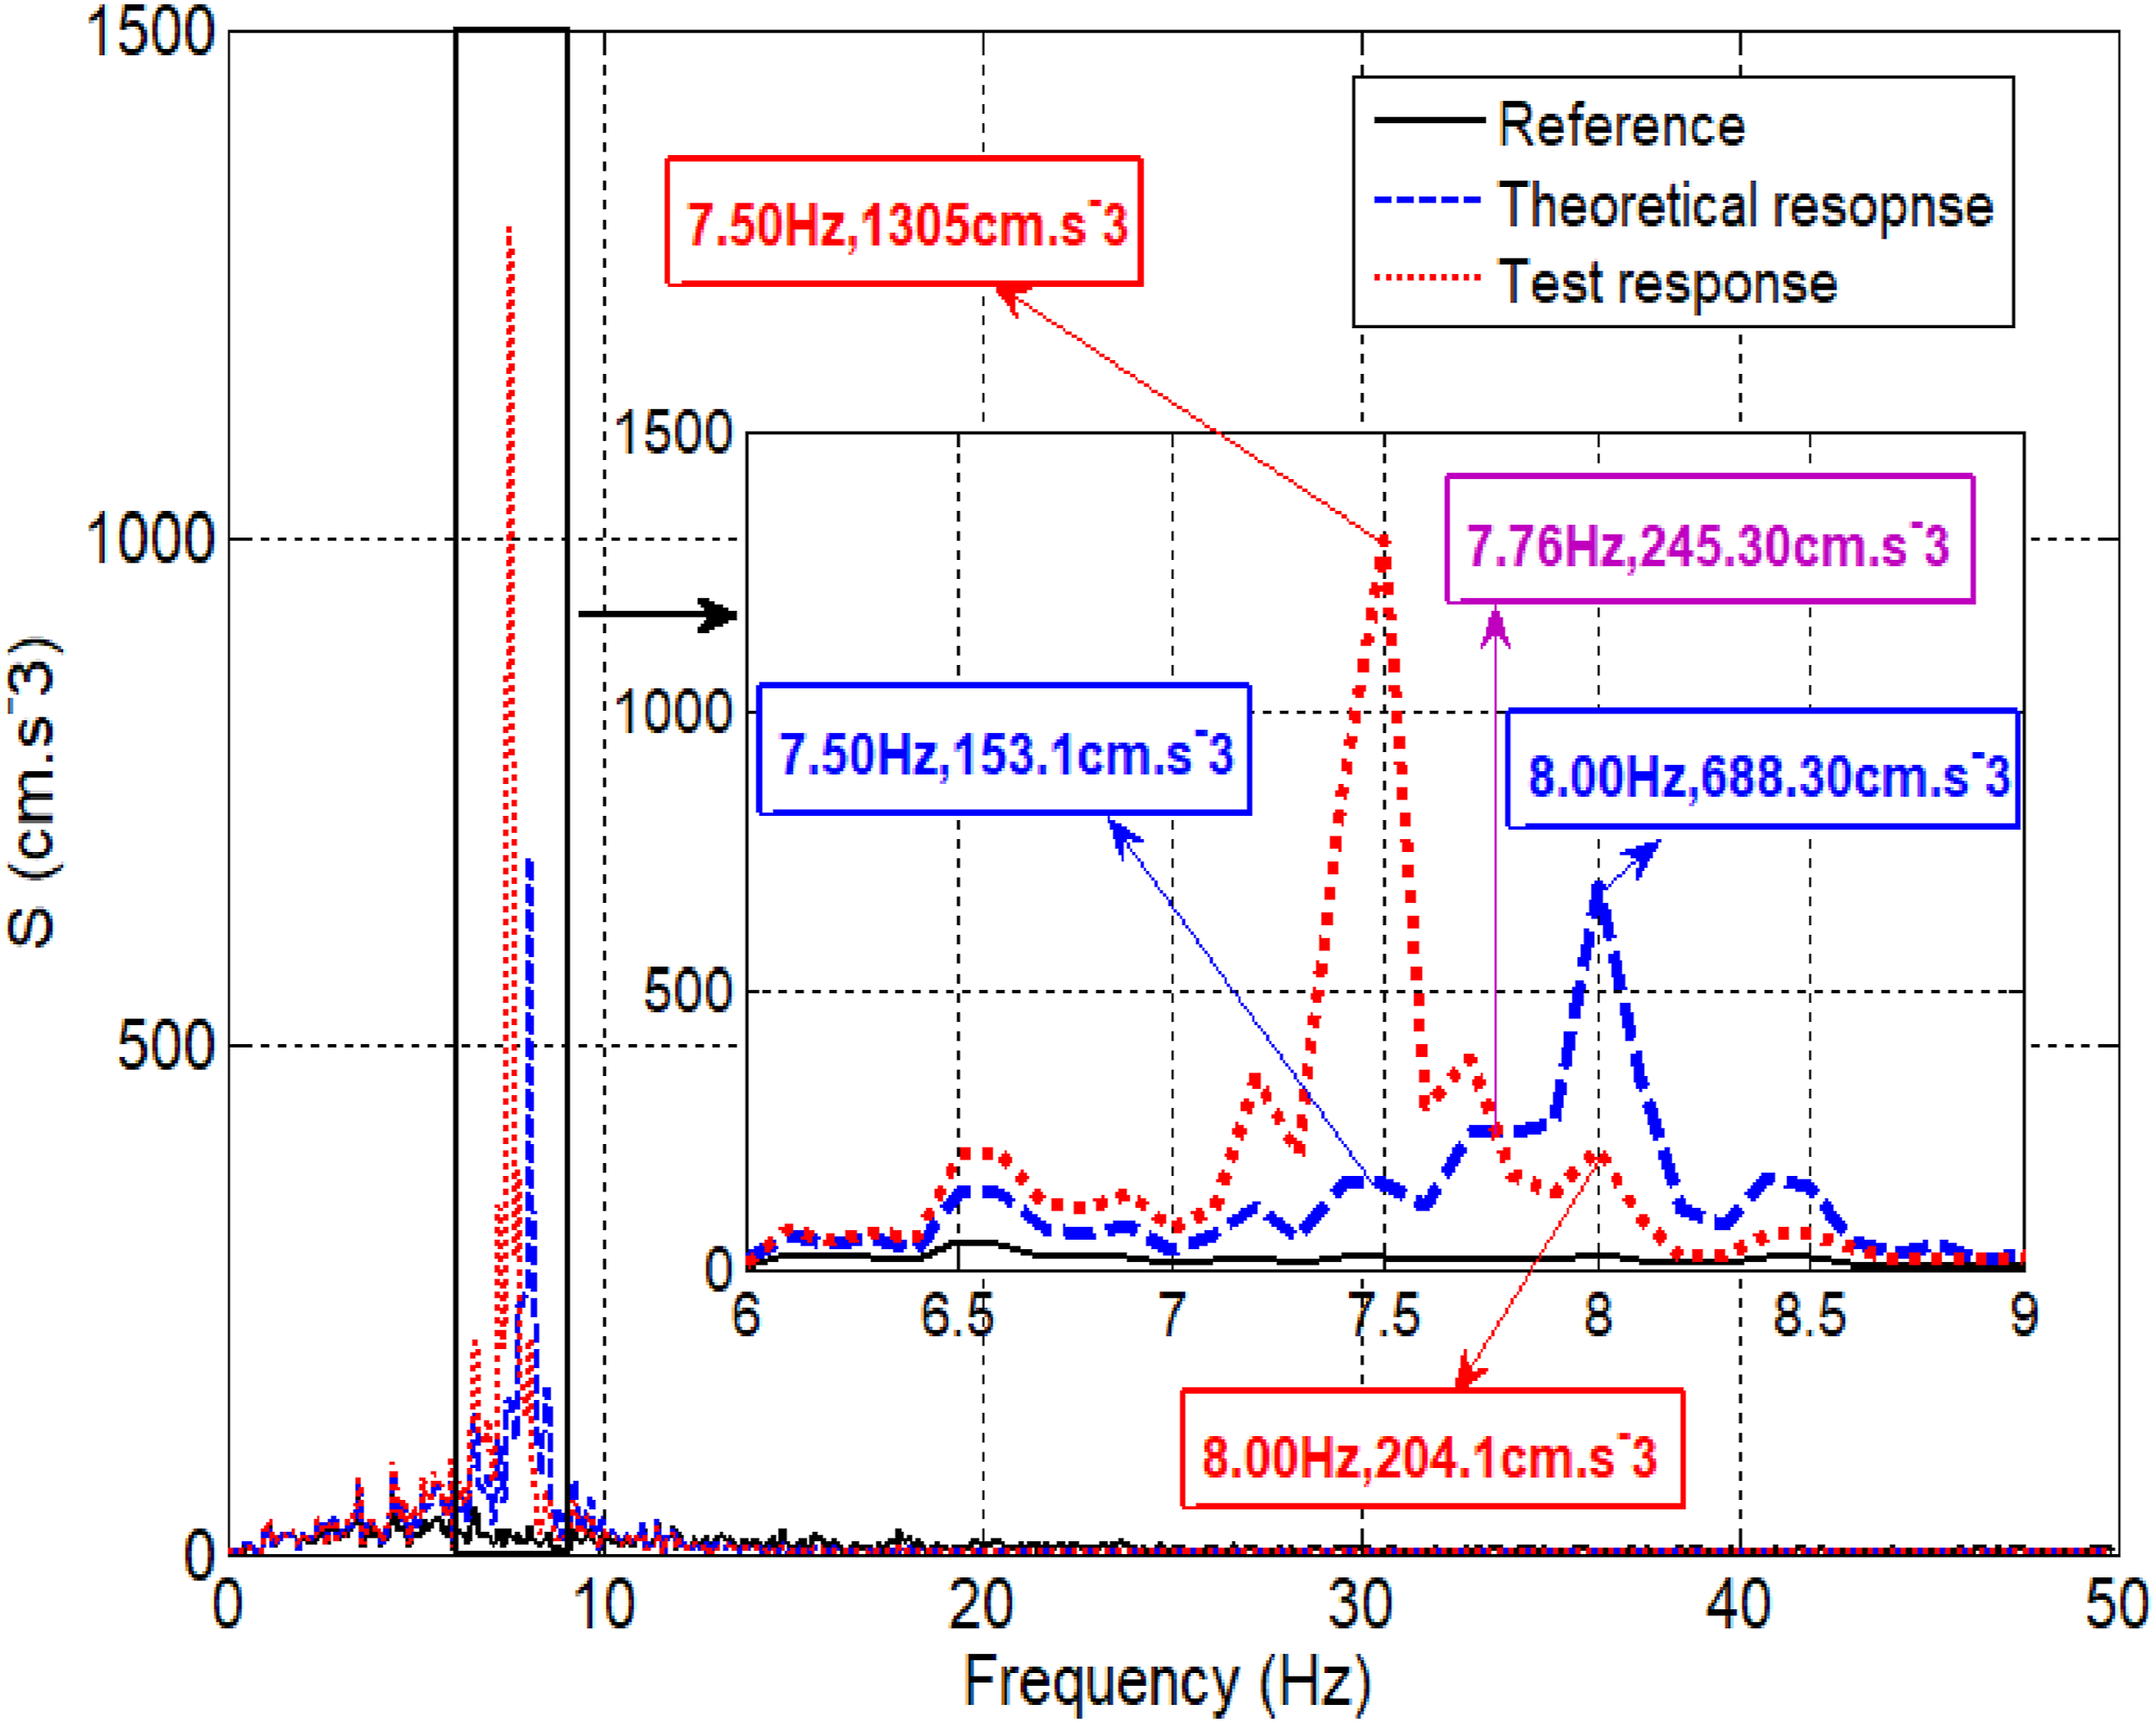
Based on the above time and frequency domain analyses, it can be concluded that the output of shaking table will cause structural test response to increase or decrease in different frequency bands, and the measured frequency of the structure will be smaller than the actual value. If the shaking table output is considered, the method of taking shaking table output as the input of structure cannot obtain the true response of structure.
STTSI effects on shaking table performance
Analysis of ground motion record and shaking table output
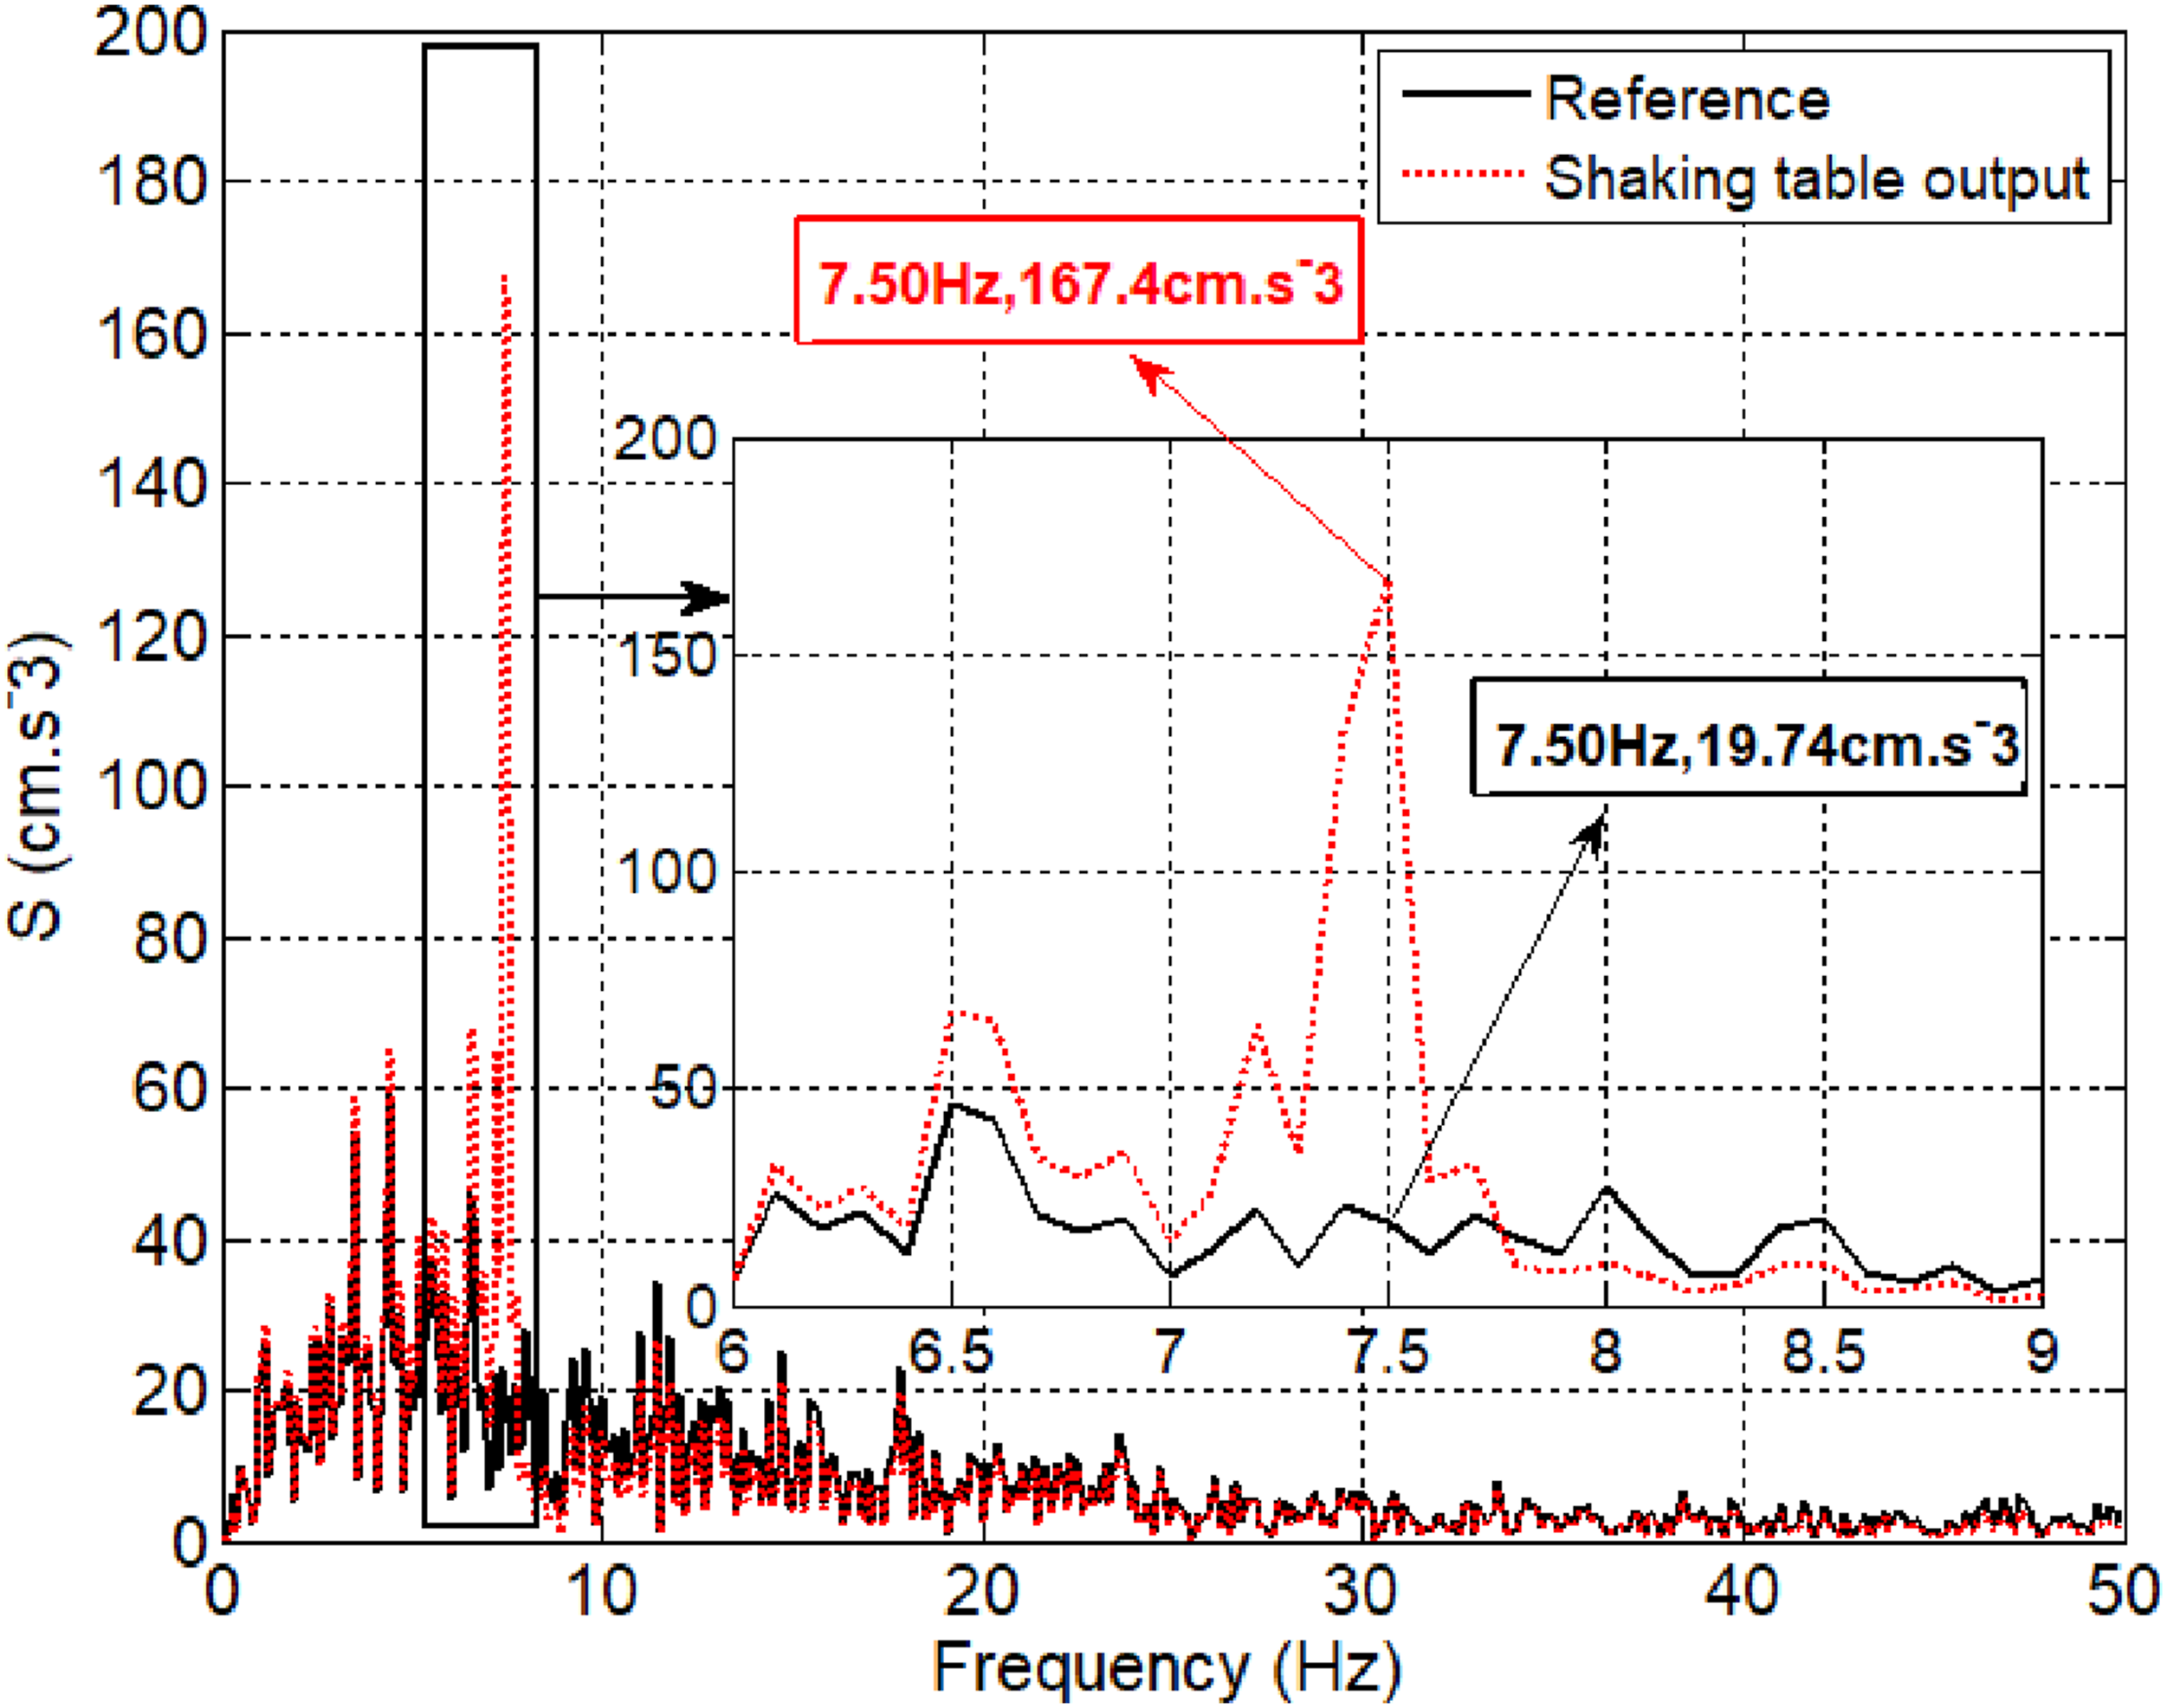
To further analyse the reasons for the deviation of structural test response due to shaking table output, a comparative analysis of ground motion record and shaking table output was performed. The ground motion record and shaking table output analysis are given in Figure 7. The Fourier spectra of the ground motion record and the shaking table output are given in Figure 8. Ground motion record and shaking table output. Spectrum analysis of ground motion and shaking table output.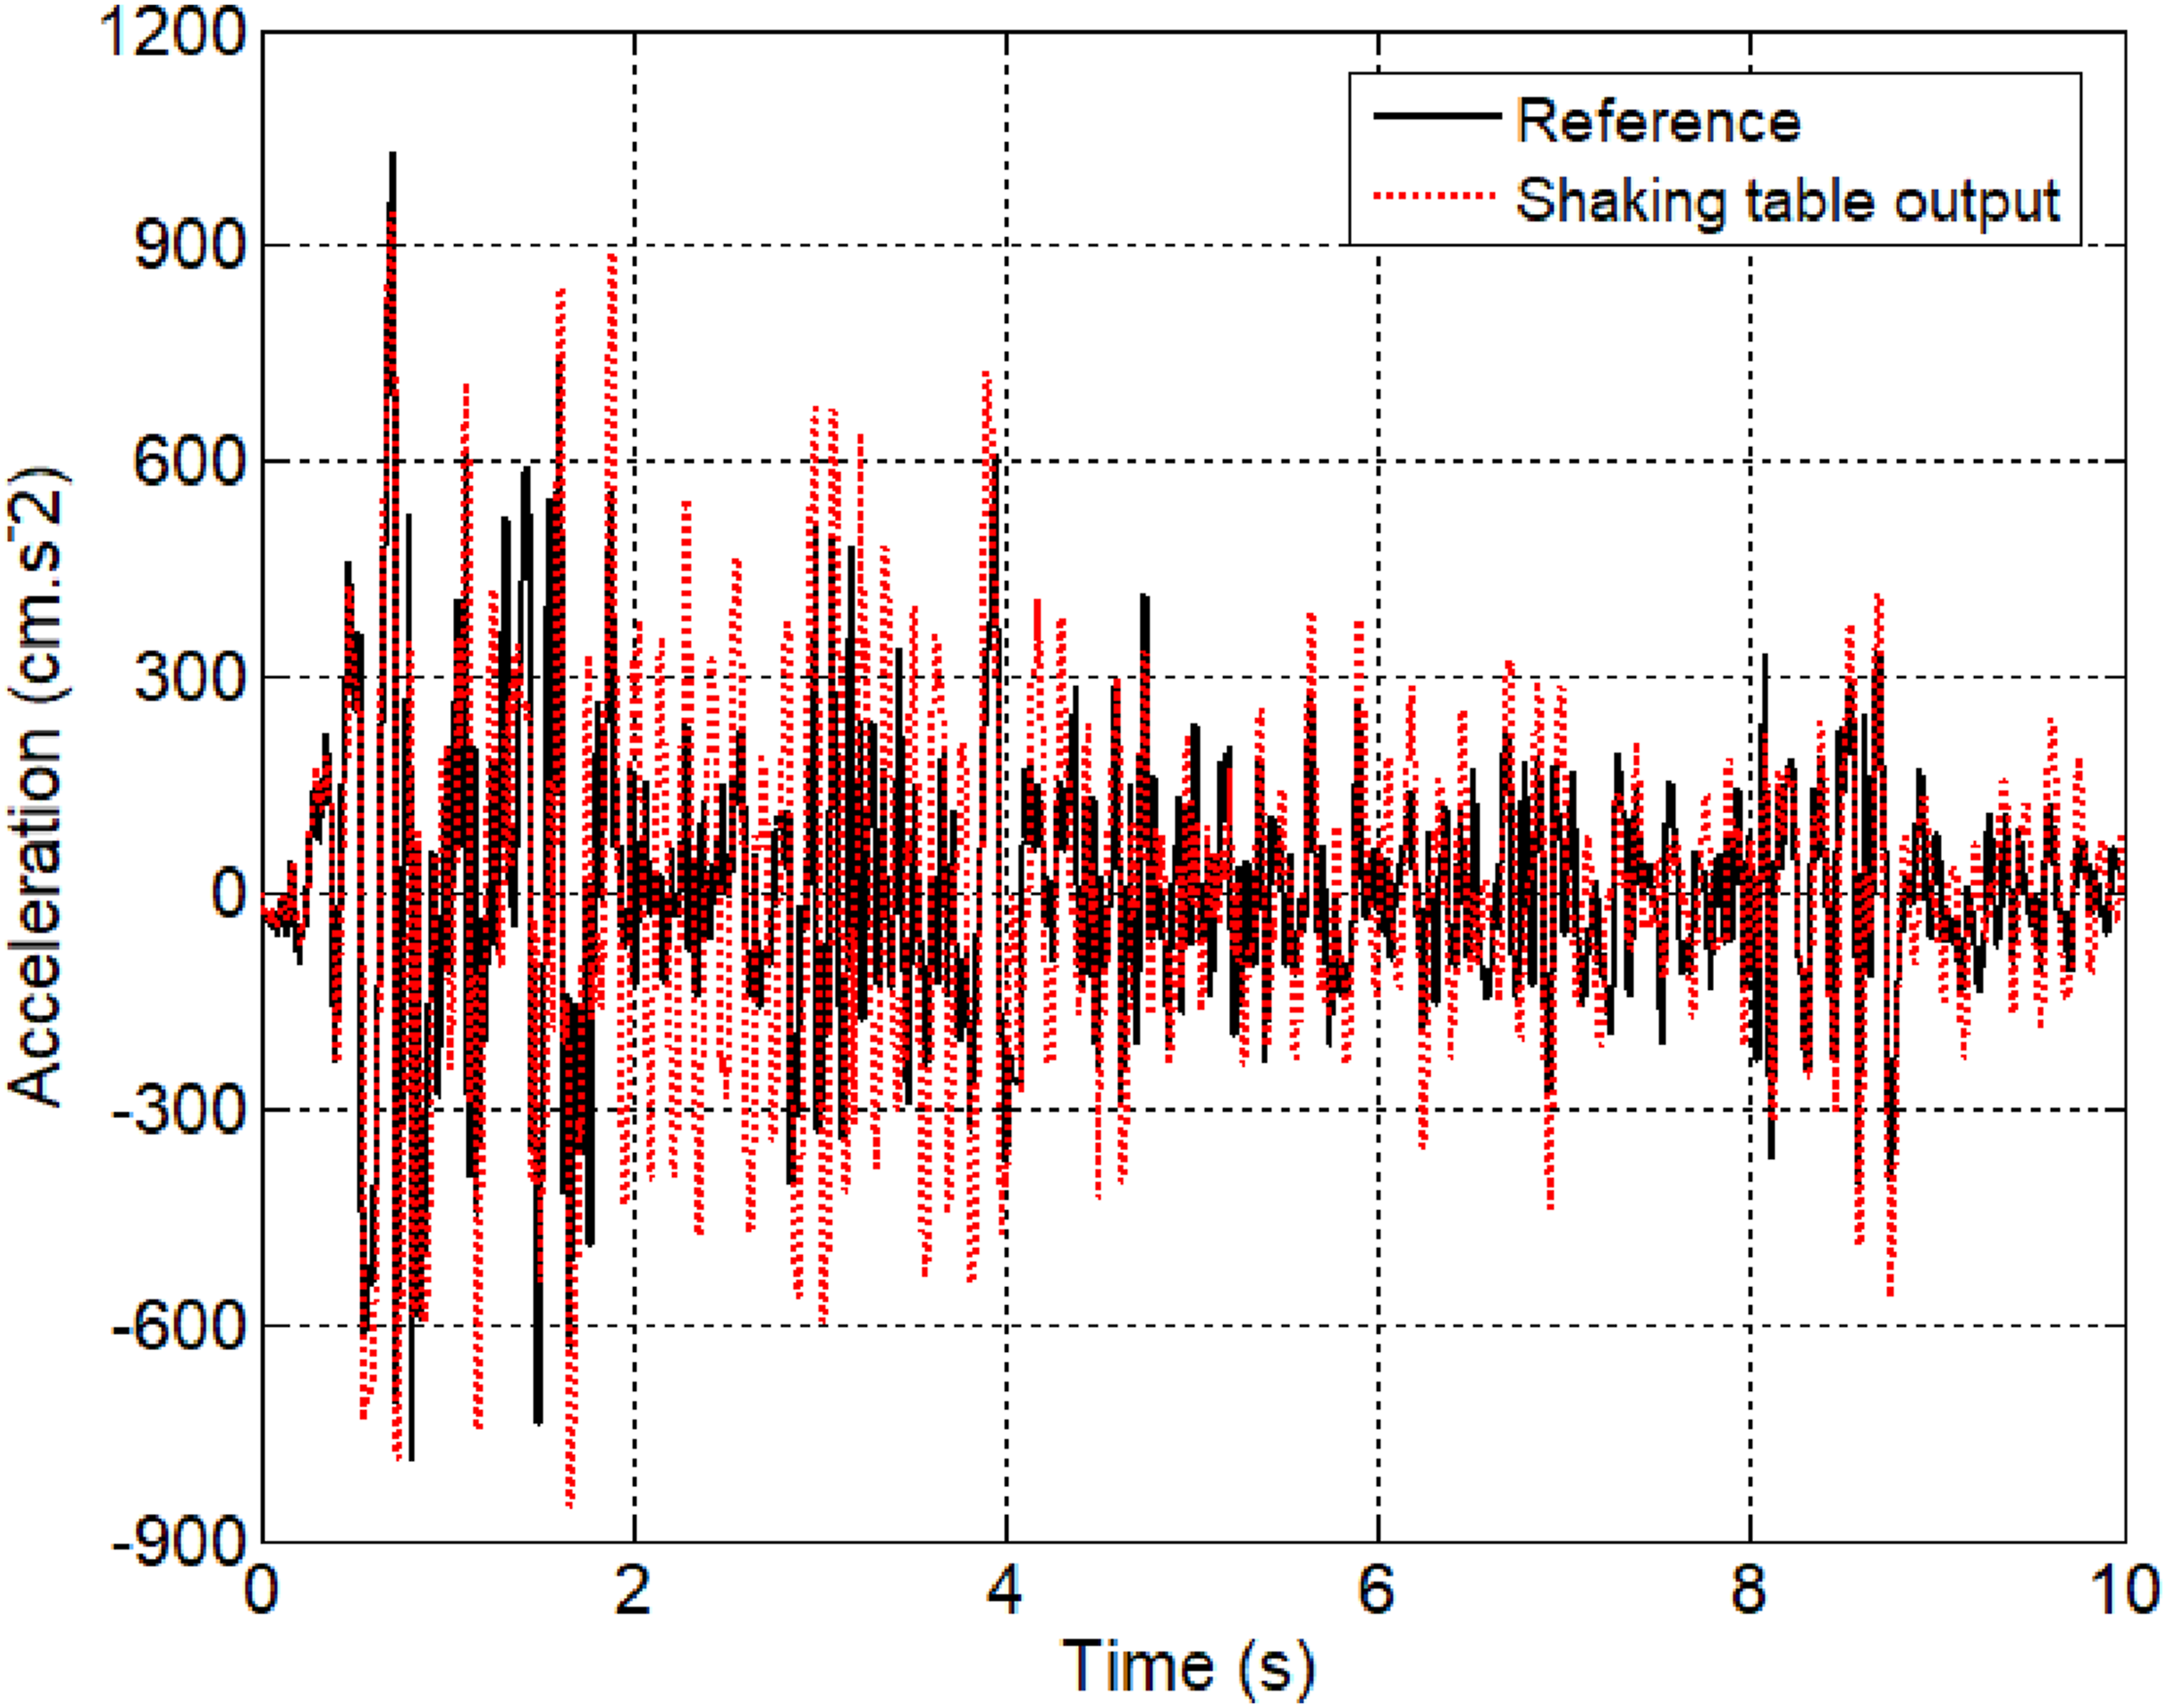
The ground motion record and shaking table output signals are given in Figure 7. It can be seen from Figure 7 that there are some differences between the shaking table output and ground motion record. The correlation coefficient between the ground motion record and the shaking table output is 67.92%, the maximum value of the error is
To fully analyse the differences between the ground motion record and the shaking table output at different frequency bands, the Fourier transforms of the two signals are given in Figure 8. It can be seen from Figure 8 that, at 7.5 Hz, the Fourier spectral amplitude of shaking table output is
By analysing the ground motion record and shaking table output, it can be seen that the shaking table output is quite different from the ground motion records.
Analysis of shaking table control
To eliminate the effect of the properties of the ground motion record and draw more generalized conclusions, The STTSI effects on shaking table control performance in the frequency domain were analysed. The shaking table spectral characteristics are shown in Figure 9. Control performance of shaking table.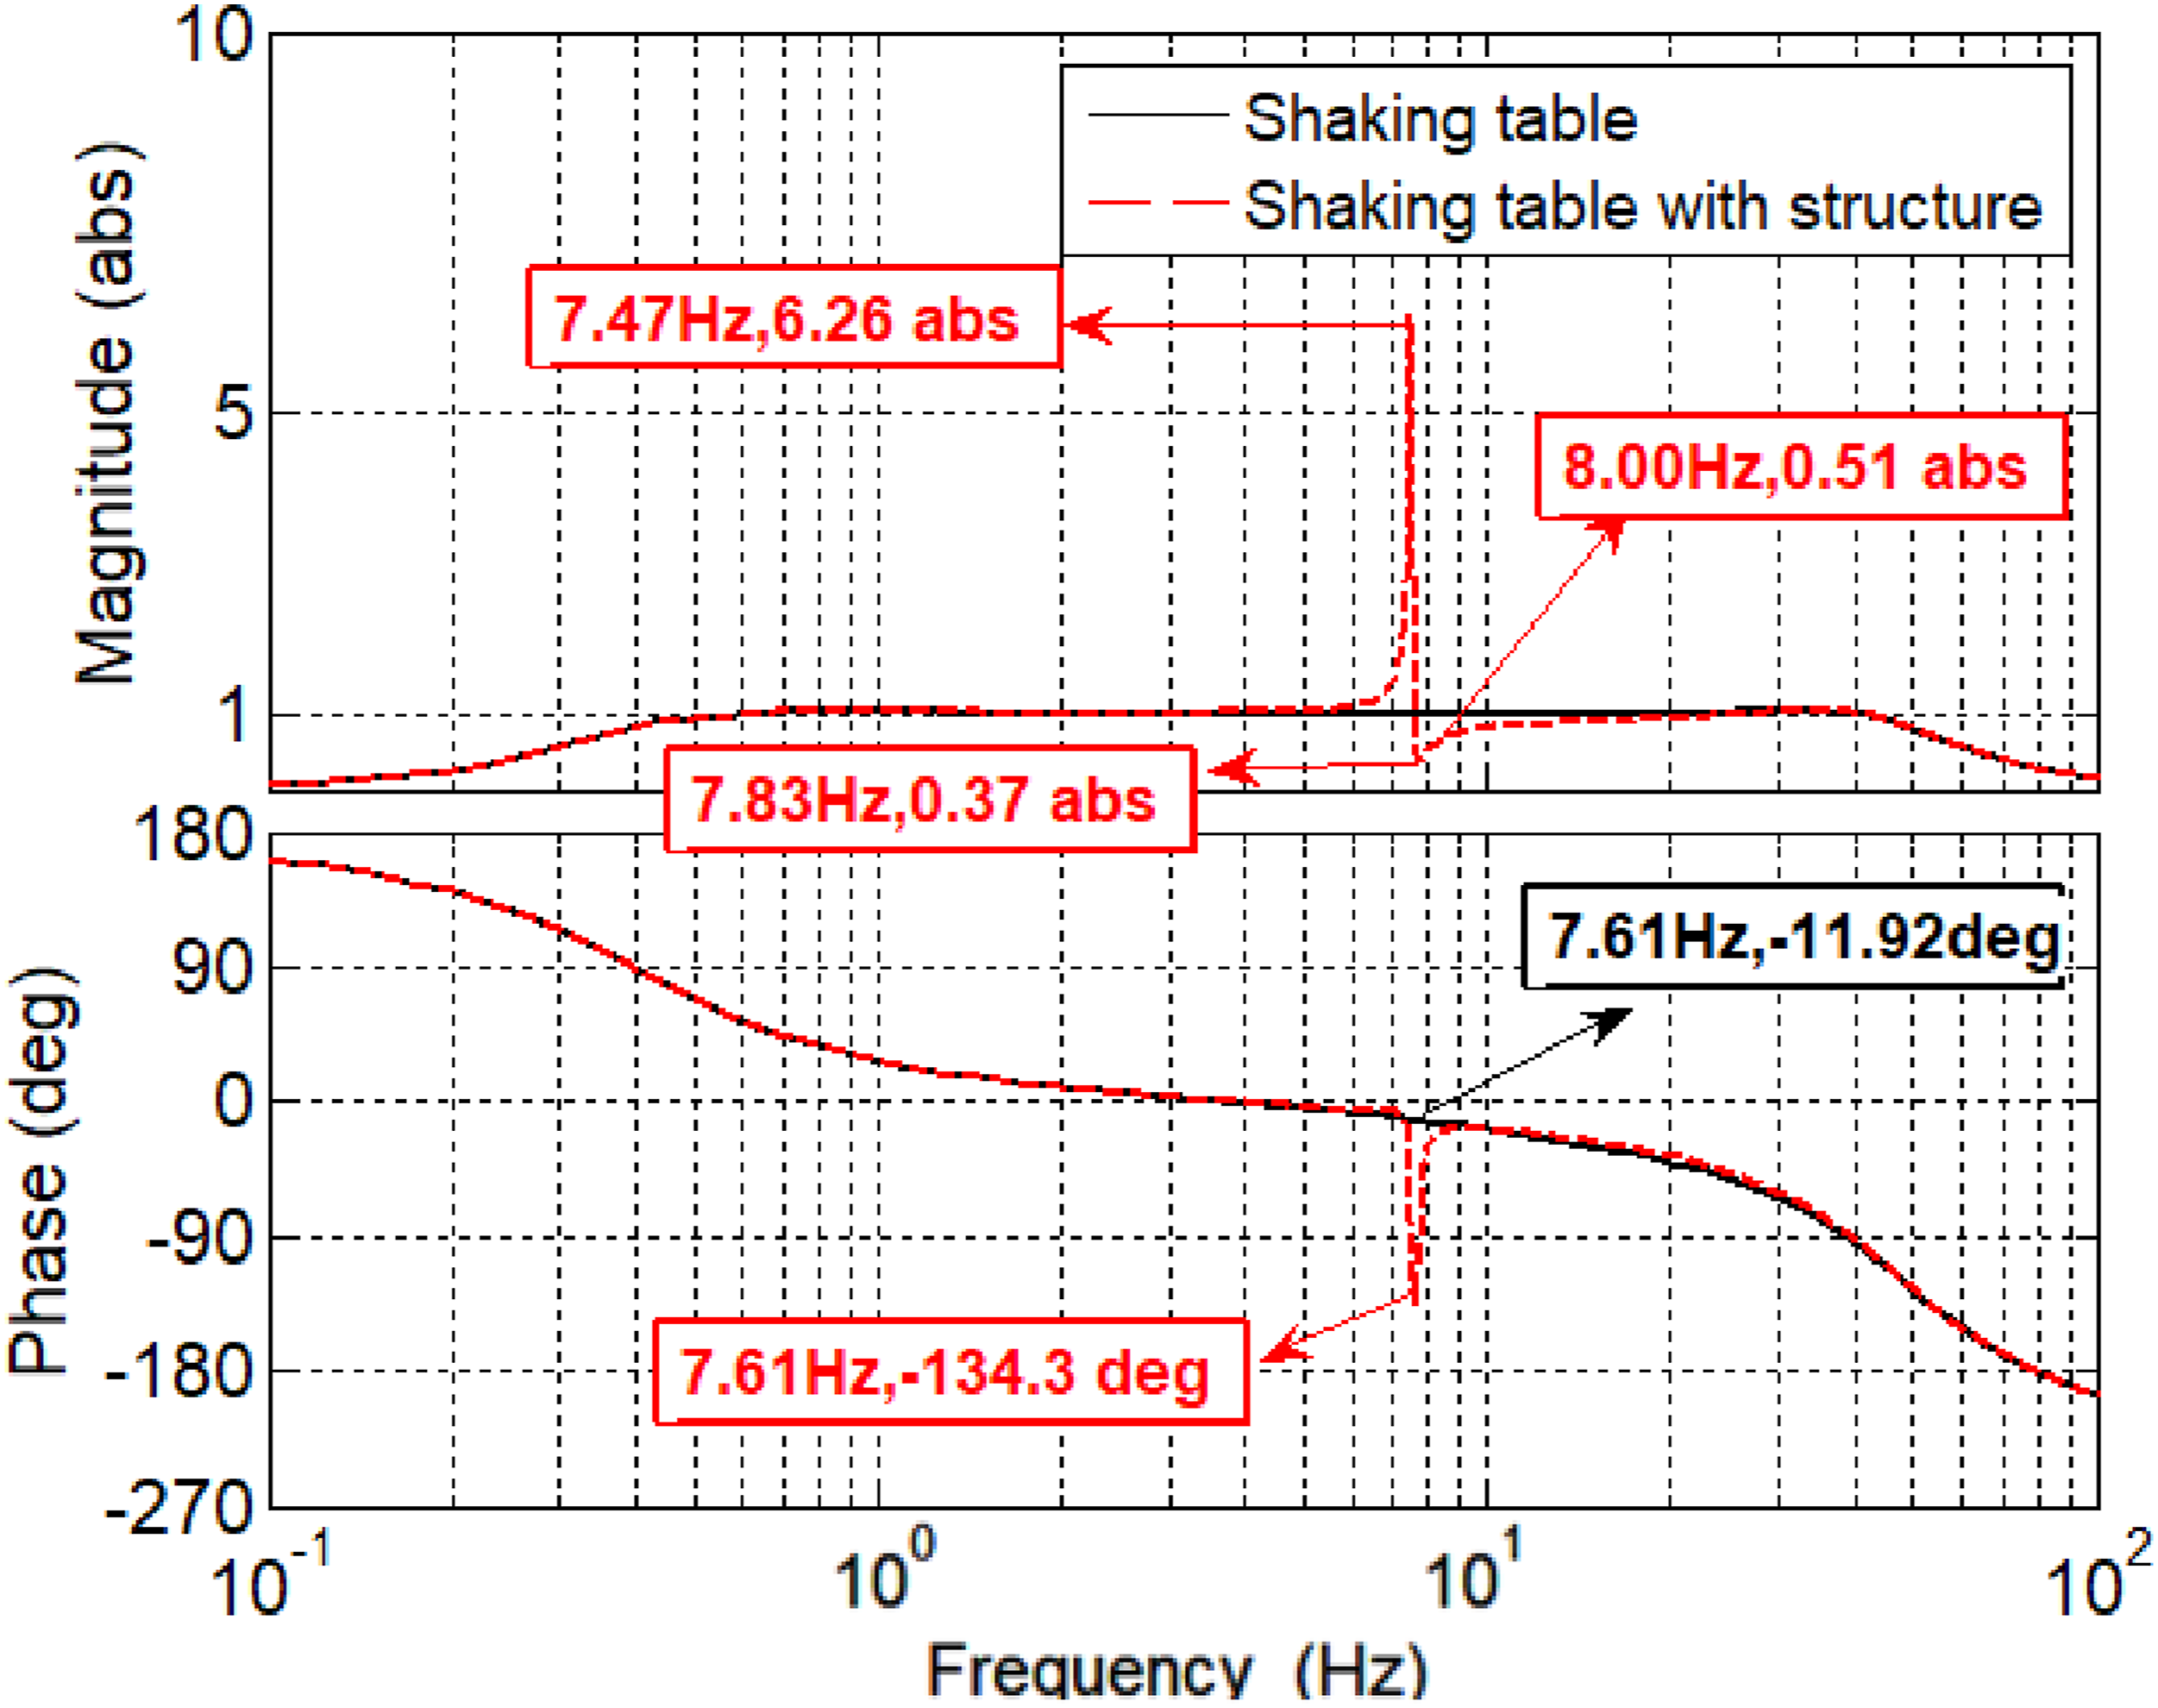
It can be seen from Figure 9 that the value of the amplitude frequency characteristic of shaking table is 6.26 abs at 7.47 Hz, 0.37 abs at 7.83 Hz, and 0.51 abs at 8.00 Hz. Based on the above data, peak-notch effect occurs at structure frequency and its surrounding frequency bands, where the peaks are 16.92 times as large as the notch, and at structure frequency, the output is 0.5 times as much as the input. The above analysis shows that the STTSI leads to large errors of the output of shaking table at structure frequency and its surrounding frequency bands. That is to say, the STTSI will result in a large error at the key frequency band range in the shaking table test.
In addition, Figure 9 shows that, at 7.61 Hz, the phase is −11.92° under no load condition, and the phase is −134.3° under load condition. Based on the above data, it can be concluded that at 7.61 Hz there exists 122.38° phase lag, which means that the output of shaking table will have a hysteresis of more than 90°. The hysteresis in phase will adversely affect the accuracy of shaking table test and structure itself.
Based on analysis of the input and output of shaking table, it can be concluded that the amplitude and the phase frequency characteristics of ground motion record have changed significantly. Thus, the amplitude and the phase frequency characteristics of the excitation to test structure are not consistent with those of the target ground vibration.
Conclusions
To study the STTSI mechanism of shaking table and test structure, this paper establishes a refined model of shaking table array-test structure. Based on the model, an in-depth investigation was conducted to find the influence of damping ratio, frequency, and shaking table output, which are the key factors affecting the accuracy of shaking table test. The most important conclusions are as follows: 1. When the STTSI can be ignored, the method of taking shaking table output as the excitation of structure can obtain the true response of structure, and the accuracy of the shaking test can be ensured. 2. When the STTSI cannot be ignored, the measured structure frequency is less than 6.3% of the true value of structure frequency. At the same time, the structure seismic response is amplified 8.5 times as much as theoretical response or reduced to 29.7% of the theoretical response. 3. Under the influence of the STTSI, the shaking table amplitude–frequency characteristic is amplified 5.26 times and phase–frequency characteristic exists 122.38° hysteresis at structure frequency and its surrounding frequency bands. The spectral errors can adversely affect the acquisition of accurate response of structure. 4. The signal from ground motion to shaking table output and then to structural seismic response has changed greatly under the influence of the STTSI. Compared with the ground motion signal, the amplitude and the phase frequency characteristics of shaking table output signal has changed significantly. That is to say, the excitation to test structure is not consistent with target ground motion anymore. 5. In practical shaking table test, shaking table with large platform mass can be used to reduce STTSI. And compensating control strategy can also improve the control performance of shaking table and the accuracy of shaking table test, so as to obtain accurate structure seismic response.
Footnotes
Declaration of Conflicting Interests
The author(s) declared no potential conflicts of interest with respect to the research, authorship, and/or publication of this article.
Funding
The author(s) disclosed receipt of the following financial support for the research, authorship, and/or publication of this article: The National Natural Science Foundation of China under Grant No. 52208221 and the Opening Project of the Key Laboratory of the Beijing University of Technology (2021B01) supported this work.