
Abstract
Measuring the sound absorption coefficient in a small reverberation room below the Schroeder frequency is a challenging task and the results are subject to a high degree of uncertainty. Recent research shows that the low-frequency acoustic properties of the enclosure and the test sample should be characterized by quantities that describe the modal sound field. The aim of this paper is to present a method for estimating the absorption coefficient of a test sample at modal frequencies in the low frequency range and to demonstrate its applicability in a small room. The hybrid inverse approach is based on eigenvalue measurement data coupled with a finite element model to estimate the sound-absorbing properties of a small room and the test sample. The method was tested experimentally and the results were consistent with those of the long impedance tube method. The applicability of the proposed method was further demonstrated by the in-situ characterization of different acoustic samples in the low frequency range.
Keywords
Introduction
Traditionally, the sound-absorbing properties of materials are characterized by the diffuse sound absorption coefficient, which is evaluated using standardized measurement techniques in a large volume reverberation chamber.1,2 Despite the reliability of standard measurements, they are often deemed costly due to the necessity for large samples, a substantial reverberation room (V > 170 m3), and a time-intensive measurement procedure.3,4 For this reason, reverberation rooms with a small volume are considered a cost-effective and environmentally friendly alternative. They can be used to perform random incidence sound absorption measurements using test methods that follow the recommendations of the Society of Automotive Engineers (SAE), 5 which were originally developed for measurements in rooms with a volume of 6 m3 to 25 m3.
The determination of the diffuse sound absorption coefficients in a small-volume reverberation room is based on the evaluation of reverberation time in 1/3 octave frequency bands with and without a test sample present in the room.1,4,5 Reverberation time is determined from the measured sound decay curves at different microphone positions. The gathered data are spatially averaged and used to calculate the frequency-dependent diffuse sound absorption coefficients at random incidence, following Sabine’s formula.6,7
Previous research has shown that small rooms can successfully be used to evaluate the diffuse sound absorption coefficients of porous materials in the 400 Hz–5000 Hz frequency range4,8–11 and thin rigid materials in the 1000 Hz–5000 Hz range. 4 Consequently, small-volume reverberation rooms have become an integral part of acoustics laboratories, research facilities, and development departments.
The primary disadvantages of small-volume rooms include the lack of sound field diffusivity, particularly in the low-frequency range,7,9,12–15 and diffraction due to the finite size of the test material known as the edge effect.16,17 The diffusivity of the sound field in the low-frequency range is reduced due to the modal nature of the sound field, that is, standing waves. To address this limitation, recent research has suggested that the acoustic field in the low-frequency range, that is, well below the Schroeder frequency, should be evaluated in terms of quantities that describe the modal sound field and the resonant nature of the sound.18–20 Specifically, in the low-frequency range, the decay time of individual modes is the preferred quantity. The modal decay time (Tm) is defined as the time required for the sound wave energy at the modal frequency to decay from the initial value by ΔL dB, where ΔL is a range of an energy decay curve (on a logarithmic scale) calculated from a microphone sound pressure signal. In practice, different ΔL values can be chosen, with ΔL = 10 dB, 20 dB, or 30 dB being the most commonly used.15,19 The decay time is a global parameter related to the room damping and does not depend strongly on the microphone position unless the position is chosen near the node, 21 where the uncertainty is higher due to the low signal-to-noise ratio. The decay time can be evaluated from room response signal using different methods operating in the time, 19 frequency,18,22 or time-frequency 20 domains where the microphone is placed in a corner of the room.
The modal sound field can be effectively studied using computational methods based on wave theory including the boundary element method (BEM), 23 the finite-difference time-domain method (FDTD),24,25 the modal expansion method (MEM),26,27 and the finite element method (FEM)28,29 which is considered as a benchmark method. Craggs 30 used FEM to show that modal decay time fluctuates depending on mode type and discovered that when absorbing surfaces are present, the decay rates are smallest for the axial modes and greatest for the oblique modes. Easwaran and Craggs 31 used FEM to show that the efficiency of damping depends on the placement of the absorbing material and proposed that for optimal damping, acoustic treatments should be located at points of pressure maxima. Further, Tomiku et.al. 32 employed FEM to study the interplay between room shape, sound source placement, and sound field dynamics, while Lau and Powell 29 studied the effect of absorber placement on the sound field. Didier et al. 7 used FEM to explore how room geometry, sound source positioning, and the presence of panel diffusers affect sound absorption values below 300 Hz in a reverberation room. They concluded that a high degree of correlation with diffuse absorption values can be achieved with highly absorbent samples in certain room designs.
The sound-absorbing boundaries can be characterized by real33–35 or complex-valued26,36 impedances, the latter being particularly important for small-volume rooms. 36 The accuracy of the boundary condition data is important for room acoustic predictions.36,37 While numerical calculations are usually based on known impedances, the practical application of calculation models often encounters a hurdle due to the lack of reliable data on the frequency-dependent impedance of surface materials at low frequencies. This lack of data results from the lack of reliable measurement methods for low frequencies. 38
An impedance tube39,40 can be used to measure the frequency-dependent normal impedance of a small, regularly shaped sample. However, for low frequencies and larger samples with irregular shapes, this method can be challenging. For example, the instrument design for the low-frequency impedance tube is subjected to problem-specific construction requirements.40–43
To improve the in-situ characterization of materials in the low-frequency range, methods that merge measured data with the numerical model of the enclosure and the absorbing sample have been introduced.44–46 However, these methods have only been validated numerically, not experimentally.
The aim of this paper is to present a method for characterizing the non-diffuse sound absorption of materials at modal frequencies in the low-frequency range and to demonstrate its applicability in a small room. The approach is based on eigenvalue measurement data of individual modes in combination with a numerical analysis using an eigenvalue FEM model. The decay time of room modes is determined from a measured room impulse response using a Window-Width Optimized Stockwell time-frequency Transform (WWOST) method. The measured data are then coupled with a numerical model and used to evaluate the local reacting surface impedances of room walls and the sample. The complex impedance values are finally used to determine the sound absorption coefficient of the sample. The method was tested experimentally using a 0.1 m thick mineral wool sample and results were compared with the absorption coefficients measured in a long impedance tube. The paper is structured as follows: first, the theoretical background is explained and the method for estimation of absorption coefficient at modal frequencies is presented. In the experimental section, the method is applied in a small test room with a mineral wool sample. The comparison with impedance tube data is then presented and the absorption coefficients at modal frequencies estimated with the hybrid approach for different acoustic samples are discussed. Finally, the conclusions are drawn.
Method
This section presents the method for estimation of sound absorption coefficients of material samples at modal frequencies in a small room. The method couples decay time measurements with FEM simulations. It consists of the following steps: 1. Extraction of the decay times of the acoustic room modes from the measured impulse response of the empty room and the room with a sample. 2. Construction of a numerical eigenvalue model of the empty room and the room with a sample. 3. Estimation of the input impedances and absorption coefficients at modal frequencies by solving an inverse problem for the empty room and the room with a sample.
Extraction of decay time from measured impulse response
In the low-frequency range, the acoustic room impulse response generated by a point source can be approximated by the modified Prony model
47

where A m , φ m , and T m are amplitudes, phases, and decay times of individual modes with modal frequencies denoted by f m . In this study, the decay time T m is the time it takes for the sound pressure level associated with modal frequency f m to decay by 60 dB from the initial value.19,48 The components of the Prony model (equation (1)) can be extracted using different signal processing techniques.19,20 In this study, the modal frequencies and decay times were evaluated using the window width optimized Stockwell transform (WWOST). 49 The details of the procedure can be found in Reference 20. The determination of modal frequencies and decay times using WWOST is performed in four steps:
The impulse response is measured and projected onto a time-frequency plane using the continuous time-frequency Stockwell transform given by equation (2). The Stockwell transform (ST) in WWOST uses a Gaussian window function, where the width of a Gaussian is a function of the frequency f and the scaling parameter γ
50

The parameter γ is chosen based on an optimization procedure where the chosen γ maximizes the energy concentration measure CM.49,51 In real applications, a discrete form of WWOST50,52 is used, where the measurement parameters, including the sampling frequency and the time of the excitation signal, have a significant impact on the measurement result. 21
The time decay function (E
f
) is calculated as the Schroeder integral
53
of ST(t, f, γ) over time for each frequency (f
n
)

The decay function is normalized and converted to the decibel scale, and values between 5 dB and 25 dB below the initial level are used to determine the slope by a least square fit. The slope (k
n
) is used to calculate the decay time for each frequency (f
n
)

The estimated decay times are plotted as a function of frequency f
n
where the decay times associated with individual room modes
Numerical analysis
In the low-frequency range, room dimensions are comparable to the length of the sound wave, and the method best suited for determining the interior sound field is modal analysis.27,44 The modal analysis was performed in the frequency domain using FEM eigenvalue study (COMSOL Multiphysics 5.1). In FEM, the boundaries, including room walls and absorbing samples, are characterized by complex impedances Z or normalized specific acoustic impedances ξ = Z/ρc, which must be provided as input data. The complex impedance boundary condition assumes that the surfaces are locally reacting to the sound pressure and is given by

where n is the normal vector perpendicular to the surface, c is the speed of sound in the air and ρ is the density of air. ξ is a complex quantity (ξ = ξ
r
+ iξ
i
). The real part of ξ is called the normalized resistance ξ
r
, and the imaginary part ξ
i
is called normalized reactance. The real and imaginary parts of the impedance ξ can be used to calculate the absorption coefficient α using the following expression
54

The output of FEM is a set of eigenfunctions and complex eigenvalues denoted as

Estimation of input impedances and absorption coefficients at modal frequencies
The solution determined with the FEM can only represent the observed sound field if realistic boundary conditions are used as input parameters. In this study, the unknown impedances of the room surfaces Graphical representation of the hybrid approach for estimation of sound absorption coefficient α at modal frequencies f
m
using decay time T
m
data and eigenvalue model. RIR = room impulse response, TFA = time-frequency analysis, FEM = finite element method.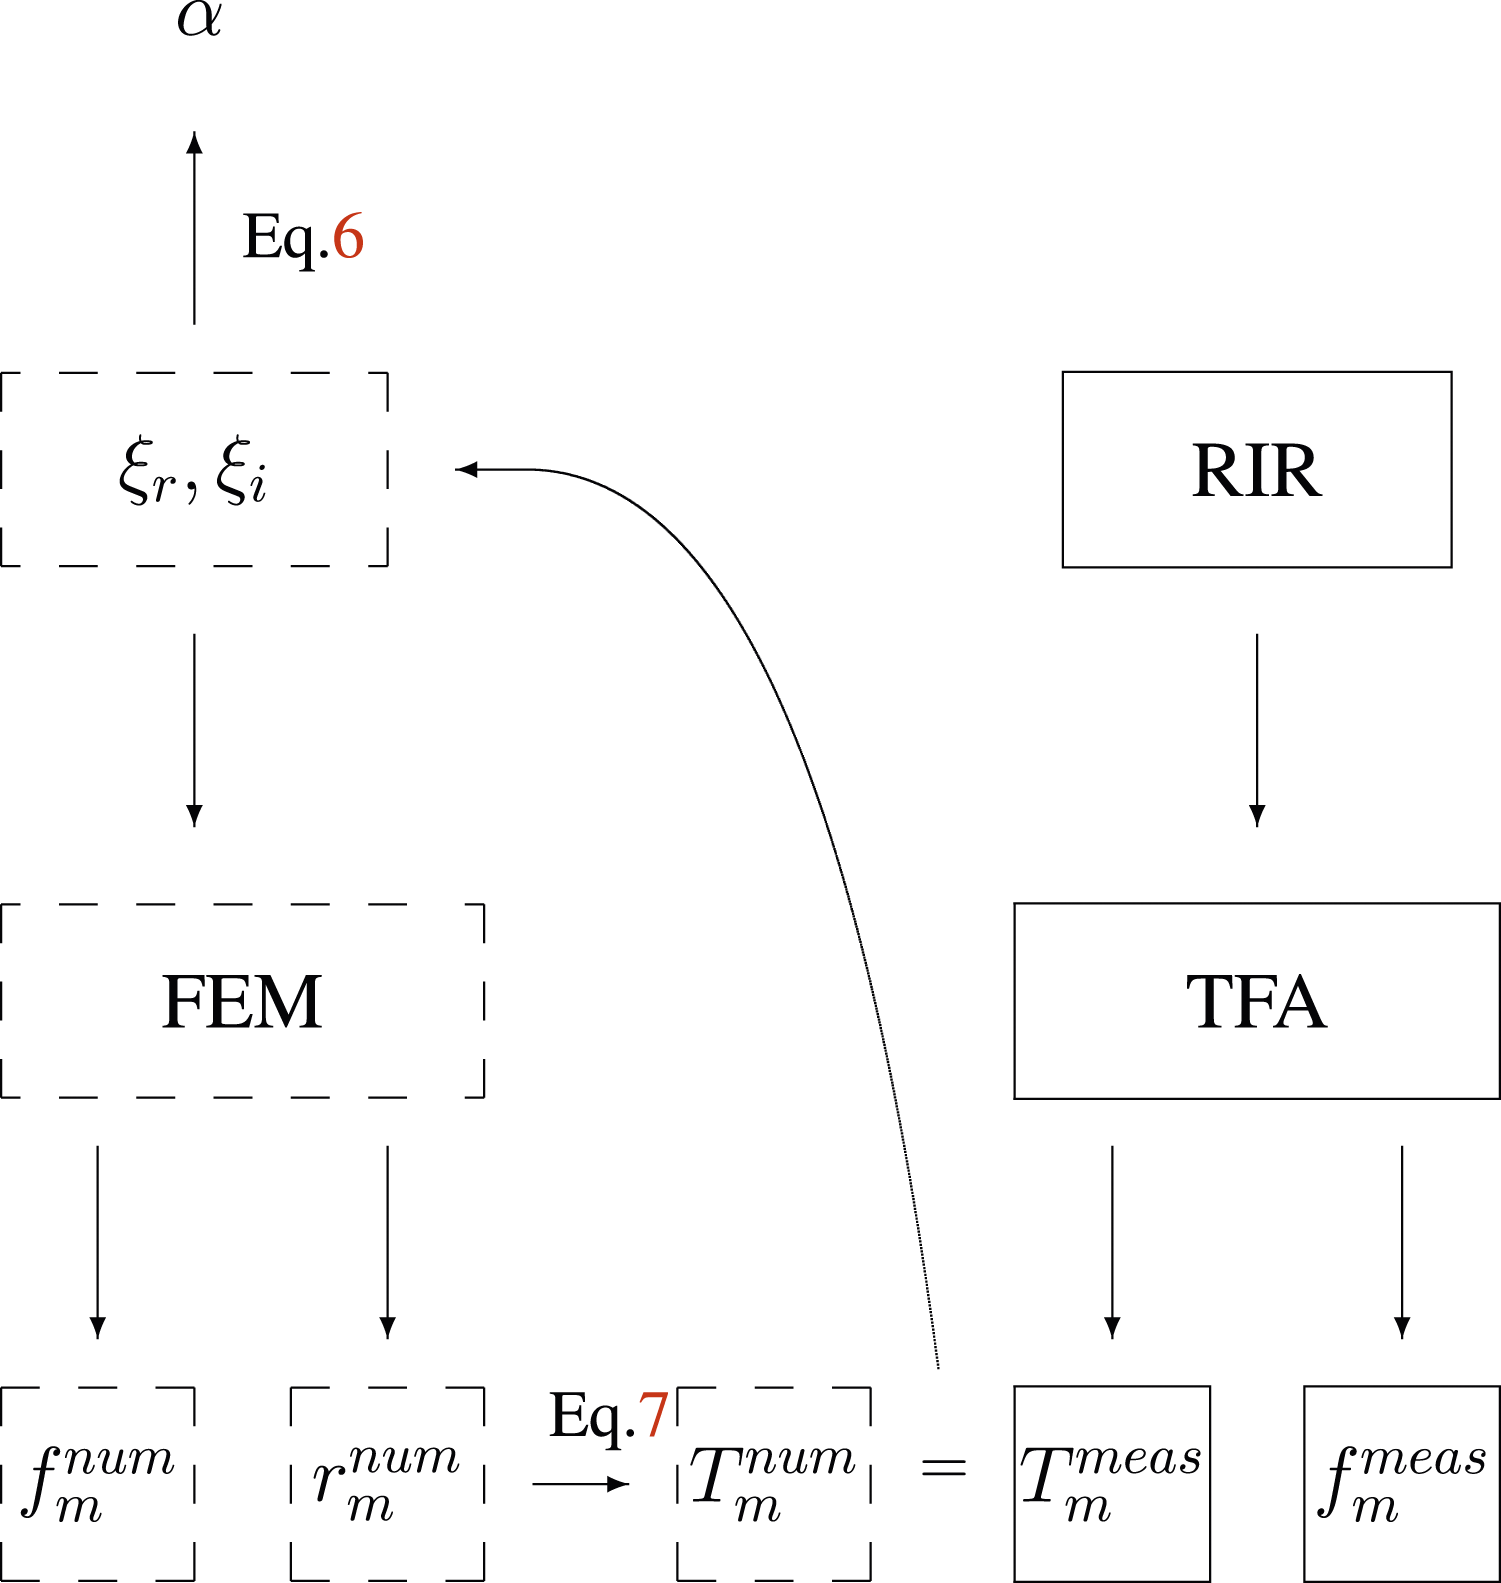
Inverse problem 1
First, an impulse response (RIR) of an empty reverberation room is measured. The microphone is placed in one corner of the room and the sound source in the opposite corner. The measured modal frequencies
Inverse problem 2
The measurements, numerical calculations, and estimation of the boundary impedances are repeated with the absorption sample positioned on the room floor. The impulse response in the room with the sample is measured at the same corner position as in the empty room and analyzed using WWOST. The boundary conditions now incorporate the impedances of both the room walls
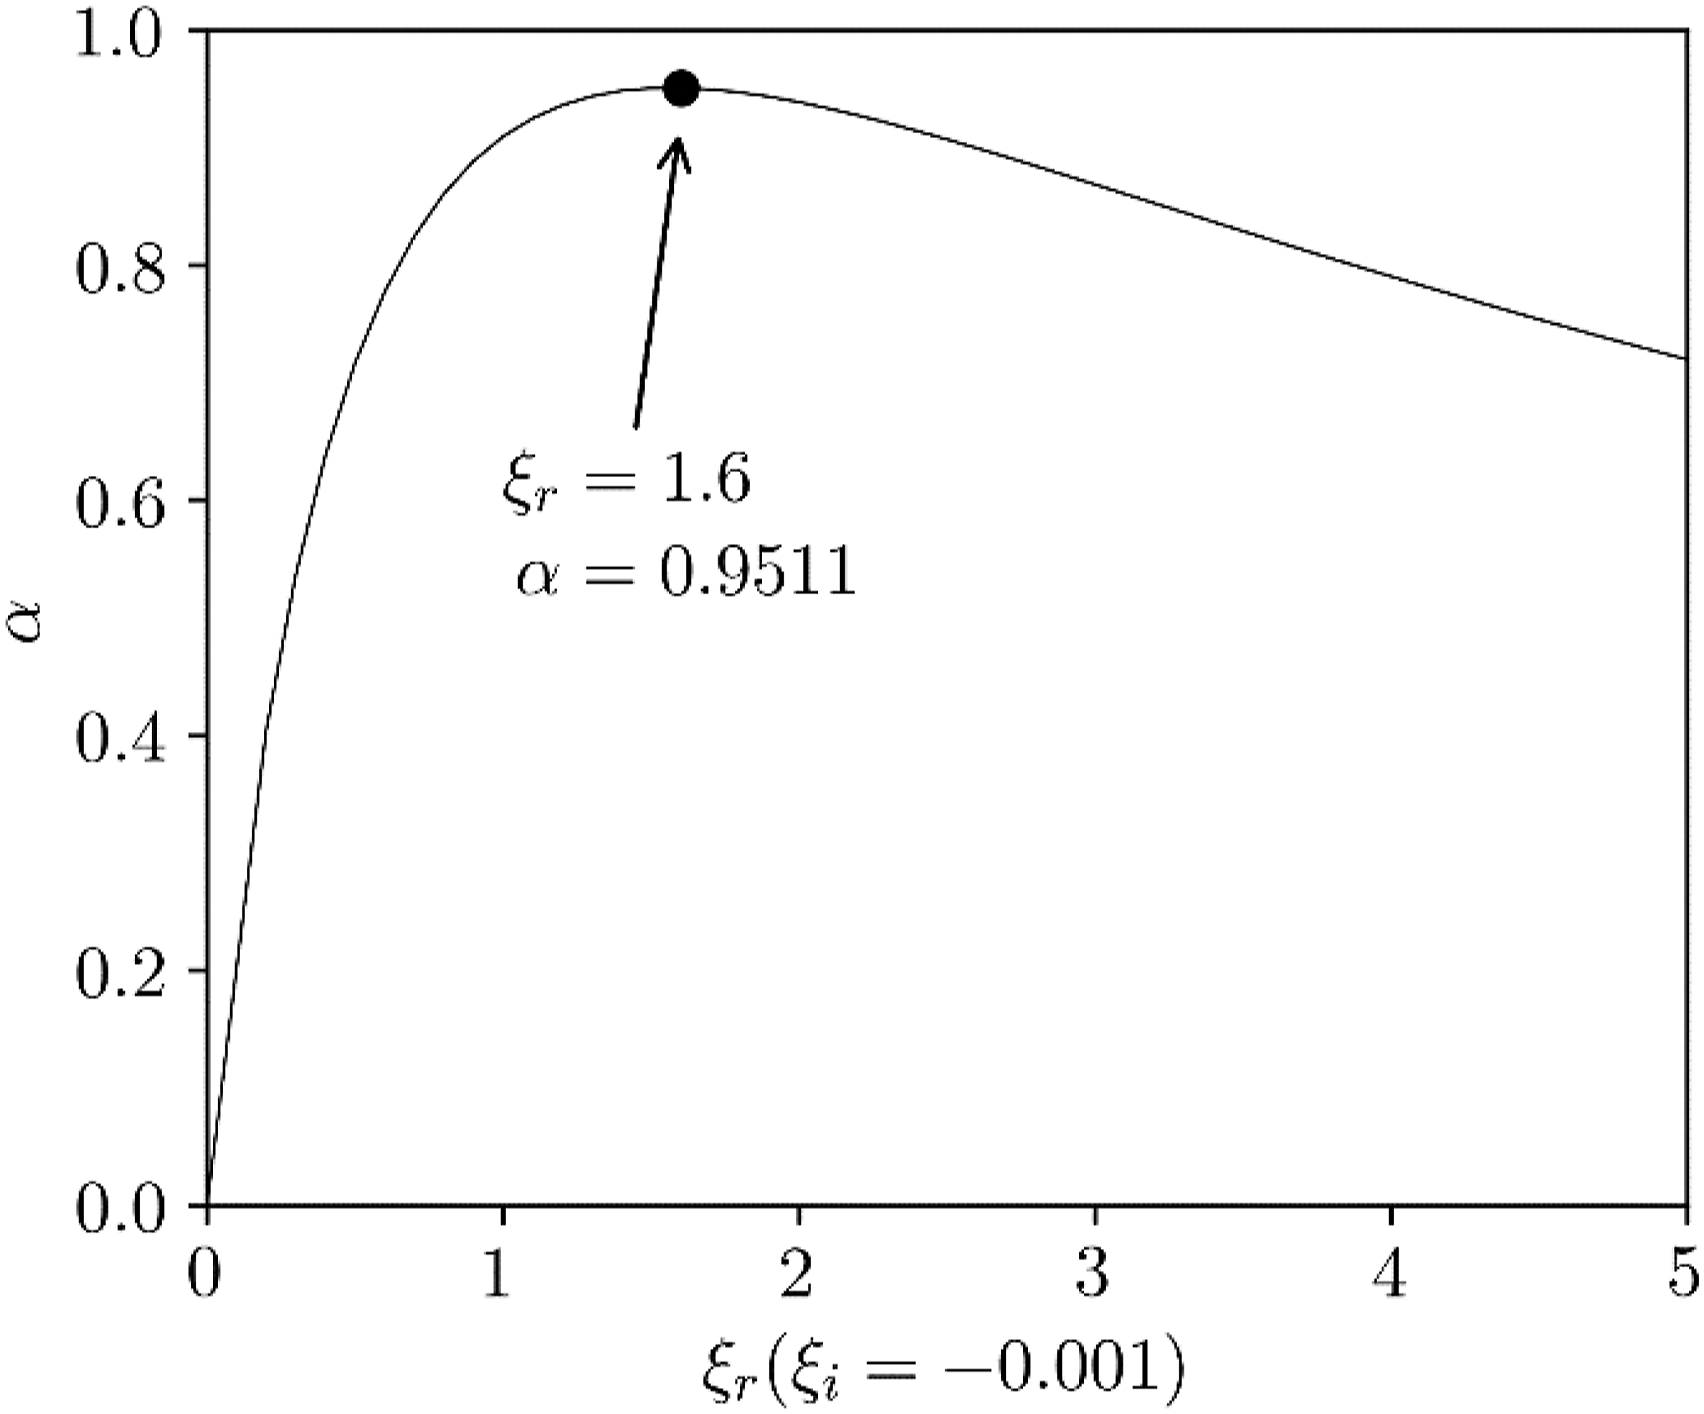
Figure 2 shows the absorption coefficient α, as a function of resistance ξ
r
with ξ
i
= −0.001, computed according to equation (6). A peak value of α = 0.9511 is attained at ξ
r
= 1.6, and the broadest range of available α values also occur at ξ
r
= 1.6. Consequently, at this step, a constant resistance value of the sample Absorption coefficient as a function of resistance ξ
r
.
Experiment
The hybrid method for estimation of the absorption coefficient at modal frequencies was initially tested in a real environment using a mineral wool sample.
Test sample
A mineral wool absorber (labeled W06-100) was selected because it can achieve high sound absorption coefficient values in the low frequency range and was previously used to study the reproducibility of measured absorption coefficients in reverberation rooms.56,57 It is also a material that is commercially available and commonly used in acoustic practice. The tested sample is shown in Figure 3. The sample was placed on the floor of the room in an oblique position (Figure 6). The side surfaces of the samples were not covered or treated. The density of the sample was 40 kg/m3. Its width, length, and height were 0.6 m, 1.0 m, and 0.1 m, respectively. Exterior and interior views of the small reverberation test chamber with mineral wool sample (W06-100).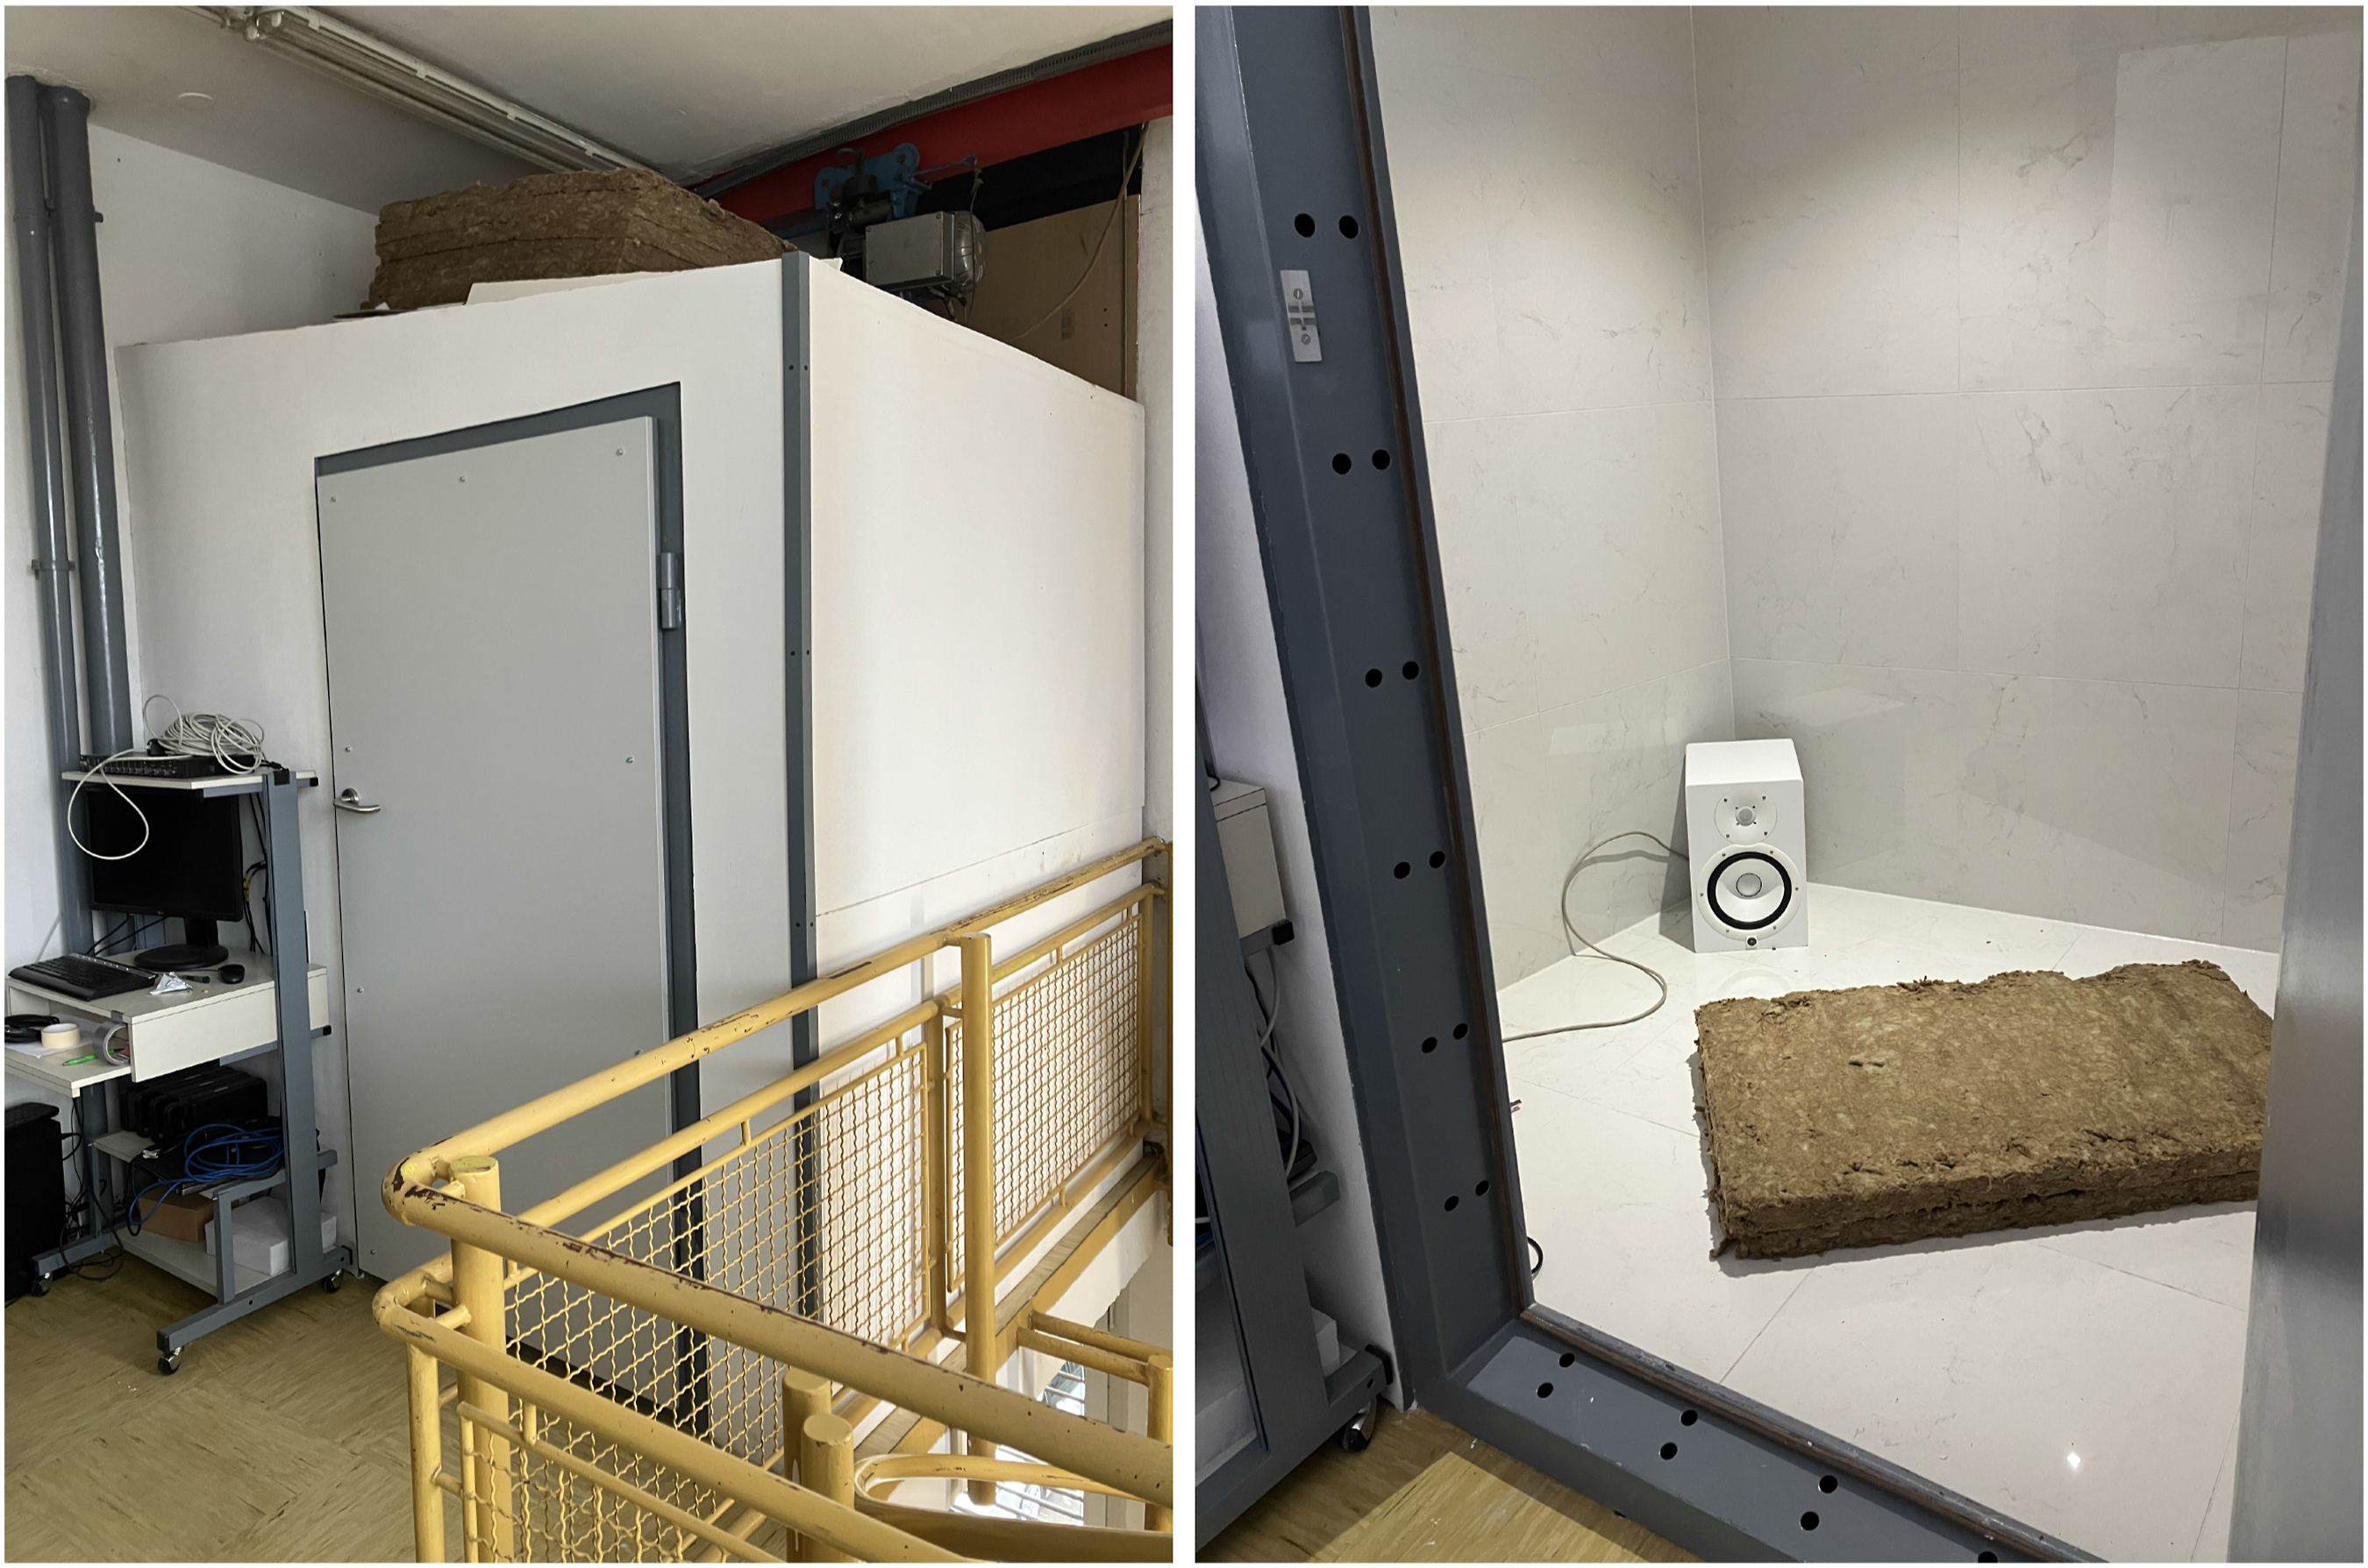
Test room
The measurements were performed in a small room (V ≈ 6.4 m3) with six non-parallel surfaces shown in Figure 3. The walls and ceiling of the room consisted of two layers of plaster and the floor consisted of a thick concrete slab. All room surfaces including doors were covered in ceramic tiles. The average diffuse field sound absorption coefficient
1
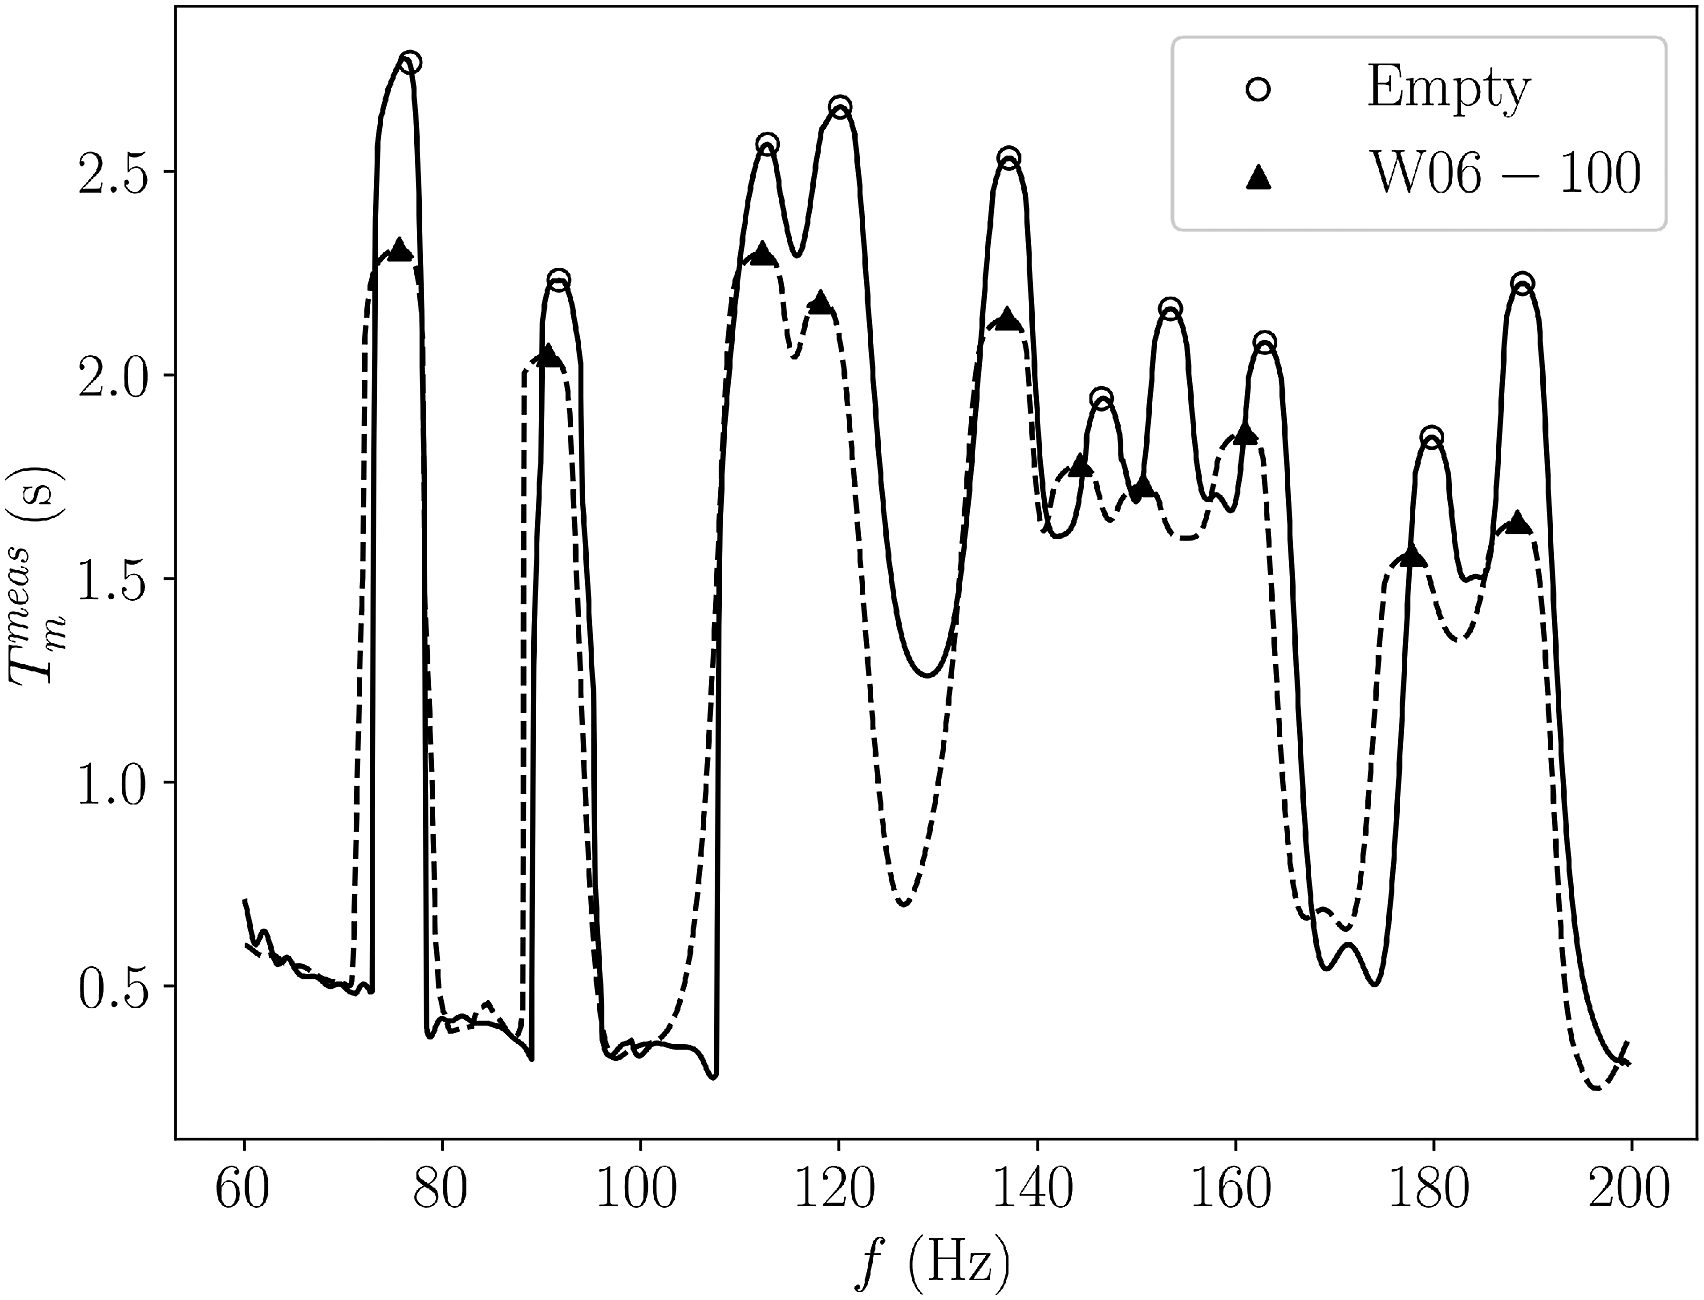
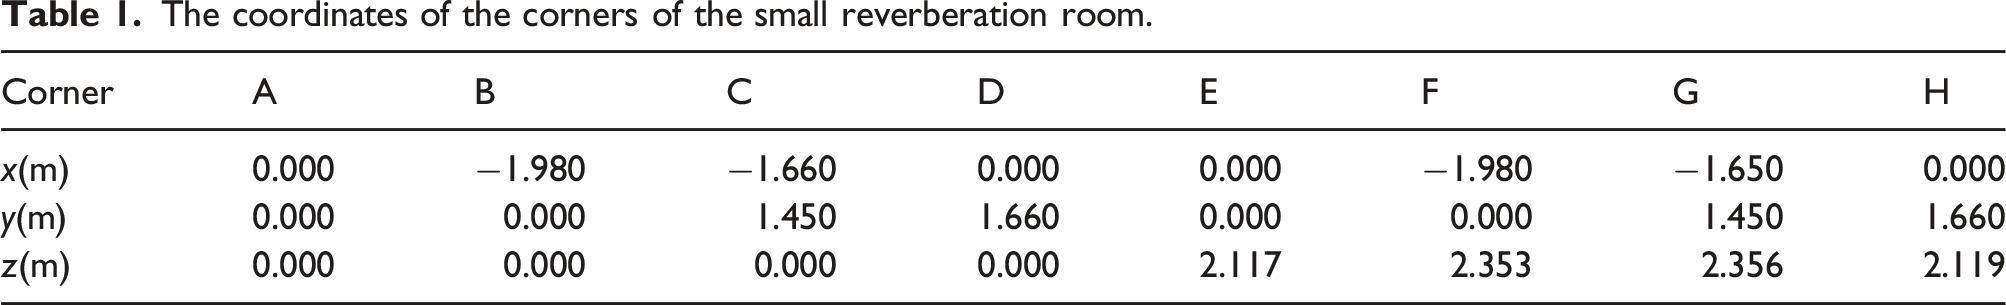
of the room surfaces was lower than α = 0.05 in the frequency range 315 to 4000 Hz and above α > 0.15 in the lower frequency ranges. The Schroeder frequency was estimated to be above 900 Hz. Therefore, the sound field in the low frequency range below 200 Hz was not considered diffuse which can be also seen from the frequency spectra of decay time presented in Figure 4 where individual modes can be clearly identified. The coordinates of the eight corners of the room are presented in Table 1. Frequency spectra of decay time for the empty reverberation room and for the reverberation room with the sample W06-100. Modal frequencies with corresponding decay times are identified as peaks in the spectra.
Measurement equipment
The impulse response was determined using an exponential swept sine excitation signal 58 between 40 Hz and 20000 Hz. The length of the excitation signal was 5.47 s. Excitation signals were generated using NI LabVIEW software, a sound card (Motu StageB16), and a loudspeaker (Yamaha HS8 with 8-inch cone woofer and 38 Hz–30 kHz frequency response). The center of a speaker was located at the position: x s = −1.790 m, y s = 0.290 m, z s = 0.150 m. The response signals were measured using a half-inch microphone (BK type 4145, sensitivity 50 mV/Pa, dynamic range 10.2 to 146 dB, frequency range 2.6 Hz to 18 kHz), an amplifier (BK type 2636), and a sound card (Motu StageB16). The microphone was placed in a corner position opposite the speaker. The receiving microphone coordinates were: x r = −0.100 m, y r = 1.380 m, z r = 1.980 m. The acquisition was done with the NI Sound and Vibration acquisition module. The signal was recorded at a sampling frequency of 96000 Hz. Two excitation signals were averaged when determining the impulse response. Deconvolution was performed in Python.
Estimation of decay time and modal frequencies by measurements
FEM setup, estimation of the input impedance and the absorption coefficient
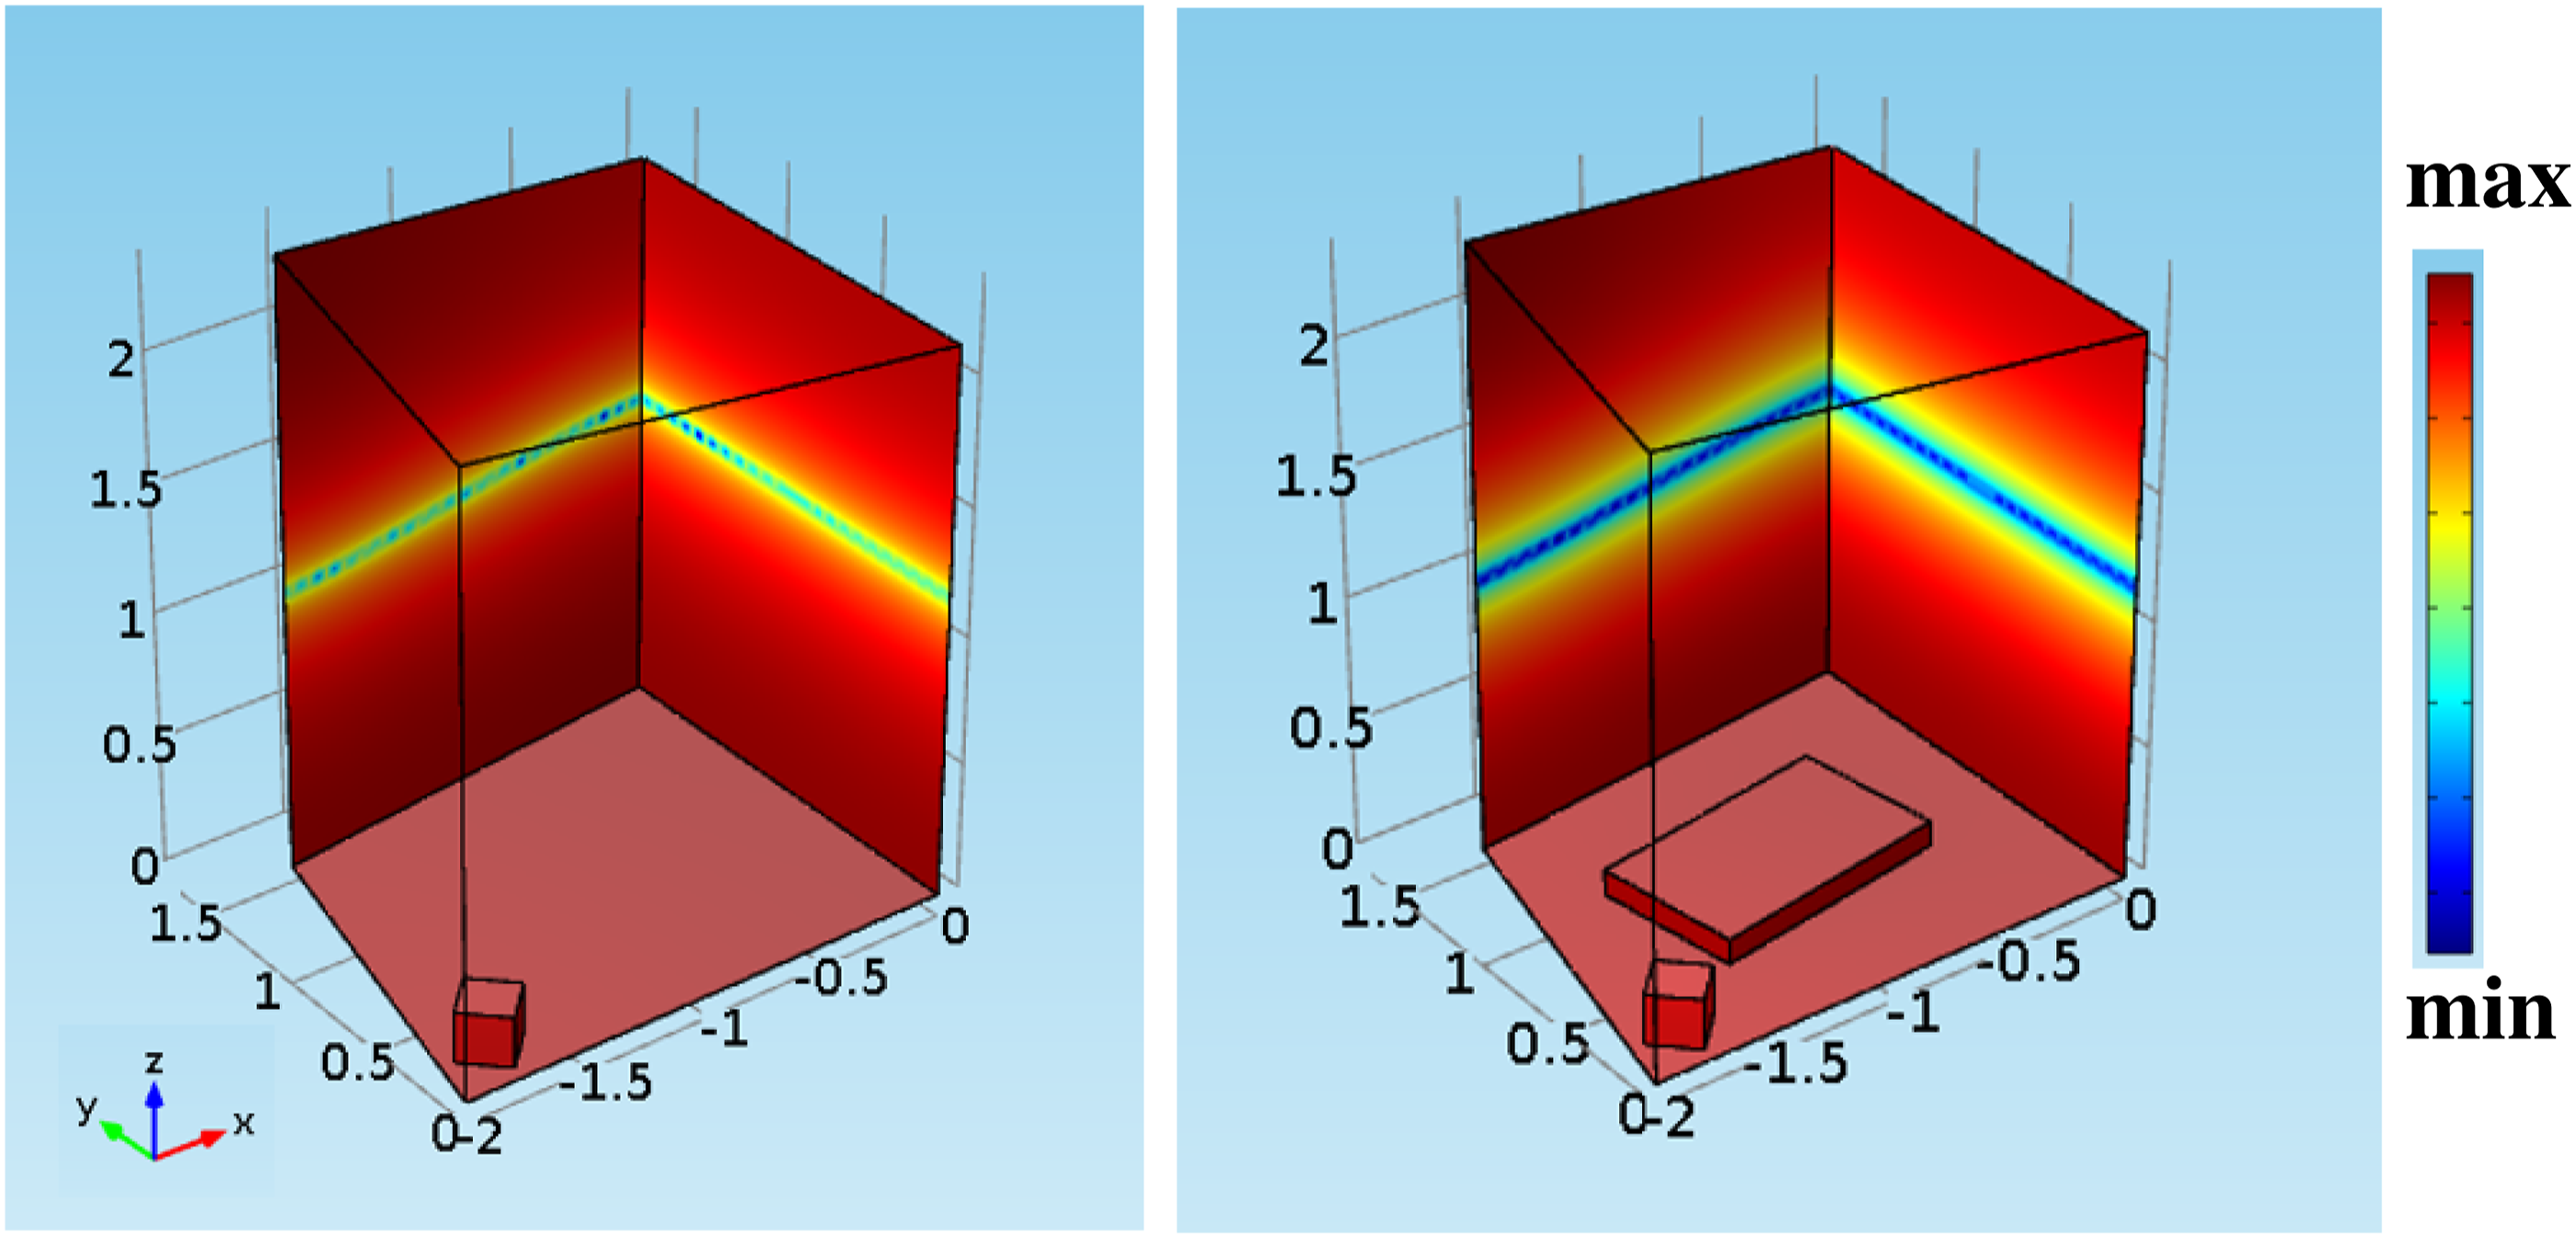
An eigenfrequency FEM model of an empty room was created. The computational model included the geometry of the small room (dimensions in Table 1), a loudspeaker, and an acoustic sample in the occupied room, as shown in Figure 6. One of the loudspeaker surfaces was modeled as a vibrating surface with an inward acceleration of 0.1 m/s2. A physics-controlled mesh with a finer element size was selected, and the air temperature was set to 293.15 K.
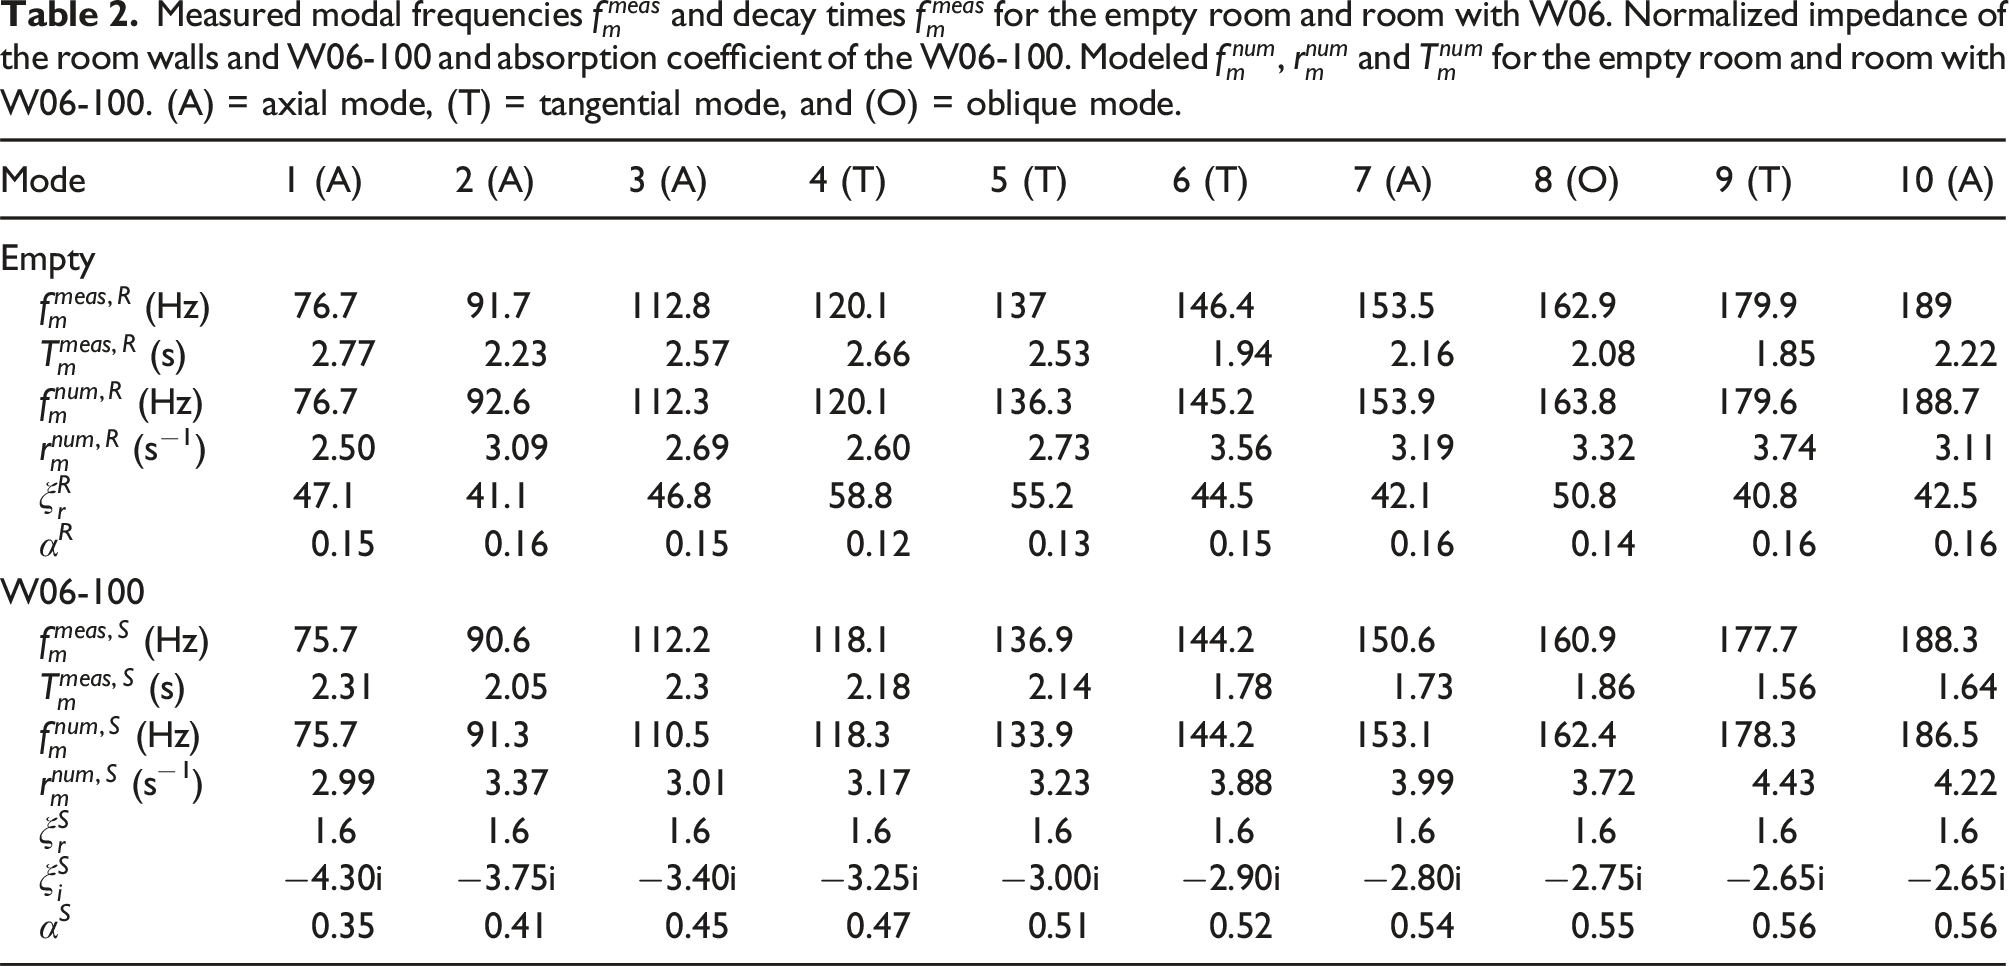
The input frequency-dependent surface impedances of the walls in the empty room were evaluated using the experimentally estimated decay times of room modes. The impedances of the empty room boundaries (
The impedance of the W06-100 sample was evaluated using decay time measurements with the sample placed on the floor of the room (Figures 5 and 6). In the numerical study, it was assumed that all surfaces of the W06-100 sample had the same impedance. The resistance was assumed to have a constant value Decay time of the first mode (m = 1) evaluated by calculation as a function of reactance (ξ
i
). Geometry of the FEM setup and sound pressure level distribution at the frequency of the first mode in a small room with and without sample.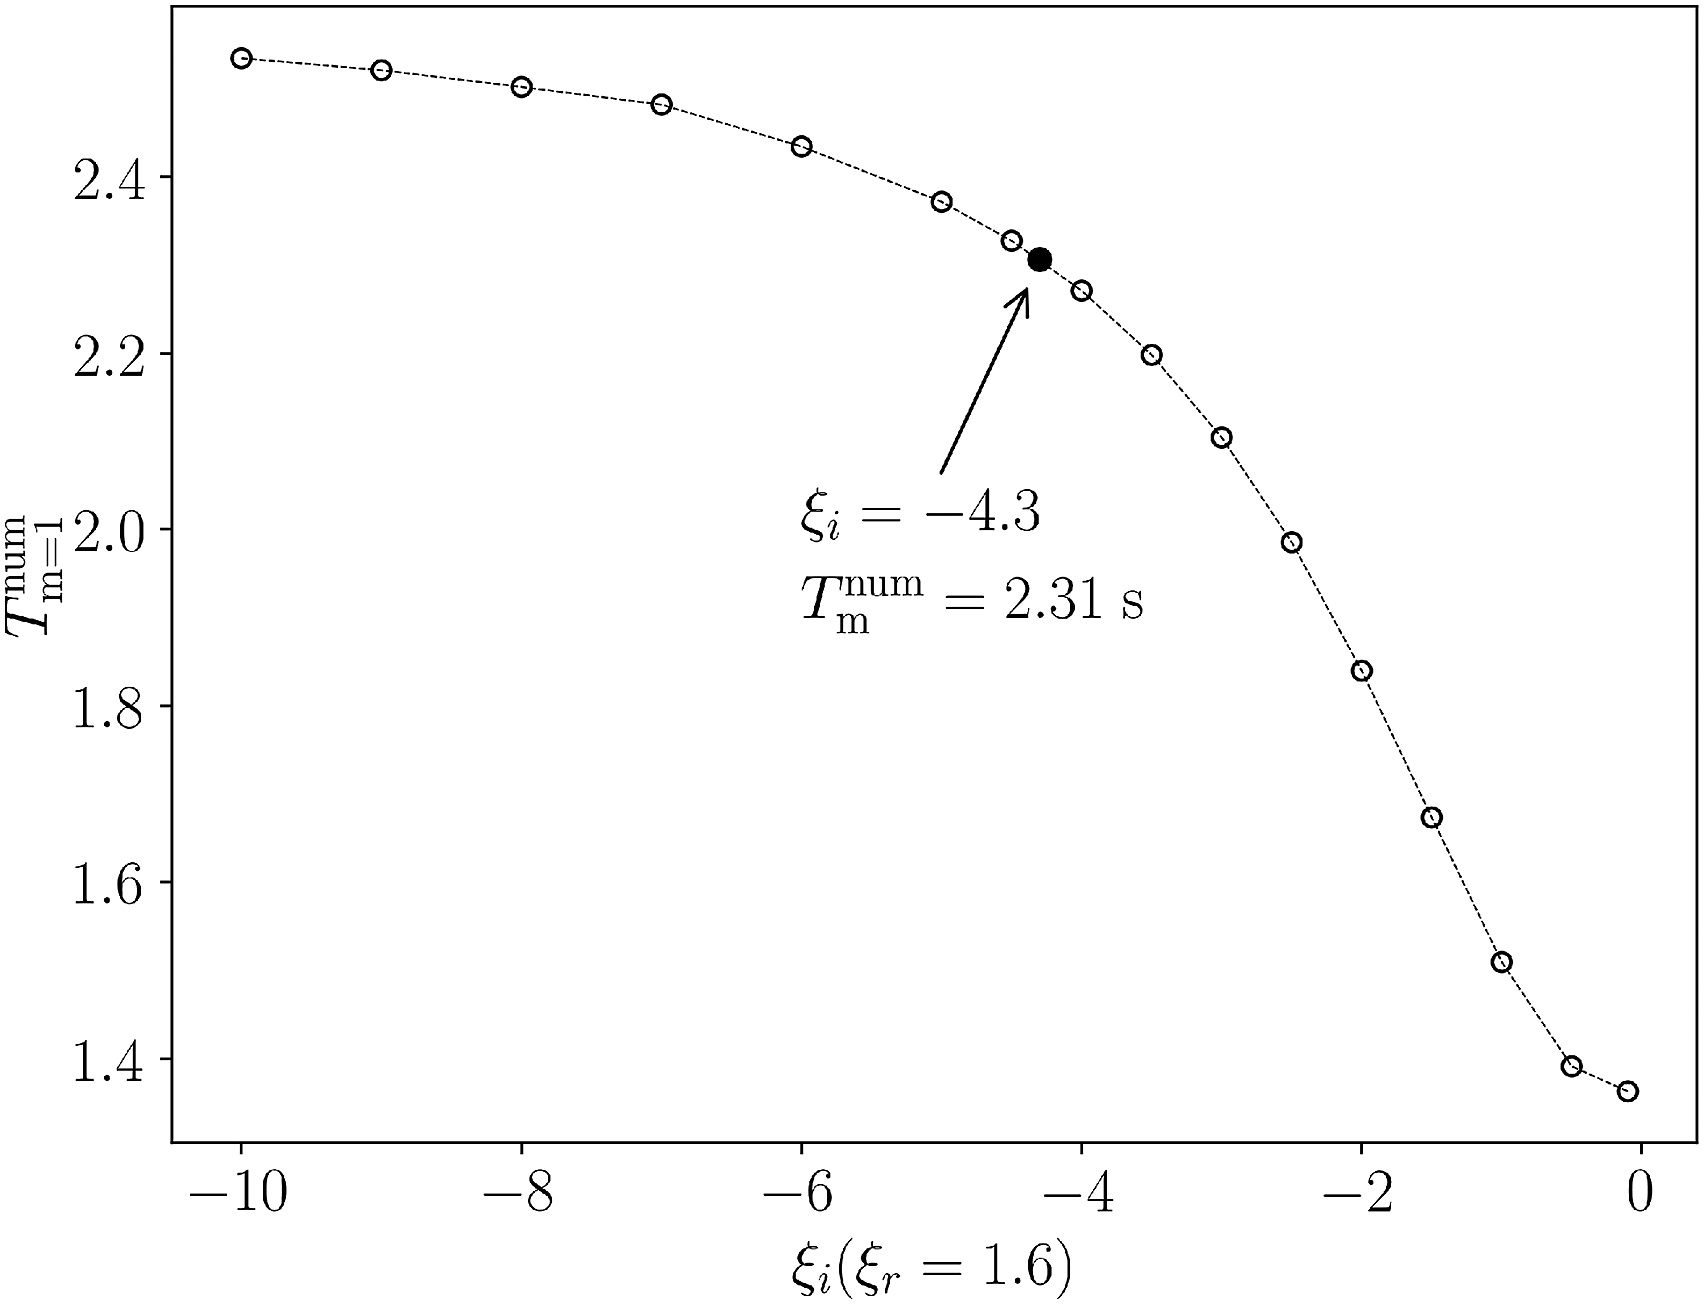
The values of
Repeatability
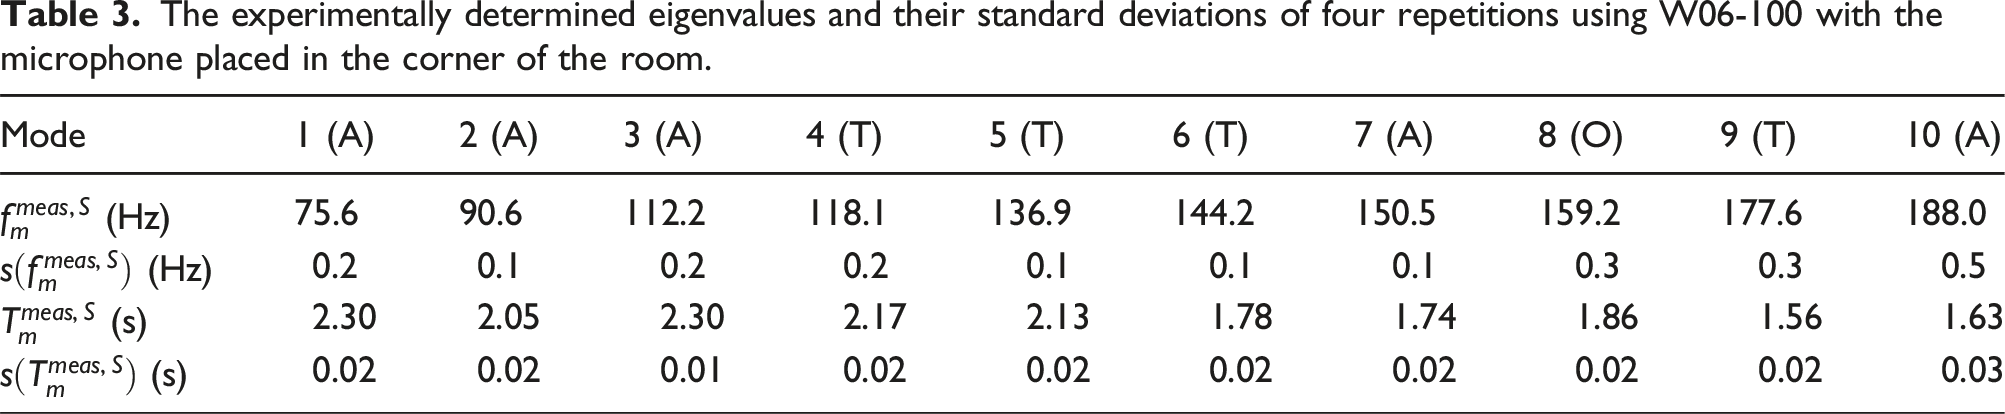
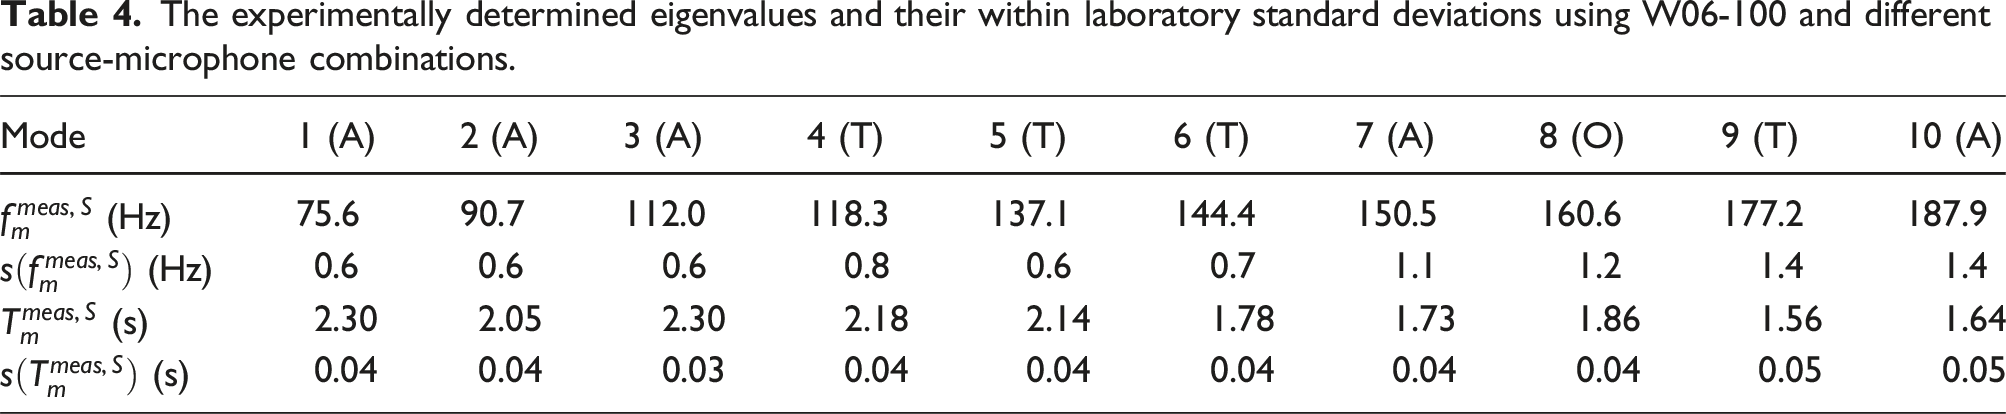
Effect of speaker and microphone positions
Effect of sample position
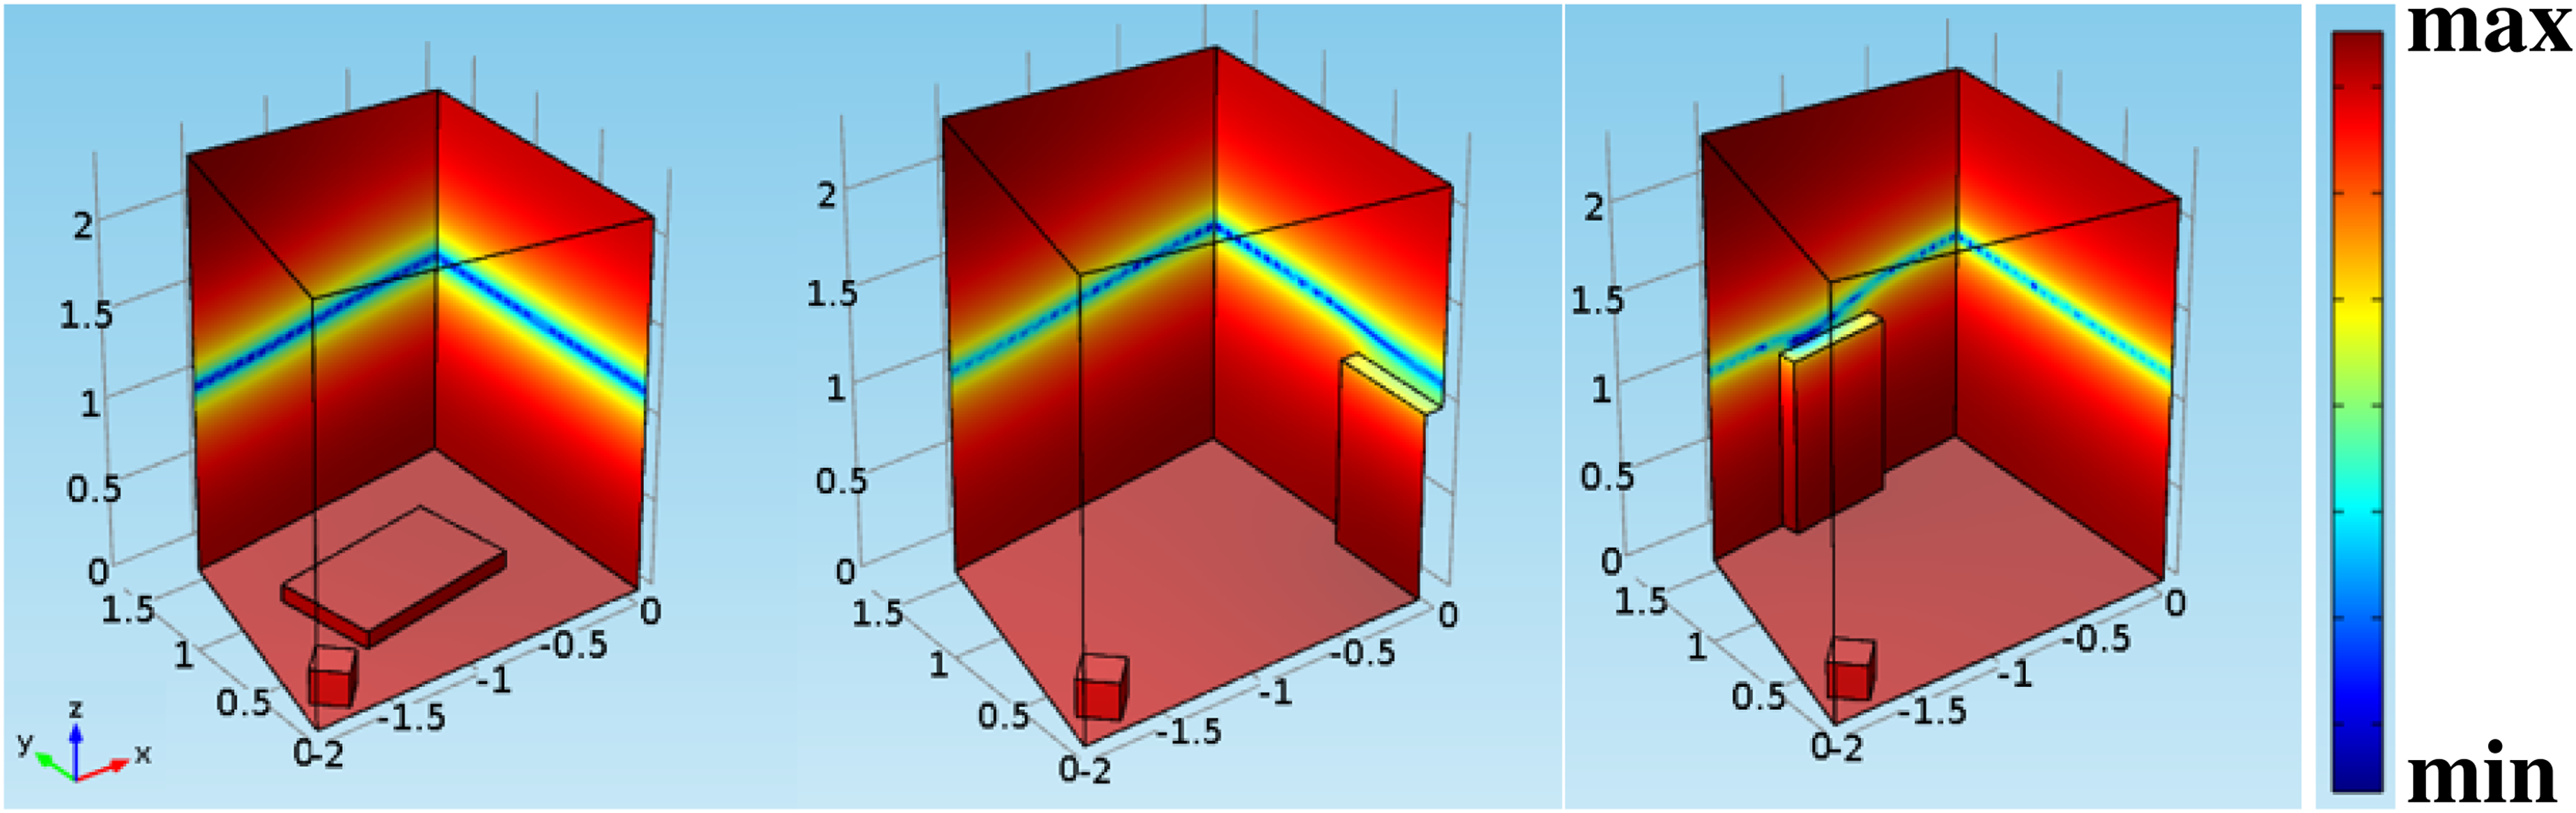
The effect of sample position on eigenvalue estimation was investigated using three different positions of W06-100. First, the sample was placed in the center of a room (oblique position), and then the measurements were repeated with the sample placed in a corner of the room and with the sample placed in the center of the wall. The different positions of the W06-100 sample are shown in Figure 8. The effect of sample position on eigenvalue estimation was also investigated by numerical calculations. Again, the input impedances were kept the same and only the sample position was varied. As shown from the measured and numerically estimated modal frequencies and decay times in Figure 7, the position of the sample had different effects for the different modes. For the first mode, the shortest decay time was measured and calculated when the sample was placed on the floor of the room. If the sample was placed in a corner or on the wall, the decay time was shortened, suggesting that the effect of the absorption element was smaller. The opposite was true for the third mode, where a greater reduction in decay time was obtained when the sample was placed in the corner of the room. This result could again be explained by the visualization of the room modes. The sound pressure level distribution for the first mode at three different sample positions is shown in Figure 8. When the sample was placed at a position where part of the sample was in the node of the room mode, the resulting damping coefficient became smaller, and the decay time became longer. Modal frequencies and modal decay times estimated by measurement (left) and numerical model (right) at different positions of sample W06-100. Distribution of the sound pressure level for the first mode (∼ 76 Hz) at different sample locations.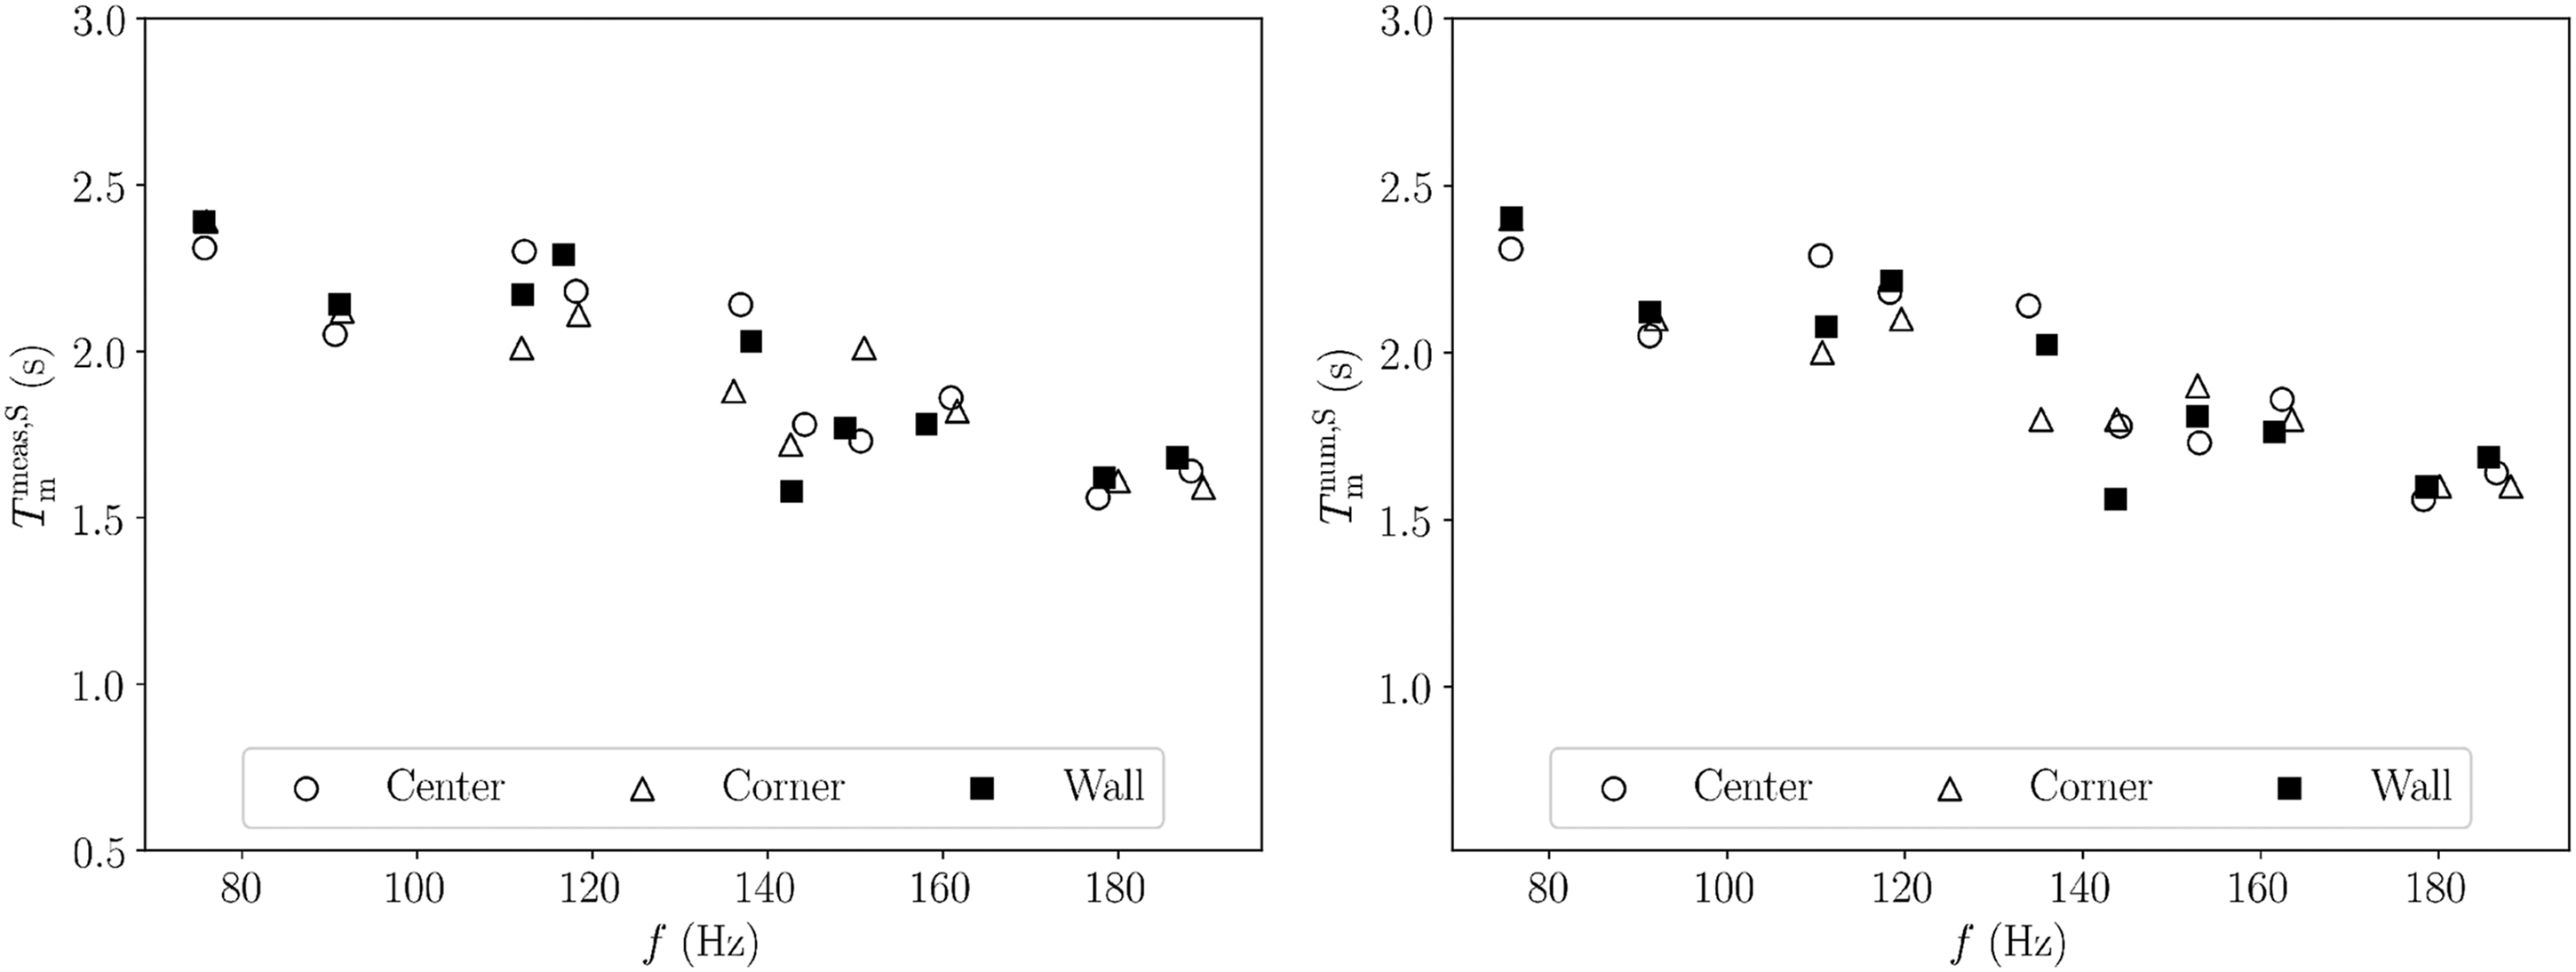
Comparison with impedance tube measurements
The impedance tube is commonly used to measure the frequency-dependent absorption coefficient of a small sample using the methods described in ISO 10534.39,40 At low frequencies, however, the instrumental setup requires a specific design.41–43 In this study, the measurement apparatus consisted of a cylindrical steel impedance tube with a length of L = 4.0 m, an inner diameter of d = 0.049 m, and a 1/4” PCB Piezotronics microphone type 130F22. The tube, shown in Figure 9, was mounted vertically on a concrete wall with rubberized mounts to reduce vibration transmission. The microphone was calibrated with a BK pistonphone Type 4228. The sound source was a Visaton FR10 100 mm full-range loudspeaker with a sensitivity of 86 dB (1 W/1 m) and a nominal impedance of 8 ohms. Measurements were performed according to ISO 10534-1
39
using the standing wave ratio. The speaker was driven by single tones. The frequency of the tones corresponded to the measured modal frequencies Top and bottom views of a long impedance tube mounted vertically on a wall.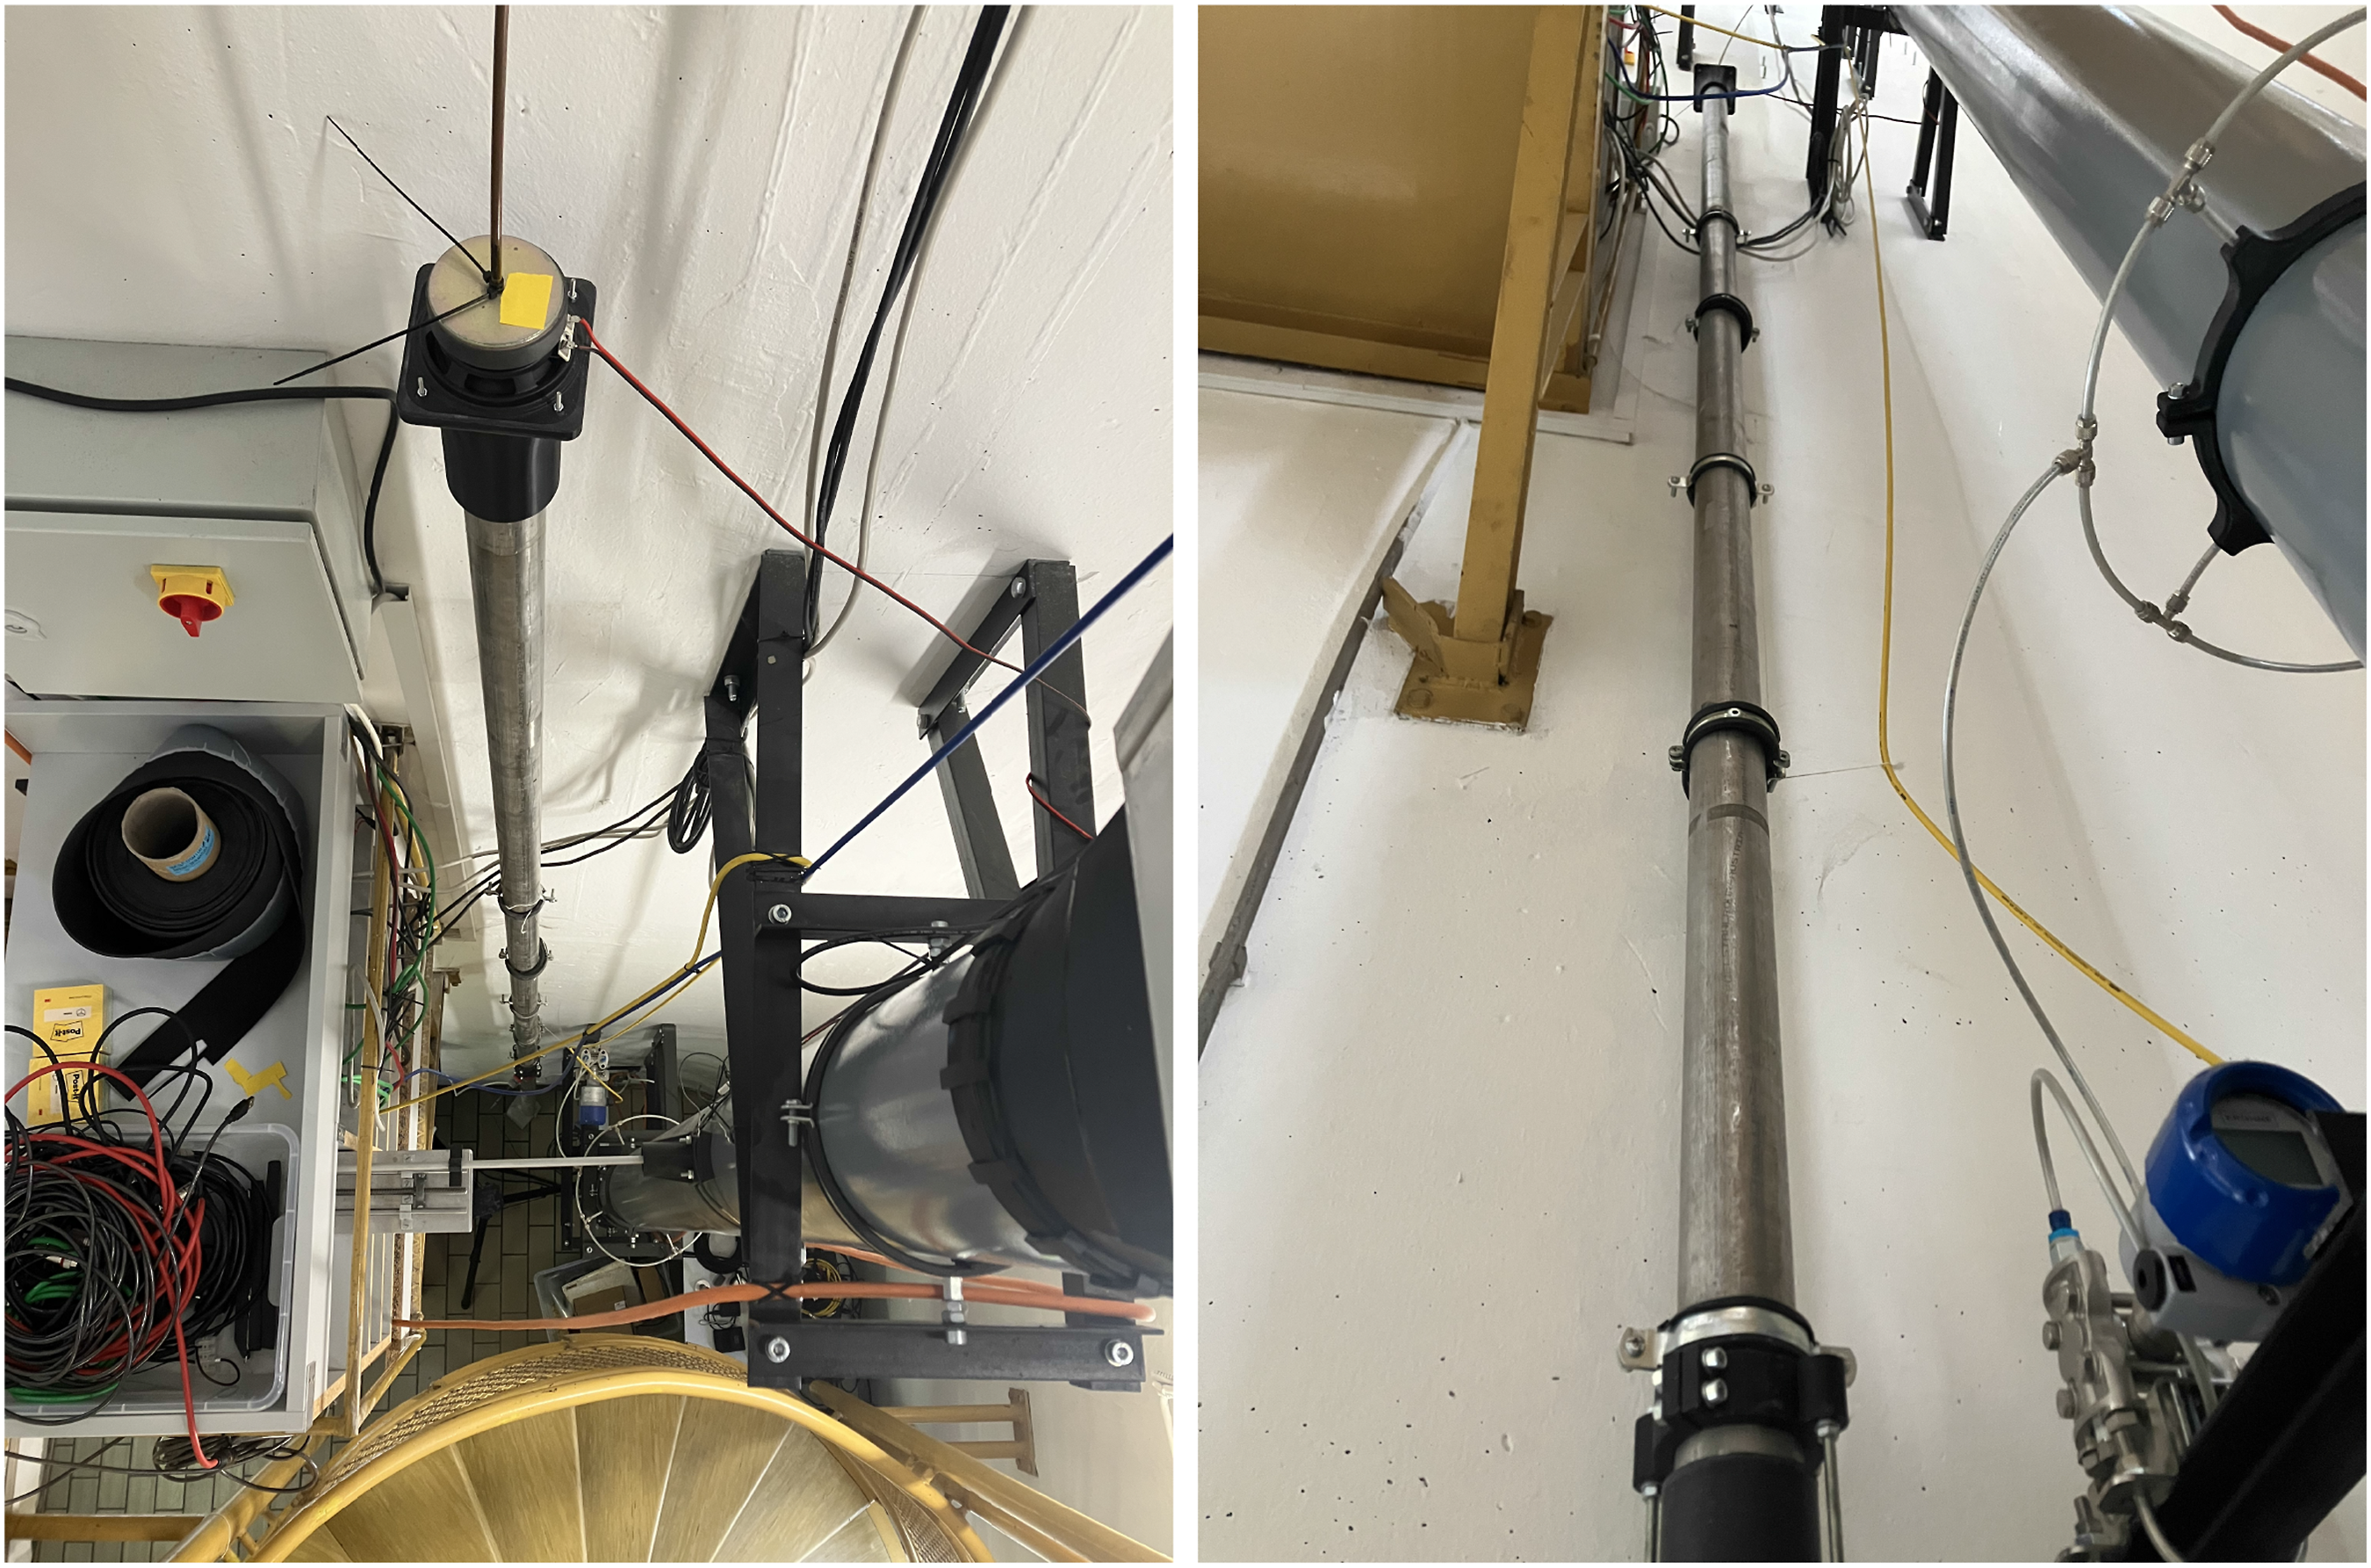
The possible cracks at the edge of the sample were sealed with petroleum jelly. The test was repeated with three specimens using the same mounting conditions. The test samples were cut out from different locations of the W06-100 test sample. The absorption coefficient of the W06-100 sample measured with the impedance tube method
39
and the presented hybrid method using decay time measurements and the FEM model is shown in Figure 10. The absorption coefficients for the first ten modes were comparable for both methods. Absorption coefficient of the W06-100 sample determined by the impedance tube method and hybrid method based on decay time measurements coupled with FEM model.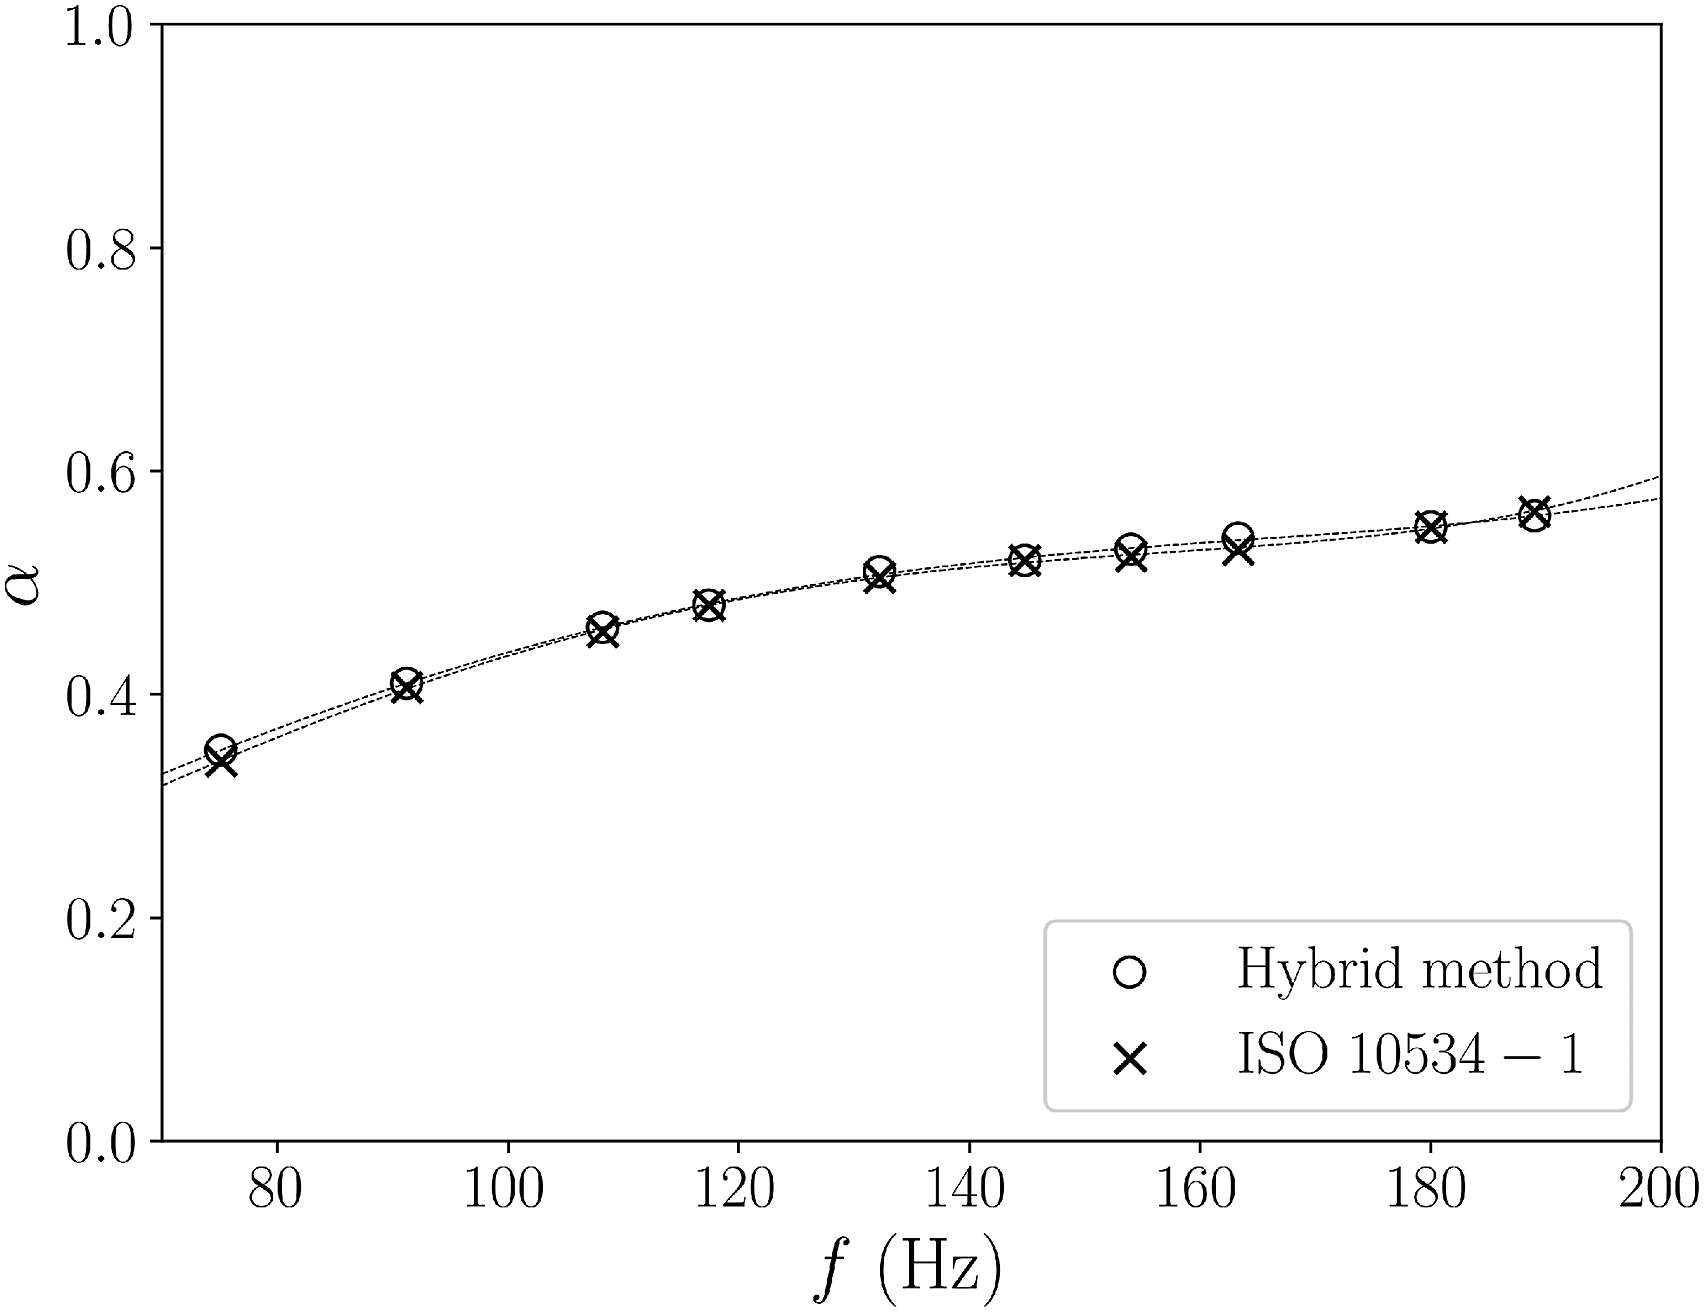
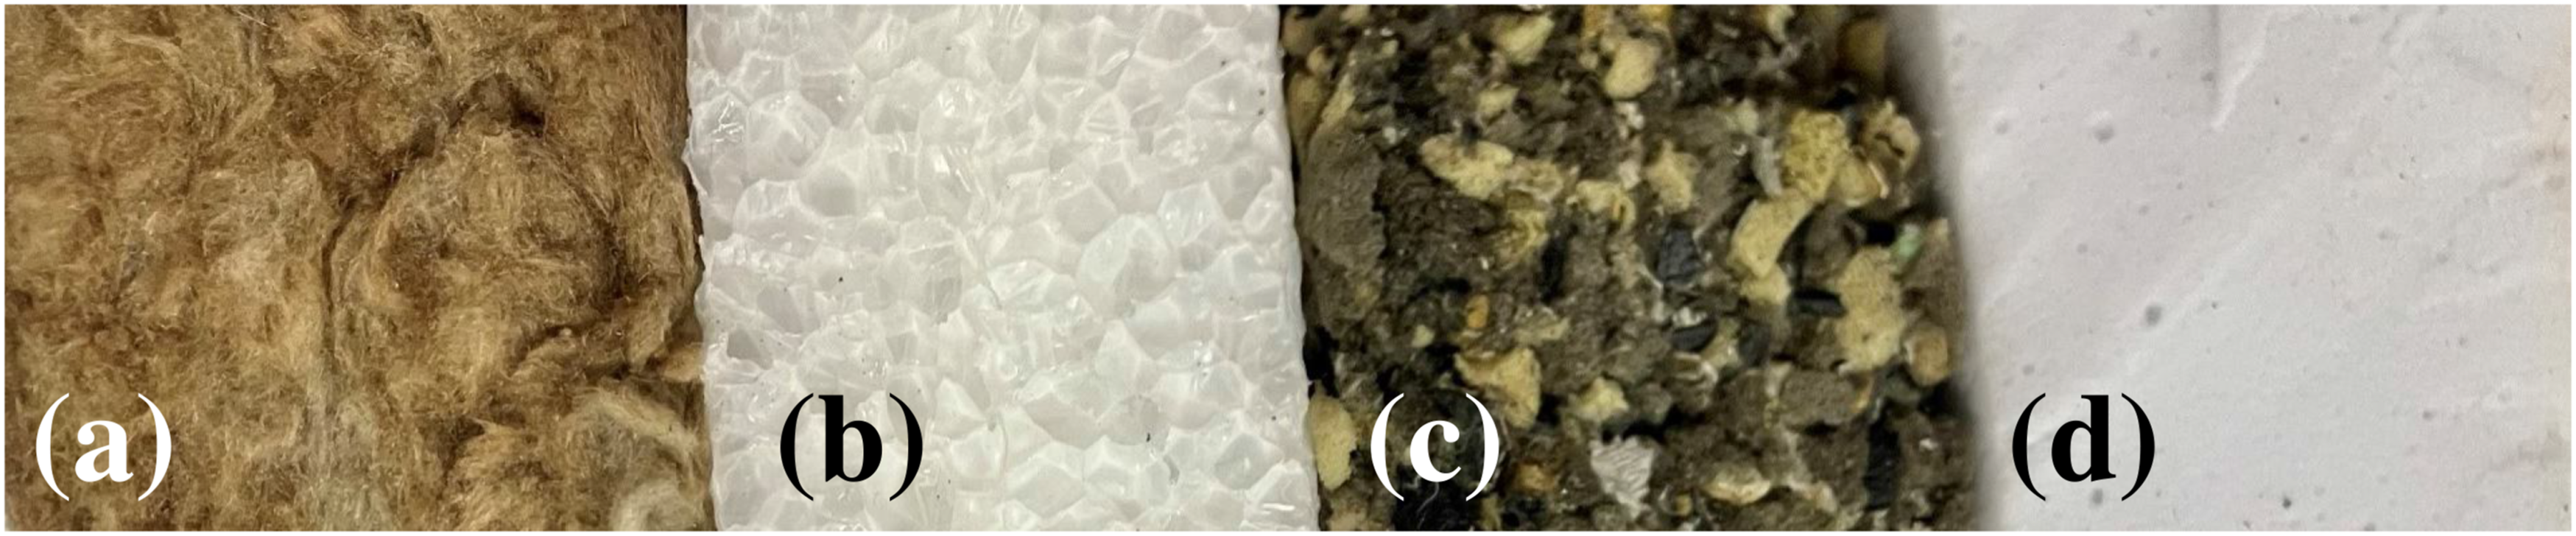
Measurements performed using different acoustic elements
In this section, the sensitivity of the method to different materials and acoustic elements was investigated. The following samples were tested: a. a 0.6 m × 1.0 m × 0.05 m mineral wool absorber with a density of 40 kg/m3, Figure 11(a). b. a 0.6 m × 1.0 m × 0.1 m PVC absorber with a density of 25 kg/m3, Figure 11(b). c. A 0.6 m × 1.0 m × 0.1 m high-density polyurethane foam with a density of 125 kg/m3, Figure 11(c). d. A 0.6 m × 1.0 m × 0.1 m melamine foam with a density of 10 kg/m3, Figure 11(d). (a) mineral wool, (b) PVC absorber, (c) high-density polyurethane foam, and (d) melamine foam.
Measurements were made with a single microphone placed in the corner of the room. The samples were placed in the center of the room in an oblique position. The eigenvalues for the lowest ten modes were determined by measurements and used to determine the input surface impedance of the sample. The surface impedance was then used to calculate the absorption coefficient α using equation (6). The measured modal frequencies and modal decay times, and absorption coefficients are shown in Figure 12. The results show that highly absorbent materials of sufficient thickness (0.1 m thick high-density polyurethane foam, melamine foam, and mineral wool) were able to absorb the low-frequency sound. The PVC absorber and the 0.05 m thick mineral wool could only slightly reduce the decay time of the lowest modes. The absorption coefficients of the PVC absorber and thin mineral wool are only slightly higher than the background sound absorption (α ∈ (0.12, 0.16)) of the empty room, with 0.05 m thick mineral wool showing better results. By comparing absorption coefficients at modal frequencies for the 0.1 m and 0.05 m thick mineral wool samples we can see that the effect of sample thickness on absorption of room modes is not linear. The decay time of the room modes can be effectively reduced only if the specimen thickness is sufficiently large (more than 50 mm), which agrees with the simulation results presented by Meissner for the smoothing effect of the frequency response.
27
Modal frequencies and the absorption coefficient of the samples obtained by combining the measured data with a numerical model (hybrid method) and by the impedance tube ISO 10534-1 method.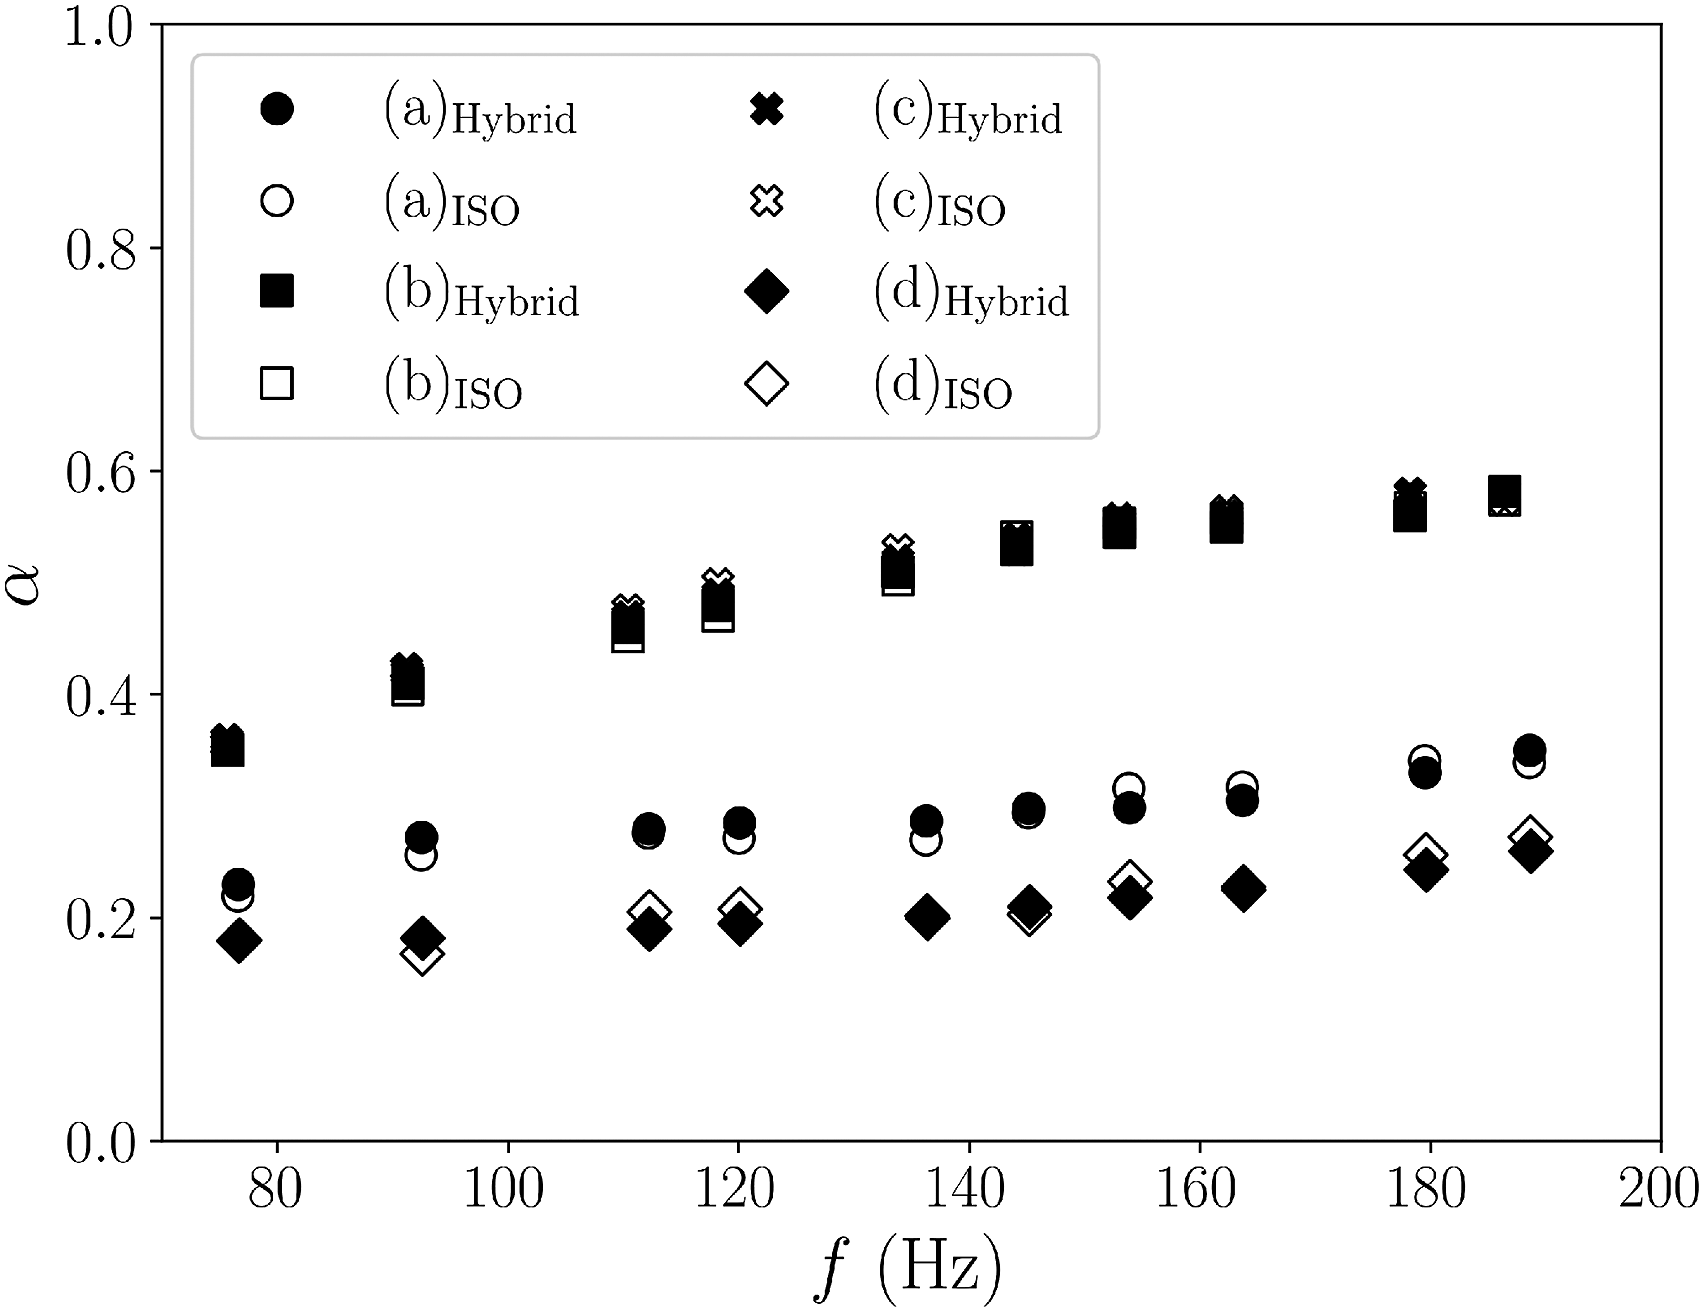
Conclusion
This paper focuses on the estimation of low-frequency sound absorption coefficients of material samples at modal frequencies in a small room. The characterization of the sound-absorbing properties of the test sample is based on a hybrid method in which the sound decay measurement data is used to determine the input parameters of an eigenvalue model and to estimate the sound absorption coefficient at modal frequencies. The modal frequencies and modal decay times in the empty and occupied rooms are determined from a room impulse response measured in a corner of the room using time-frequency analysis. The estimation of the surface impedance of the room boundaries and the sample is simplified. The surface impedance of the room walls are assumed to be finite, real, and uniformly distributed, while for the sample a constant resistance is assumed.
The repeatability of the measurement procedure was considered satisfactory. The measurements performed with different speaker-microphone configurations indicated that the global parameters such as the decay time of modal frequencies can be performed with the microphone placed in a corner of the room opposite the sound source. The results of the decay time measurements with different sample positions were in agreement with the predictions of the theoretical model.
The method was tested in a small reverberation test room where the absorption coefficients of a 0.6 m × 1.0 × 0.1 m mineral wool sample were estimated at modal frequencies in the frequency range from 70 Hz to 200 Hz. The results were compared with the standard measurements using a long impedance tube and it was found that the absorption coefficients for the first ten modes were comparable for both methods.
Characterization of some common acoustic elements was also performed. The results showed that the reduction of decay time at modal frequencies is best achieved with sufficiently thick dissipative absorption samples. The experimental results indicate that the hybrid method can be used to characterize the low-frequency sound absorption properties of high-performance material samples in small rooms at modal frequencies and it can be used to compare medium-sized (0.5 − 1.5 m2) samples. Sound absorption at other specific frequencies can be investigated by changing the room geometry, which could be interesting for the development of narrowband absorbers.
Footnotes
Declaration of conflicting interests
The author(s) declared no potential conflicts of interest with respect to the research, authorship, and/or publication of this article.
Funding
The author(s) disclosed receipt of the following financial support for the research, authorship, and/or publication of this article: This work was supported by the Slovenian Research Agency (P2-0401).