
Abstract
The vibrations generated by metro operations can cause structural damage and discomfort to occupants adjacent to the metro lines. In this study, a multigrid fully coupled method of metro vehicle-track-station-soil-building systems is proposed to predict and assess building vibrations before construction. This approach facilitates the efficient calculation of the fully coupled system, while ensuring precise simulations through the utilization of multigrid techniques for wheel-rail contact, track, station, soil, and building components. Using the newly built opera theatre along Beijing metro line 4 as a case, the study demonstrates that the multigrid fully coupled model can predict the dynamics characteristics of metro-induced vibrations and distribution with high accuracy compared with the field tests. Specifically, it was found that metro operations could result in vibrations exceeding specified limits in the opera theatre, particularly at 10∼40 Hz (the building’s natural frequency) and 60∼80 Hz (the main frequency band of vibration caused by the metro). Finally, the mechanism of excessive vibration and the effectiveness of targeted vibration mitigation measures were analyzed with the proposed method. These findings have promising implications for wider applications in environmental assessments and control strategies for new metro lines or vibration-sensitive buildings.

Keywords
Introduction
The development of metro systems has emerged as a significant aspect of urban rail transit, offering swift, high-volume transport with minimal disruption to ground-level traffic. However, the proliferation of metro construction in tandem with urbanization has had a detrimental impact on the vibration environment surrounding the metro, especially in the station areas.1,2 The prolonged and repeated exposure to metro-induced vibrations can compromise the functionality of nearby structures, such as opera theatres, and impact the quality of life of local residents.3–5 Consequently, the evaluation of the environmental impact of metro-induced vibrations and the identification of appropriate mitigation strategies have become critical and inevitable concerns. 6 Hence, it is crucial to perform a comprehensive evaluation of the environmental effects of metro-induced vibrations in the intricate station areas, particularly in scenarios where buildings are situated in close vicinity to the metro line gauge.
Vibration prediction in metro systems is a challenging problem that involves interactions between multiple scale structures and bodies. In recent decades, both industrial and scientific communities have developed prediction models to address train-induced vibration. These models range from 2D7,8 and 2.5D9,10 analytical approaches to 3D numerical methods,11–14 which are useful in identifying key parameters and their influences. The 2.5D analytical approach considers partial three-dimensional characteristics of the structure, and it is suitable for situations where it is necessary to consider the distribution of internal forces and local vibration characteristics within the structural cross-section. However, 2D and 2.5D analytical approaches have limitations in simulating detailed tracks with complex configurations and variegated track characteristics. 15 Originating from vehicle-track coupled dynamics,16,17 vehicle-bridge coupled dynamics,18,19 and 3D simulation methods have good adaptability for predicting environmental vibrations3,20 as well. Thompson 21 summarizes the empirical and numerical prediction methods, the main vehicle and track parameters that can affect the vibration levels and a range of possible mitigation methods. Kouroussis 22 reviews the effect of vehicle characteristics on ground- and track borne-vibrations from railways. Lopes 23 proposes a numerical approach for the prediction of vibrations induced in buildings due to railway traffic in tunnel. Zou 24 develops an efficient computational model that characterizes the dominant mode of vibration transmission through each structural element including those in transfer structures. He 25 proposes an efficient prediction model for the vibration generated by underground railways. Traditional 3D numerical methods, limited by computational power, usually rely on a two-step numerical methodology26–28 that ignores important factors such as deformation of supporting structures and soil and boundary effects of vibration wave reflection. While the two-step model can still provide acceptable calculation accuracy in general problems, it cannot simulate the influence of vibration mass of soil, building, and different track structures details on wheel-rail interactions. To predict the entire process of metro-induced vibration generation and transmission, a multigrid fully coupled method is required.
Multigrid method is a numerical method used for solving partial differential equations. It is a type of iterative method that uses a hierarchy of grids to approximate solutions at different levels of detail. The method starts with an initial guess at the coarsest grid and iteratively refines the solution on successively finer grids until the desired level of accuracy is reached. This approach is particularly effective for linear and nonlinear problems with large domains and fine scales, where traditional methods like finite difference or finite element methods may require a large number of grid points to achieve accurate results. In recent years, there have been significant developments in the theory and applications of multigrid methods, including the development of adaptive and parallel algorithms, the use of multigrid for optimization and machine learning, and the application of multigrid to non-standard problems such as fractional differential equations and multi-physics problems. Shaidurov and Hackbusch29,30 study the multigrid methods for finite elements and its applications. Lopez 31 presents a finite element multigrid strategy for the solution of plate vibration and buckling problems. Clevenger 32 discusses parallel, adaptive geometric multigrid methods for solving partial differential equations on adaptively refined meshes. Petrides 33 proposes an adaptive multigrid preconditioning technology for solving linear systems, suitable for adaptive hp-meshes. In this study, the efficiency, accuracy, and robustness of the method is further studied in the application of environmental vibration assessment.
This paper presents a novel multigrid fully coupled method for the quantitative assessment of environmental vibration impact prior to building construction. The method involves the integration of macroscopic station and building modeling, mesoscopic track grid topology optimization, and an improved wheel-rail contact algorithm to establish a multigrid metro vehicle-track-station-soil-building fully coupled model. The proposed multigrid method greatly improves the computational efficiency of the 3D analysis approach by optimizing the number, shape, etc. of the finite element mesh, while achieving high computational accuracy. The specific data on the vibration at various positions of the building obtained by this method can be used to guide vibration assessments and mitigation measures. A case study is conducted on the opera theatre adjacent to a metro station, wherein the vibrations of the vehicle, track, station, soil, and theatre are calculated. The results of the metro vehicle, track, station, and soil are validated using literature and field tests, while the calculated theatre vibrations are used to assess the environmental impact. Finally, the mechanism of excessive vibration and the effectiveness of targeted vibration mitigation measures are analyzed.
Multigrid fully coupled method
Multigrid simulation
The propagation of elastic waves in three-dimensional solid media can be described in equation (1). It can be solved to obtain the propagation characteristics of vibrational waves in the medium. When conducting dynamic simulation of subway-soil-structure interaction using the finite element method, the continuous media is discretized by dividing the grid, which may result in a low-pass effect during the propagation of vibration waves in the soil. That is, after the continuous media is discretized by the grid in the finite element method, a cut-off frequency-

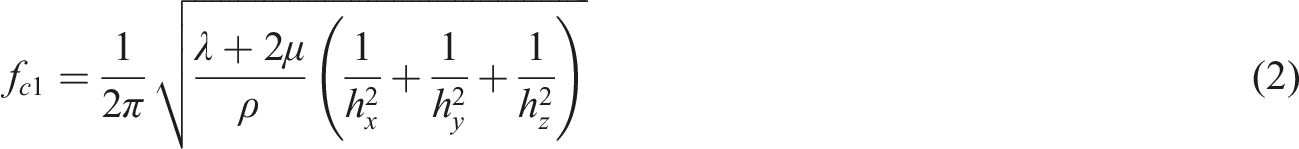
The propagation of vibrations caused by the subway is a problem of a vibration wave propagating between three-dimensional solids, and there is also a cutoff frequency during the propagation process. According to the vibration characteristics of the plate, the shear wave velocity on the plate is
To obtain accurate numerical solutions in finite element analysis of dynamic problems, it is necessary to use fine discretization grids that ensure the finite element cutoff frequency- 1. Wheel-rail contact constitutive modeling
The contact between wheel and rail is a type of contact collision problem in mechanical systems, and the finite element method is an effective approach for solving contact collision problems. In the finite element contact algorithm, contact search and contact force algorithms are the core components for calculating contact collision interfaces.
The paper adopts the master-slave algorithm, in which the two contact surfaces between the contacting bodies are designated as master and slave surfaces, respectively. The slave point is not allowed to penetrate the master surface, but the master point can penetrate the slave surface. The contact search is conducted in three steps: in the first step, a global search is performed based on the slave point on the slave surface, and the nearest master point on the master surface to the slave point is found. All master blocks around the nearest master point and the slave point form a testing pair. In the second step, the nearest master block to the slave point is found from all master blocks around this master point. In the third step, the target point location on the nearest master block is determined for the slave point, and the penetration amount of the slave point relative to its target point is calculated. Based on this penetration amount, it is determined whether the slave point contacts the nearest master block or not.
Tabular relationship and nonlinear penalty method are adopted to define pressure-overclosure relationship constraint enforcement method, as shown in Figure 1. The Tabular method defines the relationship
34
between contact pressure and overclosure/gap in a segmented manner, where the overclosure/gap is negative for the initial segment, indicating overclosure contact. Each segment is a linear relationship, and the overall trend is positively correlated. Beyond the defined range of the table, the relationship between contact pressure and overclosure/gap is extrapolated based on the slope of the last segment. The penalty method is used to approximate the defined contact pressure-overclosure constitutive relationship, allowing for a certain degree of penetration when overclosure is slight. When using the nonlinear penalty constraint method, the contact pressure-overclosure constitutive relationship is divided into four stages: no contact, first constant, enhanced, and second constant stages, with contact stiffnesses of 0, constant, linearly increasing, and constant, respectively. Wheel-rail contact constitutive relation (a) Tabular relationship (b) Penalty stiffness of nonlinear penalty method (c) Contact pressure of nonlinear penalty method.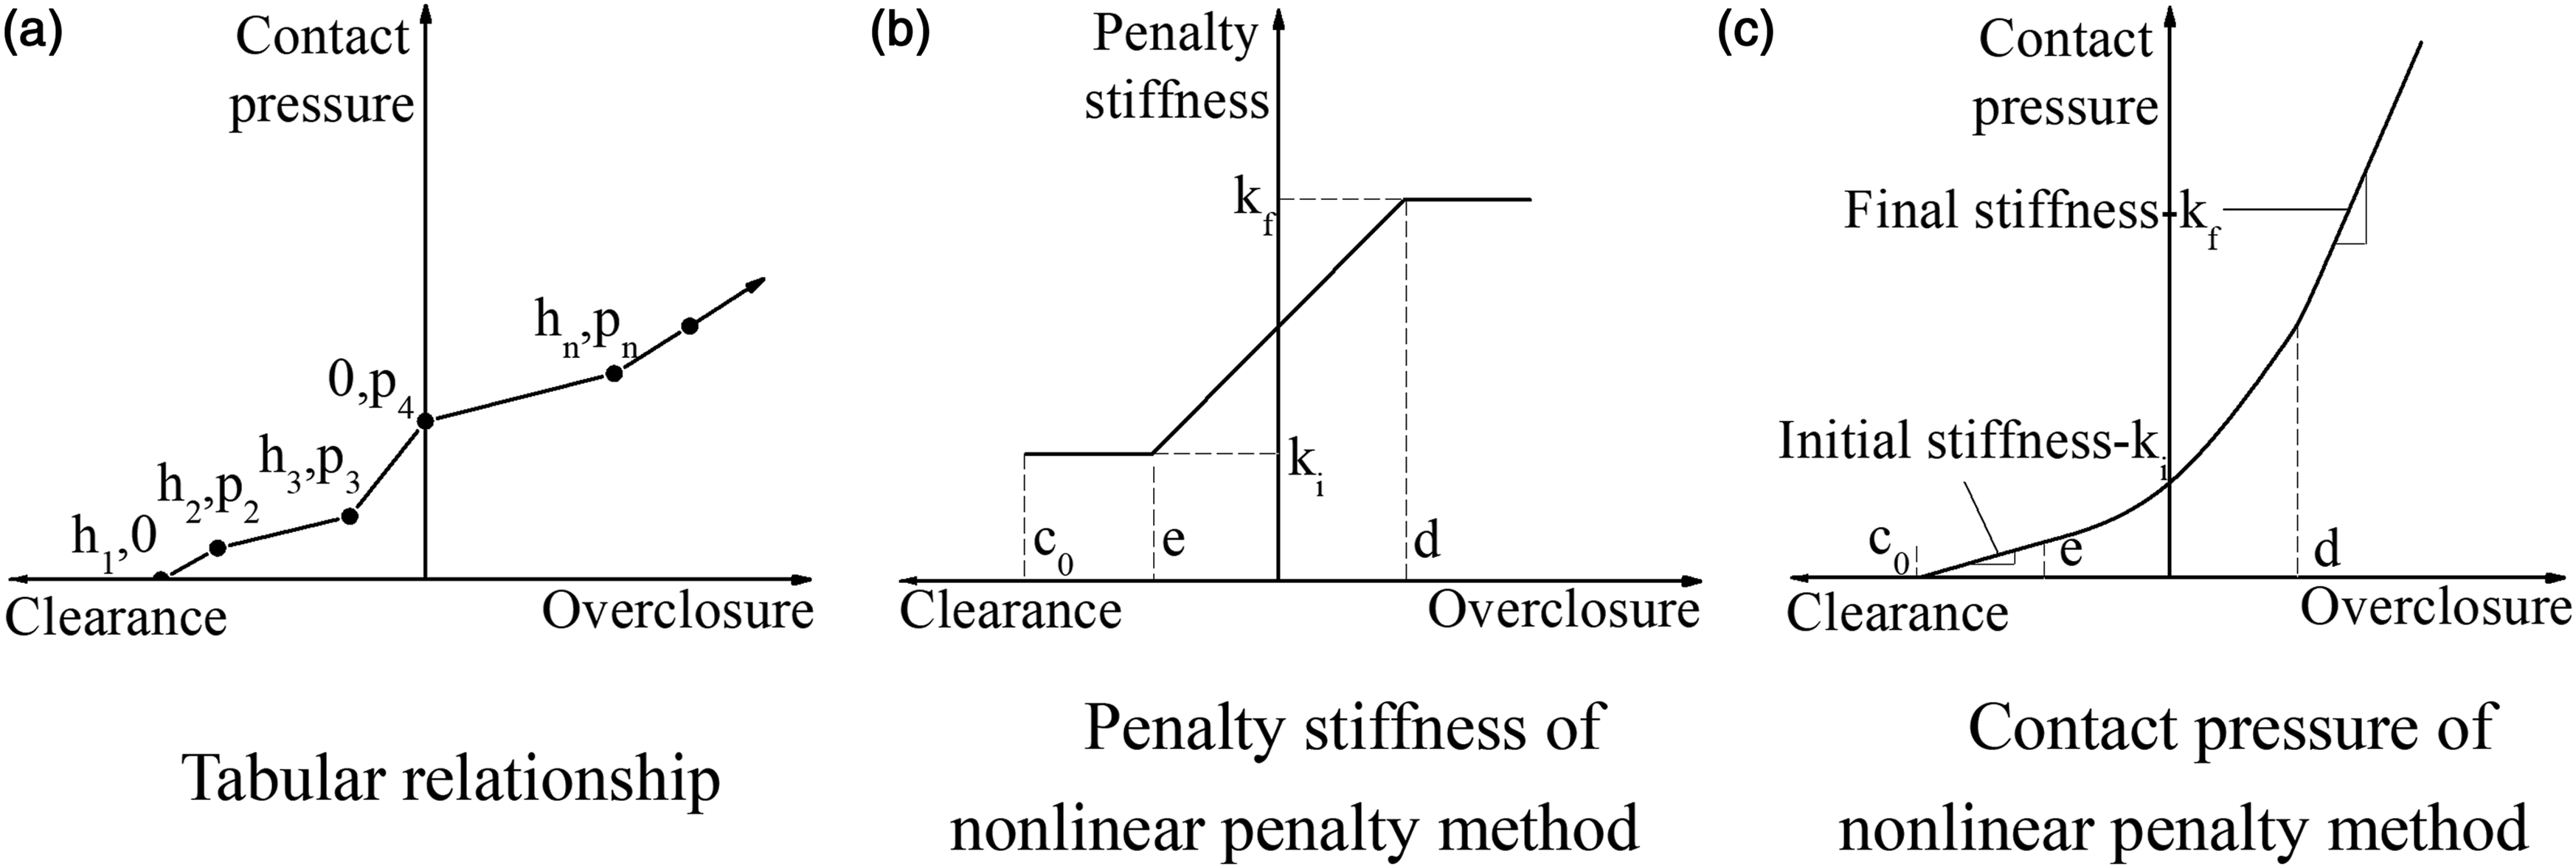
After determining the contact search and contact force algorithms, the specific calculation steps are shown in Figure 2. The semi-discrete equation of the Lagrangian format of the mechanical system can be obtained from the weak form of the momentum equation in the finite element method Finite element contact calculation process.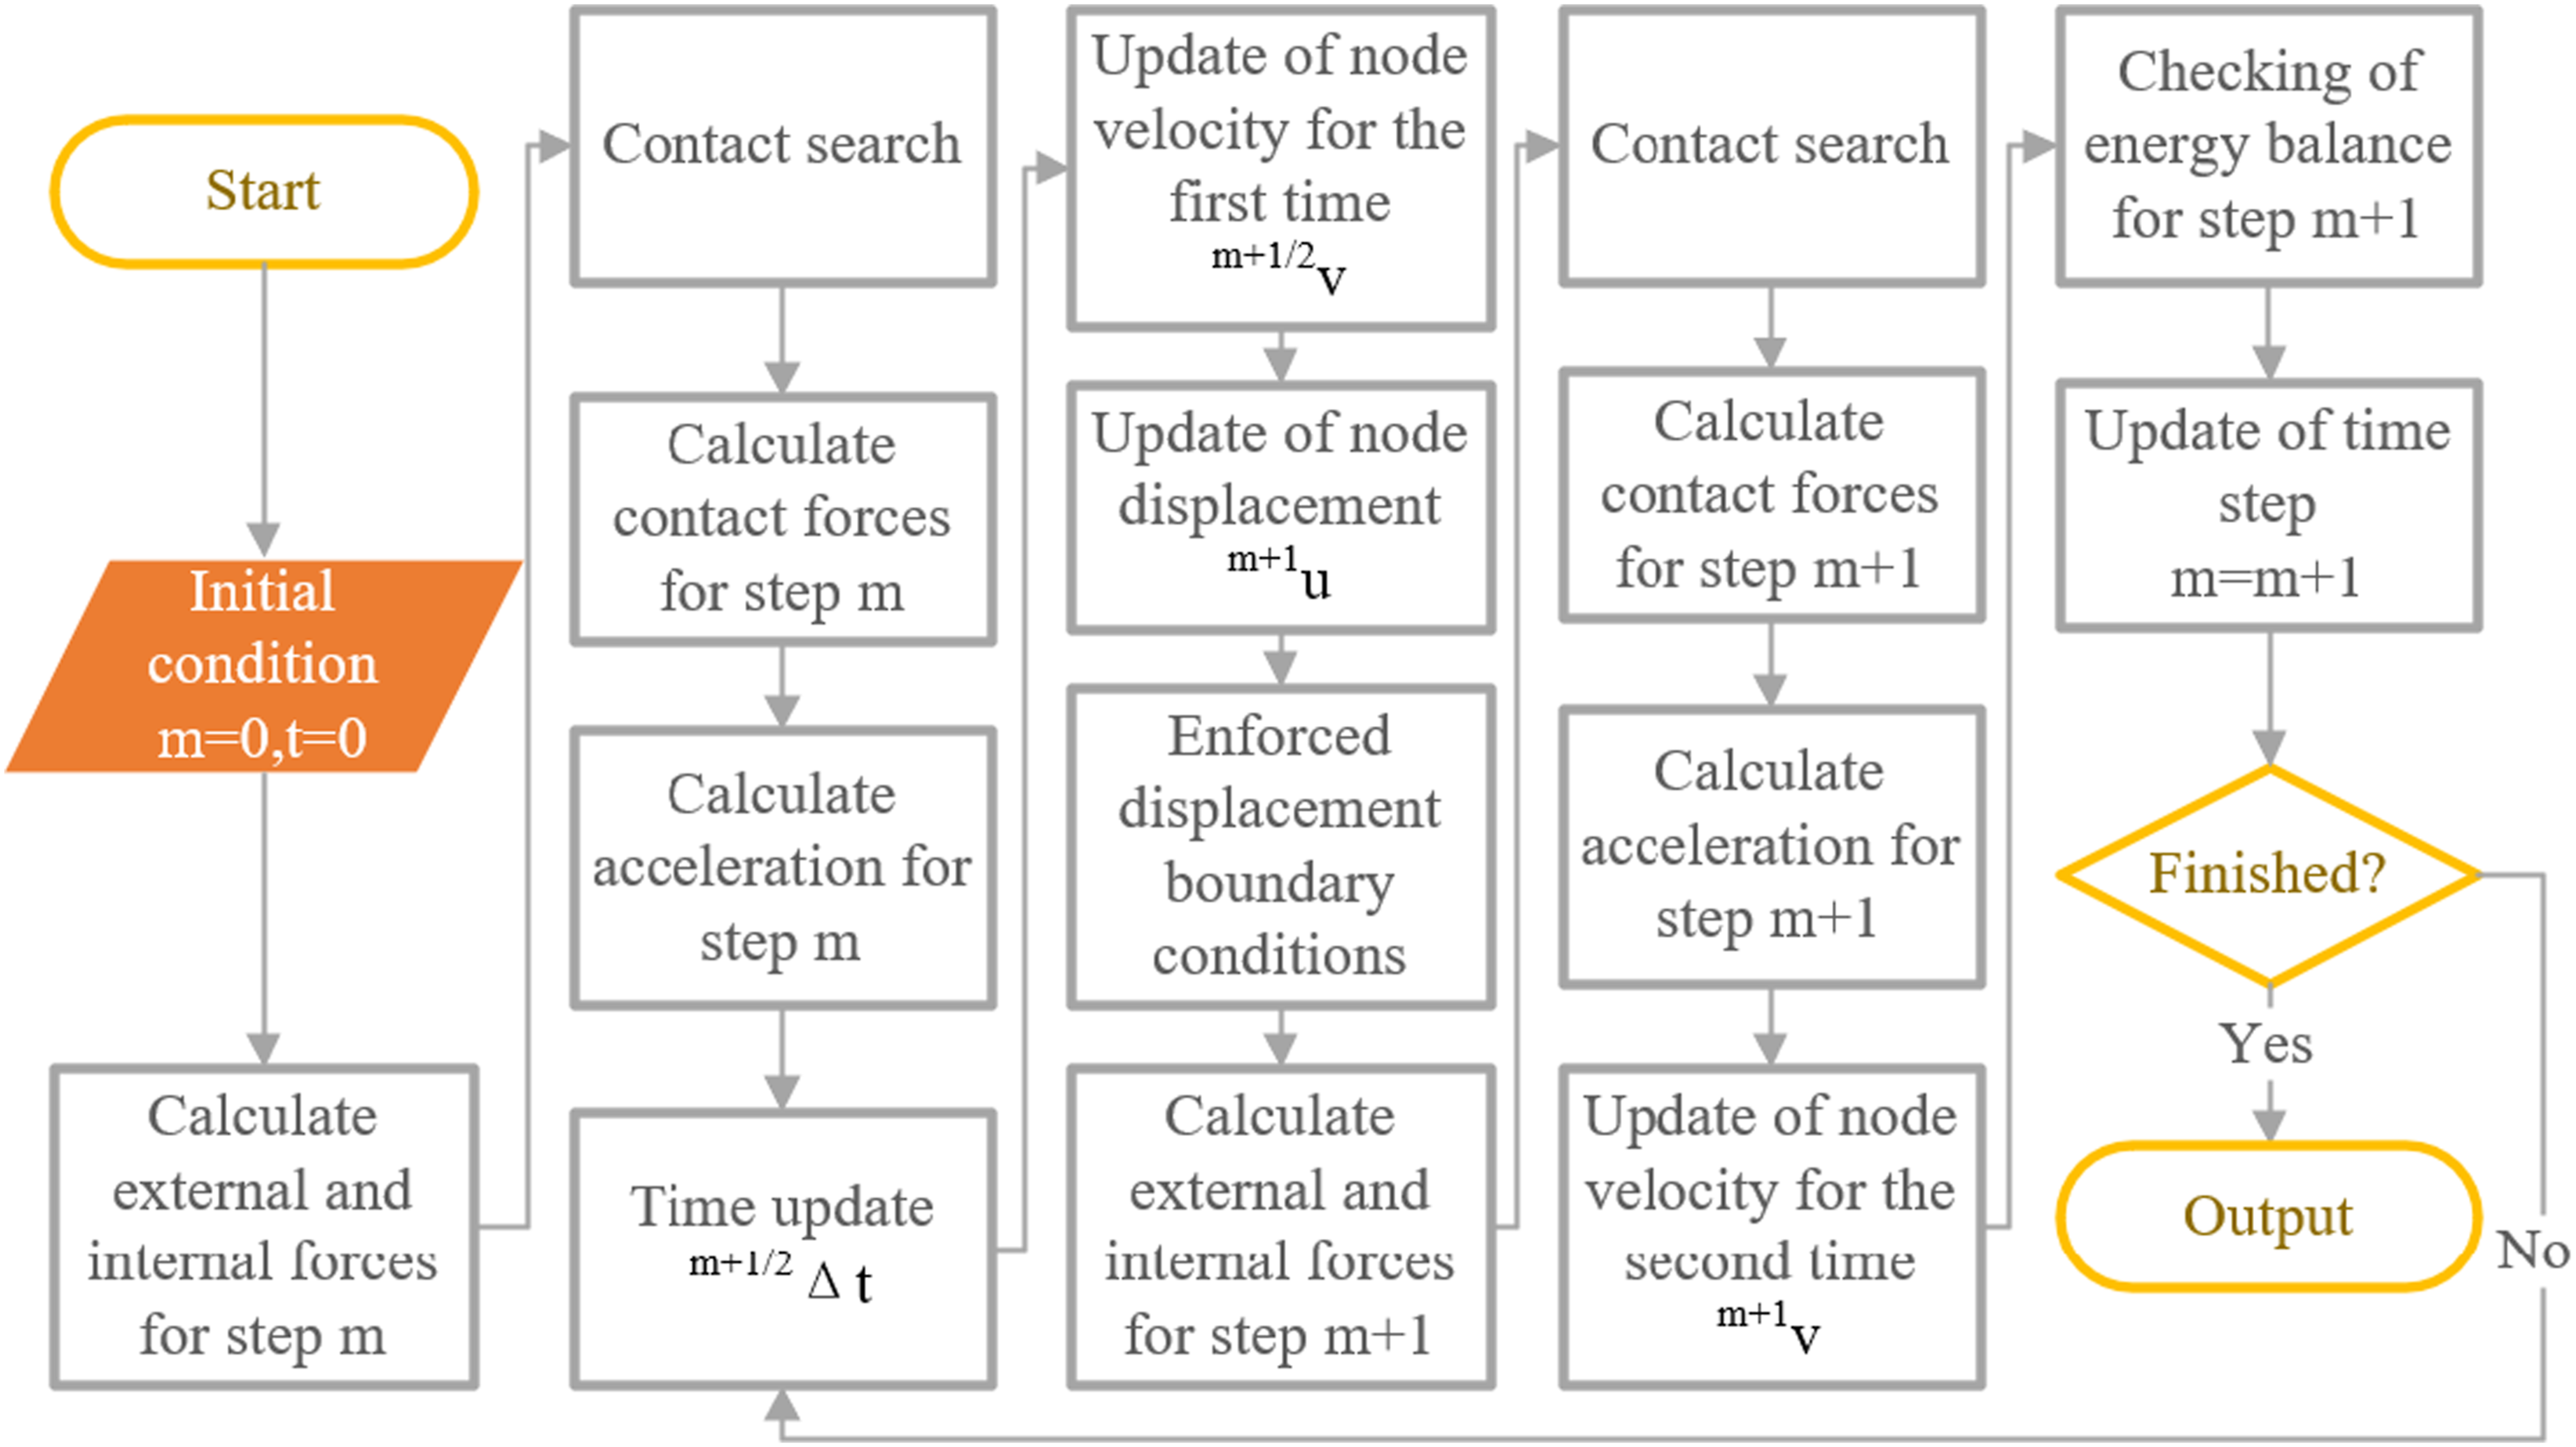

In this paper, the wheel is modeled as a rigid body and the rail as a discretely deformable body in the wheel-rail contact. The main contact surface is selected as the wheel during the contact definition. Four types of grid densities are set at 0.005 m, 0.01 m, 0.05 m, and 0.1 m. Considering that the transmission characteristics of vibration waves vary with grid sizes, the grid division of each structural part is made as uniform as possible, as shown in Figure 3. The calculation results of an example using this model for wheel-drop impact are shown in Figure 4. Wheel drop case and rail grid generation. Results at different grids (a) Wheel/rail force (b) Displacement (c) Contact stiffness.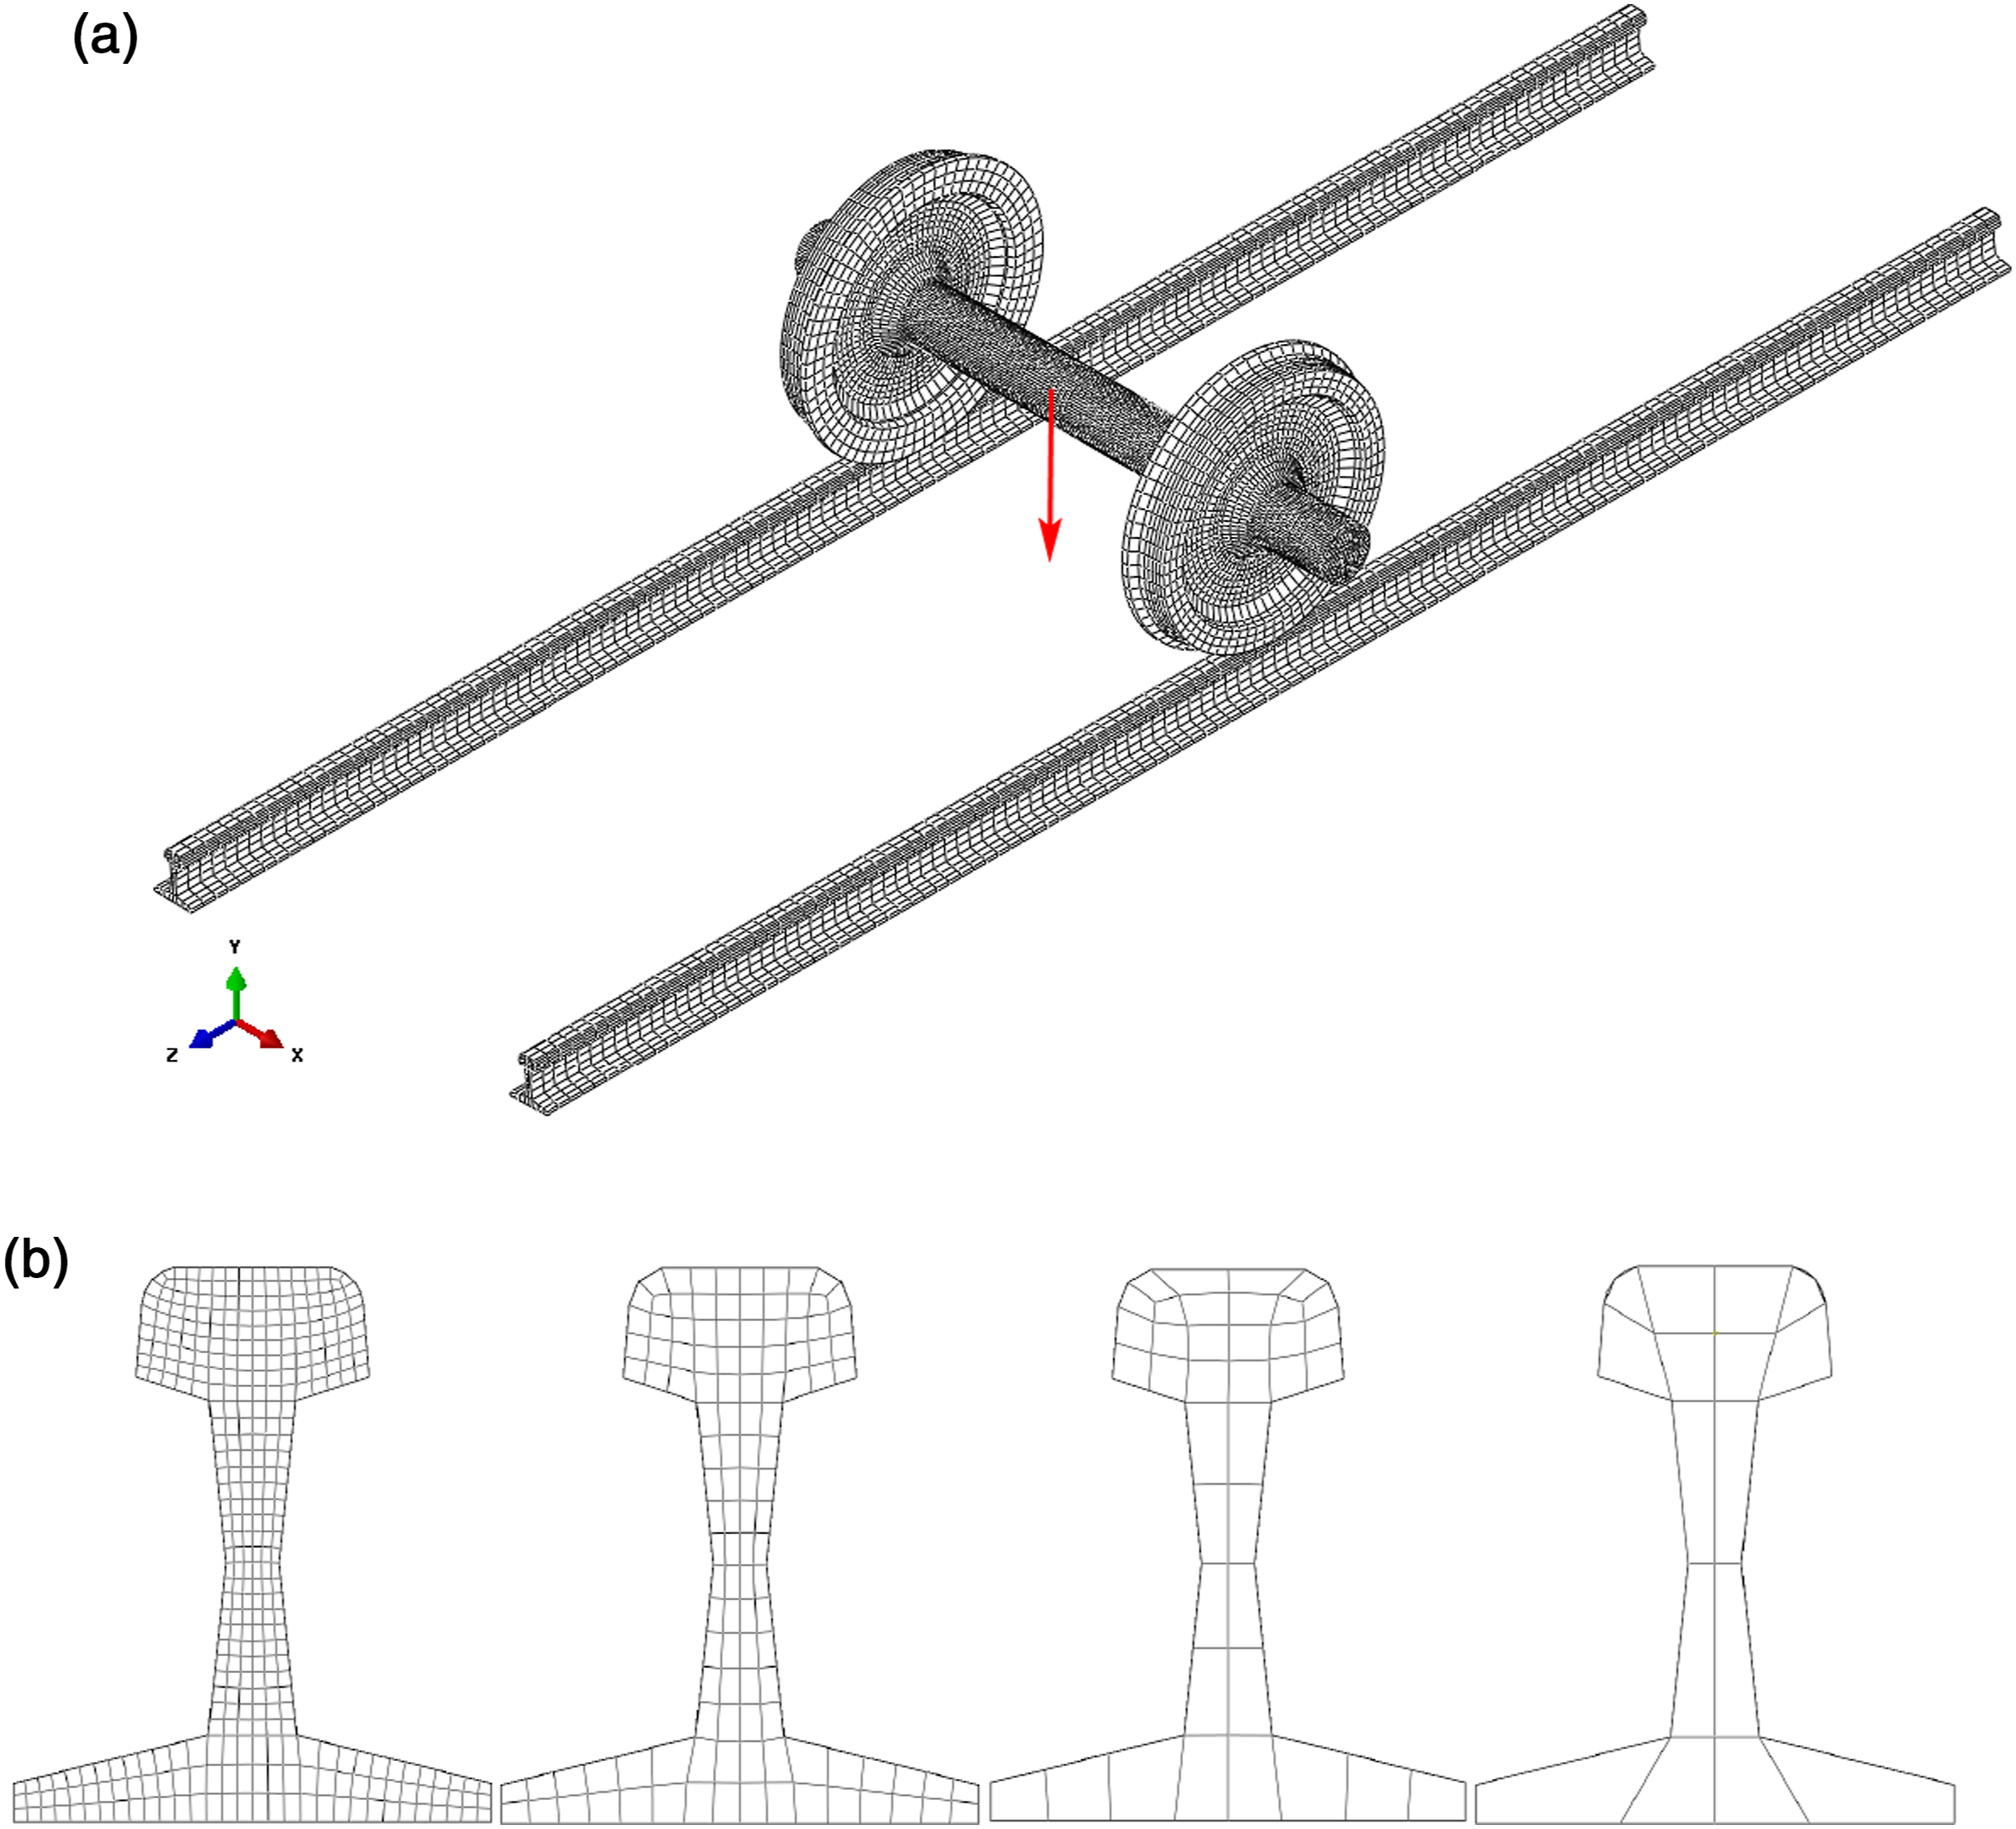
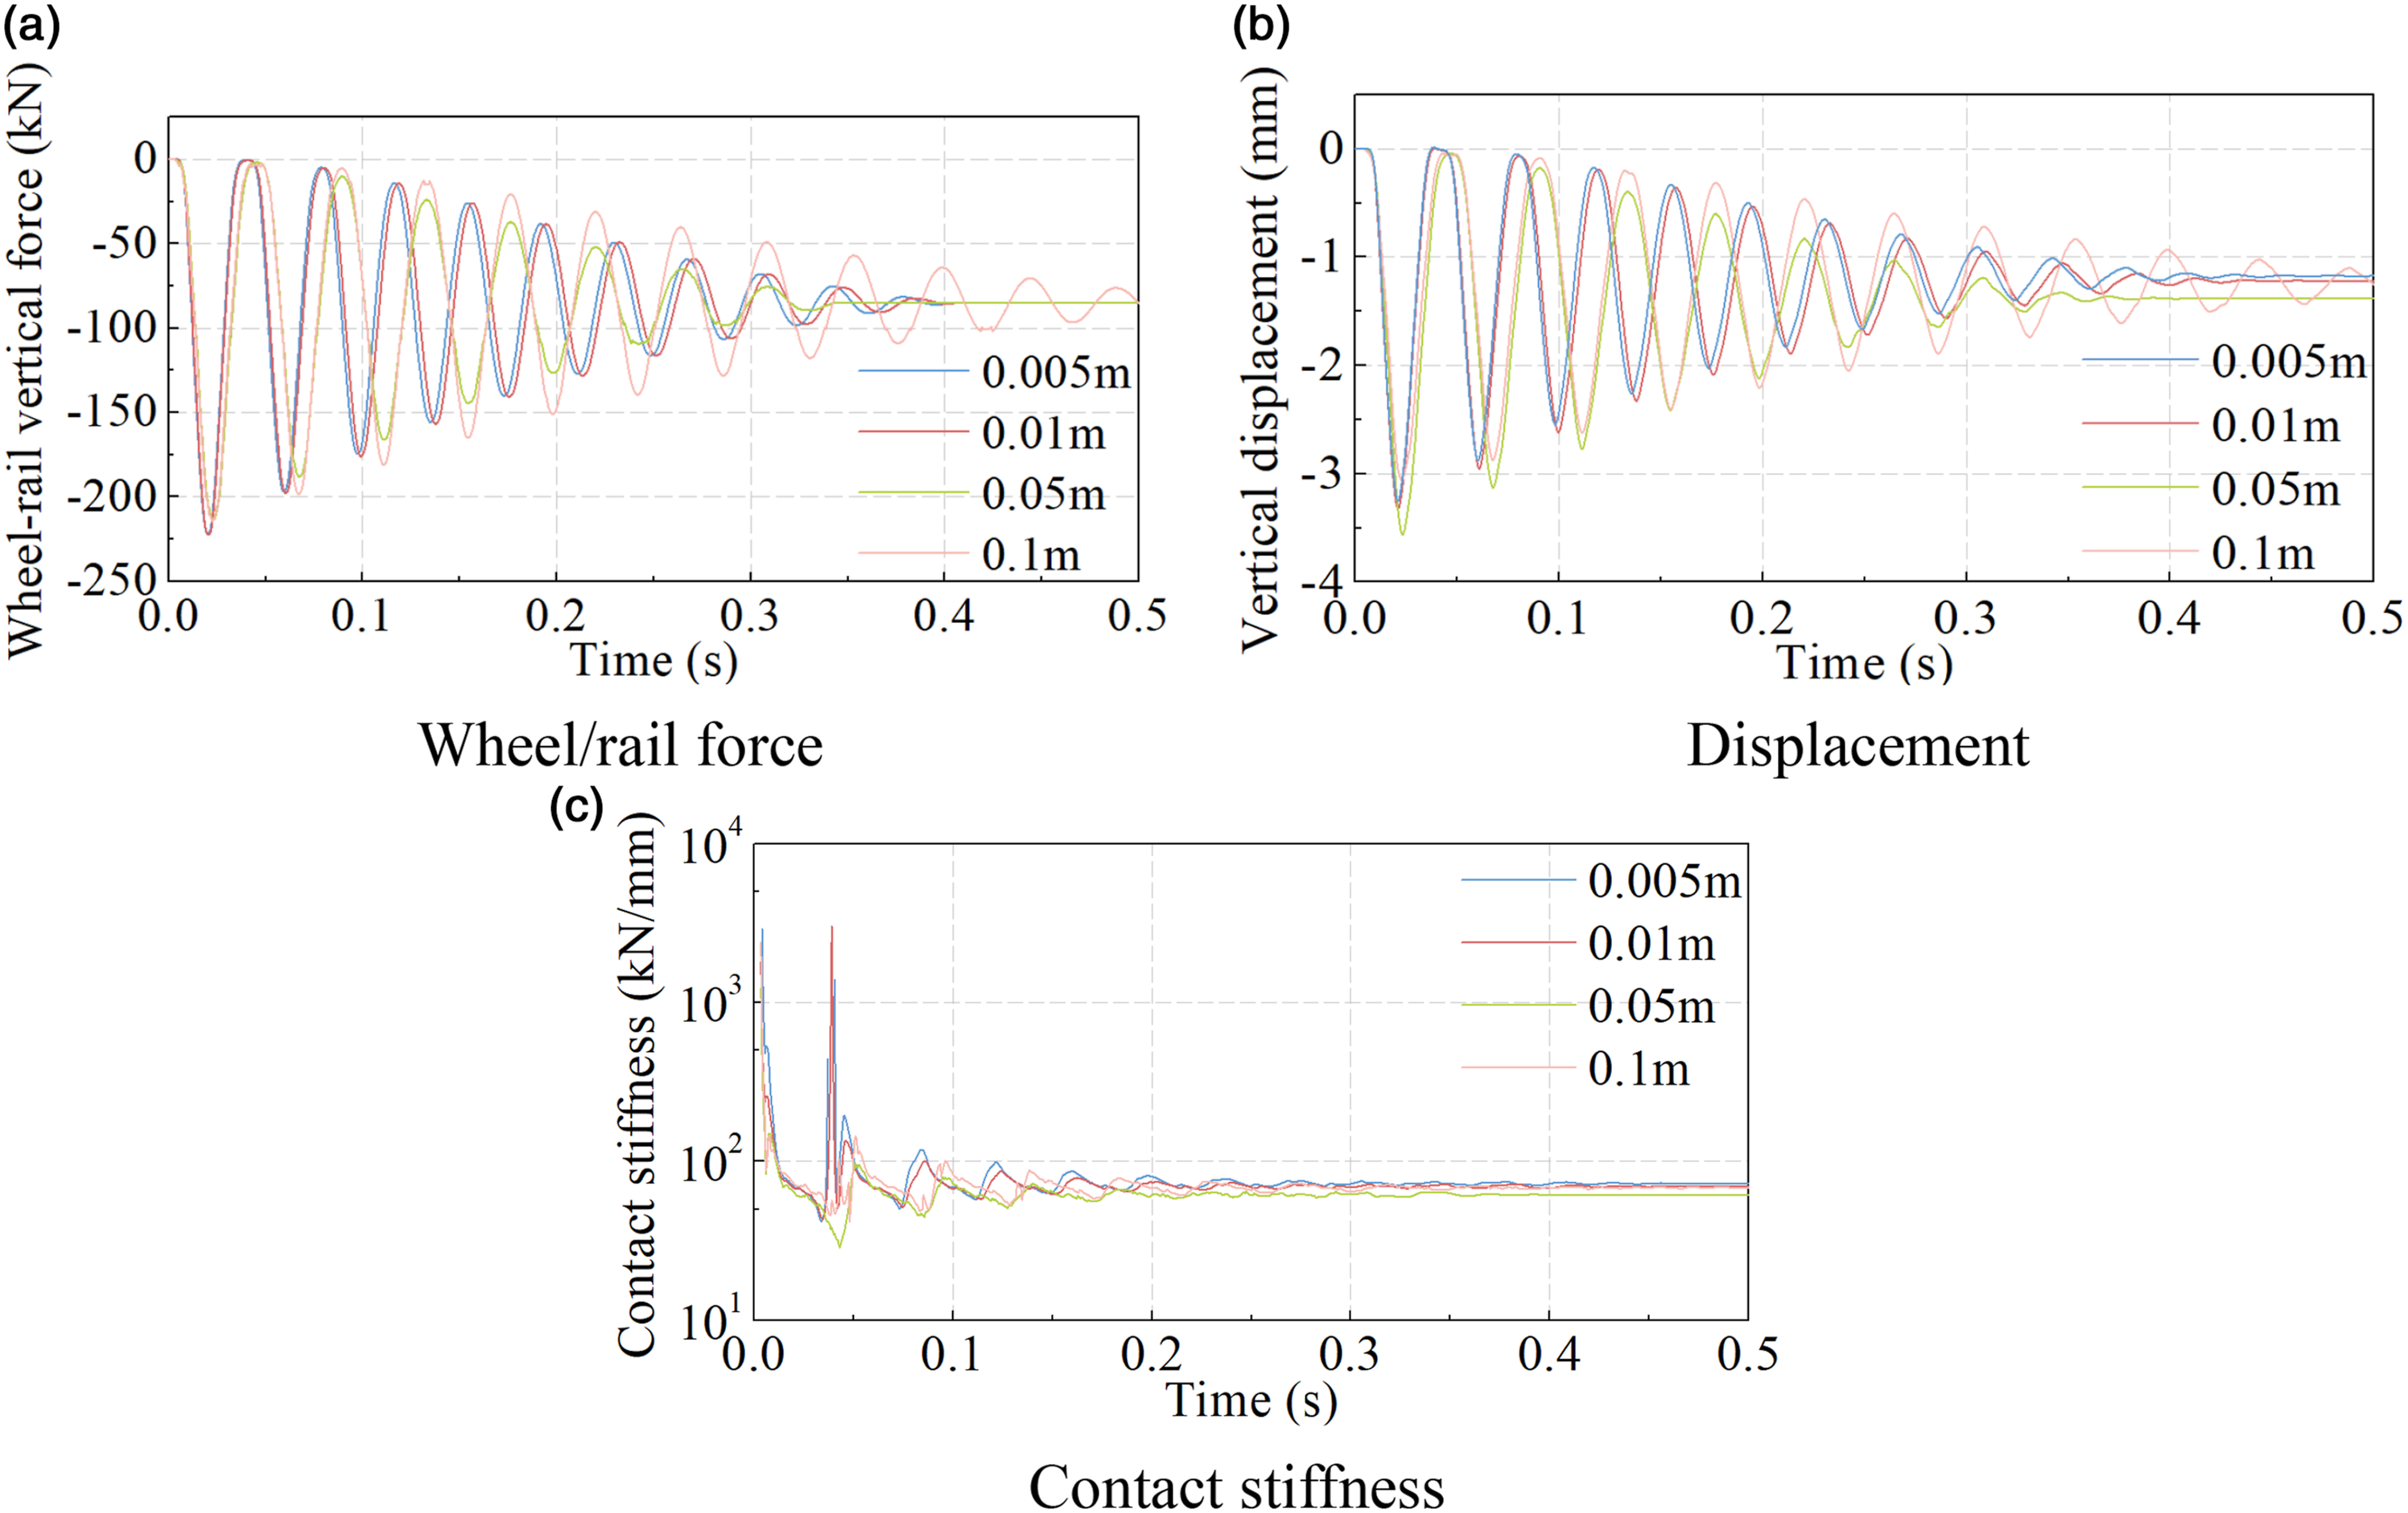
After analyzing the vertical force and displacement time history graphs of the four grid conditions in the wheel-drop calculation example, it was observed that the 0.1 m grid exhibits slow attenuation of wheel-rail force and displacement, and has not reached equilibrium state after 0.4 s. This suggests that the 0.1 m grid accuracy is inadequate and may lead to significant errors, failing to meet the requirements of dynamic calculations. On the other hand, the peak amplitude of the 0.01 m grid condition is comparable to that of the 0.005 m grid condition. The linearity of the results changes as the grid becomes finer, and the frequency of wheel-rail vertical force and displacement fluctuation decreases as the grid becomes more refined. When the grid is refined to 0.01 m, the influence of further refinement on the results diminishes.
Based on the calculation of wheel-rail vertical force and vertical rail displacement, the contact stiffness can be obtained. It can be seen that both the 0.005 m and 0.01 m grids exhibit two distinct peaks within 0.05 s, while only one peak appears with the increase of grid size. This indicates that the contact stiffness characteristics are different under different grid density conditions. Therefore, in order to ensure the accuracy of the wheel-rail contact simulation, the grid size should be around 0.01 m. 2. Grid and corresponding mode of track and station
Vibration is the superposition of various modal shapes, and accurate modal shapes are a prerequisite for precise vibration prediction. In finite element analysis, the original continuum is divided into many small finite element units, each of which is assigned a grid. The modal shapes on these grids are determined by calculating the degrees of freedom of each element, that is, the displacement and velocity on each element. Therefore, the size and distribution of grids in finite element analysis have a significant impact on the calculation of modal shapes and the accuracy of results. For the steel rail, track plate, and station structure, the grids are shown in Figure 5. The first three mode shapes of each component are displayed in order of increasing characteristic frequency. Mode shape of rail, slab and station (a) Rail mode shape (b) Slab mode shape (c) Station mode shape.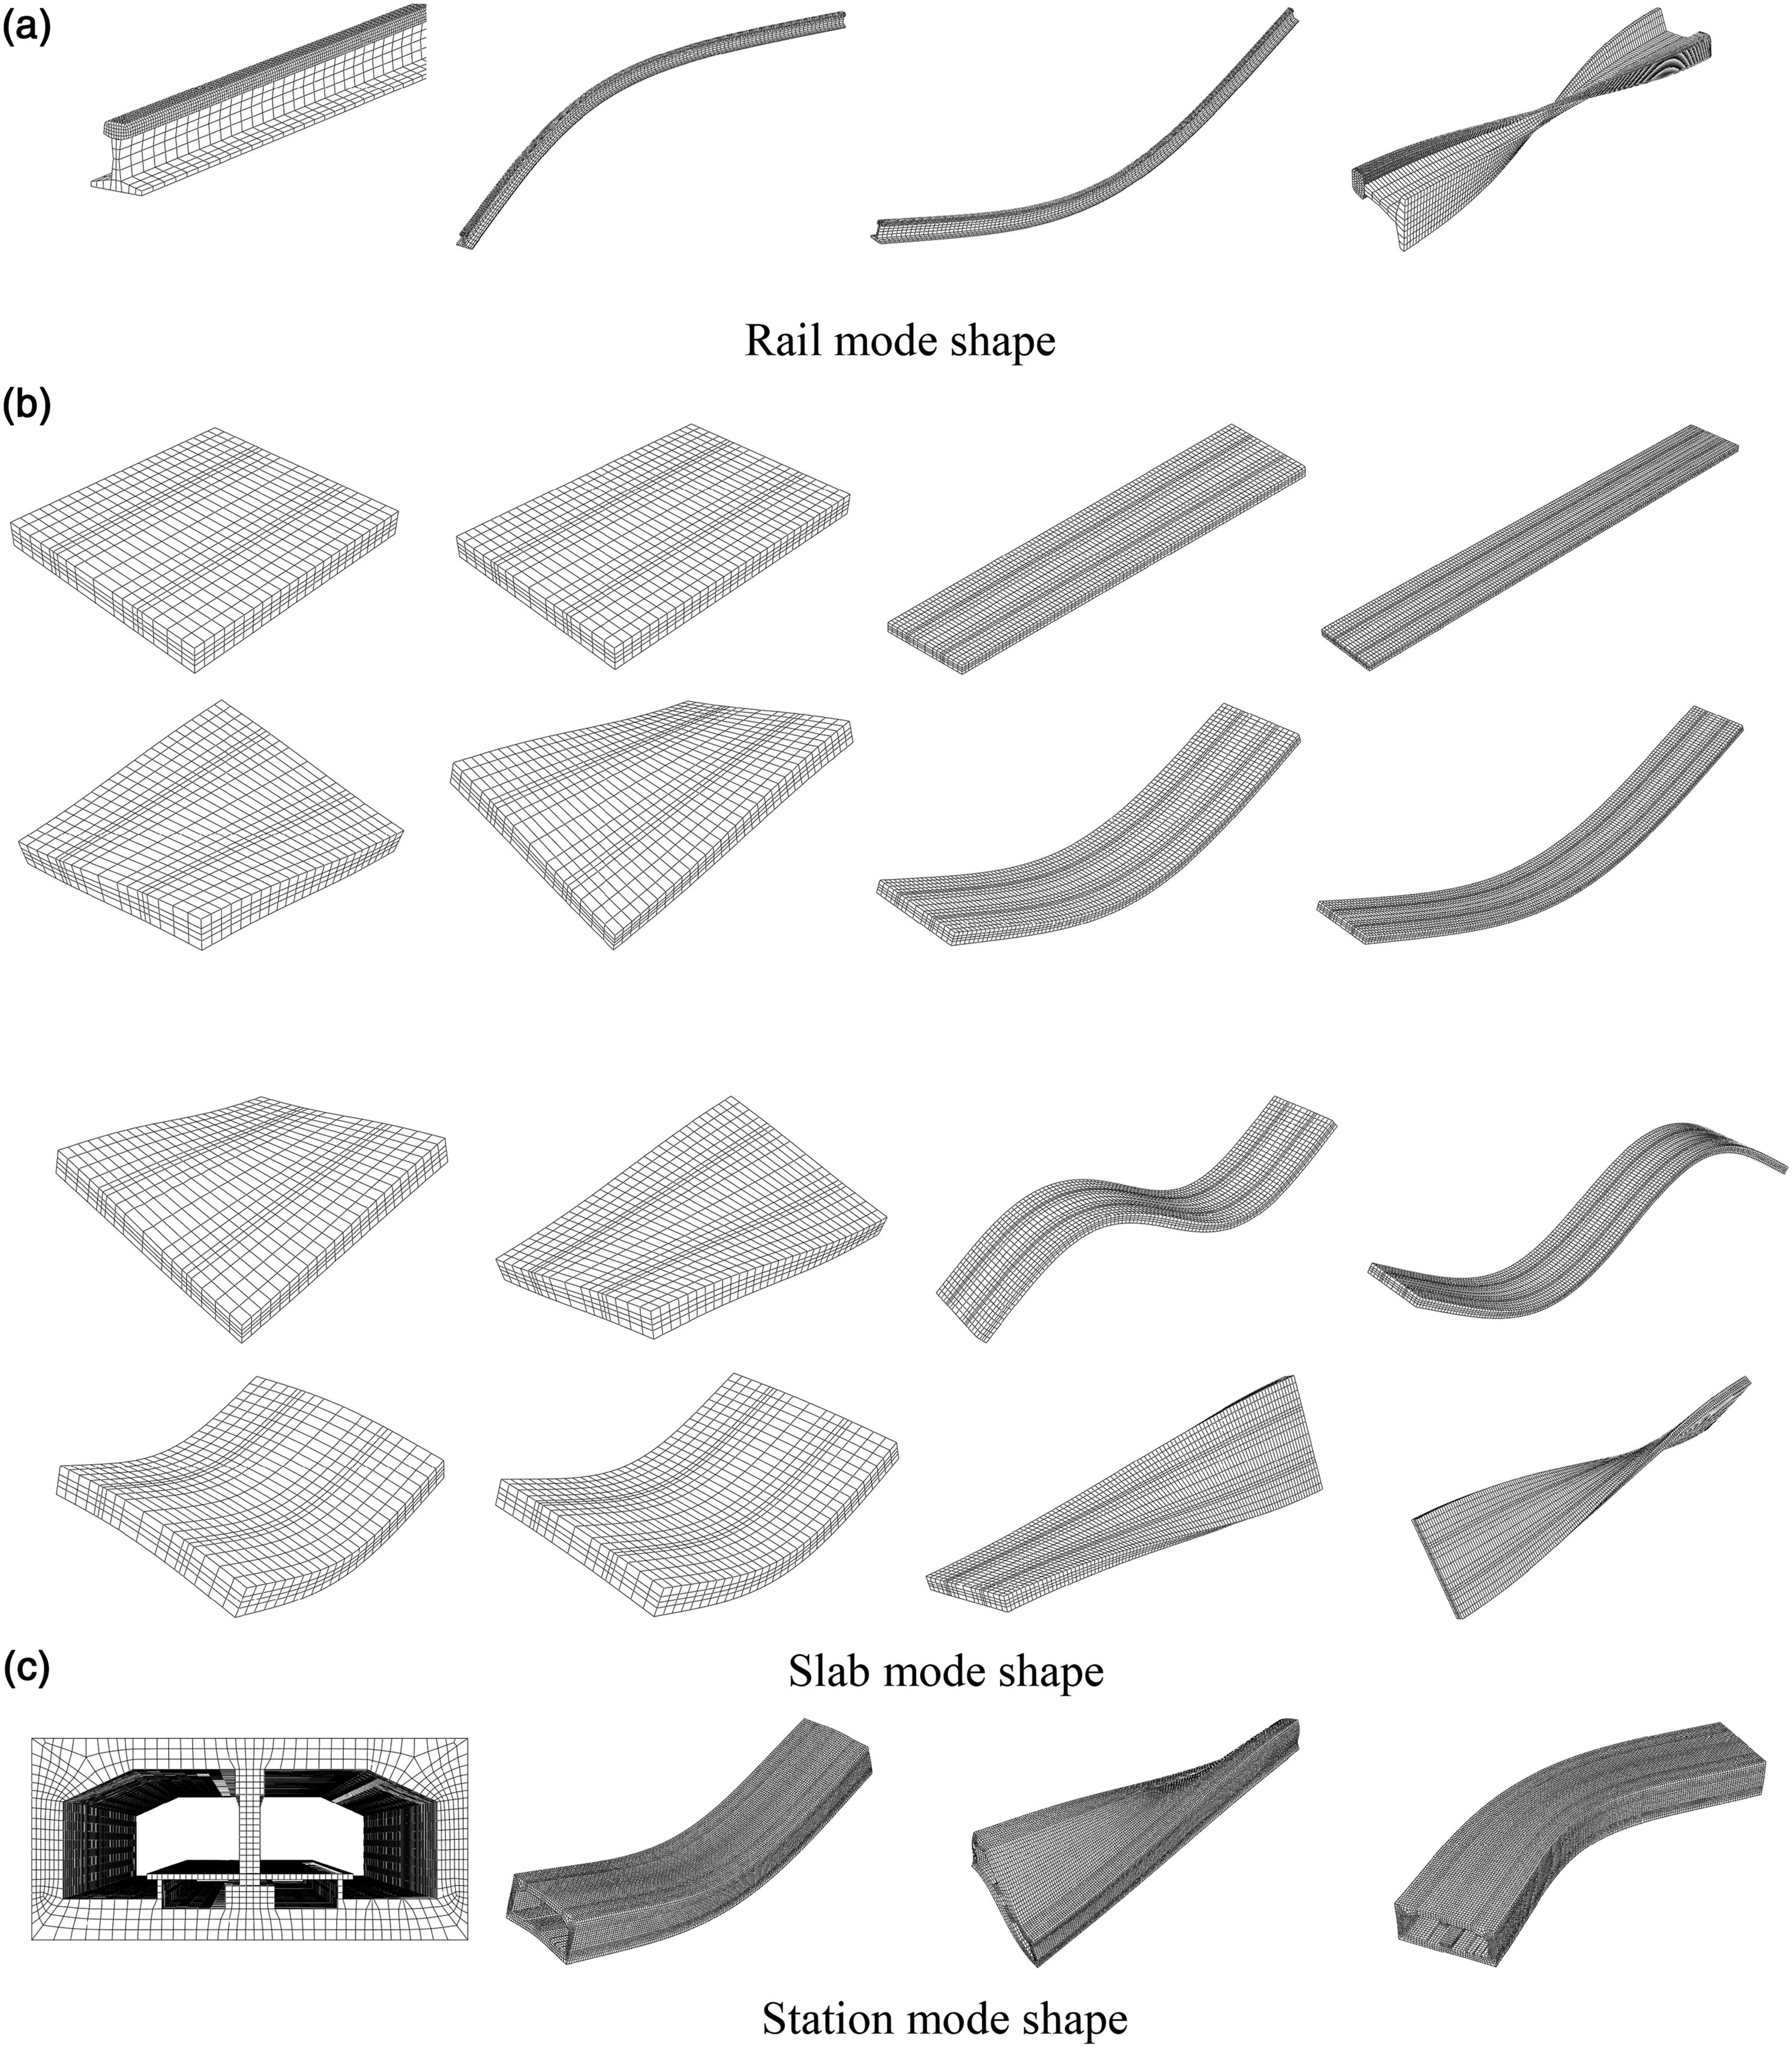
For rail modes, grid size has little effect on the mode shape, but it does have a certain effect on the frequency at which the characteristic mode appears. For a 6 m long steel rail with a 0.05 m grid size, the first-order lateral bending corresponds to a frequency of 13.390 Hz, while for a 0.01 m grid size, it is 13.537 Hz, a difference of only about 1%. Considering the requirements of wheel-rail contact on the grid size of the contact surface of the steel rail, a grid division of 0.01 m for the railhead and 0.05 m for the rail waist is adopted, resulting in a first-order lateral bending frequency of 13.422 Hz. The slab grid needs to be divided based on the position of the fasteners to realize the connection between the rail and the slab. For the slab, the vibration modes of cast-in-place long slabs (15 m, 25 m) and prefabricated short slabs (3.6 m, 4.8 m) are different. The short slab first exhibits a torsional mode and then a bending mode, while the first two modes of the long slab are bending modes, and the third mode is a torsional mode. For an island-type station, its first three modal shapes are first-order vertical bending, first-order torsion, and first-order lateral bending. 3. Model size and grid strategy of soil and building
The appropriate selection of model size can have a significant impact on the accuracy of calculation results. If the model scope is chosen to be very small, a large error in the calculation results may occur due to the influence of boundary conditions. Therefore, it is important to reasonably select the model size when conducting dynamic analysis. In finite element dynamic analysis, the distance from the truncation boundary of the model to the vibration source should not be less than the maximum half wavelength of the medium

In addition, the soil is layered according to its geological characteristics, and the grid gradually transitions from dense to sparse as it moves outward from the station. The beams, columns, and walls of the building model adopt a fine grid, while the slabs use a rough grid as shown in Figure 6. The left hole is located at the position of the underground station. The station model shown in Figure 5(c) is embedded in the tunnel, and the station interacts with the soil by establishing binding. Grids of soil and building (a) Layered soil (b) Stereogram of building.
Fully coupled VTSST model
In this study, an integrated dynamic simulation prediction method of vehicle-track-station-soil-theatre (VTSST) is established based on finite element and dynamics theory. The coupling principle is derived from the vehicle-track model, 35 which has been verified and applied to many dynamic problems. In this method, the wheel/rail interaction force is calculated considering the influence of the track deformations, the station, and the soil. The vehicle’s dynamic response and the substructure’s vibration interact with each other at every moment. The influence of the soil and building mass is factored in the calculation of the acceleration vibration response.
Based on the integration theory of coupling, a VTSST numerical simulation model is established to predict the dynamic response of the system and the impact on the opera theatre. The irregularities of the rail and the wheel are input as the excitation mechanism factors.12,36,37 A multibody system models the vehicle. The track, the station, the soil body, and the opera theatre are elaborately modelled using the finite element method. 34 The components are correlated by the wheel/rail interaction, deformation compatibility, and interface spring. An integrated dynamic model of the vehicle-track-station-soil-theatre coupling system is ultimately formed through the coupling interfaces. The vibrations of the vehicle and the track can be used to validate the method with the literature contrast and the field test.38,39 After confirming the validity and reliability of the model, the predicted theatre vibrations can be used to assess the influence of the metro-induced vibration and provide a foundation for mitigation measures.
The completed model is shown from the front view, the side view, the vertical view, and the aerial view in Figure 7. The FE model fully considers the vehicle’s degrees of freedom (DOFs),
12
the detailed geometry of the track, the station, the theatre and the layering of the soil. The Type-B vehicle in the model is the most common rolling stock of the Beijing Metro, with a carrying capacity of 245 passengers per car and a top speed of 80 km/h. The common slab track
40
includes rails, a fastening system, a track bed from top to bottom, and the concrete sleeper block and the track bed are poured together. As the vibration source of metro-induced vibration, the detailed model of the track structure is crucial and has a tremendous influence on the subsequent analysis of vibration reduction. The measured data acquired the rail model’s horizontal and vertical irregularity in the Beijing metro. The wheel out-of-roundness is specified according to EN15313 and Wheel-Rail Interface Handbook.36,41 FE model of the vehicle-track-station-soil-theatre coupled dynamic system.
The parameters in the model are selected according to the actual project and engineering experience. The critical parameters for modelling the train’s effect on the track-substructure system’s dynamic responses are the inertial characteristics, suspension parameters, characteristic lengths, elastic modulus, and fastener features. 42 The artificial boundaries were set around the soil to avoid the boundary effect of the vibration wave reflection. 43 The North Kunqu Opera Theatre has nine terrace-backwards floors aboveground with an area of 23,616 m2, three floors underground with an area of 6585 m2, and an underground burial depth of 20.5 m. There are three stages in total, one on the first floor as the main stage and the other in the first basement with a buried depth of 10.6 m. Regarding the opera theatre building model, there is a YJK-ABAQUS interface program that can export the inp file from the ArchiCAD design software. With the inp file, the finite element software can generate the opera theatre model, including the section, material, and load of the beam, slab, column, wall, and other components.
Multi-layer soil body parameters.
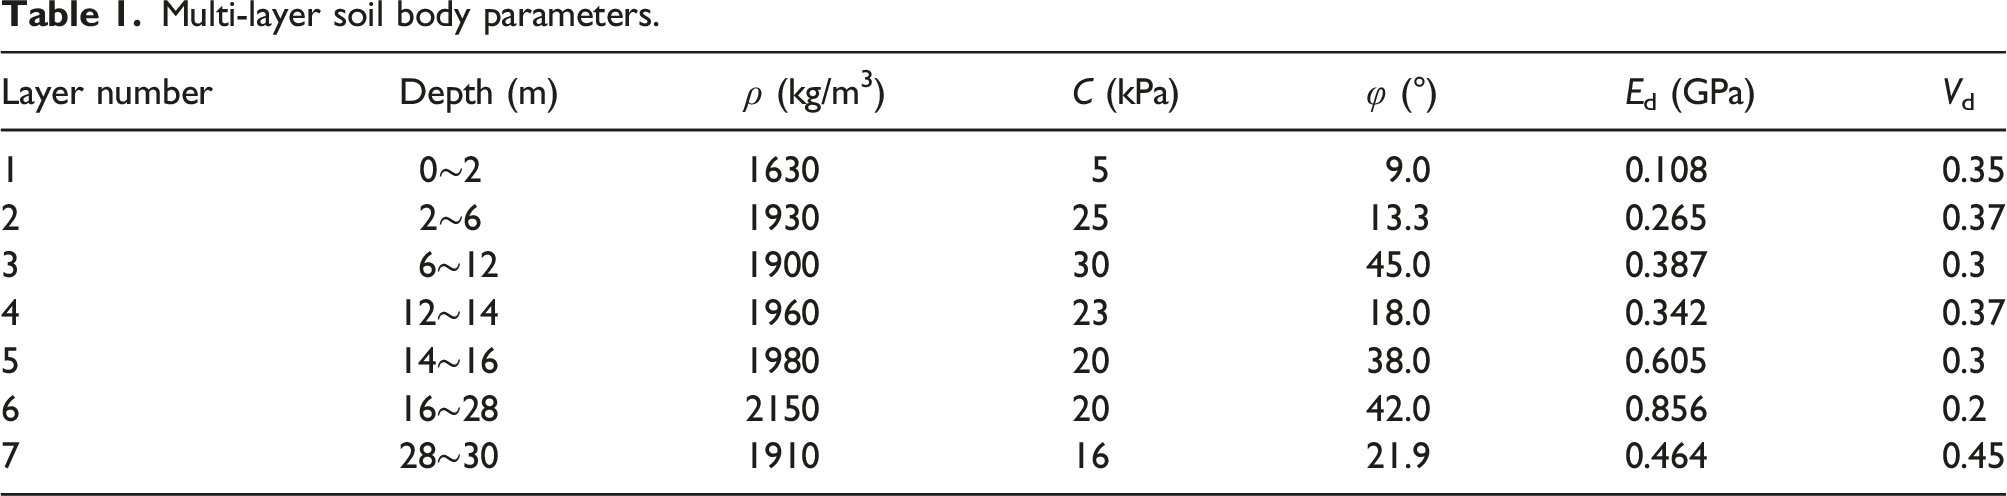
The interaction consolidates each substructure into a whole. The wheel/rail interaction is based on the Hertzian nonlinear elastic contact theory 45 and the nonlinear friction coefficient in the normal and tangential directions, respectively. The track and the station interact with each other with the interface spring. The station and the opera theatre are embedded in the soil and meet the deformation compatibility.
Result and discussion
Case introduction
To meet the demand for reverberation effect and audience capacity, the North Kunqu Opera Theatre needs to be reconstructed and upgraded. Limited by insufficient urban land, the North Kunqu Opera Theatre has to be rebuilt above the Beijing Metro Line 4 and near the Taoranting station. In this case, the nearest distance between the opera theatre and metro gauge is only 42 m and the buried depth of the station is only 20 m. The position relationship between the theater and the metro station is shown in Figure 8. The relative position of Beijing Metro Line 4 and the Northern Kunqu Opera.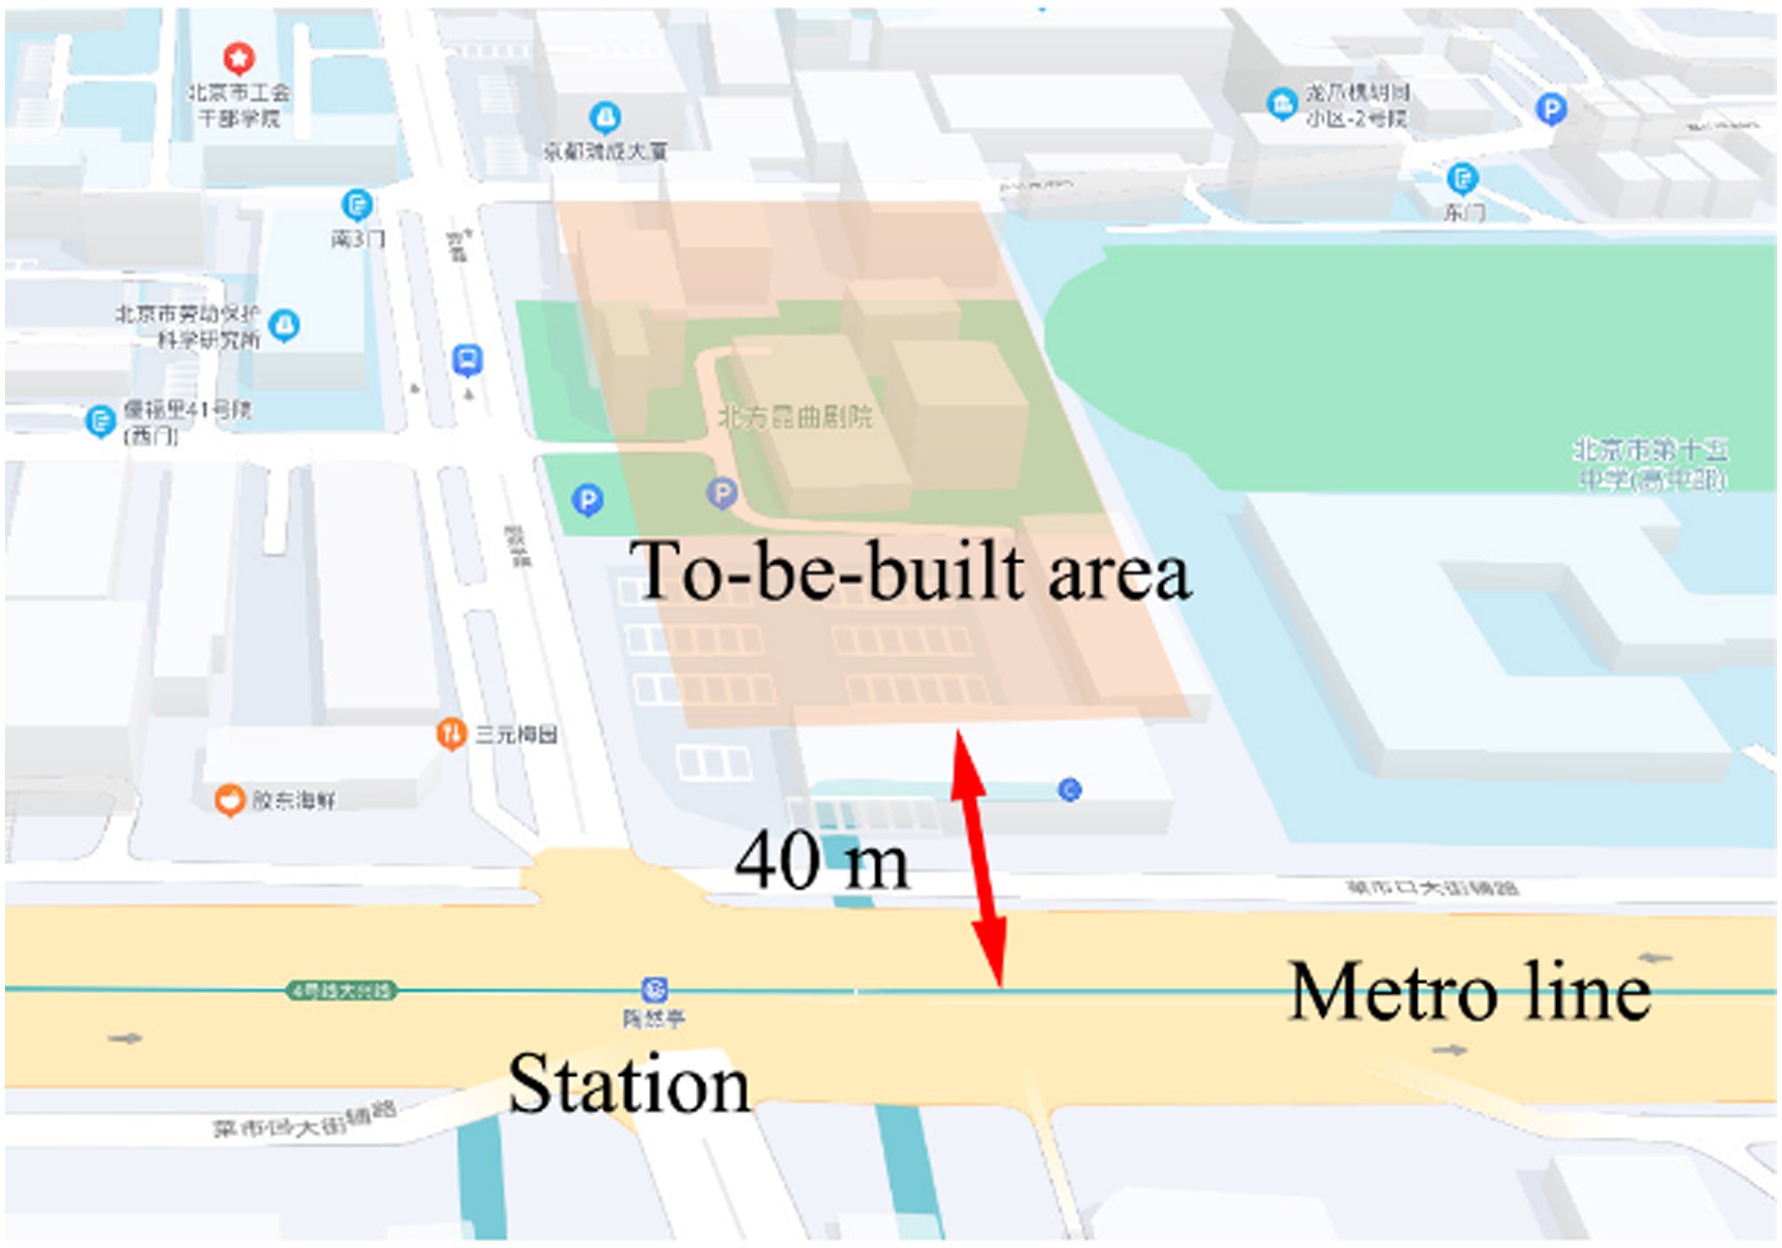
Model validation
Coupling theory has been fully verified and applied to many track dynamics studies.17,46–50 The prediction method fully considers the characteristics of the vehicle-track-station-soil-theatre system. To further validate the model, the predicted vibration of the station and ground is compared with the field measurement, as shown in Figure 9. Model validation tests of platform and ground.
The 1/3 octave band is defined such that the upper frequency edge is the cube root of two times the lower frequency edge. The vibration level is calculated as the logarithm to the base 10 of the ratio of the acceleration to the reference acceleration, multiplied by 20. The contrastive analysis of the 1/3 octave vibration level, the vibration propagation, and the vibration distribution, shown in Figure 10, is conducted through field tests and computer simulation. The field tests include detailed vibration acquisition on station platform, the ground vibration attenuation tests along the transverse direction of the line, and vibration distribution tests in the proposed area. The simulation results are obtained with a vehicle speed of 50 km/h in the station section. The 1/3 octave vibration level in the station is similar between the calculation and measurement. The vibration levels in the station of the two both change around 40 dB in the frequency below 32 Hz, and the peak values are both approximately 80 dB in the frequency of 64 Hz. Due to the stochastic nature of vehicle and track conditions, the complexity of geological conditions, and simplifying assumptions in the model calculations, it is impossible for the measured and simulated results to match perfectly. However, if the time-domain peak values are close, and the frequencies and magnitudes of the maximum spectral vibration levels are similar, it can be considered that the test and simulation results have a small difference. In such a scenario, the simulation model can be used for vibration prediction and assessment. As we move from the proximal to the distal areas of the site, the vibrations gradually decrease. However, further propagation leads to the emergence of an amplification area where the vibrations slightly intensify. The location of this area may vary slightly depending on geological conditions. Within the theater’s construction area, the vibration level primarily ranges from 60 to 70 dB, with the peak vibration level reaching around 80 dB. Based on the comparison results of the station vibration, vibration propagation, and distribution on the ground, the simulation model has been verified adequately and valid to predict the vibration induced by the metro. Test results and validation (a) Time domain validation (b) Frequency domain validation (c) Vibration level of theatre area.
Prediction results
With the proposed prediction method, the dynamic responses of the opera theatre in the time domain will be presented when the dynamic parameters of all substructures in the project are used for the established VTSST coupled dynamic model. The main theatre is the principal performance place of the opera theatre and has two auditoria on the first and second floors. Theatre 1 in the basement near the metro line is worth evaluating whether the vibration transcends the limit value. Six specific points are perpendicular to the metro line at the main theatre and theatre 1. The slab at B1 is hidden to display the column structure below.
The vertical accelerations of typical locations in the opera theatre are illustrated in Figure 11. When the vibration propagates to theatre 1 at B1, the maximal amplitudes of the vertical building accelerations in the time domain are 0.077 cm/s2 ∼ 0.141 cm/s2 at different locations. The amplitudes of the vibration accelerations at theatre 1 at B1 depend on whether there is a support column. As the vibration propagates to the auditorium of the main theatre at F1, the maximal time-domain amplitudes of accelerations become larger and reach up to 0.140 cm/s2 ∼ 0.703 cm/s2 at different positions. The vibrations at F1 are related to the length of the longitudinal beams. While the vibration appears at the cantilever auditorium of the main theatre at F2, the time-domain maxima increase to 0.518∼0.871 cm/s2 at different places. The overhang length and the constraint of beams affect the vibrations at the F2 auditorium. The acceleration curves at each floor belong to free oscillation after dynamic impact excitation of the metro. The vibration peak spacing at each position is different, which means that the wavelength and period of the vibration are different. It is necessary to further analyze the frequency domain characteristics of vibration further. The accelerations of the opera theatre in the time domain for different locations.
The corresponding vibration characteristics in the frequency domain can be obtained using a discrete Fourier transform (DFT). The frequency spectrum of vibration acceleration of the specific location in the opera theatre is illustrated in Figure 12. Among the points at B1, point 1 has the largest amplitude of 0.053 cm/s2 at 67.2 Hz, while point 5 has the largest amplitude of 0.062 cm/s2 at 21.4 Hz. Concerning the points at F1, the amplitudes of point 5 are the highest at 26.1 Hz and 66.5 Hz, and the values are 0.149 cm/s2 and 0.389 cm/s2, respectively. The significant fluctuation of point 5 at F1 is located in the middle of the longest longitudinal beam span. The largest amplitudes of points at F2 increase from 0.072 cm/s2 of point 1 to 0.263 cm/s2 of point 6 at the frequency band of 60∼80 Hz as a result of the combined action of the cantilever structure and the beam constraint. The main contribution frequencies are 20∼40 Hz and 60∼80 Hz, and the frequency band of 60∼80 Hz plays a dominant role. Through the theatre’s modal analysis, the building’s natural frequency is 20∼40 Hz. The vibration source tests show that the metro mainly causes the vibrations of 60∼80 Hz. The F2 area of the grand theater experiences relatively significant vibrations, which are closely related to its cantilevered structural form. Vibrations are also pronounced in the long beams of the F1 area of the grand theater. To further control vibrations, improvements to the building structure can be made by considering the architectural characteristics and usage requirements. The main improvement methods include densifying the beams of the cantilevered area, reducing beam length, and increasing beam height. Therefore, building vibration can be controlled from two aspects: one is controlling the characteristic spectra of the metro by the propagation path, and the other is reducing the resonance of the building by strengthening the building structure. The maximum amplitude and corresponding frequency at different positions (a) Maximum amplitude (b) Corresponding frequency.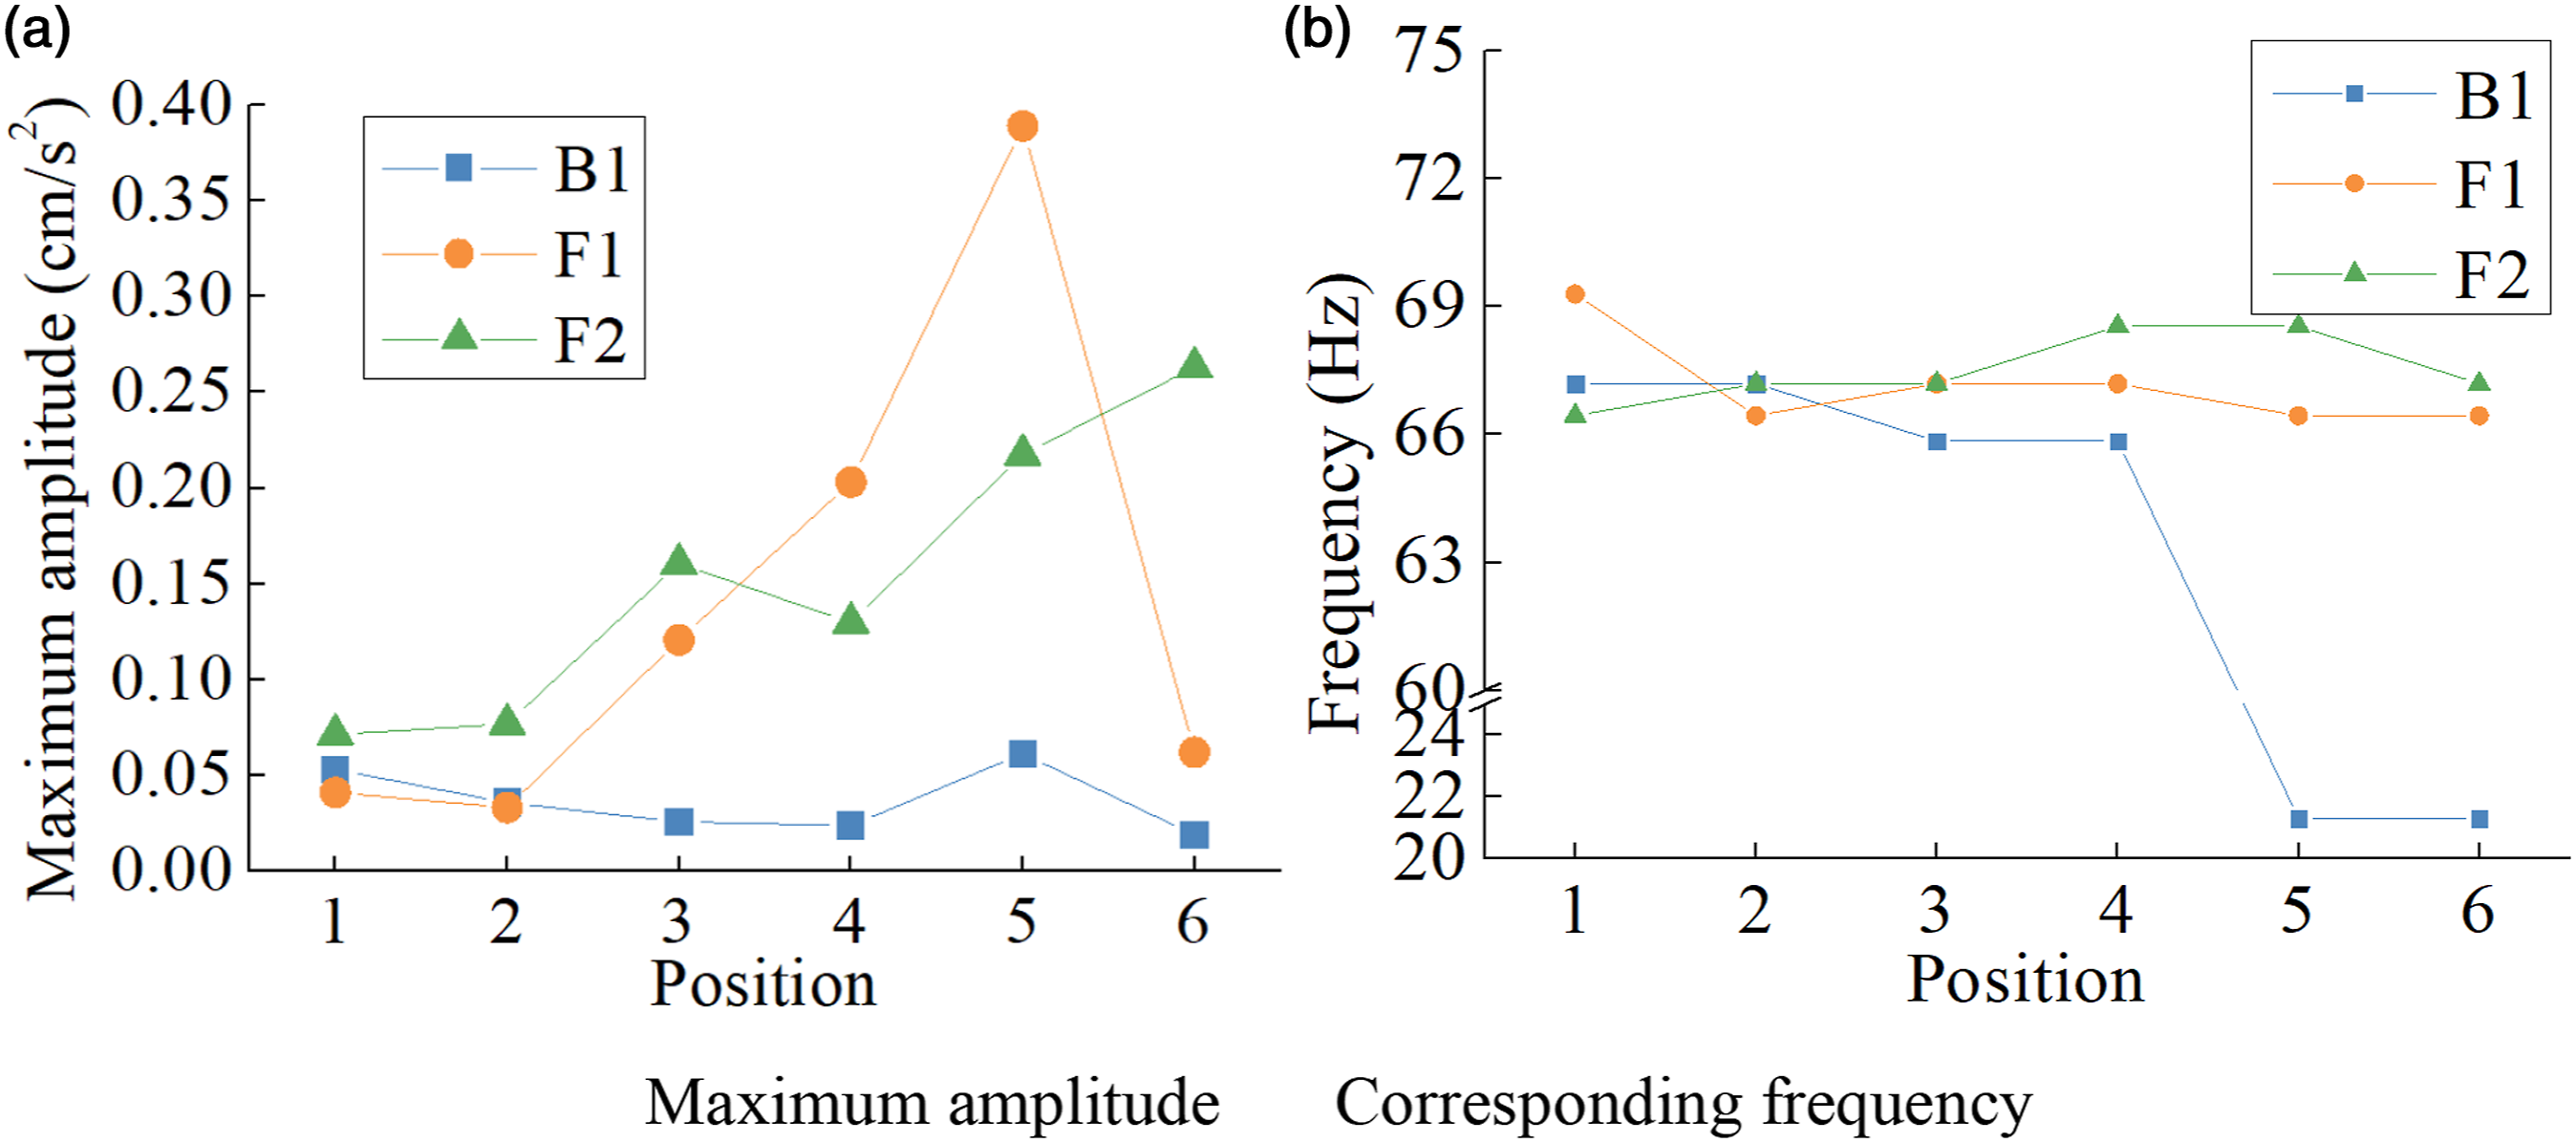
According to the standard (JGJ/T170–2009),
51
the weighted one-third octave band RMS values of the vertical accelerations at the center frequencies 4∼200 Hz are calculated and converted to the vertical acceleration levels at individual frequencies with a similar method to the international standard. The maximum vibration level is subject to a limitation of 65 dB after frequency weighting. The frequency division maximum vibration levels of acceleration at various positions of the theatre can be obtained, as summarized in Figure 13. The frequency division maximum vibration levels at various positions.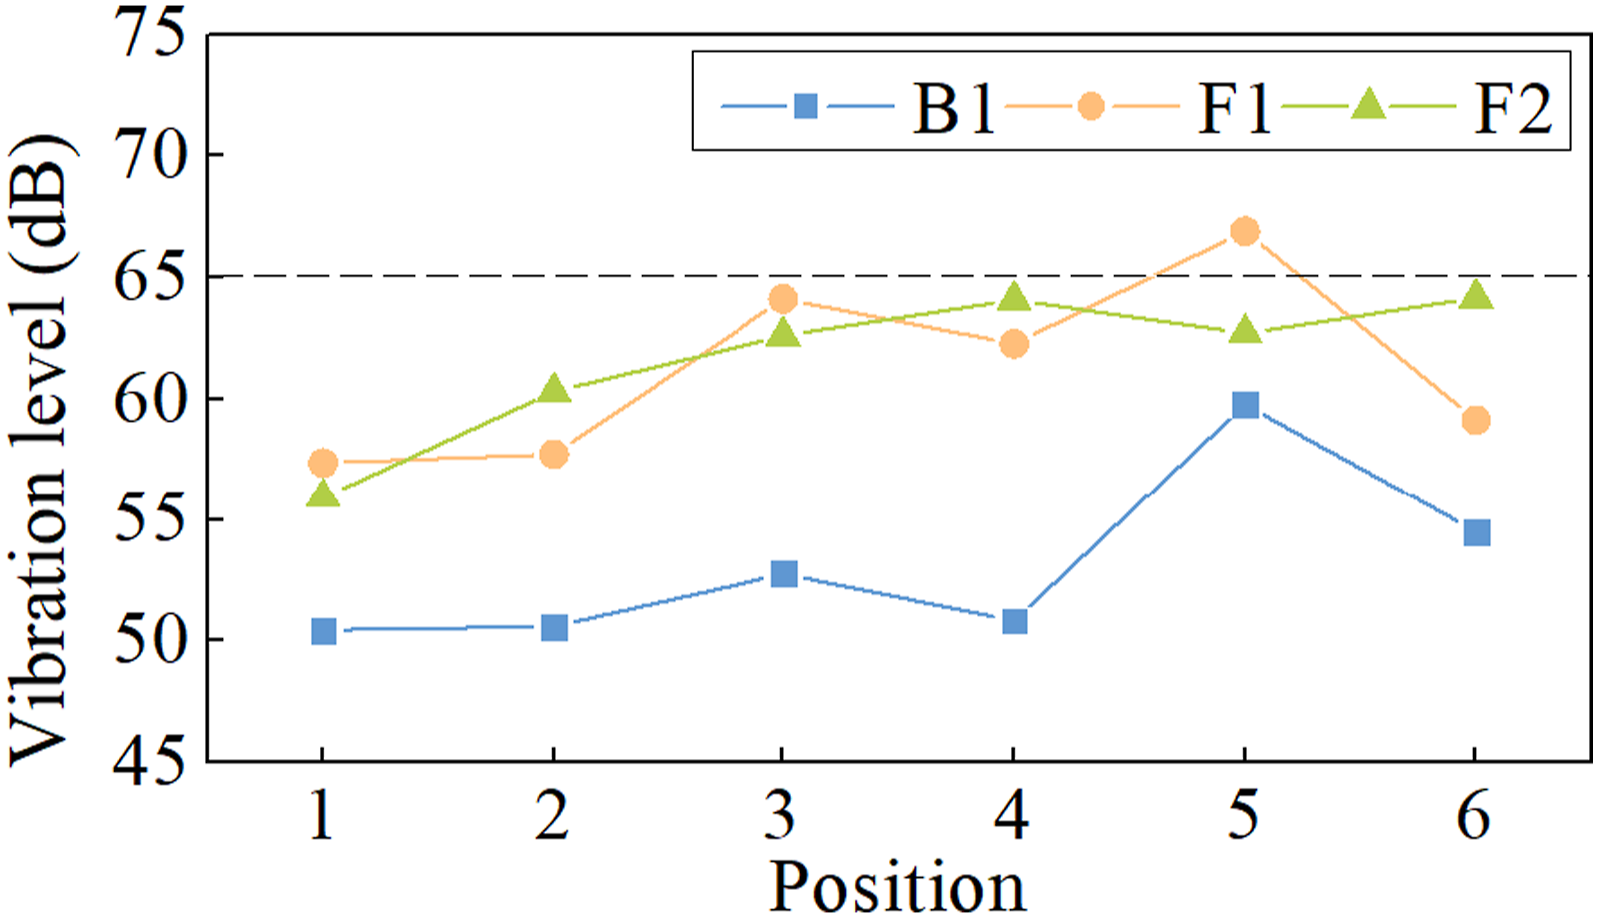
The limited value of the maximum vibration level at different frequencies is 65 dB after frequency weighting. Compared with the limit value, point 5 at the F1 position amplifies by nearly 2 dB, and the margin of point 3 at F1, point 4, and 6 at F2 is narrow to less than 1 dB. Meanwhile, all the vibration levels of points at B1 are below 60 dB. Hence, the F1 and F2 auditorium points need more concern, especially the points in the middle of the longest longitudinal beam span and at the end of the cantilever structure.
The opera theatre is in the preresonant region, which can be seen from the time-domain prediction results. The small underground theatre has the lowest vibration, followed by the F1 auditorium, and the F2 auditorium has the highest vibration. There are two contribution frequency bands: the oscillation of 20∼40 Hz originates from the resonance of the opera theatre structure, and the fluctuation of 60∼80 Hz is propagated from the metro-induced vibration. The vibration level of the small underground theatre meets the specification limit. The vibration level at F1 exceeds the limit, and that at F2 is very close to the limit. Thus, vibration reduction measures are necessary for the auditorium on the first and second floors. Through the analysis of acceleration contours, each floor’s causes of excessive vibration are clarified, and then targeted building optimization can be carried out.
The reason for exceeding permitted levels is analyzed for the positions whose vibrations exceed the limit. The data analysis shows that the significant amplitude vibration frequency band mainly pertains to the metro characteristic frequency and theatre natural frequency. Special targeted measures are to mitigate the vibration of the preresonant region and the post-resonance region. In the preresonant area, the excitation frequency is less than the natural frequency, so rigorous measures of increasing the natural frequency, such as building reinforcement, can avoid resonance. In the post resonance region, the excitation frequency is larger than the natural frequency, so the flexible measures of decreasing the natural frequency, such as damping track, can weaken the fluctuation.
Vibration mitigation measures
Section 3 shows that the vibrations of a few points in the theatre exceed the limits specified by the standards JGJ/T170-2009. The vibration outside the limitation will affect the audience’s opera viewing experience. Moreover, the secondary noise caused by building vibration will adversely impact the performance of the opera.
52
Hence, a vibration reduction design must be used. The vibration reduction design workflow is illustrated in Figure 14. With the proposed prediction method, the complete vibration source-transfer path-receiver system is established. If the vibration is over the limited level, mitigation measures of vibration source,
53
isolation measures of vibration transfer path, and optimization of vibration receiver will be taken to reduce the vibration to less than the limit. Vibration reduction design workflow.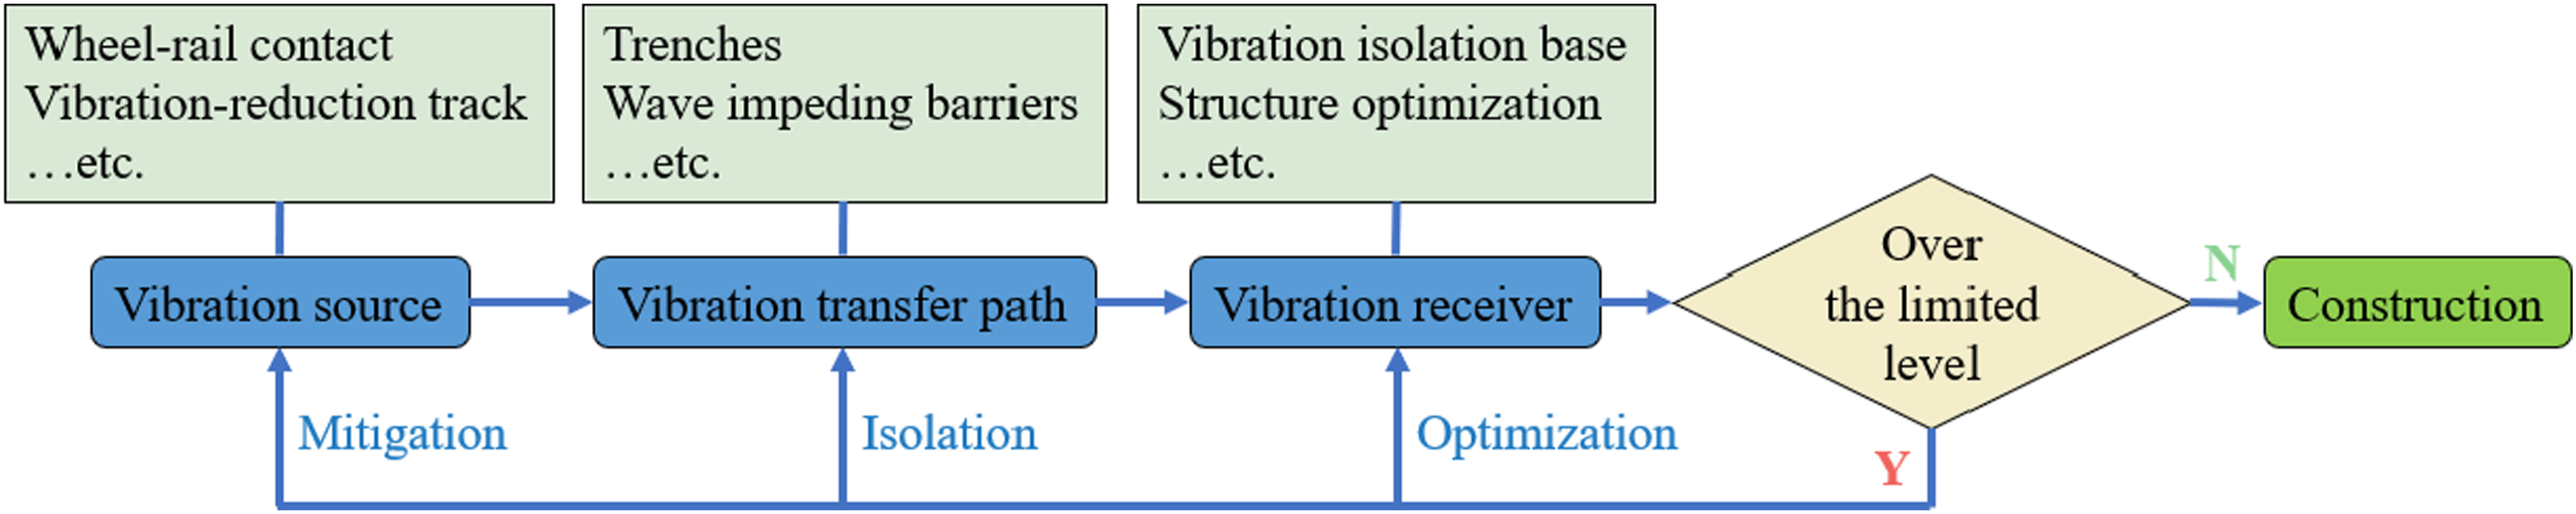
The vibration reduction measure of the periodic array trench is shown in Figure 15. The depth of the trench is 23 m and the thickness of each material is 160 mm. The flexible material (extruded polystyrene-XPS) and the rigid material (C30 concrete) alternate three cycles between the soil and the building. The C30 concrete has a density of 2500 kg/m3, an elastic modulus of 30 GPa, and Poisson’s ratio of 0.167. The dimensions of the material layers were come up according to the waterproof design for underground walls. The XPS panel is a kind of light high-strength foam panel, whose compressive strength can reach more than 350 kPa with a density of less than 40 kg/m3. The XPS panel adopted in the project has a density of 25 kg/m3, an elastic modulus of 16 MPa, and Poisson’s ratio of 0.28. One-dimension phononic crystal isolation trench.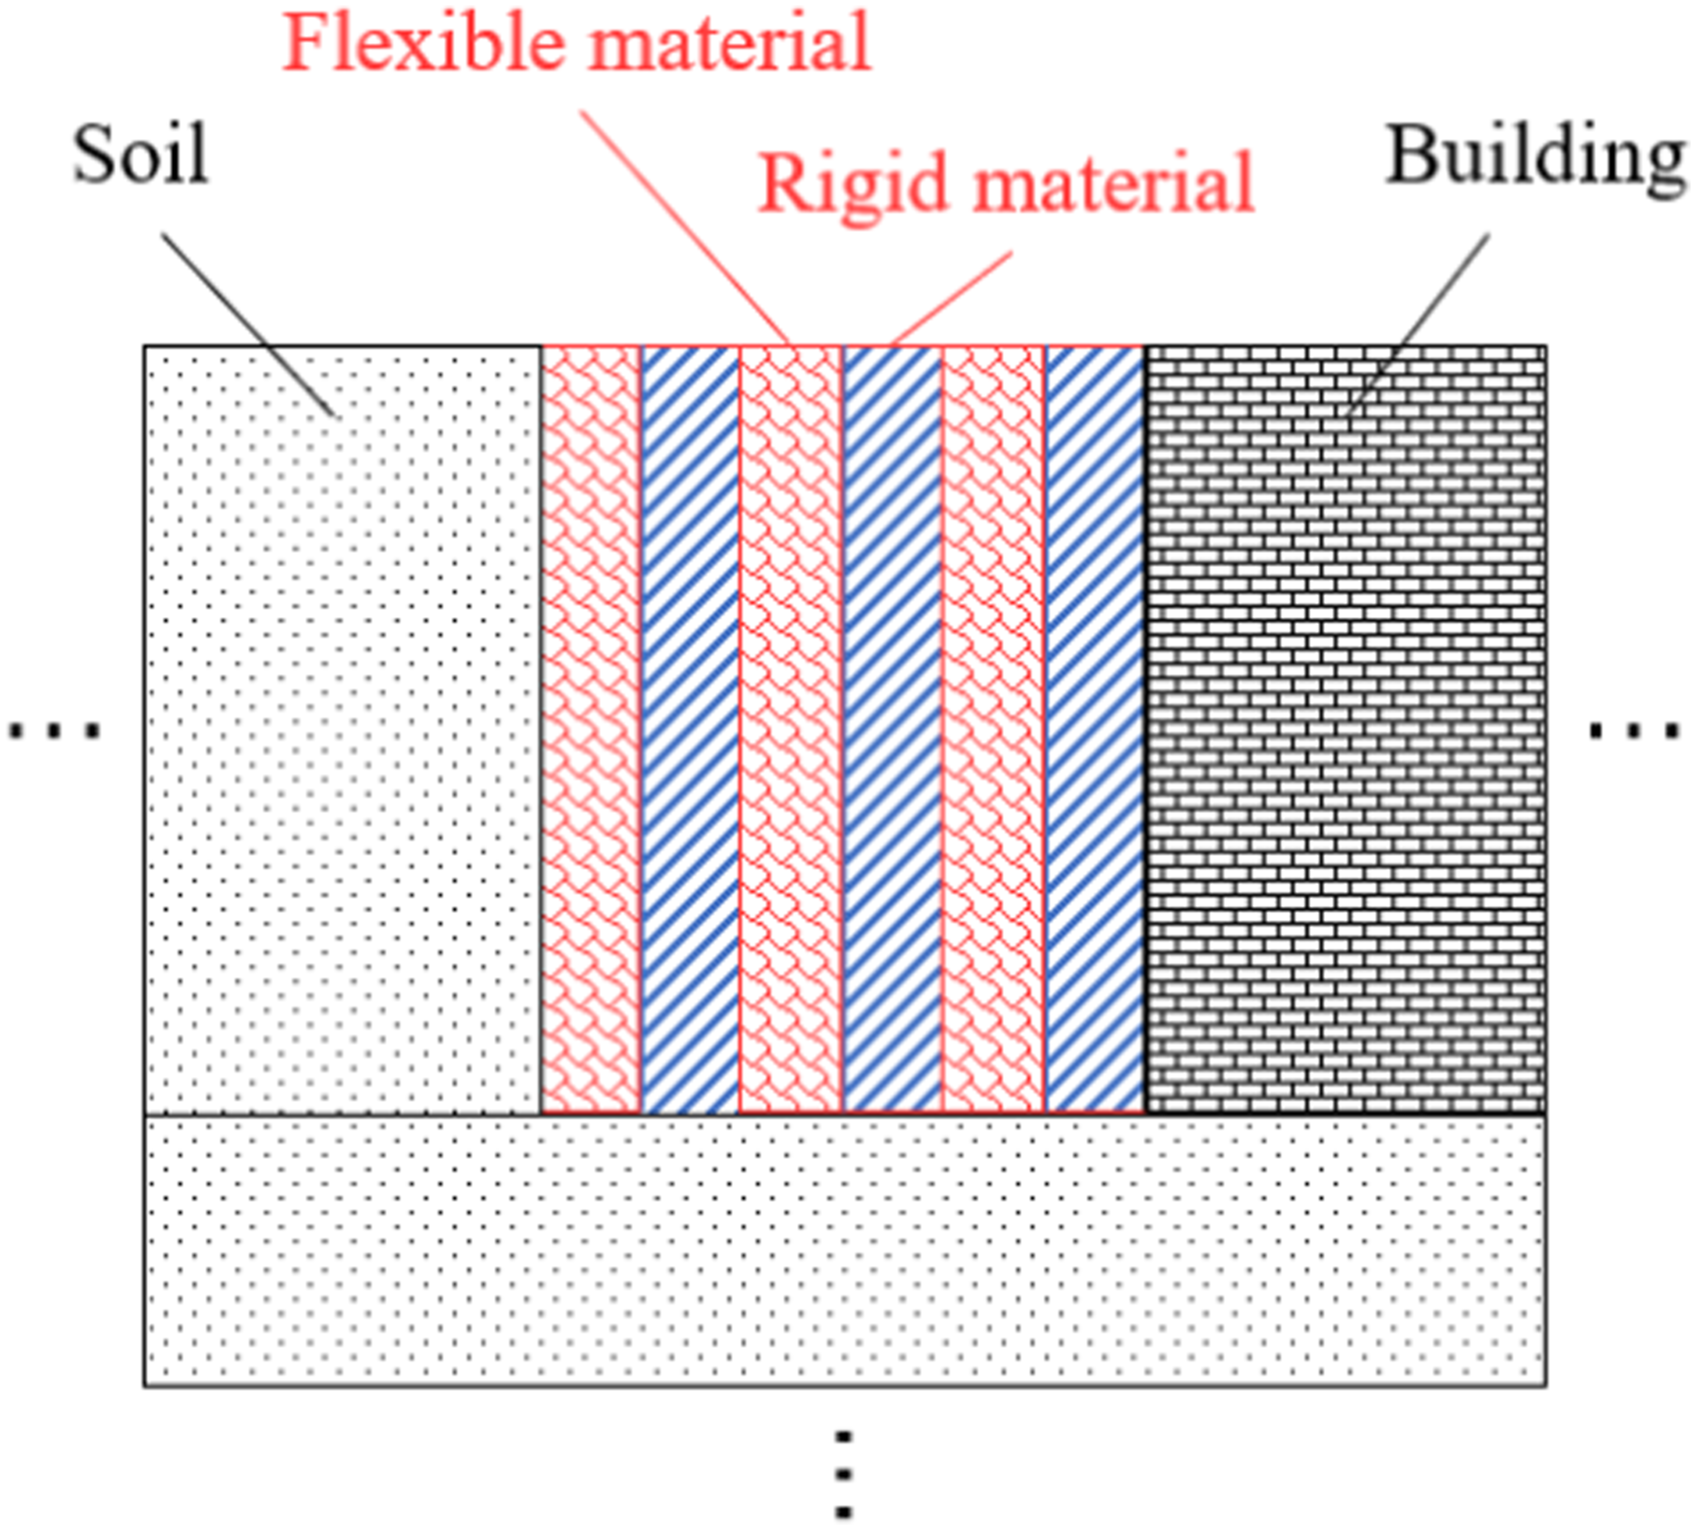
Based on the vibration characteristics analyzed in Section 3, appropriate transfer path and receiver vibration reduction measures are designed. One is controlling the characteristic spectra of the metro by the propagation path. The other is reducing the resonance of the building by strengthening the building structure. The physical meanings of the dimensions of the I-beam refer to bottom thickness, beam height, bottom width, waist thickness, top width, and top thickness, while the dimensions of the box-beam represent the beam length, beam width, and four thicknesses of the side wall. The maximum change of the F1 floor is the incremental number of longitudinal beams, from 10 to 11. In addition, there are also measures to increase the height, waist thickness, and top thickness of the I-beam, and replace the I-beam with a box beam with different sections.
The vibration levels with/without vibration reduction measures are illustrated in Figure 16 to evaluate the vibration reduction effect. There are three vibration reduction measures: filled trench, building optimization of F1 and F2 floor, and combination of the two measures. Vibration reduction effect of three kinds of measures at Auditorium (a) B1 Theatre (b) Auditorium at F1 (c) Auditorium at F2.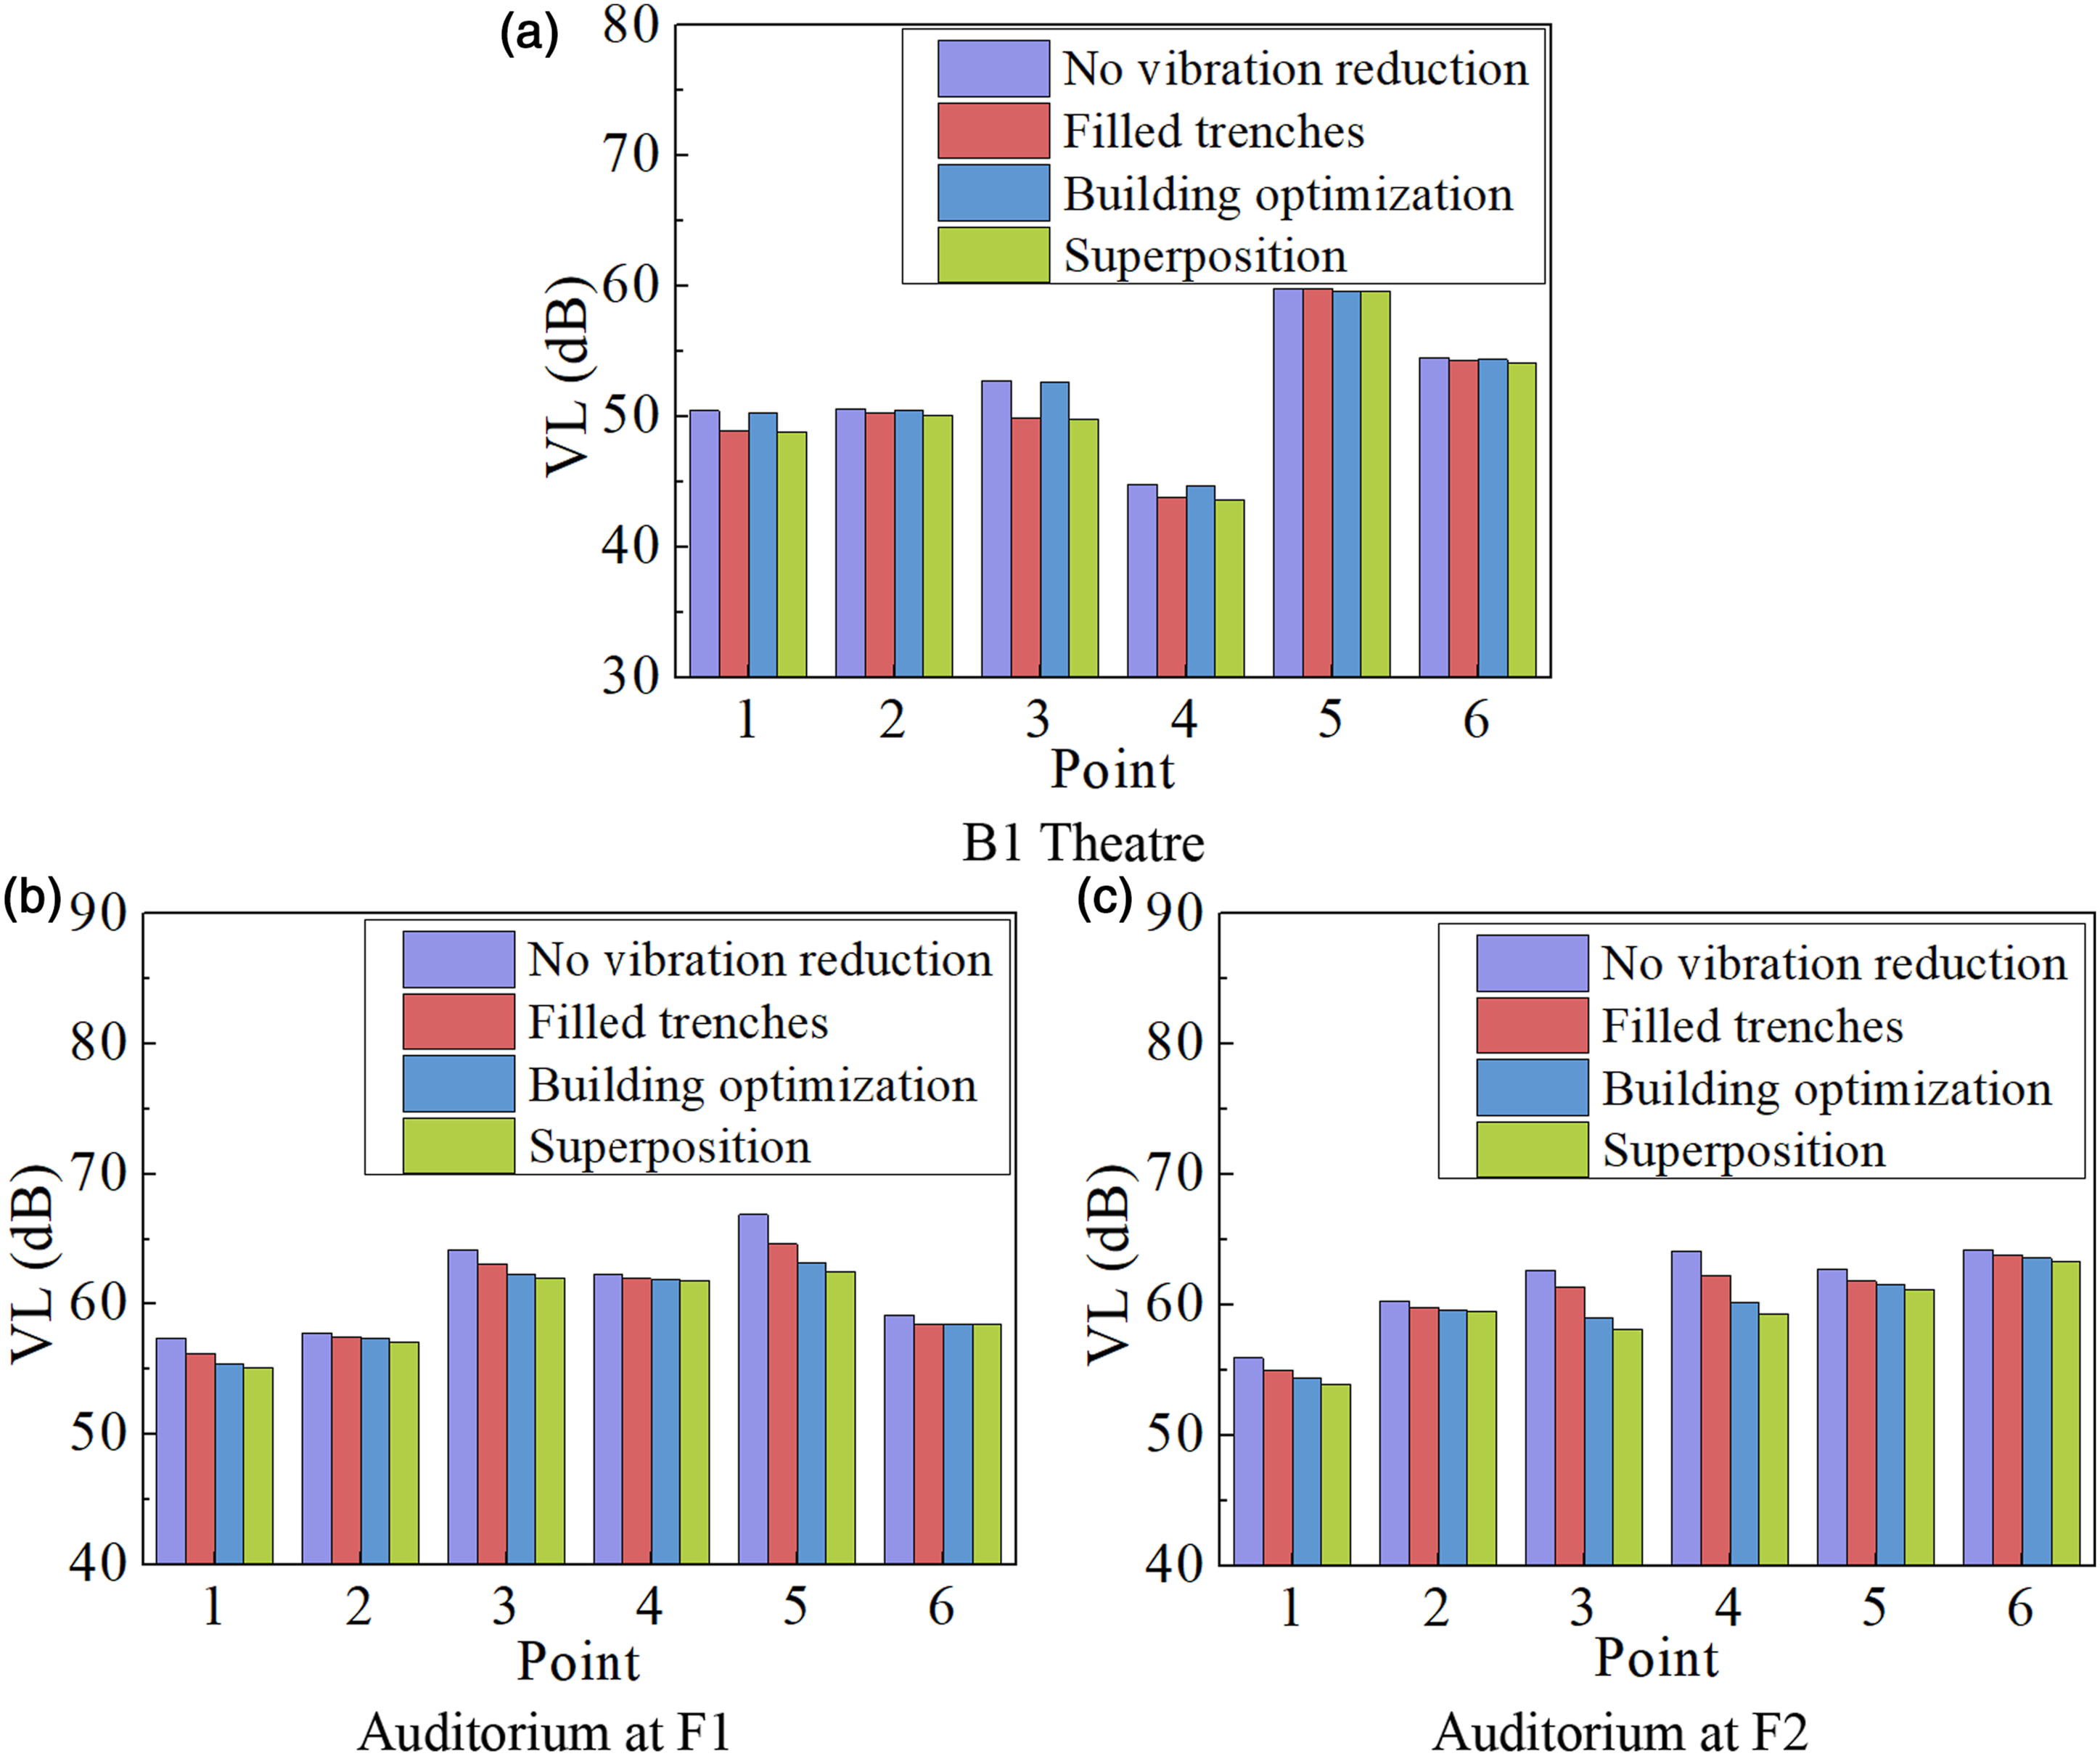
Figure 16 shows the vibration reduction effect of the filled trench, building optimization, and the combination of the two measures at the small theatre at B1 and the two-story auditorium of the main theatre. The vibration at B1 is mainly affected by the filled trenches. The vibration distribution laws with points of F1 and F2 auditorium are different. The peaks of the F1 auditorium occur at point 3 and point 5 (the mid-span point of the long longitudinal beam). In contrast, the crest values of the F2 auditorium occur at point 4 and point 6 (points at the middle and the end of the cantilever structure). The three measures can effectively control the peak values of the vibrations at the F1 auditorium. For the points at the F2 auditorium, the oscillations in the middle decrease significantly. However, the vibration control of the endpoints on the cantilever structure is less effective than that of the intermediate points.
The insertion loss is obtained by calculating the difference in the vibration level with and without vibration reduction measures to further quantify the vibration reduction effect further. Due to the different locations of points, the vibration reduction effect of superposition measures diversifies from 0.14 dB to 4.47 dB. The average insertion losses of the filled trenches, the building optimization and the superposition of the two are approximately 1 dB, 2 dB, and 2.5 dB. The filled trench applies to slight excessive vibration. In contrast, building optimization is universal and practical. However, the combination of the two cannot make the effect superimposed linearly. It does play a better role than a single measure.
As the project in this paper is located in the preresonant region, inflexibility measures such as beam reinforcement are taken to avoid the overrun of the theatre vibration. In addition, the space for filled trenches should be reserved to alleviate the metro-induced vibration before construction. During building structure design, attention should be given to the following matters: avoiding long longitudinal beam structures and strengthening cantilever structures. The filled trench measure can be applied when the vibration slightly exceeds the limit. Building optimization should be focused on in all designs, especially since there is a need for vibration control.
Conclusions
Numerical simulations and field tests were conducted to predict the vibrations induced by the metro on the Northern Kunqu Opera and to investigate the effectiveness of vibration control measures in mitigating these vibrations. The vibrations in the auditorium were predicted using a multigrid fully coupled VTSST model in various simulation combinations to assess the impact of control measures on vibration reduction efficiency. The results of this study offer valuable insights into the efficacy of the proposed multigrid fully coupled method and can be utilized to guide the development of future vibration assessment and mitigation plans for similar structures in metro-induced vibration environments. The main conclusions were reached as follows: 1. The proposed multigrid fully coupled model was rigorously validated using experimental data obtained from both the station and the ground adjacent to the metro line, resulting in high credibility and reliability of the prediction method. By accounting for the interrelationships and feedback among each component, the multigrid fully coupled metro vehicle-track-station-soil-theatre model can provide a more comprehensive understanding of the dynamic coupling effects between the metro vehicle-track-station-soil-building system. This approach offers a more accurate and realistic representation of the dynamic response of the system, which is of particular importance for structures that are sensitive to vibration. 2. The impact of metro-induced vibration on the opera theatre was found to be significant, with primary contribution frequencies occurring in the 10∼40 Hz and 60∼80 Hz bands. The former corresponds to the building’s natural frequency, while the latter is the main frequency range of metro-induced vibration. 3. The multigrid fully coupled model offers an improved and efficient approach to optimize vibration mitigation measures. By taking into account the impacts of different mitigation measures on the entire system, rather than separately considering each component, the fully coupled model can effectively identify the most suitable measures to achieve the desired level of vibration reduction. Notably, the implementation of mitigation measures such as filled trenches and building optimization can effectively reduce the vibration of the opera theatre induced by the metro, resulting in a reduction of 1∼2.5 dB. The maximum vibration value remains within permissible limits, meeting the relevant specification requirements.
Footnotes
Author contributions
All authors contributed to the study conception and design. Material preparation, data collection and analysis were performed by Qihao Wang, Xiaopei Cai, Yanli Qi, Qian Zhang, and Xueyang Tang. The first draft of the manuscript was written by Qihao Wang and all authors commented on previous versions of the manuscript. All authors read and approved the final manuscript.
Declaration of conflicting interests
The author(s) declared no potential conflicts of interest with respect to the research, authorship, and/or publication of this article.
Funding
The author(s) disclosed receipt of the following financial support for the research, authorship, and/or publication of this article: This work was supported by the Fundamental Research Funds for the Central Universities (No. 2023JBZX030) and the National Natural Science Foundation of China (No. 52178405).
Author notes
The manuscript has not received prior publication and is not under consideration for publication elsewhere.
Authorship clarified
The Journal and Publisher assume all authors agreed with the content and that all gave explicit consent to submit and that they obtained consent from the responsible authorities at the institute/organization where the work has been carried out, before the work is submitted.
Ethical approval
This research did not relate any ethical problem and has been approved by our national ethics. The manuscript is the authors’ own original work, which has not been previously published elsewhere. The manuscript is not currently being considered for publication elsewhere.
Informed consent
All authors consent to participate in the works of the manuscript.
Consent for publication
All authors consent to submit and publish the manuscript.
Data Availability Statement
The datasets generated during and/or analyzed during the current study are not publicly available due but are available from the corresponding author on reasonable request.