
Abstract
8-m super-high fully mechanized mining face has been successfully applied in China, which has brought many difficulties to dust control. The main reason is that the mining height increases and the dust distribution and evolution law are quite different. Targeting the 12,513 fully-mechanized mining face in Bulianta Coal Mine of China in this paper. The spatial evolution of airflow-respiratory dust of an 8-m high fully-mechanized mining face is analyzed using numerical simulation and underground measurement methods. The results reveal that the numerical and measured results are consistent. At the working range from 15 m in front of the shearer to 30 m behind it, the wind speed increases with an average rise of 70% on the coal cutting side. The airflow diffusion at the working face is primarily longitudinal and partly transverse. Along the airflow direction, the respiratory dust concentration in the pedestrian space first increases and decreases, followed by a marginal increase and gradual decrease,and the dust concentration increased with the increase of height, the migration distance of dust particles was directly proportional to time, and the smaller dust particles were prone to transverse diffusion. In the range of 20–30 m from the downwind side of the shearer, the transverse diffusion of coal cutting dust and the dust produced by support coal falling show conversion, leading to the increase of dust concentration. Under the same dust production intensity, compared with ordinary mining height, with the increase of mining height, the influence range of dust diffusion is wider, the floating duration is longer, and the space dust concentration will be reduced, and the support coal falling dust is the main dust pollution source in pedestrian space. The results reveal that the numerical and measured results are consistent, and obtained the relationship of spatial evolutions of respiratory dust
Keywords
Introduction
Dust is one of the six major hazards in the coal mine, which can lead to an explosion, pneumoconiosis, mechanical wear, reduction of service life and accuracy in equipment, misoperation due to lowered visibility at the production site, and several other accidents. In particular, induced pneumoconiosis is an incurable disease and does significant damage to personnel health (Zheng et al., 2009; Zhou et al., 2017a). In recent years, the safety production situation of coal mines in China has been significantly improved due to strengthening supervision and increasing investments in occupational hazard control, but the number of pneumoconiosis patients has not been effectively curbed (Cheng et al., 2016; Zhou et al., 2017b; Zhou et al., 2018). Coal mining enterprises, especially underground mines, are most severely affected by dust hazards due to the limited mining conditions and space, fixed personnel, and high exposure rate (Nie et al., 2017a; Zhou et al., 2010). With constant improvement in the scientific and technological strengths of the coal industry, large-scale coal production equipment continues to be developed and optimized, leading to high-yield and intensive production of coal mines and furnishing a solution for efficient and safe mining of thick coal seams. Owing to this, large-mining-height fully-mechanized mining is adopted by several coal mines with a thick seam. Along with the considerably improved production efficiency, the dust pollution in stope space is becoming increasingly severe, which has become a primary issue of healthy mining in modern mines (Xu et al., 2020). Because of its many dust production links and large dust production from a single source, the fully-mechanized mining face has become the location with the most serious coal mine dust hazards. The super-high fully-mechanized mining face has exacerbated the dust hazards due to the use of large mining and transportation machinery and equipment with high power, a deep cutting depth, and a large volume (Liu et al., 2007; Zhou et al., 2010). Besides, the working space of a super-high fully-mechanized mining face is much larger than that of a mining face with a normal height. In particular, the volume of the production equipment in fully-mechanized mining is large, which strengthens the airflow blocking effect in the mining space and considerably alters the airflow characteristics. Hence, the dust may diffuse and migrate with the airflow in a complex and changeable manner. It is mandatory to master the migration and diffusion characteristics of airflow and dust so that the dust at the super-high fully-mechanized mining face can be controlled.
In recent years, with the continuous evolution of computer technology, the numerical simulation technique of Computational Fluid Dynamics (CFD) has been widely adopted. Magesh et al., used numerical simulation to simulate the three-dimensional (3D) dust distribution in the isolation zone of an underground mine. Various dust concentrations were obtained and compared by treating the fresh air entering the isolation zone as continuous and the dust particle as having a continuous phase or secondary discrete phase (particle) (Magesh et al., 2016). Patankar and Joseph proposed Eulerian-Lagrangian Numerical Simulation (LNS) scheme for the particle flow. The large eddy simulation method was used to simulate the gas movement, and the LNS method was used for simulating the movement of dust particles. The spatial distribution characteristics of particles in various flow fields were numerically simulated to aim at the two basic flow field types of plane wake and turbulence (Patankar and Joseph, 2001). To characterize the migration and distribution laws of airflow and dust fields at the fully-mechanized mining face in detail, Nie Wen et al., used the methods of numerical simulation and underground test Besides, according to the dust pollution results at the fully-mechanized mining face, the corresponding dust prevention technology and equipment were proposed and designed, which provided theoretical guidance for creating safe production and clean working environments in coal mines (Chen et al., 2018; Ma et al., 2020; Nie et al., 2016a; Peng et al., 2019). The dust diffusion behavior was numerically simulated under various wind speeds at the fully-mechanized mining face by Zhou Gang et al., obtaining the optimal wind speed for dust removal (Zhang et al., 2018). Mo Jinming et al., simulated the migration of dust particles at the fully-mechanized mining face from coal cutting of the shearer drum and column falling and frame moving of the hydraulic support. Also, an onboard dust collector was proposed for the shearer and an enclosure dust control device for the hydraulic support. It was revealed from the field applications that the dust reduction efficiency of the two devices in the pedestrian area reached 49.3% and 94.8%, respectively (Mo et al., 2020; Mo et al., 2021). Cheng Weimin et al., numerically studied the migration law of airflow-dust and the dispersion mode of dust with various particle sizes during coal cutting by the shearer drum at the fully-mechanized mining face with a large mining height. It provided the dust control strategy for different areas of the fully-mechanized mining face based on the simulation results (Xie et al., 2018).
Most of the aforementioned studies targeted the airflow and dust migration and distribution rules at the fully-mechanized mining face, along with the design and application of the corresponding dust prevention technology and equipment. Currently, mines in China have completely entered the era of mechanized production. In the Shendong mining area, China Energy Investment Corporation has realized fully-mechanized mining with a large mining height of approximately 8 m. The dust pollution issue has become more serious as the diameter of the shearer's coal cutting drum reaches 4.5 m, and the mining height reaches 8 m. However, the research on the temporal and spatial evolution of airflow and respiratory dust fields in fully-mechanized mining faces with a super-large mining height of approximately 8 m is yet to be done, so there is little basis for the targeted dust control in these scenarios. The systematic study is hence essential in this regard to provide the basic support for dust control in fully-mechanized mining faces with a super-large mining height of 8 m and above.
Mathematical model of airflow-respiratory dust
Mathematical equation of airflow
The movement of dust with airflow at the fully-mechanized mining face can be considered to be a gas-solid two-phase flow in which the dust is considered as a sparse phase and the gas in the roadway belongs to the continuous phase. Besides, the gas flow is usually considered a turbulent flow. The k-ε model is used to solve the turbulent flow of the airflow at the fully-mechanized mining face (Liu et al., 2018a; Liu et al., 2018b; Nie et al., 2017b), where k is turbulent kinetic energy with a unit of m2/s2, and ɛ denotes the dissipation rate of the turbulent kinetic energy.
k equation:


Mathematical equation of dust flow
By integrating the differential equation of particle forces in Lagrangian coordinates, the dust flow can be solved. The equilibrium equation of particle-phase forces can be expressed as follows (Hu et al., 2015; Klemens et al., 2001; Nie et al., 2016b; Ren et al., 2011):

The resistance Fd can be expressed as follows:

When the dust particle moves in the turbulent flow, its trajectory is affected by the turbulence. Assuming that the instantaneous fluctuating velocity of the dust particle conforms to Gaussian distribution (Jiang et al., 2013);


Based on the random influence of turbulence on dust particle diffusion, the instantaneous velocity can be decomposed into three dimensions and integrated step-by-step in time to obtain the particle trajectory equation. For instance, the trajectory of particles in the x-direction can be obtained from Equation (6) as follows:

Numerical model establishment
The complex layout and varied positions of equipment in the mining space have great impacts on the airflow at the fully-mechanized mining face. It is hence necessary to design the calculation model based on the levels of the influences. The temperature and humidity in the mining space are relatively stable and have negligible impact on the airflow field. Hence, these aspects are ignored in this study (Neuman et al., 2009).
Model structure and size
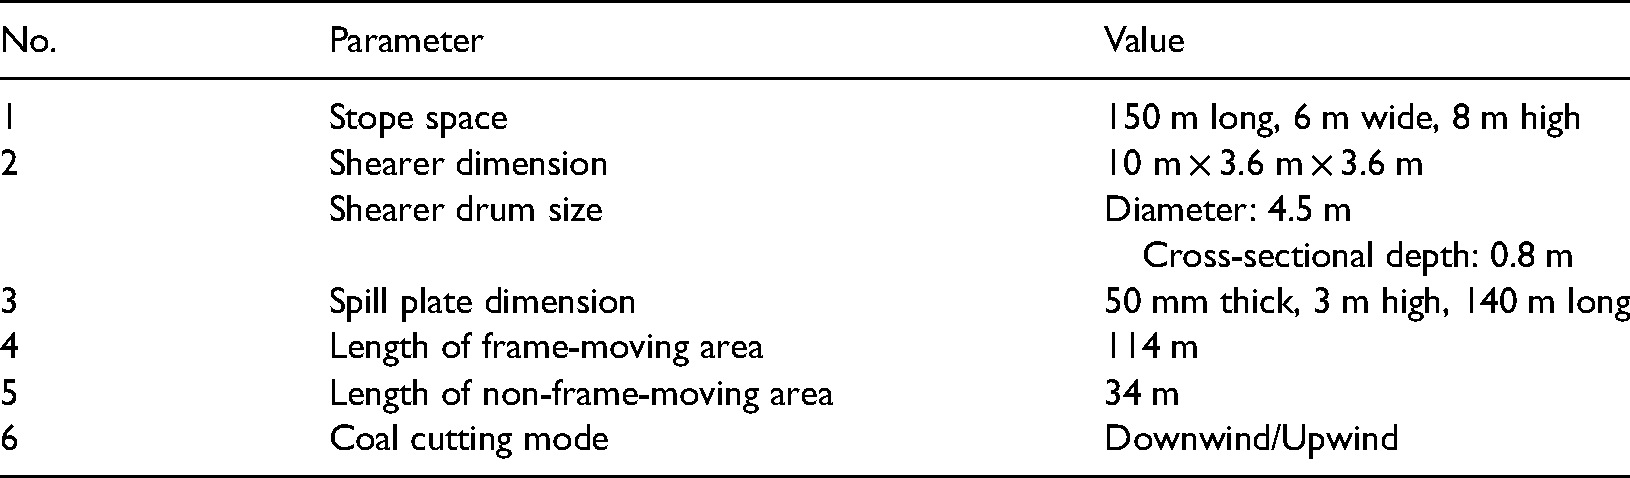
Based on the analysis of the influencing factors of the airflow field in the mining space of the fully-mechanized mining face, the model was established considering the practical sizes. Moreover, the spaces occupied by the solid elements were eliminated, only retaining the spatial model for computing the flow field in the mining space. Figure 1 demonstrates the CFD model, and the basic parameters of the model are enlisted in Table 1.
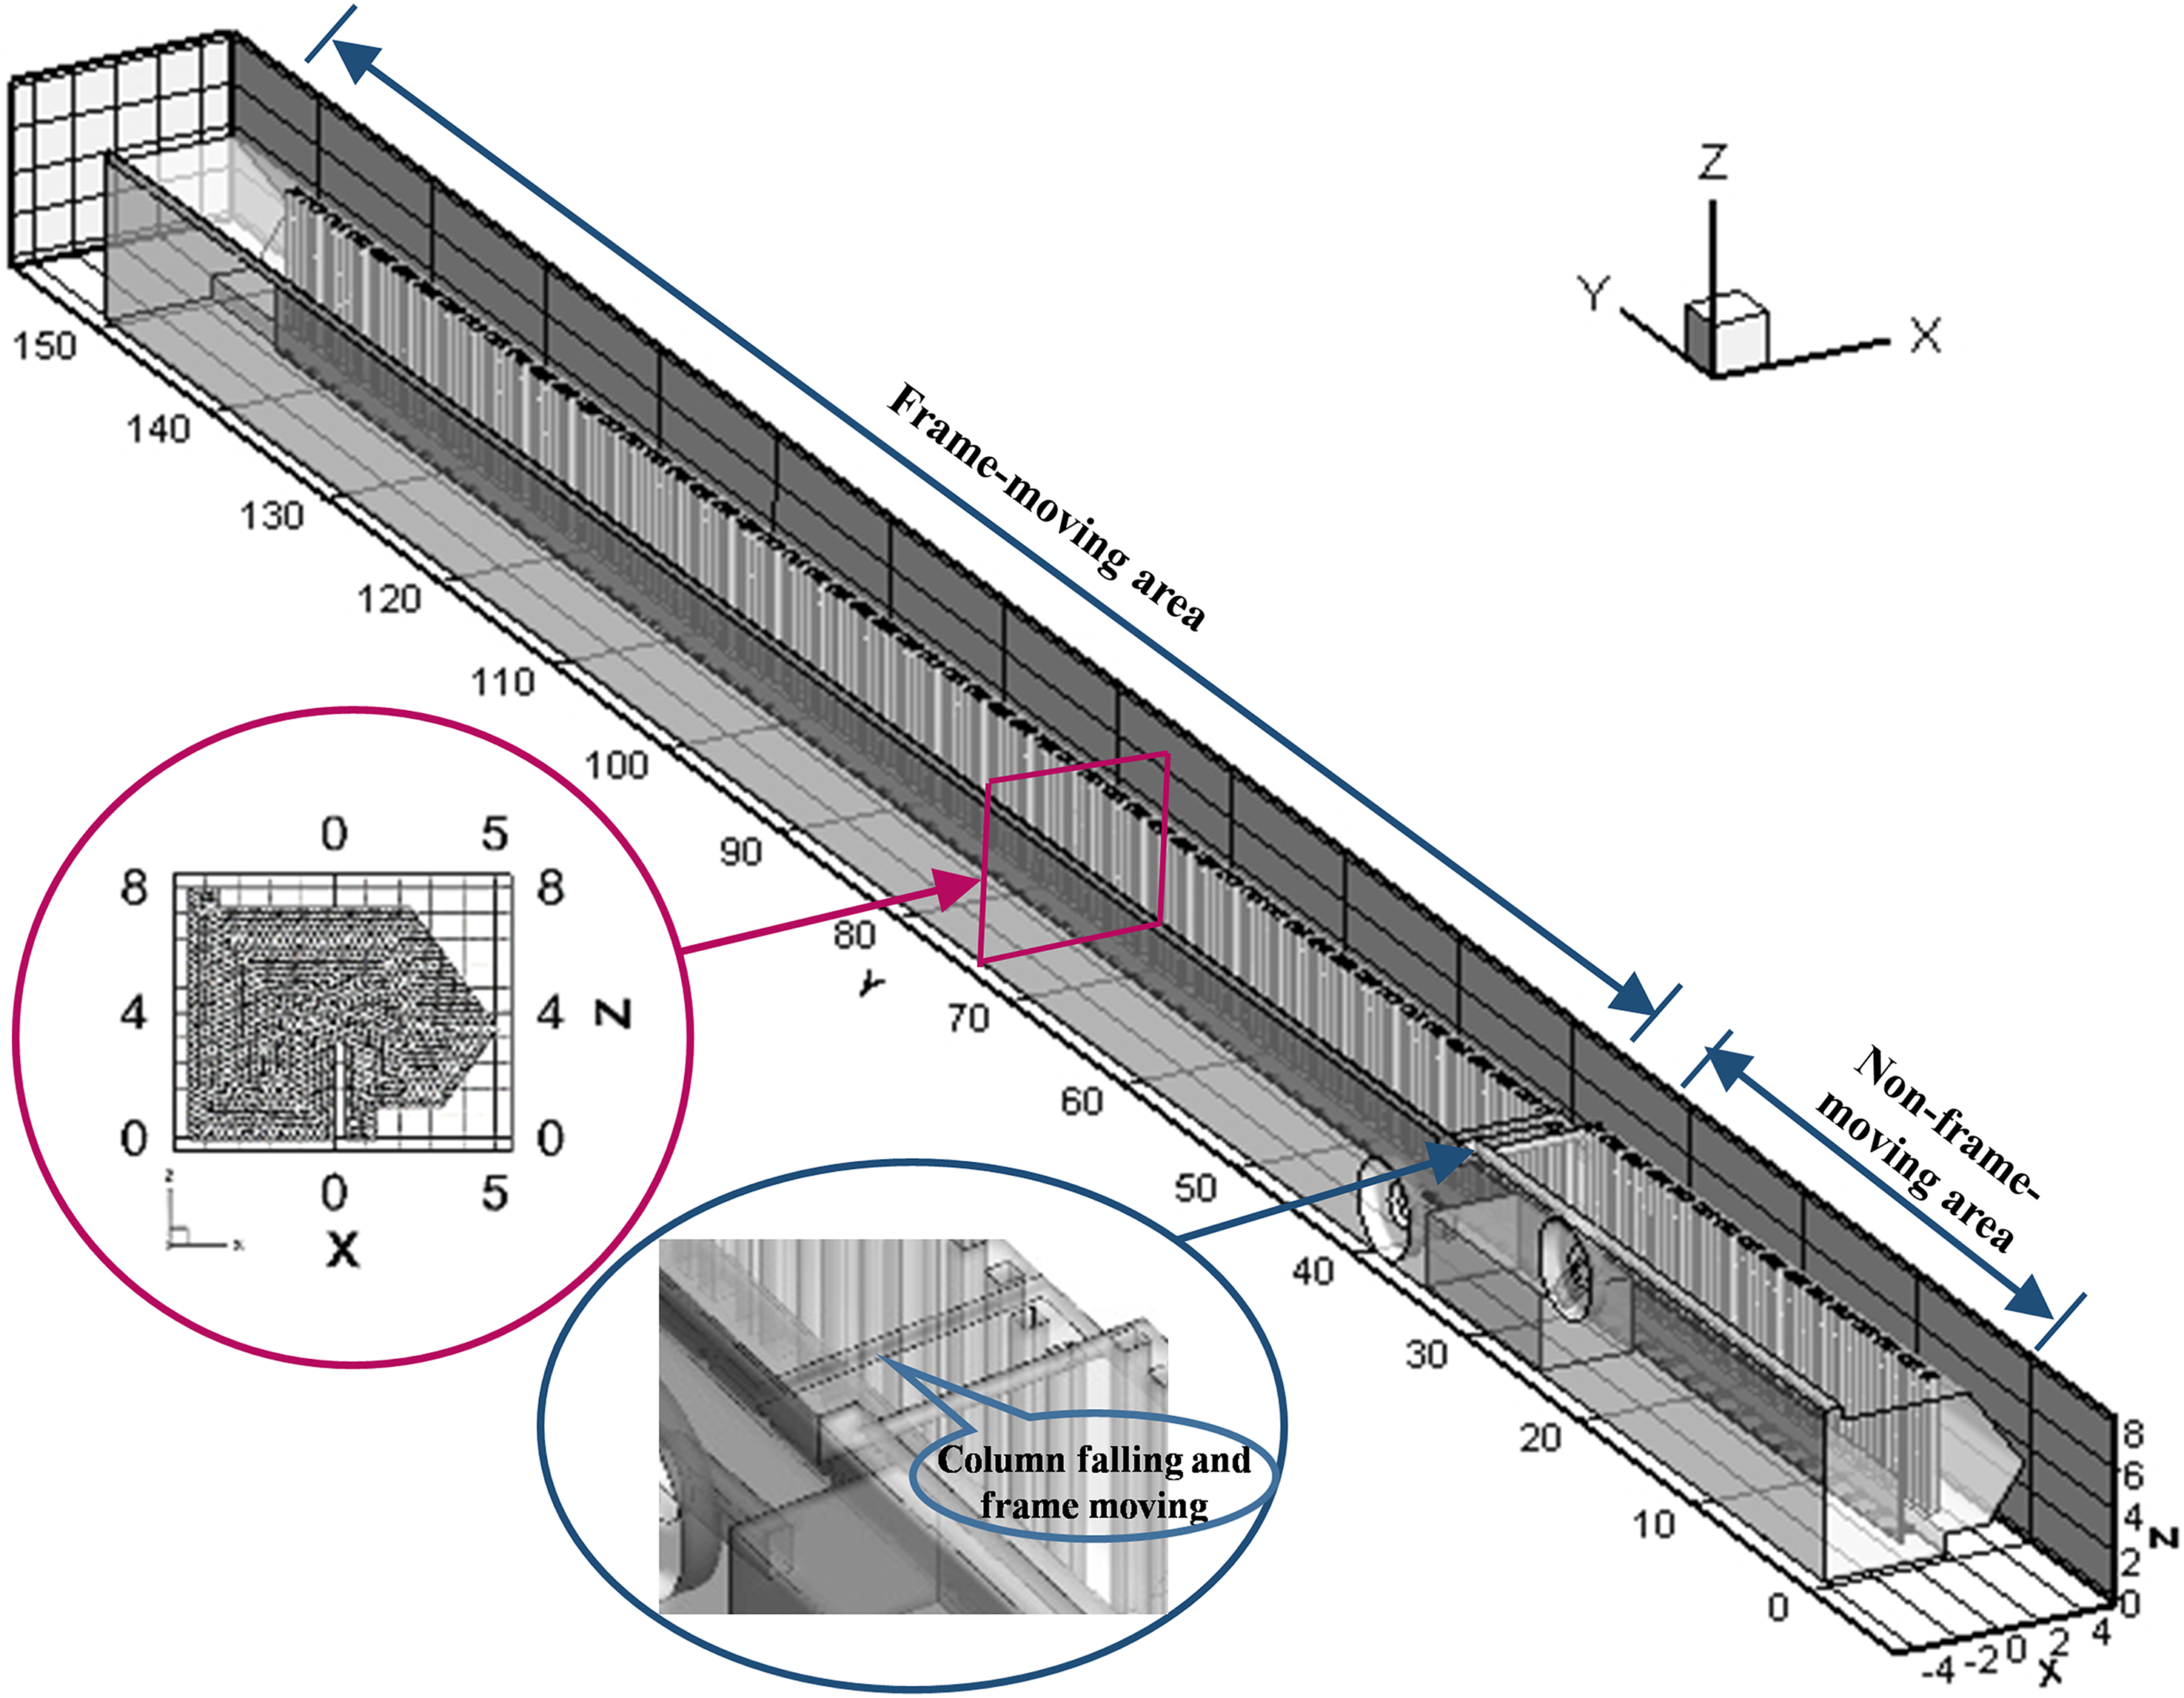
CFD model.
Model parameters.
Setting of boundary conditions
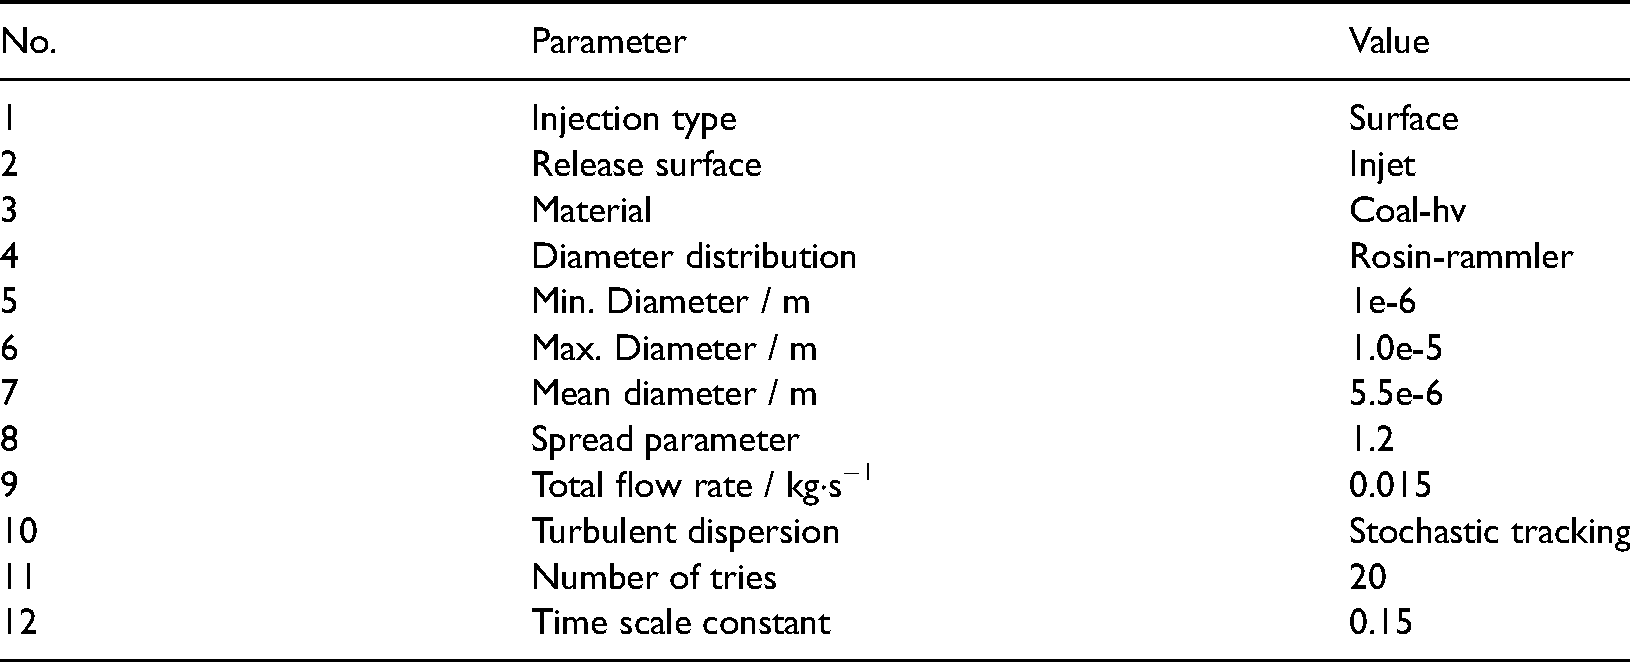
The model was meshed by polyhedrons and the standard k-ε double equation was used for calculation. The inlet boundary was the velocity inlet, the average velocity measured at the inlet was 1.0 m/s, and the outlet boundary was a free outflow. The average concentration of multiple measuring points near the dust source was found to be 330 mg/m3, the average wind speed at the working face was 1.0 m/s, and the stope cross-section had an area of 45 m2. The mass concentration and particle size distributions of respiratory dust were calculated based on these parameters and the particle size distribution test Since the long-term accumulation of particles with a size of 10 μm and below may destroy respiratory tracts and lung cells and even endanger life and health, the particle size range of respiratory dust studied in this paper was set to 1–10 μm (Liang, 2000). Table 2 represents the parameter settings of the discrete phase model (DPM).
DPM model parameter settings.
This study adopts the steady state calculation model, selects the simple consistent algorithm with better convergence and calculation efficiency, sets the Geen-Gauss cell based gradient term discretization algorithm, sets the standard pressure term discretization algorithm, and sets the momentum equation discretization method as second order upwind.
Mesh generation and independence verification
The grid independence verification of the model is performed by selecting three grid partition methods to ensure the reliability of the numerical simulation result and the quality of high-precision grid. With Integrated Computer Engineering and Manufacturing-CFD software, the grid partition is conducted through setting grid parameters A, B and C. Parameters A, B and C have 6,893,868; 8,605,669; and 10,236,675 grids, respectively. The distribution interval of grid number is shown in Figure 2.
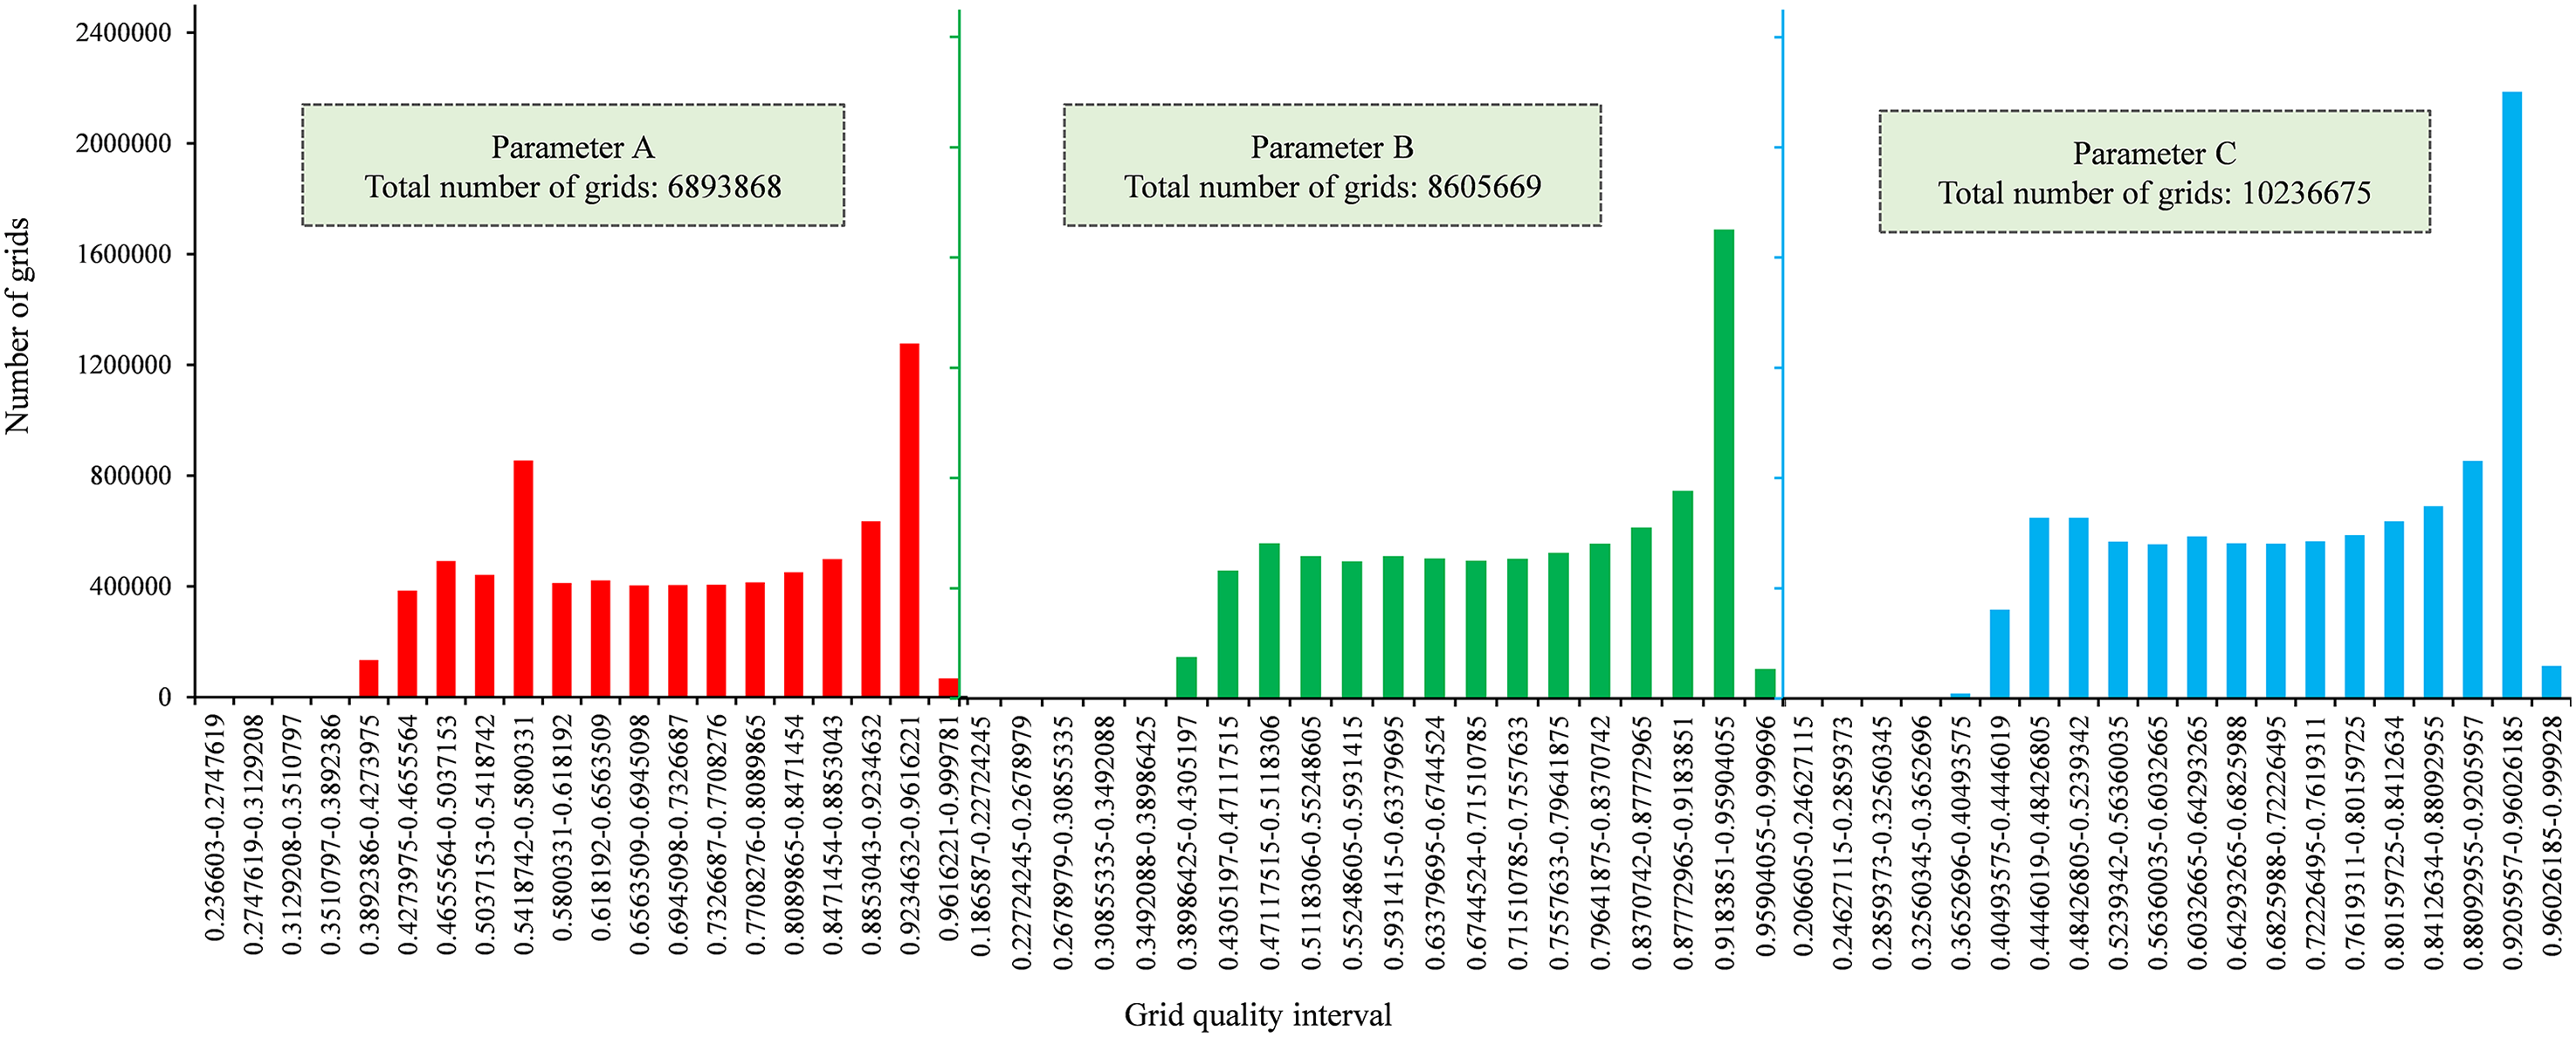
Grid partition.
Through the calculation of wind speed with three different grid parameter models, it is found that the wind speed calculation results of the three different grid parameter models are basically consistent, with no obvious difference, and the results are shown in Figure 3. Therefore, it can be considered that the grid is independent.
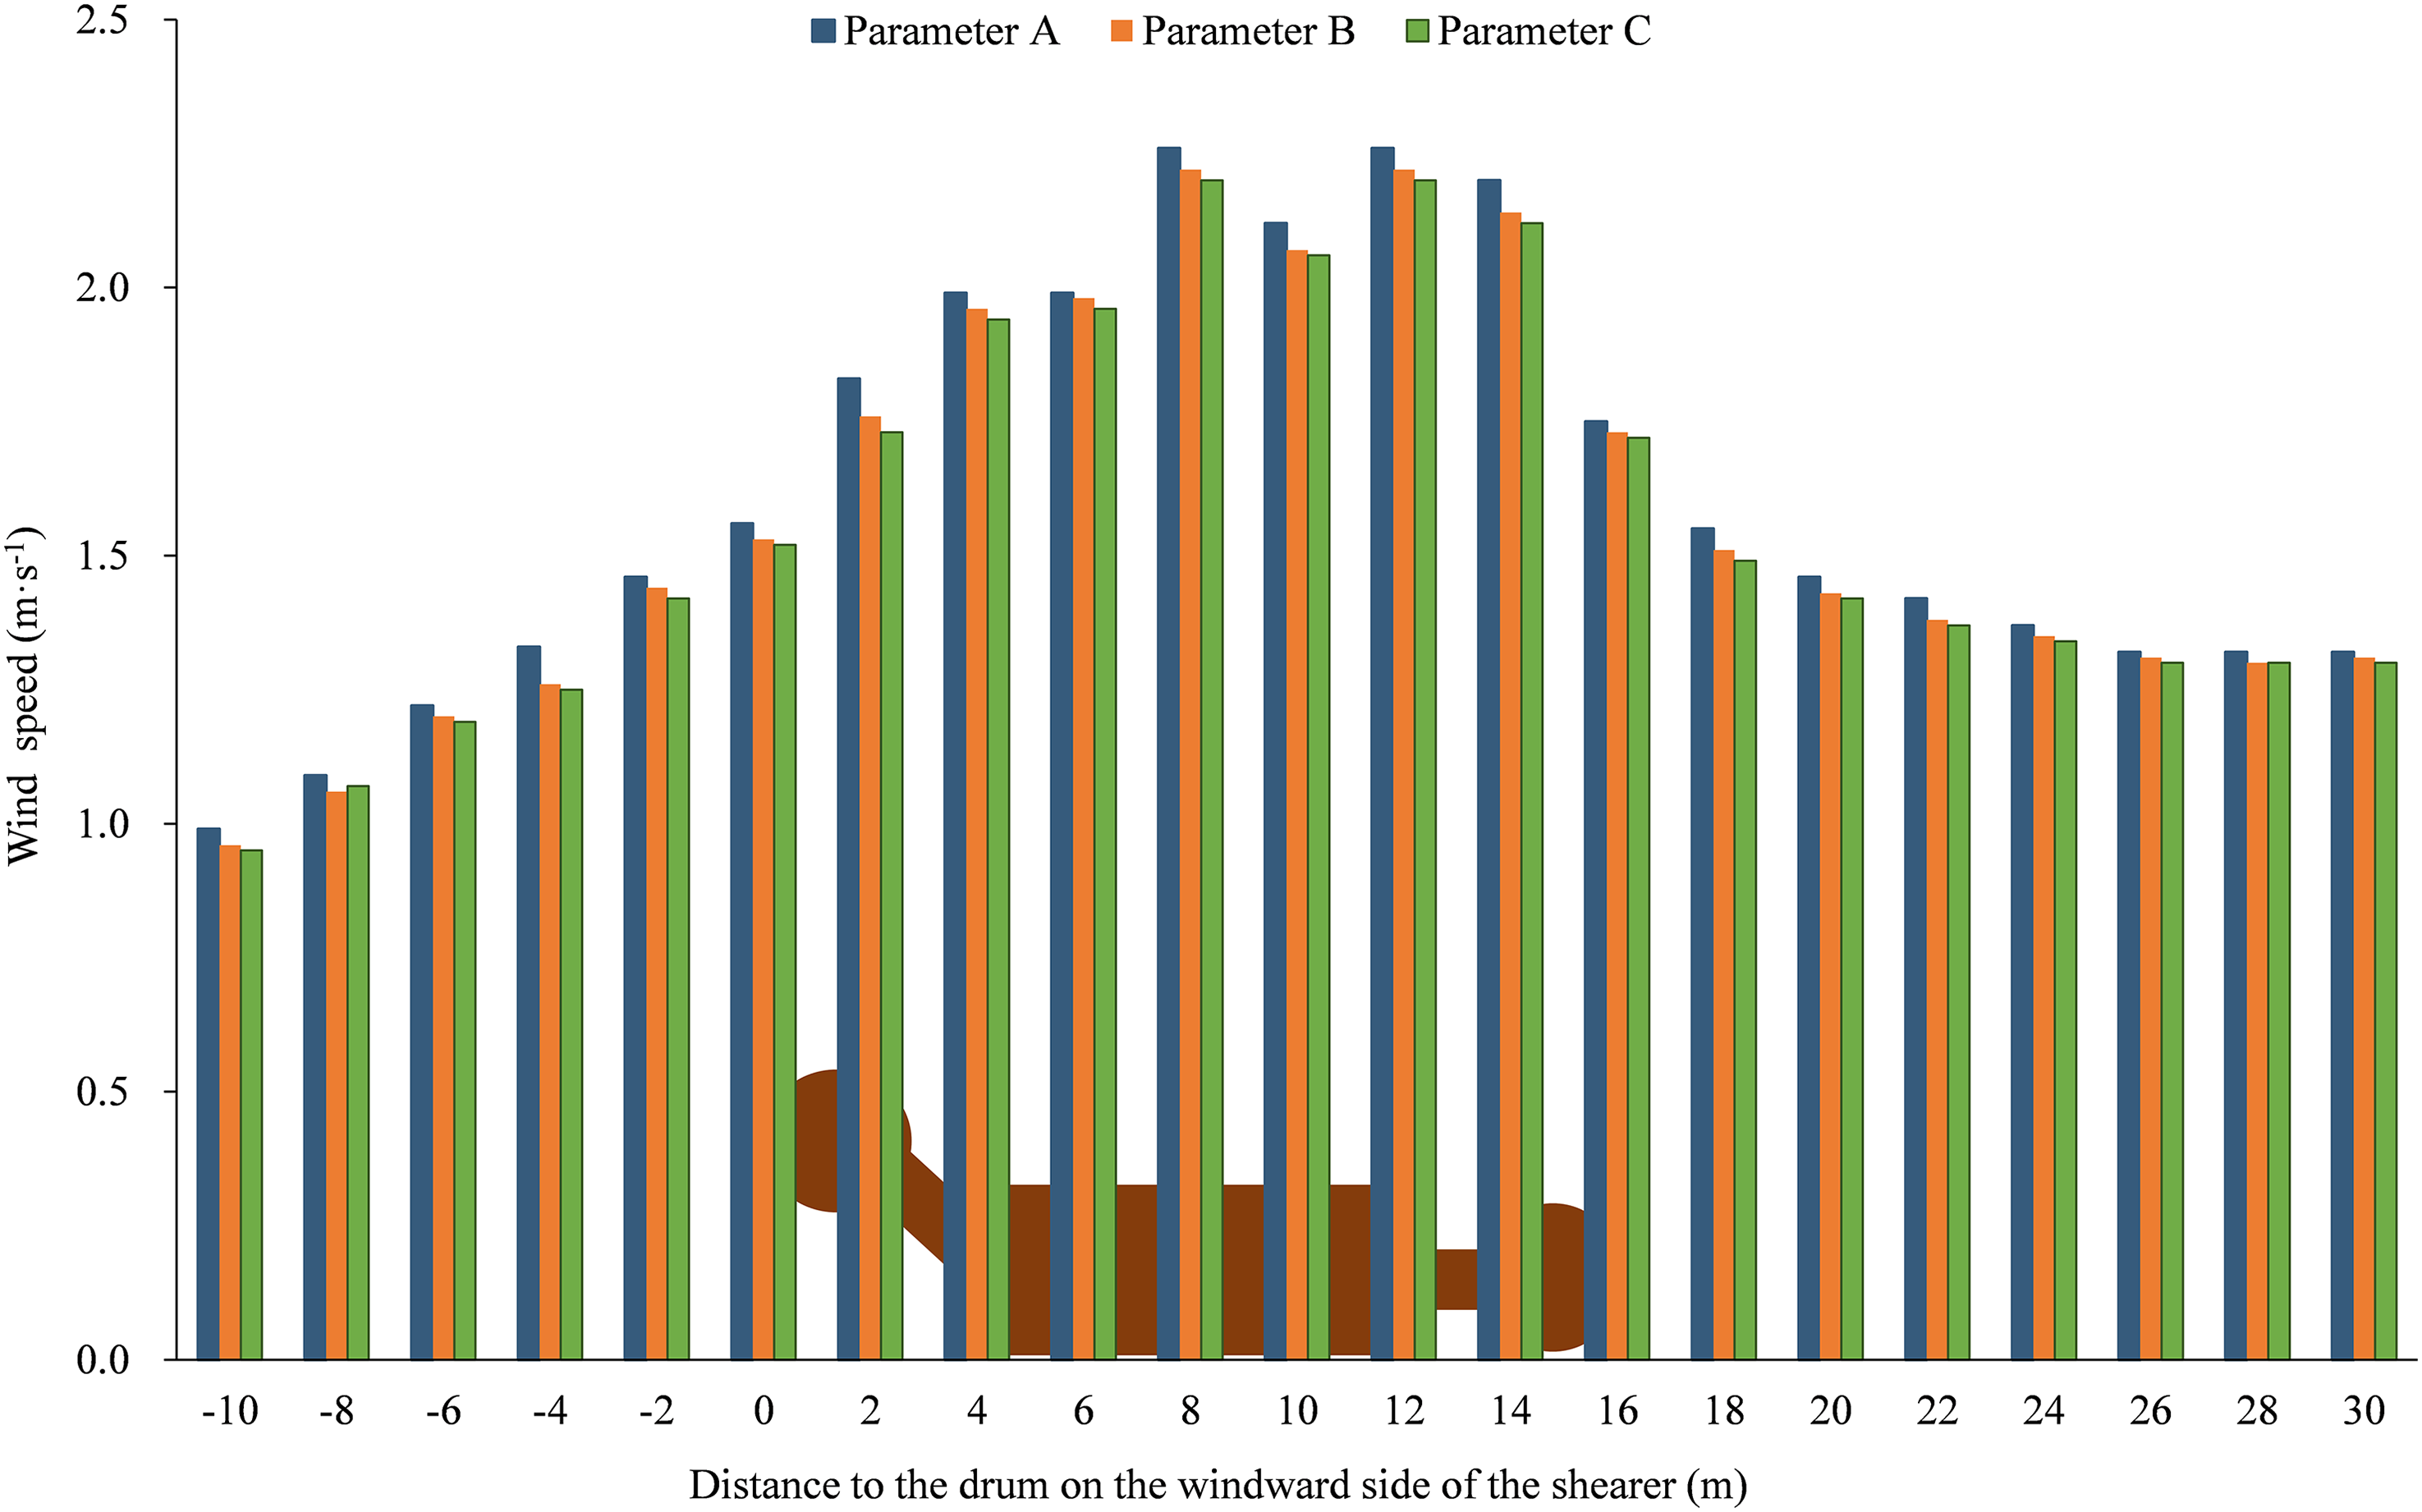
Grid independence verification results.
Finally, by comparing the number of grids corresponding to three different grid division methods and the dispersion degree of grid quality interval, combined with the computing power of the simulation workstation, the grid parameter C is more suitable for the numerical simulation of air flow and dust migration distribution law in Bulianta 12,513 fully-mechanized mining face. This grid is adopted to conduct the numerical simulation of wind velocity distribution. The results of numerical simulation are then compared with the measured results of wind velocity in the height of the respiratory area in the pedestrian side in the underground support, as shown in Figure 4. The figure shows that the numerical simulation result is roughly same as the measured wind velocity underground, and the changing law is basically consistent. The numerical simulation result is slightly higher than the measured result underground, but the error is controlled below 10%. In modeling, some complex equipment is simplified properly, which causes high simulation value, but the simulation result is still highly consistent with the measured value. Therefore, the grid partition and parameter selection are reasonable and feasible, which can be used for further research in later paragraphs.
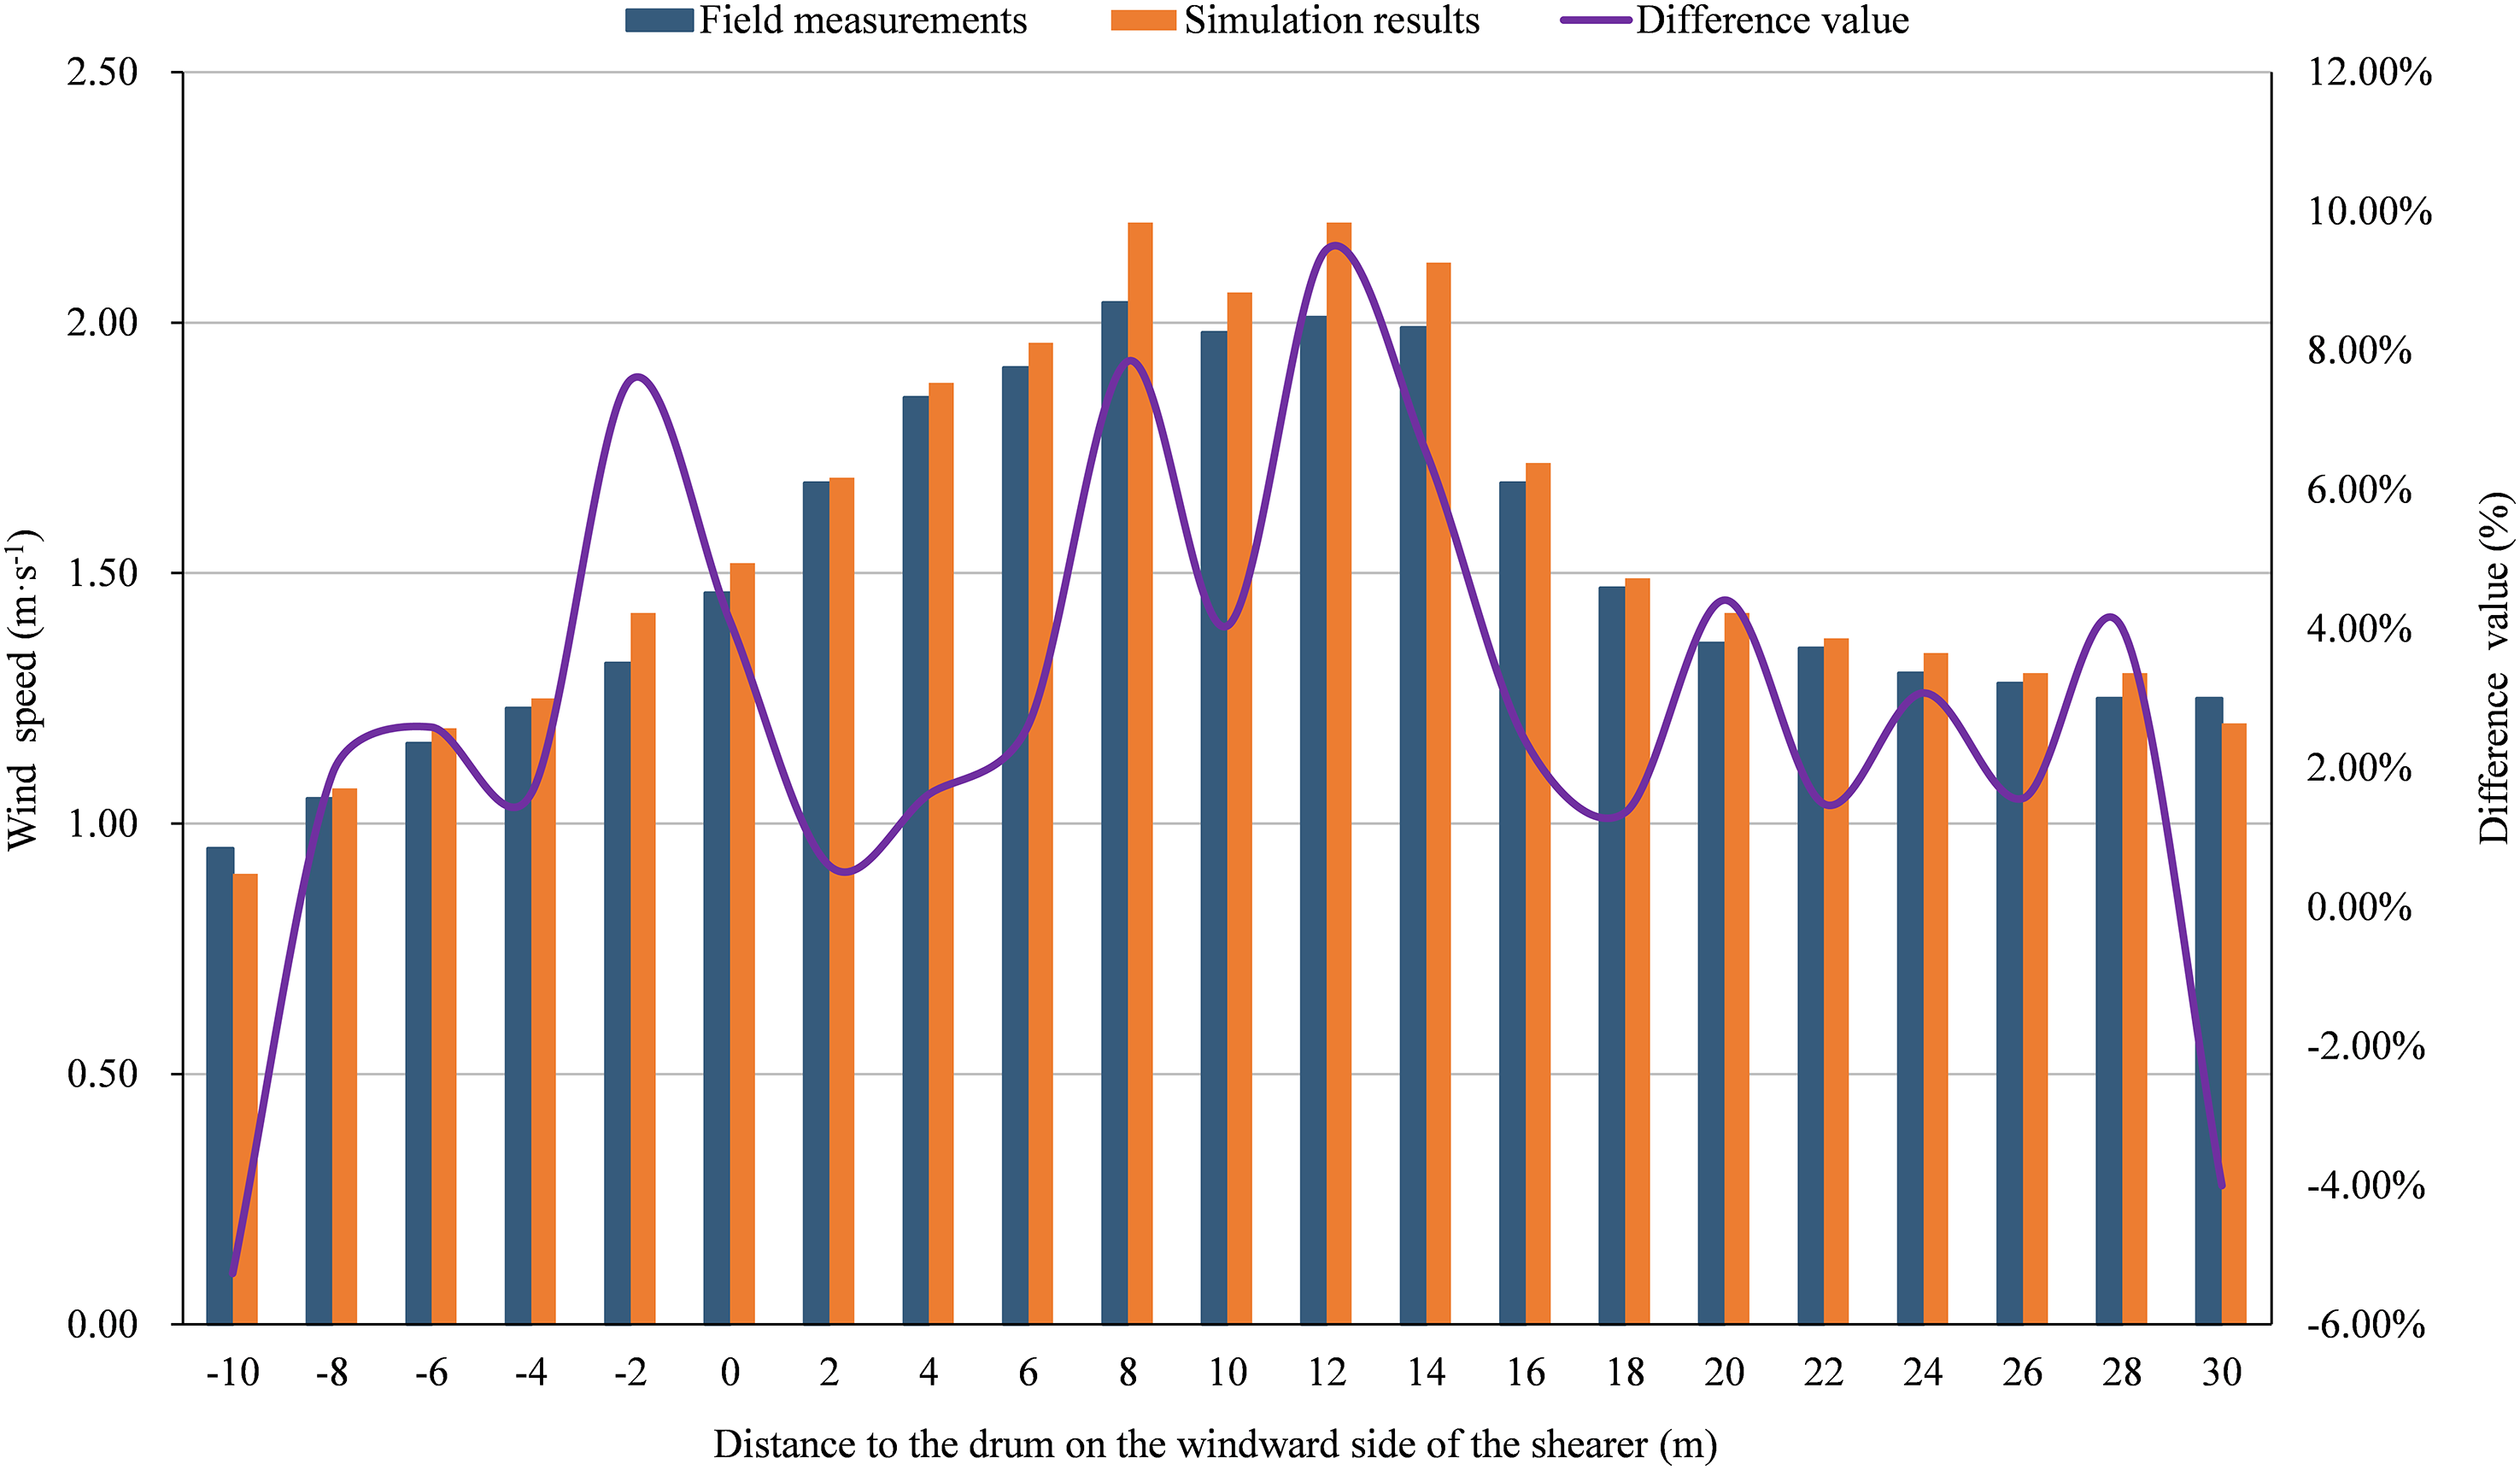
Comparative verification of the simulation result and underground measured value of wind velocity.
Result and analysis
Distribution of airflow field
Influencing range of airflow field
With the help of numerical calculations, the diagram of airflow distributions at various heights for the 8-m high mining face was obtained, as highlighted in Figure 5. Under the dual influence of shearer blocking and instantaneous stope space reduction caused by the forward movement of the support, the airflow field in the area near the shearer altered considerably, and the wind speeds at the pedestrian side and the coal cutting side significantly increased. The influencing range at the upwind side of the shearer was approximately 15 m. The closer to the shearer, the greater the wind speed. On the downwind side of the shearer, the influencing range of airflow was observed to exceed 30 m, and the farther away from the shearer, the smaller the change of airflow distribution. A high-wind-speed zone was found from the middle and lower part of the shearer to the tail area, and its range gradually increased with the height. When the height of the space reached 4.5 m, the range exceeded 40 m.
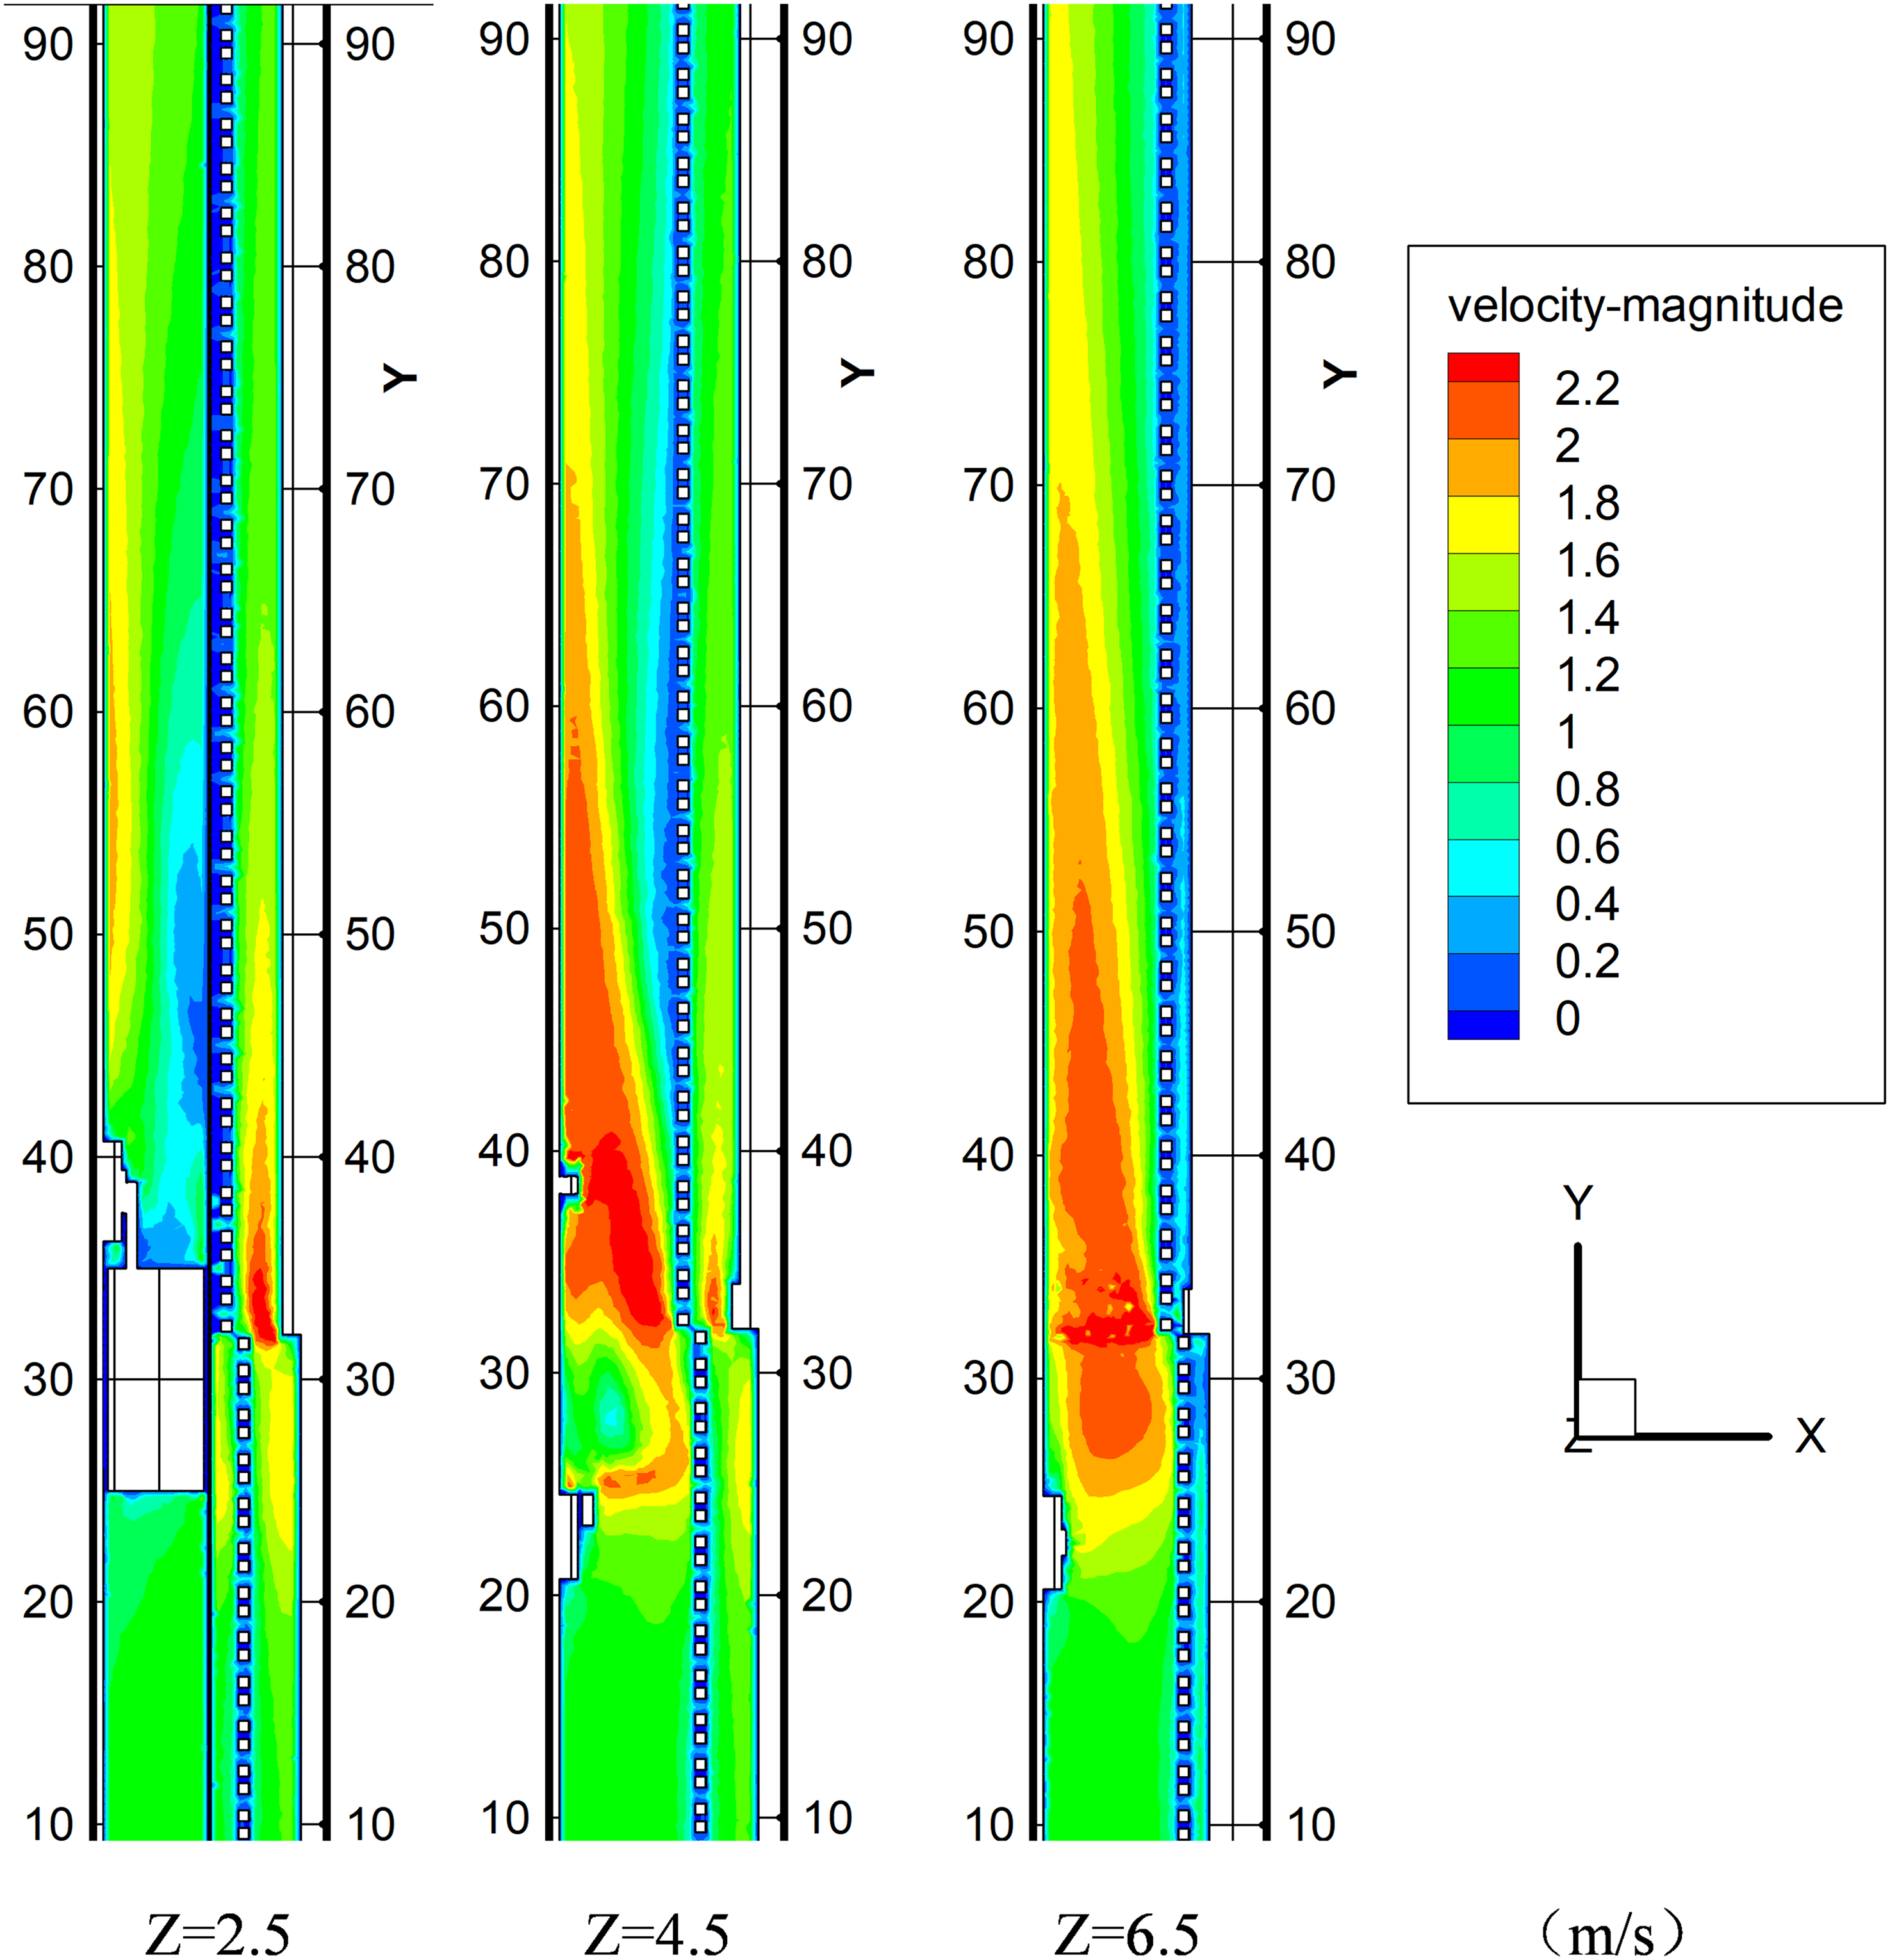
Diagram of airflow distributions at various heights.
Distribution of stope airflow
As shown in Figure 6, by extracting the airflow field velocities at different heights and taking the average of the cross-sectional wind speeds at the same position along the airflow direction, the change curves of the airflow field at the coal cutting side and the pedestrian side were obtained.
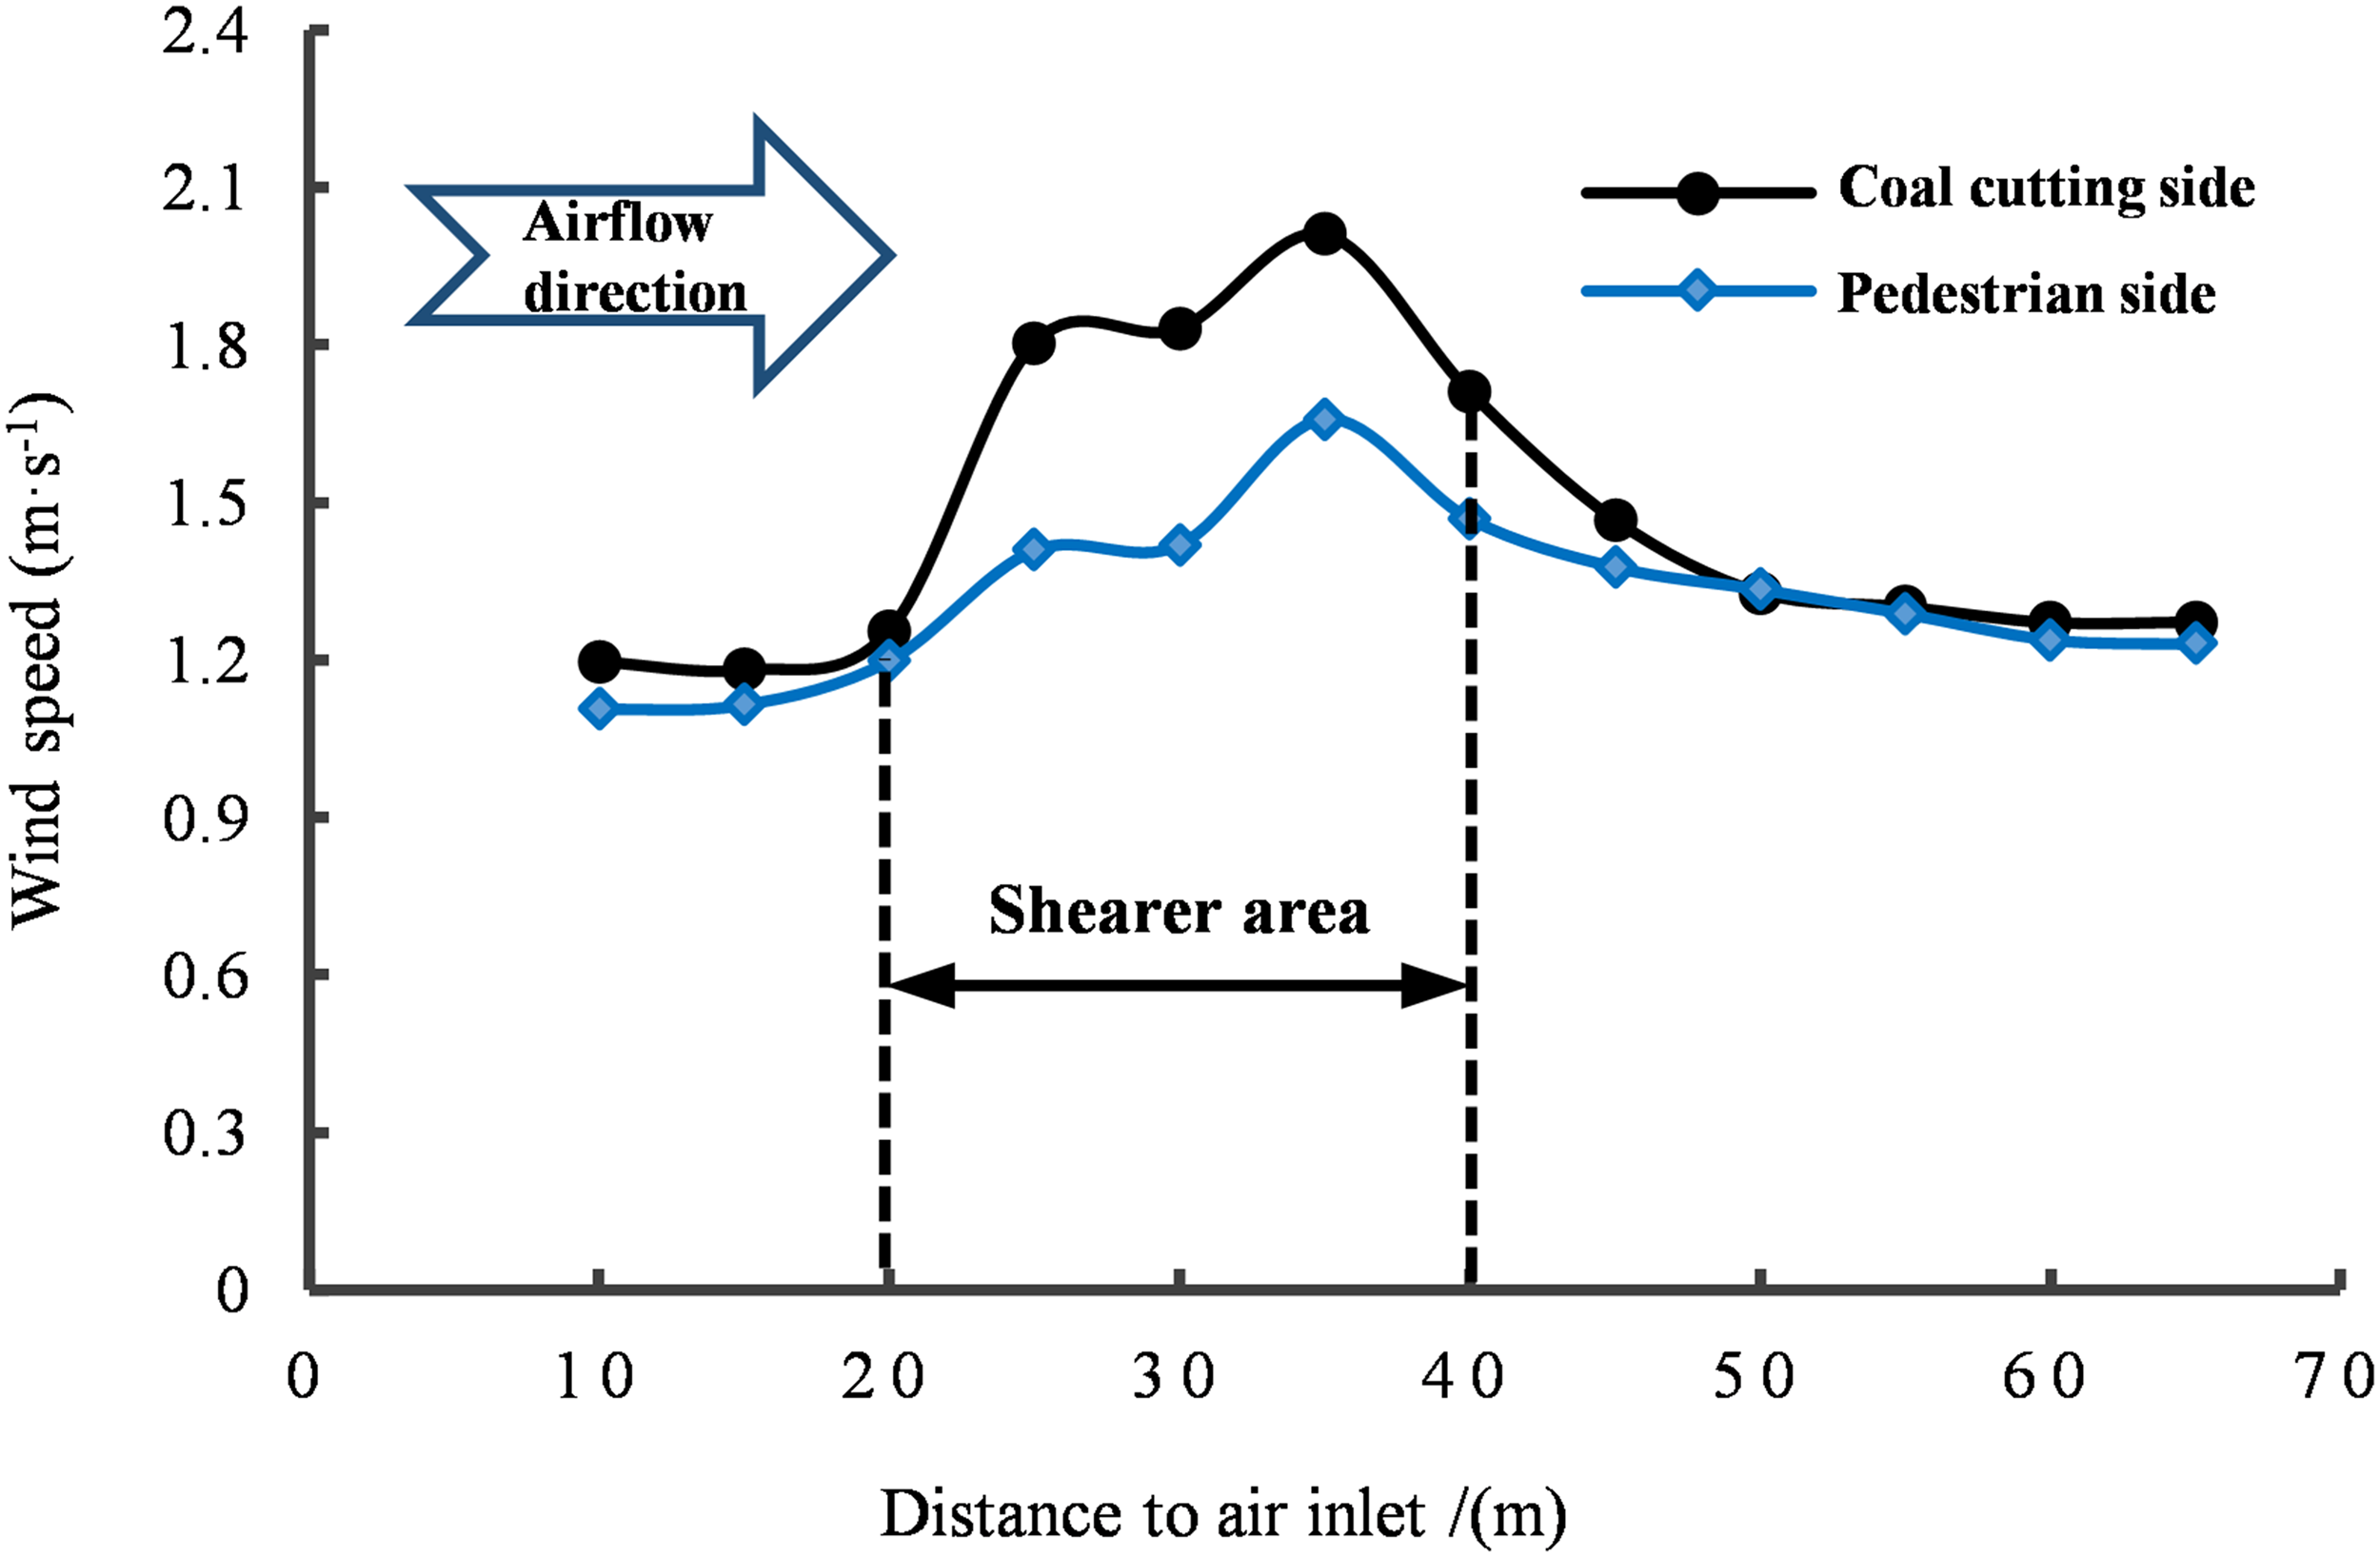
Variations of the airflow field on the coal cutting side and the pedestrian side.
It can be concluded from Figure 6 that along the airflow direction, the airflow velocities near the shearer on both the coal cutting side and the pedestrian side increased first and then decreased gradually, and eventually returned to their average value. When the shearer blocked the airflow, the airflow velocities in the shearer area (Y = 20–40 m) increased rapidly and maximized at the tail of the shearer, which was 2.01 m/s at the coal cutting side and 1.66 m/s at the pedestrian side. The increase of the wind speed at the coal cutting side was much greater as compared to the pedestrian side. It varied between 1.25 m/s and 2.01 m/s, with an average of 1.72 m/s, which was increased by approximately 70% compared to that at the stope. This suggested that because of the blocking effect of the shearer at the 8-m high mining face, most airflow at the working face passed through the upper space of the shearer surface and a small amount of airflow diffused laterally to the pedestrian side. Therefore, the transverse diffusion of airflow was weaker than the longitudinal diffusion. Since the dust diffused with the airflow, the dust from coal cutting at the 8-m high mining face primarily underwent vertical diffusion with supplementary horizontal diffusion. Accordingly, the major dust source on the pedestrian side was also altered.
3D Distribution of respiratory dust
Distributions of respiratory dust concentration at various distances
When the airflow calculation converged, the discrete phase was included, and the calculation continued under the steady-state condition. At every 10 m along the airflow direction, a cross-section was taken. Besides, to analyze the distributions of respiratory dust concentration at various heights, three heights, 2.5 m (the height of the operator's respiratory zone relative to the floor), 4.5 m, and 6.5 m were taken in the pedestrian space inside the support. Figure 7 demonstrates the distributions of respiratory dust concentration at various distances and heights under coal cutting along and against the wind.
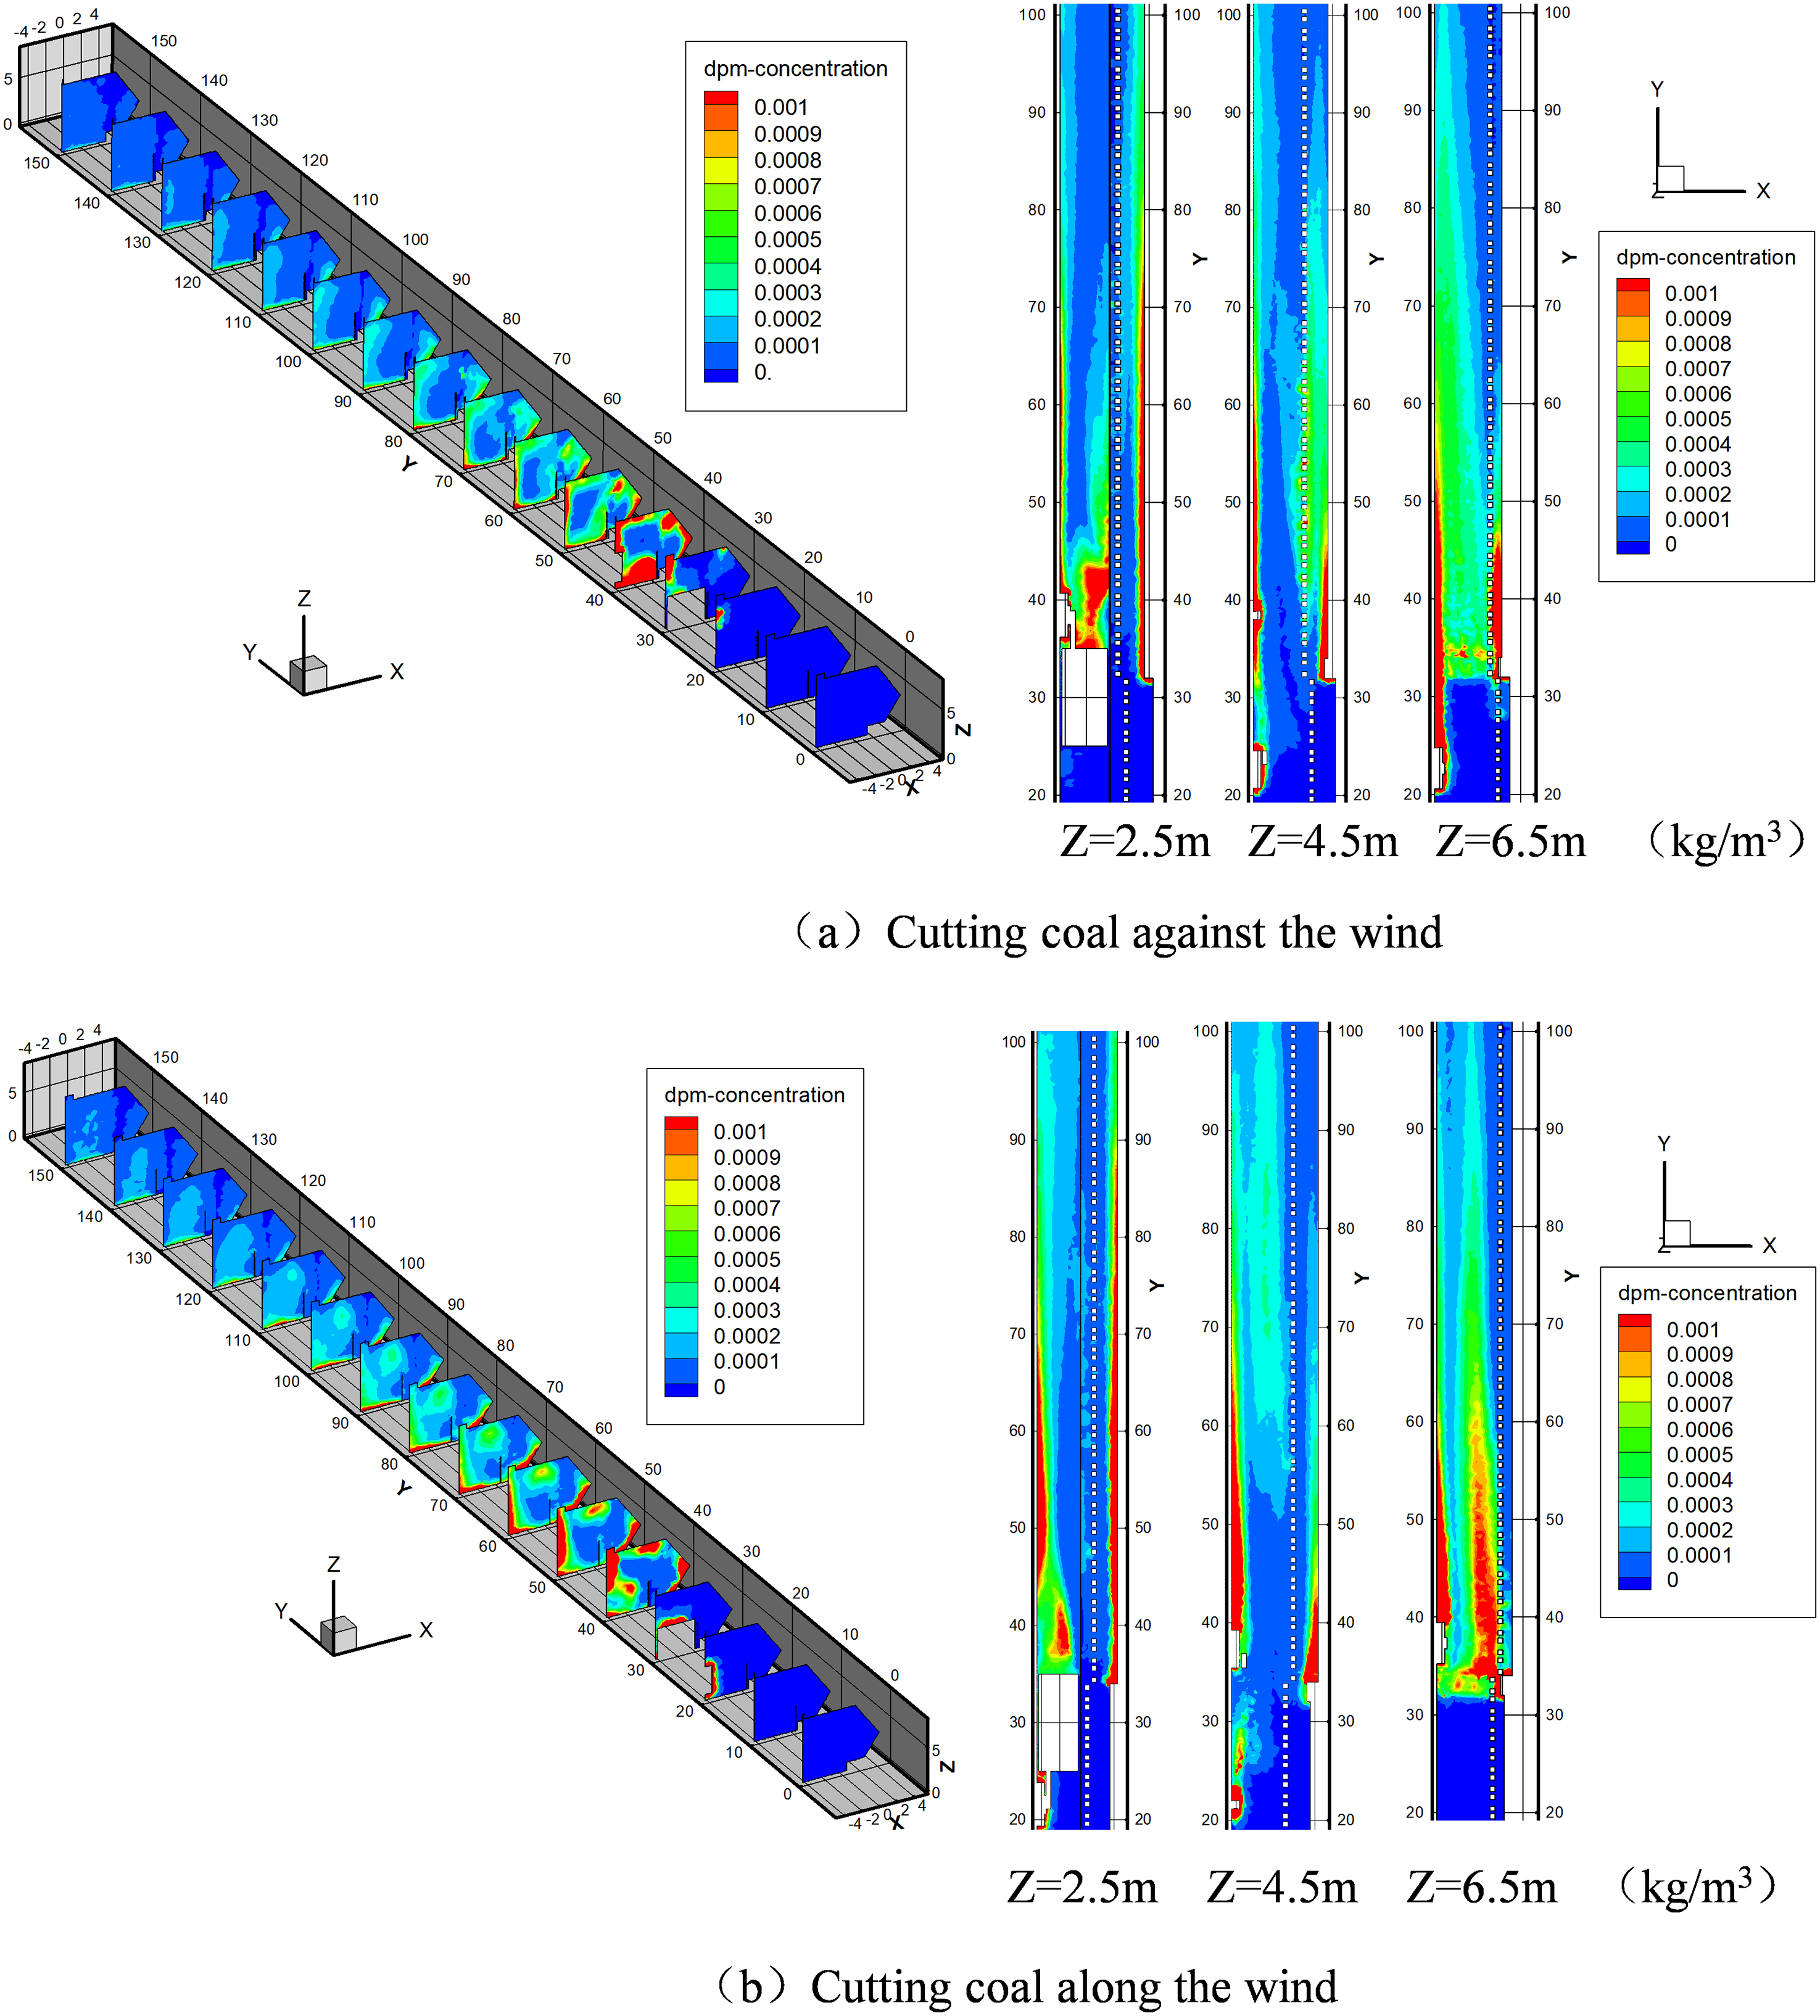
Diagram of respiratory dust concentration distributions at various positions.
In the case of coal cutting against the wind, the respiratory dust above the shearer gradually diffused under the disturbance of airflow. A small part of this duct diffused to the pedestrian space though most of it moved to the top space of the machine surface, leading to an increase of the influencing range by the respiratory dust in X and Z directions. The height of the spill plate was lower than the coal cutting height of the drum, at the corner between the windward side of the shearer and the spill plate. So, the dust concentration in this area was found to be very low. At the downwind side of the shearer, the dust moved along the airflow, climbing over the shear and sinking at the end, leading to the dust accumulation there. This was mainly caused due to the low wind speed at a height of 2 m because of the shearer's blocking effect. As the distance from the shearer increased, the dust concentration tended to be uniform and decreased under the influence of airflow disturbance.
In the scenario of cutting coal along the wind, the upwind drum cut the bottom coal. This led to a considerable concentration of the dust at the corner between the spill plate and the shearer and diffused windward along the shearer and the spill plate. The dust concentration was maximum above the shearer surface, and it gradually diffused towards the upper space. At the downwind side of the shearer, the drum cut the top coal. Therefore, the dust primarily moved along the coal wall and gradually diffused to the pedestrian side with the airflow.
It can be observed from the comparison of the downwind and upwind coal cutting cases that at the same height, the trends of respirable dust distribution were roughly the same. Nonetheless, the dust mainly moved along the coal wall when cutting coal along the wind, and it moved downwind along the spill plate side when cutting coal against the wind. The primary source in both cases was the dust from the frame moving of the support. The dust concentration on the coal cutting side increased with the increase in height. The dust in the upper space mainly originated from the frame moving, and the dust in the lower space mostly came from coal cutting. Moreover, the dust produced by the support had a larger influencing range in the transverse direction. The dust produced by the support gradually converged with the dust from coal cutting within 20–30 m downwind of the shearer, which further moved downward.
Temporal evolution of respiratory dust
As shown in Figure 8, the distributions of respiratory dust with various particle sizes at 5, 15, 35, 50, 75, 100, and 150 s after dust generation were obtained according to the spatial distribution trajectory of dust particles.
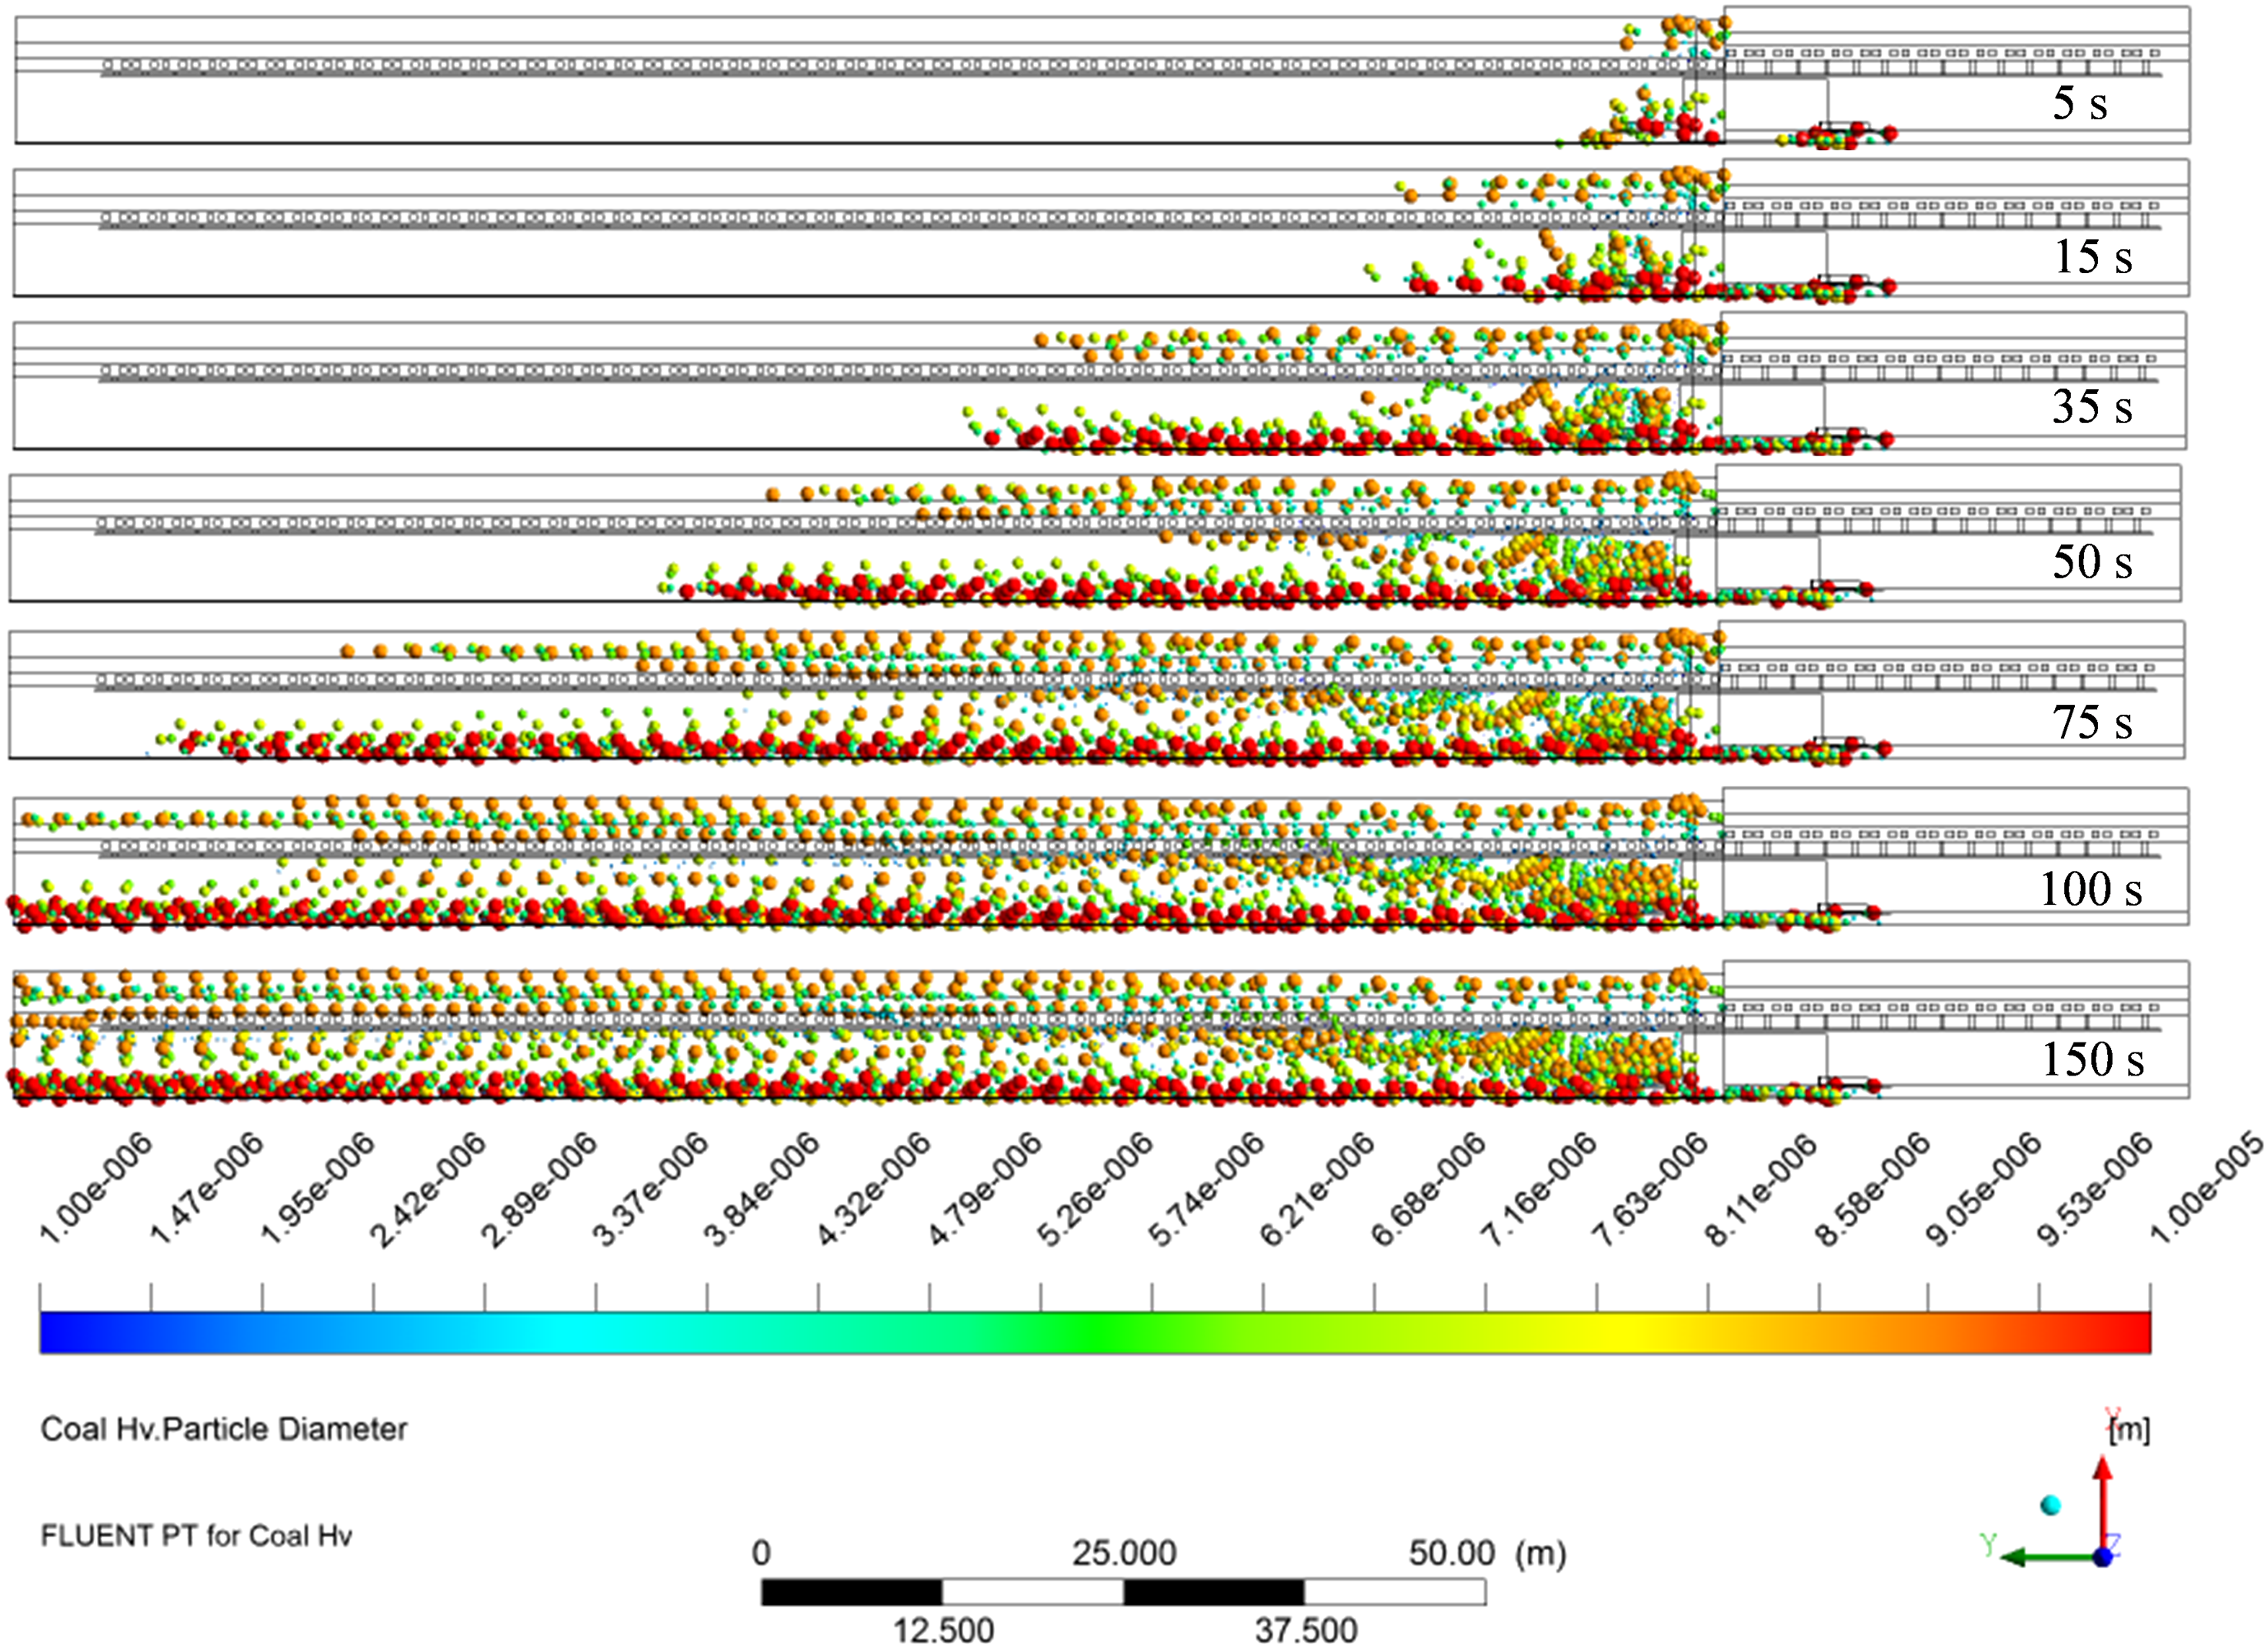
Distribution of dust particles at various moments.
A directly proportional relationship to time was exhibited by the migration distance of dust particles. The majority of the larger dust particles moved along the coal wall with the airflow, whereas the smaller ones were prone to transverse diffusion. The dust particle movement trajectory was disorderly diffused in the initial stage of dust production. It stabilized after approximately 100 s. At the initial stage, a great difference in dust migration existed for dust particles produced by shearer cutting and support frame moving. Figure 9 shows the trajectories of dust particles under upwind coal cutting.
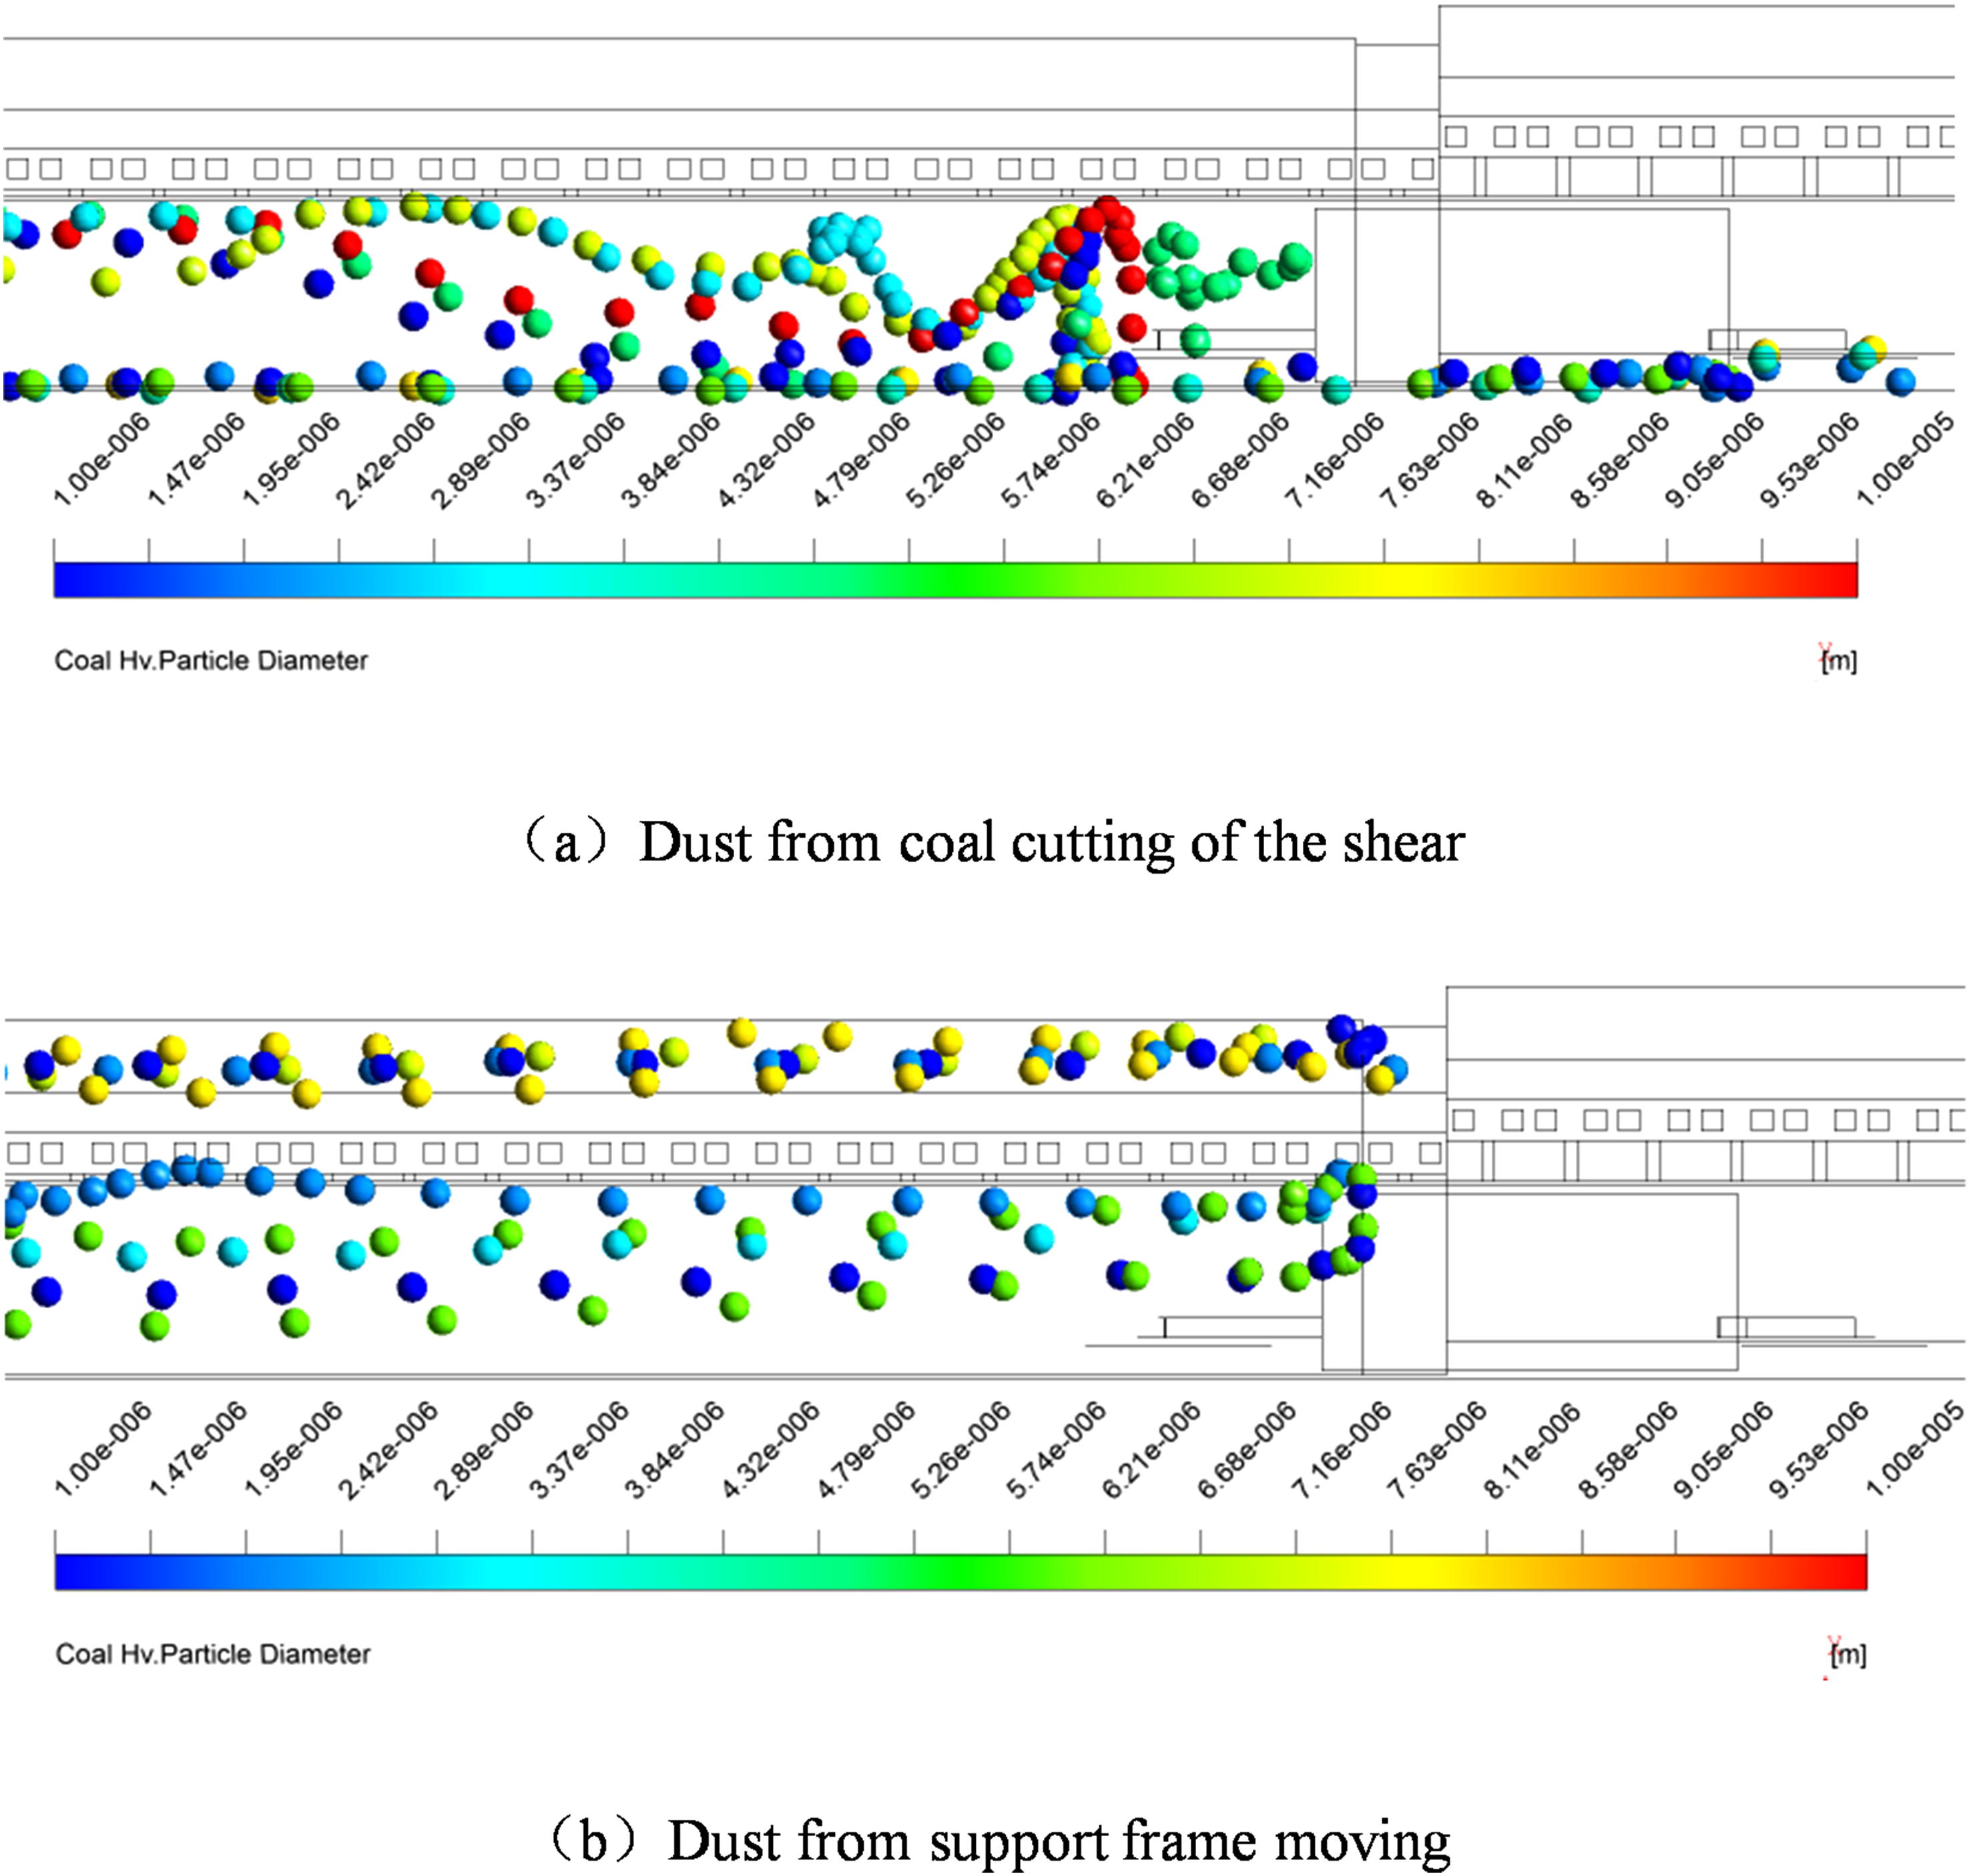
Migration trajectories of dust particles.
As shown in Figure 9(a), on the coal cutting side, the respiratory dust particles generated by the drum on the upwind side of the shearer moved downwind along the coal wall, whereas the dust particles generated by the drum on the downwind side lingered and collided back and forth between the drum and the spill plate. Though they eventually moved downwind, the dust particles in this area tended to accumulate instantaneously, which must be the prime focus of the treatment. When the dust particles at the downwind side drum left the vicinity of the drum, they gradually diffused to the pedestrian side in the tunnel at 15–20 m downwind of the shearer. Figure 9(b) demonstrates the case of dust produced by support frame moving. Due to the high stope space, the dust generated at the support tail beam gradually moved downwind with the airflow along the rear side of the pedestrian space close to the support tail beam, and subsequently diffused to the whole pedestrian space. The falling dust particles generated by the top beam were primarily diffused in the upper space. The dust in the pedestrian space inside the support mainly originated from support frame moving, in which the main source was the dust falling from the tail beam.
Spatial evolution of pedestrian-side respiratory dust concentration
As demonstrated in Figure 10, the distribution of respiratory dust concentration was obtained by extracting it at various heights in the pedestrian space.
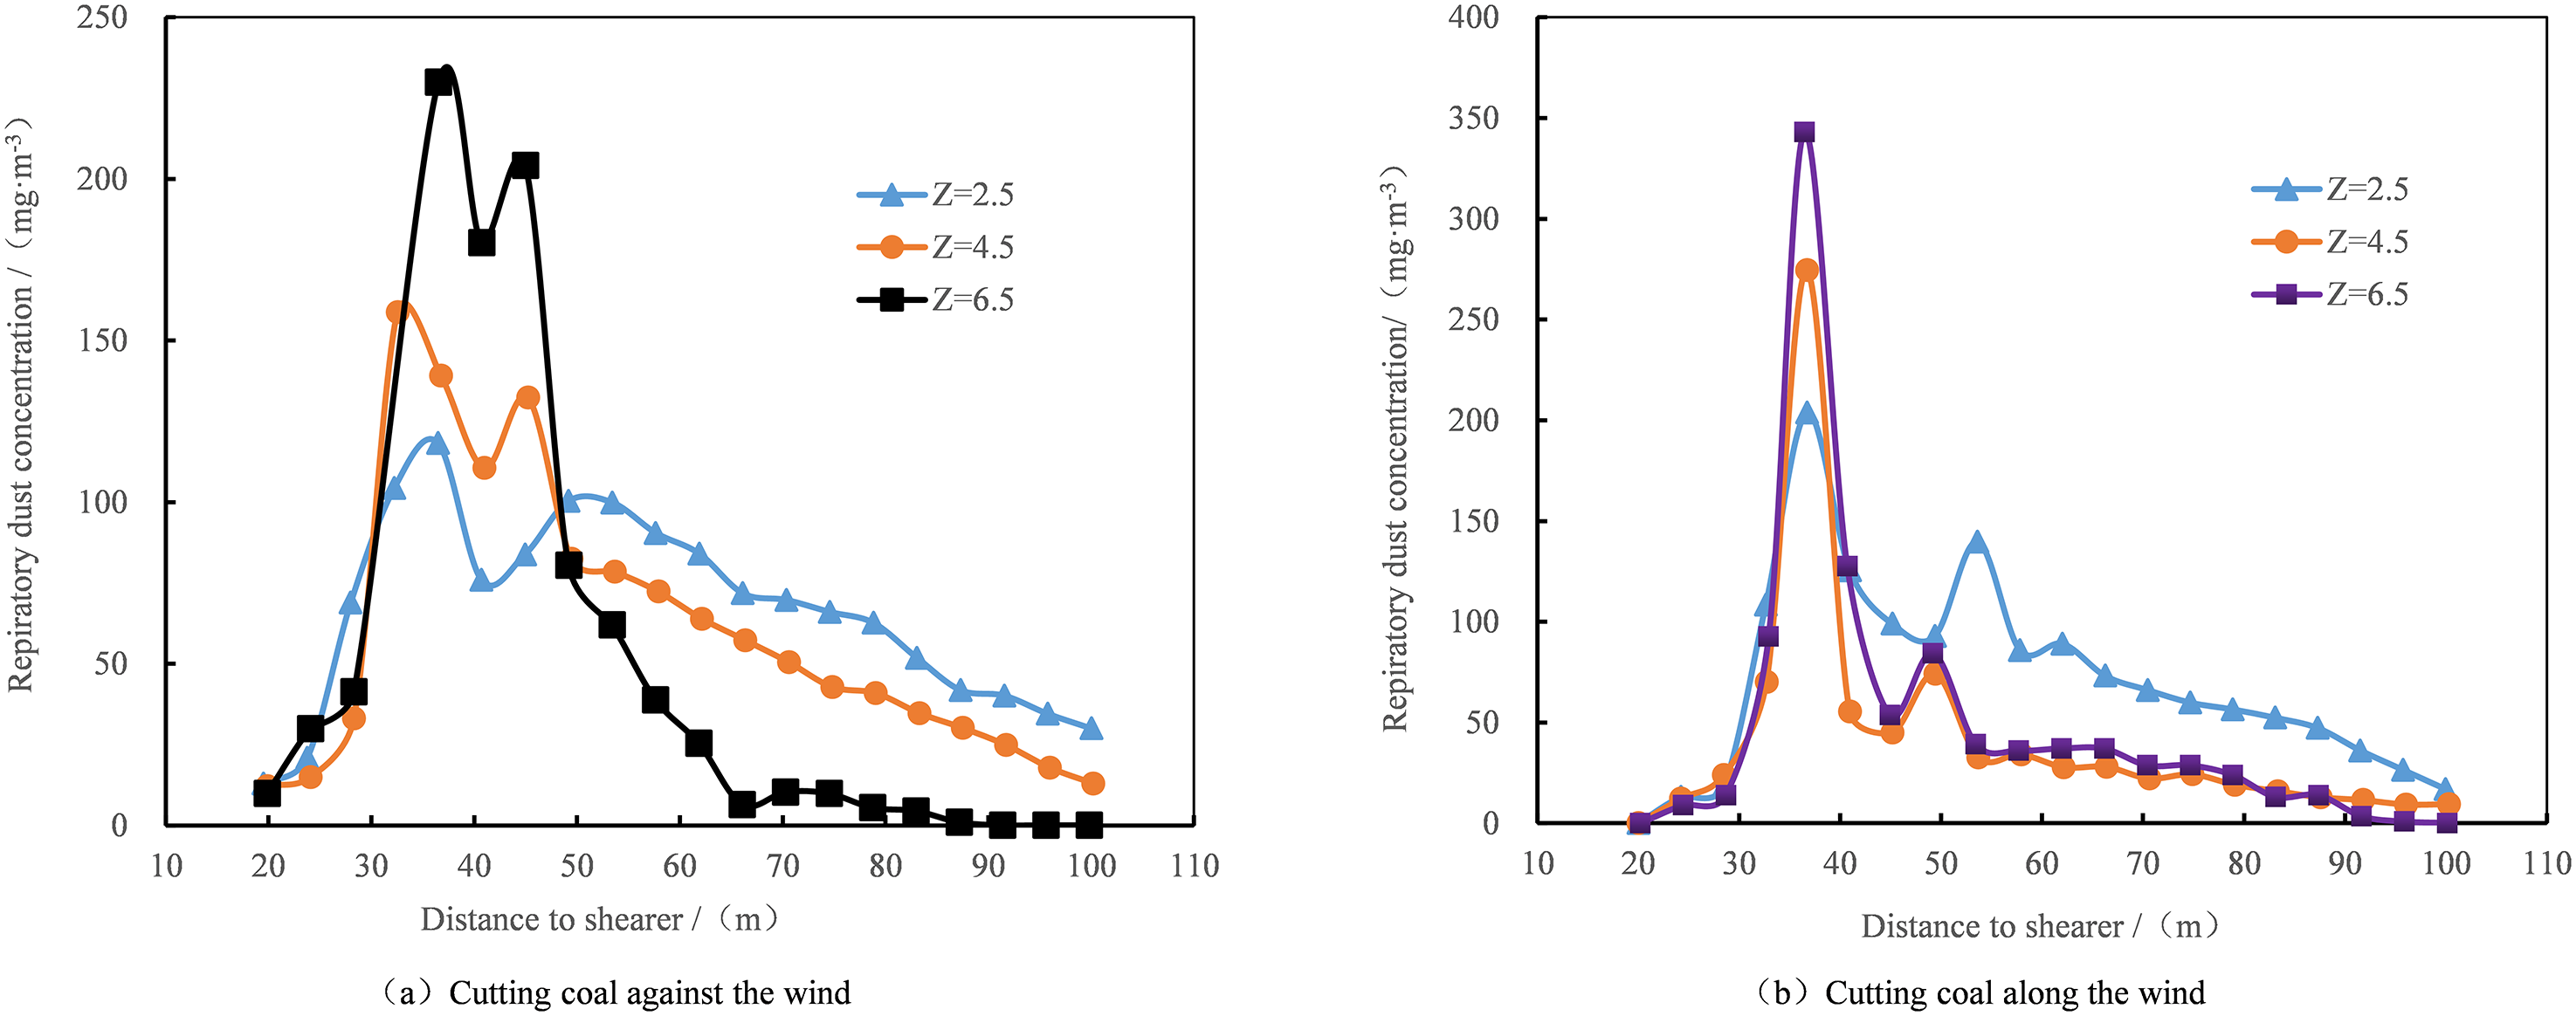
Respiratory dust concentrations at various heights in the pedestrian space.
The respiratory dust concentration in the pedestrian space along the airflow direction increased first and then decreased, then further increased and decreased gradually for either upwind or downwind coal cutting. When cutting coal against the wind, from the windward side to the tail of the shearer, the dust concentration increased with the increase of height. The maximum dust concentration was measured to be up to 229.8 mg/m3, which occurred at the tail of the shearer. The dust concentration at the height of the respiratory zone maximized at 10 m beyond the shearer tail, which reached 118.3 mg/m3. On the downwind side of the tail, the dust concentration gradually decreased with the increase of height. This was mainly due to the gradual dust settlement from the upper space to the lower space.
When cutting coal along the wind, the respiratory dust concentration also showcased an increase-decrease-increase-decrease trend along the airflow direction, and the dust concentration increased with the increase of height. However, this trend was more obvious compared with the case of upwind coal cutting, primarily because the downwind coal cutting had less disturbance to the airflow. The support frame moved on the windward side in downwind coal cutting, leading to a rapid increase in the dust concentration near the shearer, which was up to 343.1 mg/m3. At approximately 20 m behind the shearer tail, due to the combined effect of transverse diffusion of the coal cutting dust and diffusion of the dust from coal wall collapse, the dust concentration increased and reached a local maximum of 100.3 mg/m3 at the height of the personnel respiratory zone.
As shown in Figure 11, considering the position of the upper shearer drum as the origin and fitting the respiratory dust concentrations from 10 m in front of the shearer to 60 m beyond its tail, the relationship between the respiratory dust concentration near the shearer and the spatial location was obtained. The goodness of fit was over 0.95, indicating a high fitting similarity, which could be used as a reference.
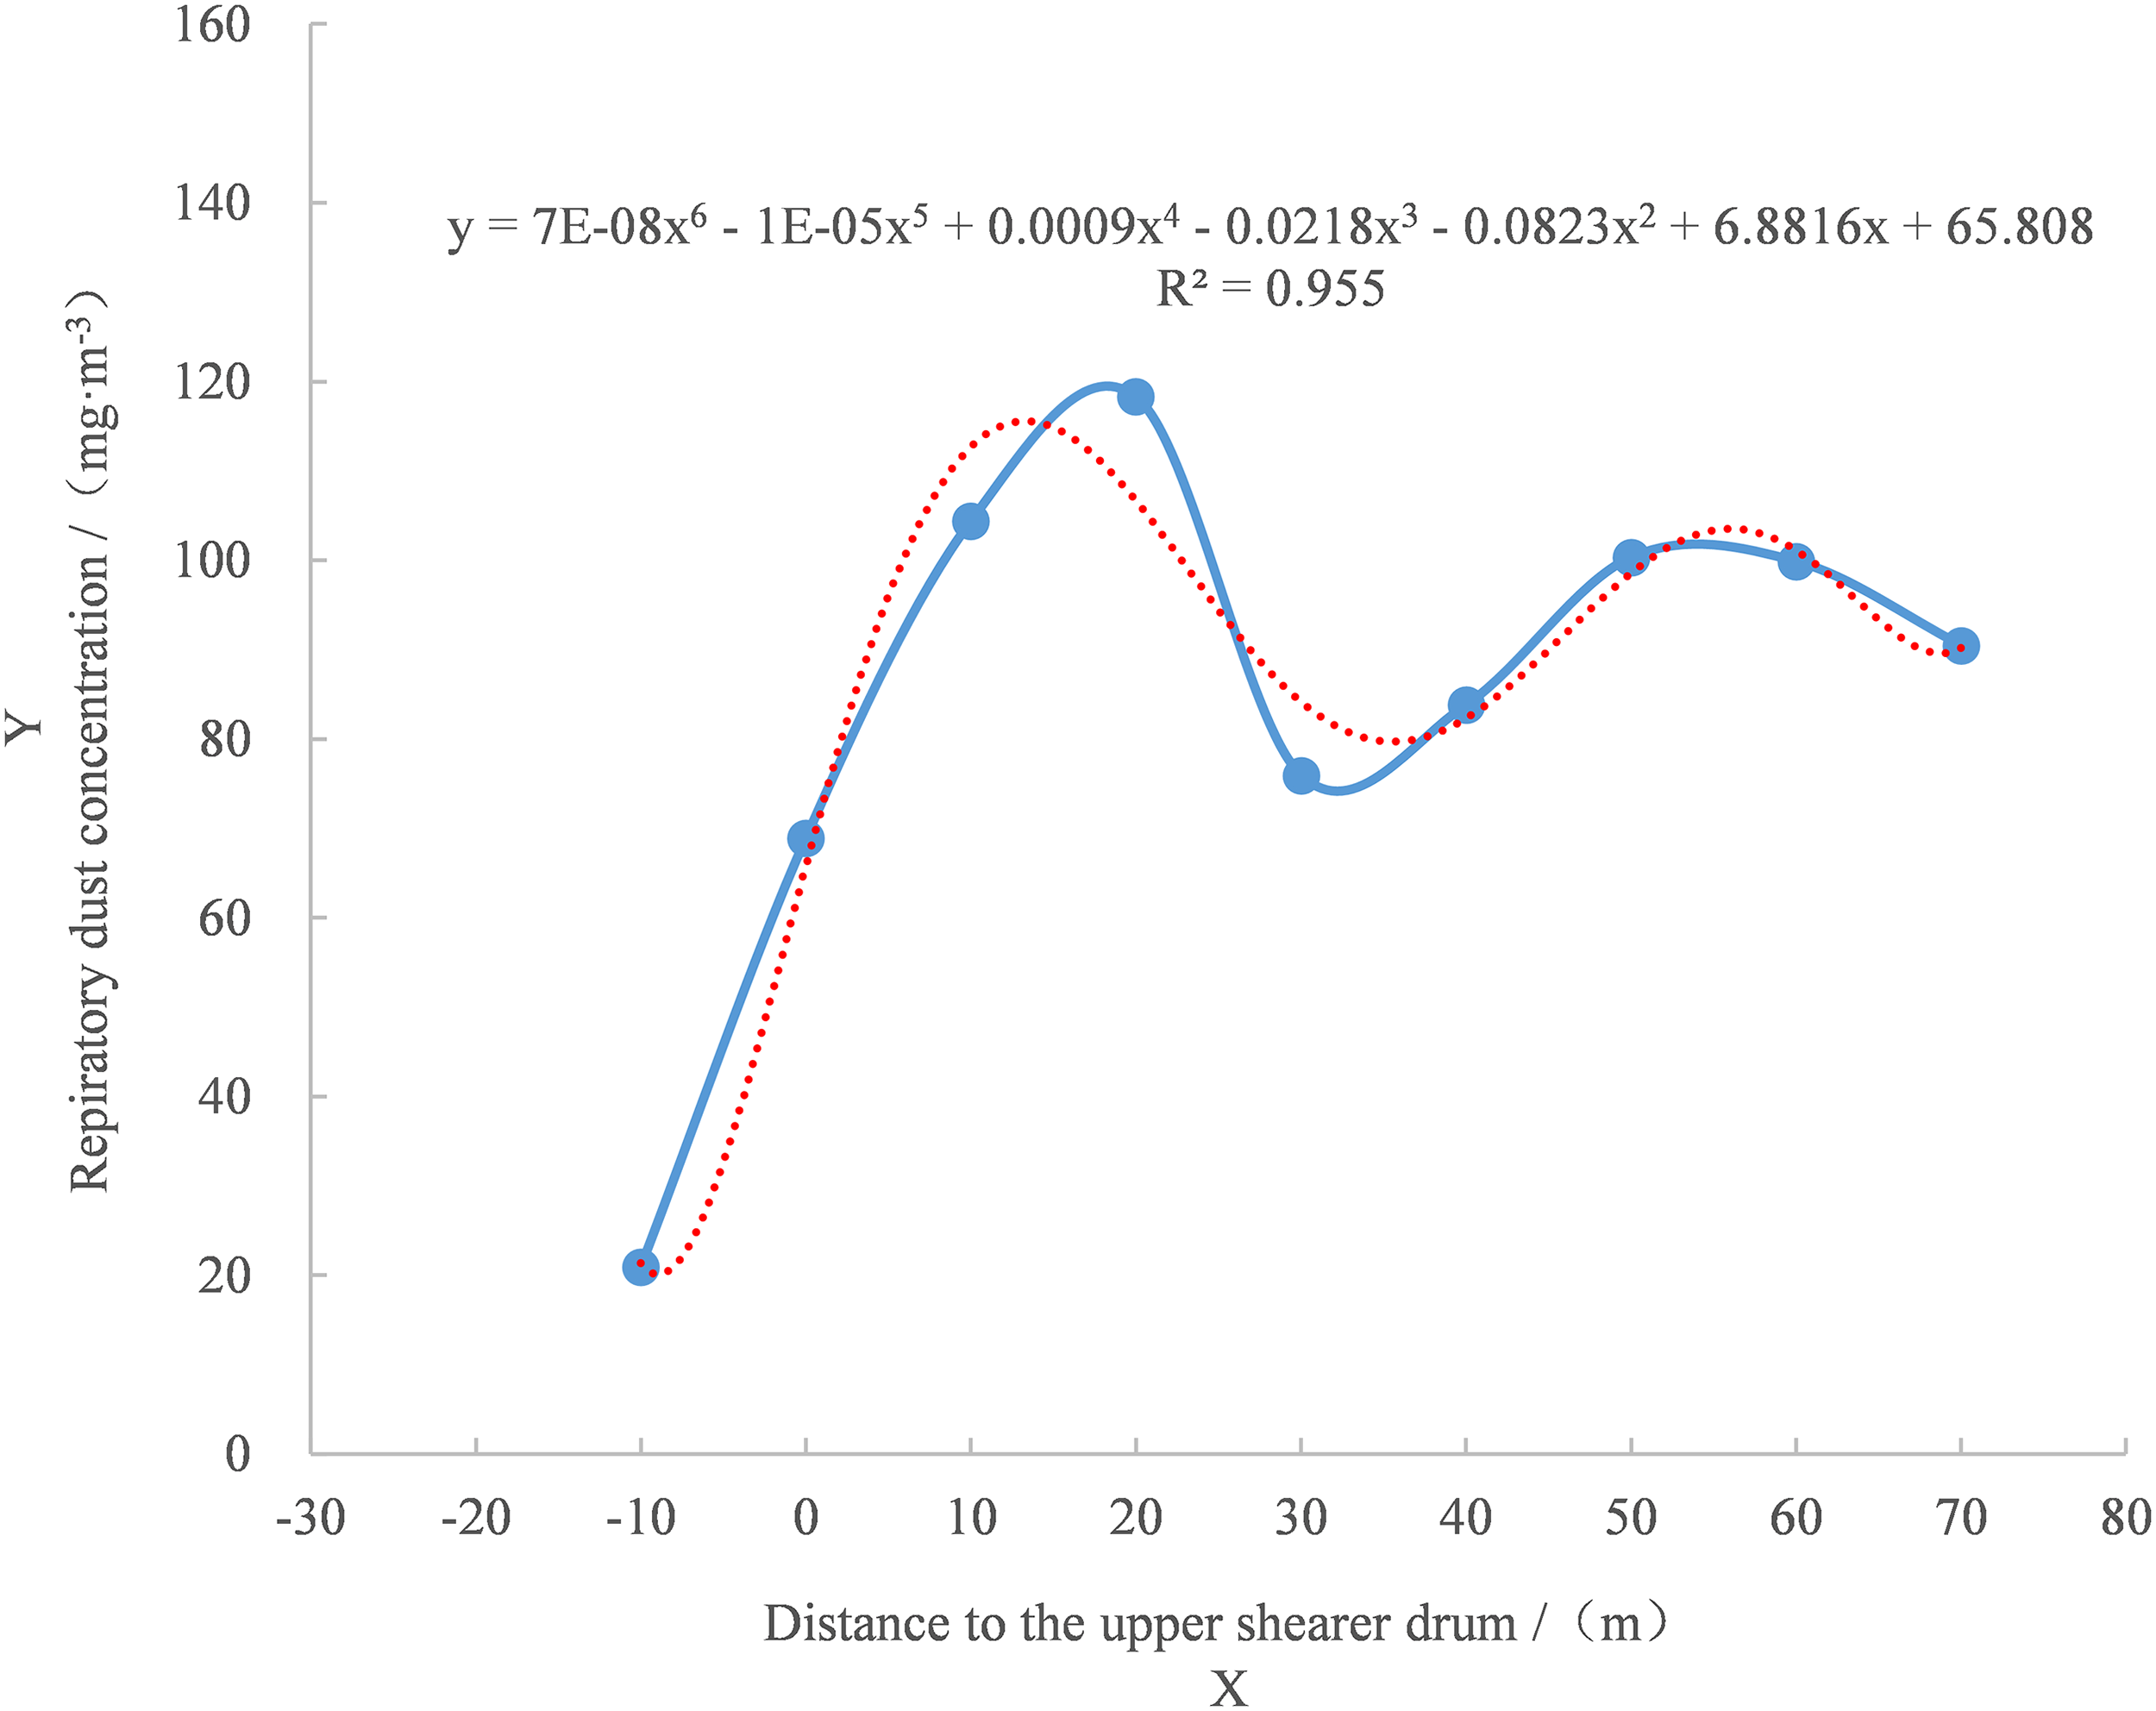
Relationship between respiratory dust concentration and spatial location.
Experimental study on the evolution of airflow-respiratory dust
Field test
Due to the limitations of the site conditions and safety factors at the 8-m high fully-mechanized mining face, the space of the shearer scraping and conveying path could not be sampled. Besides, since the operators are typically in the pedestrian space, the sampling points were only arranged in the pedestrian space within the support, and the result could effectively reflect the impact of dust pollution on the personnel at the working face and be compared with the numerical simulation.
The arrangement of the respiratory dust concentration measuring points was made as follows. Along the airflow direction at the working face, a monitoring section was arranged at every 10 m from 20 m upwind of the shearer to 60 m after the shearer tail, along with a monitoring section at every 50 m beyond 60 m behind the tail. Each section was arranged with three measuring points upward at the height of the personnel respiratory zone (1.5 m). At an interval of 2 m near the shearer, a wind speed monitoring section was arranged. To measure the dust concentration and wind speed, CCZ20A and electronic anemometers were used, respectively. To ensure reliability, multiple measurements were done synchronously. The sampling probe with the filter membrane was installed on a 6-m high telescopic rod, followed by the connection of the pipelines using the connector, which were then connected with the samplers via the dust measuring tube. When they were fixed, 1#, 2#, and 3# samplers were opened simultaneously, which measured the spatial dust concentration at the height of 1.5, 3.5, and 5.5 m from the surface of the support base, respectively. Figure 12 demonstrates the layout of measuring points for each section.
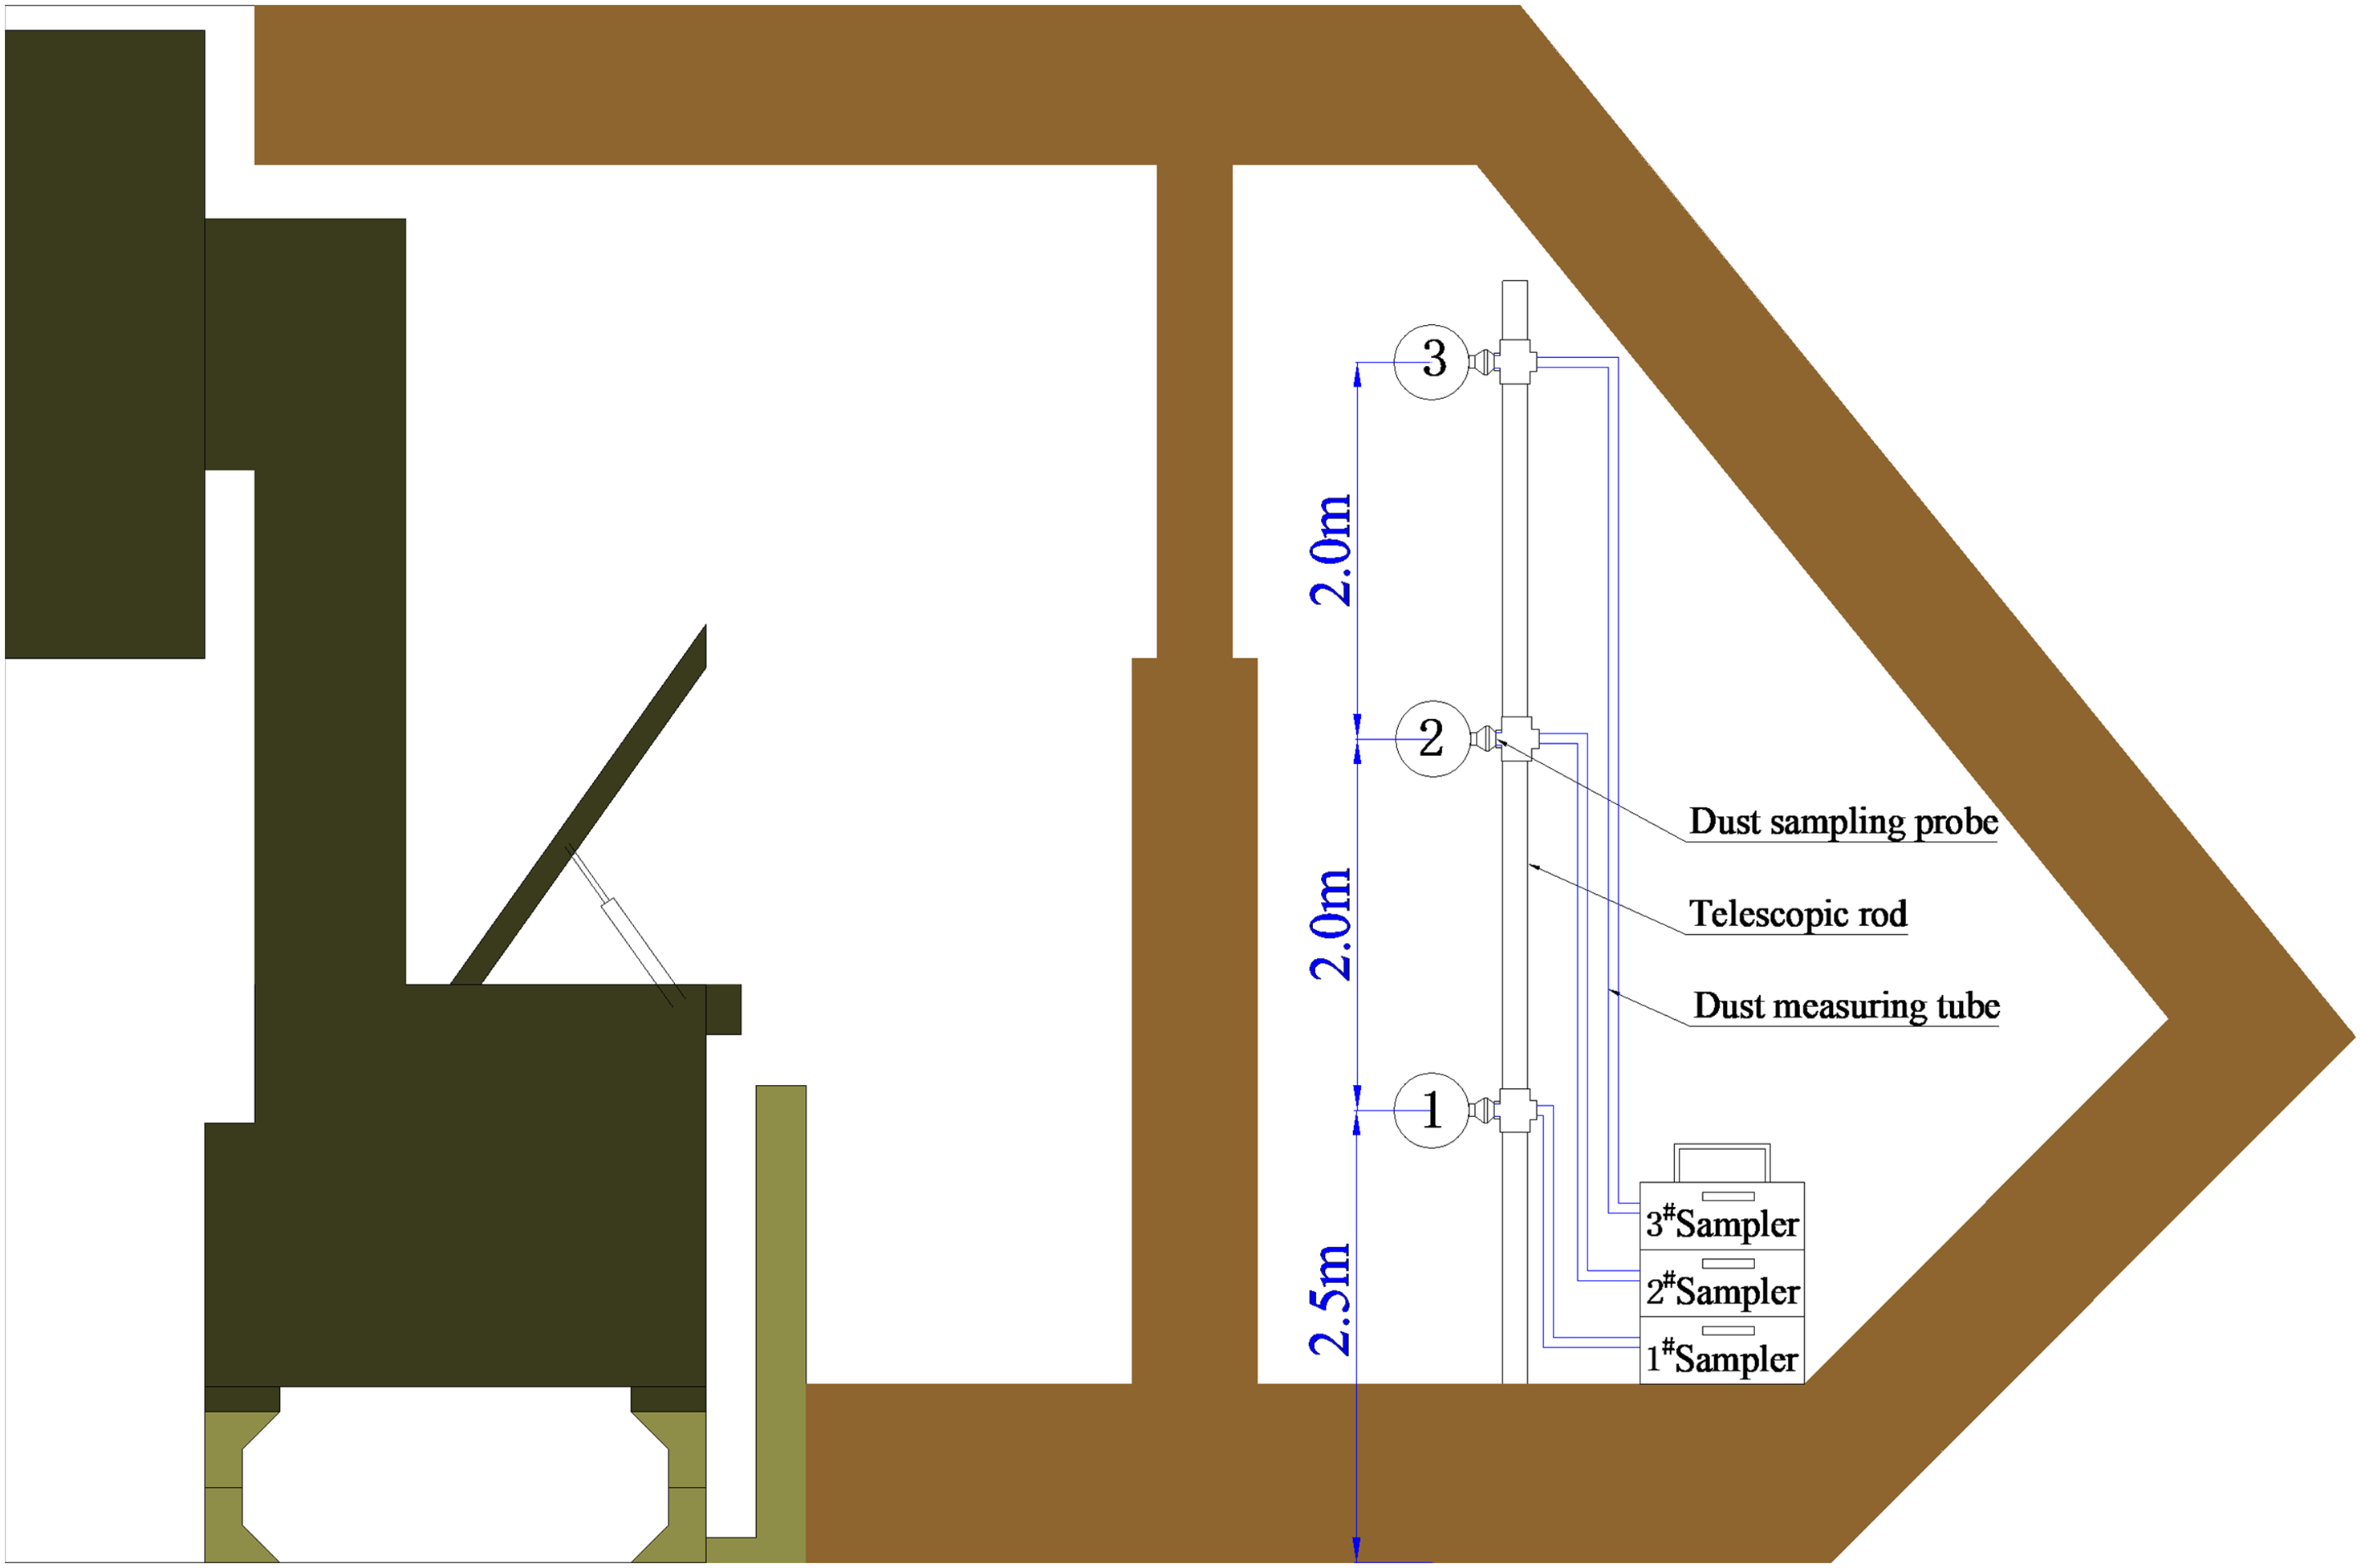
Cross-section of sampling points layout.
Measured results of airflow-respiratory dust distribution
According to the practical site situation and the layout of measuring points, 24 cuts of coal cutting out of the 12,513 fully-mechanized mining face of Bulianta Coal Mine were tested along and against the wind, obtaining 500 groups of test data of airflow field and respiratory dust These data were averaged to obtain the wind speed and dust concentration.
Distribution of airflow field
As displayed in Figure 13. by testing the spatial airflow velocity of the mining space near the shearer, the distribution of the airflow field at the fully-mechanized mining face was obtained.
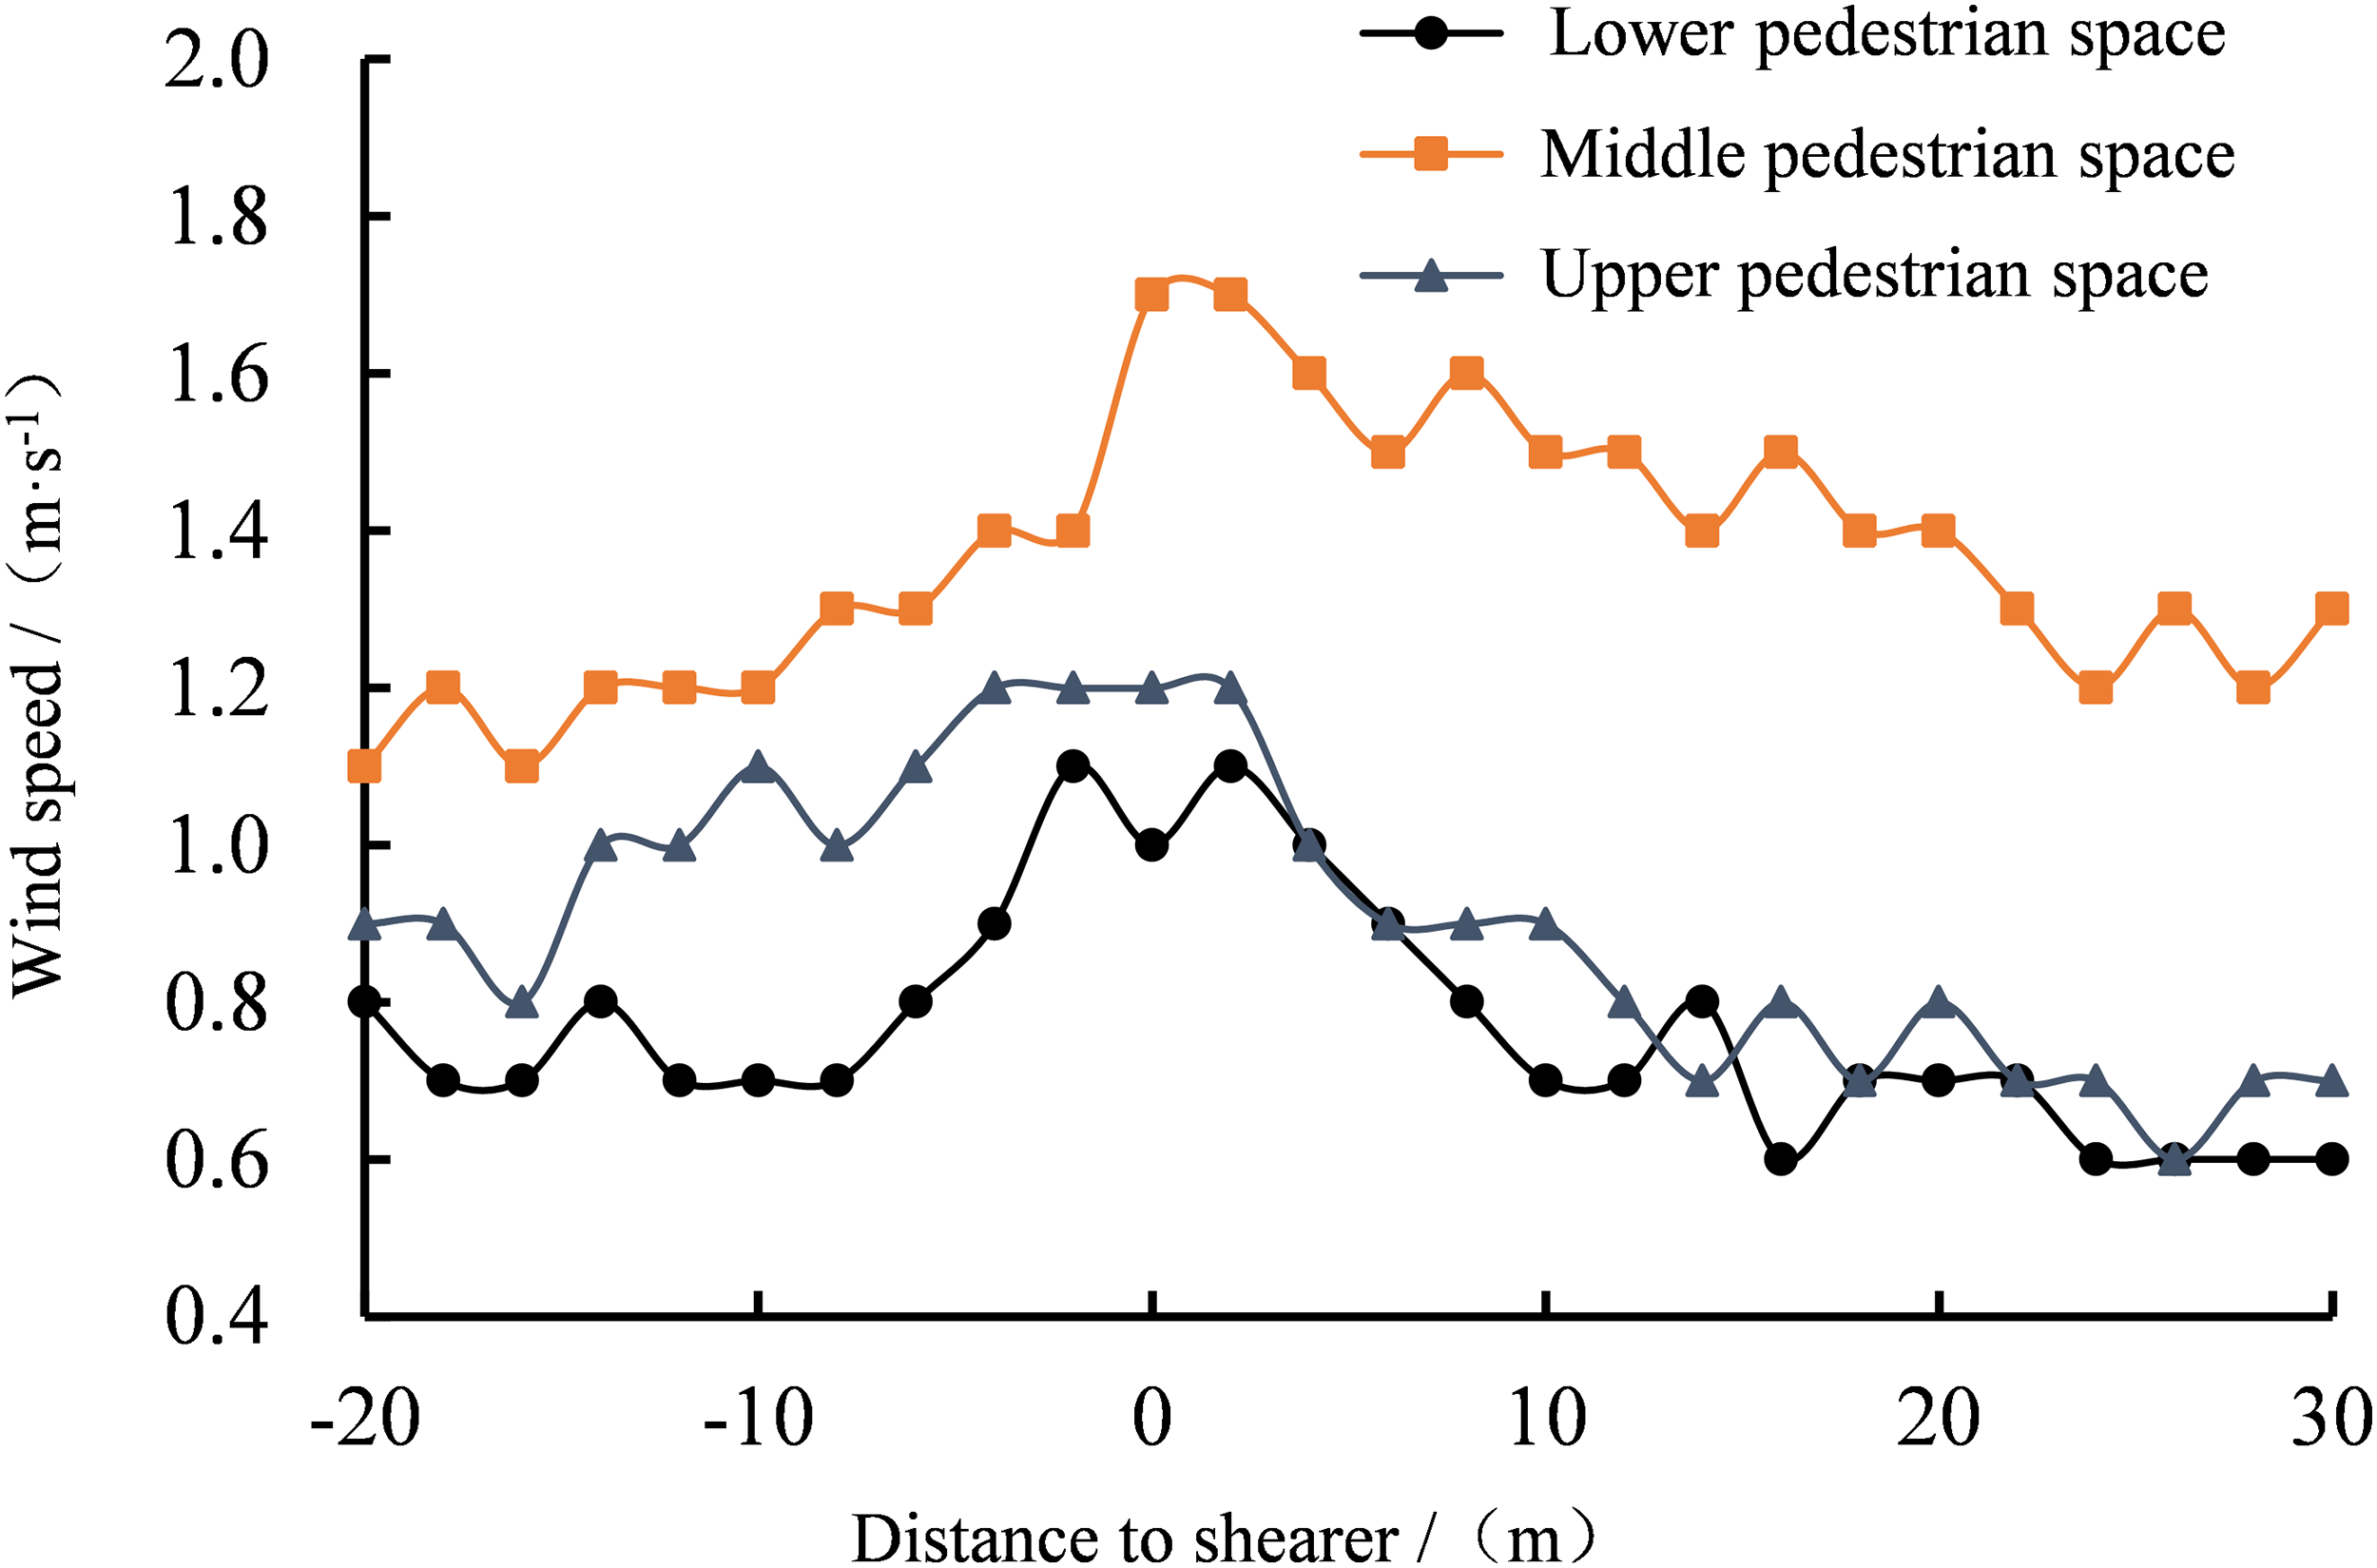
Distribution of airflow field at the working face.
It was observed from the test results that the wind speed was relatively stable in the 20 m area in front of the shearer, which was in the range of 0.7–1.1 m/s with an average of 0.9 m/s. The wind speed was the highest in the middle space and the lowest in the lower space. Approaching the shearer, the wind speed continues to increase at an average speed of 1.17 m/s and an average increase of 30%. The wind speed in the middle space was 1.7 m/s. In general, the wind speed was higher in the middle and lower at the edges, reaching a maximum at the shearer tail. As the airflow moved backward, the wind speed decreased gradually and eventually stabilized at approximately 1.2 m/s in the middle part and 0.6–0.7 m/s in the upper and lower spaces. The measured distributions were consistent with the numerical calculation results, with similar rules and absolute values. Thus, the accuracy of the numerical simulation was verified.
Distribution of respiratory dust
As shown in Figure 14, by measuring respiratory dust concentration at the height of the respiratory zone and above, the distribution of respiratory dust concentration along the airflow direction at the fully-mechanized mining face was obtained.
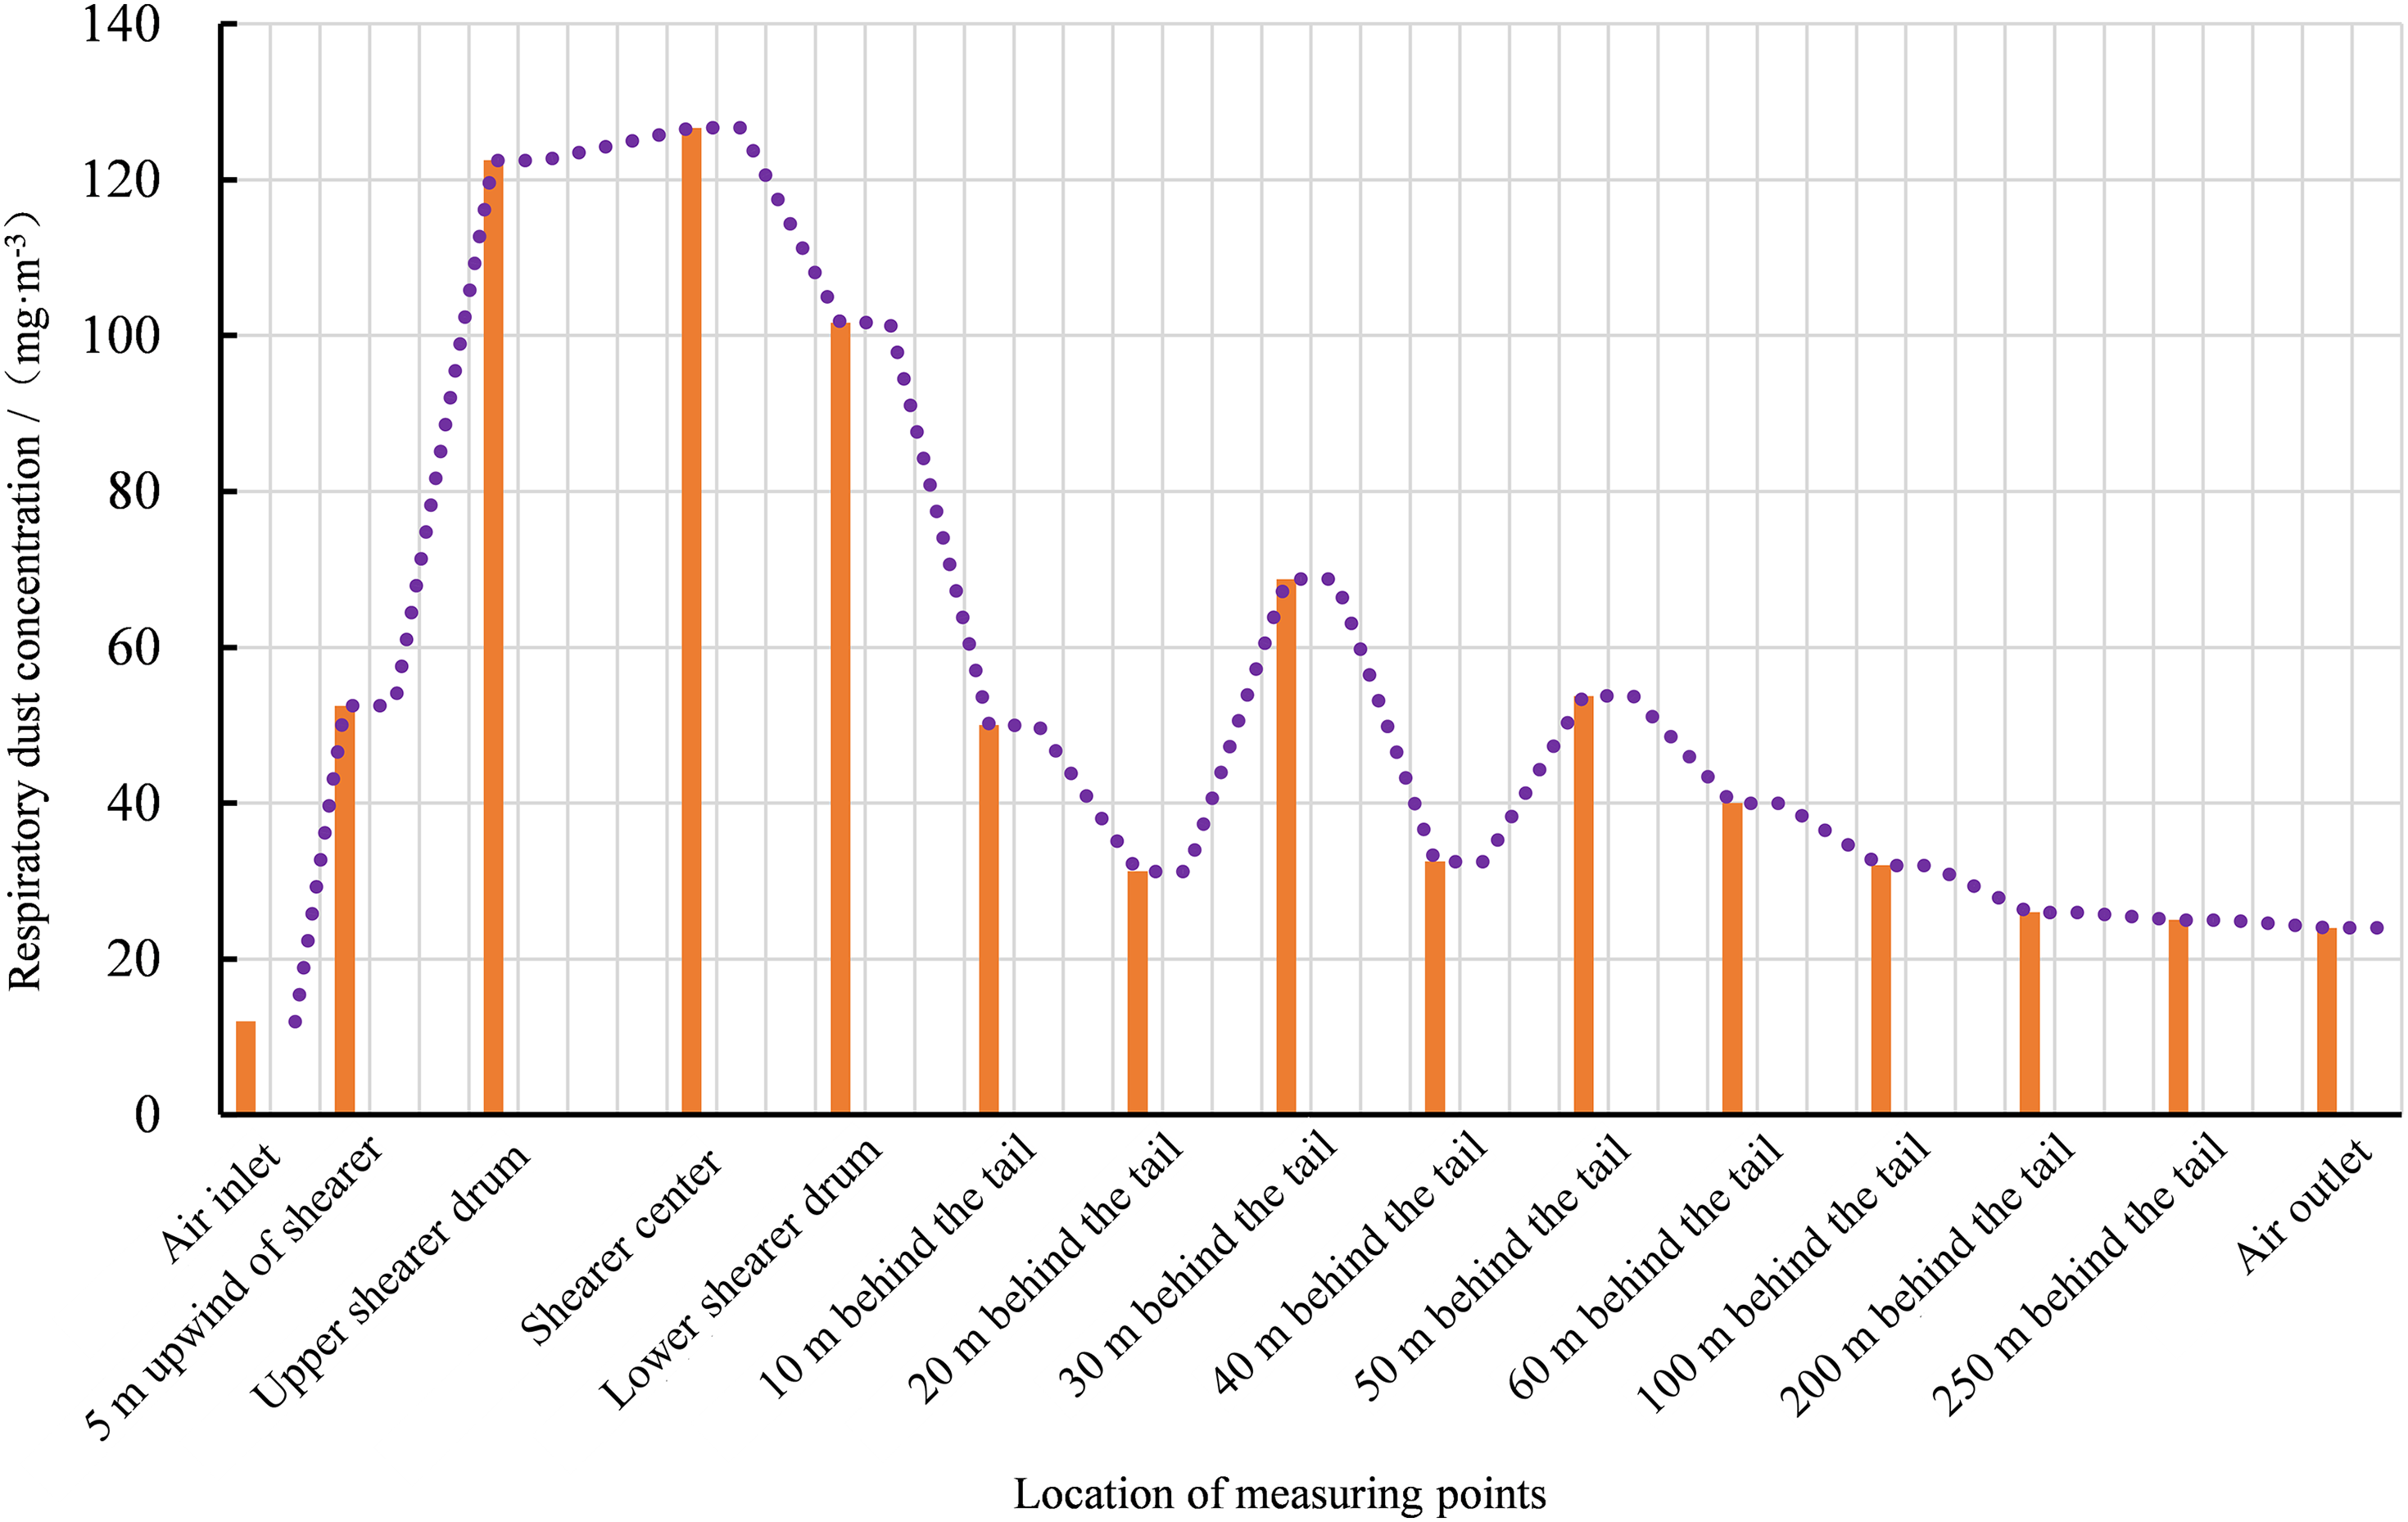
Distribution of respiratory dust concentration.
It was observed from the test that when cutting coal against the wind, at the height of the respiratory zone, the dust concentration in the pedestrian space first increased and then decreased along the airflow direction, and then increased marginally and decreased gradually. As the support successively recovered the flippers at 10 m in front of the shearer, the coal wall in front of the shearer continued to collapse under the dual effects of roof pressure and forward extrusion of the shearer, leading to a large amount of dust that diffused horizontally and vertically with the airflow. Subsequently, the generated dust converged with the dust in the inlet airflow, leading to a rapid increase of respiratory dust concentration at the upper shearer drum from 12.0 mg/m3 to 122.5 mg/m3. In the middle part of the shearer, the respiratory dust concentration further rose to 126.7 mg/m3. At the location of the lower drum, the dust concentration in the respiratory zone began to decline. At 20 m behind the tail, the dust concentration again increased with a maximum value of 68.8 mg/m3. Between 20 m and 60 m beyond the tail, the respiratory dust concentration fluctuated between 30 mg/m3 and 70 mg/m3. Further, the dust concentration declined gradually and finally stabilized at approximately 24.0 mg/m3, where the dust entered the return airflow.
Figure 15 shows the distribution of dust concentration in the space above the head of the personnel within the support. The dust concentration in the upper space on the pedestrian side exhibited the same trend as that at the height of the personnel respiratory zone, though having a certain backward deviation compared to that of the lower space. The maximum dust concentration was reported in the region from the lower shearer drum to 10 m beyond the tail. This was mainly because the respiratory dust in the upper space originated from the frame moving of the support, which reported a maximum concentration of 138.8 mg/m3. A slight increase in dust concentration occurred between 30 m and 40 m behind the tail primarily because a small amount of dust was generated when the support at the rear end of the tail completed the frame moving successively, and the position of the support was slightly adjusted by the operator. The dust concentration gradually decreased after 40 m beyond the tail, and stabilized at approximately 20.5 mg/m3, where the dust entered the return airflow.
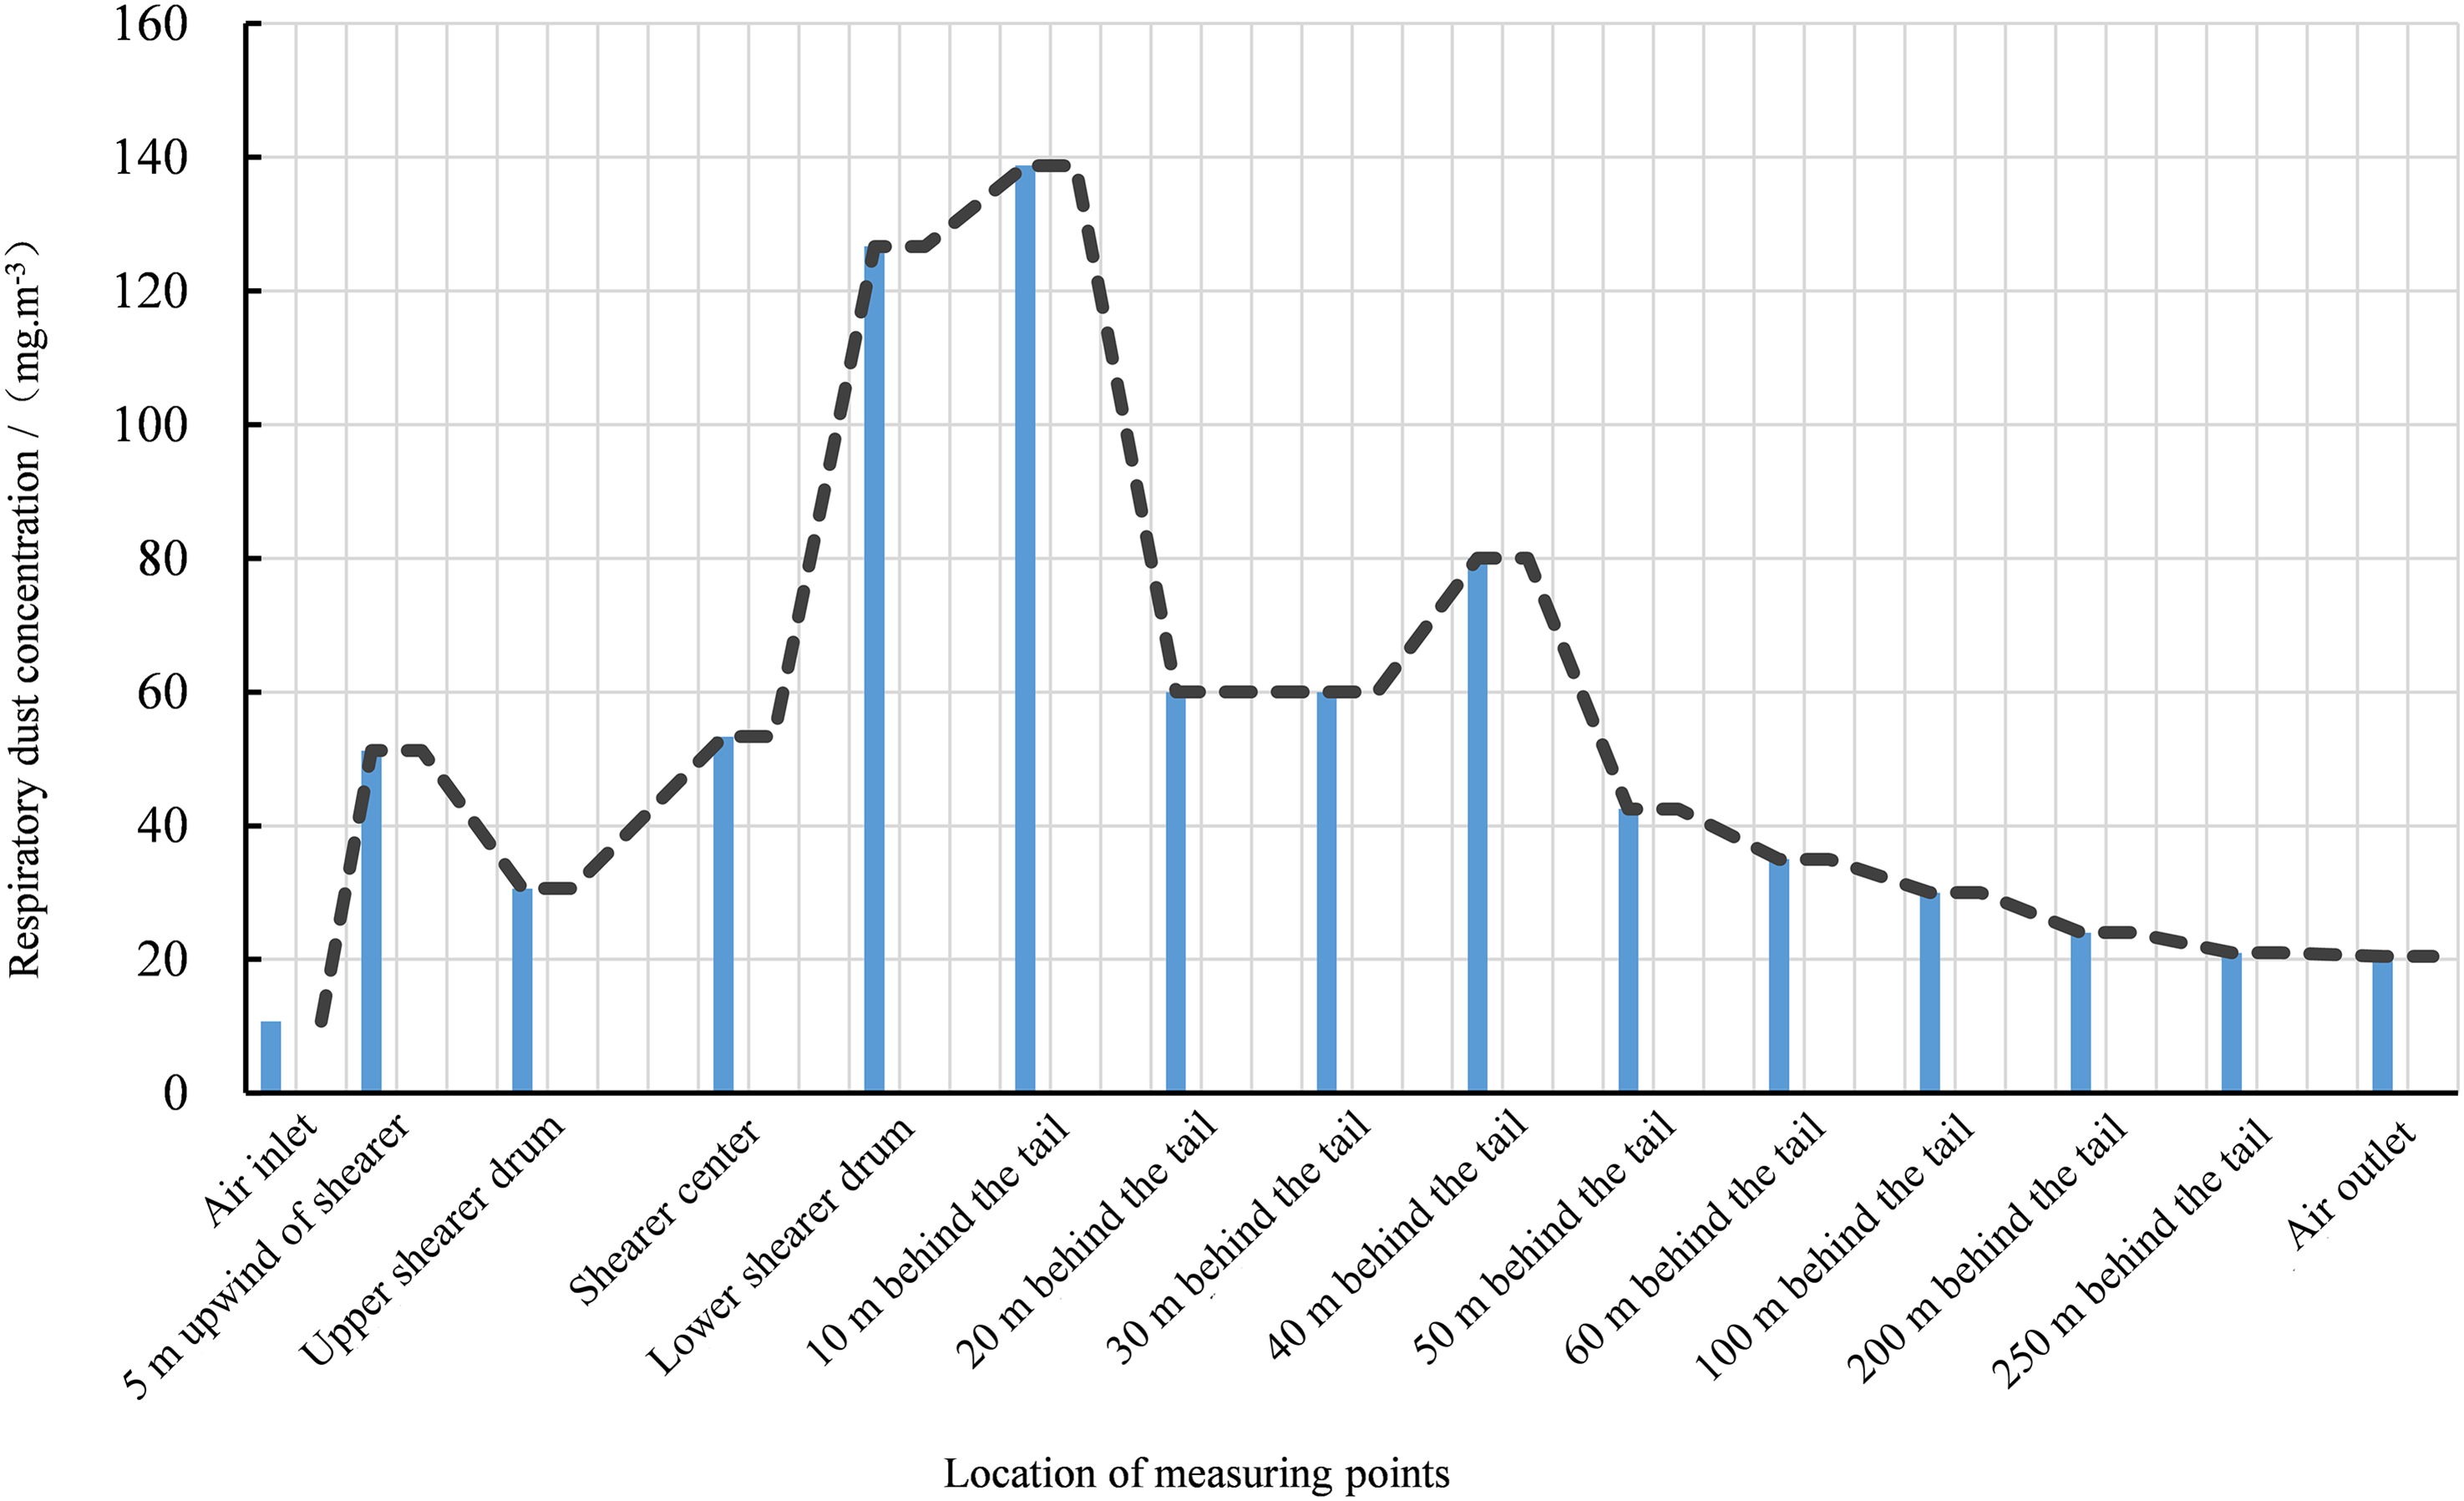
Dust concentration distribution in the upper space.
Considering the upper shearer drum as the origin, the respiratory dust concentrations from 20 m in front of the shearer to 60 m behind the tail of the shearer were fitted, establishing the relationship between the respiratory dust concentration and the spatial position, as illustrated in Figure 16.
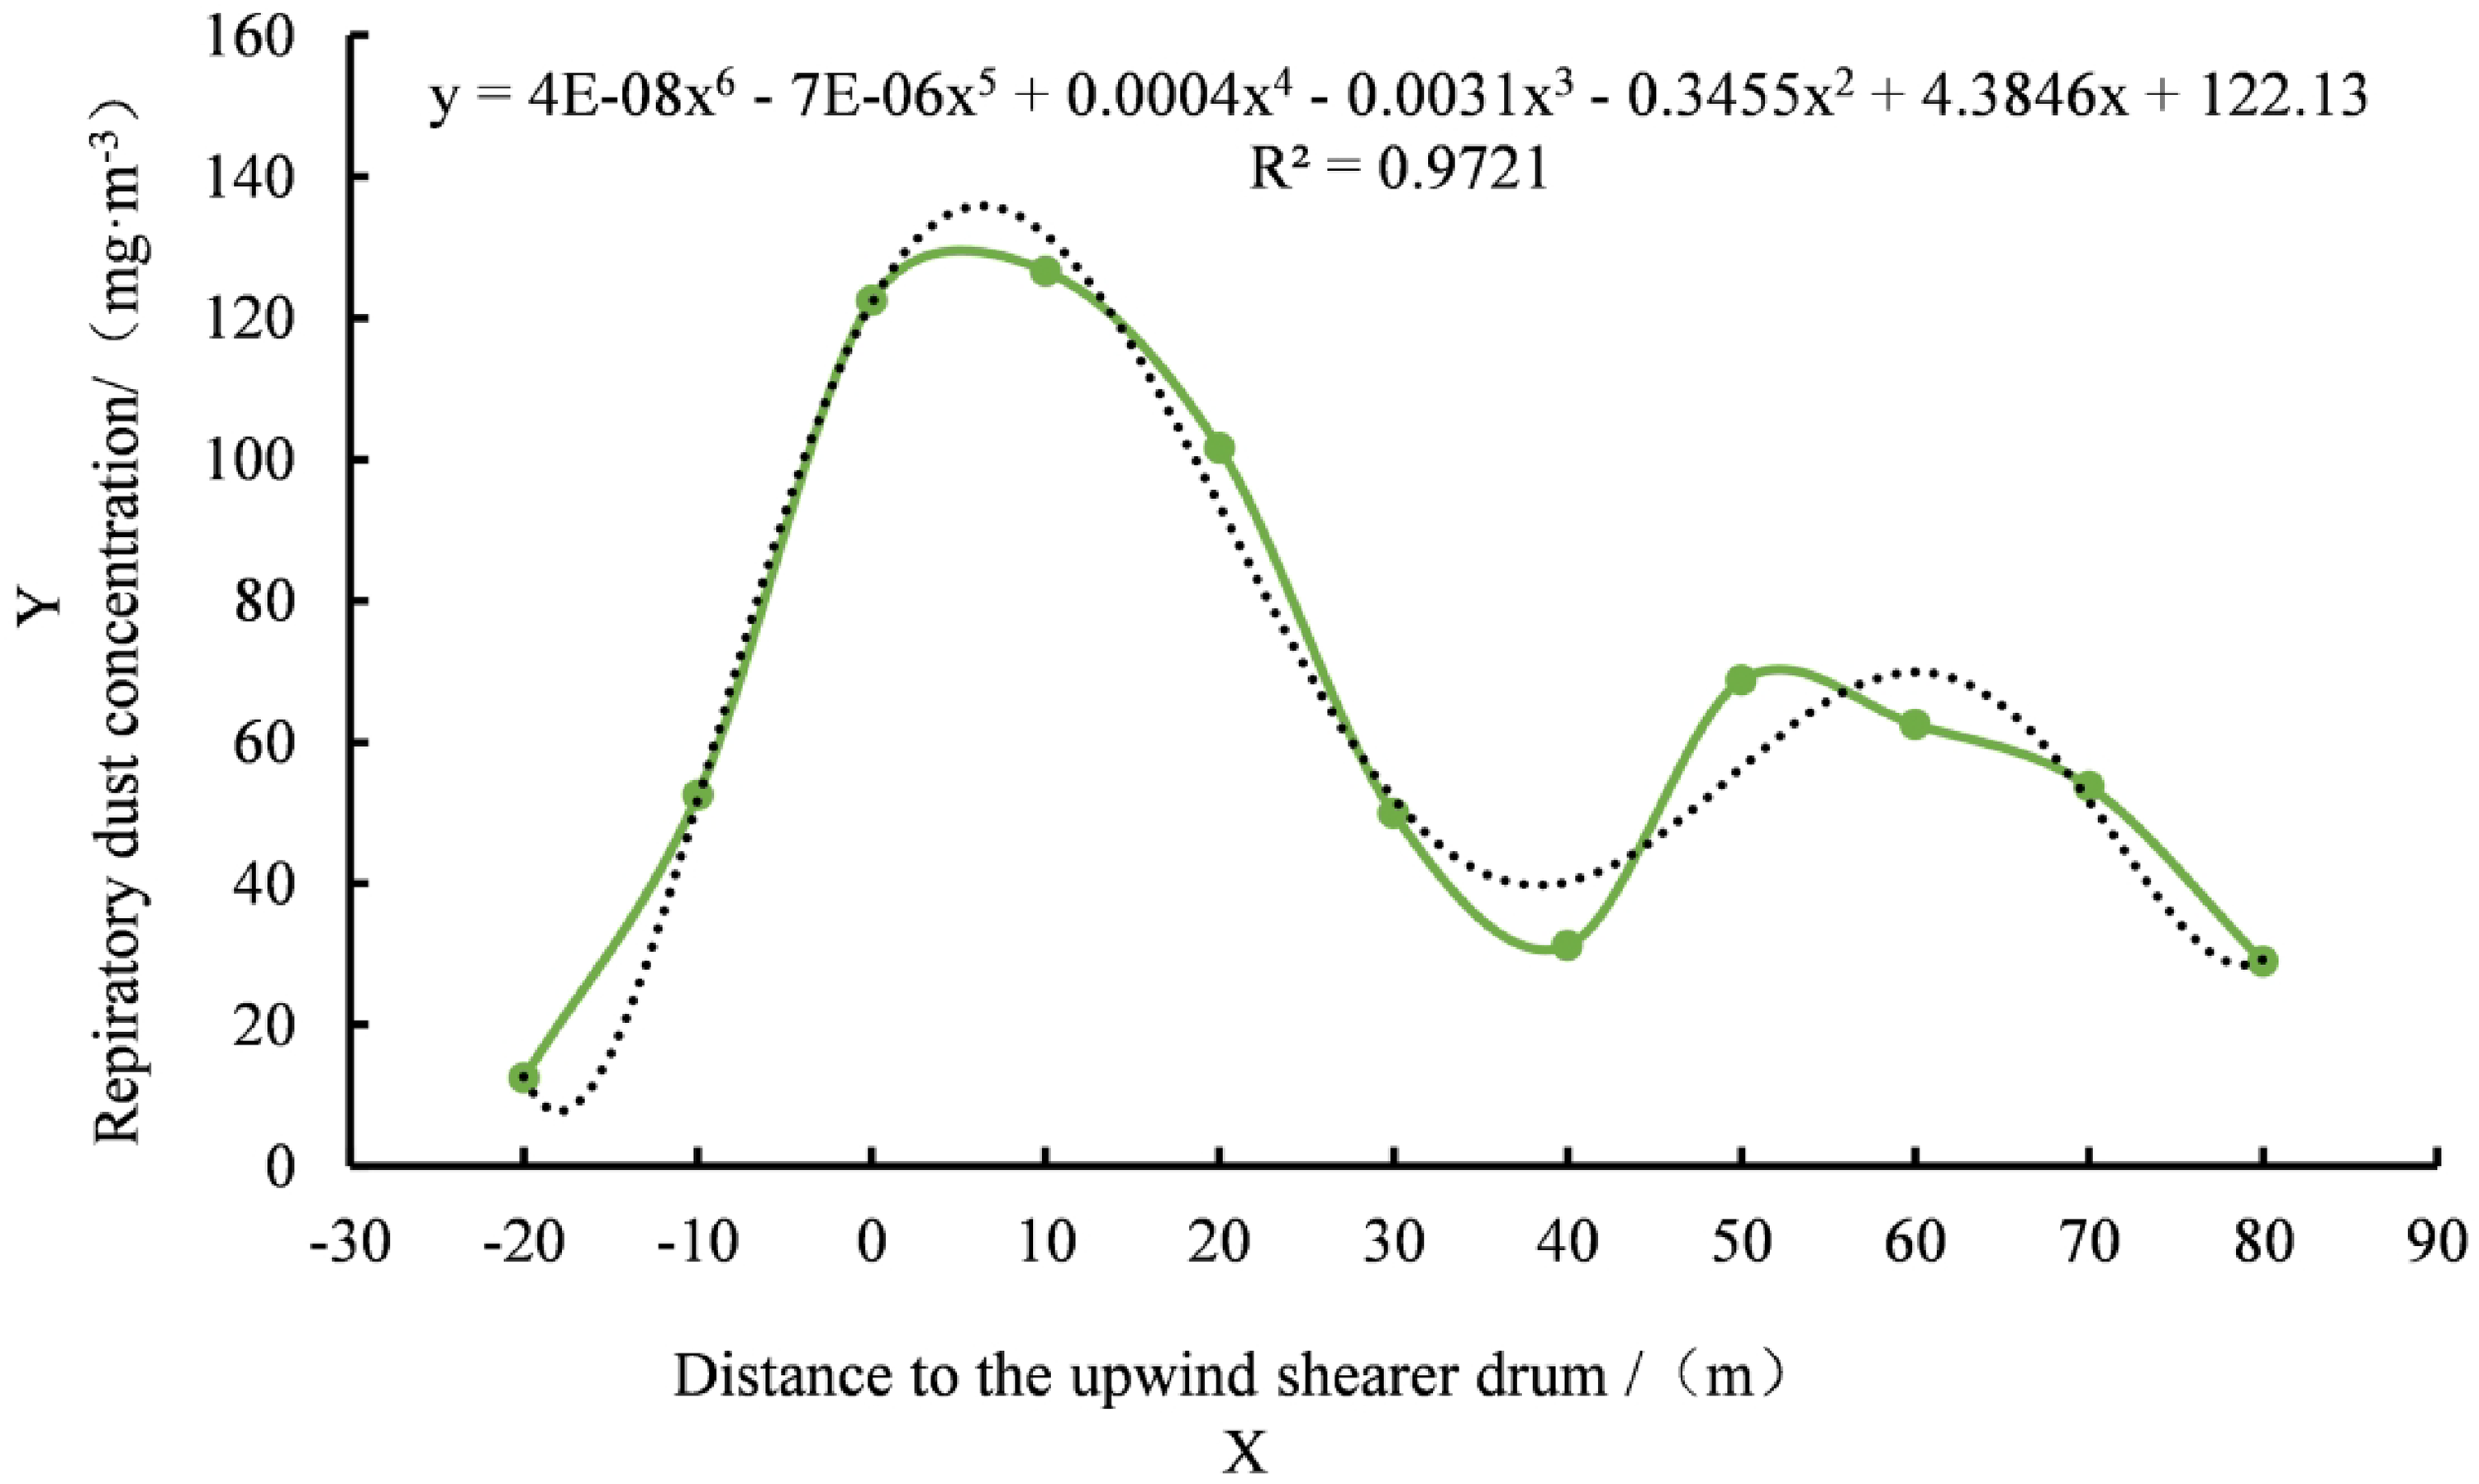
Relationship between the respiratory dust concentration at the respiratory zone height and spatial position.
The goodness of fit exceeded 0.97, suggesting a high similarity between the fitting curve and the measured curve. The comparison revealed that the trend of evolution of the measured respiratory dust concentration as a function of the spatial position at the working face was similar to that in numerical simulation, and the structural compositions of the relationship expression were also similar. However, the numerical simulation result was marginally larger in the absolute values. The principal reason was that in numerical simulation, the respiratory dust concentration at the dust source point was deduced from the average value of several measuring points on the section at a certain position. Therefore, the dust mass concentration at the dust source point was higher than the practical value.
Conclusion
In the working range from 15 m in front of the shearer and 30 m behind it, the wind speed first increased and then decreased at both the cutting side and pedestrian side, though finally declining to the average value of the working face. Within 20 m along the shearer length, the wind speed remarkably increased, and the average wind speed at the cutting side increased by approximately 70%, indicating that when the airflow at the 8-m high fully-mechanized mining face was blocked by obstacles, it mostly underwent longitudinal diffusion with supplementary transverse diffusion.
The respiratory dust concentration along the airflow direction in the pedestrian space demonstrated a tendency of increase-decreases-slight increase-gradual decrease. However, the dust concentration increased with the increase of height, the migration distance of dust particles was directly proportional to time, and the smaller dust particles were prone to transverse diffusion. Within 20–30 m at the downwind side of the shearer, the transverse diffusion of coal cutting dust converged with the dust produced by support coal falling, leading to a small increase in dust concentration, the support coal falling dust is the main dust pollution source in pedestrian space.
It can be observed from the field measurement that when cutting coal against the wind, at the height of the respiratory zone in the pedestrian space, The dust concentration increased to 126.7 mg/m3 in the middle part of the shearer and gradually decreased further. At 20 m behind the tail of the shearer, the dust concentration increased again, with a local maximum of 68.8 mg/m3. The respiratory dust concentration fluctuated between 20 m and 60 m behind the tail and continued to decline gradually afterward. Consequently, the dust stabilized with a concentration of approximately 24.0 mg/m3 and entered the return airflow. This trend was similar to that in numerical simulation, and obtained the relationship of spatial evolutions of respiratory dust, through fitting analysis. These results furnished the basic theoretical data for similar working faces and could offer support for the targeted dust control.
Footnotes
Declaration of conflicting interests
The author(s) declared no potential conflicts of interest with respect to the research, authorship, and/or publication of this article.
Funding
The author(s) disclosed receipt of the following financial support for the research, authorship, and/or publication of this article: This work was supported by the National Key R&D Program of China, (grant number 2017YFC0805201).