
Abstract
The vibration signal of the planetary gear train is easily disturbed by the background noise, so the measured signal is complicated. In order to accurately extract the fault features, the resonance method has been widely used. However, even if the optimal resonance frequency band is found, the in-band noise still exists, so it is necessary to study an effective in-band denoising method. In this paper, an in-band denoising method based on Iterative Singular Value Decomposition (ISVD) is proposed for the fault diagnosis of the secondary sun gear of a planetary gear train, combined with the envelope order spectrum analysis. This method uses the enhanced Wavelet Packet Transform Spectral Kurtosis (WPTSK) to determine the best frequency band for the signal, and uses the ISVD method to realize the signal denoising. It sets a threshold to avoid the destruction of the useful information caused by the excessive iteration, and uses the relationship between the singular values and frequency components to reconstruct the denoised signal. Finally, the signal is converted to the fault characteristic order domain by resampling to identify the fault type of the sun gear from the envelope order spectrum. The simulation and experimental results show that compared with the Empirical Mode Decomposition (EMD) and Variational Mode Decomposition (VMD), the ISVD can effectively suppress the in-band noise and more accurately extract the fault characteristic order of the secondary sun gear under varying speed.
Keywords
Introduction
The planetary gear train is a common transmission type in industry with a large reduction ratio. As an important mechanical element, once the gear suffers a fault, it will lead to an abnormal operation of the entire machine, potentially causing the serious damage and great losses. Especially for a complex multi-stage planetary gear drive train, when a gear has a serious fault in whole or in part, the meshing surfaces of the faulty and normal teeth will generate a series of shock due to the contact, and these shocks contain the rich information about the working state of the gear pair. Therefore, accurately extracting the fault features from the tested signals to implement the fault diagnosis is crucial. 1 However, when the gear in the planetary gear train runs under the varying speed state, the conventional spectrum analysis method will result in a fuzzy spectrum and the fault characteristics cannot be clearly observed. Meantime, the background noise will seriously mask the fault information, especially when the sensor is not installed near the faulty gear. 1 Therefore, to effectively extract the fault features from the measured signals at varying speed has attracted much attention. 2
In recent years, many methods have been proposed to solve the above problem. Wang et al. proposed a method to address the interference in gear trains for the fault diagnosis of rolling bearings, which includes the adaptive gear interference elimination, fault detection based on the characteristic order, and fault identification by the rotating order side band. 3 Zhou et al. studied a method of the short-time angle resampling and ridge enhancement to estimate the instantaneous rotation frequency of large speed-change gear system, and enhanced the target ridge by the angle resampling and merging the ridges of several gear meshing harmonics to improve the estimation accuracy. 4 Nguyen et al. developed a gearbox fault diagnosis model based on the adaptive noise reduction and stacked sparse automatic encoder, which achieved an ideal fault diagnosis. 5 Syed et al. demonstrated the potency of discrete wavelet analysis for fault diagnosis of a planetary gearbox using Artificial Neural Network (ANN) and Support Vector Machine (SVM). 6 Syed et al. also compared the classification abilities of the Fuzzy classifier and ANN for the fault detection in a planetary gearbox using the histogram features. 7 Among them, the called Resonance Demodulated Technique (RDT) is widely used for the vibration signal feature extraction, but how to determine the optimal demodulation frequency band is still a challenge.8,9 To solve this issue, Zhao et al. put forward the Spectral Kurtosis (SK), which has been proved to be an effective index. 10 Inspired by it, Antoni proposed the Fast Kurtogram (FK) based on the Short-time Fourier Transform (STFT). 11 Later, many methods were proposed to improve the accuracy of fast SK diagram in identifying the sensitive frequency bands. 12 Lei et al. found that Wavelet Packet Transform (WPT) can generate more accurate filters than STFT, so the WPT was used to construct a fast SK diagram, and the transients hidden in the noise can be filtered. 13 Although the optimal frequency band is effectively extracted, only the noise outside the selected band is removed, but the in-band noise containing the frequency is not eliminated. If the noise intensity is high, it is still a challenge to extract fault features from the filtered non-stationary signals. Therefore, it is necessary to further process the filtered signals.
At present, some in-band denoising methods have been proposed. Wang et al. proposed a mixed signal processing method based on the spectral subtraction denoising and empirical wavelet transform to extract the sideband features of the gear. 14 Wang et al. introduced the kurtosis demodulation of energy spectrum and improved the Signal-to-Noise Ratio (SNR) by the maximum kurtosis deconvolution filter. 15 The denoising method based on the Singular Value Decomposition (SVD) tends to highlight the high energy components in the measured signal, so it is faster and easier to implement than the others. 16 The effectiveness of signal denoising based on the SVD is influenced by two factors. 17 The first is the matrix structure to be analyzed. Typically, the measured signal as a time series needs to be reshaped into a matrix. The second is the selection of singular value to reconstruct the signal. The introduction of difference spectrum and selection algorithm based on the correlation coefficient can solve the above. 18 However, due to the speed change, the frequency spectrum of the filtered signal is blurred, which makes it more difficult to extract the effective singular values. 19 In order to extract the fault features, the time-domain signals can be resampled in the angle domain, and then the influence of speed change can be eliminated by the order tracking method. 20 Thus, for the SVD-based denoising methods, it's crucial to correctly construct the signal matrix and select the effective singular values.
Given the above, this work proposes an in-band denoising method based on the SK of Iterative SVD (ISVD) with the enhanced WPT and the relationship between singular values and frequency components. Using WPT, the optimal frequency band is determined, followed by signal reconstruction using the maximum SK node. Subsequently, ISVD reduces the in-band noise and enhances the transient fault-induced component. Finally, after resampling the reconstructed signal and converting it to the order domain, the Fault Characteristic Order (FCO) is identified from the envelope order spectrum.
Overall idea of proposed method
The schematic diagram of this work is shown in Figure 1. Firstly, the vibration and speed of a planetary gear train are collected by an accelerometer and a tachometer. Secondly, the original signal is processed by the high-pass filtering to remove the low-frequency components. Then, the Wavelet Packet Transform Spectral Kurtosis (WPTSK) is used to determine the best frequency band of the signal. Meantime, the ISVD is used to improve the SNR of the signal. Next, the reconstructed signal is resampled and converted to the order domain. In this way, the fault of the sun gear in the planetary gear train is identified by the envelope order spectrum. Finally, the upper envelope and amplitude difference of the envelope order spectrum are used to prove the effectiveness of the proposed method. The research scheme diagram for ISVD-based in-band denoising approach for planetary gear train.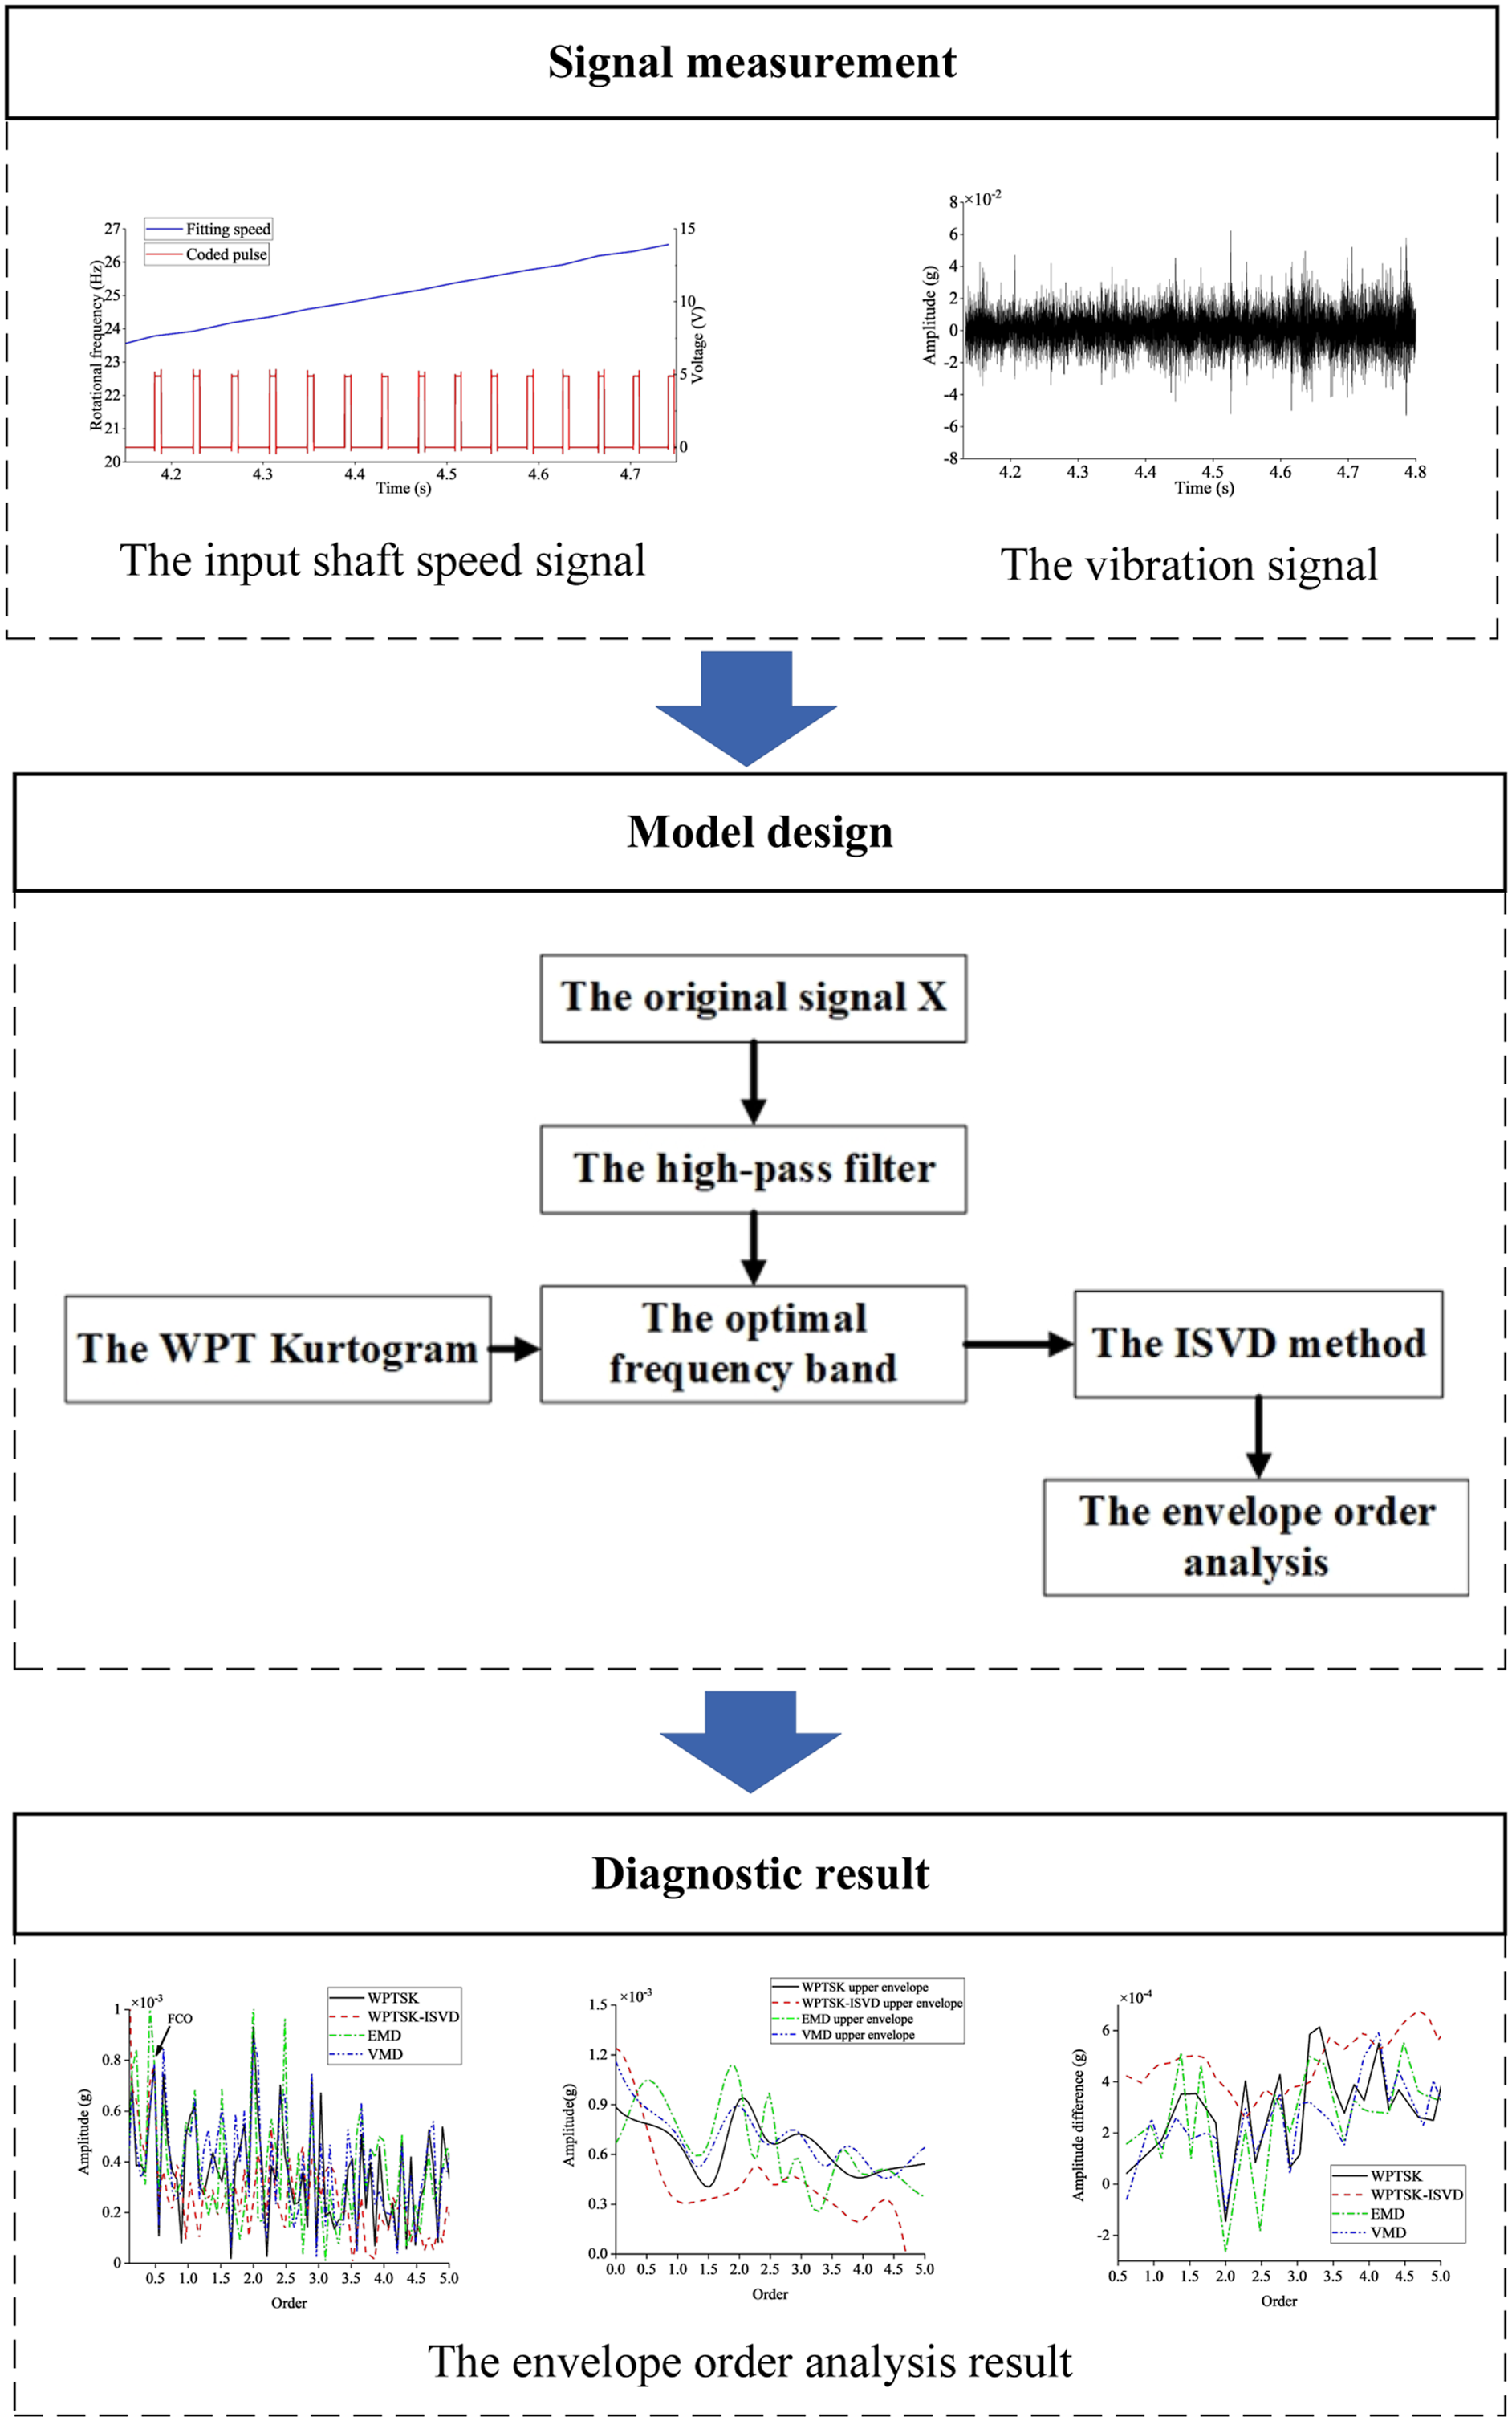
Wavelet packet transform kurtogram
The fault of the sun gear in a planetary gear system often leads to a series of shock, which triggers the resonance and its modulation. Therefore, the resonance frequency band contains a lot of valuable information. Considering the high-precision filtering of WPT can accurately match the fault features in the noisy signals, this work uses the WPT to analyze the fault features.
The WPT is a kind of generalized orthogonal wavelet transform, which not only decomposes low-frequency components, but also processes high-frequency components, and obtains the detailed information in the whole frequency band.
21
The calculation of WPT is
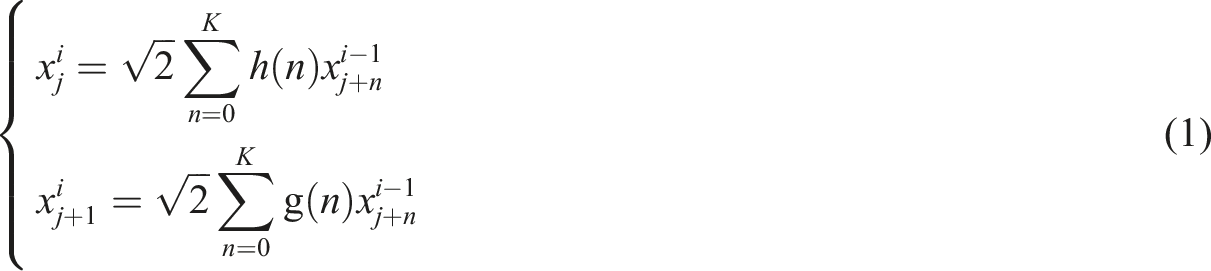
In the WPT, the recursive decomposition signal is represented by a binary tree, that is, the wavelet packet tree, in which each node represents the frequency band with the original length. However, the order of frequency bands in the wavelet packet tree is out of order. In order to facilitate the analysis, the nodes are sorted from low to high frequencies. When extracting the time-domain signal generated by wavelet packet nodes, the SK is used to determine the best frequency band. For each reconstructed signal, the SK is
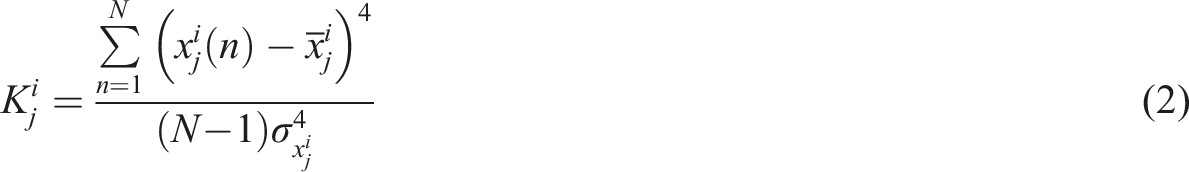

Select the node with the largest kurtosis, and then the corresponding frequency band is the best.
ISVD-based in-band denoising
The Rule of singular values distribution
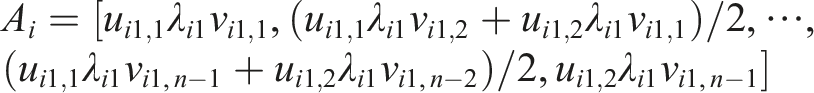
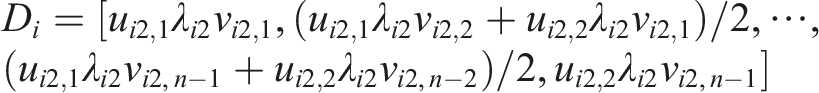
The SVD has been proven to be effective for the signal denoising. For a signal with multiple frequency components, SVD produces two adjacent non-zero singular values. For an array Y(t) of length N, if it contains only one frequency component, then its SVD is

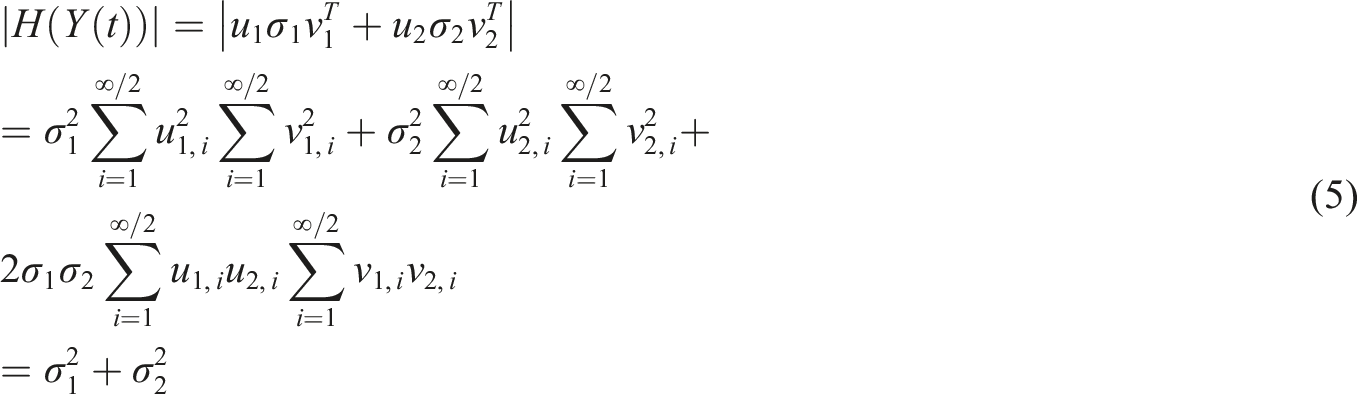
Therefore, the squares sum of the singular values is proportional to the energy of the corresponding instantaneous frequency. By analyzing the energy of the different components sorted in descending order, the singular values of each component are determined. For example, the singular values of the i-th component are (I) The signal contains the finite frequency components of (II) The energy of each frequency component is different, that is, (III) The signal is long enough, that is,
When the speed continues to increase, the signal frequency changes with the time, that is, the number of instantaneous frequency components increases with the increase of signal length, so the above conditions I and III cannot be met at the same time. In addition, the amplitude of white noise conforms to the normal distribution, and the frequency energy is uniformly distributed. However, in practice, due to the limited signal length, the white noise does not always have the statistical characteristics, and the condition II cannot be guaranteed to be true at all times. Therefore, the SVD of signal matrix in the time domain cannot accurately extract the fault features under the varying speed state.
The ISVD method
According to the above, it can be seen that the signal frequency component changes with the time under the variable speeds. Therefore, the analysis of signals with the same resolution cannot get the effective results. When the effective low-frequency components are modulated, the fault information will be lost due to the loss of detailed components. 22 This work proposes the ISVD method to solve this issue.
Construct a new Hankel matrix H(X
i
) from the signal

Taking
Perform the same operation on
It should be noted that the impulse response is highly concentrated in the low-frequency range, so it has the better aggregation. In order to realize the signal processing, it is necessary to use a high-pass filter to eliminate the DC component, and the cutoff frequency of the filter is higher than the minimum rotation frequency. Then the Hankel matrix is constructed by the filtered signal, and the SVD is performed on it to obtain two singular values, the first is greater than the second. Each singular value and corresponding vector are used to reconstruct the signal, that is, two component signals are obtained. Calculate the Root Mean Square Error (RMSE) between the reconstructed signal corresponding to the larger singular value and the original signal. If the RMSE is lower than the threshold, replace the original signal with the reconstructed, and repeat the above until the RMSE is lower than the threshold. In order to improve the analysis efficiency, the correlation between the different reconstructed components is calculated, and the components with the Cross-correlation Coefficient (CCC) higher than the threshold are put together. When the RMSE between the adjacent envelopes meets the conditions, the SK of each reconstructed signal in the last layer is calculated, and the original signal is replaced by that with the largest SK.
The summary of proposed method
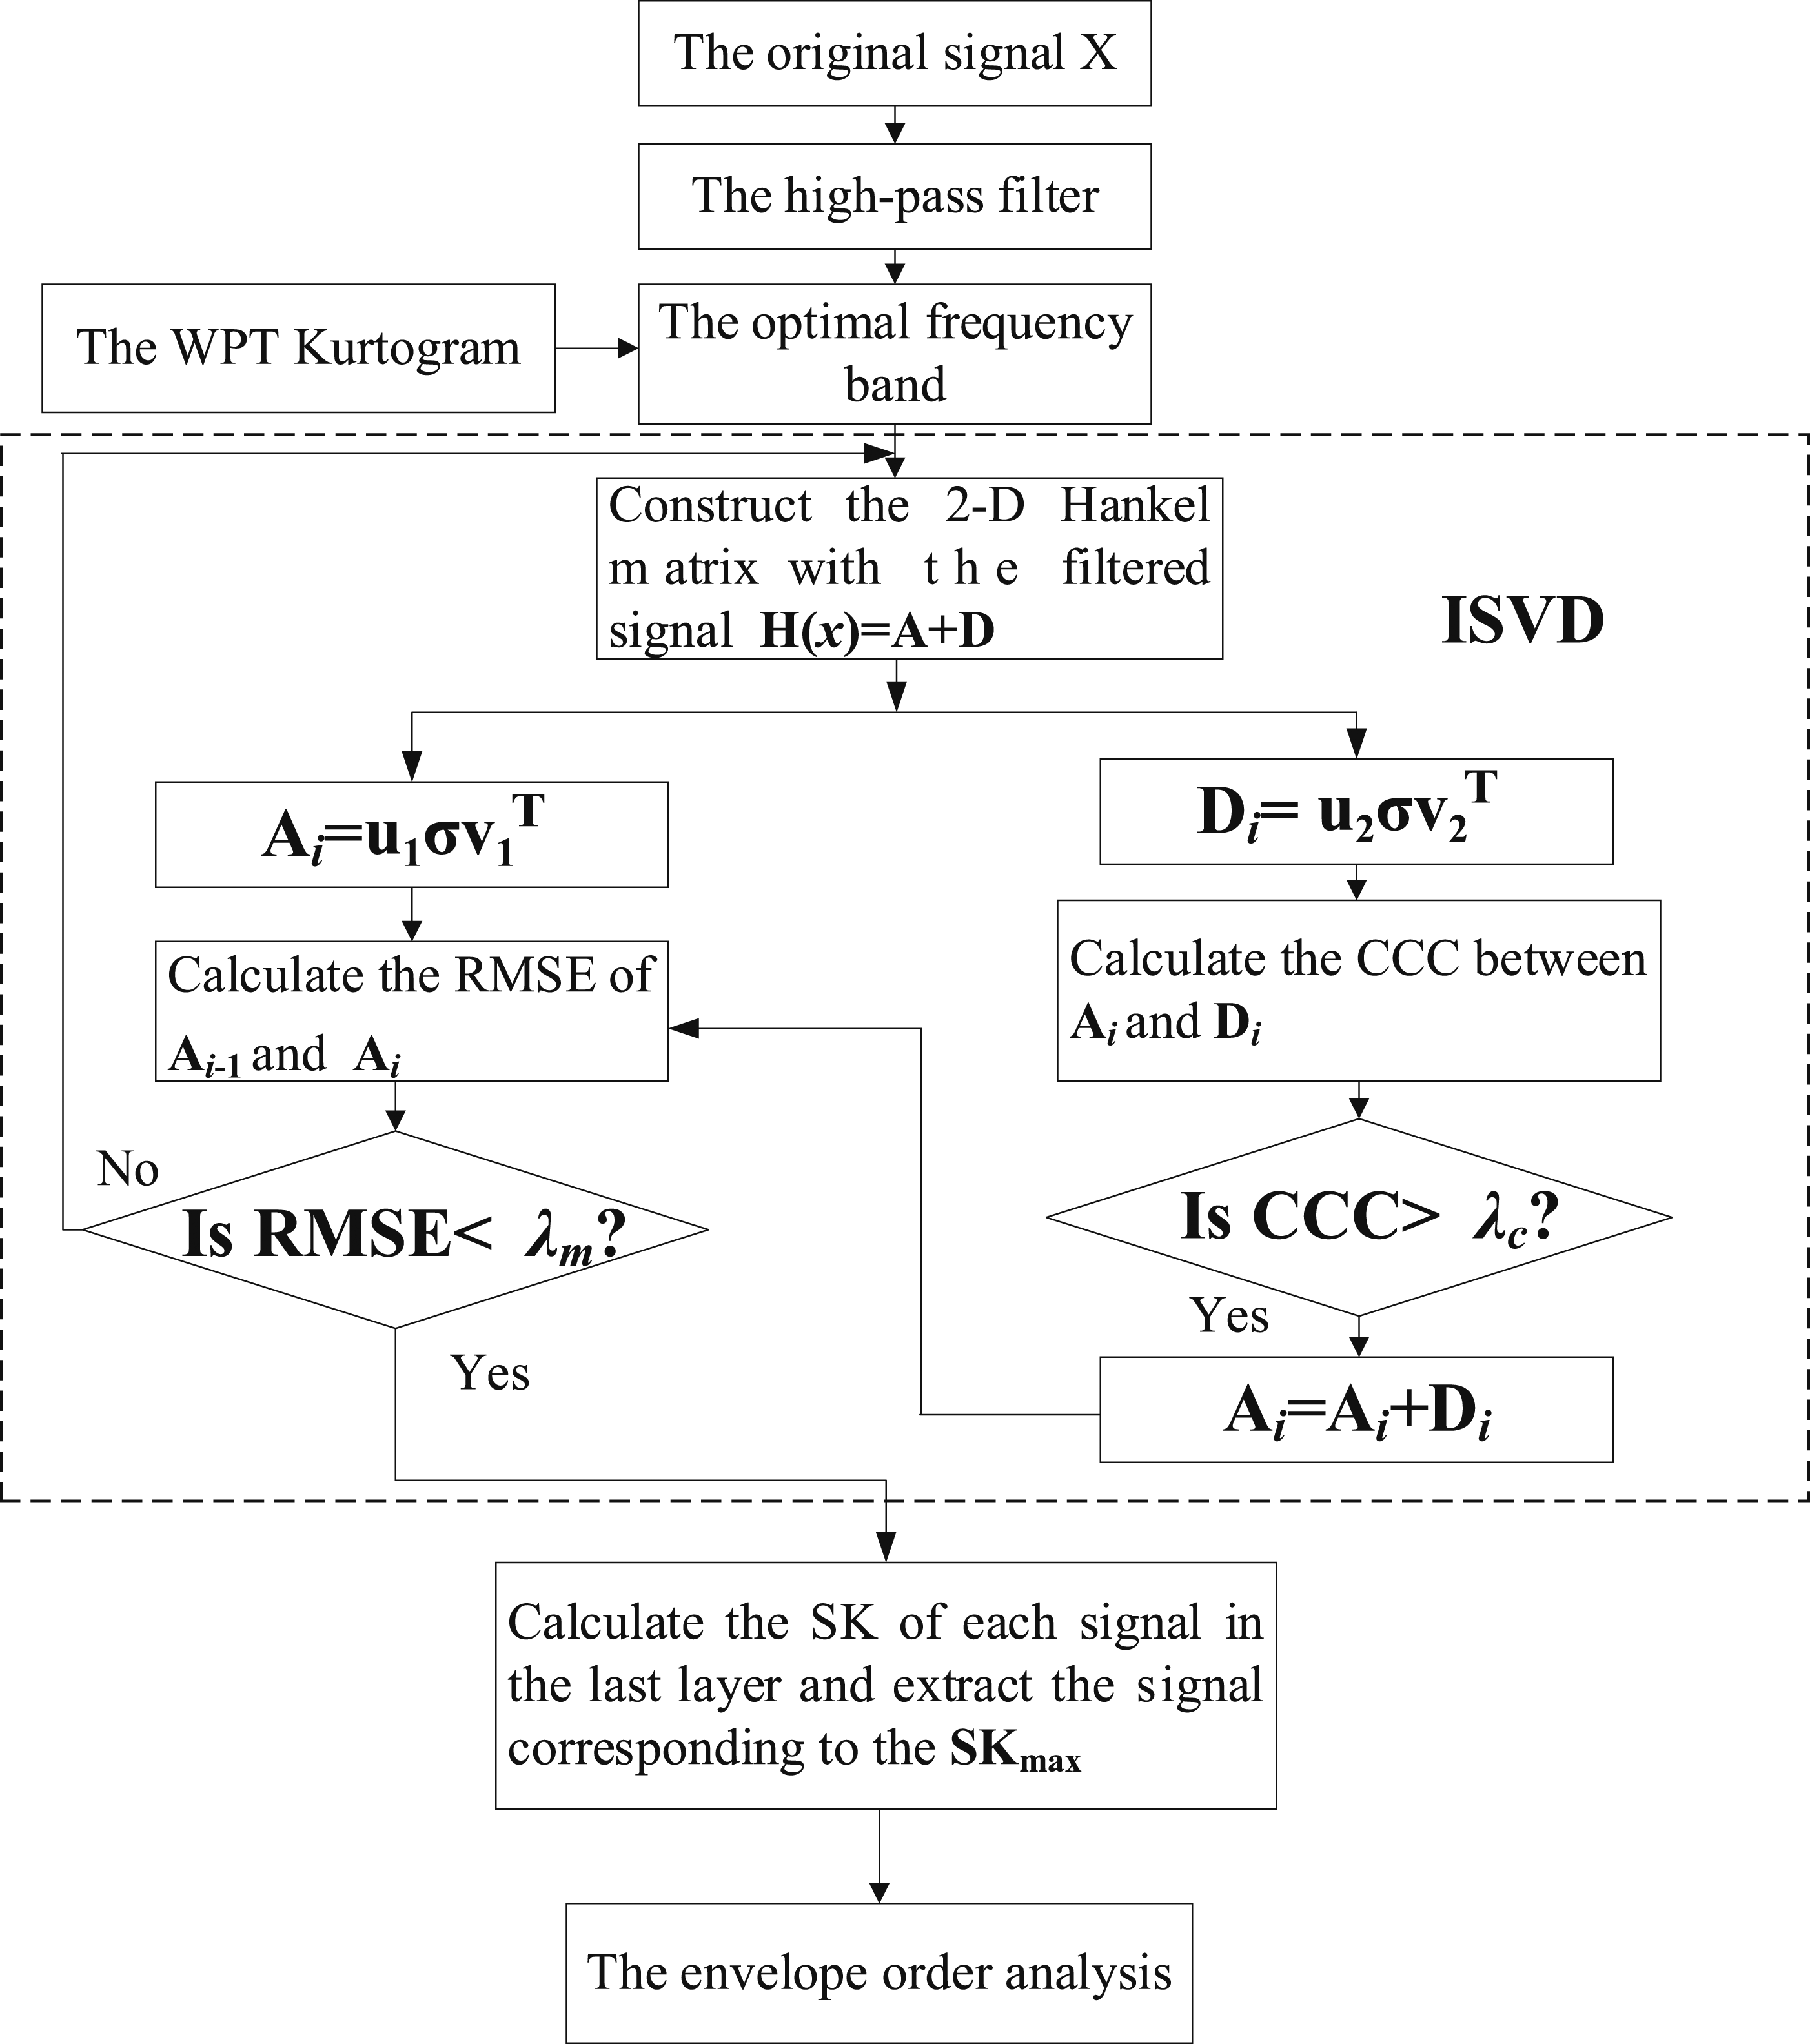
The flow chart of the method proposed in this work is shown in Figure 2, as follows. (I) Extract the sensitive frequency band from the original signal X with the WPT, and reconstruct the signal with the wavelet packet coefficient corresponding to the maximum kurtosis of the envelope spectrum; (II) A high-pass filter is used, and the cutoff frequency is lower than the minimum value of the rotation frequency to eliminate the DC component; (III) Construct 2-D Hankel matrix with the filtered signal; (IV) Carry out the signal reconstruction with different singular values for each part, and calculate CCC; If CCC is greater than λ
c
, add these parts; (V) Calculate the RMSE between the adjacent layers by using the first envelope signal; If RMSE is greater than λ
m
, return Step II; Otherwise, continue to execute; (VI) Calculate the SK of each component of the last layer and replace the original signal with the signal corresponding to the maximum SK; (VII) Resample the reconstructed signal to the angle domain and convert it to the fault characteristic order domain. The schematic diagram of the proposed method.
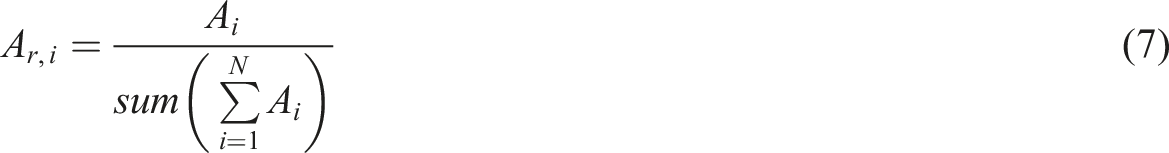
Use the following formula to calculate the relative envelope order spectrum
Use the following formula to calculate the amplitude difference

Simulation analysis
When the sun gear of a planetary gear train is damaged locally, there are the steady frequency modulation signals with the meshing frequency as carrier frequency and rotation frequency and its frequency multiplication as modulation frequencies, and there are also the periodic impact amplitude modulation signals. According to the signal characteristics, the following simulated signal is constructed
23
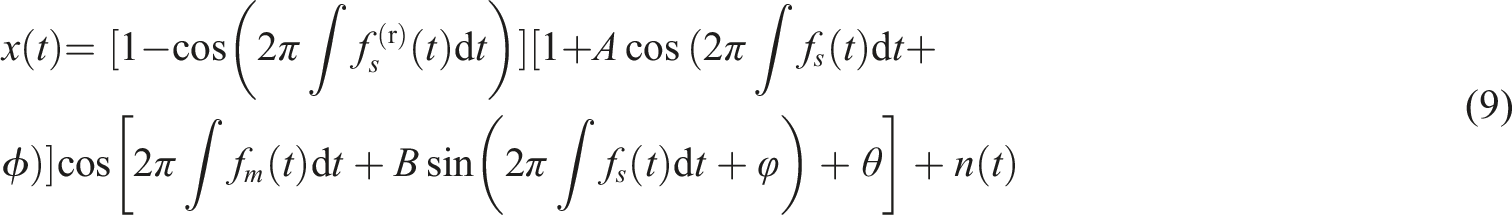
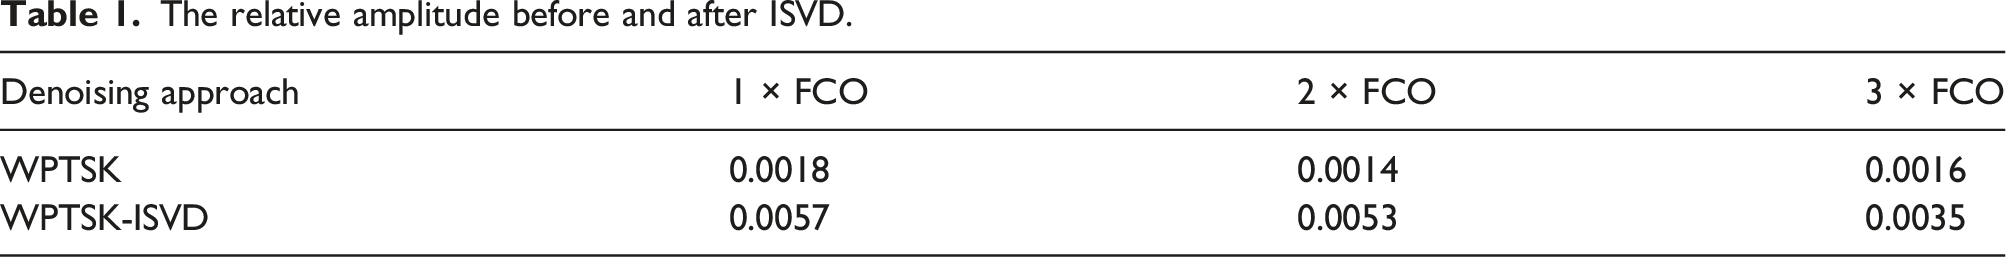
Let A = 0.6, B = 0.05, The simulated signal and its analysis results: (a) time-domain waveform, (b) frequency-domain spectrum, (c) envelope order spectrum before ISVD, and (d) envelope order spectrum after ISVD. The relative amplitude before and after ISVD.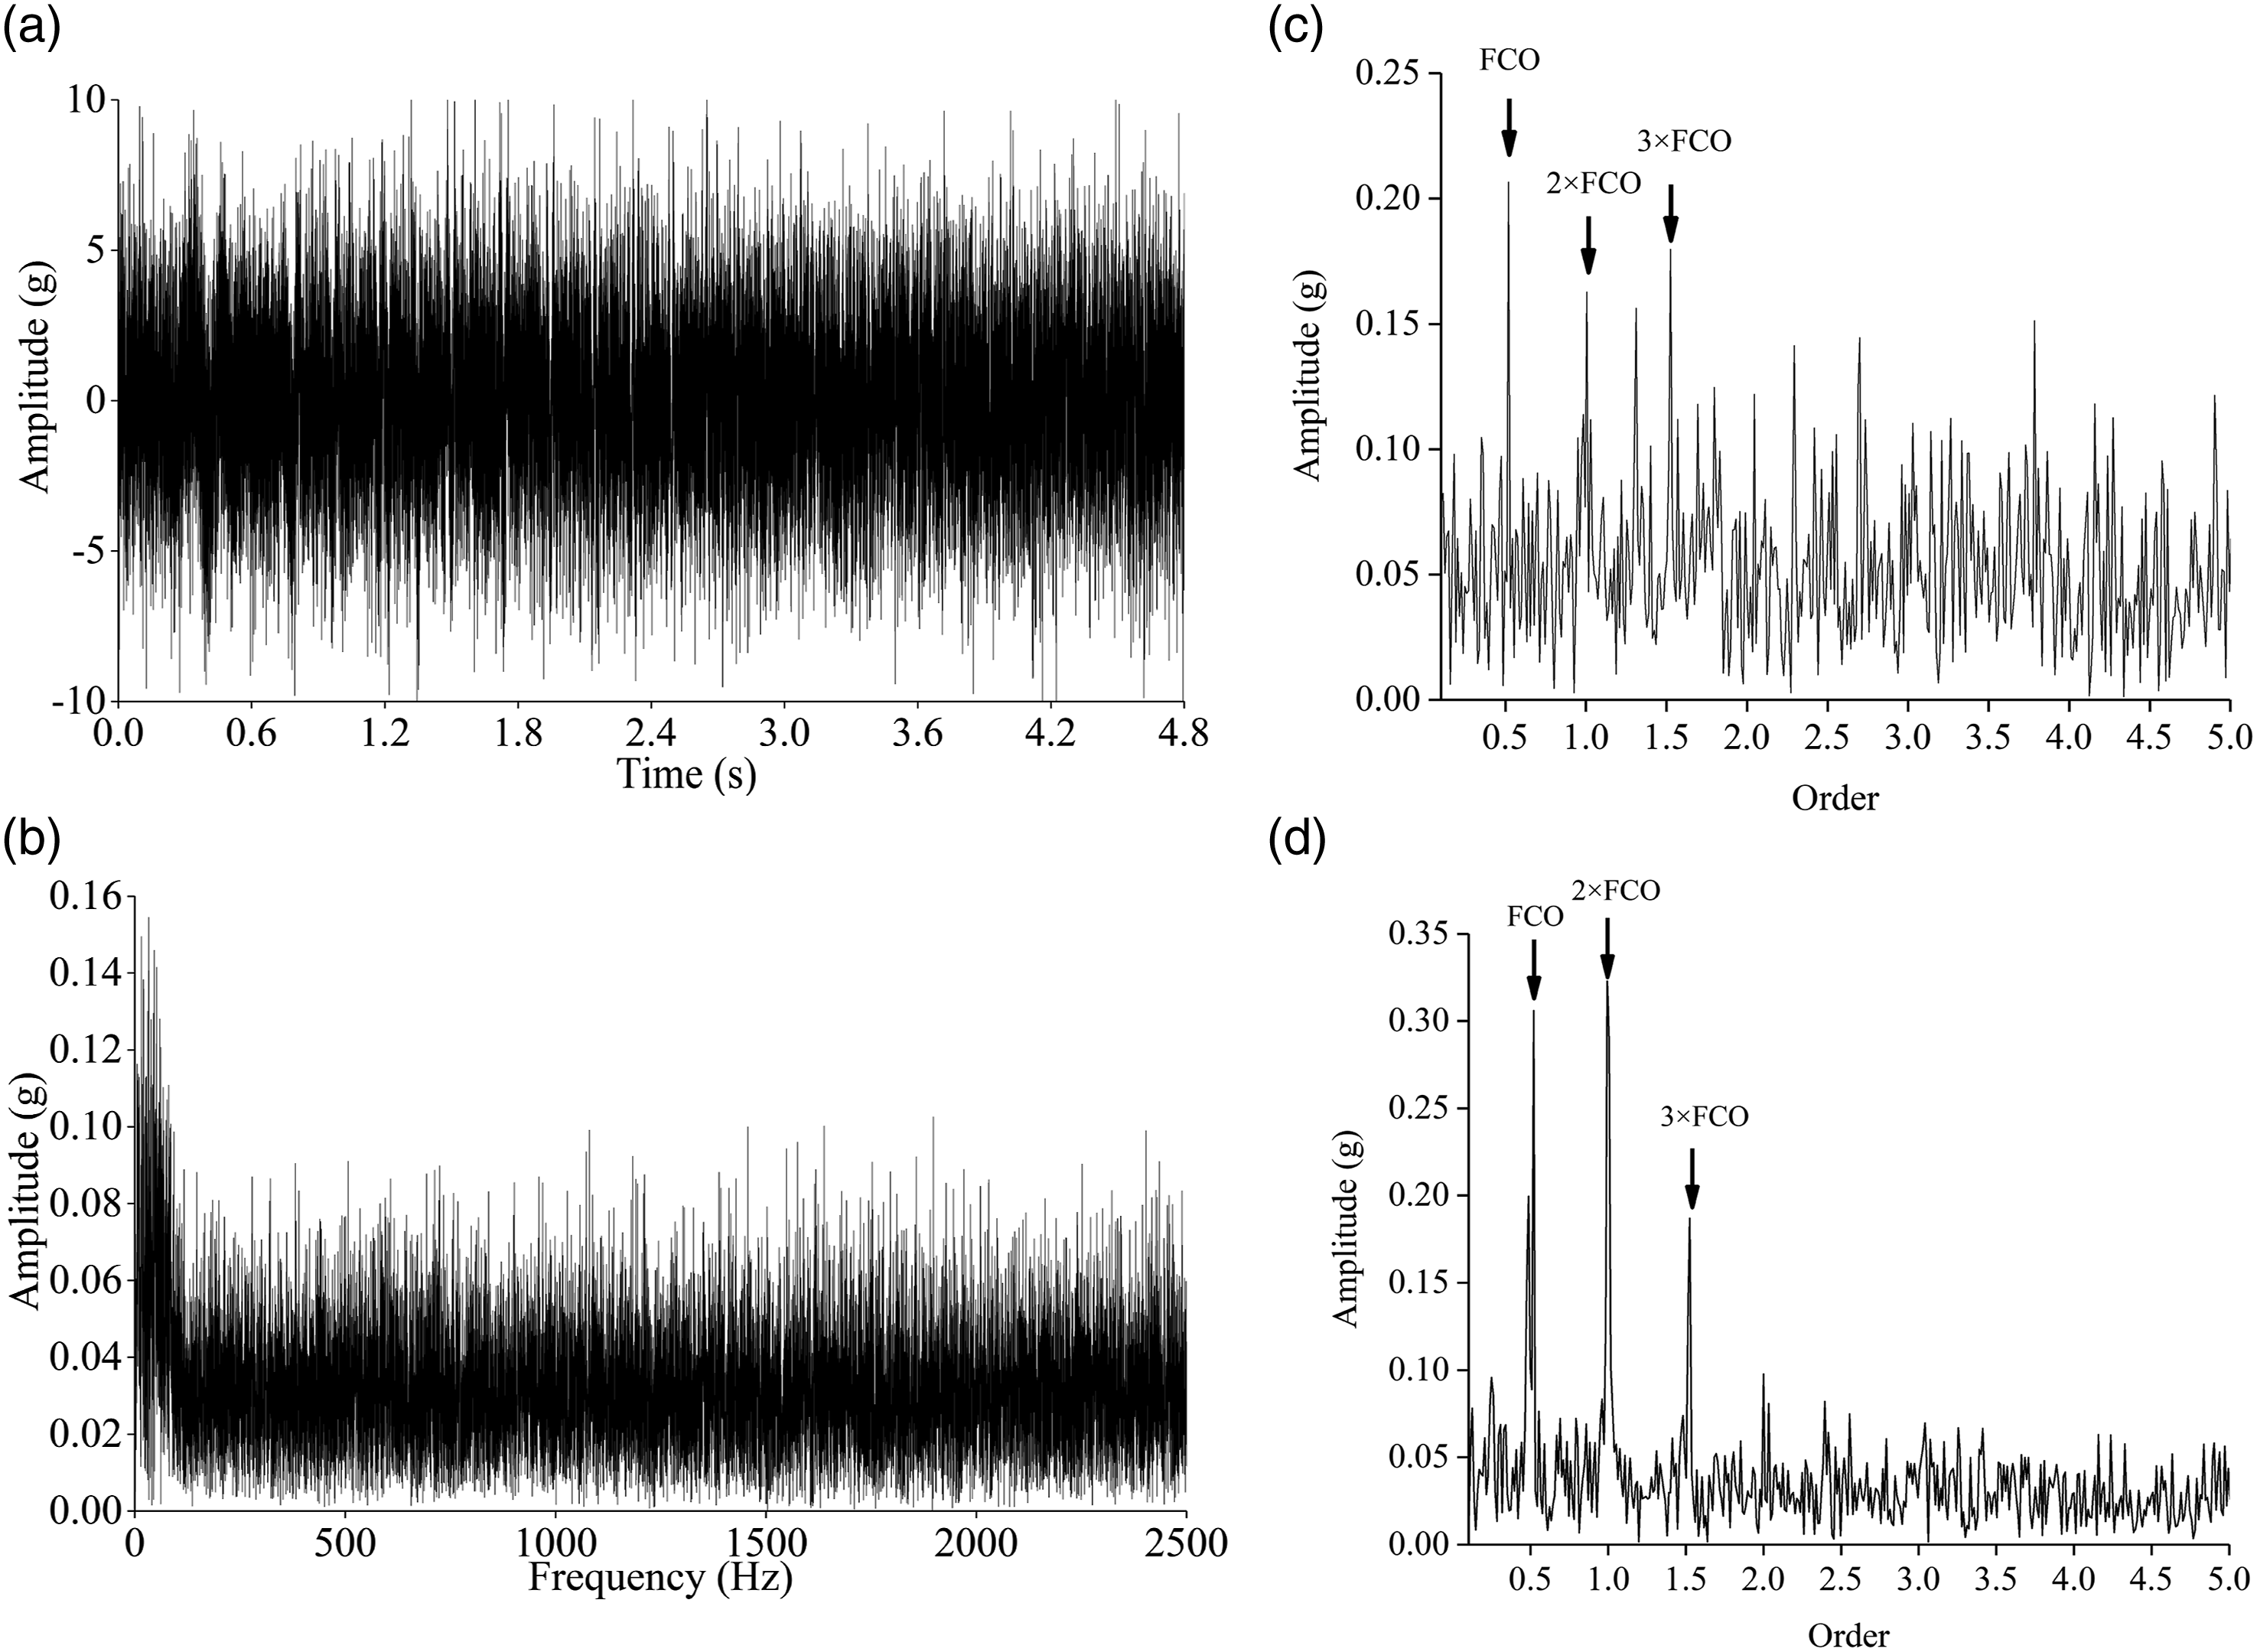
Experimental verification
Test platform and parameters
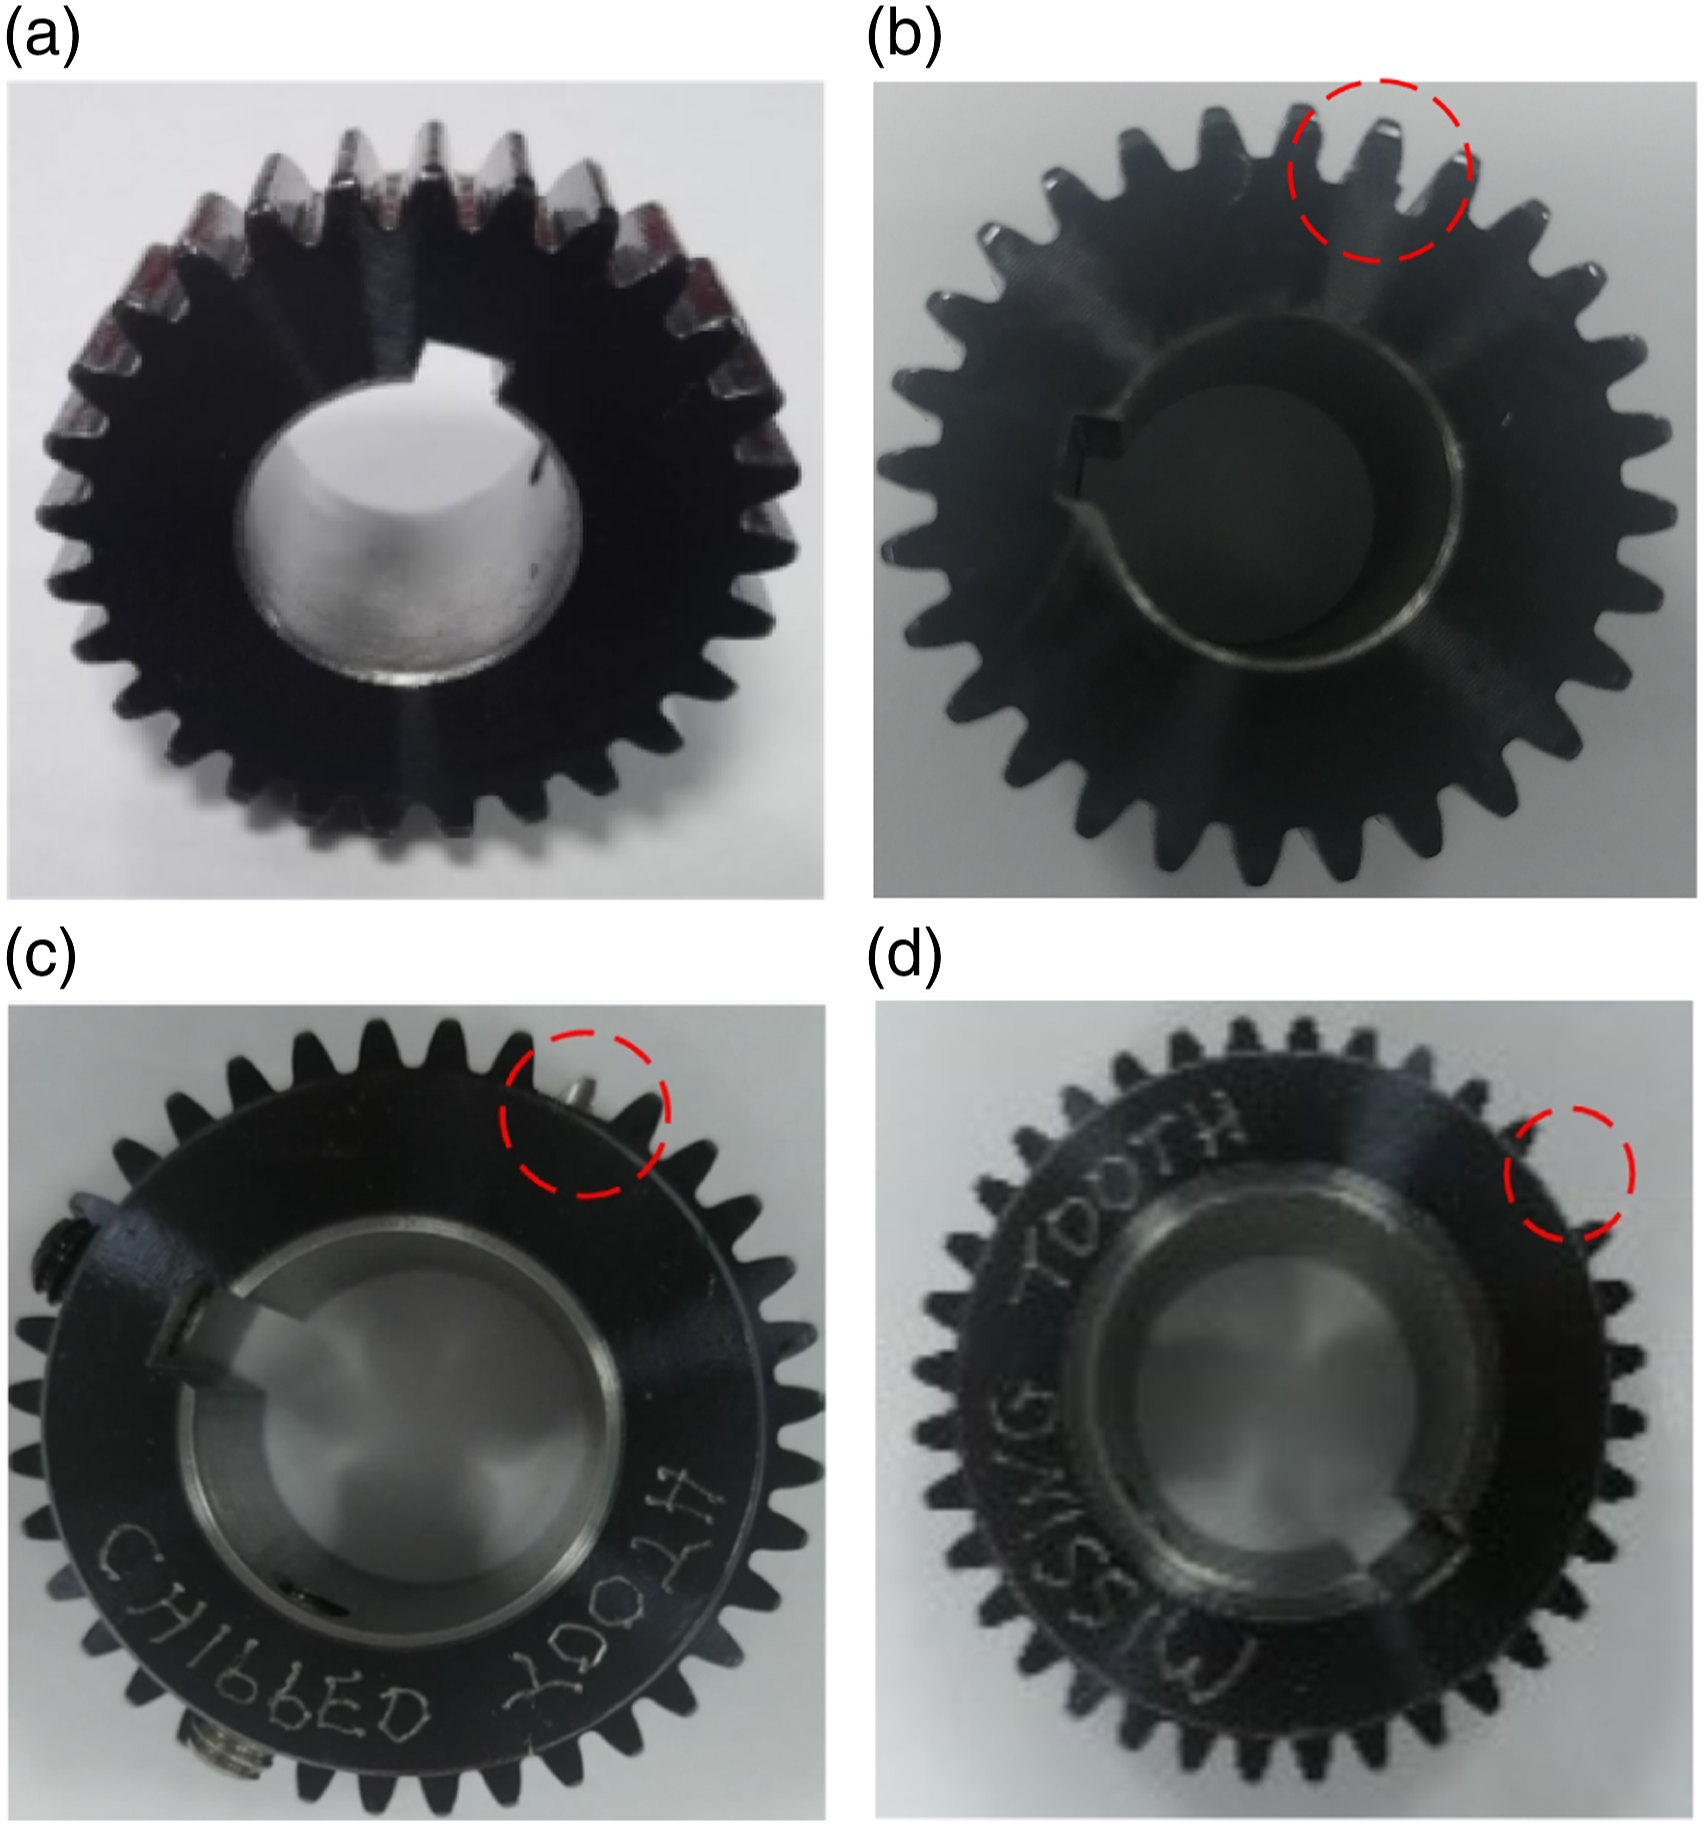
In this work, the signals are collected from a planetary gear train. The test platform is shown in Figure 4, and its schematic diagram is shown in Figure 4(a). The platform consists of a motor, a frequency converter, a planetary gearbox, a parallel shaft gearbox, and a magnetic brake, as shown in Figure 4(b). An accelerometer is placed on the housing of the planetary gearbox, and its sensitivity is 0.089 mv/g. A tachometer is used to collect the rotational speed of motor. The internal structure of the planetary gearbox is shown in Figure 4(c). The primary planetary train includes a sun gear, three planetary gears, and a gear ring, and the secondary includes a sun gear, four planetary gears, and a gear ring. Because the meshing frequency of the secondary is smaller and closer to the output, the signal is weaker. The selected faulty gear is the secondary sun gear, which artificially creates different degrees of fault, including normal tooth, tooth root crack, local broken tooth, and entire broken tooth, as shown in Figure 5. The fault simulation platform of a planetary gear train: (a) schematic diagram of transmission system, (b) overall layout of device, and (c) internal structure of secondary planetary train. The gears to be tested with different fault degrees: (a) normal tooth, (b) tooth root crack, (c) local broken tooth, and (d) entire broken tooth.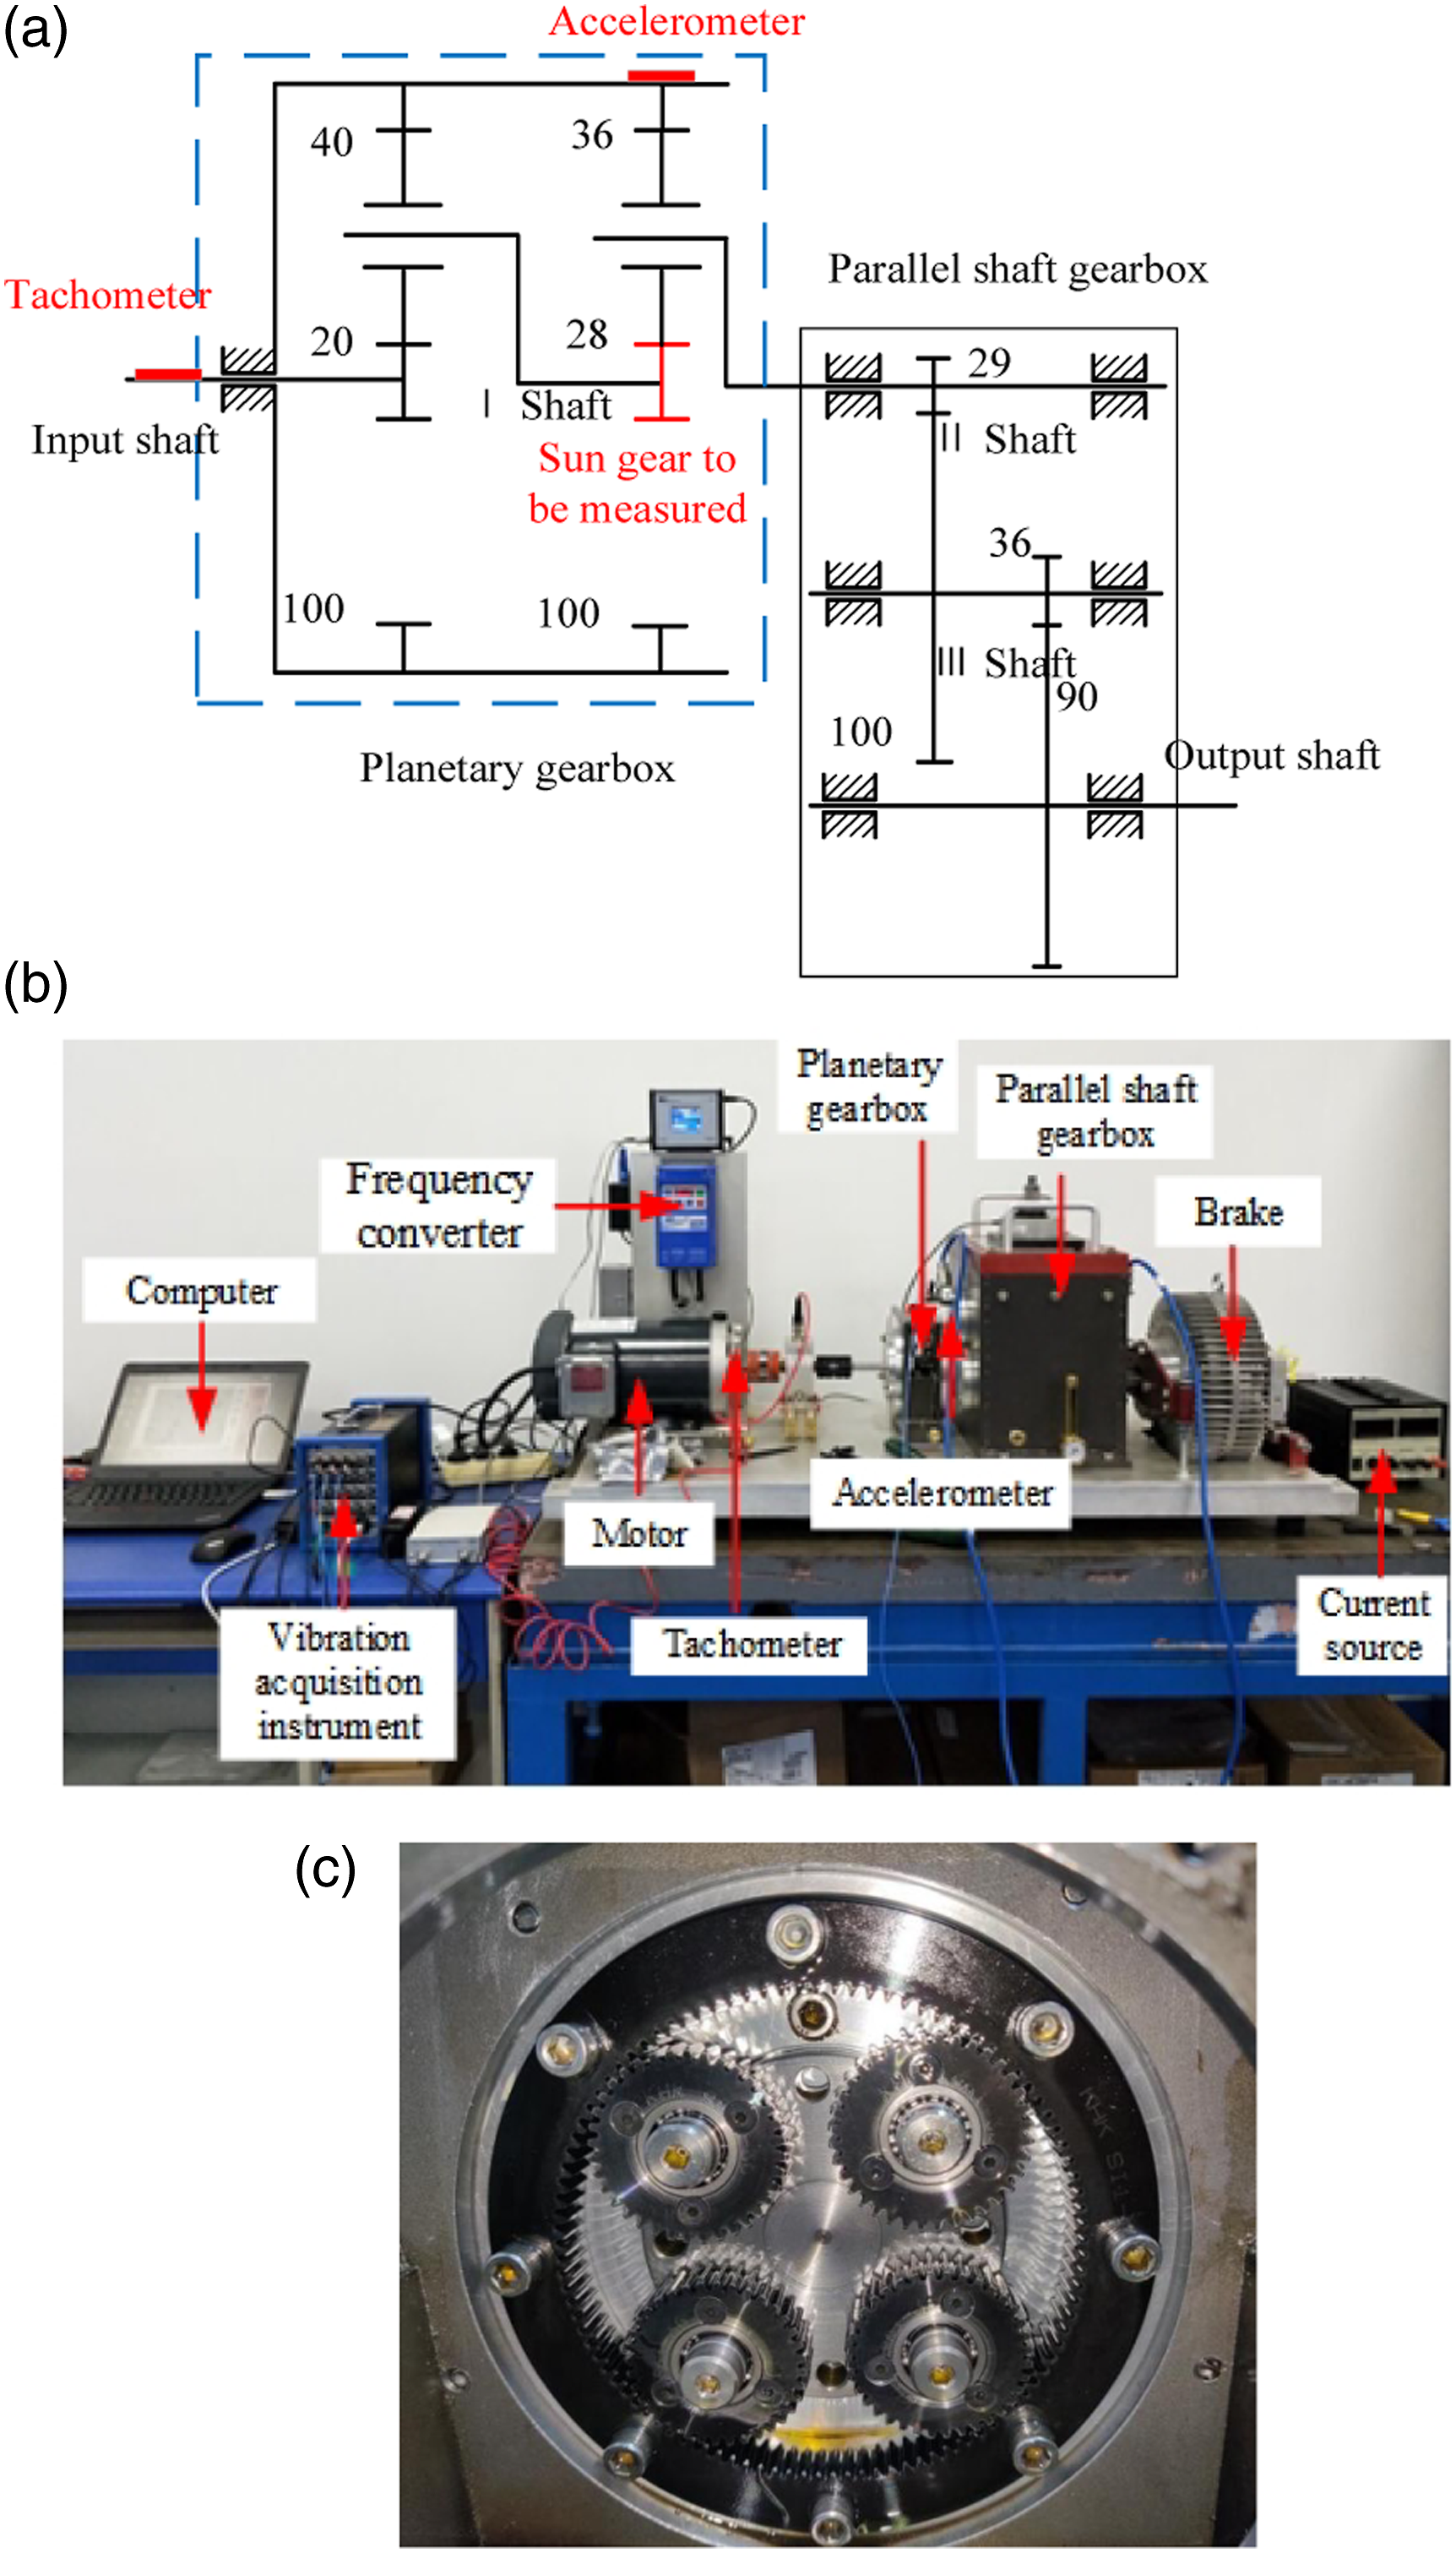
Assuming that the rotation frequency of the motor is 

The calculation shows that the primary planetary carrier rotation frequency 
According to the gearbox parameters, the fault characteristic order of the secondary sun gear is obtained, that is, FCO = 0.52.
Tooth root crack case
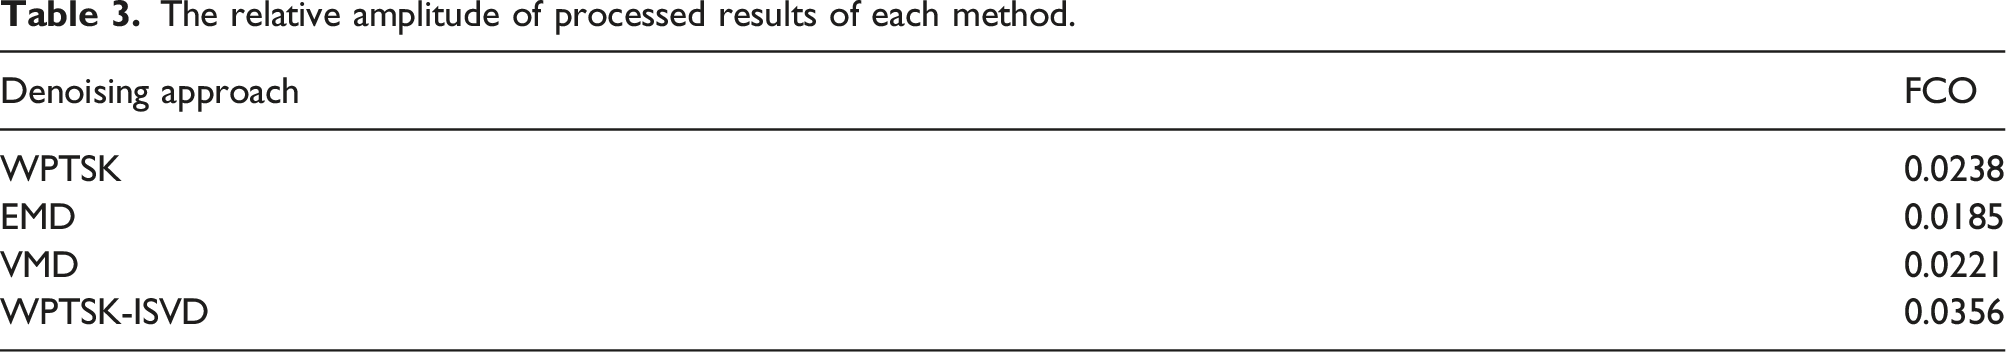
The load on the planetary gearbox was 44.09 N·m. The frequency range of the motor was set to 5∼30 Hz within 0∼5 s. The sampling frequency was 20,480 Hz, and the sampling time was 4.8 s. In order to improve the calculation of the algorithm, 4.15∼4.75 s data segments were used and down-sampled by half. It can be seen that the motor speed rises approximately in a straight line, as shown in Figure 6(a). The time-domain waveform and frequency-domain spectrum of the signal are shown in Figure 6(b) and (c). As can be seen from Figure 6, the meshing frequency of the secondary is too low, resulting in the complete coverage by the primary meshing frequency. Meantime, the fluctuation of the rotating speed causes the Fourier spectrum to drift from left to right, which makes it difficult to analyze the time-frequency law and easy to cause the misdiagnosis. The signal of tooth root crack: (a) motor rotational frequency, (b) time-domain waveform, and (c) frequency-domain spectrum.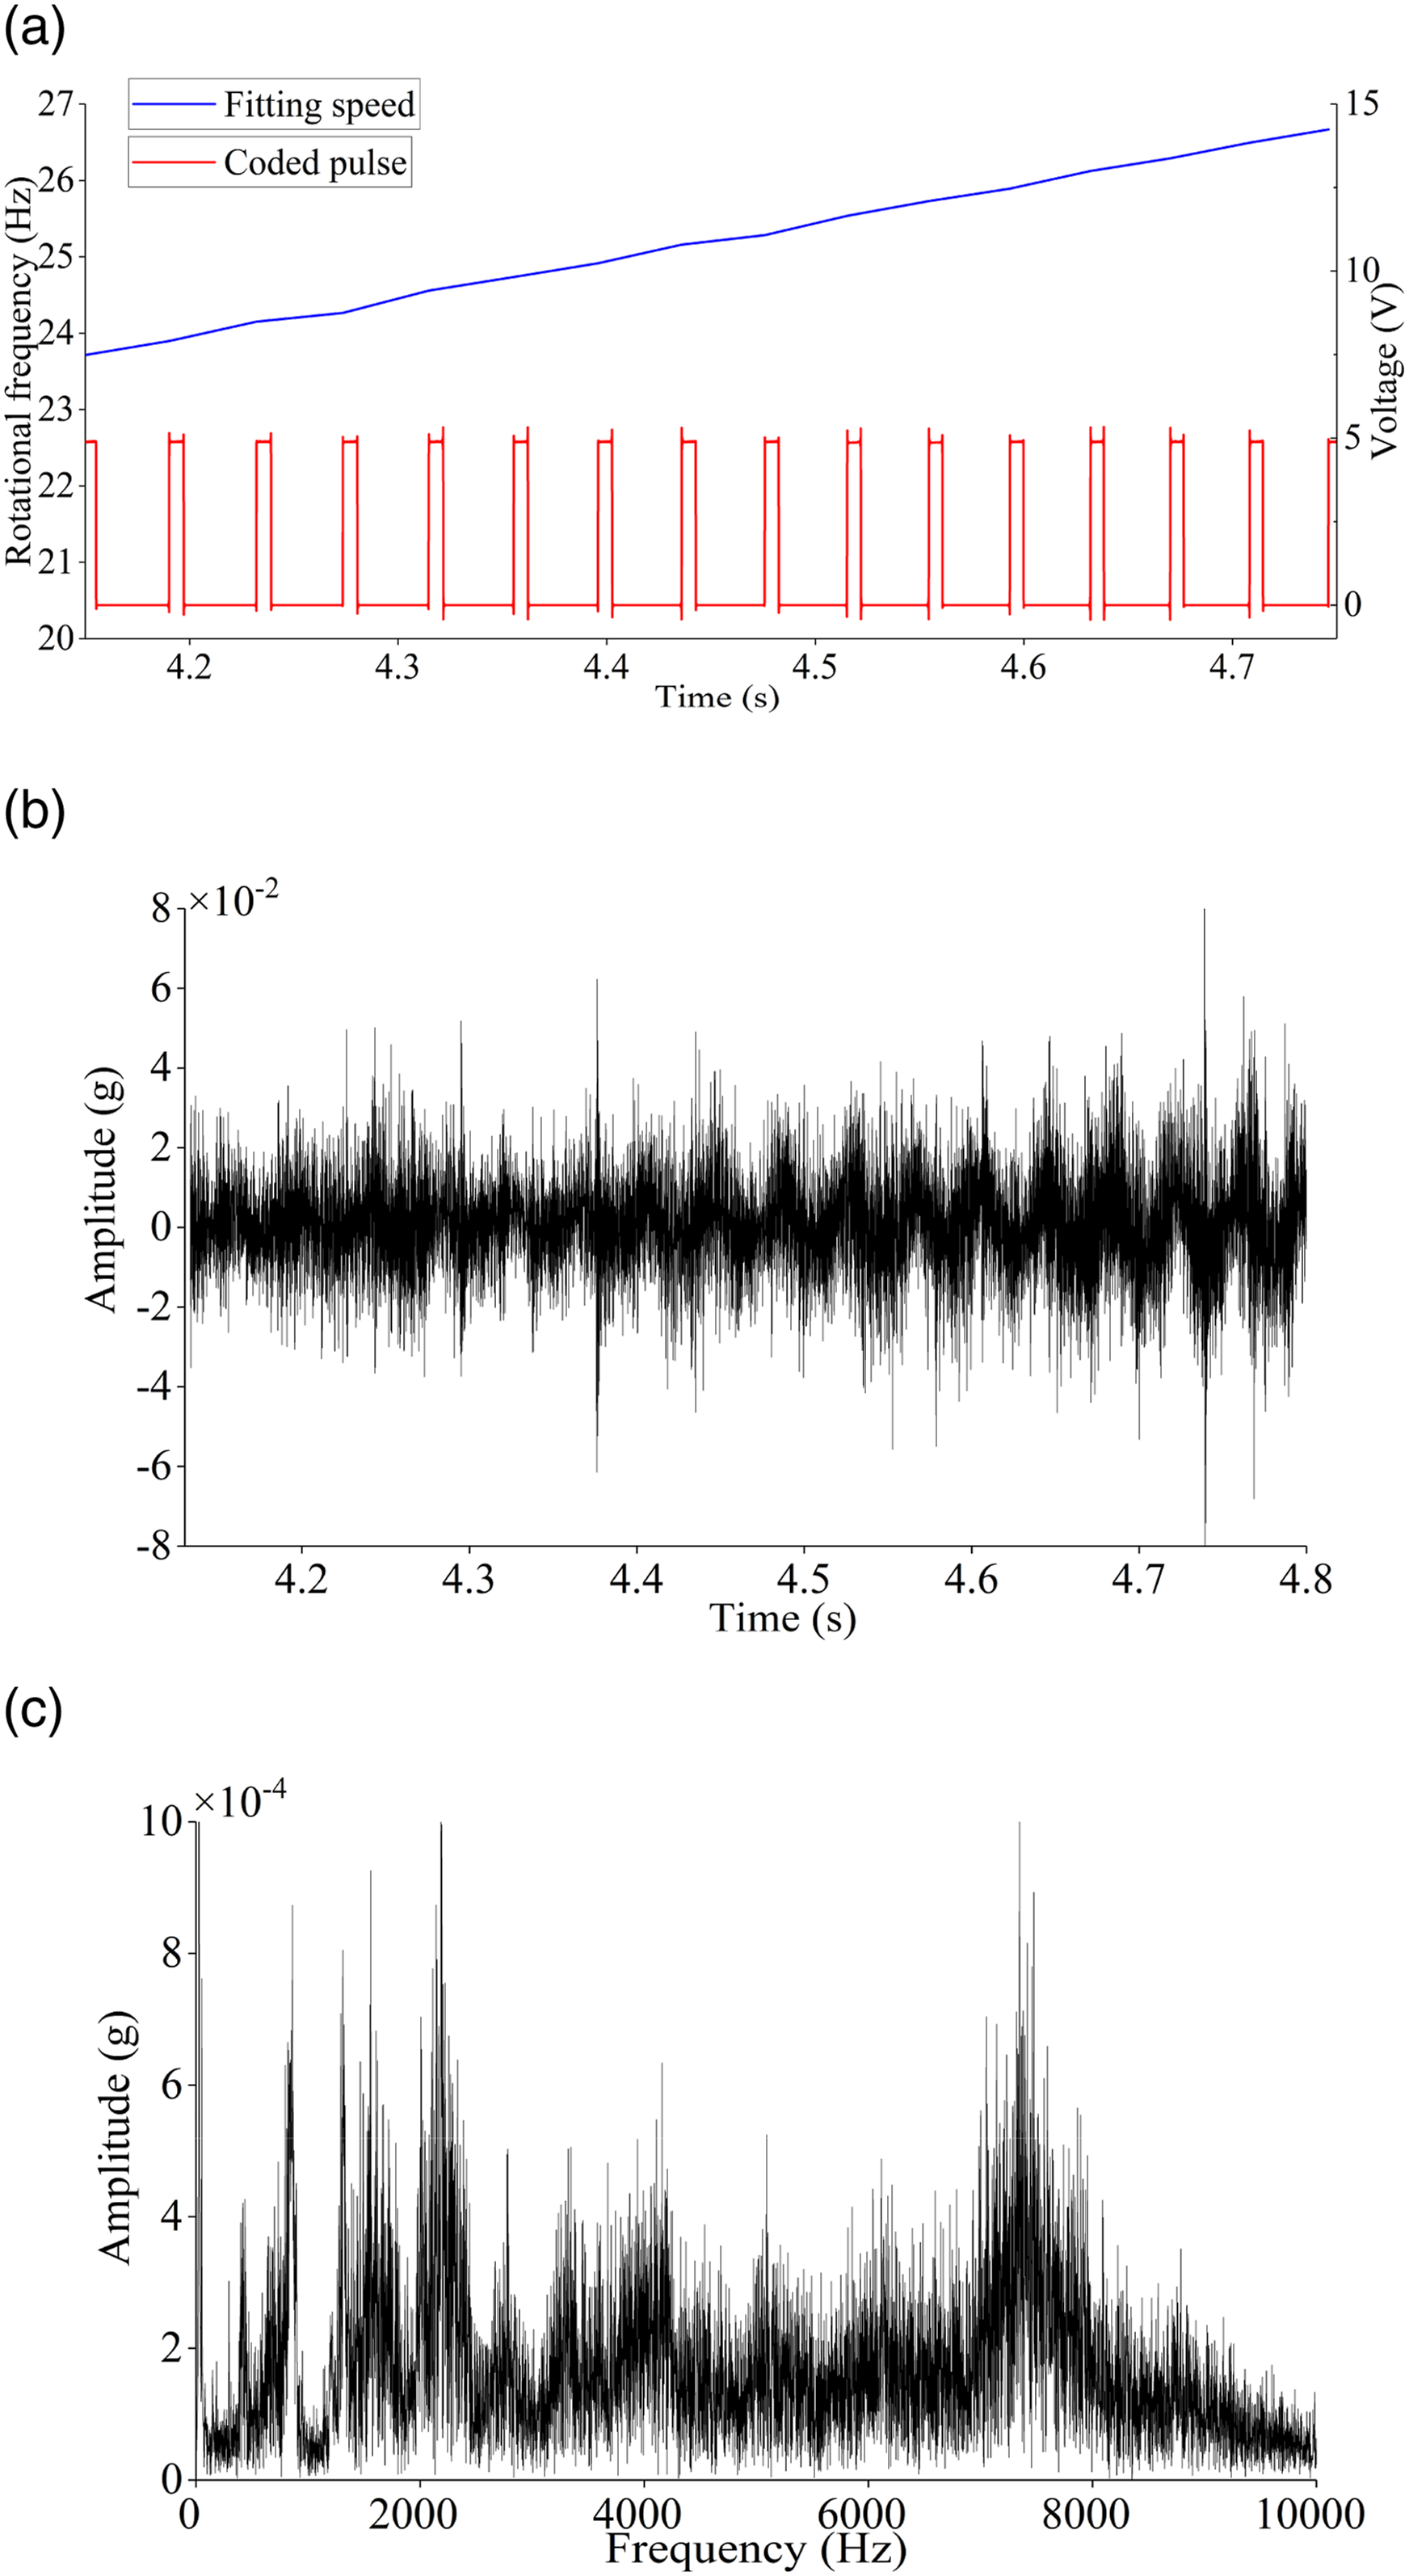
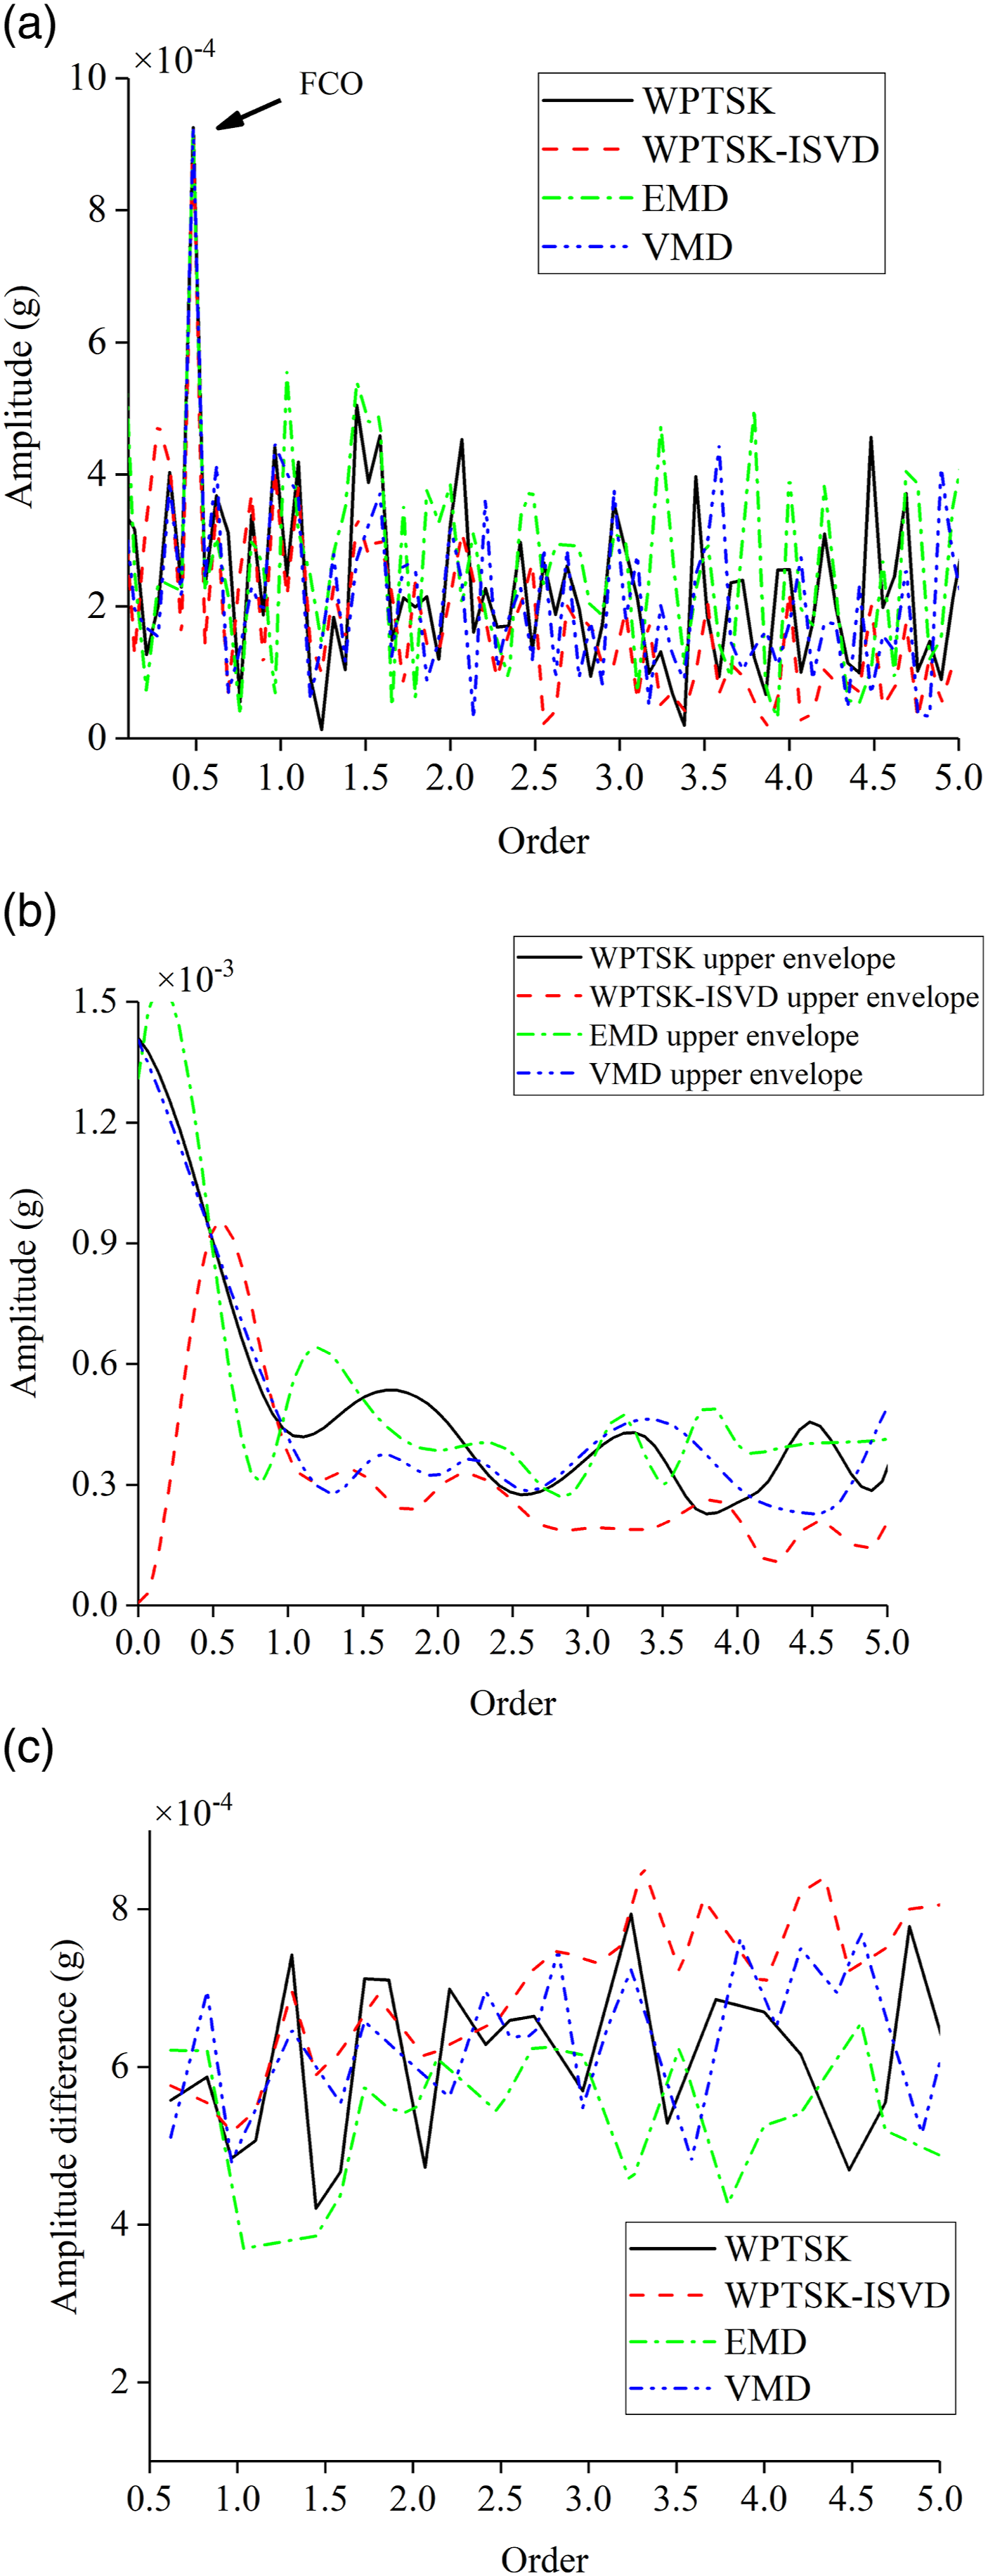
A high-pass filter with the cutoff frequency equal to the minimum rotation frequency is used to eliminate the DC component and noise. The cutoff frequency of the high-pass filter is set to 20 Hz. The WPTSK is used to obtain the best frequency band of the filtered signal, and the WPT coefficient is used to reconstruct the signal. The processed signal is resampled to the angle domain to obtain the angle-domain signal. The FCO domain information is obtained by FFT of the angle signal. In the Figure 7(a), the WPT represents the order spectrum after the order tracking, and it can be seen that the frequency drift is eliminated. Because the overall amplitude of the filtered order spectrum decreases, in order to facilitate the comparison, a correction parameter λ
k
is set, and the overall amplitude of the filtered order spectrum is multiplied by the parameter λ
k
. The results of each method: (a) envelope order spectrum, (b) upper envelope of envelope order spectrum, and (c) amplitude difference diagram.
The relative amplitude of processed results of each method.

Local broken tooth case
The faulty gear is replaced by a local broken gear. The frequency of the motor is shown in Figure 8(a). Figure 8(b) and (c) show the time-domain waveform and frequency-domain spectrum of the signal. The signal of local broken tooth: (a) motor rotational frequency, (b) time-domain waveform, and (c) frequency-domain spectrum.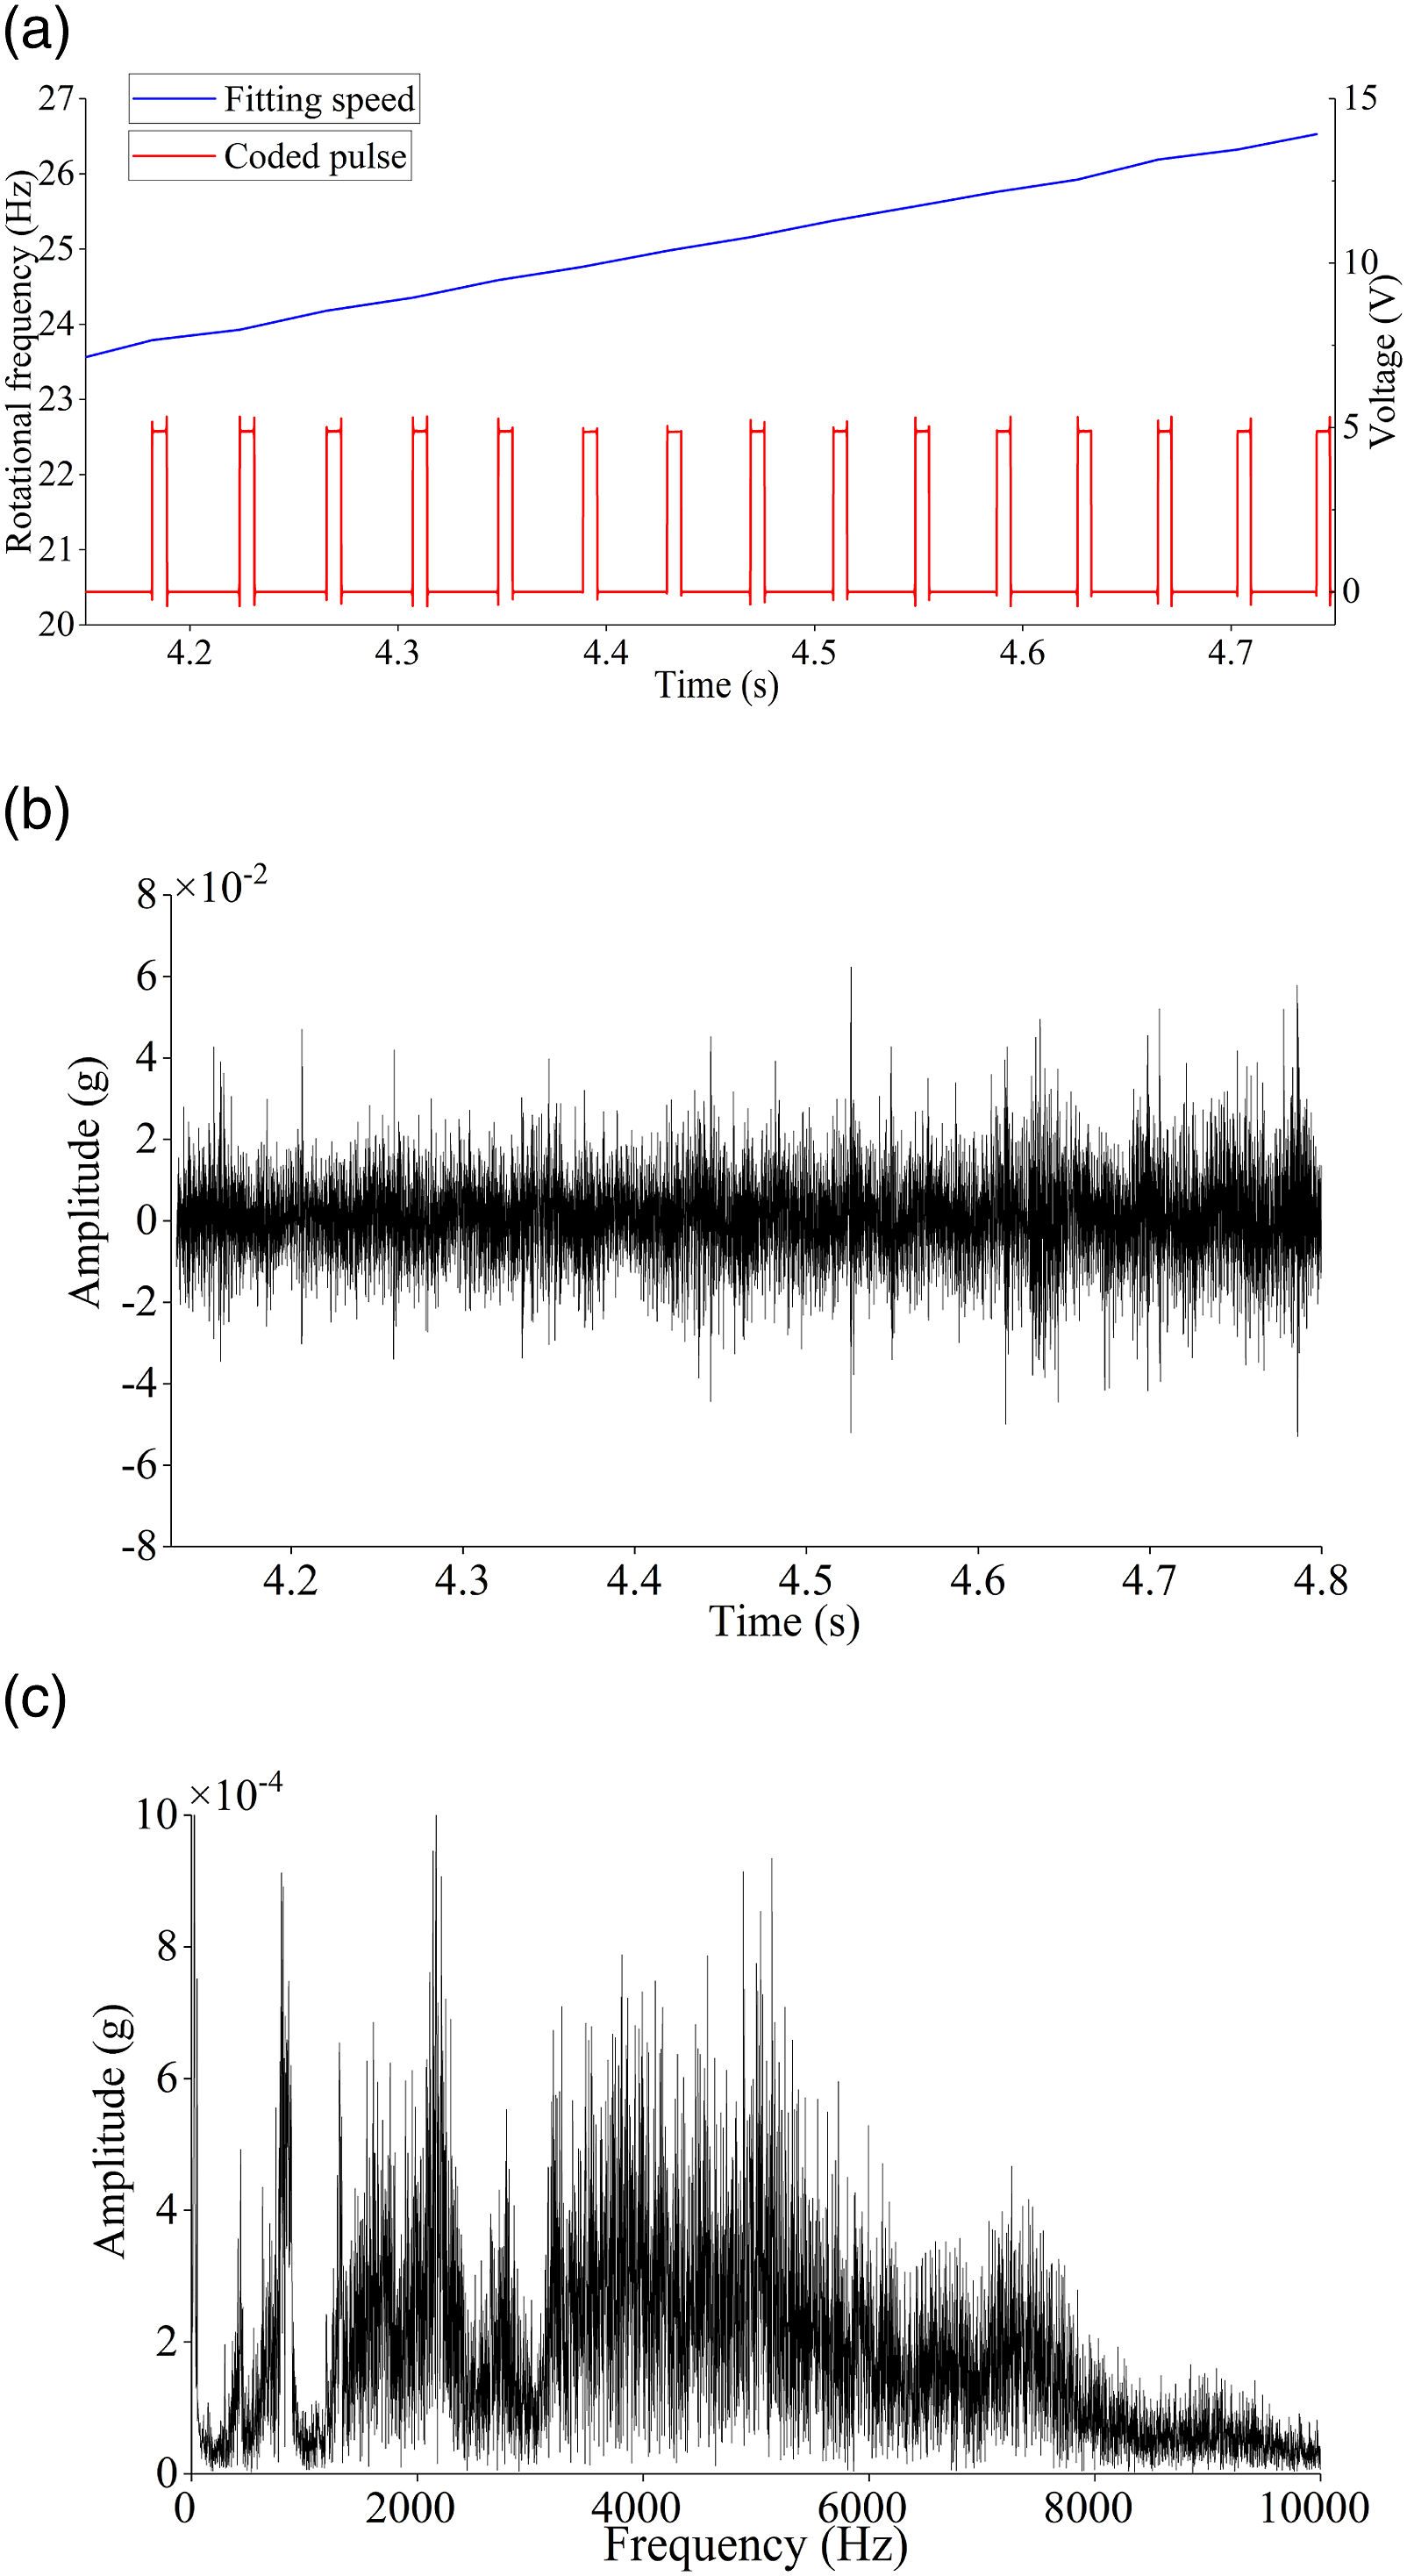
Similar to the above, in Figure 9, WPTSK shows the order spectrum. The signal in Figure 8(b) is analyzed by the proposed ISVD, and the obtained order spectrum is WPTSK-ISVD in Figure 9; it can be seen that the local fault characteristic order of the secondary sun gear and its amplitude is clearer. EMD and VMD denoising methods are also applied to the tested signals. It can be seen that the amplitudes of the local fault characteristic order of the secondary sun gear in the envelope order spectrum after EMD and VMD denoising are not as obvious as the proposed method. The relative amplitudes of different components are shown in Table 3. The results of each method: (a) envelope order spectrum, (b) upper envelope of envelope order spectrum, and (c) amplitude difference diagram. The relative amplitude of processed results of each method.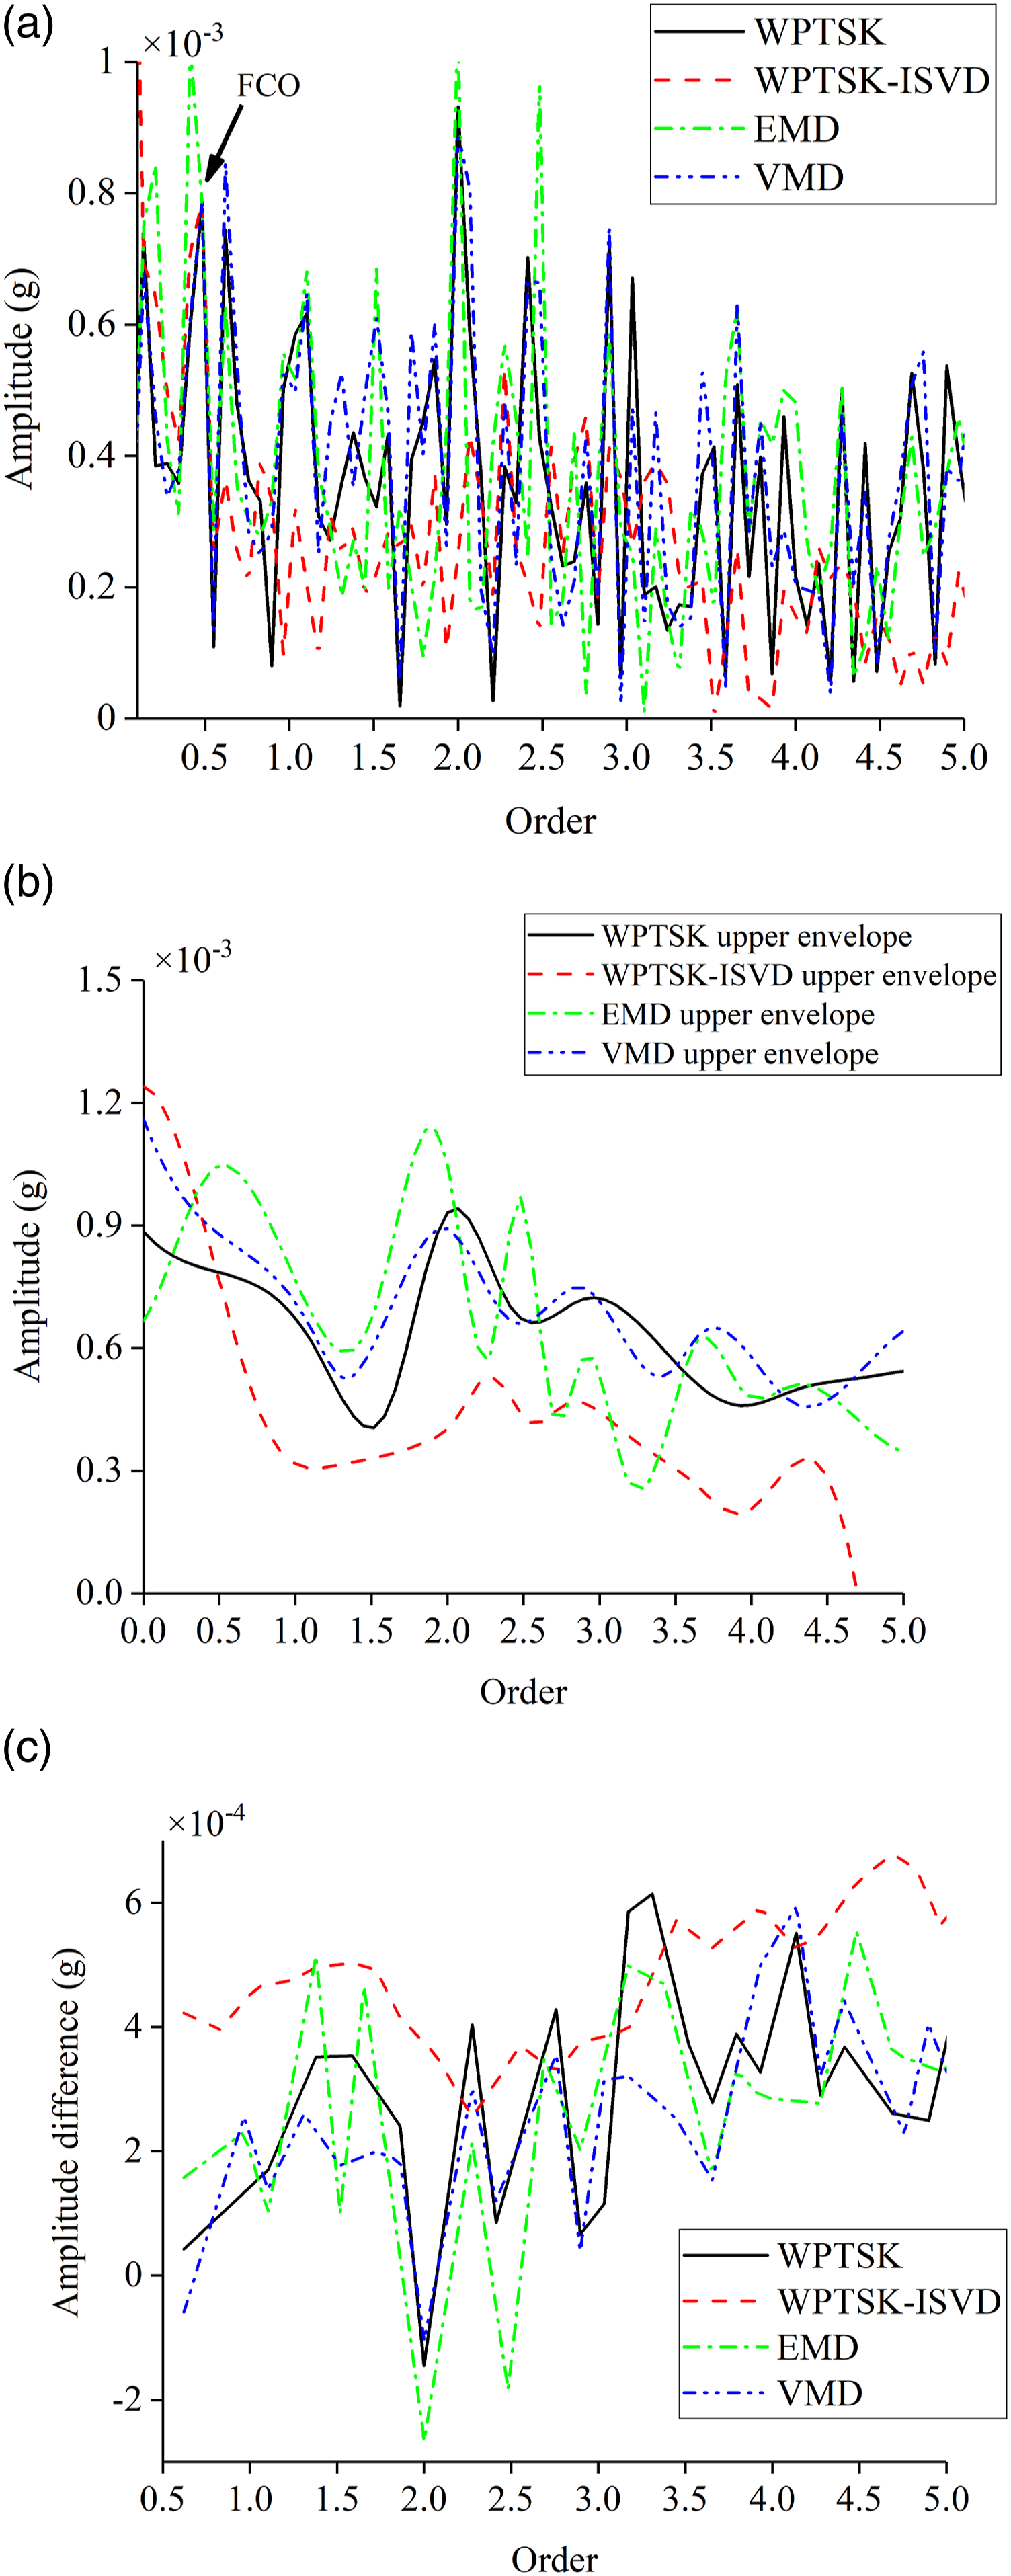
Entire broken tooth case
The faulty gear is replaced by an entire broken gear. The frequency of the motor is shown in Figure 10(a). Figure 10(b) and (c) show the time-domain waveform and frequency-domain spectrum. The signal of entire broken tooth: (a) motor rotational frequency, (b) time-domain waveform, and (c) frequency-domain spectrum.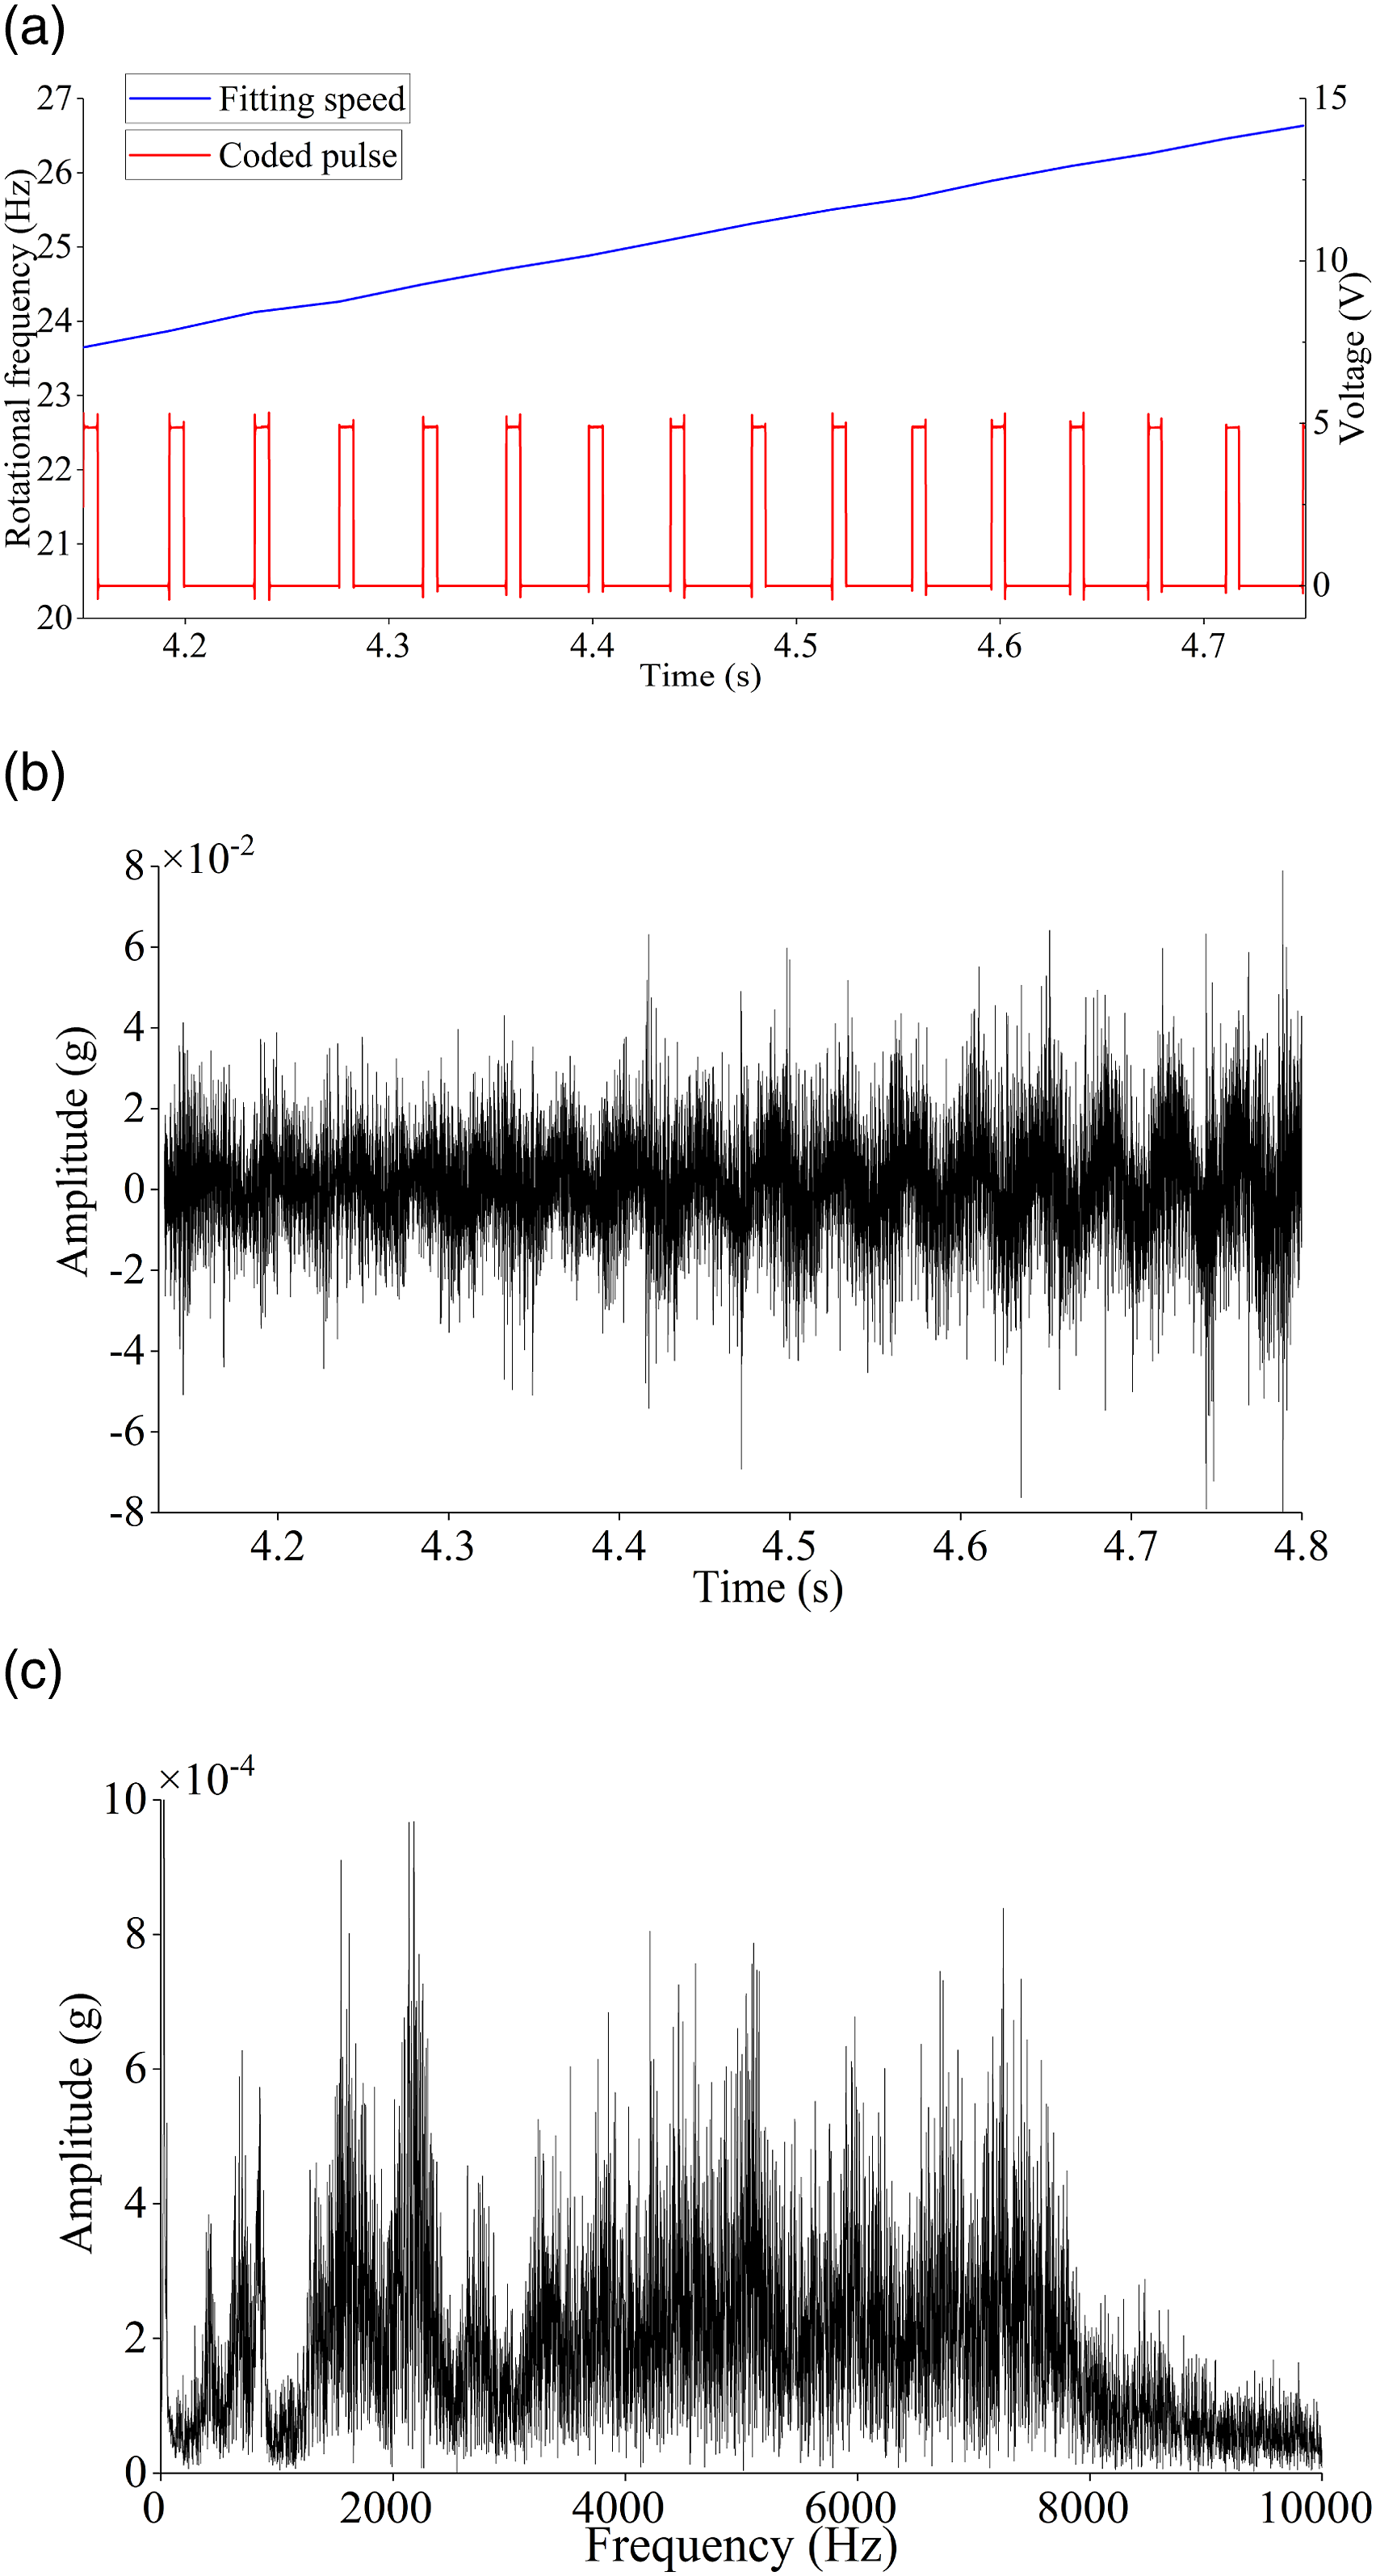
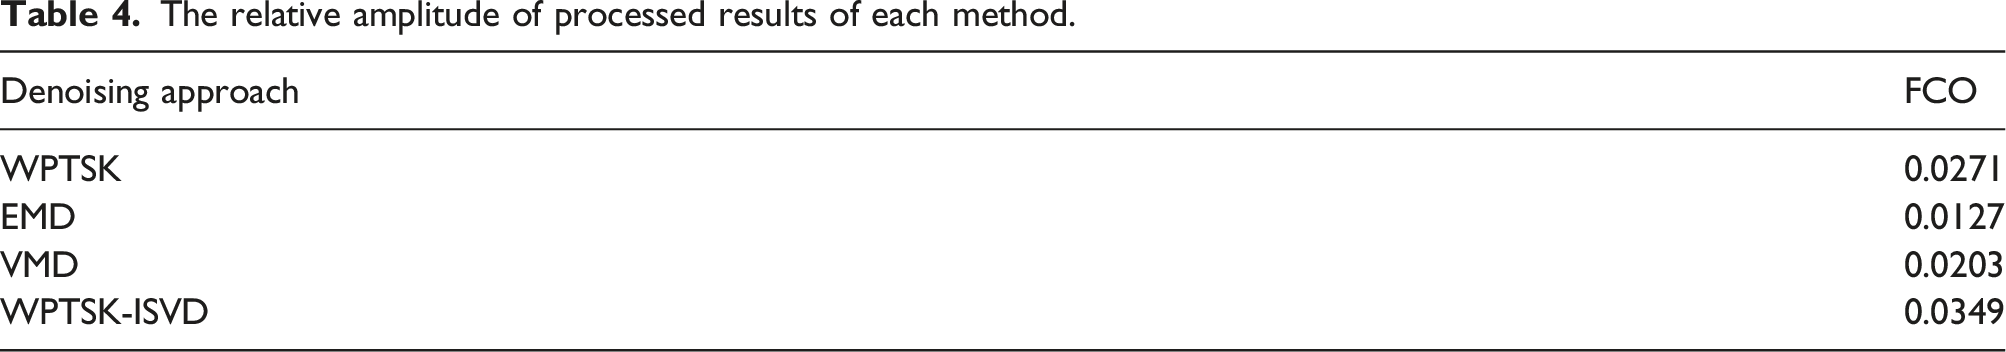
Similar to the above, in Figure 11, WPTSK shows the order spectrum. The signal shown in Figure 10(b) is analyzed by the proposed ISVD, and the obtained order spectrum is WPTSK-ISVD in Figure 11; it can be seen that the local fault characteristic order of the secondary sun gear and its amplitude is clearer. EMD and VMD denoising methods are also applied to the tested signals. It can be seen that the amplitudes of the local fault characteristic order of the secondary sun gear in the envelope order spectrum after EMD and VMD denoising are not as obvious as the proposed method. The relative amplitudes of different components are shown in Table 4. The results of each method: (a) envelope order spectrum, (b) upper envelope of envelope order spectrum, and (c) amplitude difference diagram. The relative amplitude of processed results of each method.
Normal tooth case
The faulty gear is replaced by a normal gear. The frequency of the motor is shown in Figure 12(a). Figure 12(b) and (c) show the time-domain waveform and frequency-domain spectrum. The signal of normal tooth: (a) motor rotational frequency, (b) time-domain waveform, and (c) frequency-domain spectrum.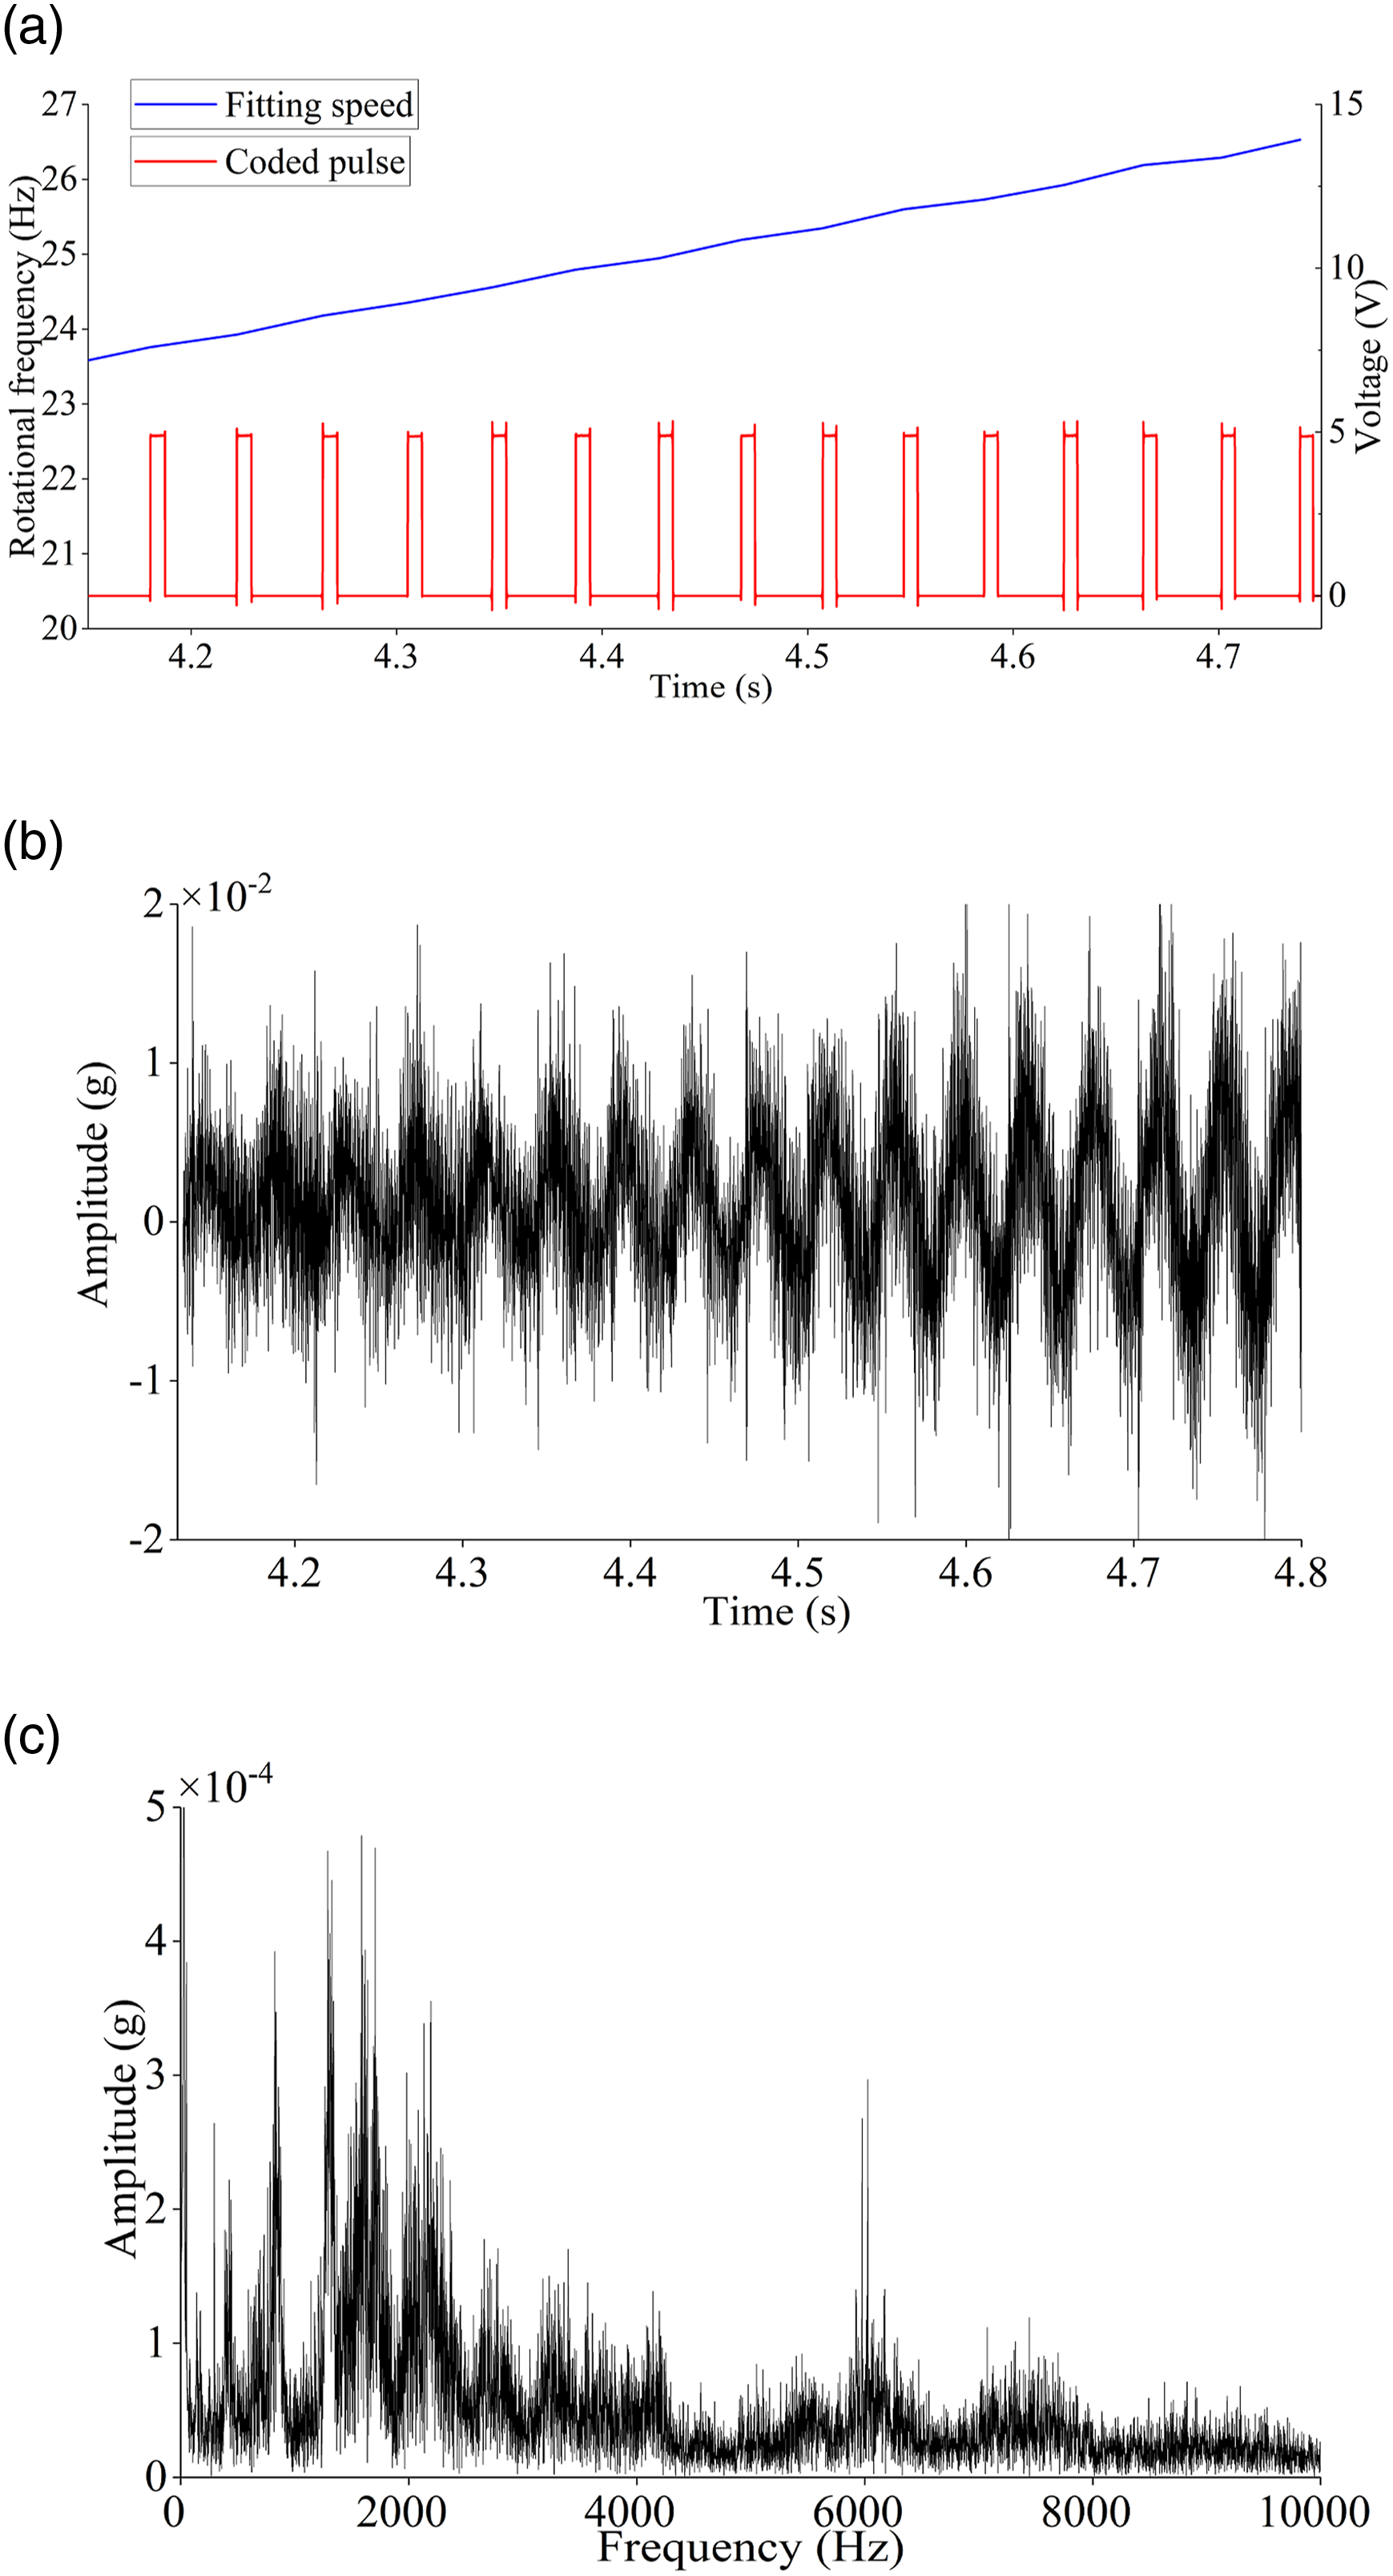
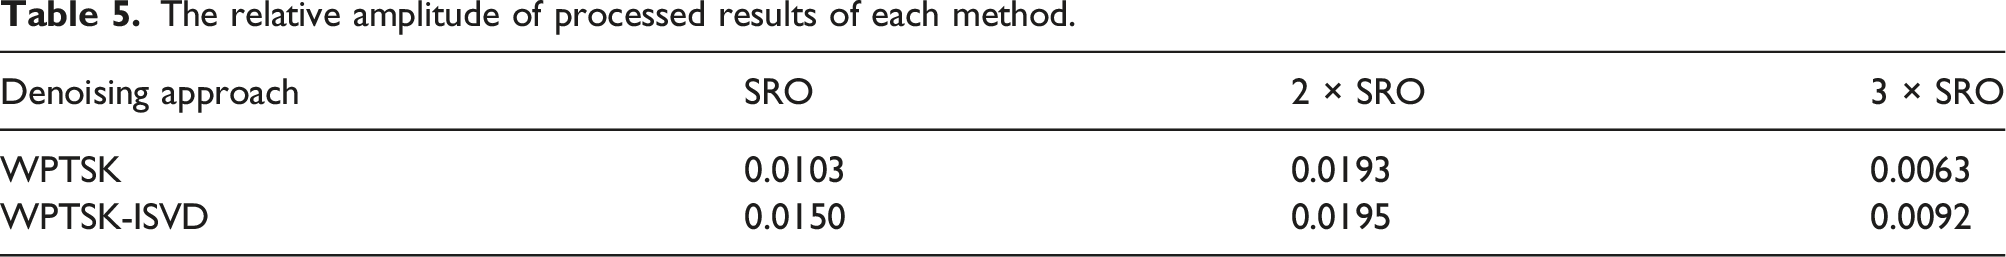
Similar to the above, Figure 13(a) shows the order spectrum. The signal in Figure 12(b) is analyzed by the proposed ISVD, and the obtained order spectrum is shown in Figure 13(b). After the ISVD, the relative amplitude of Shaft Rotation Order (SRO) and its frequency doubling is higher than that of the previous. This further shows that ISVD can effectively improve the in-band SNR. The relative amplitudes of different components are shown in Table 5. The envelope order spectrum of normal tooth: (a) before ISVD and (b) after ISVD. The relative amplitude of processed results of each method.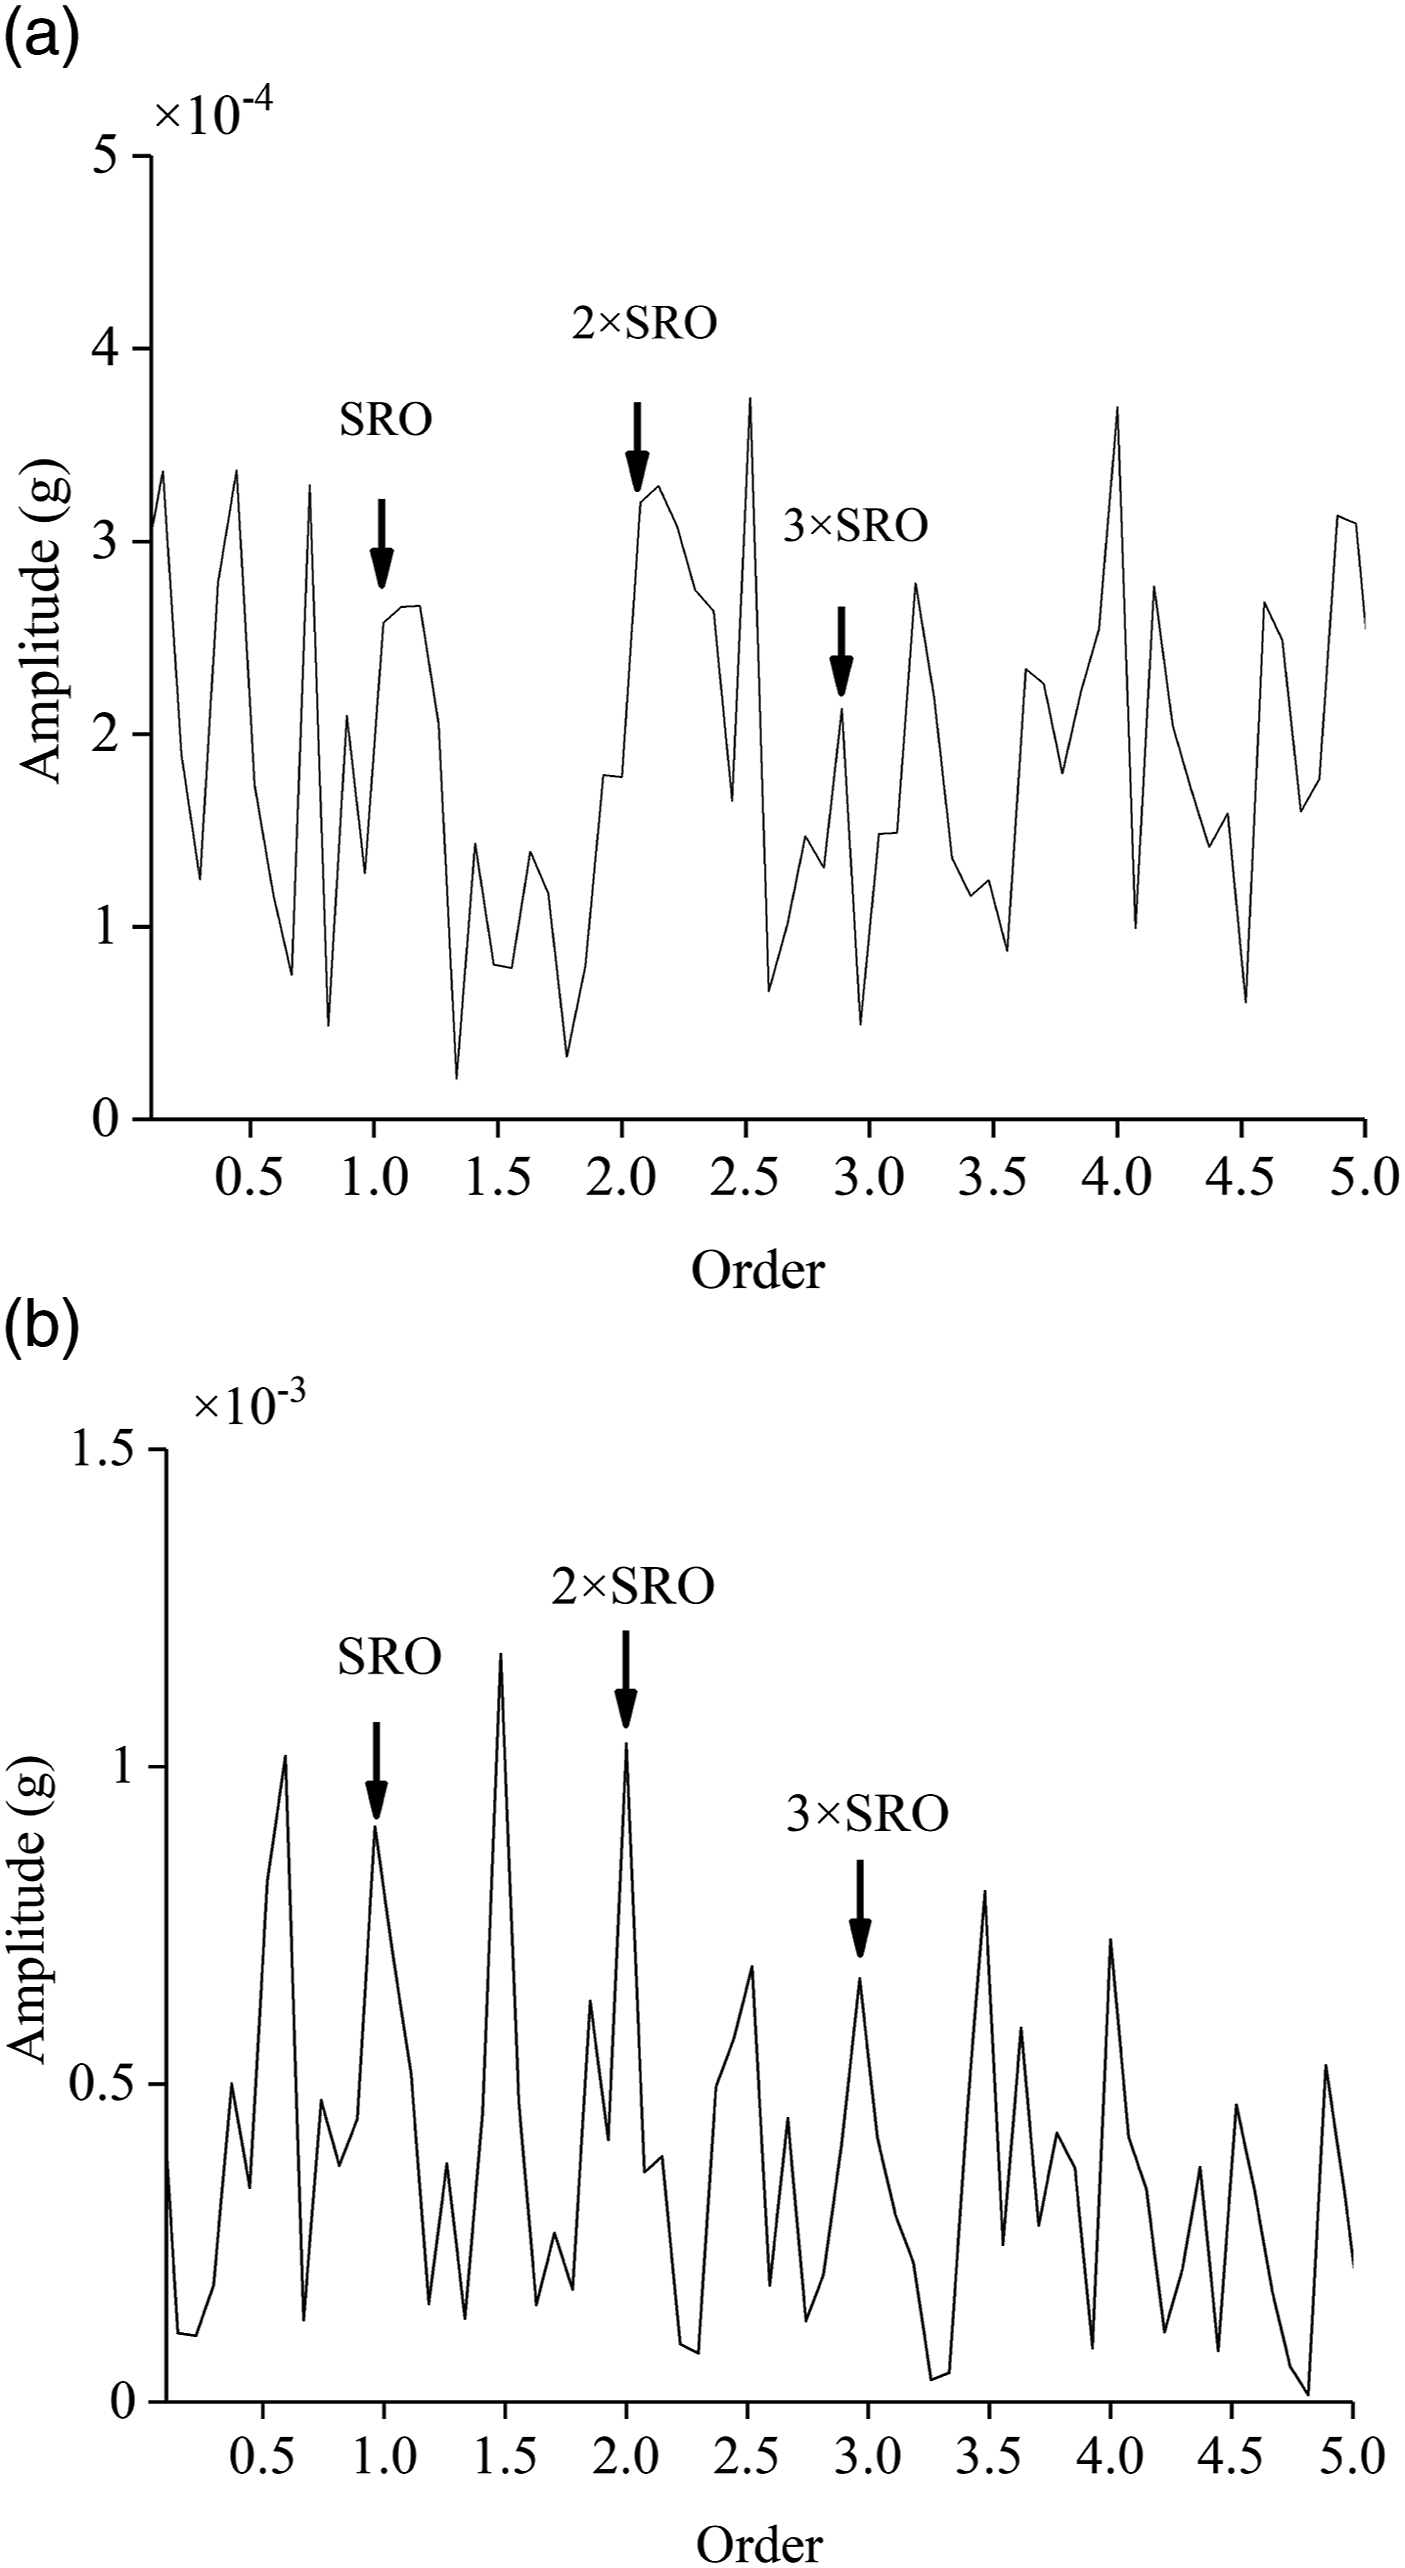
Conclusions
In the existing resonance method, even if the optimal resonance frequency band is found, the in-band noise still exists. Hence, employing the in-band denoising technique is essential to prevent the fault misdiagnoses in a planetary gearbox. (1) The ISVD-based in-band denoising approach coupled with the envelope order analysis effectively mitigates the in-band noise and other interferences. The method employs the SK of WPT to pinpoint the optimal frequency band, and utilizes the ISVD for the signal denoising. (2) Compared to the EMD and VMD, the ISVD more effectively suppresses the in-band noise, aiding the extraction of the fault feature order in variable speed scenarios. Resampling the signal to the fault characteristic order domain allows for the identification of the sun gear fault in a planetary gearbox by the envelope order spectrum.
Footnotes
Declaration of conflicting interests
The author(s) declared no potential conflicts of interest with respect to the research, authorship, and/or publication of this article.
Funding
The author(s) disclosed receipt of the following financial support for the research, authorship, and/or publication of this article: This work was supported by the National Natural Science Foundation of China (52275131, 52274158).
Data Availability Statement
The data used in this paper came from the data collected by the authors' laboratory. The data work can be available upon the reasonable request from the author Jiexiang Huang (