
Abstract
Windows are commonly the primary way for noise to enter the building environment. Most windows achieve higher sound insulation targets by simply increasing glass thickness or laminate. However, the glass thickness cannot be increased freely due to the window frame’s limitation. This research selects eleven kinds of asymmetric insulating laminated glass (glass + polyvinyl butyral + glass + air + glass) within 27 mm, which are the typical thicknesses of window frames. The three pieces of glass have equal thicknesses. The half-space acoustics method investigated the acoustic properties and modal behavior of the glass with finite thickness. The results show that when PVB or three glass increases simultaneously, and the sound insulation of each glass can be improved by 0.9∼3.4 dB or 3.7∼21.8 dB at first resonant frequencies, respectively. The glass with the best sound insulation is 7 mm glass + 0.76 mm polyvinyl butyral + 7 mm glass + 5 mm air + 7 mm glass (7 + 0.76 + 7 + 5A + 7 for short). Its sound transmission loss (TL) is 38.5 dB from 125 to 4000 Hz and 16.8 dB in the first resonant frequency (200 Hz). In addition, its first resonant frequency is the highest among eleven kinds of glass, and the number of natural frequencies in the low frequency range is only 9. These findings can provide a basis for designing asymmetric insulating laminated glass to improve the low frequency noise reduction effect effectively.
Keywords
Introduction
With the rapid increase of urbanization, noise pollution has become a significant problem affecting people’s living environments and quality of life. 1 The World Health Organization (WHO) ranks noise pollution as the second most undesirable environmental factor. 2 2020 WHO report shows that more than 113 million people in Europe are exposed to traffic noise yearly, causing at least 1 million deaths. 3 Furthermore, road traffic noise that exceeds 53 dB during the day or 45 dB at night will significantly affect people’s living environments, especially sleep quality. 4 As window-to-wall ratios of buildings gradually increase in modern cities, there are various ways for noise to enter buildings. Therefore, there is urgently used to explore more effective sound insulation measures for windows to mitigate the impact of noise on the building’s acoustic environment.
Usually, installing sound barriers on both sides of the road is the first step to reducing traffic noise in residential areas. Grahn and Jensen 5 found that changing vertical barriers to T-shape can effectively mitigate the noise at frequencies above 1000 Hz. Wang Xu6,7 found that a sound barrier from materials of inhomogeneous impedance and sound dredging barriers could dredge the energy flux out. However, semi-enclosed barriers are ineffective in dense urban environments and cannot effectively cut off propagation paths for high-rise buildings. When noise is transmitted to the residential facade by an open balcony, reflections from the ceiling will increase the amount of noise transmitted. Thus, the surface of the ceiling is usually designed with multiple concave surfaces or inhomogeneous impedance to reduce reflections.8,9 However, a fully enclosed balcony can effectively isolate the noise for a better reduction effect. 10 Furthermore, Tang 11 summarized the current development status of natural ventilation-enabling façade noise control devices for mid- and high-rise residential buildings. As opposed to transforming balconies, setting double-pane windows with staggering air inlets and outlets can more effectively reduce noise and improve ventilation quality.
Ford and Kerry 12 first proposed a ventilated sound insulation window. The sound insulation of this window is about 9 dB better than that of an open sliding window with similar opening dimensions. Søndergaard and Legarth 13 applied ventilated sound insulated windows to a multi-story house in Denmark. They measured the sound pressure level with open windows, which was 46 dB below the maximum permitted sound pressure level of the Danish Environmental Protection Agency. Several studies through simulations and experiments14–16 found that these windows are more effective for reducing medium and high frequency noise. Moreover, the sound insulation performance of the glass itself remains one of our primary concerns. In the last century, Quirt17,18 found that the change in Sound Transmission Class (STC) with increasing glass thickness is less than predicted by the “law of mass.” Increasing the thickness and spacing for double-pane glass can improve its sound insulation performance. The sound insulation performance was better for triple-pane glass (three glass and two chambers) than ordinary insulating glass below 500 Hz, but there was no significant difference above 500 Hz. Furthermore, adding a damping material to the edge of the insulating glass, 19 using a viscoelastic material as a connector between two glass panes, 20 and pasting an acoustic material within a double-pane window could all significantly improve sound insulation performance. 21 Last but not least, Miskinis 22 found that from the production point of view, insulating laminated glass has a thinner thickness, lighter weight, and lower cost than double laminated insulating glass, although the sound insulation effect is 5 dB worse in the low frequency band.
Simulation methods are frequently used to calculate the sound transmission loss of building components such as glass. Many noise measurement and control studies in three-dimensional spaces are conducted under free-field conditions. However, the semi-space is a more practical engineering concern. 23 Unlike free space, calculating sound transmission loss in a semi-space usually requires considering the presence of reflecting surfaces. Shepard 24 calculated the directional distribution of the loudspeaker in the sound field by considering the loudspeaker and its mirrored image on the ground as a dipole in the same direction. D.A. Bies 25 found that the radiation impedance of the sound source will be severely affected by the reflecting surface when the distance between the reflecting surface and the sound source is less than half a wavelength. M. Reed and B. Simon 26 developed a method applicable to situations with unknown surface impedance, which regards the reflection of the reflecting surface as radiated by equivalent sound sources located beneath the plane. The direct and reflected sounds can then be represented as a superposition of a series of equivalent sound sources. However, these methods have not been widely applied to measure the sound transmission loss of insulating laminated glass. 27 The literature on the systematic study of the effect of glass thickness on the sound insulation properties of insulating laminated glass is much less developed than the literature on barriers, balconies, and sound-proofed ventilation windows.
The insulating laminated glass in modern buildings represents one of the most fundamental architectural components, endowing the stud with great significance. The primary purpose of this investigation is to analyze the sound insulation performance of different insulating laminated glass thicknesses and identify the specifications with the best sound insulation effect. Specifically, sound insulation characteristics using an acoustic half-space simulation better represent the actual sound environment. After verifying its accuracy, eleven kinds of insulating laminated glass were analyzed for sound pressure levels, vibration patterns, stresses, and natural frequencies. The aim is to determine the insulating laminated glass provides the best sound insulation in different frequency bands, along with a discussion of the specific reasons behind the results.
Simulation settings
Half-space acoustic method setup
The propagation of sound waves is commonly described by plane or spherical waves. The Dodecahedron Sound Source used for experimental measurements is usually close to the windows. The sound waveforms touching the glass surface do not precisely match the noise waves from farther away in reality (Figure 1(a)). In typical measurement setups, the diffuse sound field is generated in a reverberation room. The sound field usually obtained in the low frequency band is not entirely scattered. Therefore, the sound transmission loss (TL) measured will be affected to some extent by the experimental conditions. The sound reduction index by experimental measurement depends on the laboratory structure and sealing conditions. (a) Sound sources are spherical waves. (b) Using N uncorrelated plane waves moving in random directions instead of conventional spherical wave sources.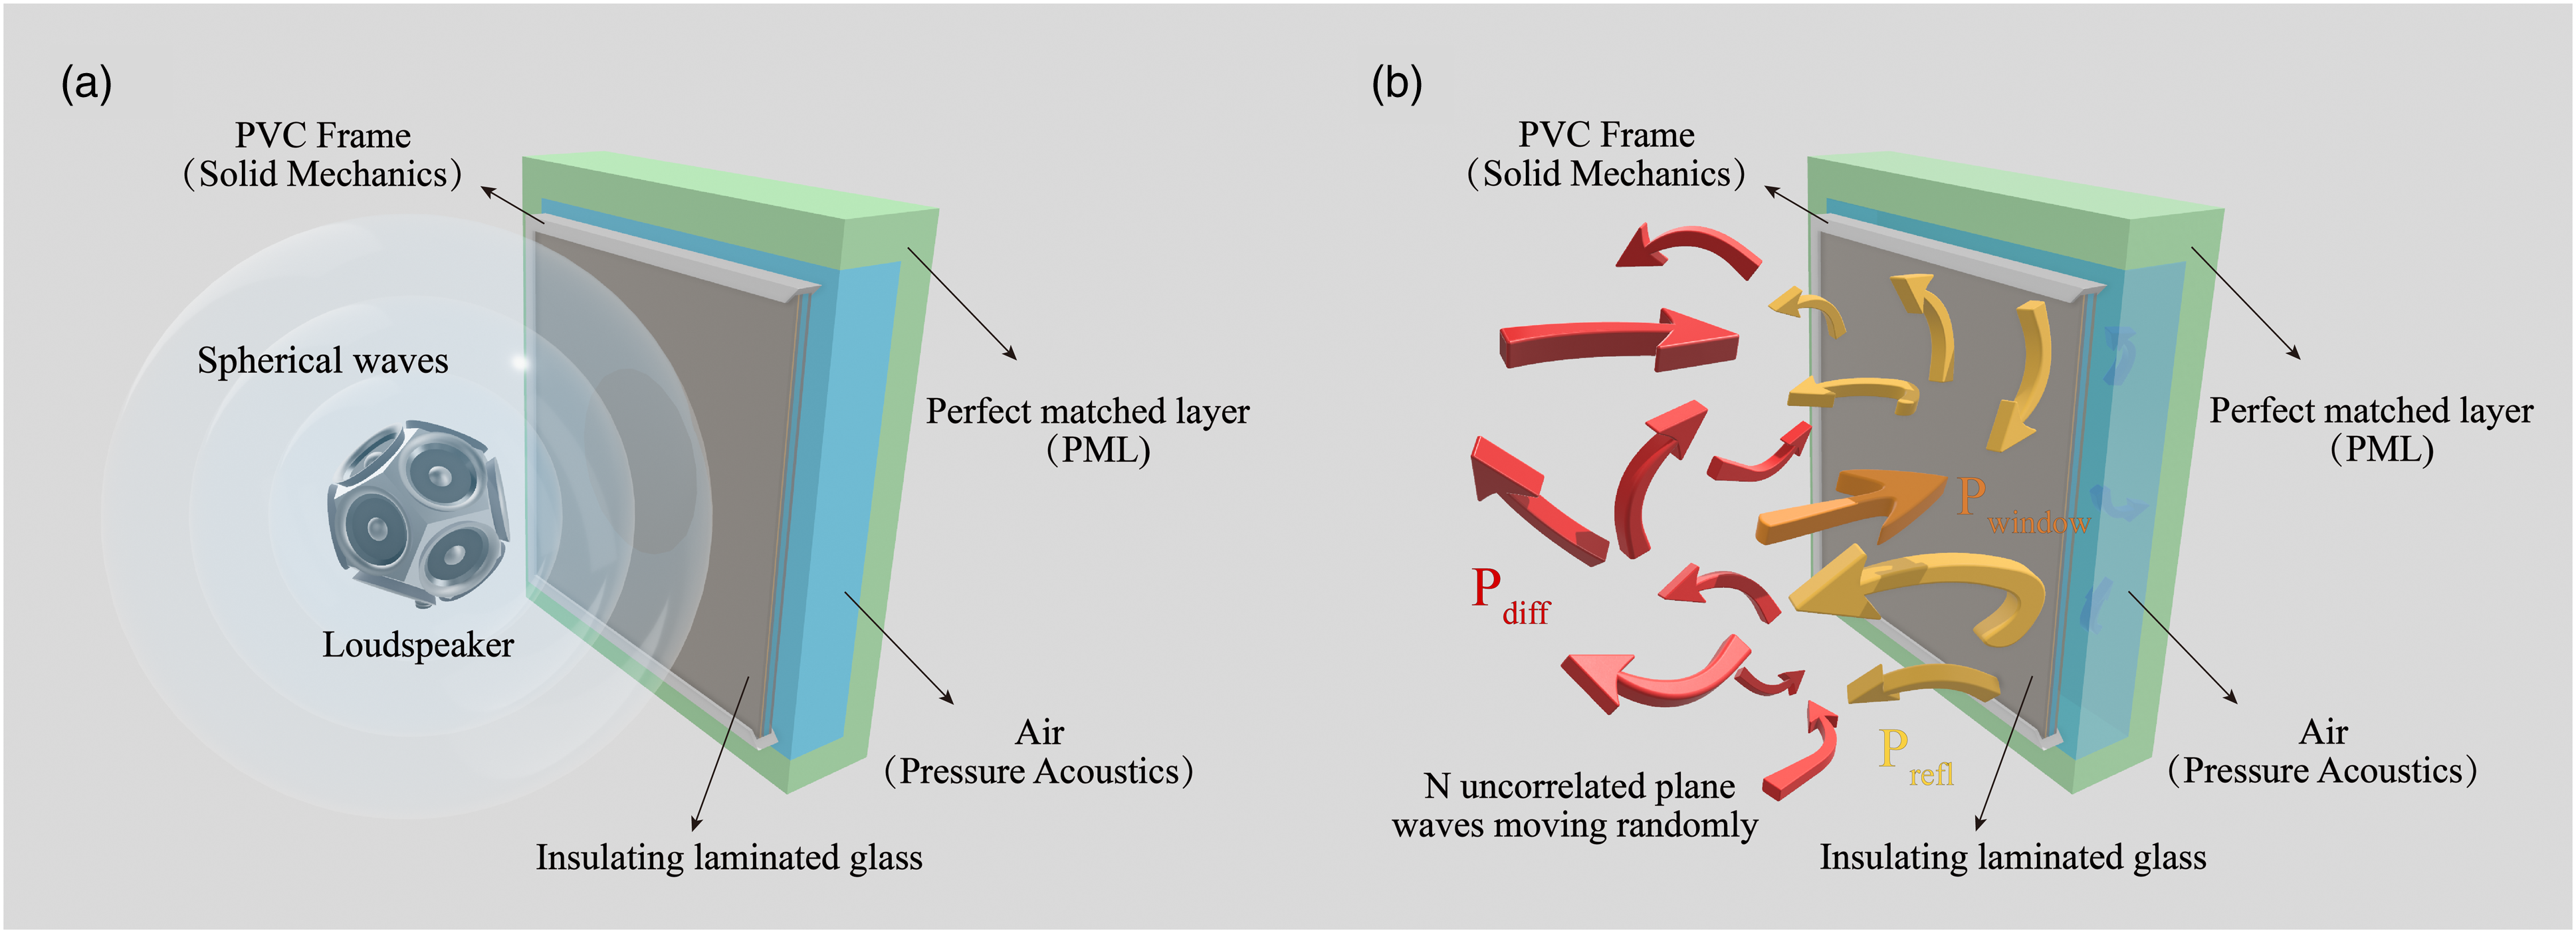
In response to this, this study introduces the “half-space acoustics method,” presenting a hybrid model that integrates characteristics from both free and reverberant fields. In half-space acoustics, we use the sum of N uncorrelated plane waves moving randomly instead of traditional spherical waves. The wave scatters in myriad directions when sound interacts with reflective surfaces like windows. By leveraging multiple uncorrelated plane waves, we can authentically emulate this scattering. Each wave has its unique direction, phase, and characteristics, ensuring an intricate sound field resembling real-world scenarios. Calculating TL can simplify the calculation, complete the realistic sound field simulation, and avoid simultaneously modeling the source and received rooms, as shown in Figure 1(b).
In Figure 1(b), the source side is defined as the scattering field and the right side is designated as the receive side. It is assumed that the scattered field contains an infinite number of plane waves, all entering the window in a random direction. Each plane wave can be described by equation (1)
28

This equation shows the pressure at any point in space at a given frequency. Where
Therefore, the total pressure on the source side can be written as the sum of all these individual plane waves by

By superimposing N random plane waves, the quantity of amplitude can be separated by dividing the superposition by N since the amplitude


By substituting equations (3)–(6) into equation (2), the expression for the incident pressure field on the source side of the sound can be obtained

As glass is a relatively rigid structure with low acoustics absorption properties, it is assumed that the structure of the tested samples has a negligible effect on the sound field on the source side. Therefore, only the pressure field during the reflection component. Therefore, the sound source's reflection component is expressed as:

The sound field on the source side

Using the random number method to set up the sound source can ensure the randomness of each plane wave direction and optimize the incident power, making the results closer to the natural, complex acoustic environment.
Sound transmission loss and incident power
According to the standard ISO 10140-2 2021,
29
the sound transmission loss (TL) of windows is commonly measured using the two-room method, and the sound transmission loss is defined as the ratio of the total incident power

In this model, the transmitted power is obtained by integrating the transmitted sound intensity with the following equation Two-room method. (a) Reverberation room—Reverberation room. (b) Reverberation room—Anechoic room.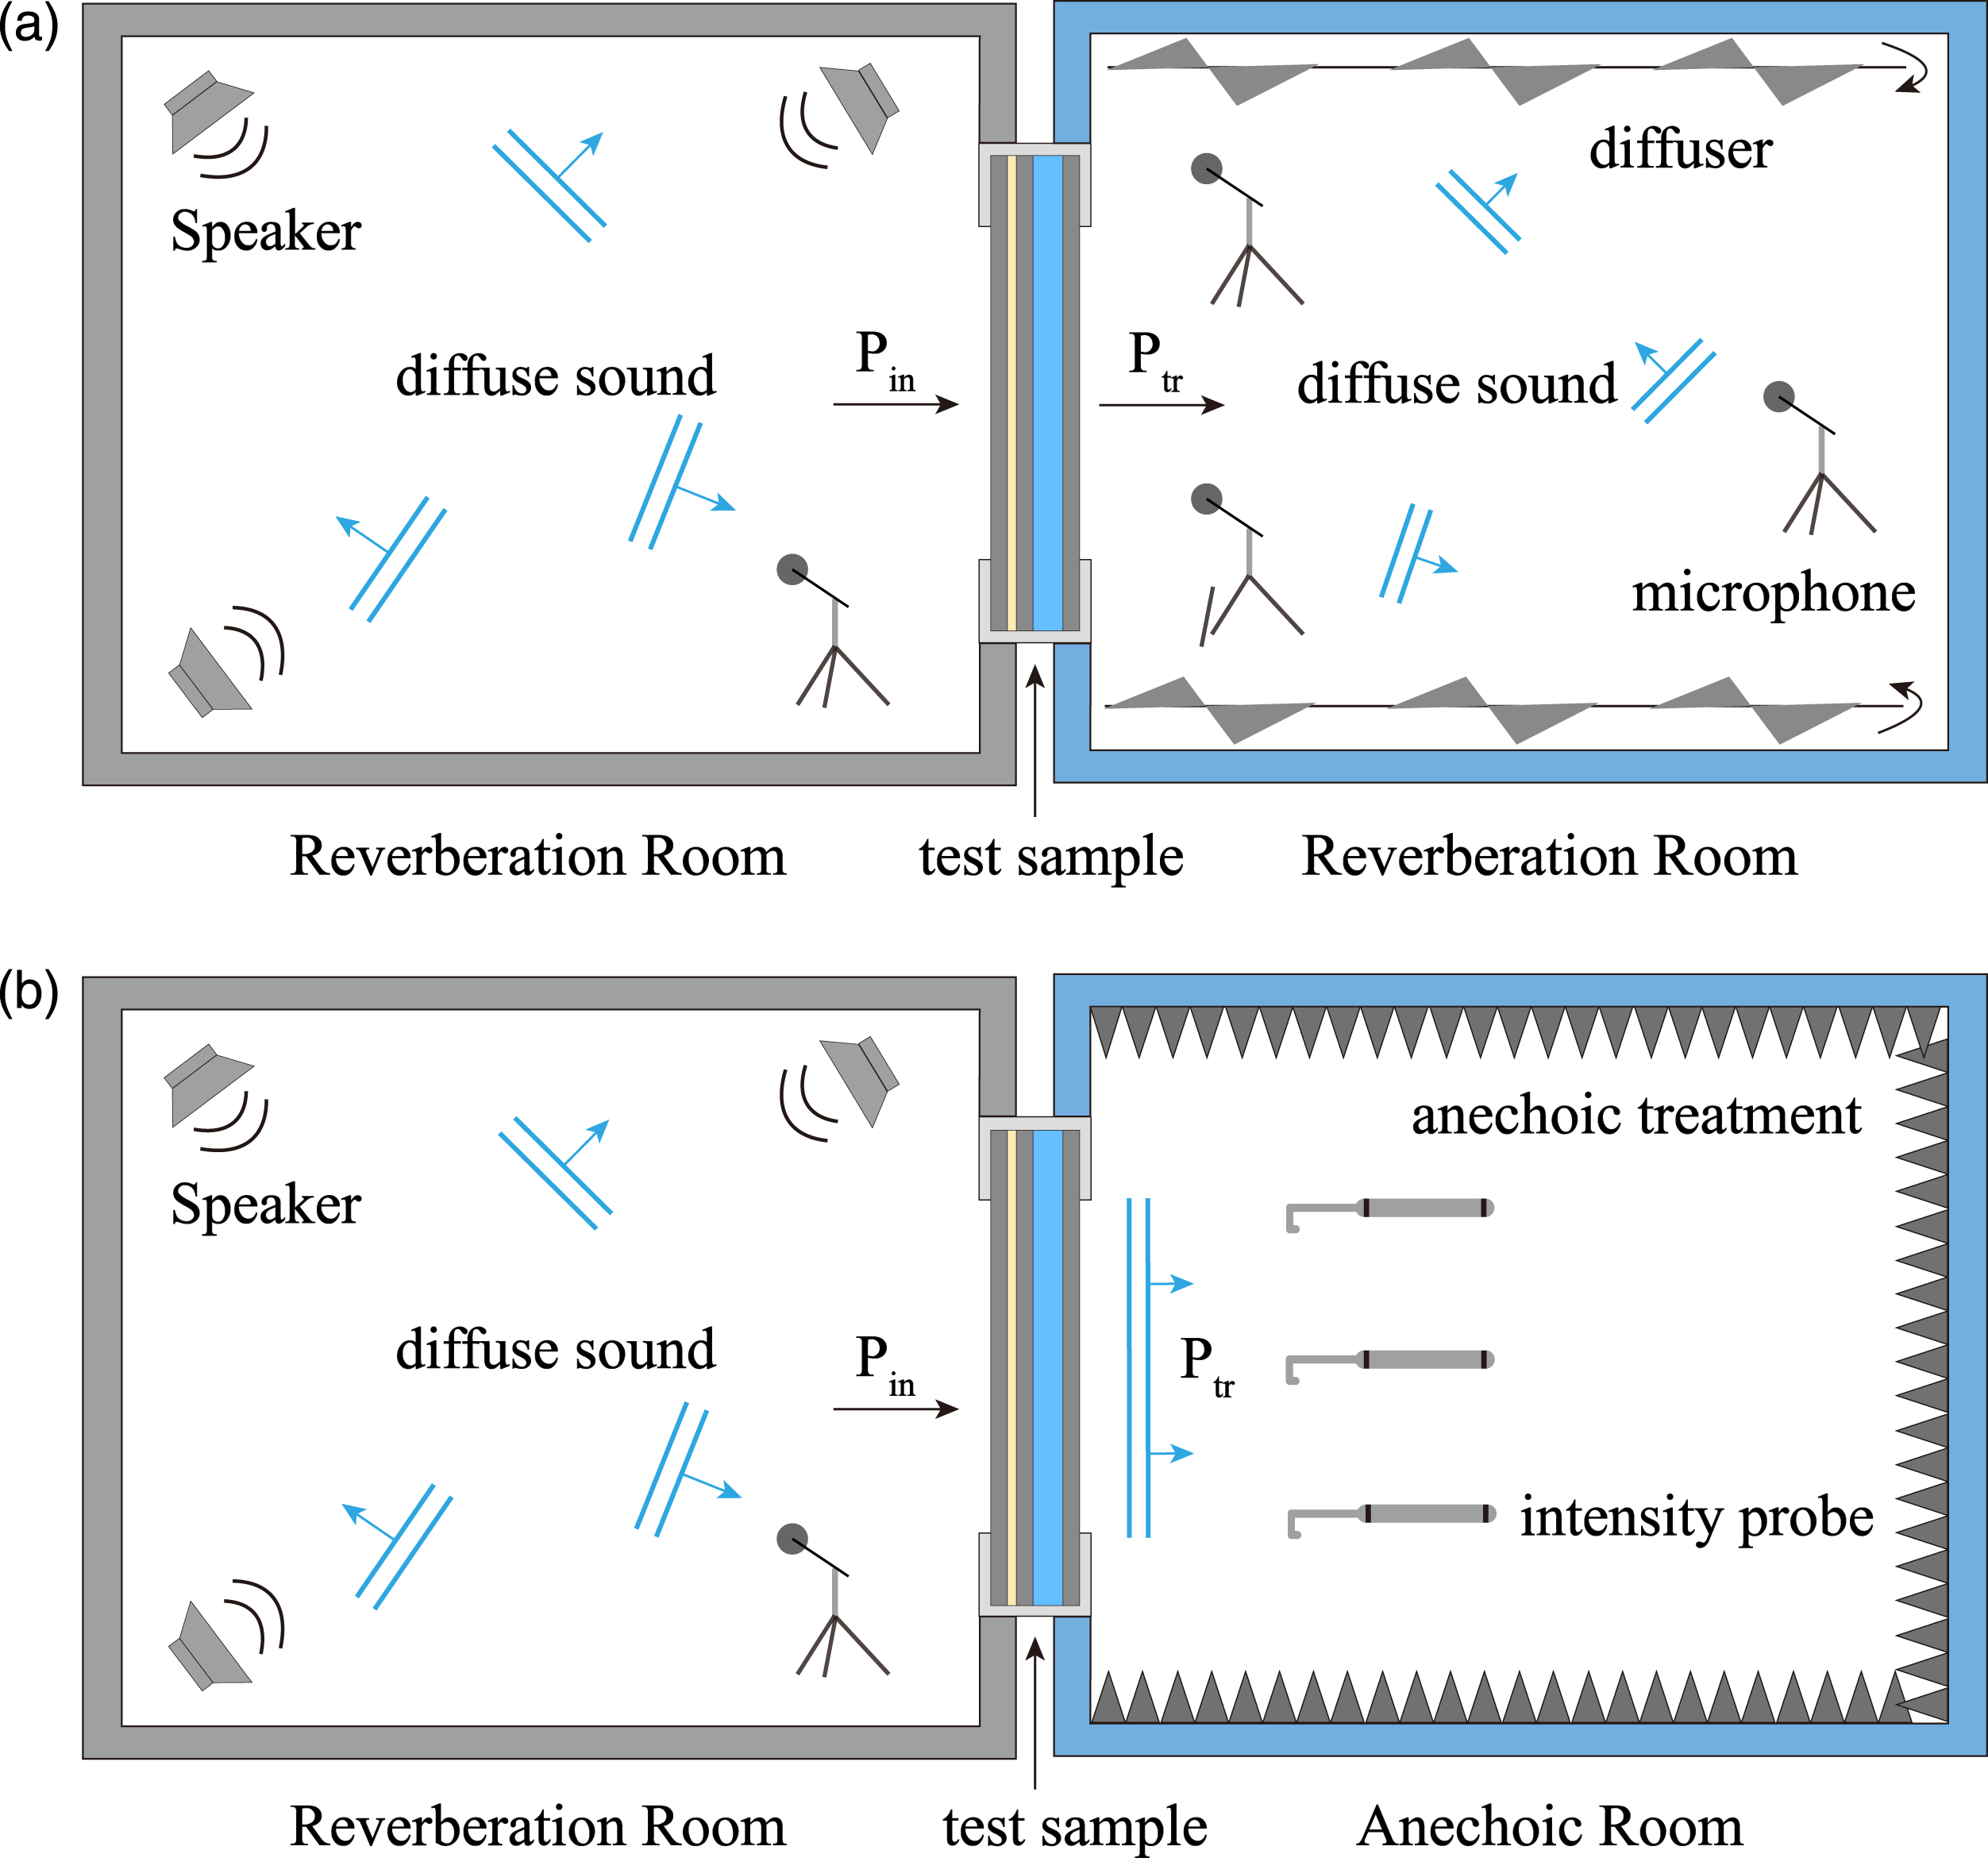


To obtain the incident intensity, the real part of the inner product of the total sound pressure of the diffuse field and its velocity component in the x-direction is calculated, and the result by an additional 1/2 since only the incident component is used. Where

The velocity component in the

By combining (15) and (11) with (10), sound transmission loss between reverberation rooms can be calculated, as shown in equation (16)


This equation’s root-mean-square (RMS) pressure is set to the theoretical value, and the theoretical incident sound power is calculated after integration.
The equations (17) and (11) are incorporated into (10) to derive the formula (18) for calculating the sound transmission loss in the simulated reverberation room-anechoic room case

Materials and multiphysics
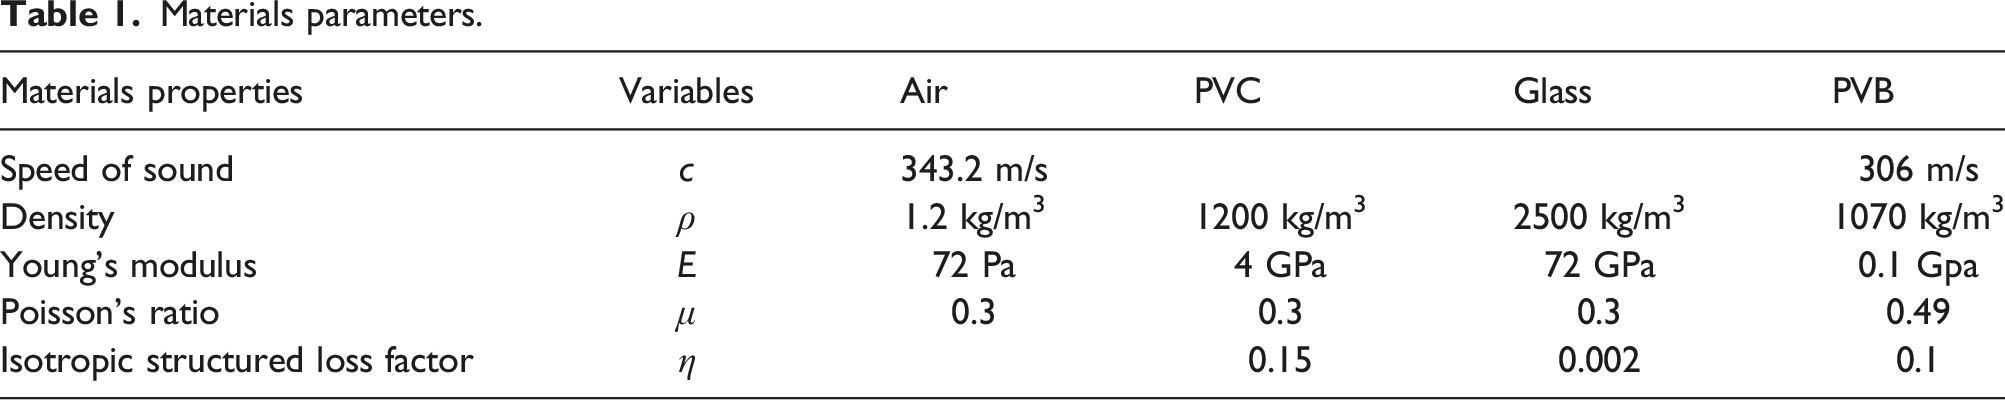
Figure 3 depicts the composition of the insulating laminated glass. Based on traditional insulating glass (glass + air + glass), the outermost glass is pressed with one layer of PVB and another piece of glass by high temperature. Moreover, there is a 3A molecular sieve in the stainless steel middle frame for absorbing water molecules. And Table 1 lists the material parameters. Structure of insulating laminated glass. Materials parameters.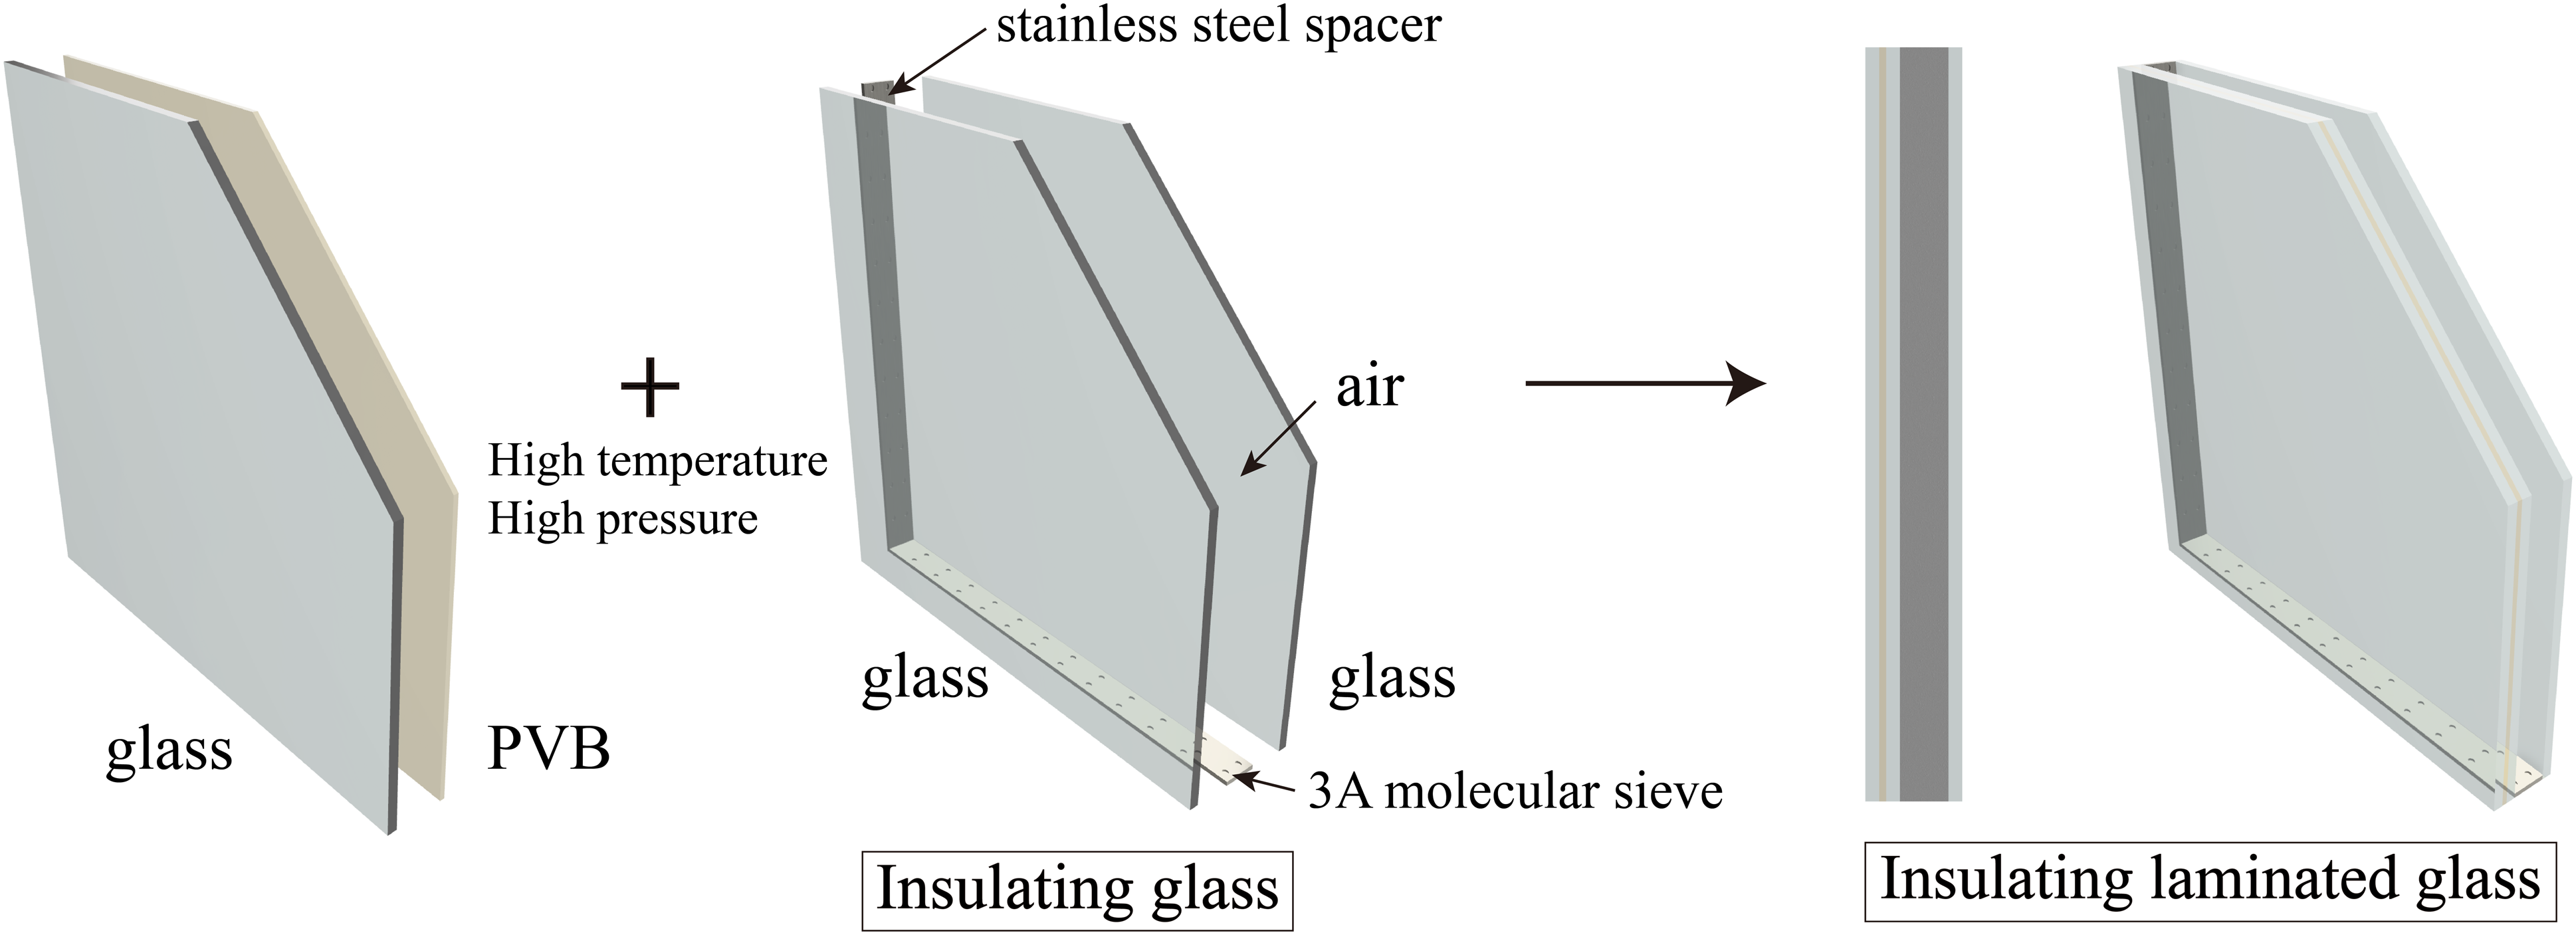
As shown in Figure 4, the model was constructed by placing a glass panel measuring 585 × 620 mm into a PVC frame and positioning it in front of the air domain. In the receiving room, use the air domain terminated by the perfect matching layer (PML) to simulate the ideal reverberant and anechoic room. Multiphysics is the coupling of acoustic and solid mechanics. The PVC frame uses “solid mechanics,” and the whole model uses “pressure acoustics, frequency domain.” To maximize the absorption effect of perfectly matched layers, the entire PML is divided into an 8-layer grid. The entire model was discretized using swept meshing, while free tetrahedral meshing was used in the interior of the PVC frame The mesh diagram of the laminated glass insulation.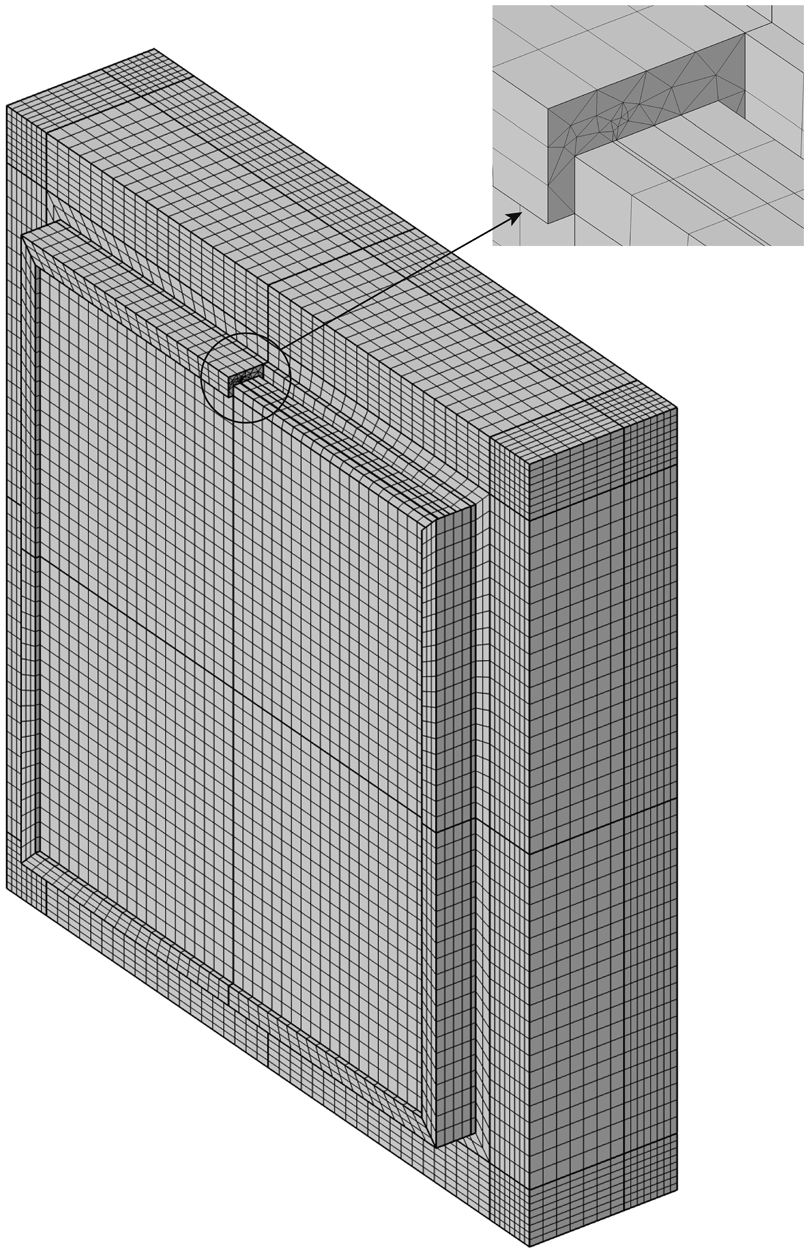
Due to the asymmetry of the insulating laminated glass, the modeling assumes that the PVB layer is on the sound source side by default. The PML is used to absorb all sound waves without reflection and reduce the simulation error. Furthermore, calculations were performed in the 125 Hz to 4000 Hz range with 1/6 octave. To control for bias, set the random seeds to 200, 300, and 400, respectively. Then using the parametric sweep, the results of TL were obtained under three random test conditions.
Results
Simulation validity verification
To validate the accuracy of our proposed model, a comparison was conducted with experimental data from two studies: the 4 + 18A + 6 specification of hollow glass investigated in a 2015 study
22
and the 6 + 0.76 + 6 laminated glass analyzed in a 2022 study.
31
The simulations were performed six times using different random seeds to ensure result reliability. The acquired data were categorized based on the reverberation chamber and the anechoic chamber at the receiving end. All computations were carried out using Z-weighting. The outcomes are presented in Figure 5(a) and (b). The results indicate that due to variations in random seeds, the simulated values for hollow glass exhibit varying degrees of underestimation and overestimation in sound insulation performance, particularly below 1600 Hz. Notably, at 2000 Hz, a significant valley emerges when the random seeds are set at 200 and 400. This can be attributed to a resonant overlap effect occurring at higher frequencies, resulting in a substantial drop in Sound Transmission Class (STC). Nonetheless, when considering the average STC across the six curves, it amounts to 36 dB, which is in close proximity to the experimental STC value of 37 dB. Furthermore, the model’s prediction for laminated glass outperforms that for hollow glass. The simulation accurately replicates the valleys observed in the experimental data at 250 Hz and 2500 Hz for laminated glass. The average STC across the six simulation instances for laminated glass stands at 33.5 dB, aligning closely with the experimental STC value of 34 dB. These findings underscore the efficacy of our model in predicting sound insulation performance for laminated glass configurations. Comparison and analysis of simulated and experimental sound insulation performance. (a) 4 + 18A + 6. (b) 6 + 0.76 + 6.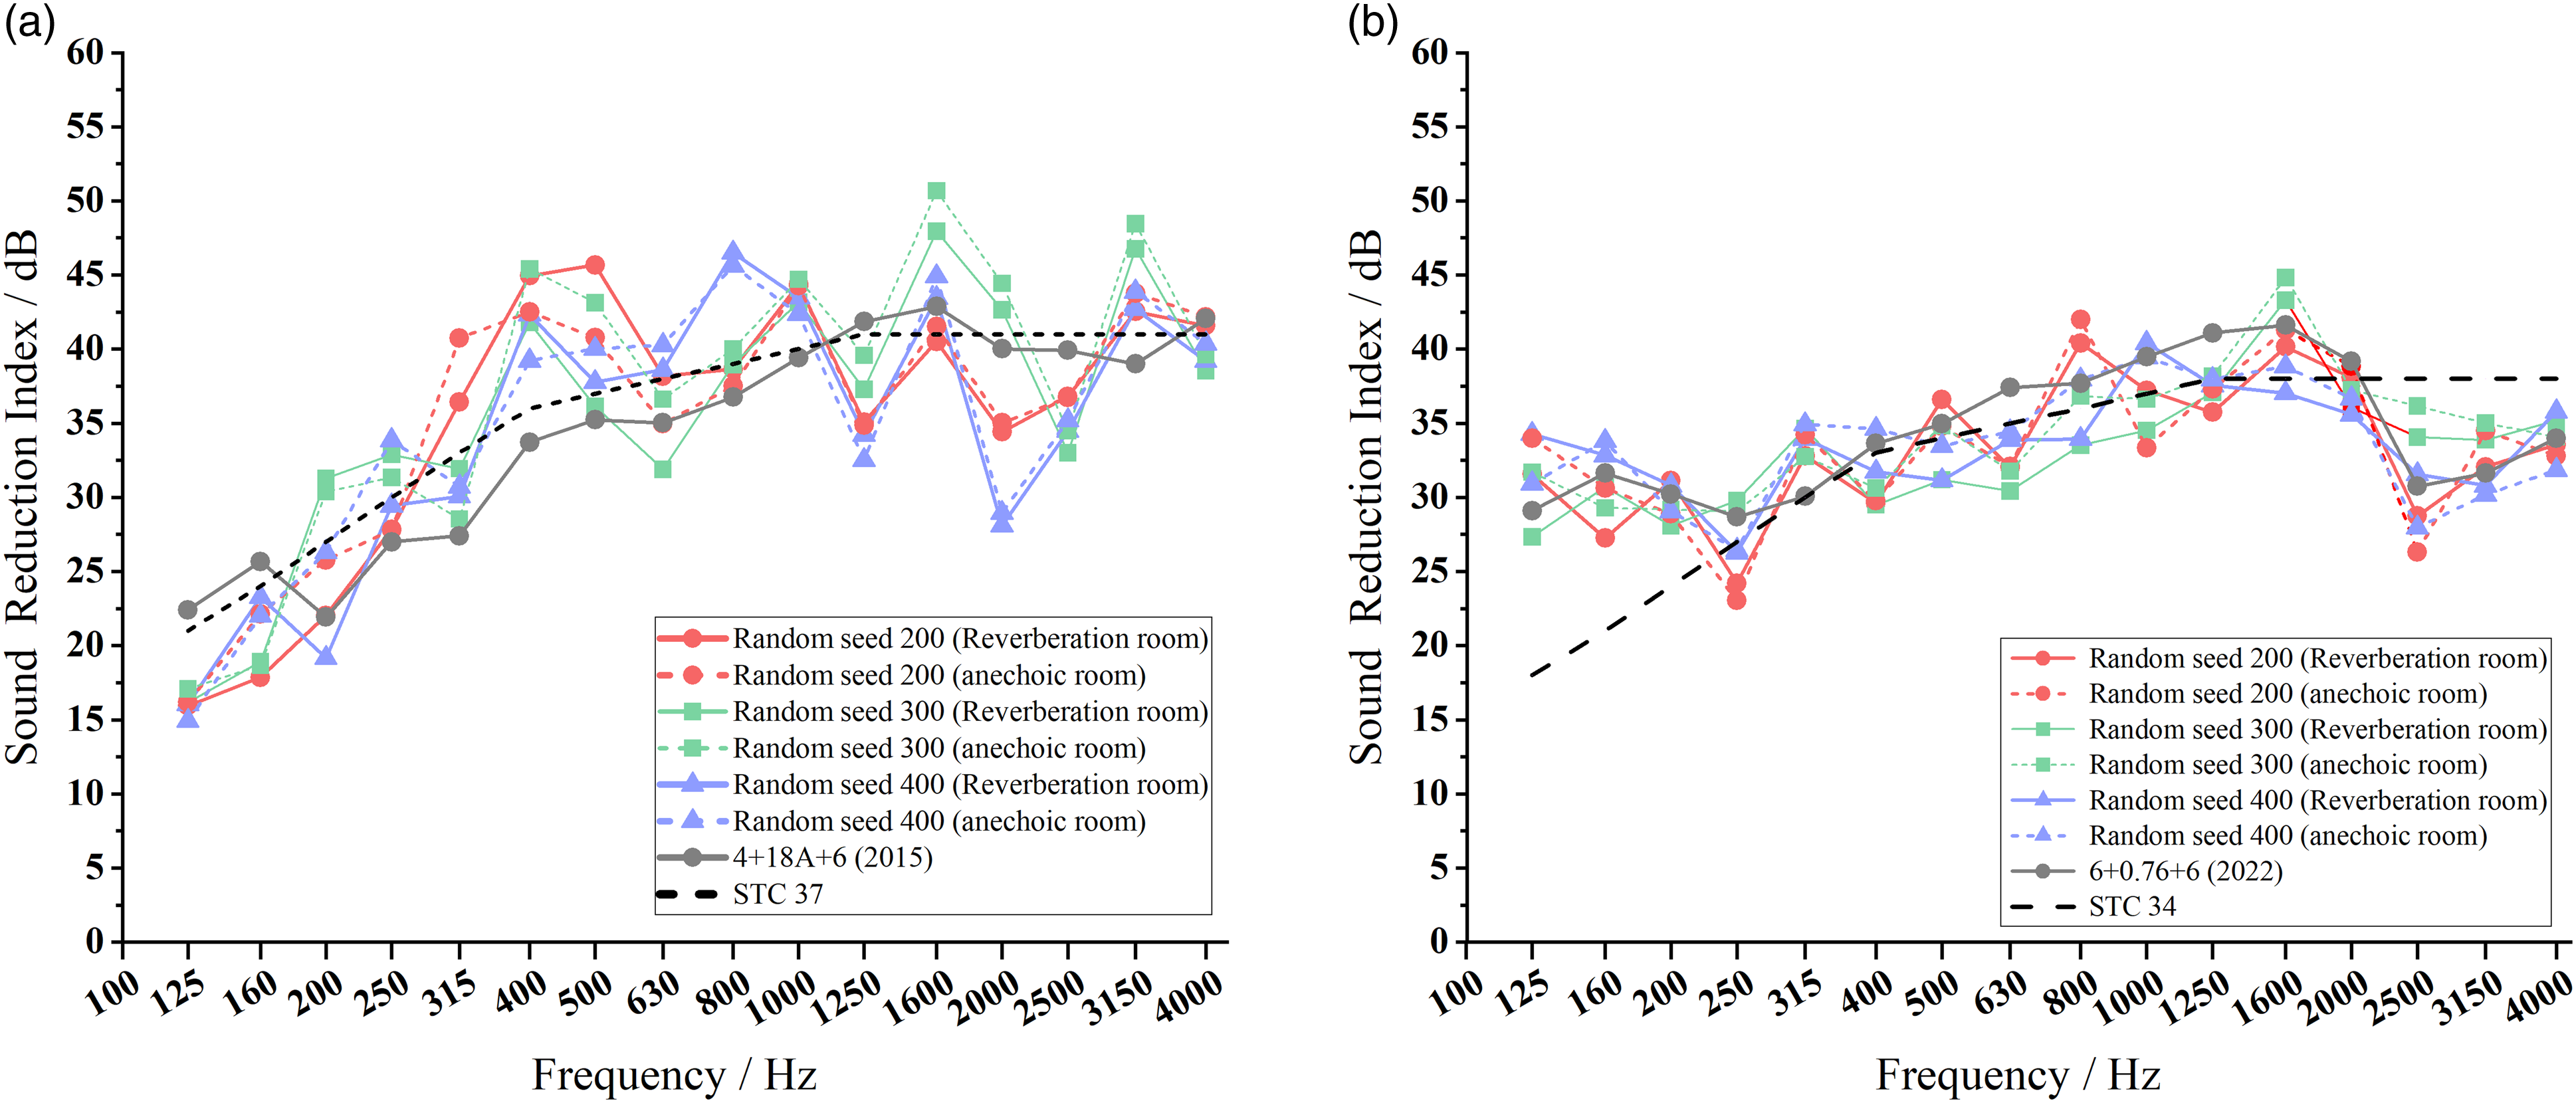
Average sound transmission loss for each frequency range
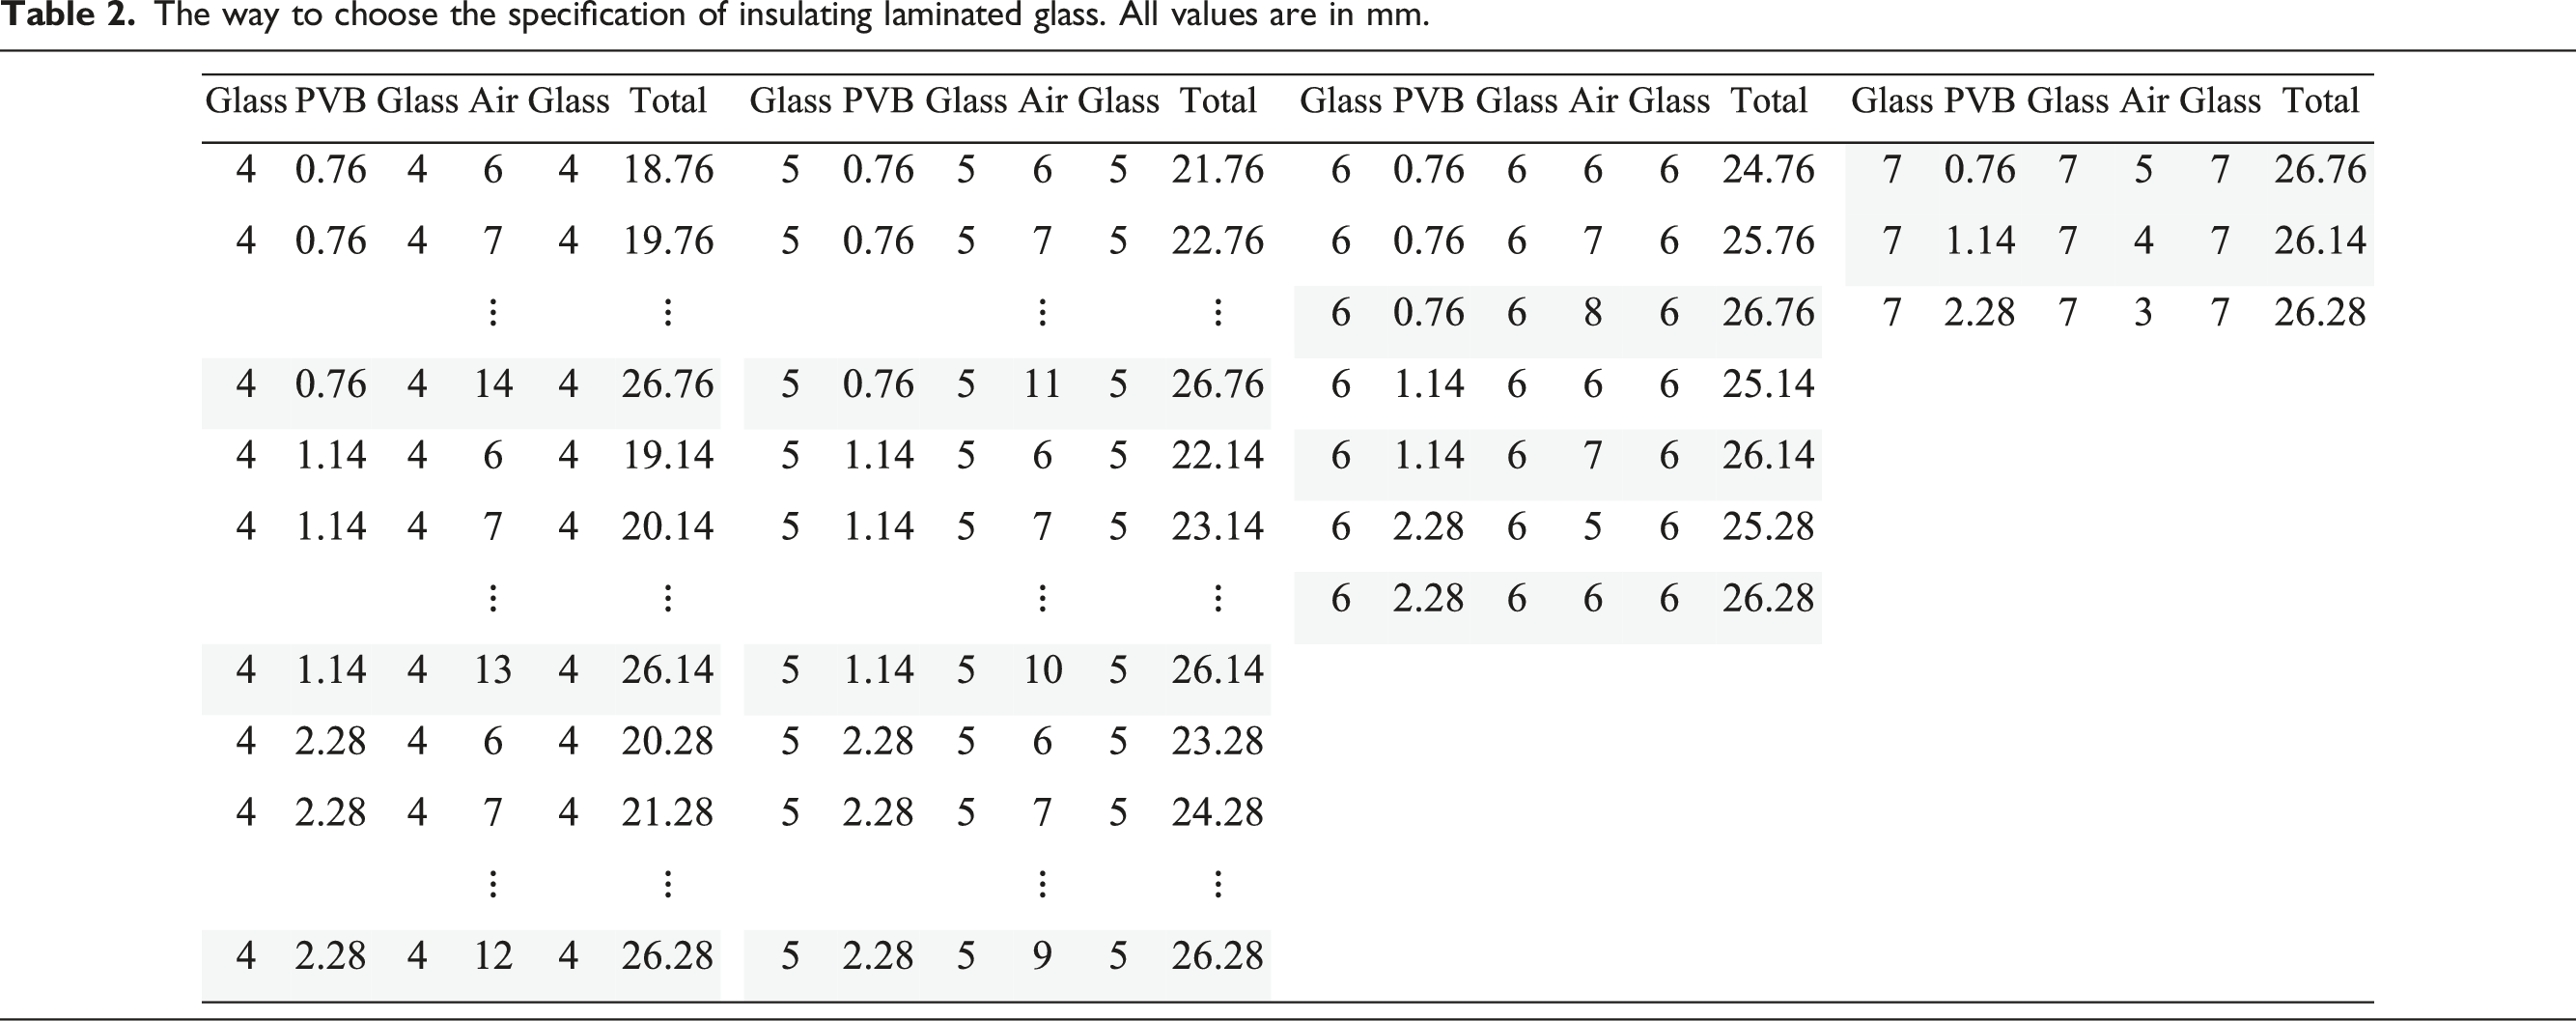
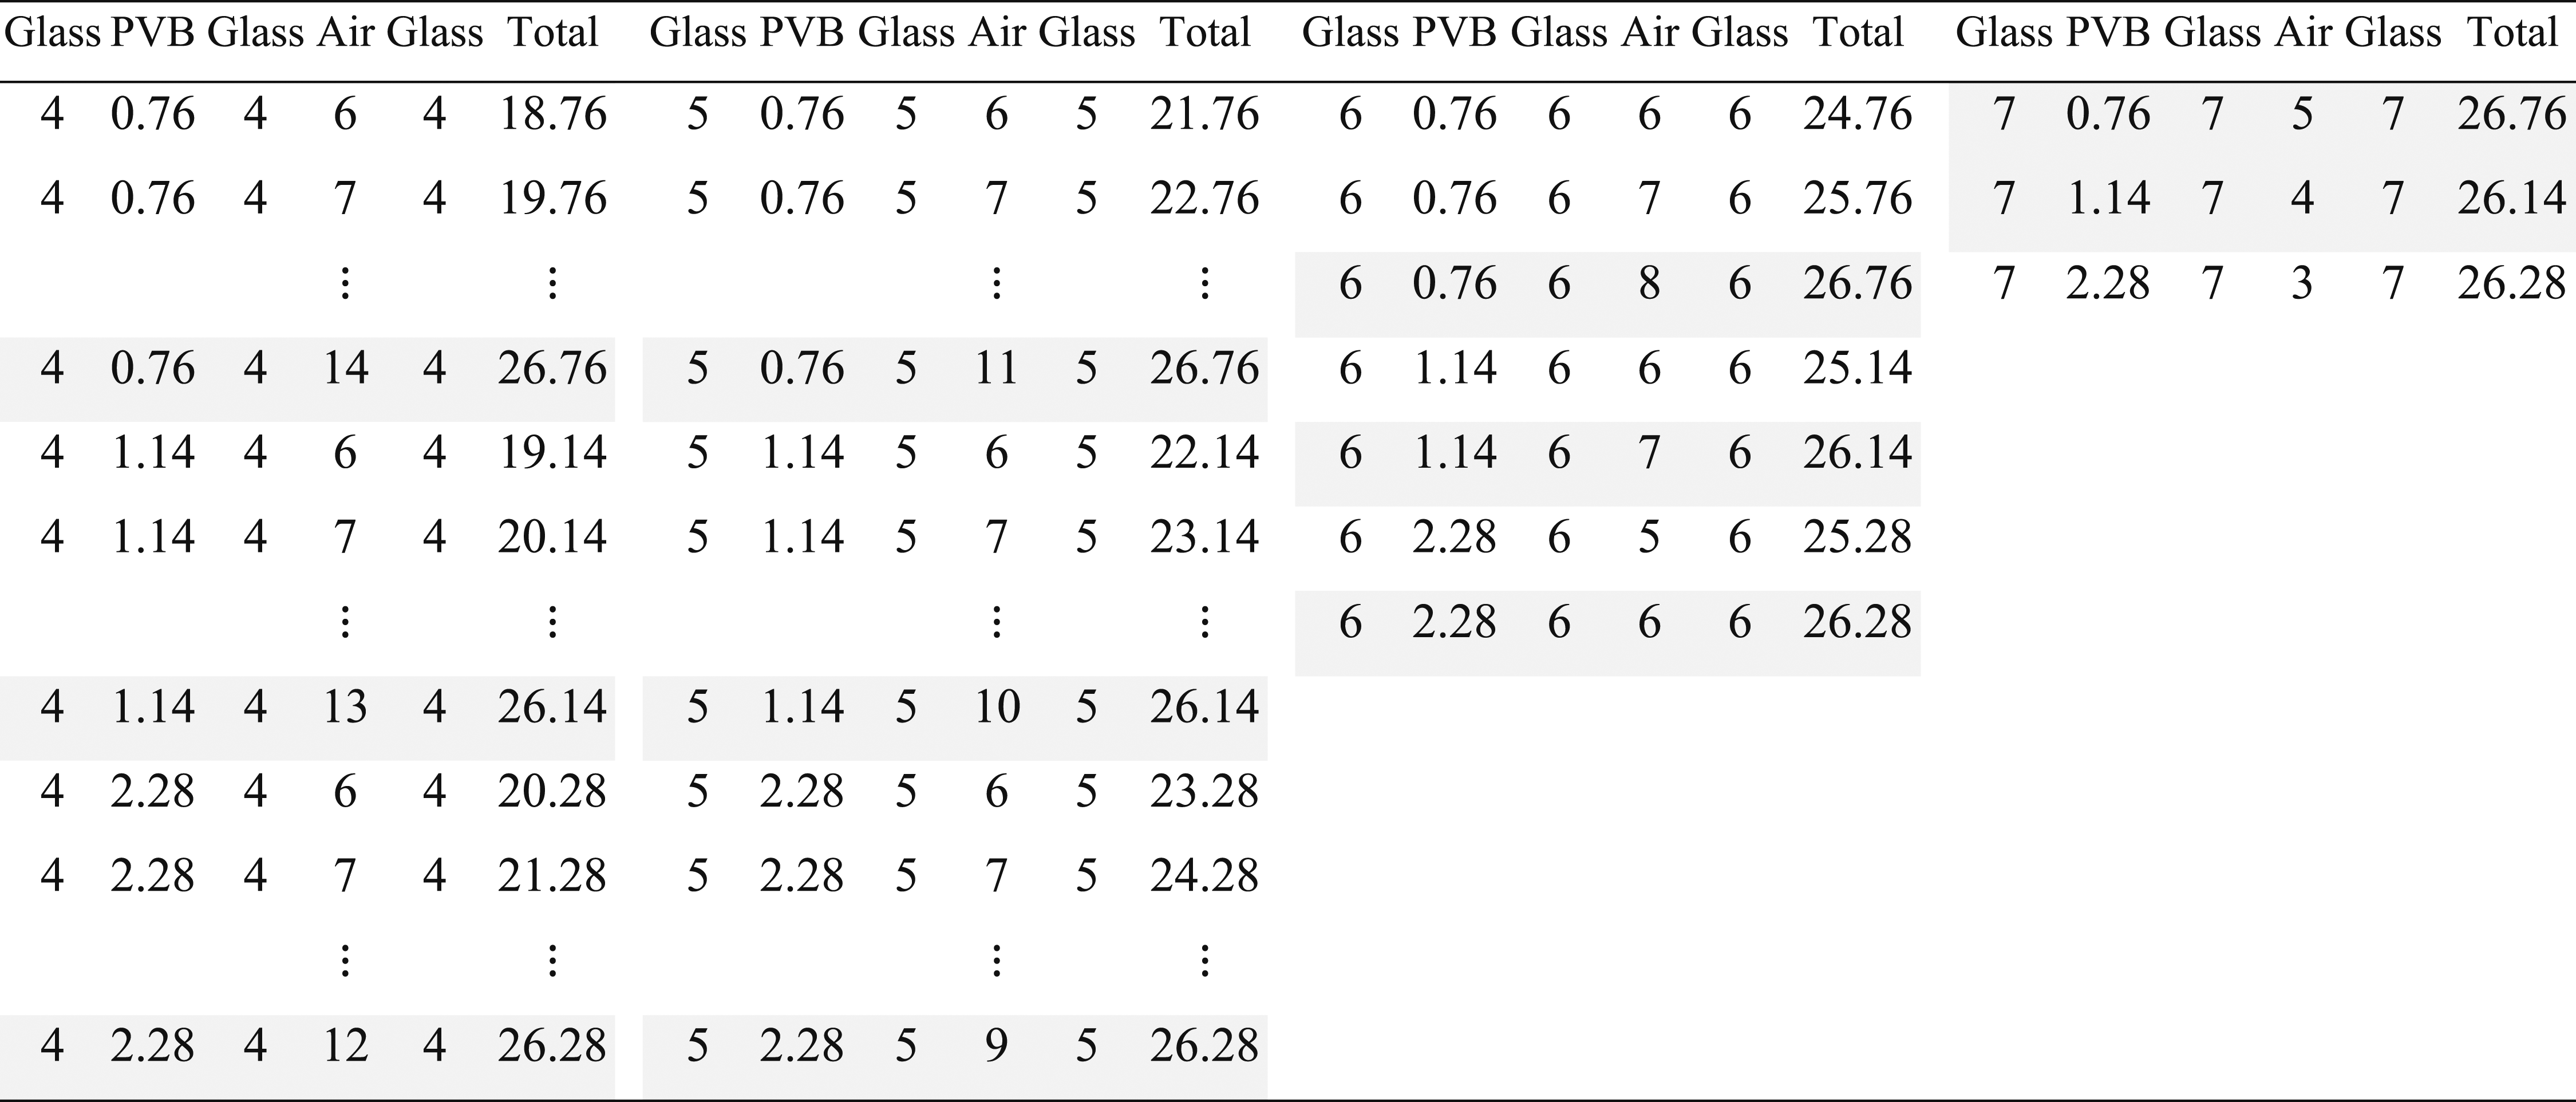
Previous verification confirms that representing the incident sound field as a sum of N uncorrelated plane waves traveling in random directions enables an effective and accurate simulation of the glass's realistic sound insulation effect. Subsequently, additional conditions are established and screened. Considering the limited structure of window frames, single glass is generally not thicker than 27 mm. Moreover, air layer thicknesses below 4 mm are excluded from consideration, as they are impractical to produce and too narrow to meet the basic sound insulation requirements.
The way to choose the specification of insulating laminated glass. All values are in mm.
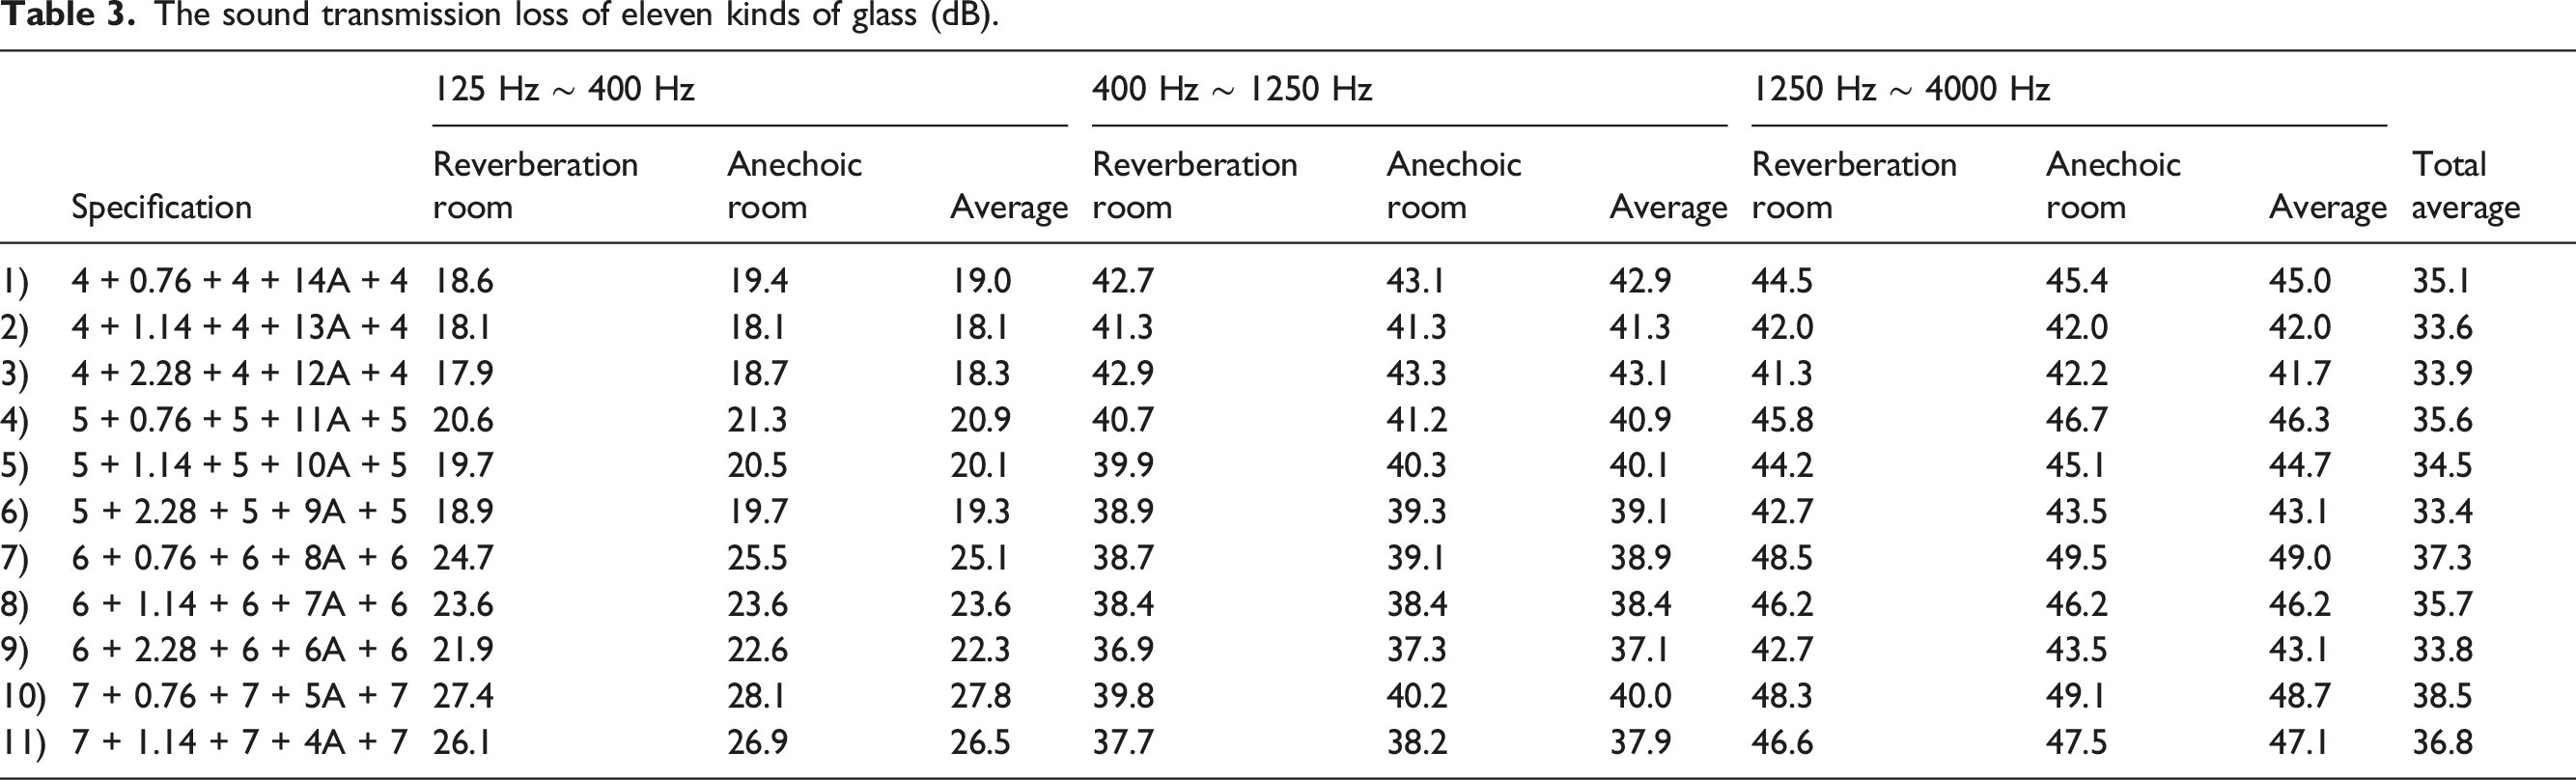
The sound transmission loss of eleven kinds of glass (dB).
Additionally, as this simulation does not incorporate the two-room model, it precludes the use of laboratory measurement methods (which typically add a correction value after discerning sound pressure level differences) to determine transmission loss. Instead, transmission loss is computed using formulas (16) and (18), based on the ratio of incident power to transmitted power. These results exhibit universal applicability and are not merely contingent upon the variations in internal and external sound pressure levels observed in experimental.
Table 3 shows that: 1) In the insulating laminated glass with three pieces of glass of the same thickness (e.g., specifications 1, 2, and 3), the sound insulation is more effective when the air layer is thicker and the PVB is thinner. 2) When the total thickness is approximately the same, the thicker the glass (e.g., specification 1, 4, 7, and 10), the sound insulation effect is more noticeable in the low frequency range (19 dB ∼ 27.8 dB) than the high frequency range (45 dB ∼ 49 dB). The thicker the air is, the better the sound insulation effect in the mid frequency band. 3) The 7 + 0.76 + 7 + 5A + 7 is the best insulating laminated glass among all samples, with the highest TL of 38.5 dB at the closest 27 mm thickness.
Sound transmission loss and modal analysis
To investigate the differences in TL between the eleven kinds of glass, the glass samples were categorized into four groups based on the thickness of each individual piece. Figure 6(a)–(c) show the TL for three kinds of laminated insulating glass. Each comprises three pieces of 4 mm glass and is divided into two cases (reverberant room-reverberant room and reverberant room-anechoic room). Each case is calculated three times with different random seeds. Sound transmission loss of eleven kinds of glass from 125 Hz to 4000 Hz. (a) 4 + 0.76 + 4 + 14A + 4, (b) 4 + 1.14 + 4 + 13A + 4, (c) 4 + 2.28 + 4 + 12A + 4, (d) 5 + 0.76 + 5 + 11A + 5, (e) 5 + 1.14 + 5 + 10A + 5, (f) 5 + 2.28 + 5 + 9A + 5, (g) 6 + 0.76 + 6 + 8A + 6, (h) 6 + 1.14 + 6 + 7A + 6, (i) 6 + 2.28 + 6 + 6A + 6, (j) 7 + 0.76 + 7 + 5A + 7, and (k) 7 + 1.14 + 7 + 4A + 7.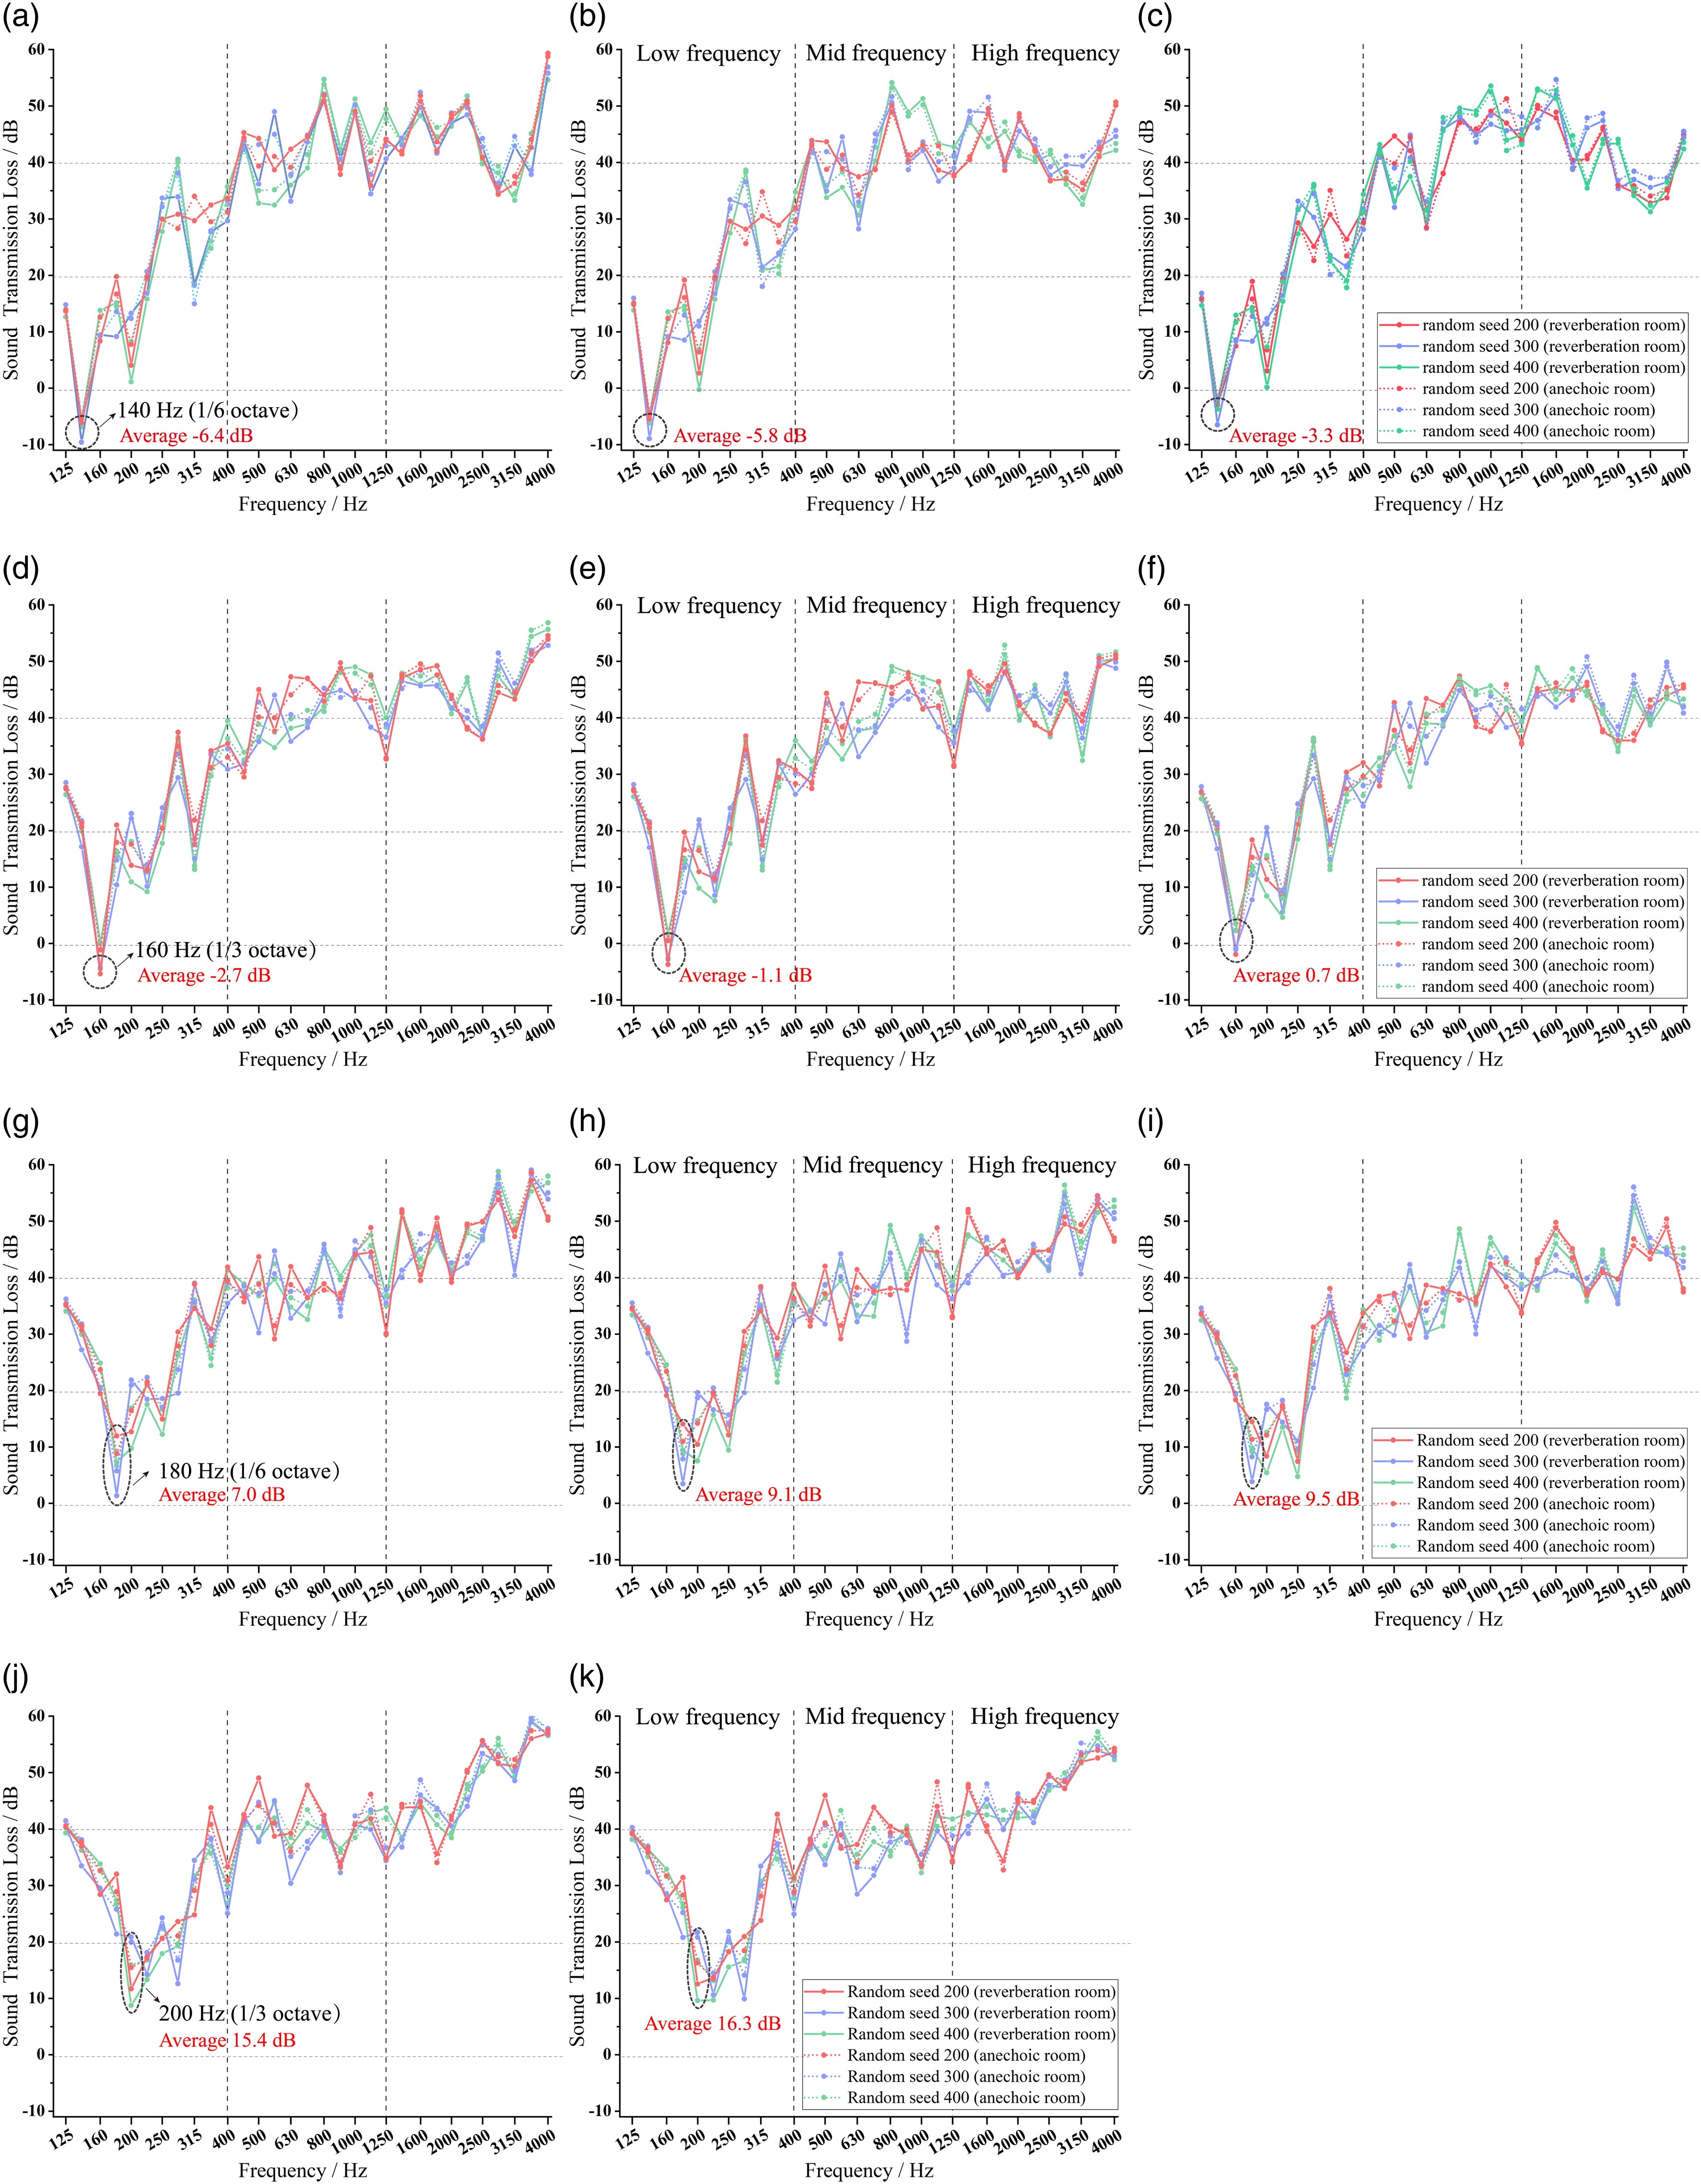
In the low frequency range (125 Hz ∼ 400 Hz), the three kinds of glass exhibit valleys in TL at 140 Hz and 200 Hz due to resonance. The TL of each glass at its first resonant frequency gradually rises by 3.1 dB as the PVB thickness increases. Above 400 Hz, all three types show a similar trend and exhibit valleys at 3150 Hz. Referring to Tables 3, it is evident that the glass with specification 4 + 0.76 + 4 + 14A + 4 demonstrates the highest TL in both the low frequency range and the overall frequency range. This observation suggests that increasing the PVB thickness may enhance TL at the resonant frequency. However, it may not significantly improve TL in the low frequency range. A thicker air layer may present a more effective solution when the total thickness is fixed.
In the subsequent nine subgraphs, the thickness of PVB is increased while maintaining the thickness of three pieces of glass. The TL of each type of glass is increased slightly in its first resonant frequency. Figure 6(d) and (f) show the most significant improvement, which is 3.4 dB. From Figure 6(a), (d), (g), and (j), when the total thickness is all controlled within 27 mm, increasing the thickness of three pieces of glass while maintaining the thickness of PVB can considerably improve the TL at their first resonant frequency—increased from 3.7 dB to 21.9 dB. The glass with the highest TL at all the glass’s first resonant frequency is 7 + 1.14 + 7 + 4A + 7, up to 16.3 dB. Also, the average TL increases from 19 dB to 27.8 dB in the 125 Hz ∼ 400 Hz range. This change remarkably improves the TL for low frequency noise. In the mid frequency range (400 Hz ∼ 1250 Hz), 4 + 2.28 + 4 + 13A + 4 has the best TL with 43.1 dB. In the high frequency range (1250 Hz ∼ 4000 Hz), 7 + 0.76 + 7 + 5A + 7 has the best TL with 49.0 dB.
Figure 7 shows the sound pressure levels, vibration patterns, and stresses for four types of glass at their respective first resonant frequencies. As seen from the sound pressure level maps, the amount of TL of the glass can be reflected by the color of the incident versus the received side. With the simultaneous thickening of the three pieces of glass composing the insulating laminated glass, it is evident from the side view that the sound insulation amounts of the four kinds of glass at their respective first resonance frequencies increase substantially. The sound pressure level, patterns, and stress maps for four kinds of glass at the frequencies with the worst sound insulation performance. (140 Hz, 160 Hz, 180 Hz, and 200 Hz). (a) 4 + 0.76 + 4 + 14A + 4 140 Hz, (b) 5 + 0.76 + 5 + 11A + 5 160 Hz, (c) 6 + 0.76 + 6 + 8A + 6 180 Hz, (d) 7 + 0.76 + 7 + 5A + 7 200 Hz.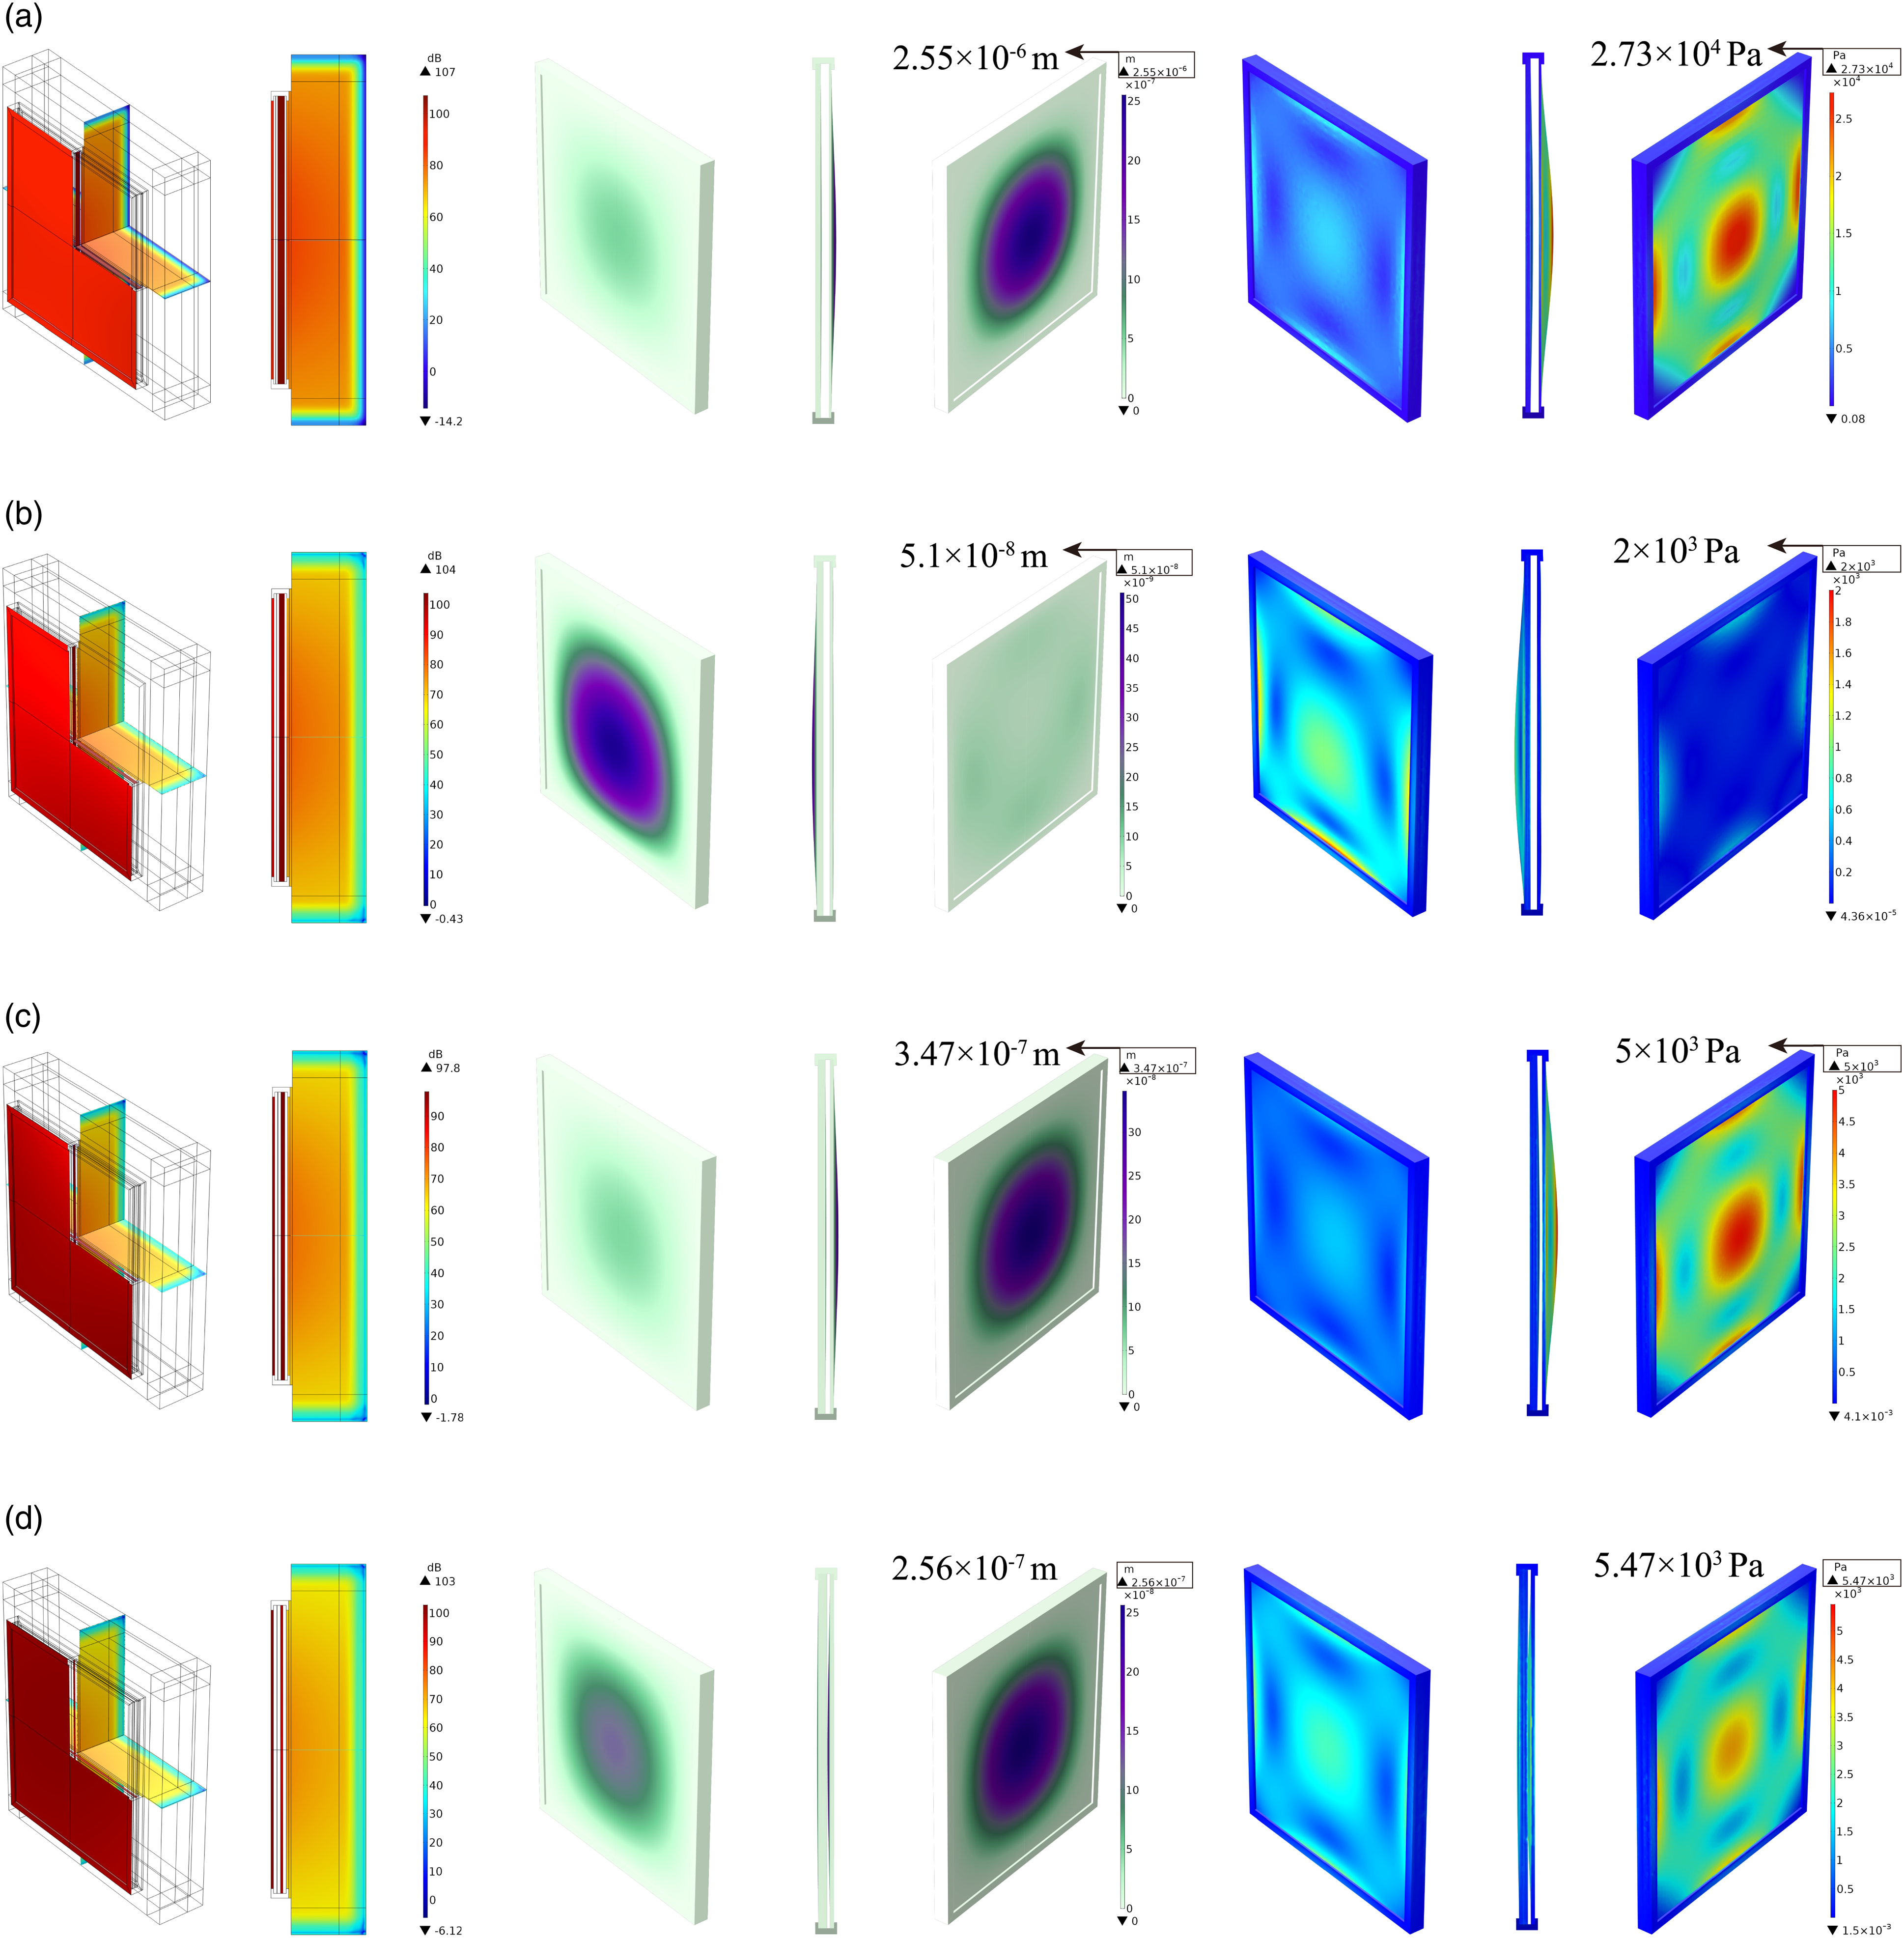
According to the vibration patterns maps, the 4 + 0.76 + 4 + 14A + 4, 6 + 0.76 + 6 + 8A + 6, and 7 + 0.76 + 7 + 5A + 7 all have a more concentrated displacement at the center of glass on the receive side, while 5 + 0.76 + 5 + 11A + 5 is the opposite. The displacement amplitude of 4 + 0.76 + 4 + 14A + 4 is the largest, reaching 2.55 × 10⁻⁶ m. The 5 + 0.76 + 5 + 11A + 5 is the smallest, with only 2% of the displacement of the former. In addition, the other two kinds of glass displacement are in between them.
From the stress maps, the stresses of 4 + 0.76 + 4 + 14A + 4 and 6 + 0.76 + 6 + 8A + 6 are more uniformly distributed on the incident side of the two glass. On the receiving side, there are apparent stress concentrations in the center and frame of the three kinds of glass, except for 5 + 0.76 + 5 + 11A + 5. Among them, the innermost glass stress of the two kinds of insulating laminated glass 4 + 0.76 + 4 + 14A + 4 and 6 + 0.76 + 6 + 8A + 6 is facing the room, while the stress of 7 + 0.76 + 7 + 5A + 7 is squeezing its own air layer.
Natural frequency analysis
Figure 7(b) shows that 5 + 0.76 + 5 + 11A + 5 has no apparent stress concentration on the source side and receive side at 200 Hz. It seems no structural resonance has occurred. However, Figure 6(d) and (j) show that the average TL of 5 + 0.76 + 5 + 11A + 5 at its first resonant frequency is still 18.1 dB lower than that of 7 + 0.76 + 7 + 5A + 7. Since the TL is calculated using 1/6 octave, 160 Hz is used instead of a specific range of frequency intervals on the left and right sides, and the frequency that causes resonance may be closer to 160 Hz instead of 160 Hz. Based on the above conjecture, all natural frequencies of the eleven pieces of insulating laminated with PVC frame glass before 400 Hz were calculated, as shown in Figure 8. Natural frequencies and distribution characteristics of eleven types of laminated insulating glass in the low frequency range (125 Hz–400 Hz).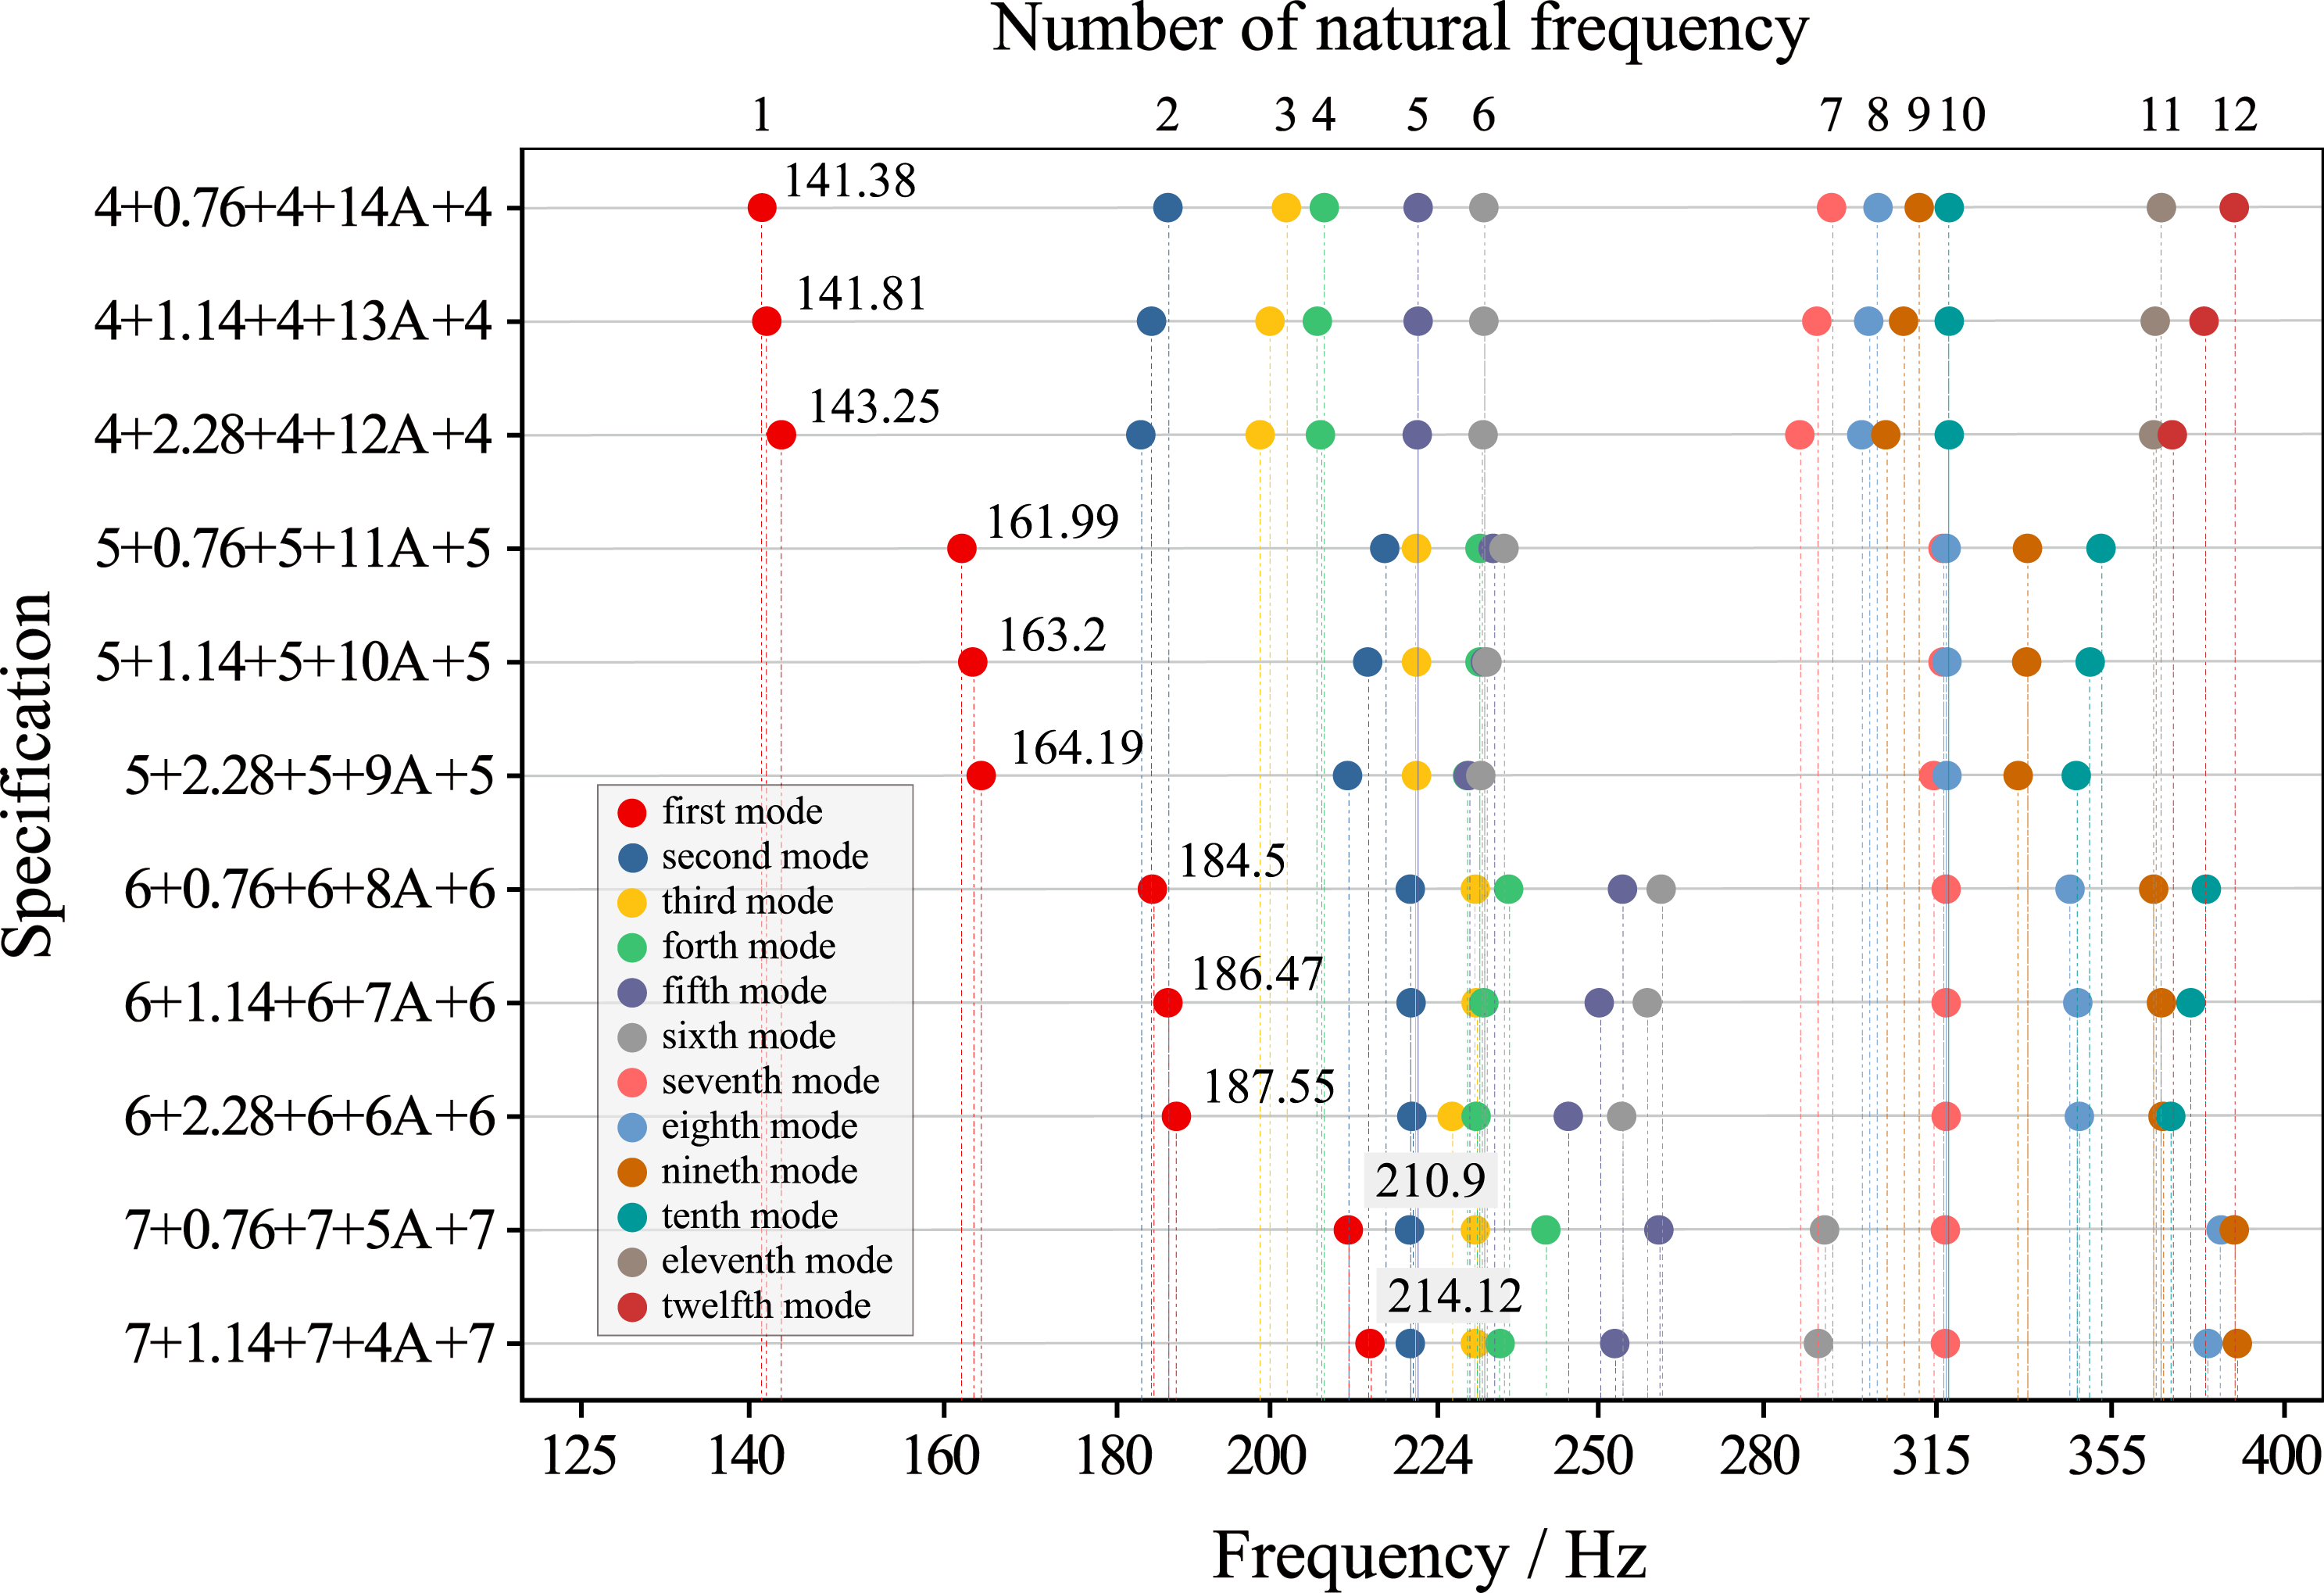
When the PVB thickness of four types of insulating laminated glass is increased from 0.76 mm to 2.28 mm, the first resonant frequencies could be increased slightly. When the three pieces of glass are increased from 4 mm to 7 mm simultaneously, the first resonant frequencies of these four types of glass are elevated in approximately 20 Hz increments, located around 140 Hz, 160 Hz, 180 Hz, and 200 Hz, respectively.
In addition, the number of natural frequencies is also an important indicator of the sound insulation performance of glass. The fewer the number of natural frequencies in the low frequency range of any glass, the less likely it is to be resonated by external excitation. The first type of insulating laminated glass consisting of three pieces of 4 mm glass has twelve resonant frequencies within 400 Hz. However, two kinds of glass, 7 + 0.76 + 7 + 5A + 5 and 7 + 1.14 + 7 + 4A + 7, have only nine natural frequencies because the enhancement of glass thickness enhances the structural stiffness and makes it less likely to resonate when subjected to more stress.
Stress analysis
Combining Figures 7 and 8, the surface stress on the source and the received sides of the four kinds of glass at their respective first resonant frequencies is plotted in Figure 9. The legends of the four graphs use the same range. Surface stress distribution on the source and receive sides of four types of glass at their respective first resonant frequencies. (a) 4 + 0.76 + 4 + 14A + 4. (b) 5 + 0.76 + 5 + 11A + 5. (c) 6 + 0.76 + 6 + 8A + 6. (d) 7 + 0.76 + 7 + 5A + 7.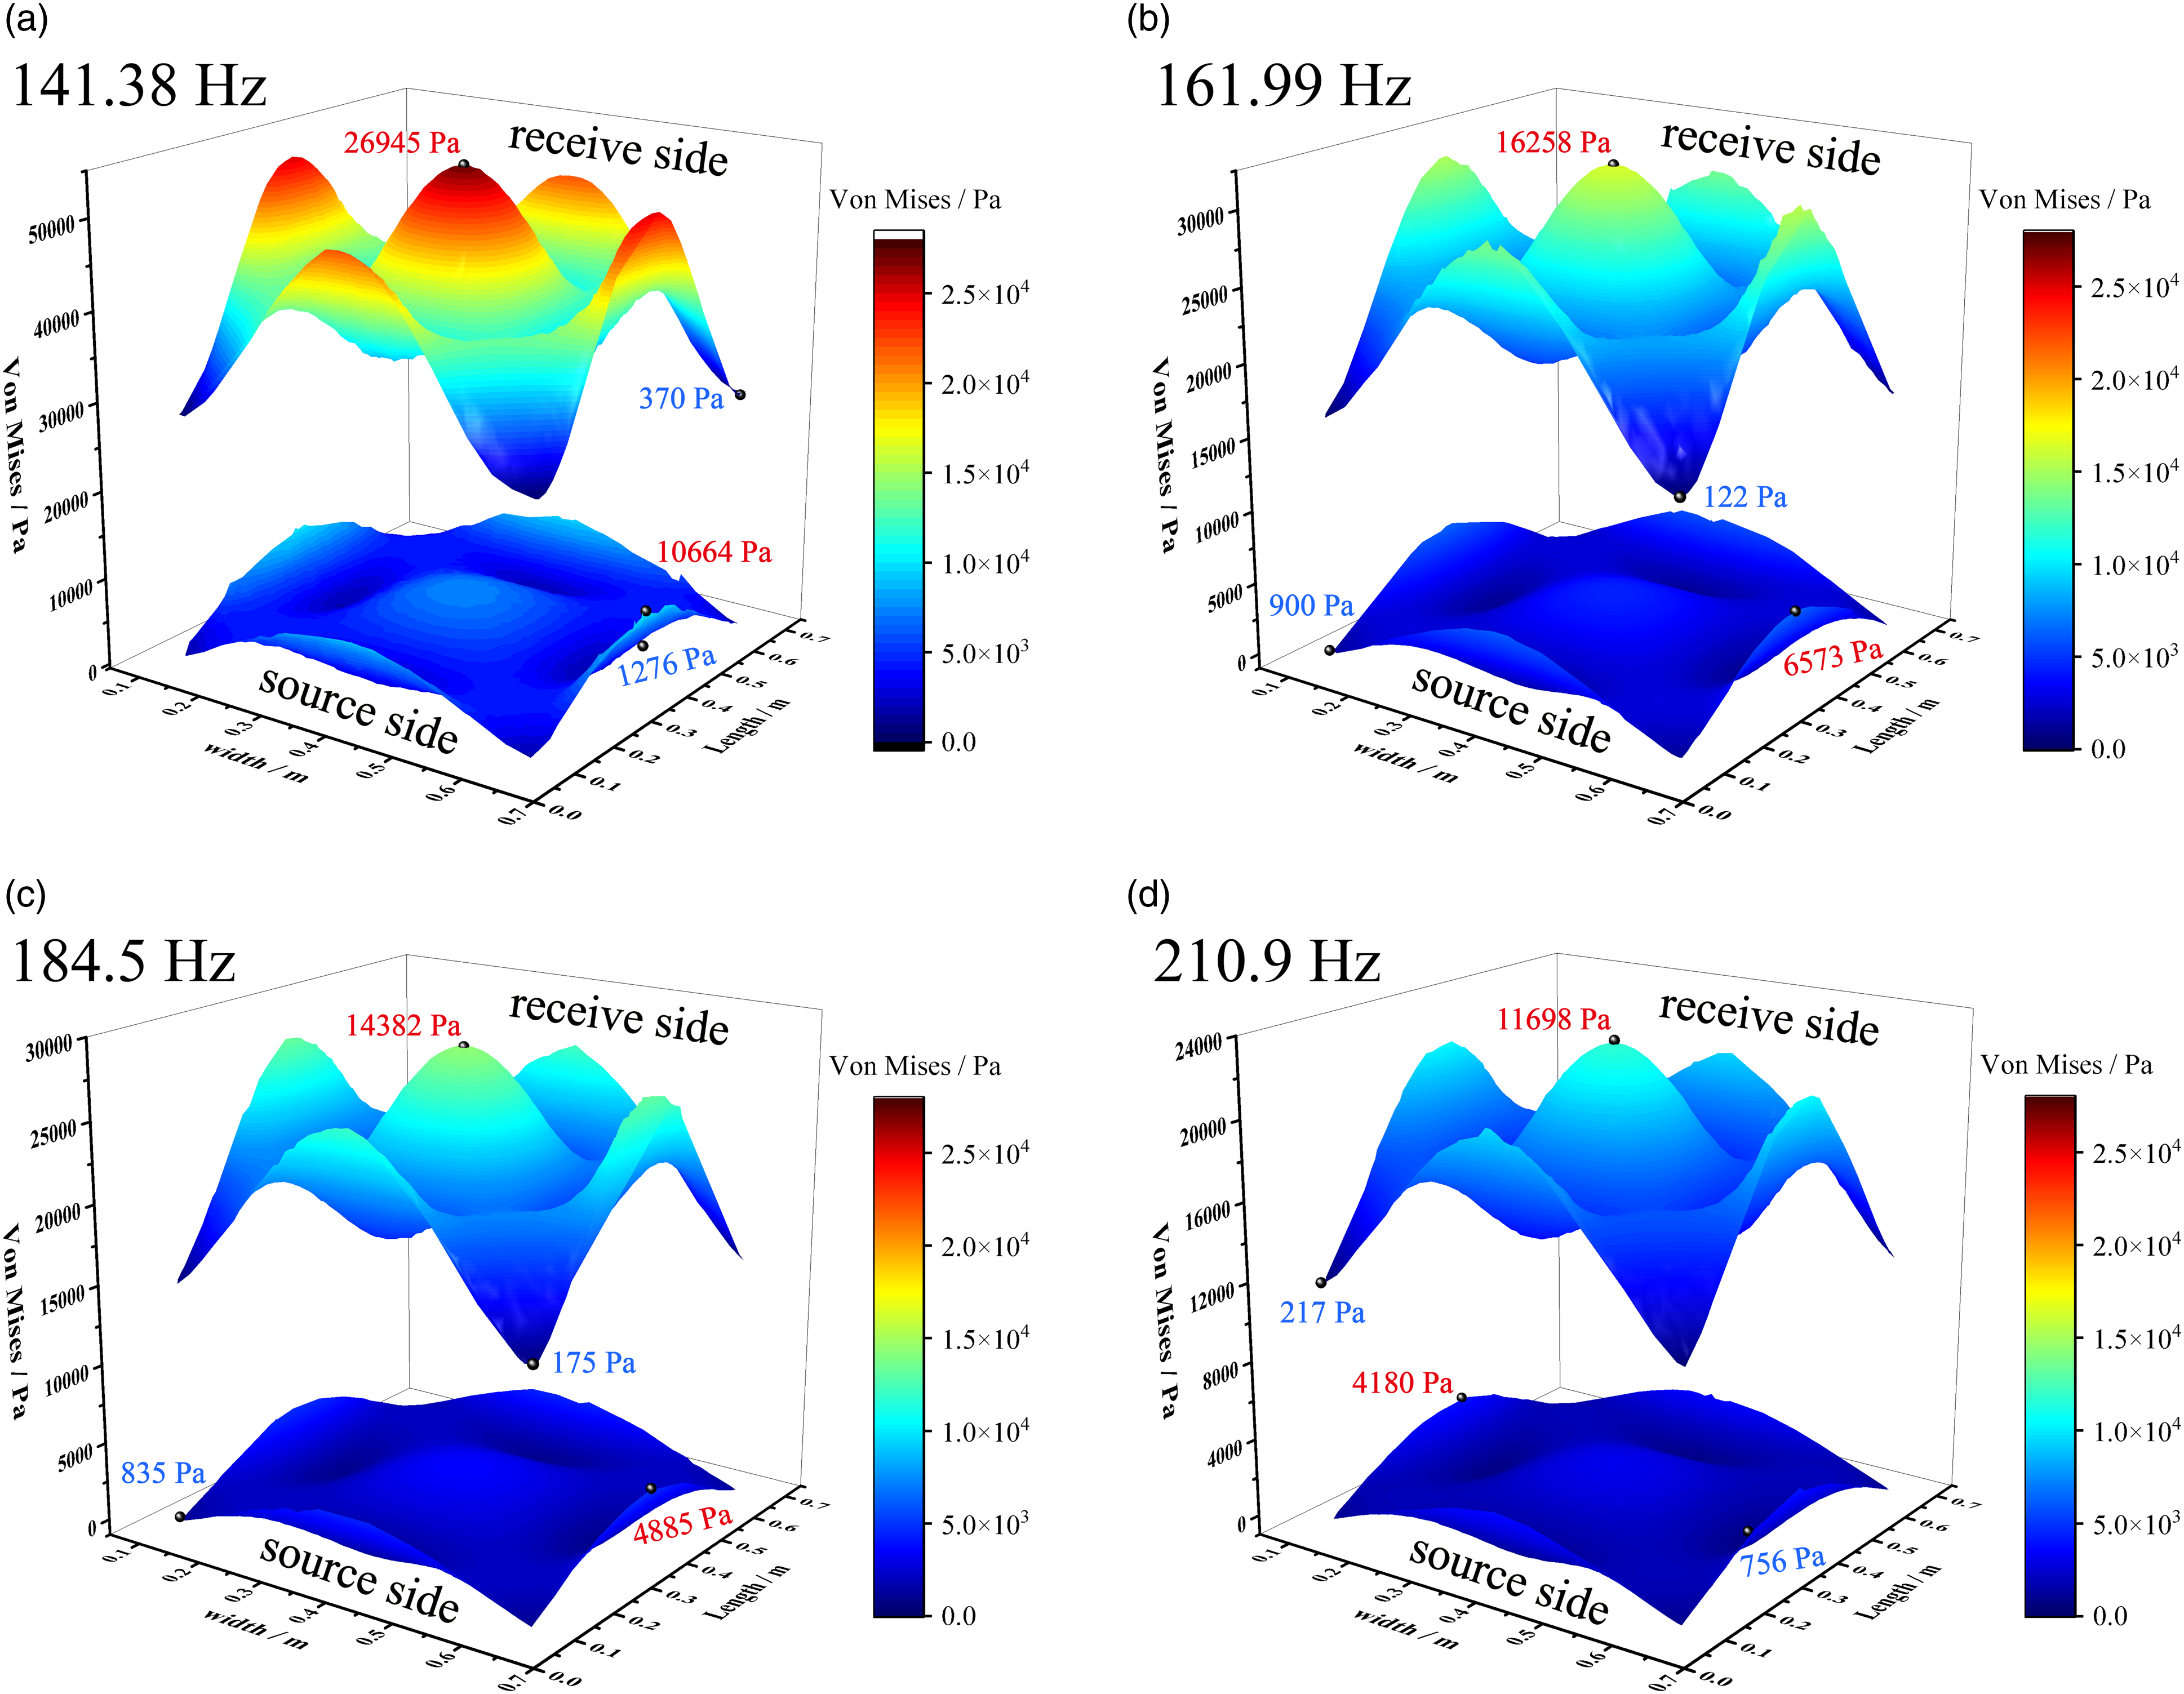
Figure 9(a) shows that the peak value of the receive side stress of 4 + 0.76 + 4 + 14A + 4 reaches 26945 Pa, and the minimum value is 370 Pa, the maximum value of four kinds of glass. When the three pieces of glass are increased from 4 mm to 7 mm simultaneously, the magnitude of the stress peak on the receive side gradually reduces to 11698 Pa. By combining with Figure 6(a), (d), (g), and (j), it can be concluded that the glass surface, when subjected to random plane waves, exhibits varying stress magnitudes due to different glass specifications. Consequently, the stress induces structural displacement, leading to diverse sound insulation at the first resonant frequency. The TL of 7 + 0.76 + 7 + 5A + 7 at 200 Hz is the highest among all glass because increasing the glass’s thickness improves the structural rigidity. The peak and average stress on the source and receive sides are the minimum, making it maintain good sound insulation performance during resonance.
Discussions
Based on the results, a sound insulation performance rule can be inferred for insulating laminated glass with constant total thickness. The glass can be classified into four zones according to the observed trend, as illustrated in Figure 10. The law of sound insulation performance of insulating laminated glass with constant total thickness.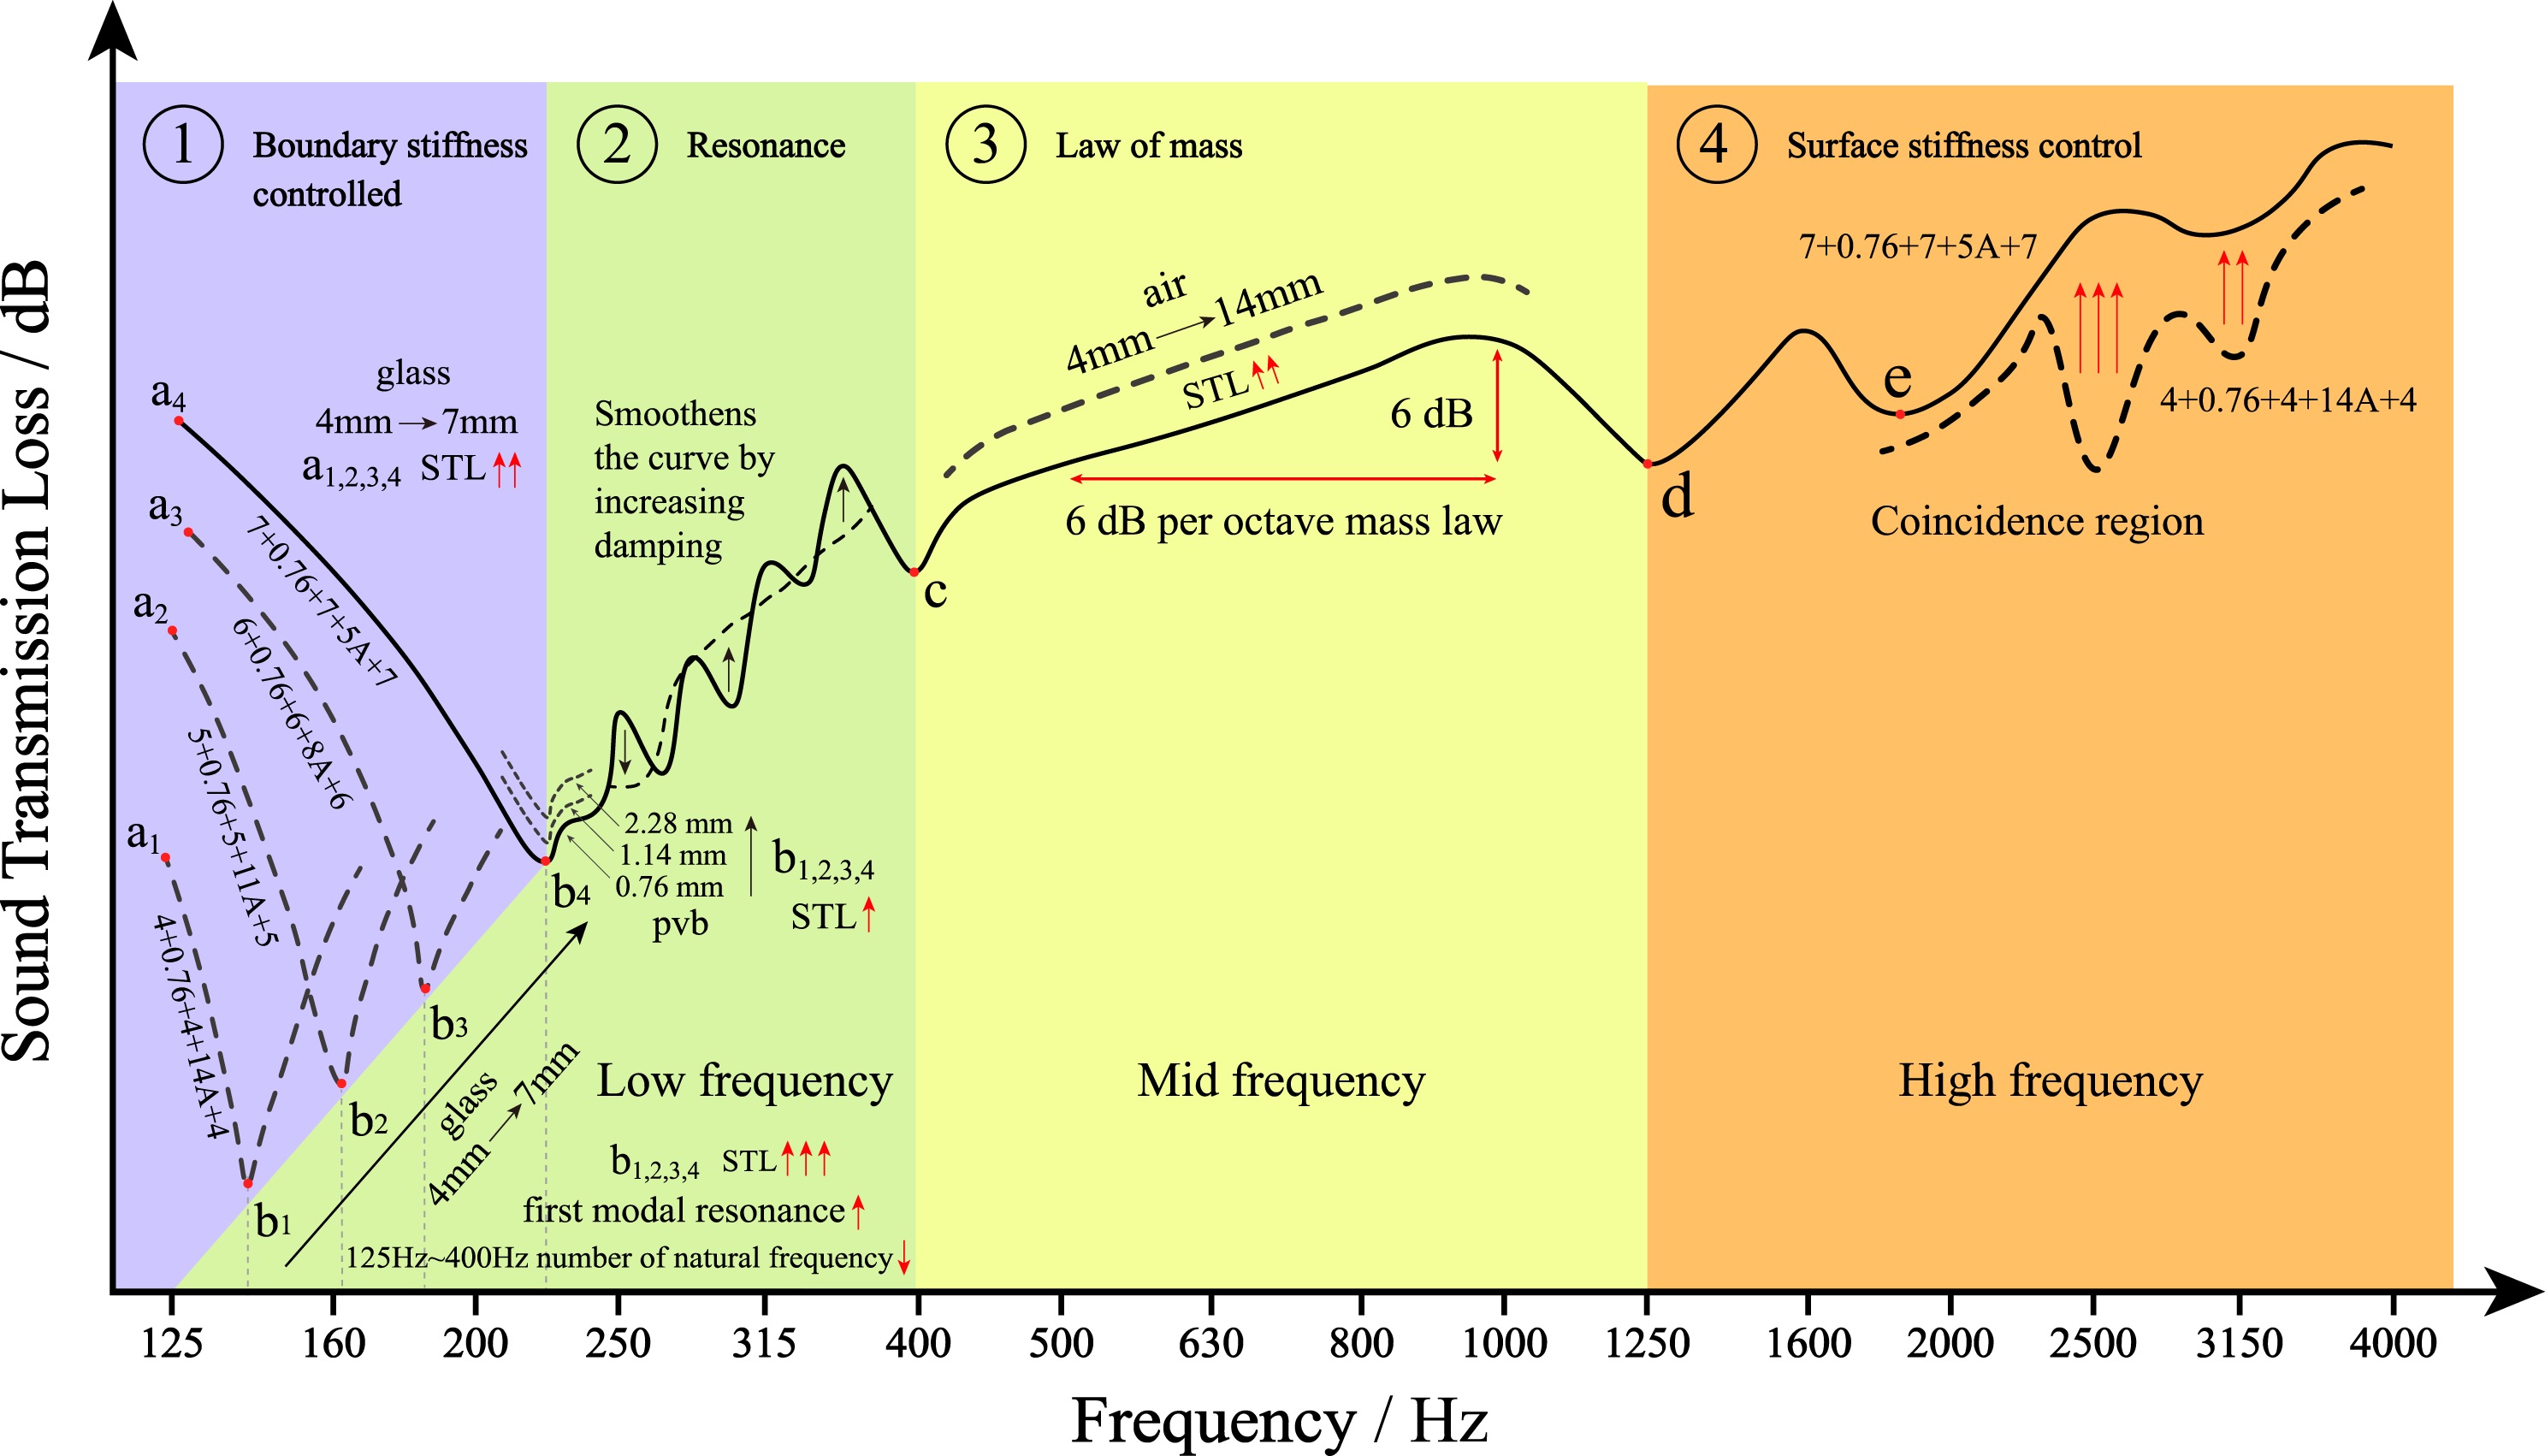
In the boundary stiffness control zone, when the three pieces of glass are increased from 4 mm to 7 mm simultaneously, the sound insulation at point a1 can be significantly improved to the a4. It shows that increasing the stiffness helps to increase its sound insulation upper limit in the low frequency range. Combined with Figure 8, the first resonant frequency of the four types of glass will shift to the mid frequency range, and the number of natural frequencies in the low frequency band will gradually decrease. Combined with Figure 9, due to the increase in glass thickness, the displacement decreases when subject to resonance and the TL will significantly increase from b1 to b4.
In the resonance region, by increasing the thickness of PVB from 0.76 mm to 2.28 mm, the TL at the respective first resonant frequencies can be slightly improved. Moreover, experiments found that adding enough damping material around the glass can make the sound insulation smoother.
In the “law of mass” zone, when combined in Table 3, enhancing sound insulation in the mid frequency range can be achieved by increasing the thickness of the air layer. Additionally, augmenting the glass thickness within the surface stiffness control area leads to improved sound insulation at the valley value, resulting in enhanced sound insulation performance.
When designing building components, such as glass, the following guidelines are recommended rules: increasing the thickness of individual glass pieces used in insulating laminated glass, minimizing the number of natural frequencies, and shifting the first few resonant frequencies towards the mid frequency range to avoid excessive vibrations that may compromise sound insulation performance.
Conclusions
In this study, a half-space acoustic simulation method was employed as a replacement for the spherical wave, and the accuracy of this method was tested to identify the insulating laminated glass specification that offers the best sound insulation performance. The following conclusions are drawn: 1) When PVB increases from 0.76 mm to 2.28 mm, the sound insulation of each type of glass can slightly improve by 0.9∼3.4 dB at first resonant frequencies. When the three pieces of glass change simultaneously from 4 mm to 7 mm, the sound insulation of each type of glass can significantly improve by 3.7∼21.8 dB at first resonant frequencies. 2) The 7 + 0.76 + 7 + 5A + 7 have the best sound insulation effect. Because the three pieces of 7 mm glass have the highest percentage of the total thickness, it has the most minor displacement when subjected to resonance. Therefore, the average sound insulation at its first natural frequency (200 Hz) is 15.4 dB, and the average TL in the full frequency range (125 Hz ∼ 4000 Hz) is 38.5 dB, the highest value among the eleven kinds of glass. 3) The thicker the three pieces of glass that make up the insulating laminated glass, the higher the frequency of the first resonance, and moving towards the mid frequency in approximately 20 Hz increments. The number of modes with resonant frequencies in the low frequency range (125 Hz ∼ 400 Hz) will be reduced from 12 to 9. This conclusion can effectively reduce the frequency subject to resonance.
Footnotes
Declaration of conflicting interests
The author(s) declared no potential conflicts of interest with respect to the research, authorship, and/or publication of this article.
Funding
The author(s) disclosed receipt of the following financial support for the research, authorship, and/or publication of this article: This work was supported by the Natural Science Foundation of Shaanxi Province (No. 2022JQ-430).