
Abstract
The control-structure interaction (CSI) between shaking table and eccentric load is one of the most important reasons causing the accuracy degradation of shaking table test. At present, the eccentric ratio (ER) of load and the coupling between actuators pose challenges to study the CSI. Thus, this paper establishes an analytical transfer function matrix of a shaking table and eccentric load. Based on the transfer function matrix, a comprehensive study is conducted to analyse the CSI effect under different eccentric ratio conditions. The analysis proves the influence of the CSI, and the CSI amplifies the actuator coupling more than 22 times at 20.00 Hz. Furthermore, a real-time CSI compensation strategy considering the actuator coupling is proposed. With the adopting of the proposed strategy, the coupling between two actuators is fully eliminated, and the correlation coefficients of ground motion records of two actuators are improved by 14.75% and 5.48%, respectively.
Keywords
Introduction
Shaking table is an essential experimental facility to replicate actual vibration conditions in engineering seismic research works,1–4 aerospace vibration tests,5,6 vehicle road simulations,7,8 etc. The CSI9–11 is the dynamic coupling between shaking table and load in the context of shaking table test. The CSI not only affects the control precision of shaking table but also introduces error to the load response. Researchers also demonstrate that if an eccentric load is loaded on shaking table, the CSI increases greatly under some conditions. 12 In order to understand the CSI mechanism between the shaking table and load, researchers have conducted studies to find the CSI effect and propose the CSI compensation strategies.
The analysis of the CSI effect is to find out the influence trend and degree of the CSI under different system characteristics. In the existed analysis of the CSI effect, most researchers took shaking table and centrosymmetric load as research subjects, and established the models of shaking table and load. The analysis of the CSI effect was mainly conducted from two aspects: shaking table characteristics and load characteristics. From the aspect of shaking table characteristics, many researchers have analysed the effects of control parameters, including proportional integral derivative parameters 13 and three variable control (TVC) parameters, 14 the time delay, 15 the bias 16 of servo valve, the stiffness of hinge, 17 the mass of hydraulic cylinder, 18 the deformation of platform, 19 and the coupling between two shaking tables 20 on the models of shaking table and load. From the aspect of load characteristics, researchers have analysed the effects of mass, damping ratio, and frequency,3,21 rigidity and flexibility, 22 the physical realization of damping, 15 the physical realization of stiffness, 23 and vibration mode 24 on the models of shaking table and load. The above researches have been provided in reference, 25 so the detailed researches will not be elaborated here. Besides, the ER influence on the system has been analysed in reference, 25 which only demonstrates the ER influence on actuator coupling at 10 Hz.
To compensate for the CSI, a series of off-line and real-time compensation control strategies were proposed. With the adoption of multiple off-line iterations, Twitchell 26 and Fletcher 27 mitigated the influence of the CSI. However, multiple off-line iterations may cause unrecoverable damage to load, which might affect test results. Many studies demonstrated that real-time compensation control strategies are effective methods to compensate for the CSI. Dozono28,29, Li 20 , and Tang 30 obtained the magnitude of the interactions based on different computational methods, and used a force feedback control method to compensate the CSI in real time. Seki 31 employed an adaptive trap to compensate for the CSI and improved the control performance of shaking table. Tian 32 adopted adaptive inverse control strategy to identify the CSI and then compensated the CSI. Yan 18 and Zhao12,33 developed strategies to compensate for the CSI on the basis of the modal control strategy, which turns out to be a promising approach. Nakata 34 proposed an acceleration trajectory tracking control strategy, and theoretical and experimental results shown that the strategy can compensate the CSI. Phillips 35 compensates the CSI by introducing a model-based multi-metric strategy. Li 36 proposed a differential movement synchronous tracking control strategy to compensate the CSI between double shaking table system and specimen. Yao 37 proposed a least-mean-square based adaptive trap that adaptively compensates for the CSI. Guan 38 established an adaptive stochastic control method that replicates the reference acceleration power spectrum density, and demonstrated that the control method can effectively compensate the CSI through multiple sets of experiments. Zhang 39 combined a deviation-coupled control strategy with fuzzy control strategy for dual shaking table array to compensate the CSI. Liu 40 adopted frequency-domain adaptive control algorithm and developed full-state feedback feed-forward servo controller, which can reduce the CSI effectively and expand the frequency band of the system. Shen 41 compensated the CSI by combining an offline compensator with an online adaptive controller, and thus the tracking control performance of system was improved. Dai 42 employed sliding mode control algorithm to reduces the internal force of the system due to the CSI, and the synchronous tracking performance of system is improved. Based on a model predictive control strategy, Malalis 43 adjusted multiple parameters of the model predictive control gauge, which compensates the CSI effectively. Jose 44 proposed a model control method based on real-time inversion of the state space model, which can compensate the interaction and improve the control performance of shaking table. Madabhushi 45 pointed that it may be necessary to reproduce the specimen’s overall dynamic response during the iterative learning control process in compensating the CSI.
In conclusion, a series of studies were conducted to study the mechanism of the CSI. However, the ER influence on actuator coupling still needs to be further explored. As the research in reference 25 analysed the ER influence only at 10 Hz frequency point, the study of ER influence at key frequency point needs to be further conducted. More importantly, the previous studies have not considered the problem that the effectiveness and application of the CSI compensation control strategies are hindered by actuator coupling. Faced with the aforementioned problems, this study takes unidirectional twin-axes shaking table and eccentric load as research subject. And an analytical transfer function matrix is established to analyse the CSI effect and compensate the CSI. Based on the transfer function matrix, an in-depth investigation is conducted under different ER conditions. The CSI effect on the transfer function matrix is found in the investigation. Moreover, a real-time CSI compensation strategy that considers the coupling between two actuators is proposed. Then, the effectiveness of the proposed strategy is verified in frequency and time domain, respectively.
This paper is organized as follows: the System modelling part establishes the analytical transfer function matrix of the unidirectional twin-axes shaking table and eccentric load; The analysis of the CSI effect is conducted under different ER conditions in the Analysis of the CSI effect part; The control strategy is proposed to compensate for the CSI in the Real-time CSI compensation strategy part; and the last part concludes the main points and contributions.
System modelling
The diagram of the shaking table and eccentric load is shown in Figure 1. It can be seen from Figure 1 that the system is mainly composed of the following parts: control computer, servo valve, hydraulic cylinder, platform, guide mechanism, connecting rod, actuators, and load. Diagram of the shaking table and eccentric load.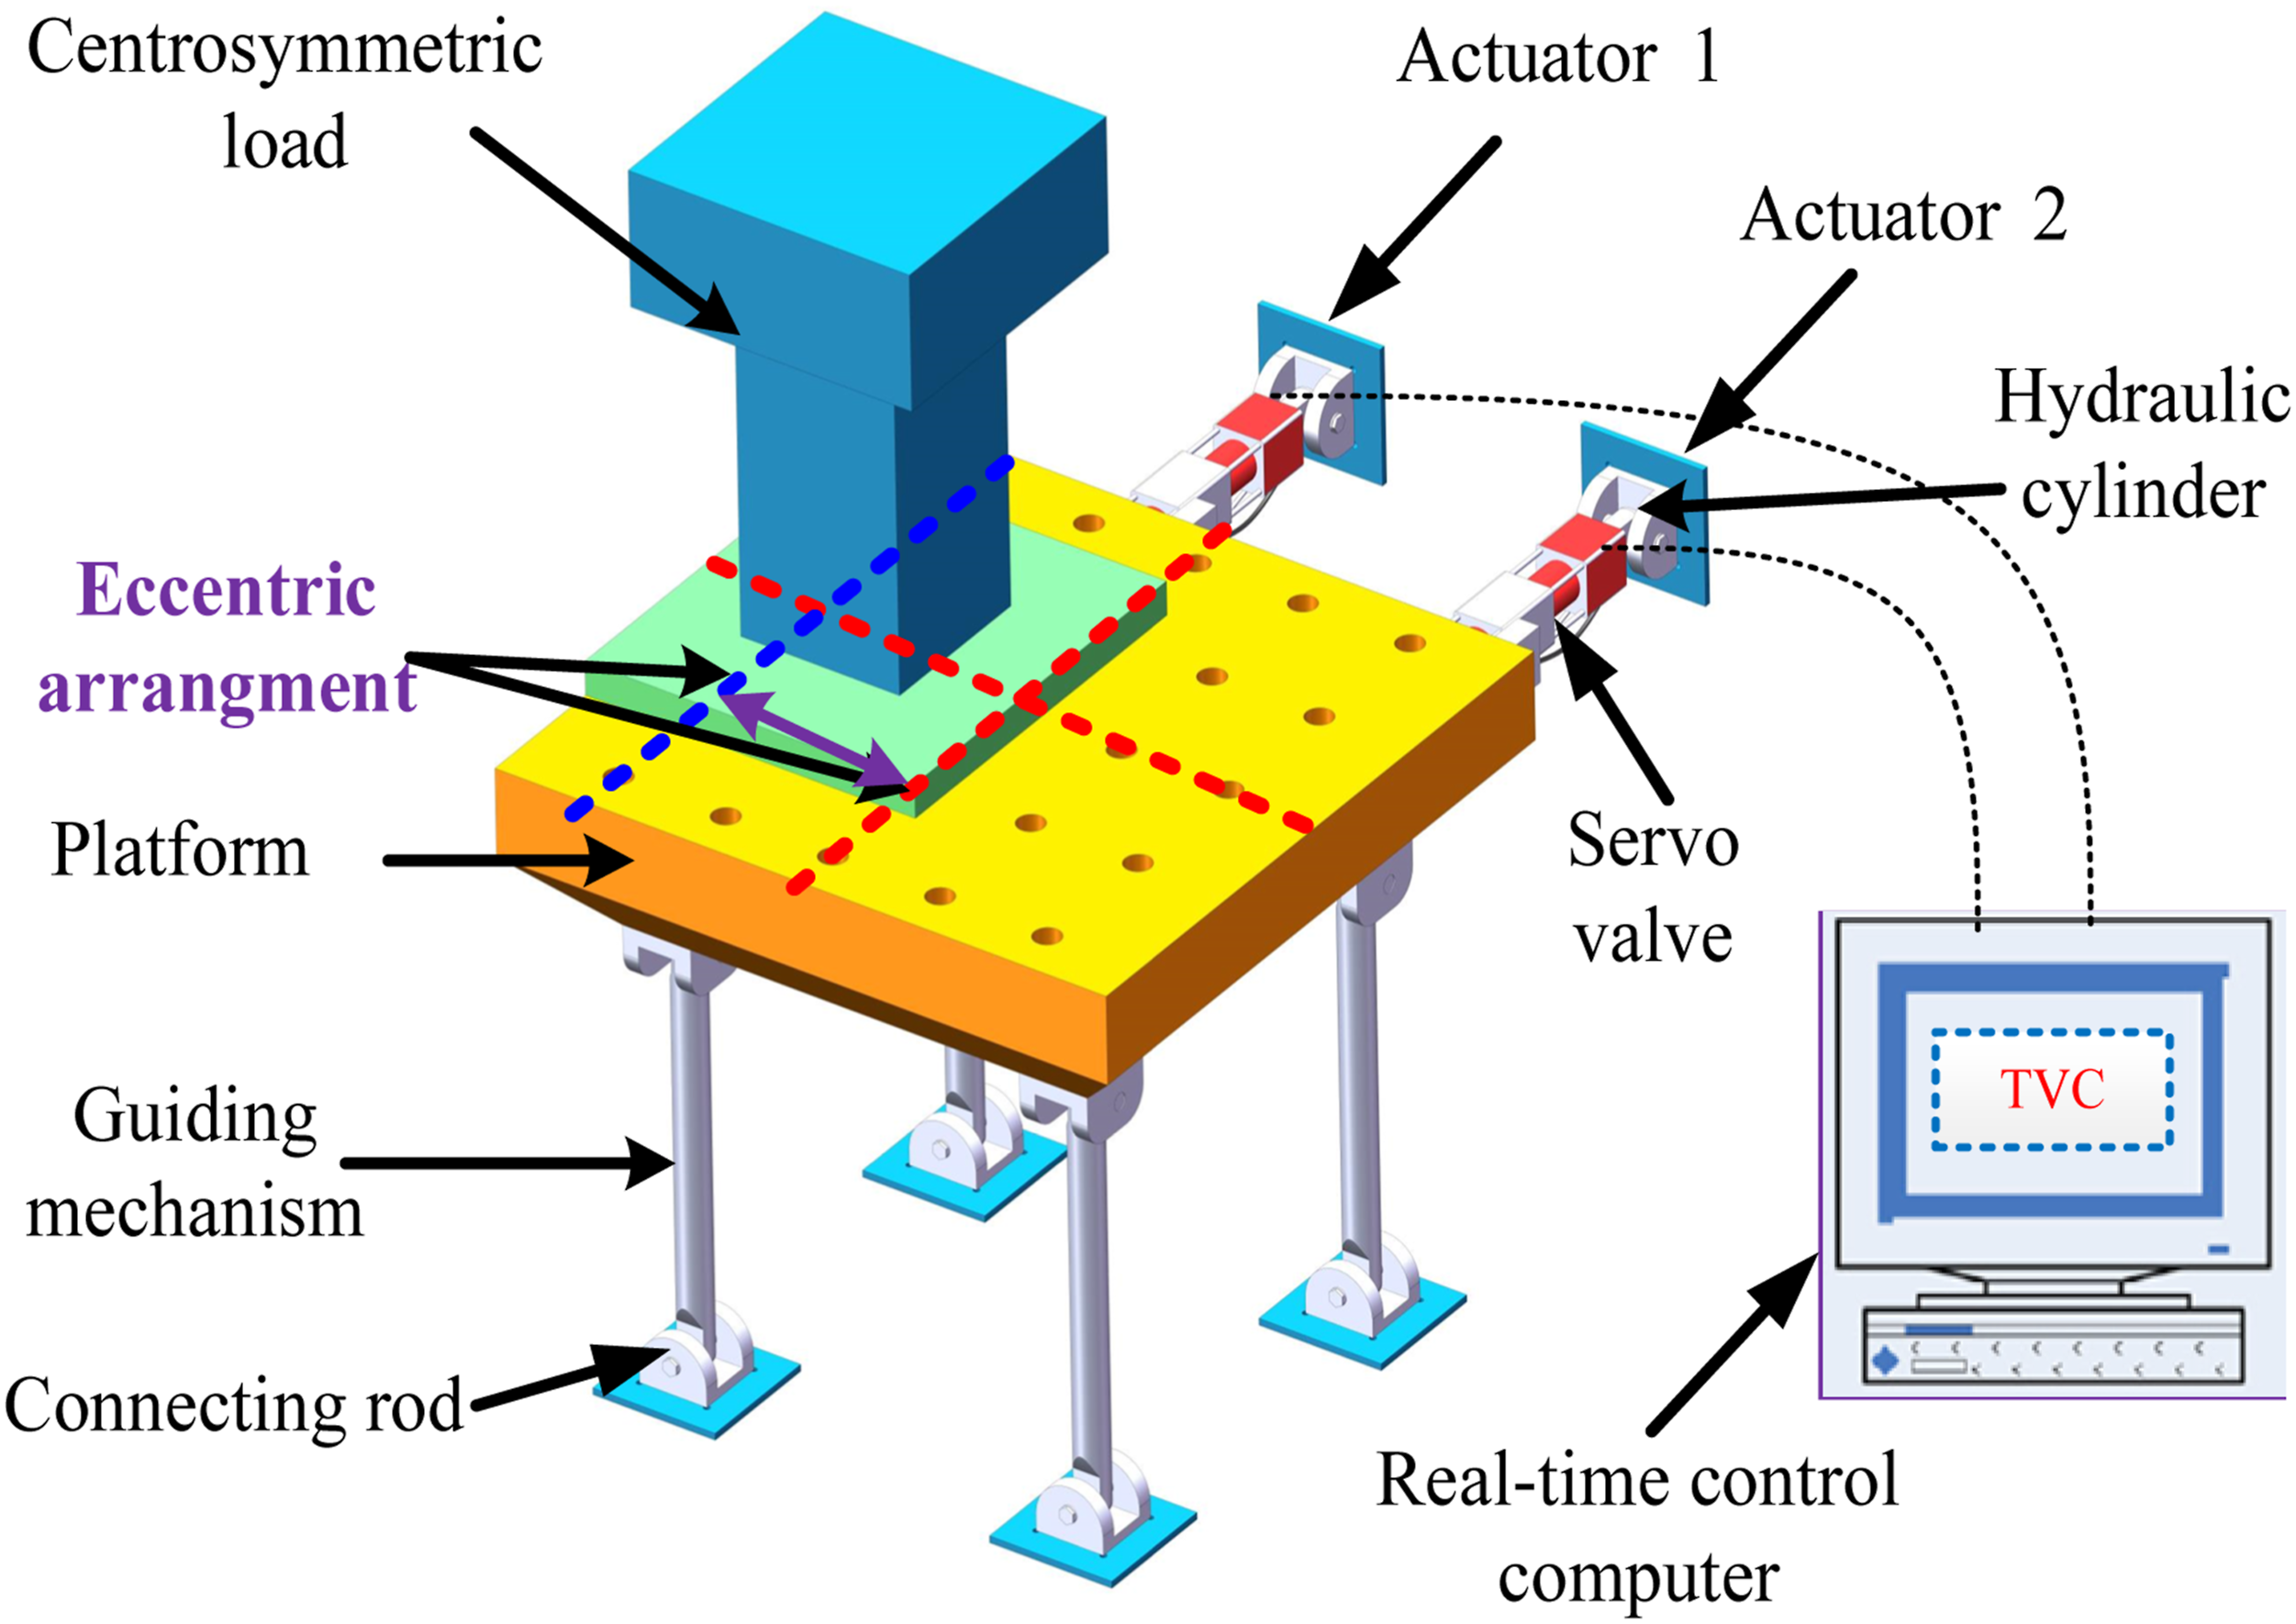
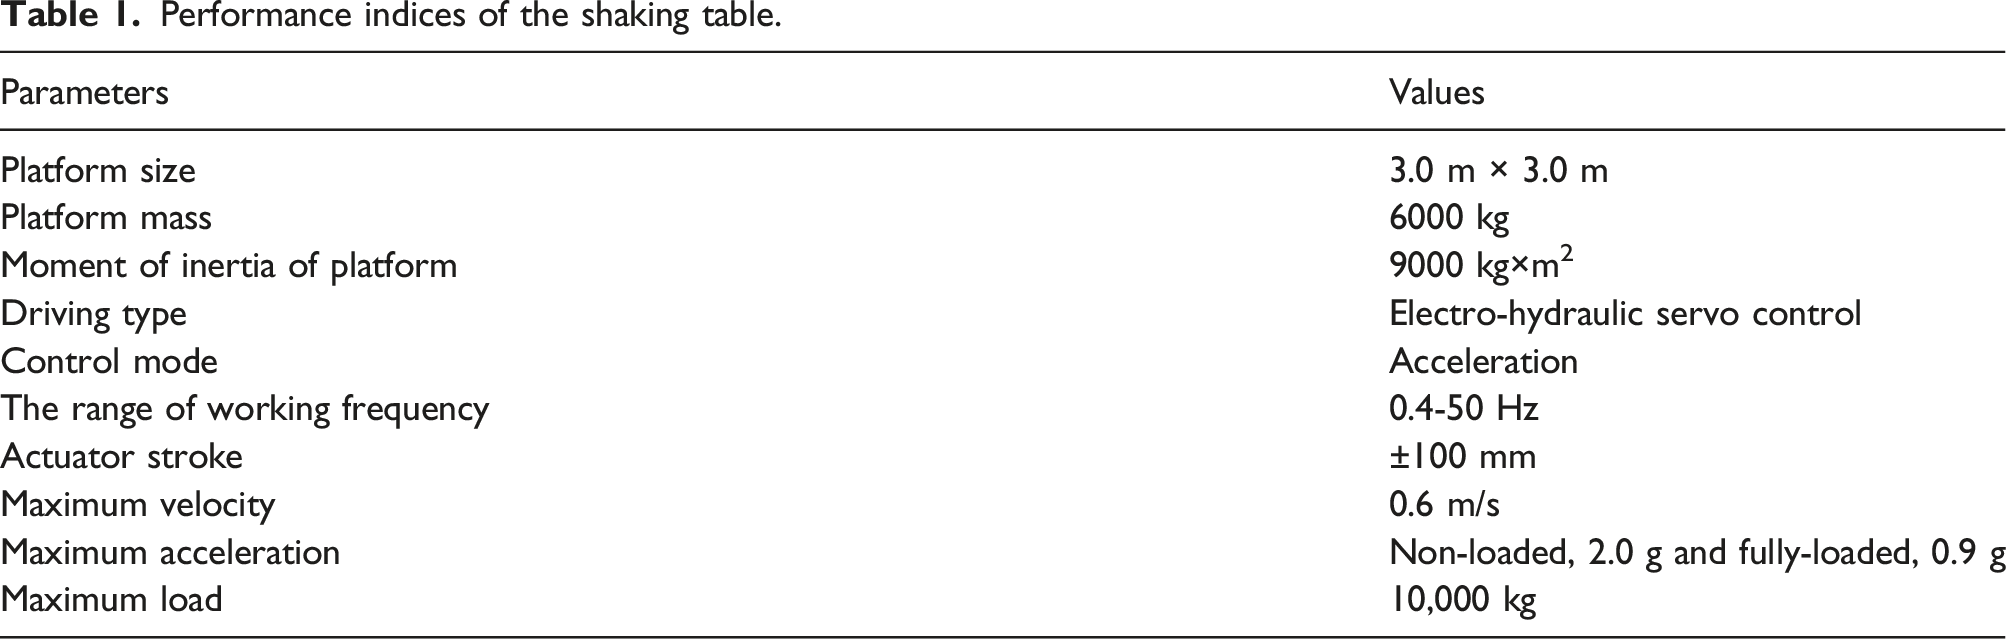
Performance indices of the shaking table.
The system model is established following the modular method depicted in Figure 2. It can be seen from Figure 2 that the system can be divided into three main sub-models, including the dynamic model, hydraulic-driven model, and TVC model. They are the motion mechanism part, the hydraulic-driven part, and the control part of the system. And the block diagram of the operation principles of the three parts is presented in Figure A1 in Appendix A. To establish an analytical transfer function matrix model, the components and the physical characteristics of the system are comprehensively considered in Figure A1. The values of the parameters are listed in Appendix A. According to Figure A1, the detailed modelling process is as follows. Three sub-models of the shaking table and eccentric load.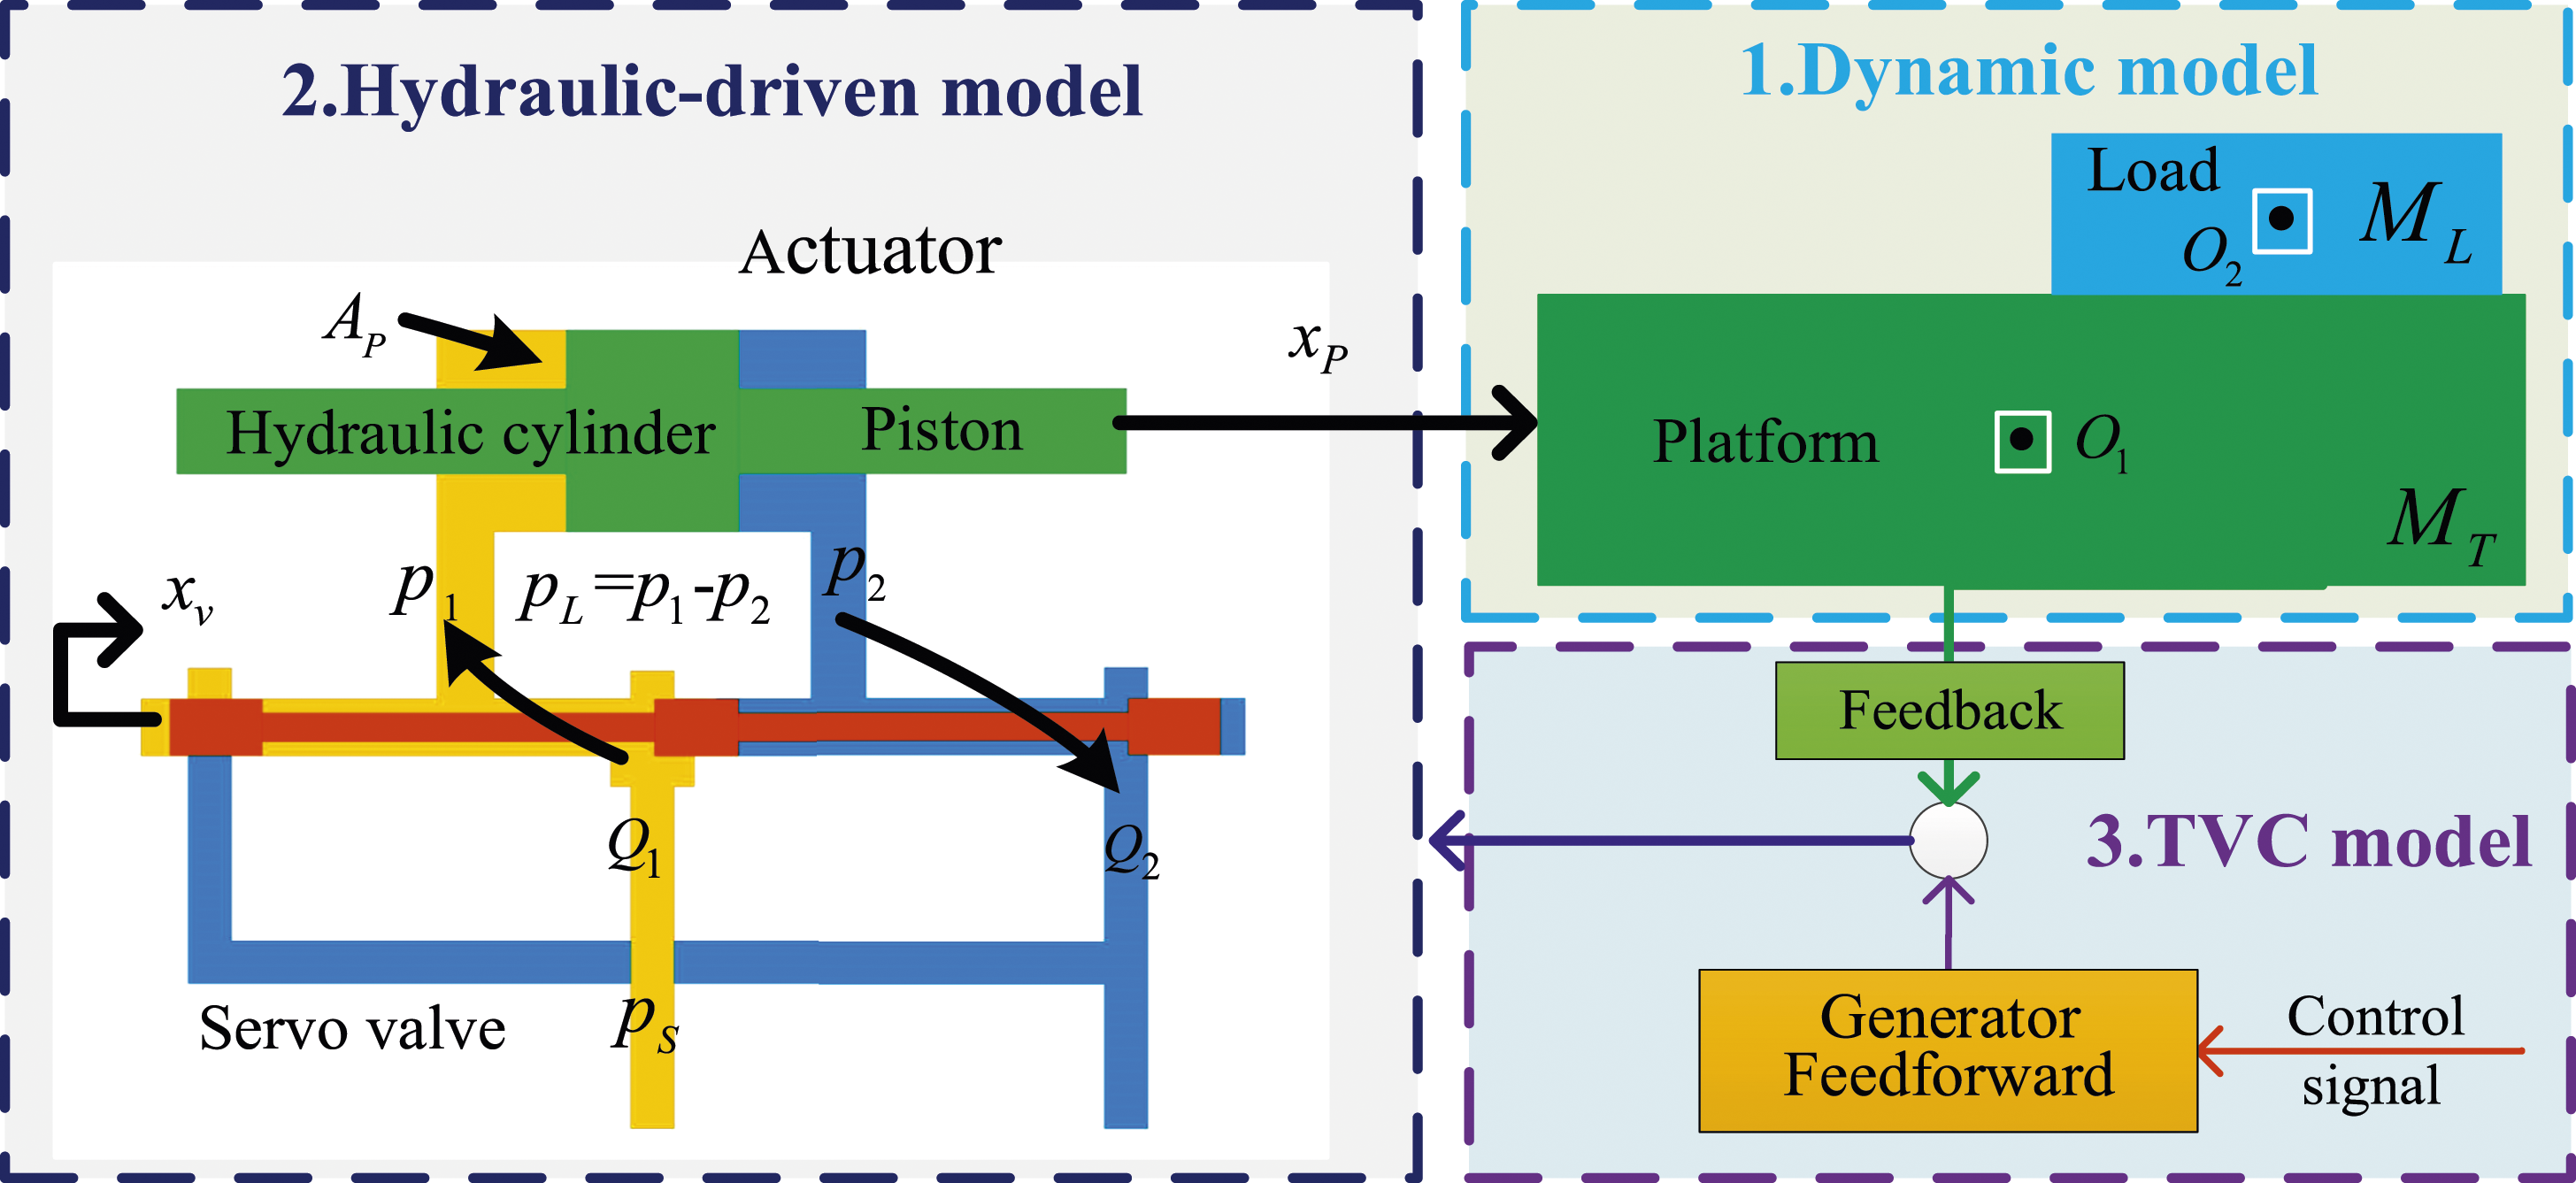
Dynamic system modelling
The dynamic model of the shaking table and eccentric load, which can be regarded as an integrated whole. The integrated whole is an equivalent model of the dynamic model, the schematic diagram of which is presented in Figure 3. Dynamic model. (a) Equivalent model of the dynamic model. (b) Dynamic analysis of the equivalent model.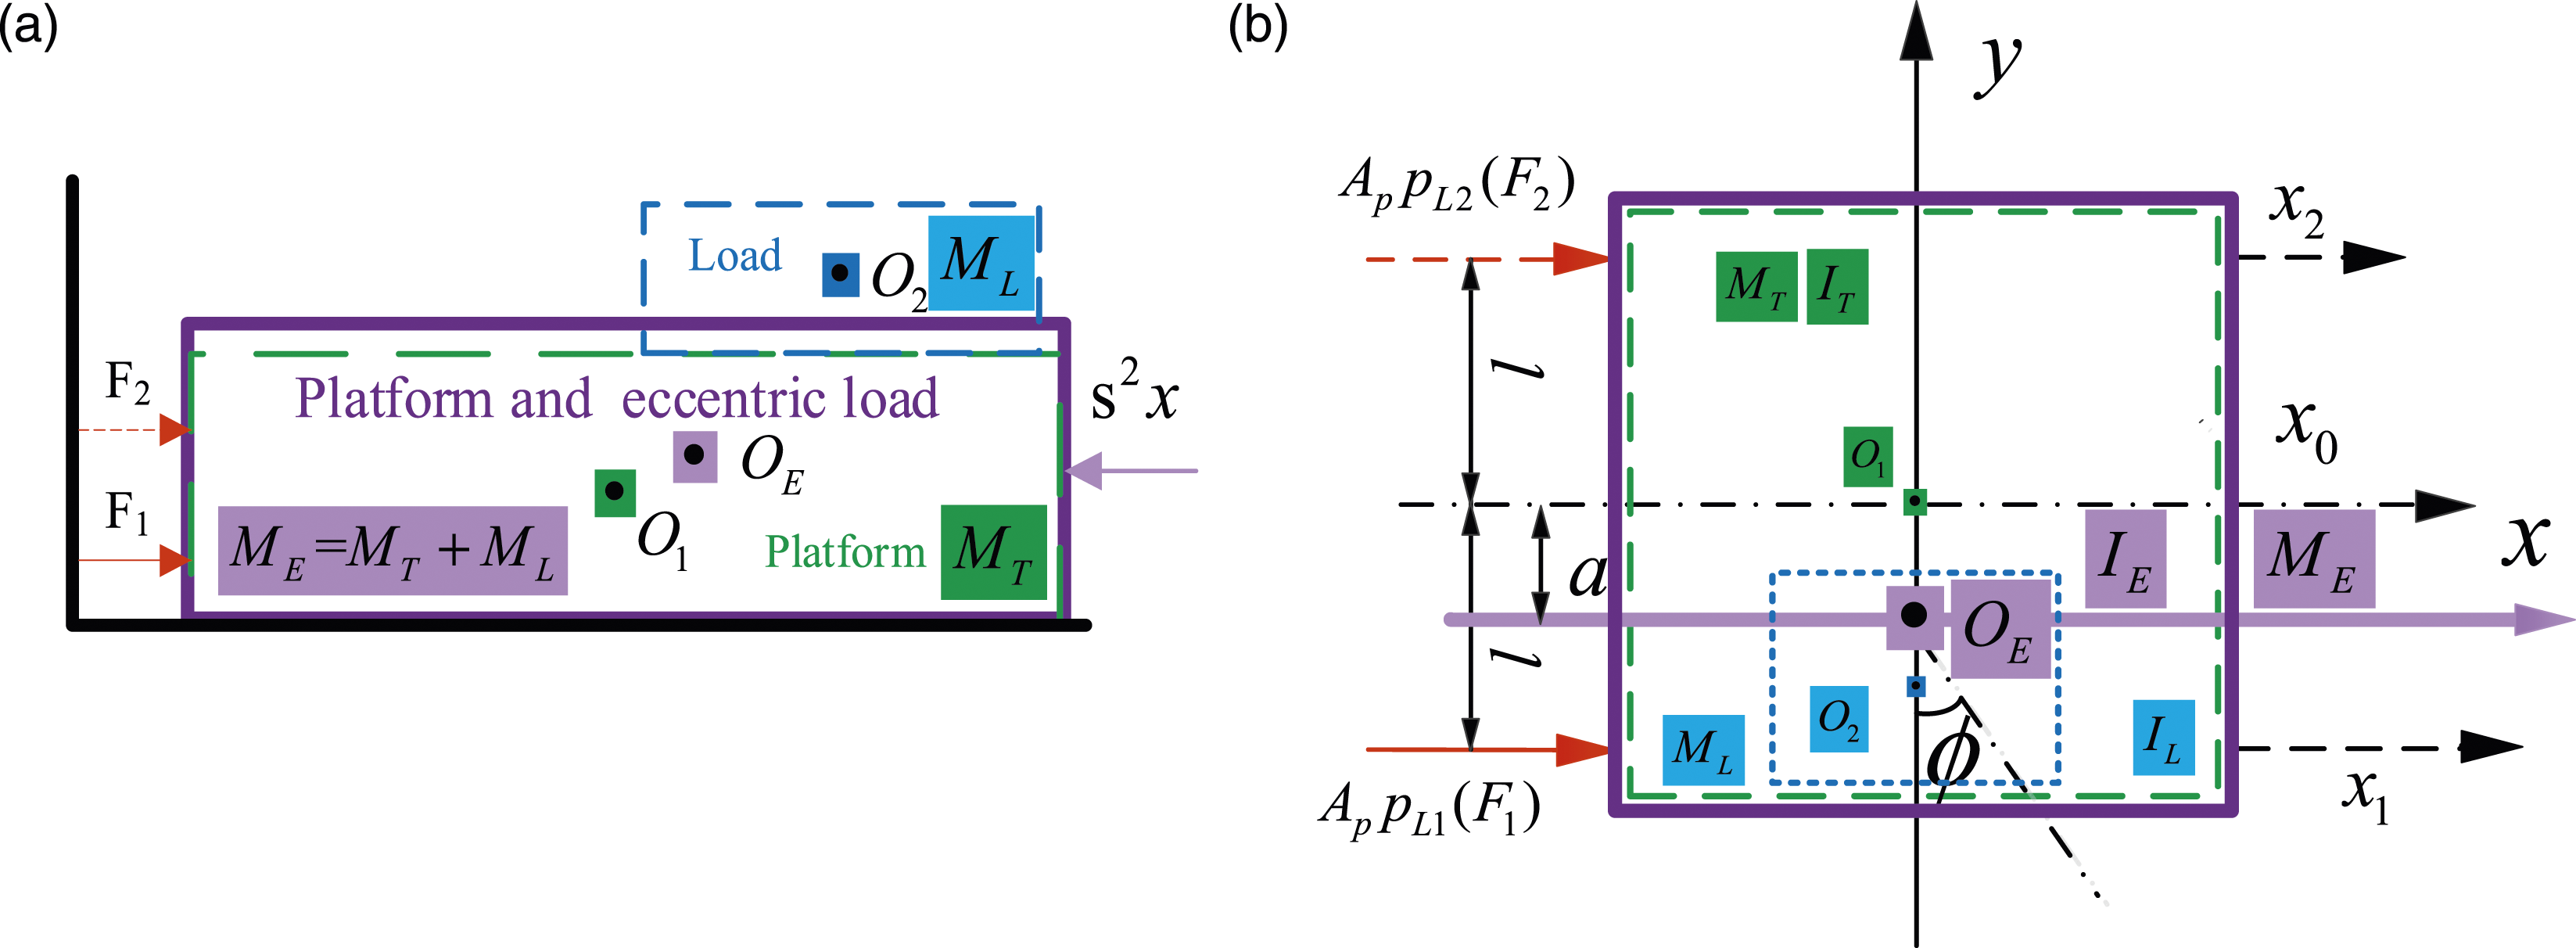
Figure 3(a) is the equivalent model of the dynamic model. Dynamic analysis of the equivalent model is shown in Figure 3(b). The detailed explanation of symbols are as follows: M T is the mass of the platform, M L is the mass of load, A1 is actuator 1 of the shaking table, A2 is actuator 2 of the shaking table, O1 is the centre of gravity of platform, O2 is the centre of gravity of load, F1(A p pL1) is the actuator force of actuator 1, F2(A p pL2) is the actuator force of actuator 2, x1 is the displacement of actuator 1, x2 is the displacement of actuator 2, I T is the moment of inertia of the platform relative to its own centroid axis, I L is the moment of inertia of the load relative to its own centroid axis, M E is the equivalent mass of the platform and load, I E is the equivalent moment of inertia of the platform and load relative to its own centroid axis, O E is the centre of gravity of equivalent mass, x is the displacement of the equivalent mass, and ϕ is the motion angle of the equivalent mass, a is the centre of gravity of the equivalent mass to the centre gravity of shaking table, and l is the distance from actuator to the centre gravity of shaking table.
Based on the parallel axis theorem, the equivalent model can be expressed as follows
Based on equation (1), the Newton's second law is adopted to establish the dynamic model of the shaking table and eccentric load. Then, the dynamic model is as follows
Hydraulic-driven system modelling
The block diagram of hydraulic-driven system is demonstrated in Figure 4. From Figure 4, the hydraulic-driven system is mainly composed of servo valve and hydraulic cylinder. The hydraulic-driven system can be expressed by a series of continuity equations. Hydraulic-driven model.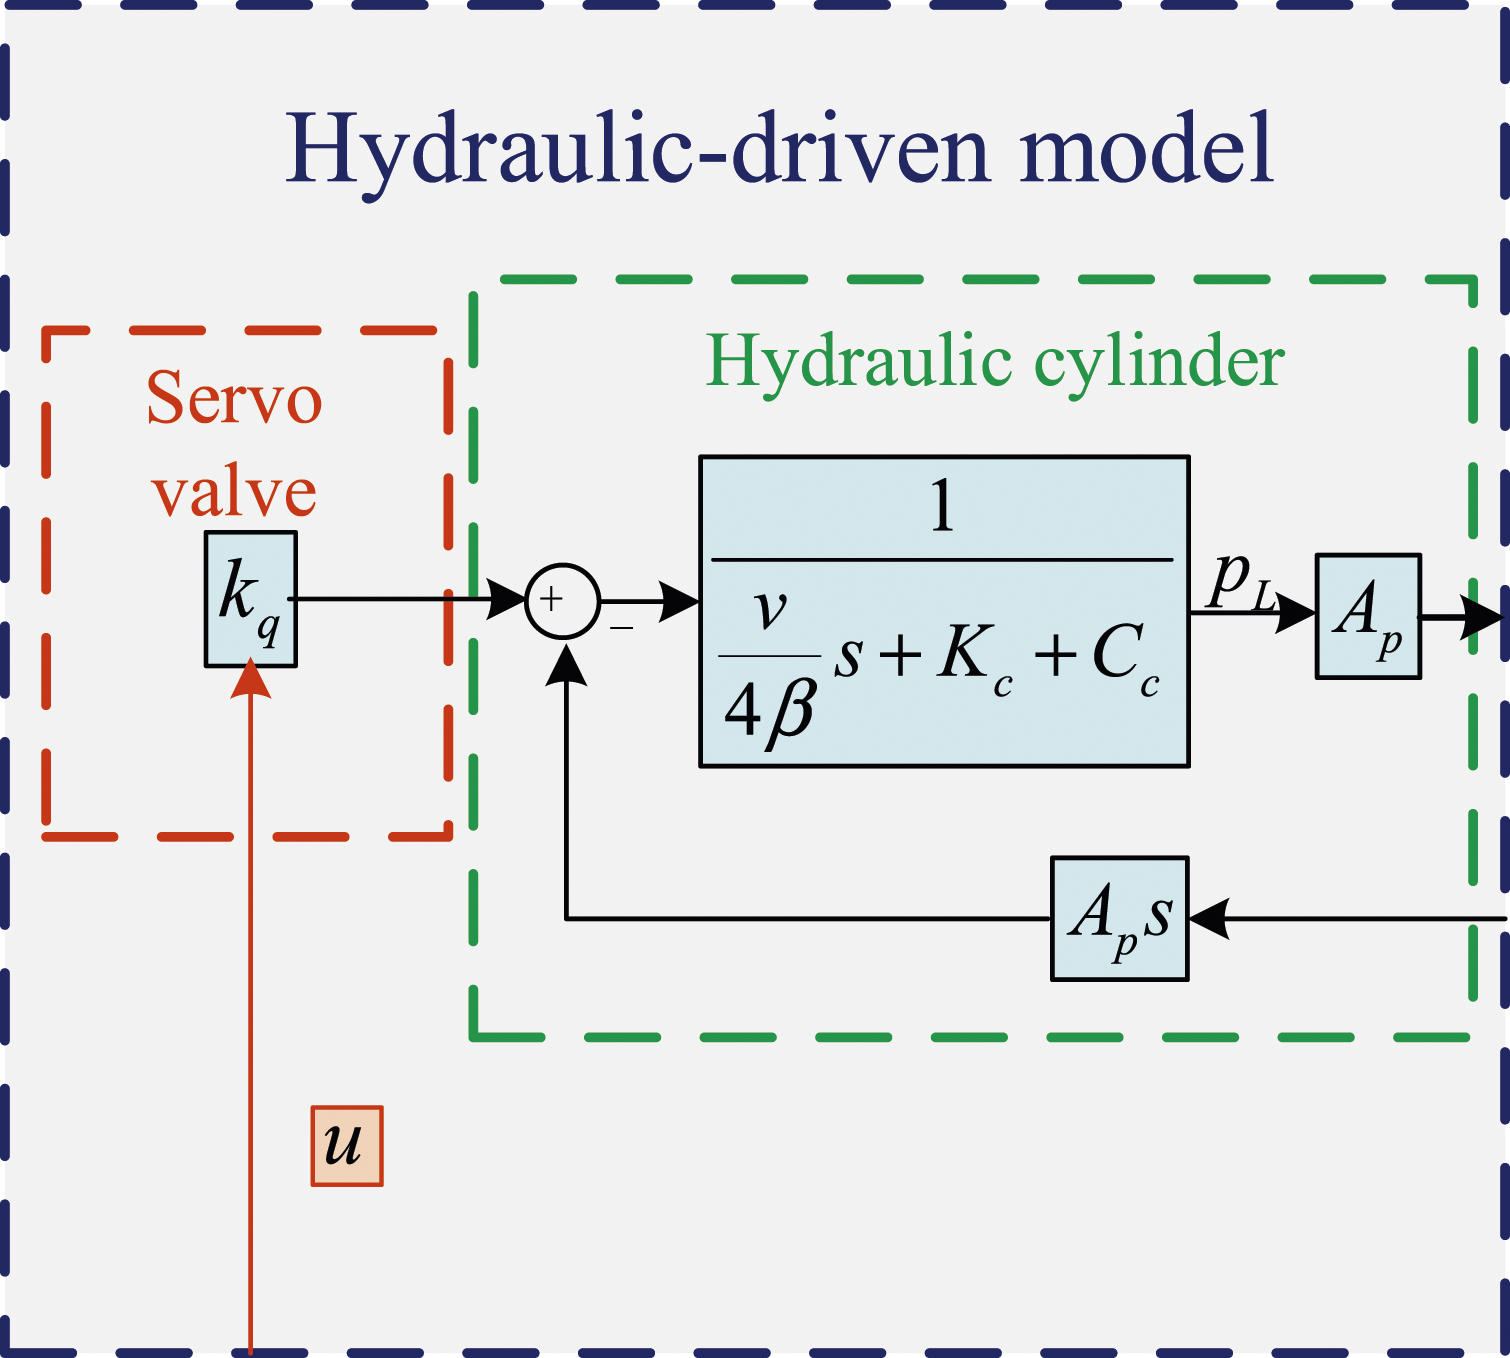
The servo valve model can be established with the basis of the second order oscillation link as follows
Referring to the research [3], the continuity equations of hydraulic-driven model can be obtained after the processing of the Laplace transform. The continuity equations are shown in equation (4)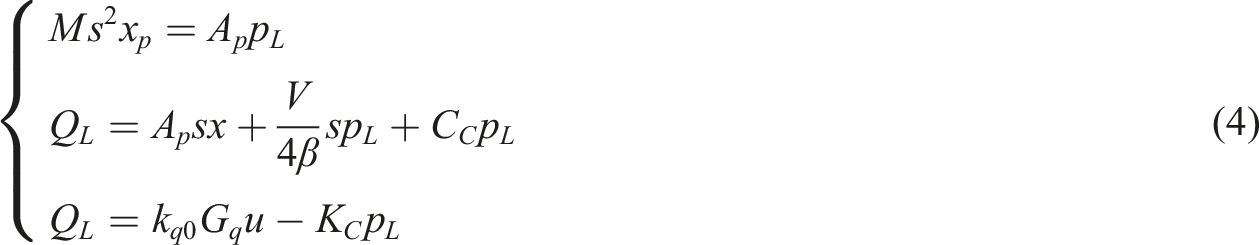
TVC system modelling
The feedback, the feedforward, and the generator are the three core components of the TVC model. The block diagram of the TVC model is shown in Figure 5. TVC model.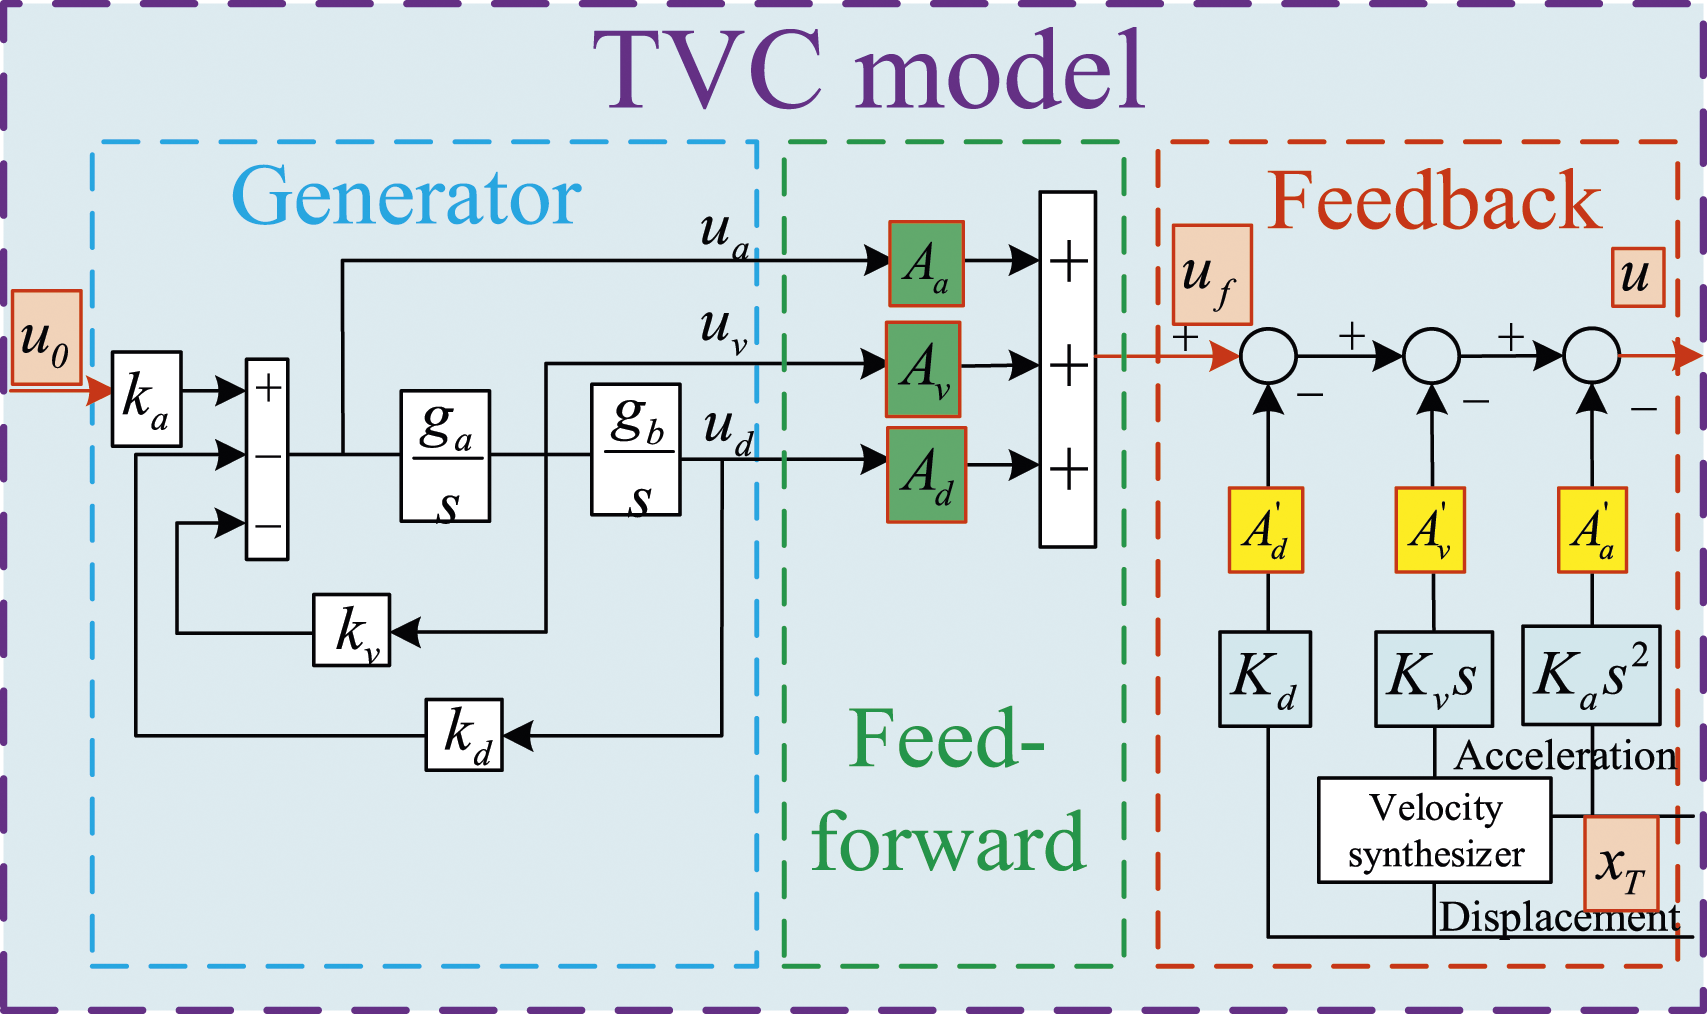
According to the research [3], in which the TVC system modelling process is presented in detail, the control error signal is as follows

Transfer function matrix modelling
Based on the three sub-models, the transfer function matrix is established. In the modelling process, the parameters of actuators 1 and 2 are assumed to be consistent with each other. Then, the transfer function can be deduced as follows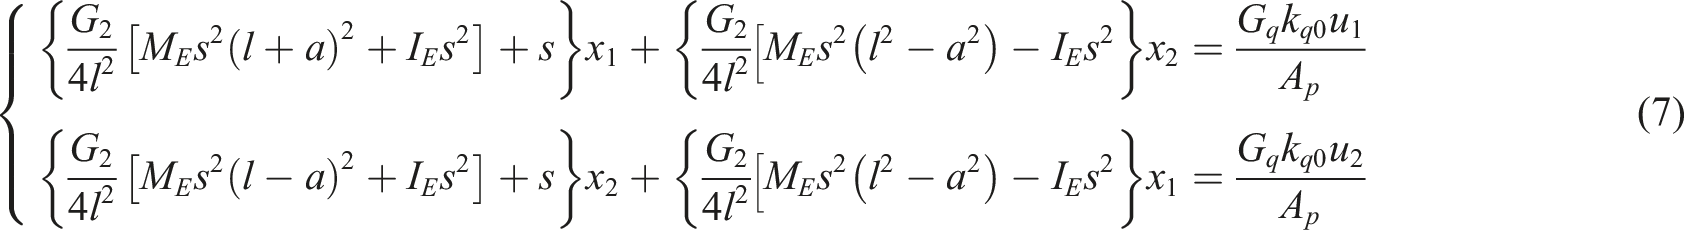

Substituting equation (5) into equation (7), the analytical transfer function can be obtained as follows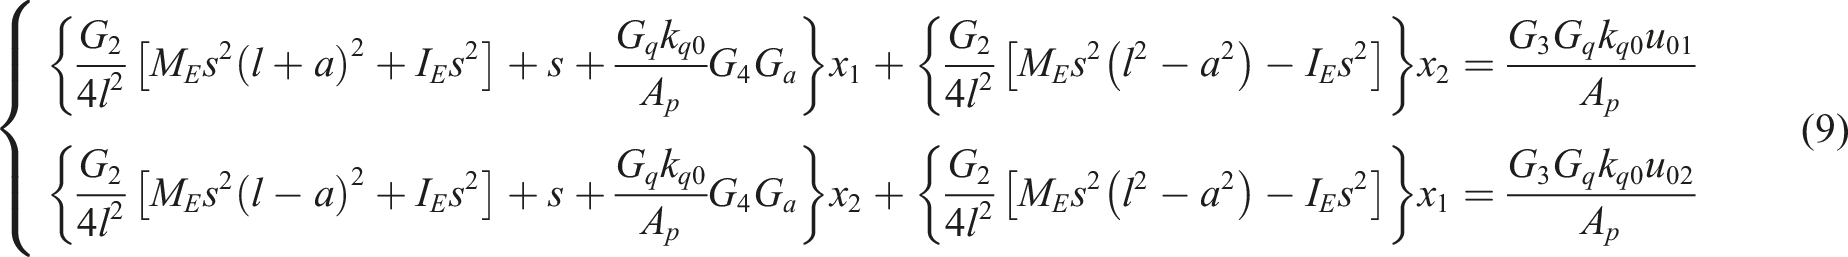
This can be arranged to the following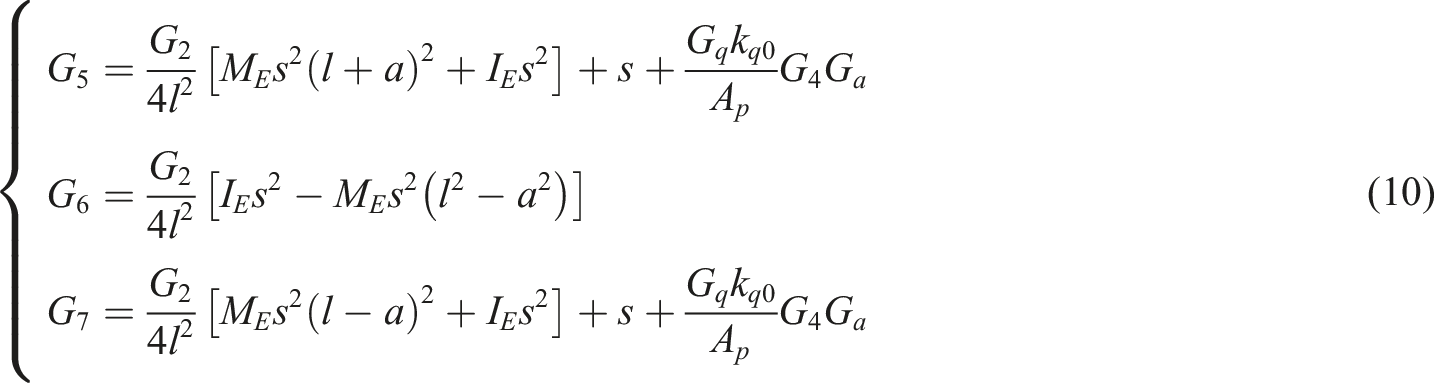
Then, the following relationships apply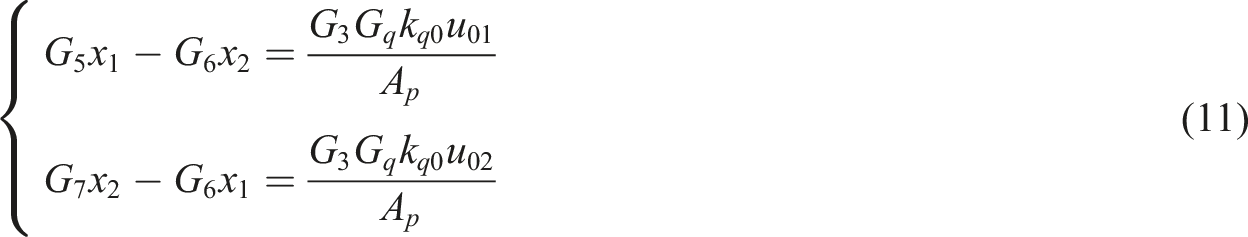
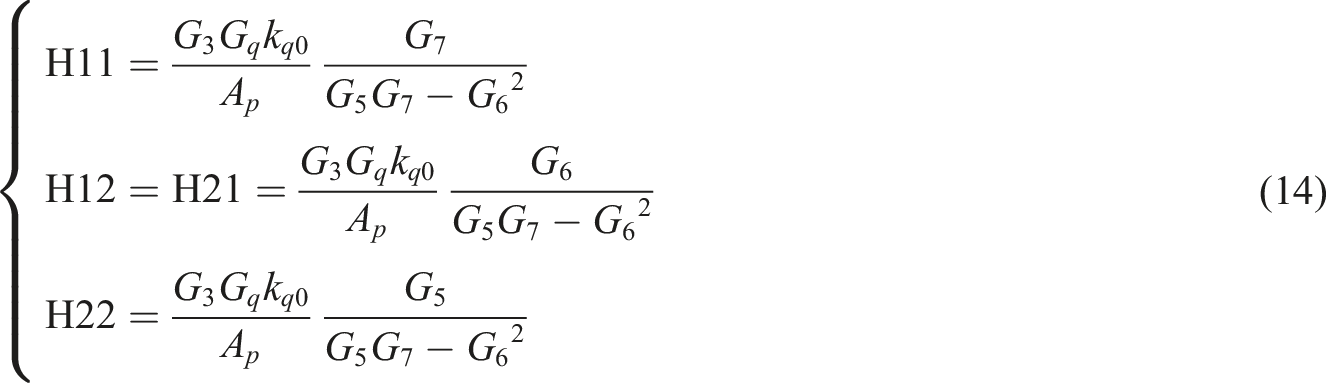
Finally, the transfer function of the shaking table and eccentric load can be obtained as follows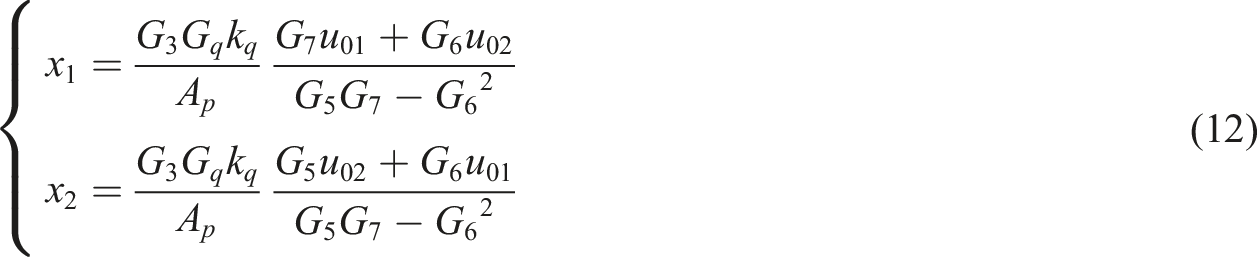
Rewriting equation (12) into the form of transfer function matrix to obtain equation (13)
Given u01= u02= u, then the transfer function of actuators can be written as follows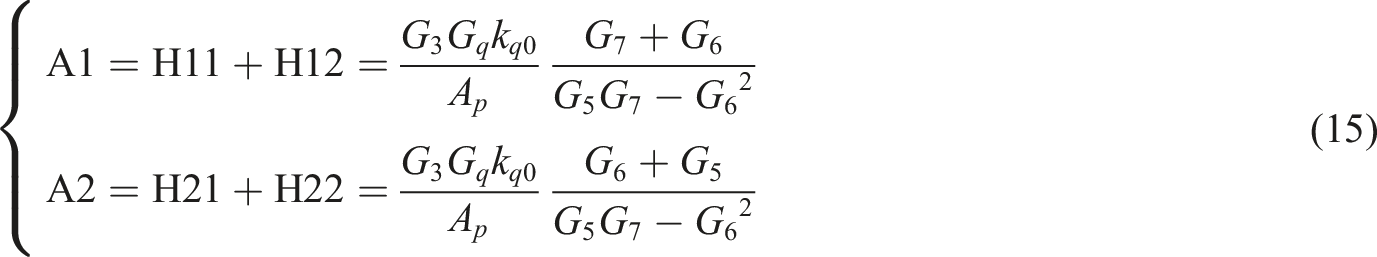
Based on the above deduction, the transfer function of the shaking table and eccentric load was established in MATLAB R2021a.
Analysis of the CSI effect
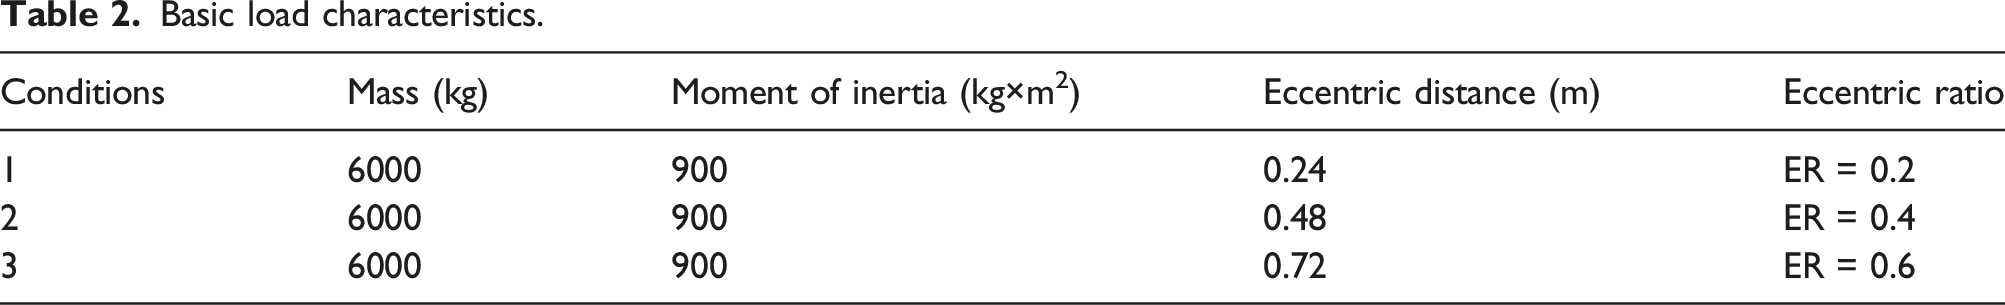
Basic load characteristics.
To compare and analyse the CSI effect on the transfer function matrix, the condition, in which the shaking table has no load, is defined as a reference condition. In the analysis, the amplitude frequency characteristic of the transfer function matrix is a key index. If the value of the index is in the range of 0.71 absolute value (abs) to 1.41 abs, the shaking table will function in its effective frequency range (−3.00 dB to +3.00 dB). The analysis was conducted in MATLAB R2021a.
Figure 6 shows the CSI effect under different ER conditions. Figure 6(a) shows that at 16.70 Hz the value of H11 is 1.36 abs when ER = 0.2, at 16.20 Hz the value of H11 is 1.50 abs when ER = 0.4, at 16.00 Hz the value of H11 is 1.65 abs when ER = 0.6, and at 11.40 Hz the value of H11 is 1.41 abs when ER = 0.6. Meanwhile, at 40.90 Hz the value of H22 is 0.71 abs when ER = 0.2, at 45.30 Hz the value of H22 is 0.71 abs when ER = 0.4, and at 48.20 Hz the value of H22 is 0.71 abs when ER = 0.6. According to the data collected, it can be obtained that at the resonance peak of oil column frequency and its surrounding frequency band, the influence of the CSI on H11 increases with the ER, and the influence of the CSI on H22 decreases with the ER. Meanwhile, the frequency of resonance peak of oil column of H11 decreases with the ER, the value of resonance peak of oil column of H11 increases with the ER. Besides, the effective frequency band of H22 increases at a certain extent, but the frequency does not exceed the effective frequency band of the reference condition (53.70 Hz). CSI effect on the transfer function matrix under different ER conditions. (a) H11 and H22. (b) H12 and H21.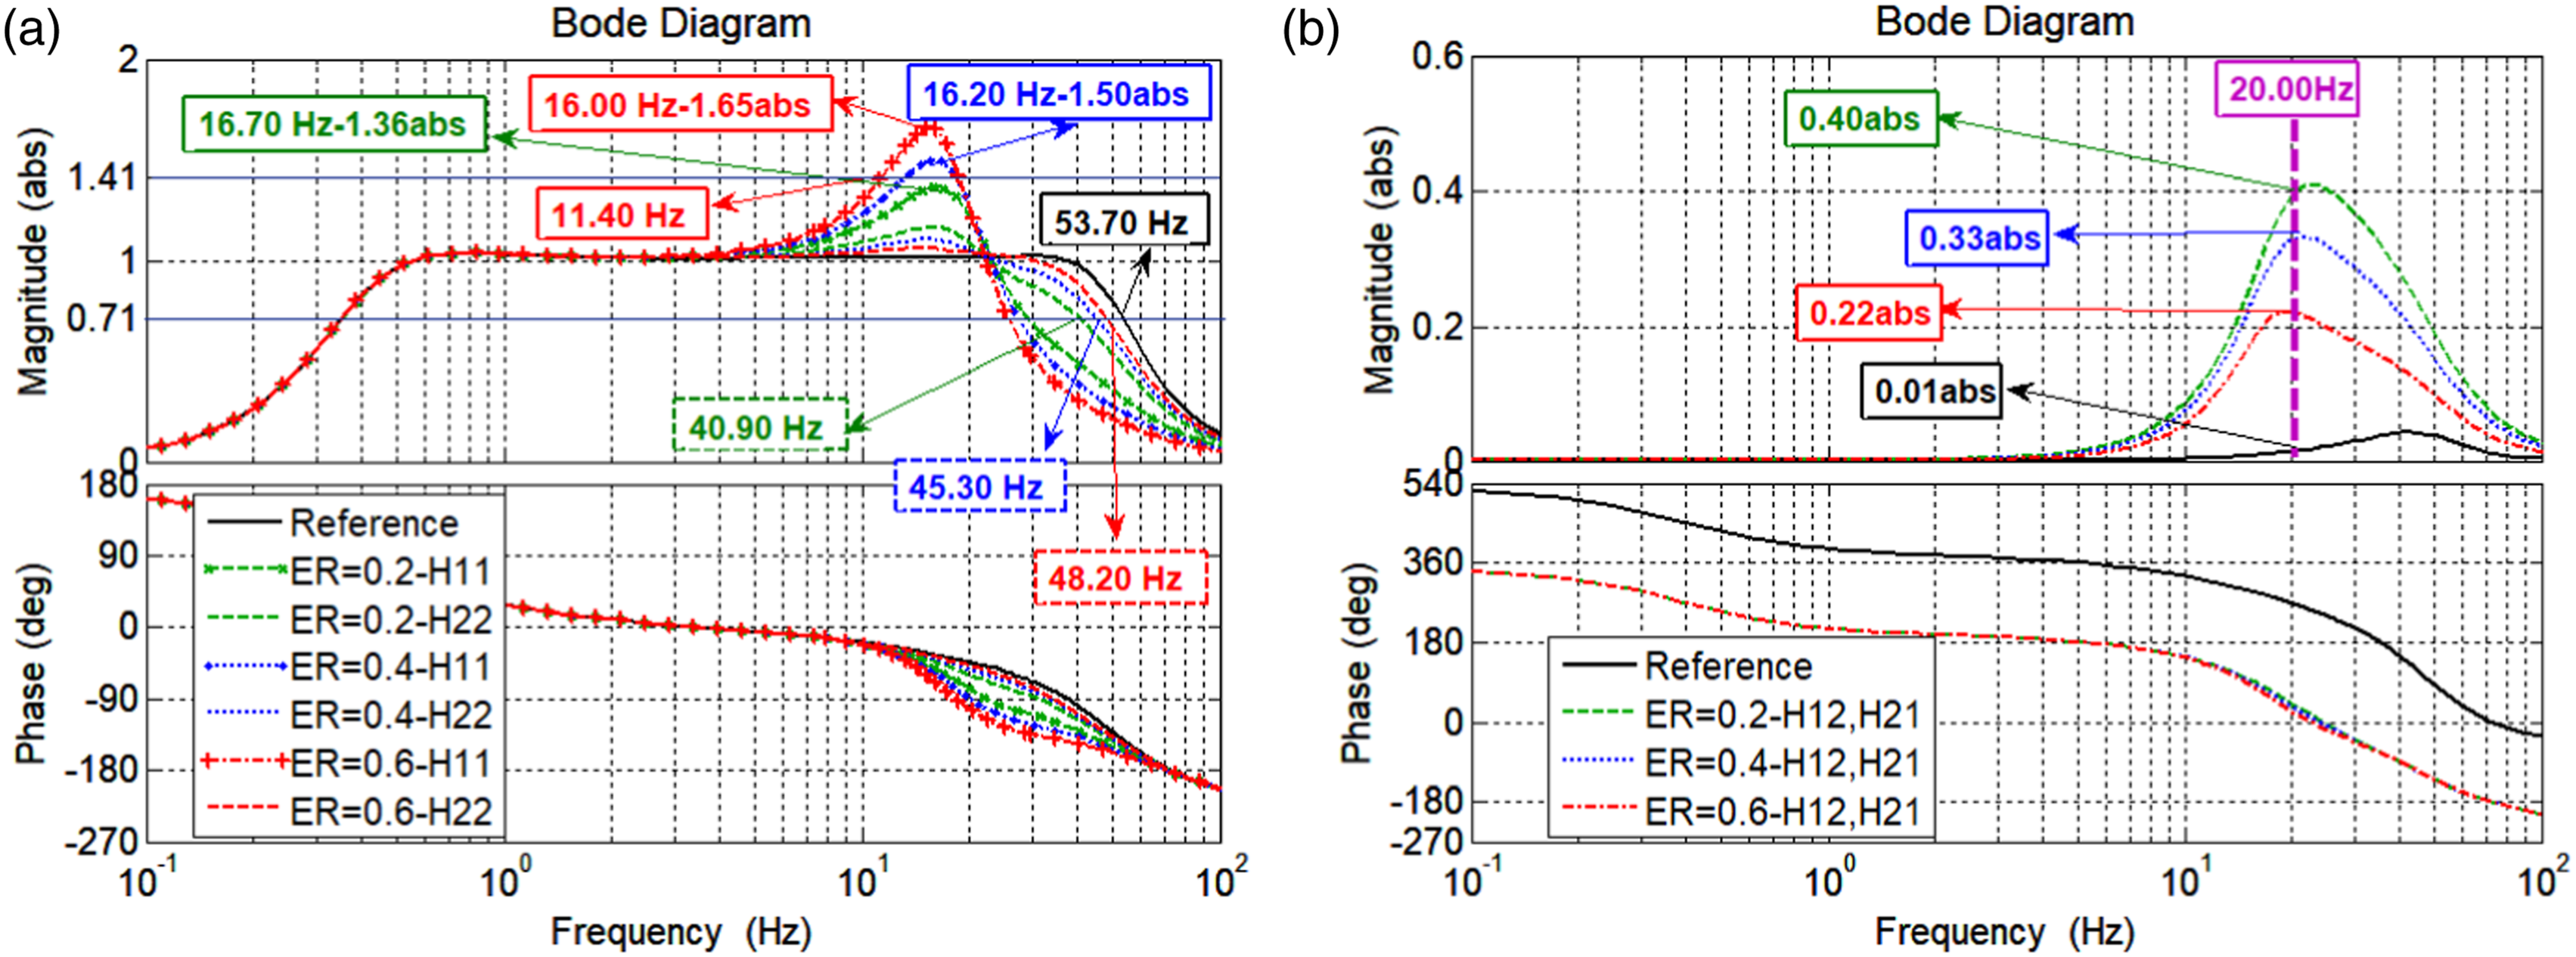
It can be observed from Figure 6(b) that at 20.00 Hz, the values of H12 and H21 are 0.22 abs when ER=0.2, 0.33 abs when ER=0.4 and −0.40 abs when ER = 0.6. These data show that the coupling between two actuators increases with the ER, and the coupling is amplified at least 22 times at 20.00 Hz.
In a word, the ER exerts great effect on H11 and H12/H21 at the resonance peak of oil column frequency and its surrounding frequency band, which leads to sharp decrease in the frequency band of actuator and drastic amplification of the coupling between actuators. However, the ER impact on H22 is relatively small.
Real-time CSI compensation strategy
According to the CSI effect in Section 3 and the deficiency of the previous CSI compensation strategies, a real-time CSI compensation strategy considering the coupling between actuators is proposed. Two main parts are involved in this section, including the proposal of the strategy and the verification of the strategy.
Proposal of the strategy
The control block diagram of the strategy is shown in Figure 7. The control strategy includes two parts: the first part (C1) is used to compensate for the interaction between actuators and load, and the second part (C2) is used to compensate for the coupling between two actuators. Block diagram of the control strategy.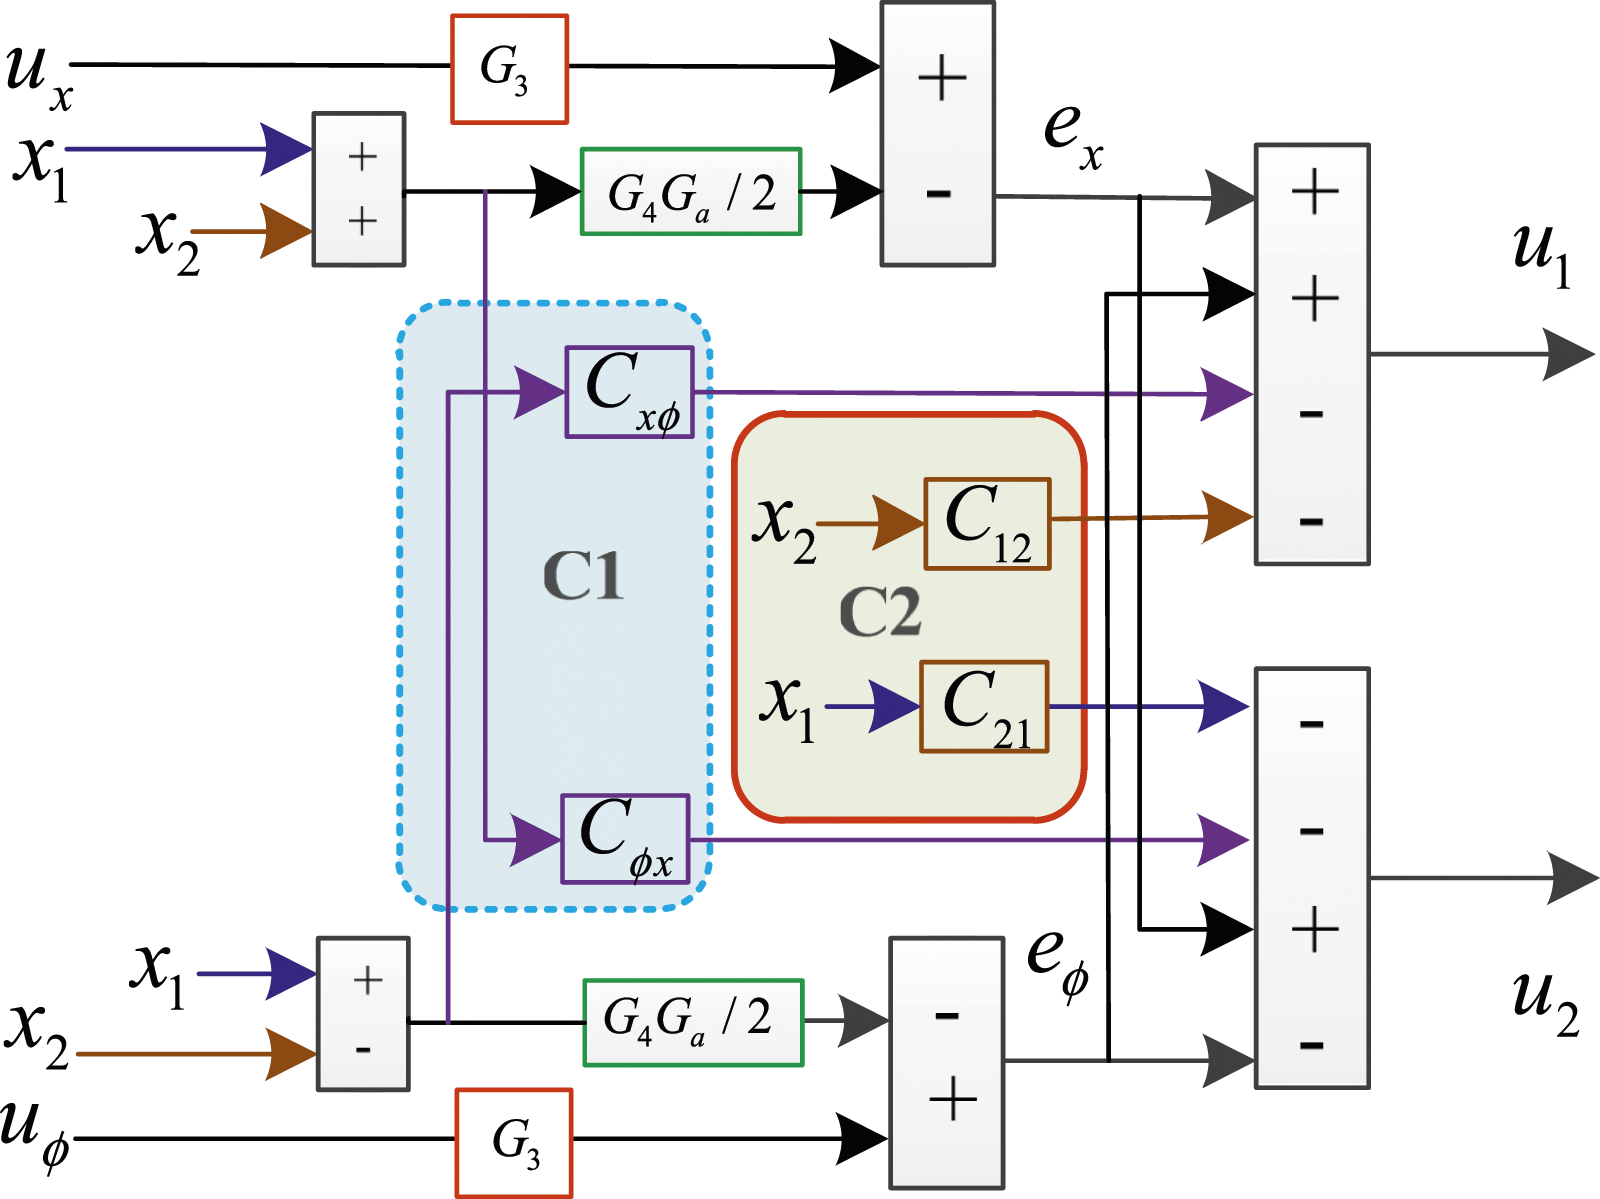
According to Figure 7 and assuming that u
ϕ
=0, the control error signals of two actuators are as follows
The following can then be obtained
Substituting Equations (16) and (17) into equation (9) to get the following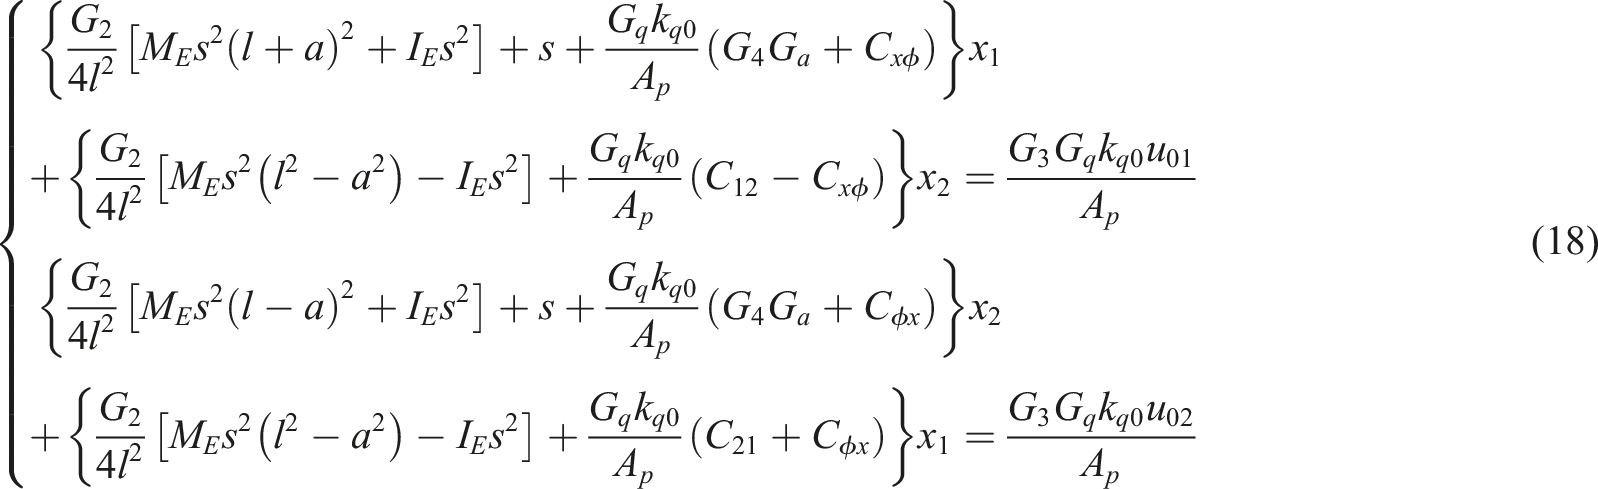
Then, C
xϕ
, C
ϕx
, C12, and C21 can be obtained as follows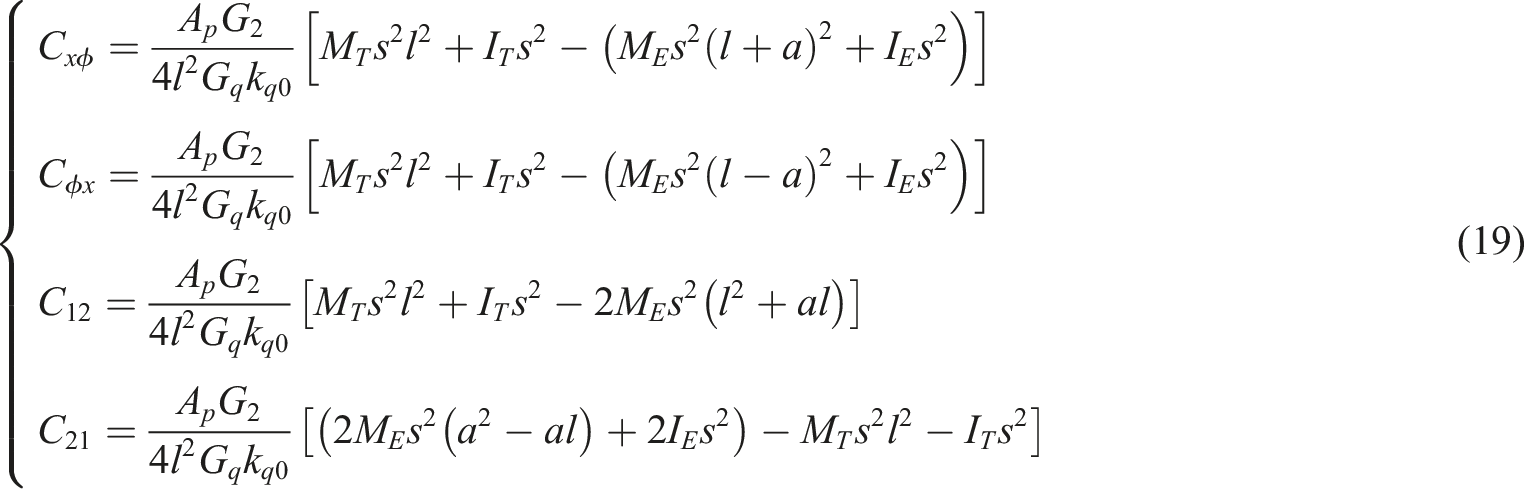
Finally, with the adoption of the strategy, the transfer function of the system is as follows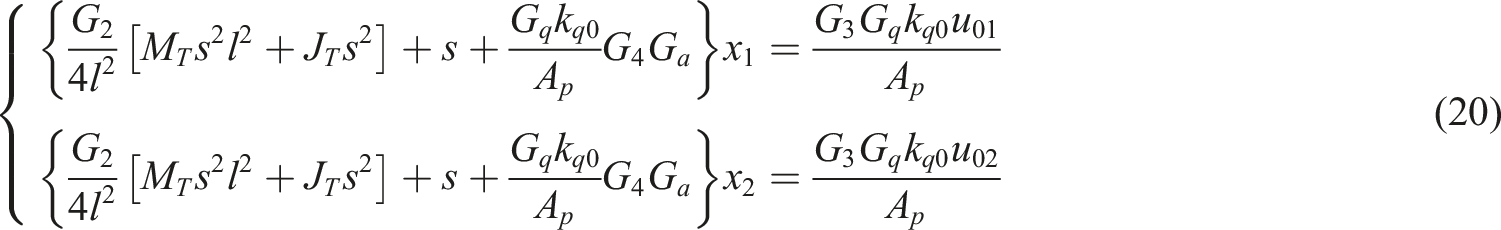
Equation (20) shows that the CSI is completely eliminated. To verify the effectiveness of the proposed strategy, comprehensive studies are conducted in frequency domain and time domain. The verification is conducted in MATLAB R2021a. In the verification process, Condition 2 in Table 2 is selected as load condition.
Frequency domain verification
Figure 8 shows the improvements of the system in frequency domain with the adoption of the proposed strategy. It can be observed from Figure 8(a) that, because of the CSI, the value of H11 is 1.50 abs at 16.20 Hz, the value of H22 is 0.71 abs at 45.30 Hz. Figure 8(b) presents that, at 20.00 Hz, the values of H12 and H21 are 0.01 abs under the reference condition, but they are 0.33 abs under the influence of the CSI. Figure 8(c) shows the value of A1 is 1.71 abs at 16.50 Hz, and the value of A2 is 0.71 abs at 32.60 Hz. Figure 8(d) displays that the value of A1 is 1.47 abs at 15.70 Hz. The values of H12 and H21 change from 0.01 abs to 0.33 abs, which means that the coupling between two actuators is amplified 33 times. According to those data collected, it can be concluded that the operating frequency band of shaking table decreases dramatically and the coupling between two actuators increases greatly. Improvements in frequency domain. (a) H11 and H22. (b) H21 and H21. (c) Actuator 1 and Actuator. (d) Shaking table.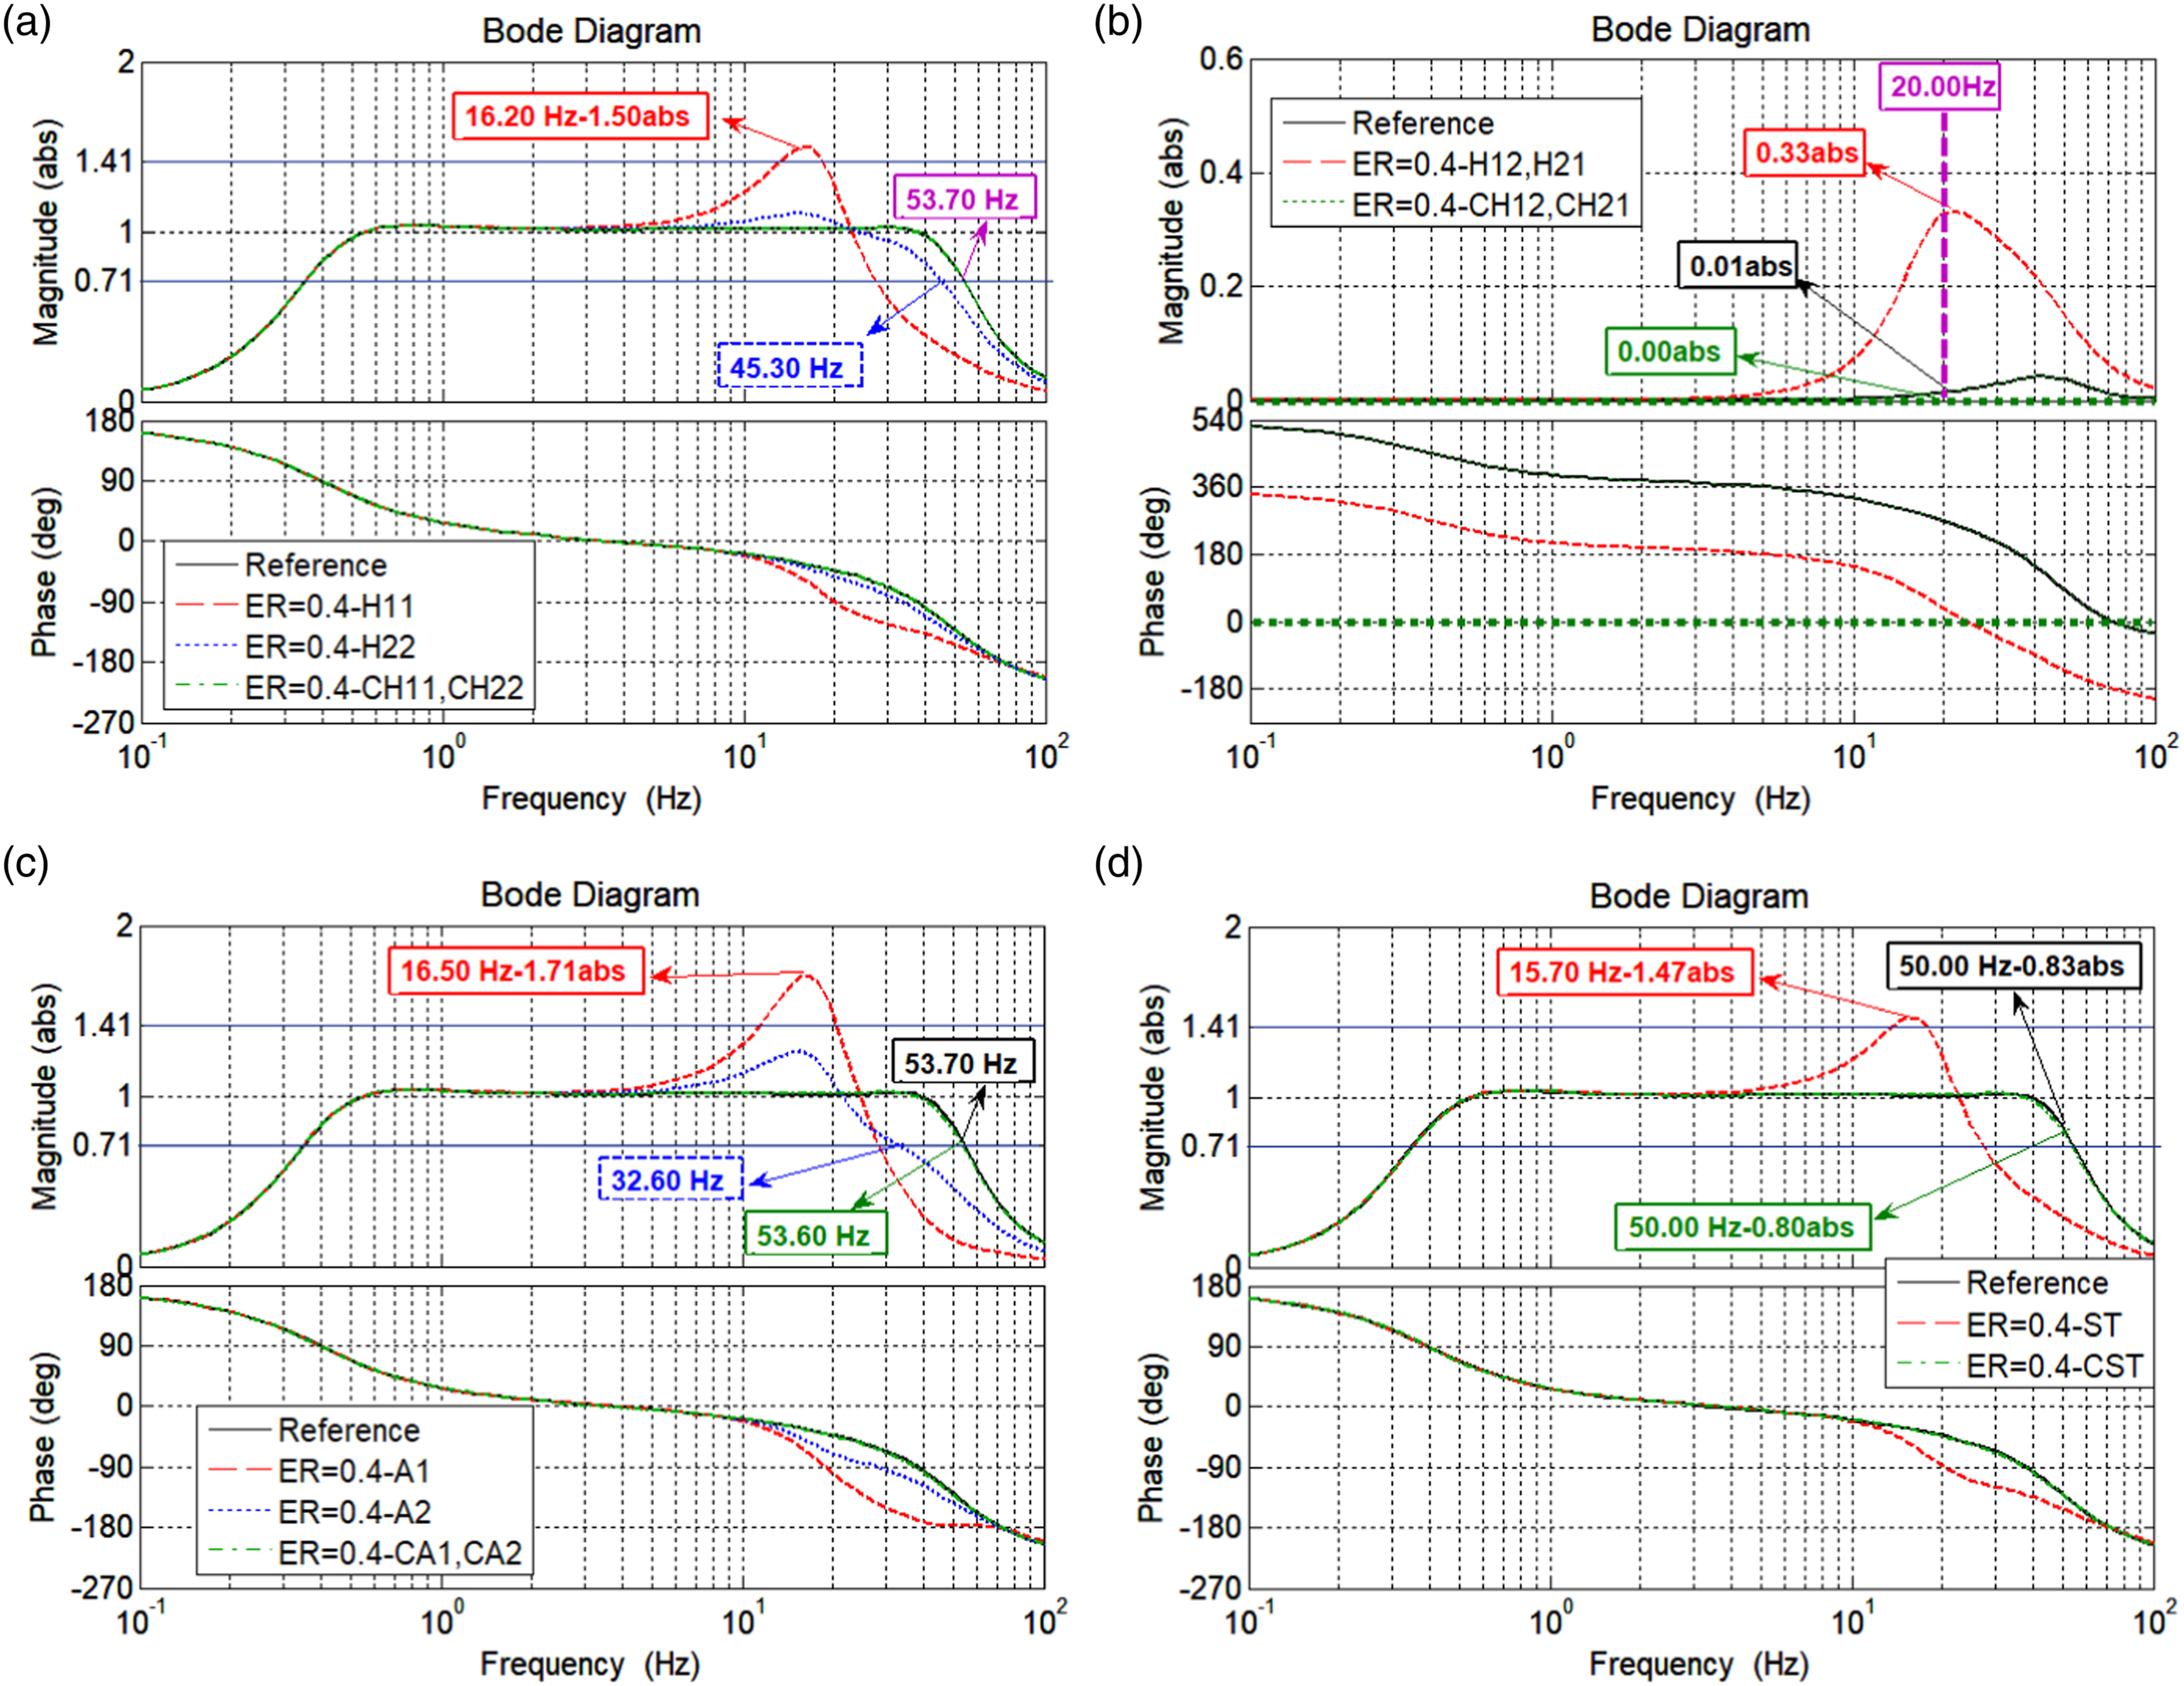
Figure 8(a) presents that with adoption of the proposed strategy, the values of CH11 and CH22 are equal to the reference condition. Figure 8(b) shows that the coupling between two actuators is 0.00 abs. Figure 8(c) shows the values of CA1 and CA2 are 0.71 abs at 53.60 Hz, and the value of the reference is 0.71 abs at 53.70 Hz. It can be observed from Figure 8(d) that, the value of CST is 0.80 abs at 53.00 Hz, and the value of the reference is 0.83 abs at 50.00 Hz. The changes of effective frequency band (from 53.60 Hz to 53.70 Hz) and amplitude frequency characteristic (from 0.80 abs to 0.83 abs) are no more than the range of ±3.75%. Those data show that the coupling of two actuators is eliminated and the CSI effect is compensated effectively.
Time domain verification
The earthquake ground motion records, El Centro-NS records with peak ground acceleration of 342cm/s2, is 3 times compressed and thereby forms input signal in the case study to reveal system characteristics at different frequency points. In order to reflect system characteristics more comprehensively, the precision of the records replication and the errors of synchronous and tracking control are used to estimate the effectiveness of the proposed strategy.
Figure 9 represents the replication of the motion records and the evaluation of the replication. To facilitate observation and comparation, the replication from 6.2 s to 6.3 s is partially enlarged. It can be observed from Figure 9(a) that, at 6.28 s, the replication results of A1 and A2 are 143.6 cm/s2 and 107.4 cm/s2, respectively, that of the reference condition is 76.99 cm/s2, and the replication results of the C-A1,A2,ST are 75.14 cm/s2. Those data prove that the strategy can compensate the CSI between the shaking table and the eccentric load effectively at 6.28 s. Precisions of the replication. (a) Time wave replication. (b) Indices for evaluation of the replication.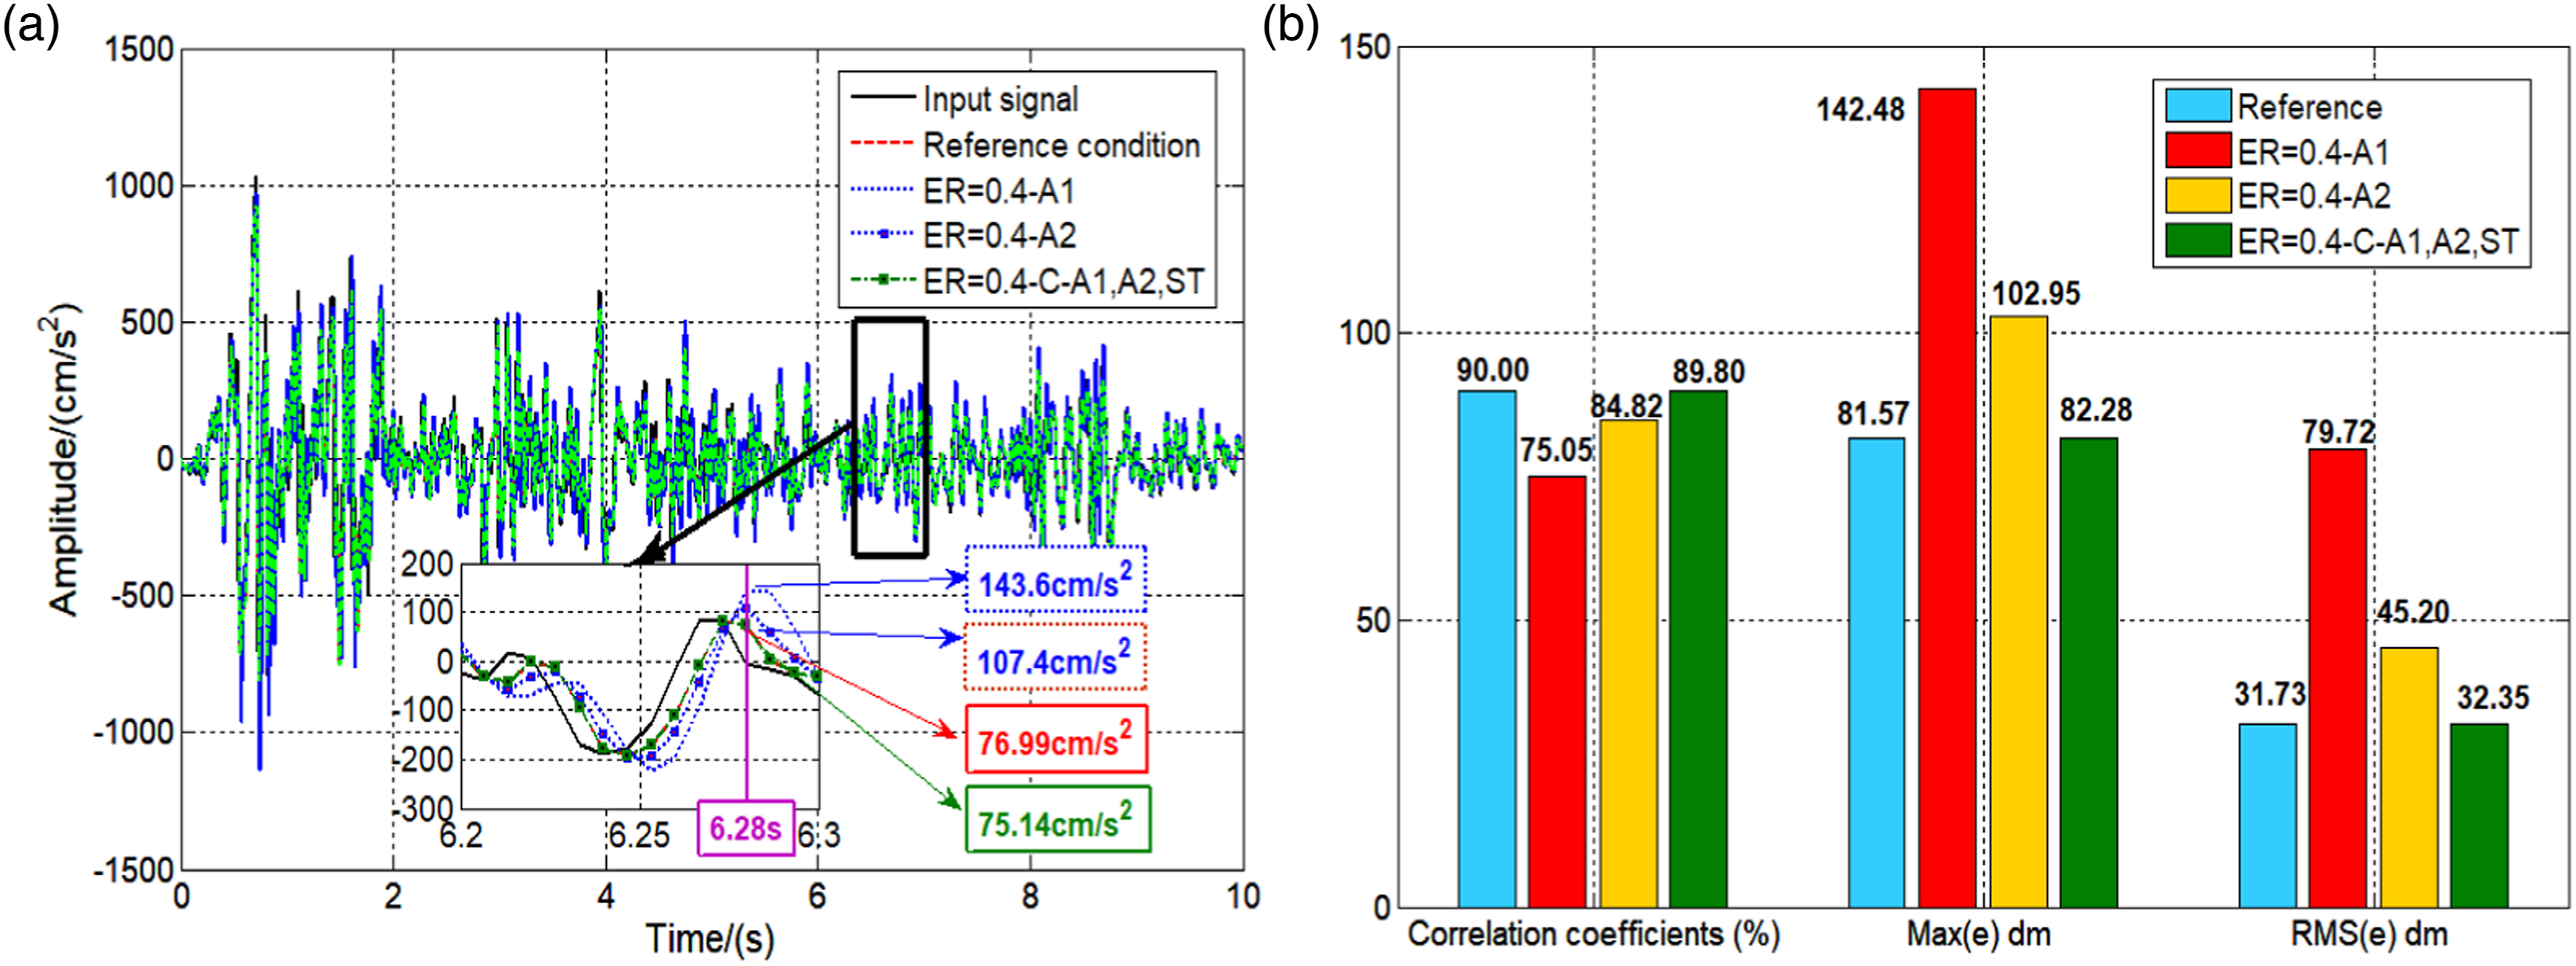
To further substantiate the effectiveness of the proposed strategy, the replication accuracy of the ground motion records is analysed. Figure 9(b) shows the replication evaluation indices before and after compensation. It can be seen from Figure 9(b) that before compensation, the waveform correlation coefficients of actuators 1 and 2 are 75.05% and 84.32%, respectively. After compensation, actuators 1 and 2 move synchronously, and the correlation coefficient of the replication waveform is 89.80%. The maximum waveform replication errors of actuators 1 and 2 are 82.28 dm after compensation, but they are 142.48 dm and 102.95 dm before compensation. The root mean square (RMS) values of the waveform replication errors of actuators 1 and 2 are 32.35 dm after compensation, but they are 79.72 dm and 45.20 dm, respectively, before compensation.
According to those data collected, it can be concluded that the waveform correlation coefficients of the two actuators after compensation are increased by 14.75% and 5.48%, the maximum values of errors are reduced by 42.25% and 20.08%, and the RMS values of errors are reduced by 59.42% and 28.43%, respectively. In addition, the index difference between the reference condition and the compensation condition does not exceed the range of ±2%. The improvement in the replication accuracy of ground motion records shows that the proposed compensation strategy is effective. These results clearly demonstrate that higher precision of wave replication performance can be achieved when the proposed strategy is applied.
The synchronous control error and the tracking control error are shown in Figure 10. Figure 10(a) shows the synchronous control error between two actuators is 33.65 cm/s2 at 6.28 s. And with the application of the strategy, the synchronous control error between two actuators is 0.00 cm/s2. Figure 10(b) shows at 6.28 s, the tracking errors between reference signal and two actuators are −149.9 cm/s2 and −113.7 cm/s2, respectively. And with the adoption of the strategy, the tracking errors are −83.29 cm/s2. It indicates that the tracking error is decreased by at least 26.74%. It can be concluded from Figure 10 that the strategy can reduce the synchronous error and the tracking error significantly, showing the effectiveness of the proposed strategy. Control errors of the replication. (a) Synchronous control error. (b) Tracking control error.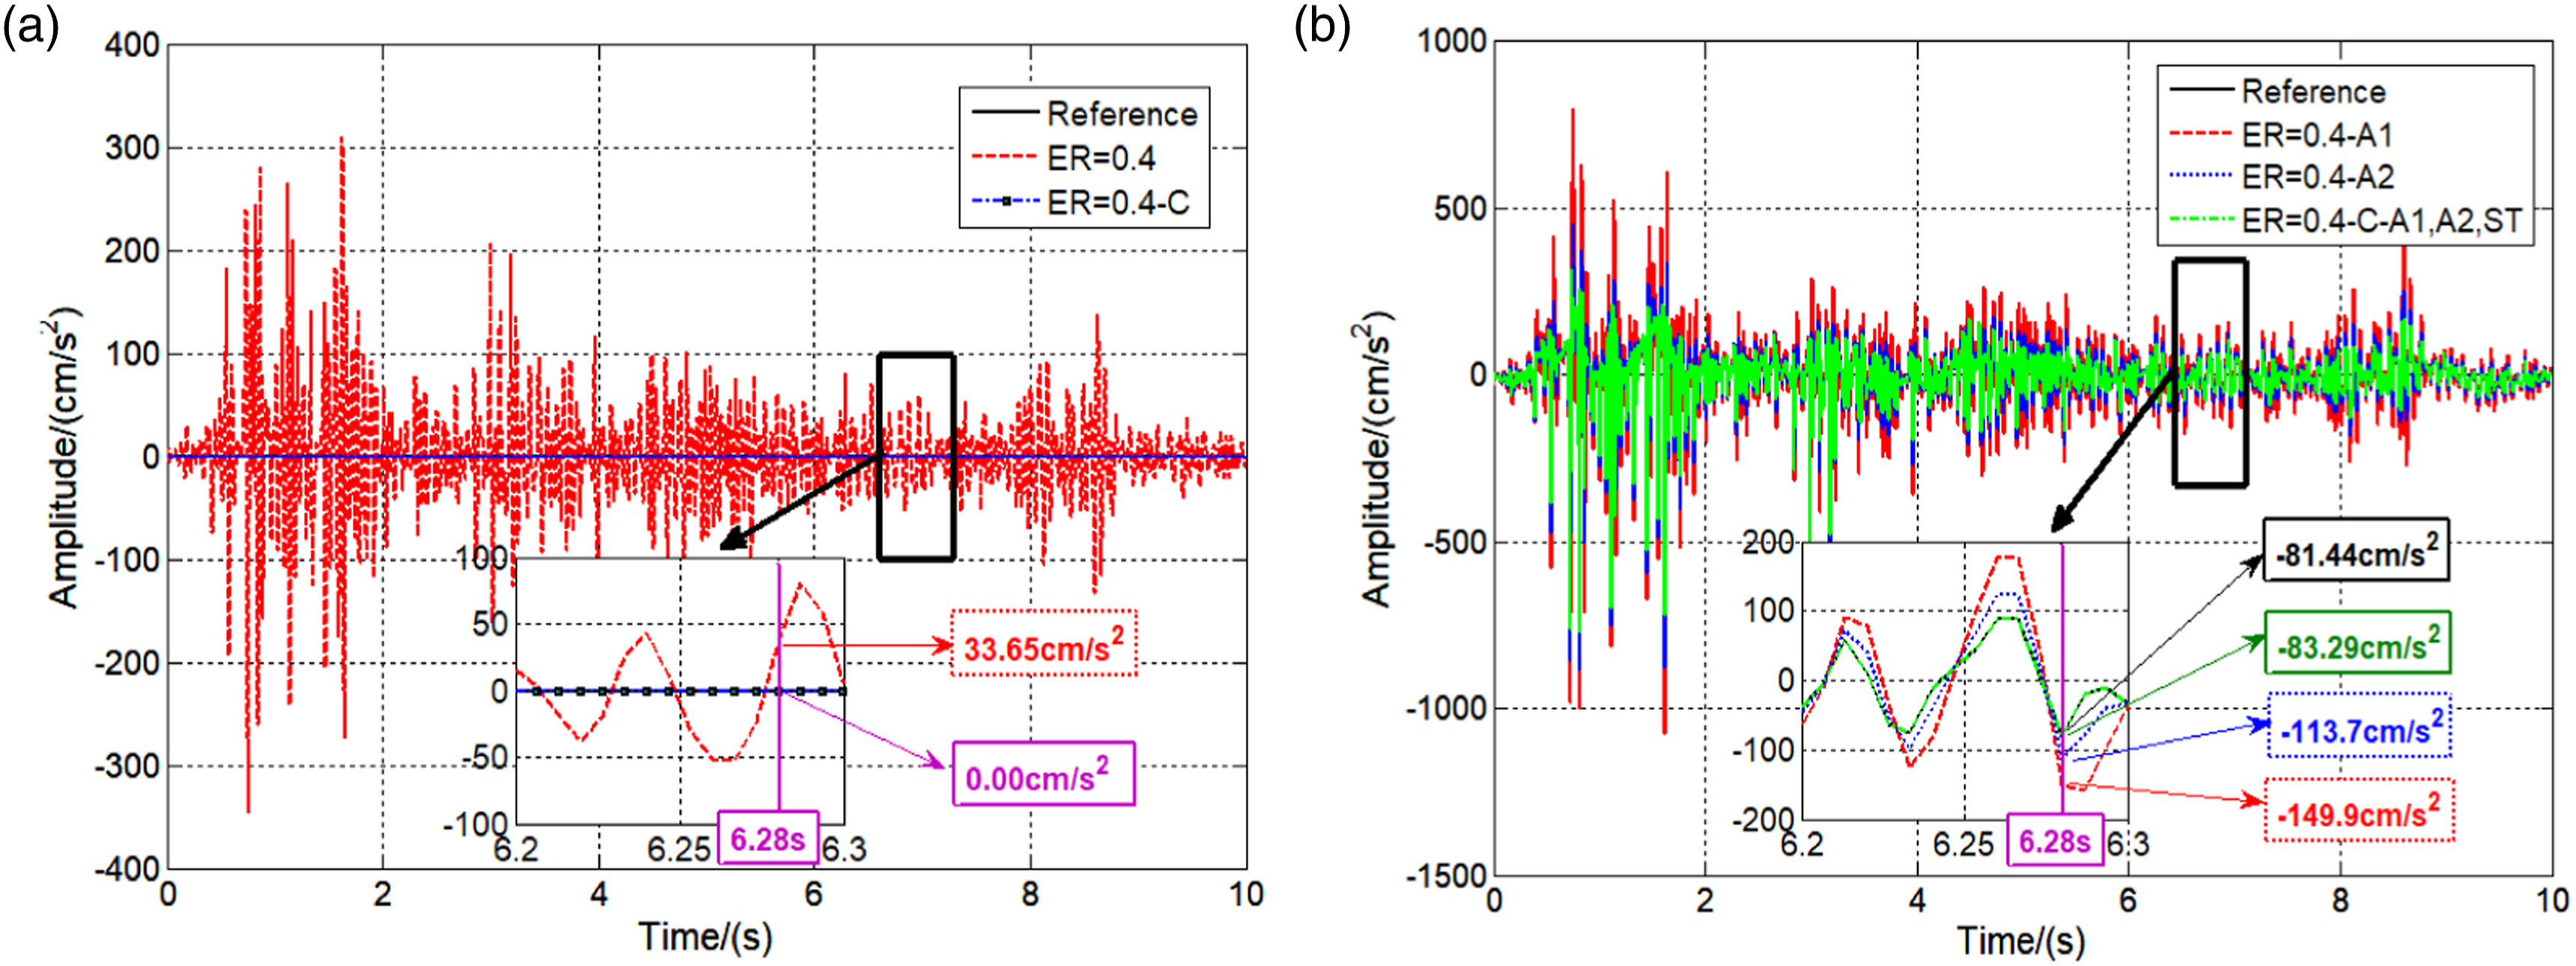
According to the validations in time domain and frequency domain, it can be verified that the proposed strategy can not only obtain better performance in replicating the expected records, but also achieve successful synchronization and better tracking performance. Therefore, the accuracy of shaking table test can be improved by the proposed strategy.
Conclusions
This study establishes a transfer function matrix to investigate the CSI between shaking table and eccentric load. In the investigation, shaking table and eccentric load are regarded as an integrated whole. A transfer function matrix of the integrated whole is established. Based on the transfer function matrix, a comprehensive investigation is conducted under different ER conditions. The influence trend and degree of the CSI are obtained. More importantly, a real-time control strategy considering the coupling between actuators is proposed to compensate for the CSI. The most important conclusions are as follows: 1. The CSI has great effect on the transfer function matrix (H11 and H12/H21), the two actuators, and the shaking table at the resonance peak of oil column frequency and its surrounding frequency band under different ER condition. a) When the ER = 06, the CSI leads to the working frequency range of H11 decreases from 0.4–53.70 Hz to 0.4–11.40 Hz. b) When the ER=04, the actuator coupling (H12/H21) is amplified 33 times at 20.00 Hz. c) Although the impact of CSI on H22 is not obvious, the impact of CSI on actuator 2 becomes significant because the actuator coupling increases greatly. d) Two actuators will not move synchronously and shaking table will twist under the influence of the CSI. 2. The proposed strategy considering actuator coupling proves to be effective in compensating for the CSI between shaking table and eccentric load. It can improve the accuracy of the shaking table test. a) The proposed strategy can fully eliminate the actuator coupling. b) The proposed strategy can not only obtain better performance in replicating the expected records but can also achieve successful synchronization and better tracking performance. It is worth pointing out that the correlation coefficients of ground motion records of two actuators are improved by 14.75% and 5.48%, respectively. 3. It is worthy to conduct experimental validation to further improve the proposed control strategy in the future.
Footnotes
Declaration of conflicting interests
The author(s) declared no potential conflicts of interest with respect to the research, authorship, and publication of this article.
Funding
The author(s) disclosed receipt of the following financial support for the research, authorship, and/or publication of this article: This work is supported by the National Natural Science Foundation of China under Grant No. 52208221, China Postdoctoral Science Foundation under Grant No. 2021M692972, and Opening Project of Key Laboratory of Beijing University of Technology under Grant No. 2021B01, and Key Projects of Key Laboratory of Urban Security and Disaster Engineering of China Ministry of Education (2023).