
Abstract
Weak fault detection is still a hotspot in these years. The key of this work is to enhance the ratio of signal to noise (SNR). Then a new extraction method of weak fault impact based on amplification algorithm is proposed. Since the fault impact is related to bigger derivative, the amplification function combined with the derivative of the vibration signal is used to amplify the amplitude of the impact. Then Sparse Spike Deconvolution (SSD) which has been widely used in earthquake for impact detection is able to extract small impact from the signal processed by amplification function. Then, in order to enhance the periodicity of fault impacts, the compression function is used to compress the amplitude of bigger impacts according to different scales. At last, the experiment result shows that the proposed method is more effective than the common envelope analysis.
Introduction
Rolling elements Bearing is an important part of mechanical machine. Once damage happens on the surface of the bearing track or rollers, large damage may be occurred in the whole machine. Thus bearing diagnosis should be taken into full consideration for the normal machine operation. So far, many different fault detection methods have been applied for the engineering problem. For example, resonance demodulation which is a classic diagnosis has been used for several decades and developed into many new methods in these years. Spectral kurtosis 1 is one of the most successful modified envelope analysis methods, which is widely used in practical engineering problem. However, this method cannot find the most optimum frequency band with high SNR for band-pass filtering which is an important part of the envelope analysis. Thus, many new methods which intend to find optimal band are proposed. Gu 2 applied Morlet wavelet filter to find the best envelope parameters containing filtering band and filter construction. Randall 3 used GA to find the optimal band with high SNR for the extraction of envelope spectrum. However, since the weak fault energy is very low, it is not easy to obtain effective envelope spectrum only by searching optimal band.
Then some other fault detection methods based on intelligent algorithms are proposed. Guo 4 used network to extract weak fault feature as the health indicator which can tell the damage degree. And the support vector5-8 is trained for weak fault recognition. Markov model9-12 is also a popular tool for weak fault detection, which can decrease the effect of the random noise. However, these methods based on intelligent algorithm cannot precisely describe the real damage degree of the bearing, which just use the basic data characteristics to extract the fault feature without relating to the physical principle. When the damage occurs on the surface of the race order, the fault impact amplitude can indicate the real damage degree. Thus fault impact recognition and extraction is still an important way to detect the weak fault.
Then SSD13-15 which is widely used in earthquake impact detection can be used here for fault extraction. Shulin Pan16-18 has contributed a lot to the field of SSD and made a great progress on it in these years. His research proves that this algorithm is sensitive to impact based on sparsity assumption. Then a new weak fault impact extraction method based on amplification-compression function and SSD is proposed. Firstly, the amplification function is used to amplify the amplitude of the weak impact. Then the amplified signal is decomposed into impact train using sparse spike deconvolution which can decrease the influence of the gaussian noise. Then the compression function is used to compress the extracted impact amplitude, which can reduce noise influence. In the end, the fault vibration data of rolling bearing is used to verify the effectiveness of the proposed method. And a common method is used as comparison. The contribution of this paper is to proposed a method to amplify the weak fault of the bearing by amplifying the peaks which may relate to the fault impact. And every peak amplification scale is set according to derivative of the peak. And the differences of the peak amplitudes after amplification are bigger. Then compression method is used to decrease the bigger peak amplitude so that the fault impact periodicity can be strengthened. And the SSD can be applied to extract the amplified-compressed impact.
The principle of weak fault impact detection
The principle of amplified function
Since the derivative of fault impact is bigger than the one of many other vibration components, an amplification function combined with the signal derivative is built to enhance the fault impact amplitude. And the amplification function is shown as follows

The principle of sparse spike deconvolution
Sparse spike deconvolution is a popular algorithm which is widely used to detect impact in earthquake. This model of the algorithm assumes that the earth structure can be represented adequately by a set of planar layers of constant impedance, which is shown as follows


Then another important formula is used here as follows


While the second term which is regularization term is shown as follows


Based on the above formula, another one can be deduced as follows (1) Set the regularization parameter μ (2) Calculate matrix R and g (3) Use (4) Then the iteration can be conducted to calculate x and Q by following formula (5) The iteration doesn’t stop until k reached its predetermined value.


The principle of compression procession
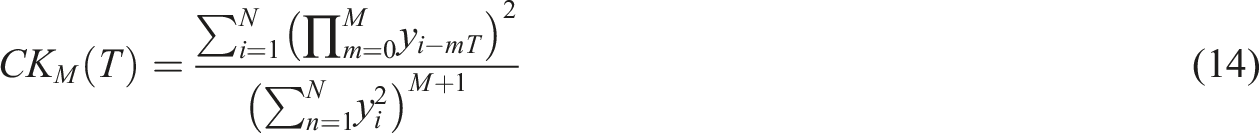
After the above procession, small impacts in the signal are amplified. However, the amplitude sizes of initial fault impacts are obviously different. Some of them are bigger while others are small or even not detected. Then if original signal is just processed by equation (1), the amplitude differences of these fault impacts would become extremely larger, which would weaken fault periodicity. Moreover, some small noise with bigger derivative is also amplified, which can negatively affect the SNR. Then clear fault frequency with its harmonics may not be clearly shown in envelope spectrum. Thus, the amplitudes of bigger impacts should be compressed to strengthen fault periodicity. As the amplitude of fault impact and amplified noise is compressed down to the similar size, the total energy of all fault impacts in the signal will be more apparent than the noise energy. Then the scanning compression method is used to reduce the bigger impact amplitudes. First, we can set several thresholds which should be set as follows

Here, Flow chart of proposed method.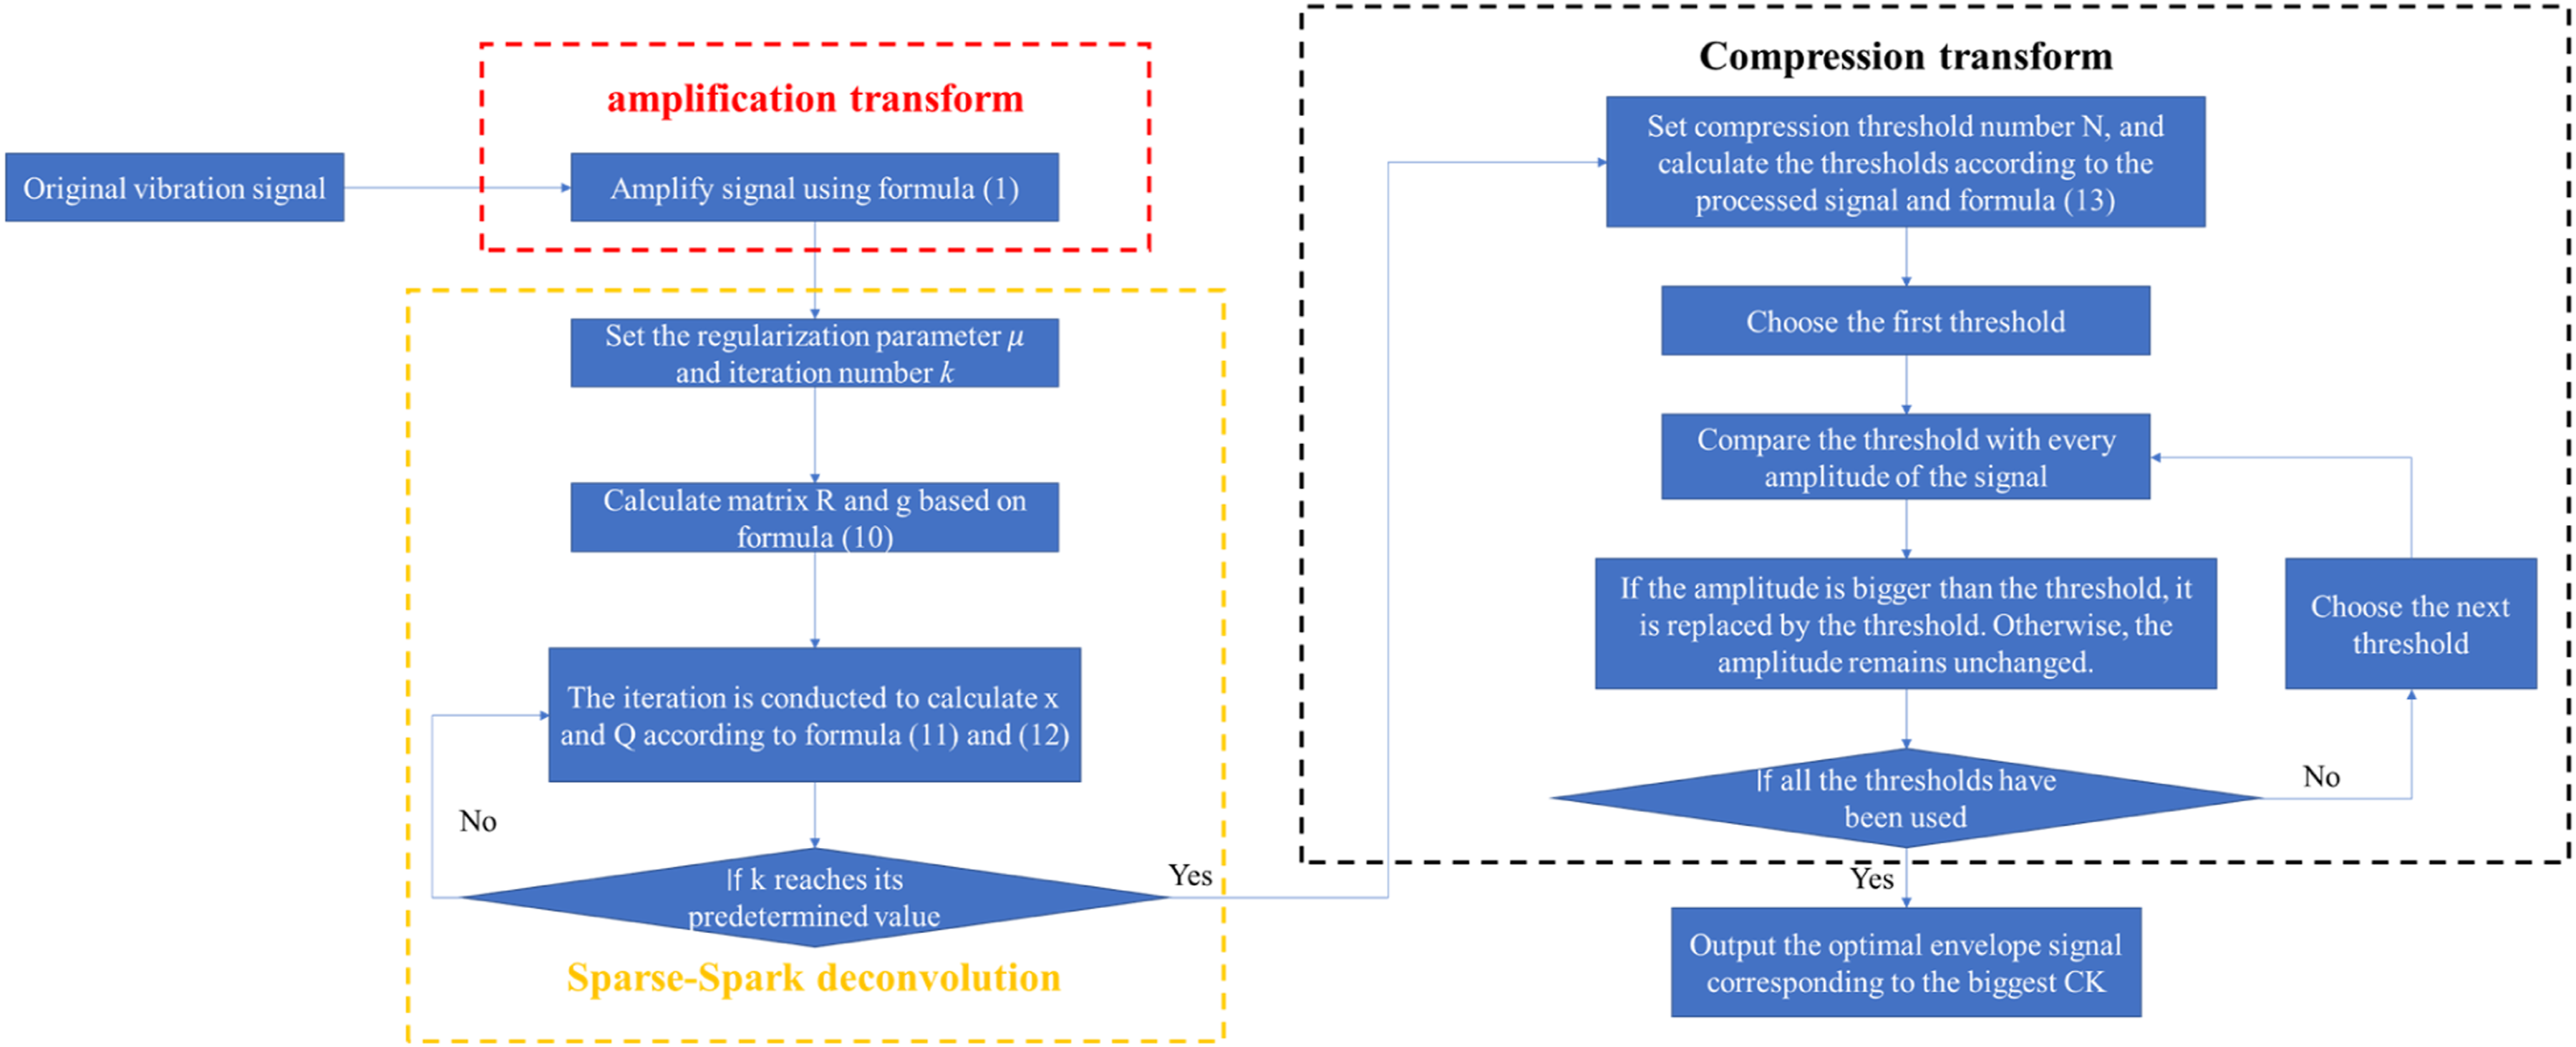
The flow chart of the whole proposed method is shown as follows:
Simulated validation
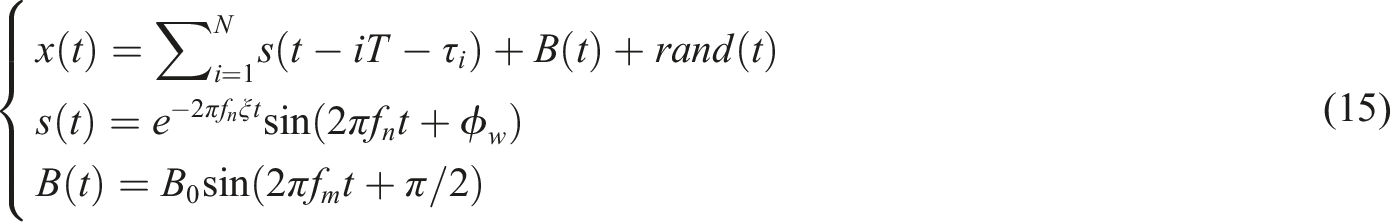
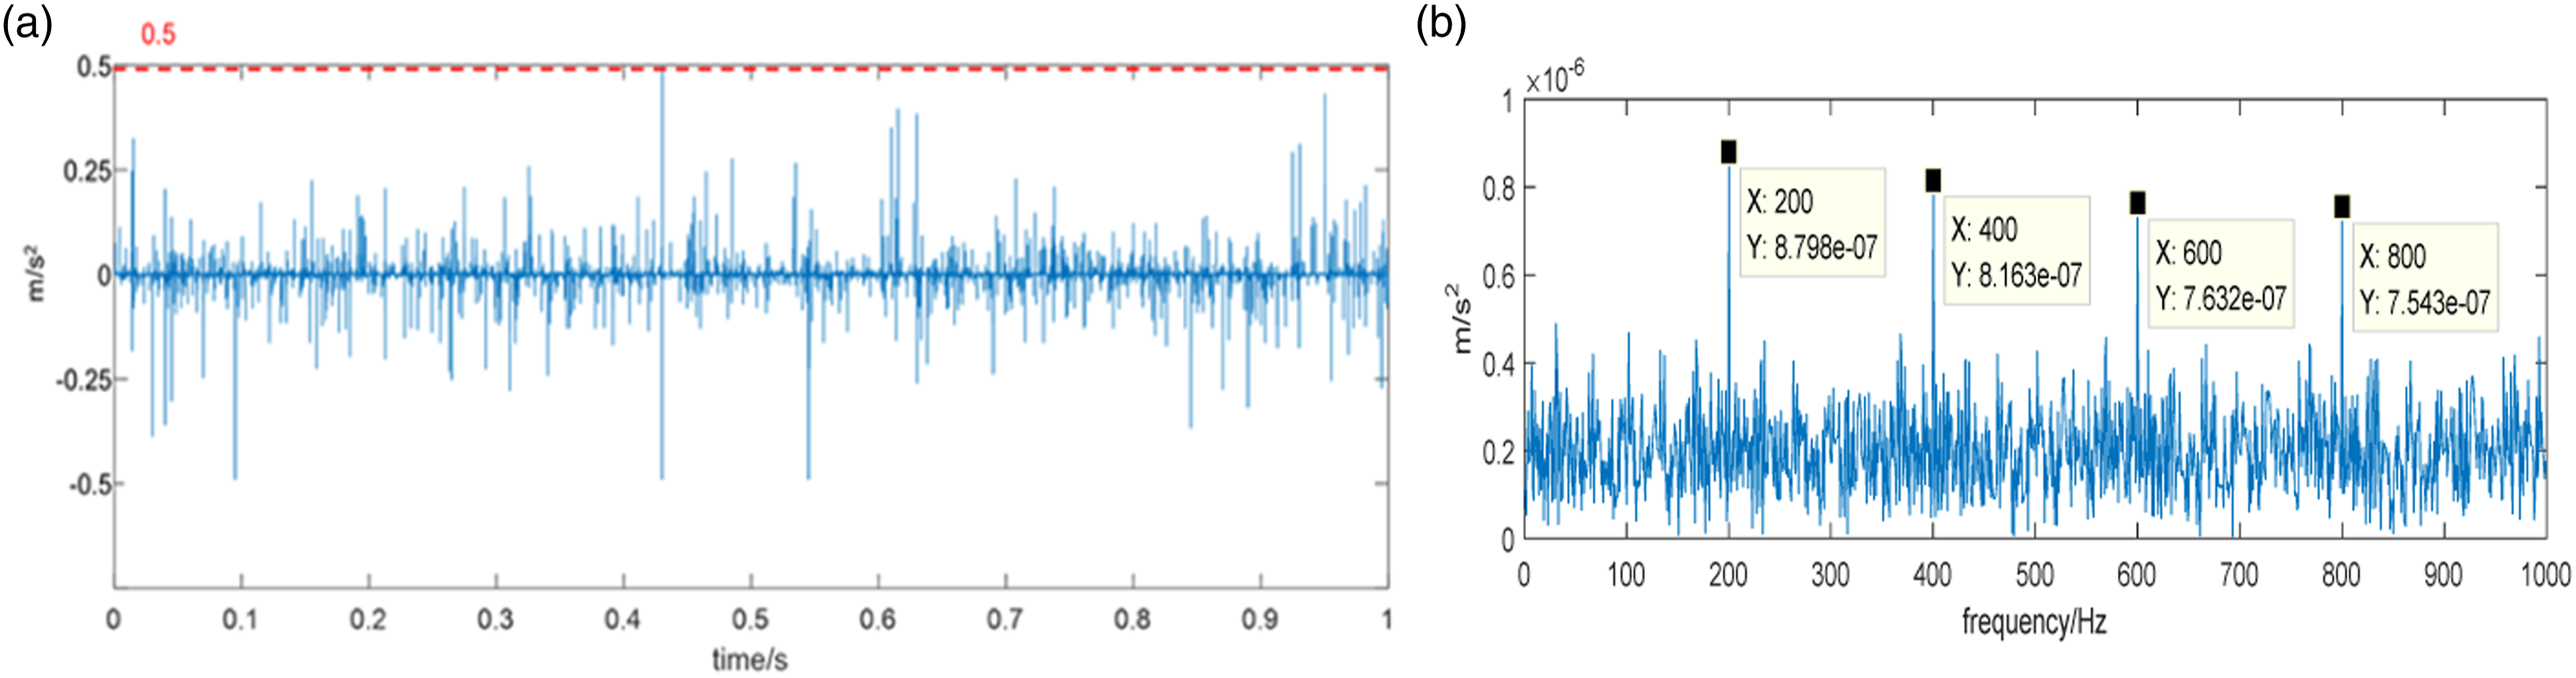
The simulated fault signal is used here to validate the effectiveness of the proposed method, whose model is shown as follow
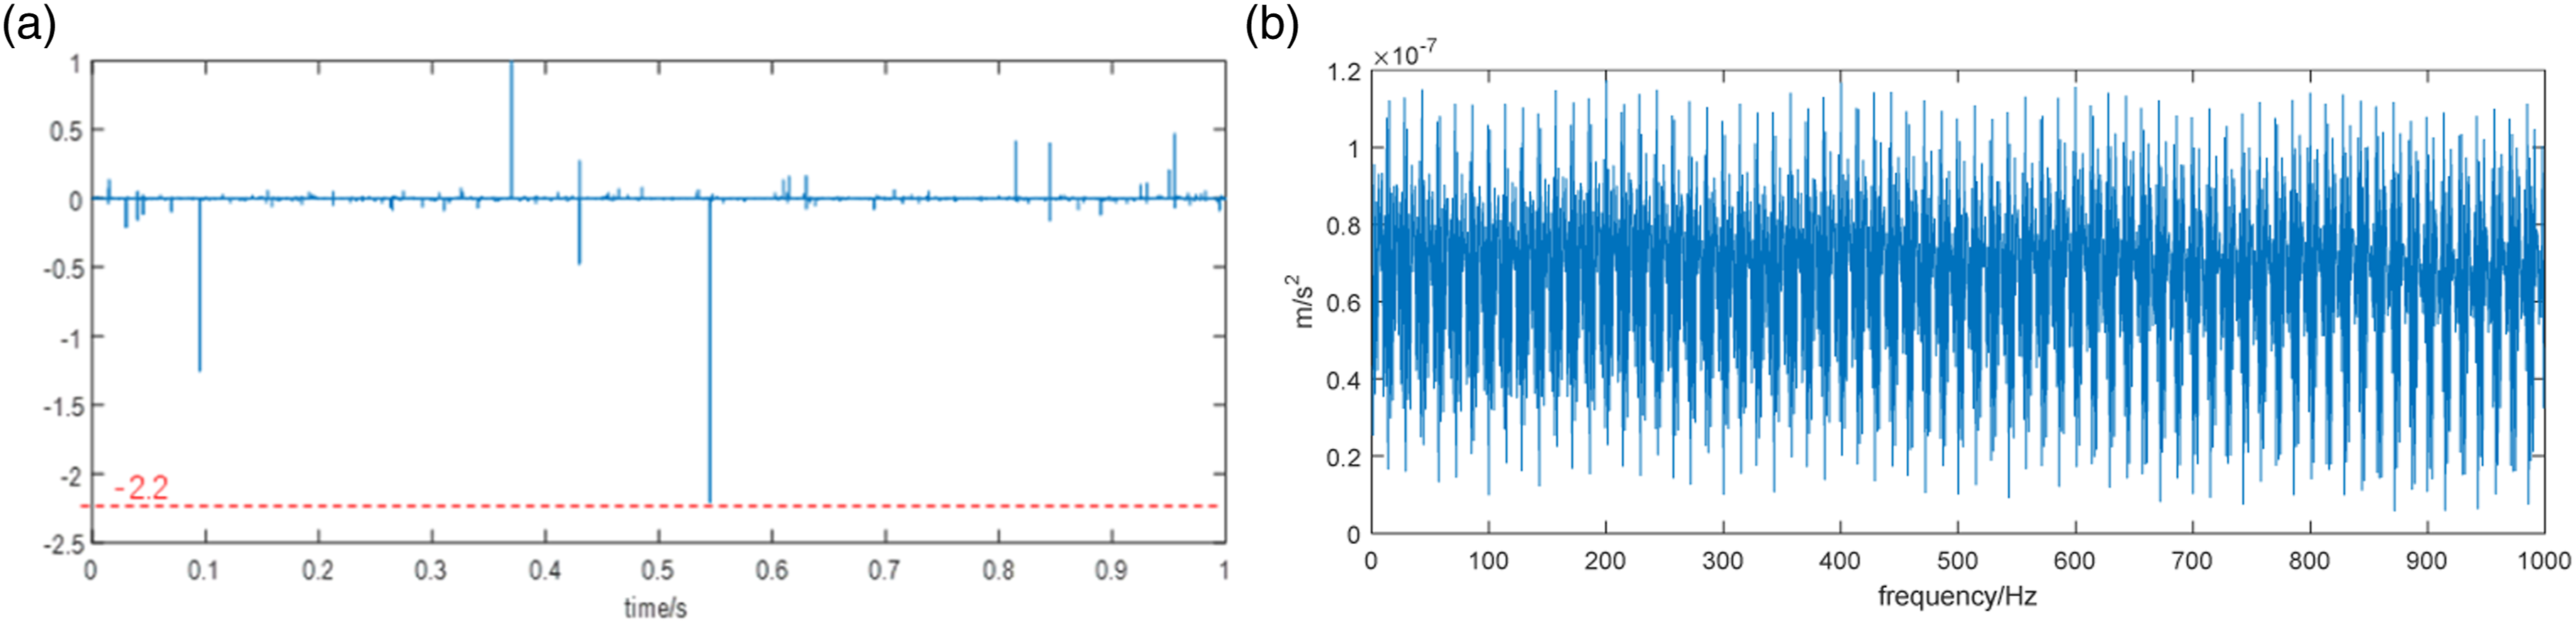
Simulated fault signal (a) Timewave of simulated Fault signal (b )frequency spectrum of simulated fault signal.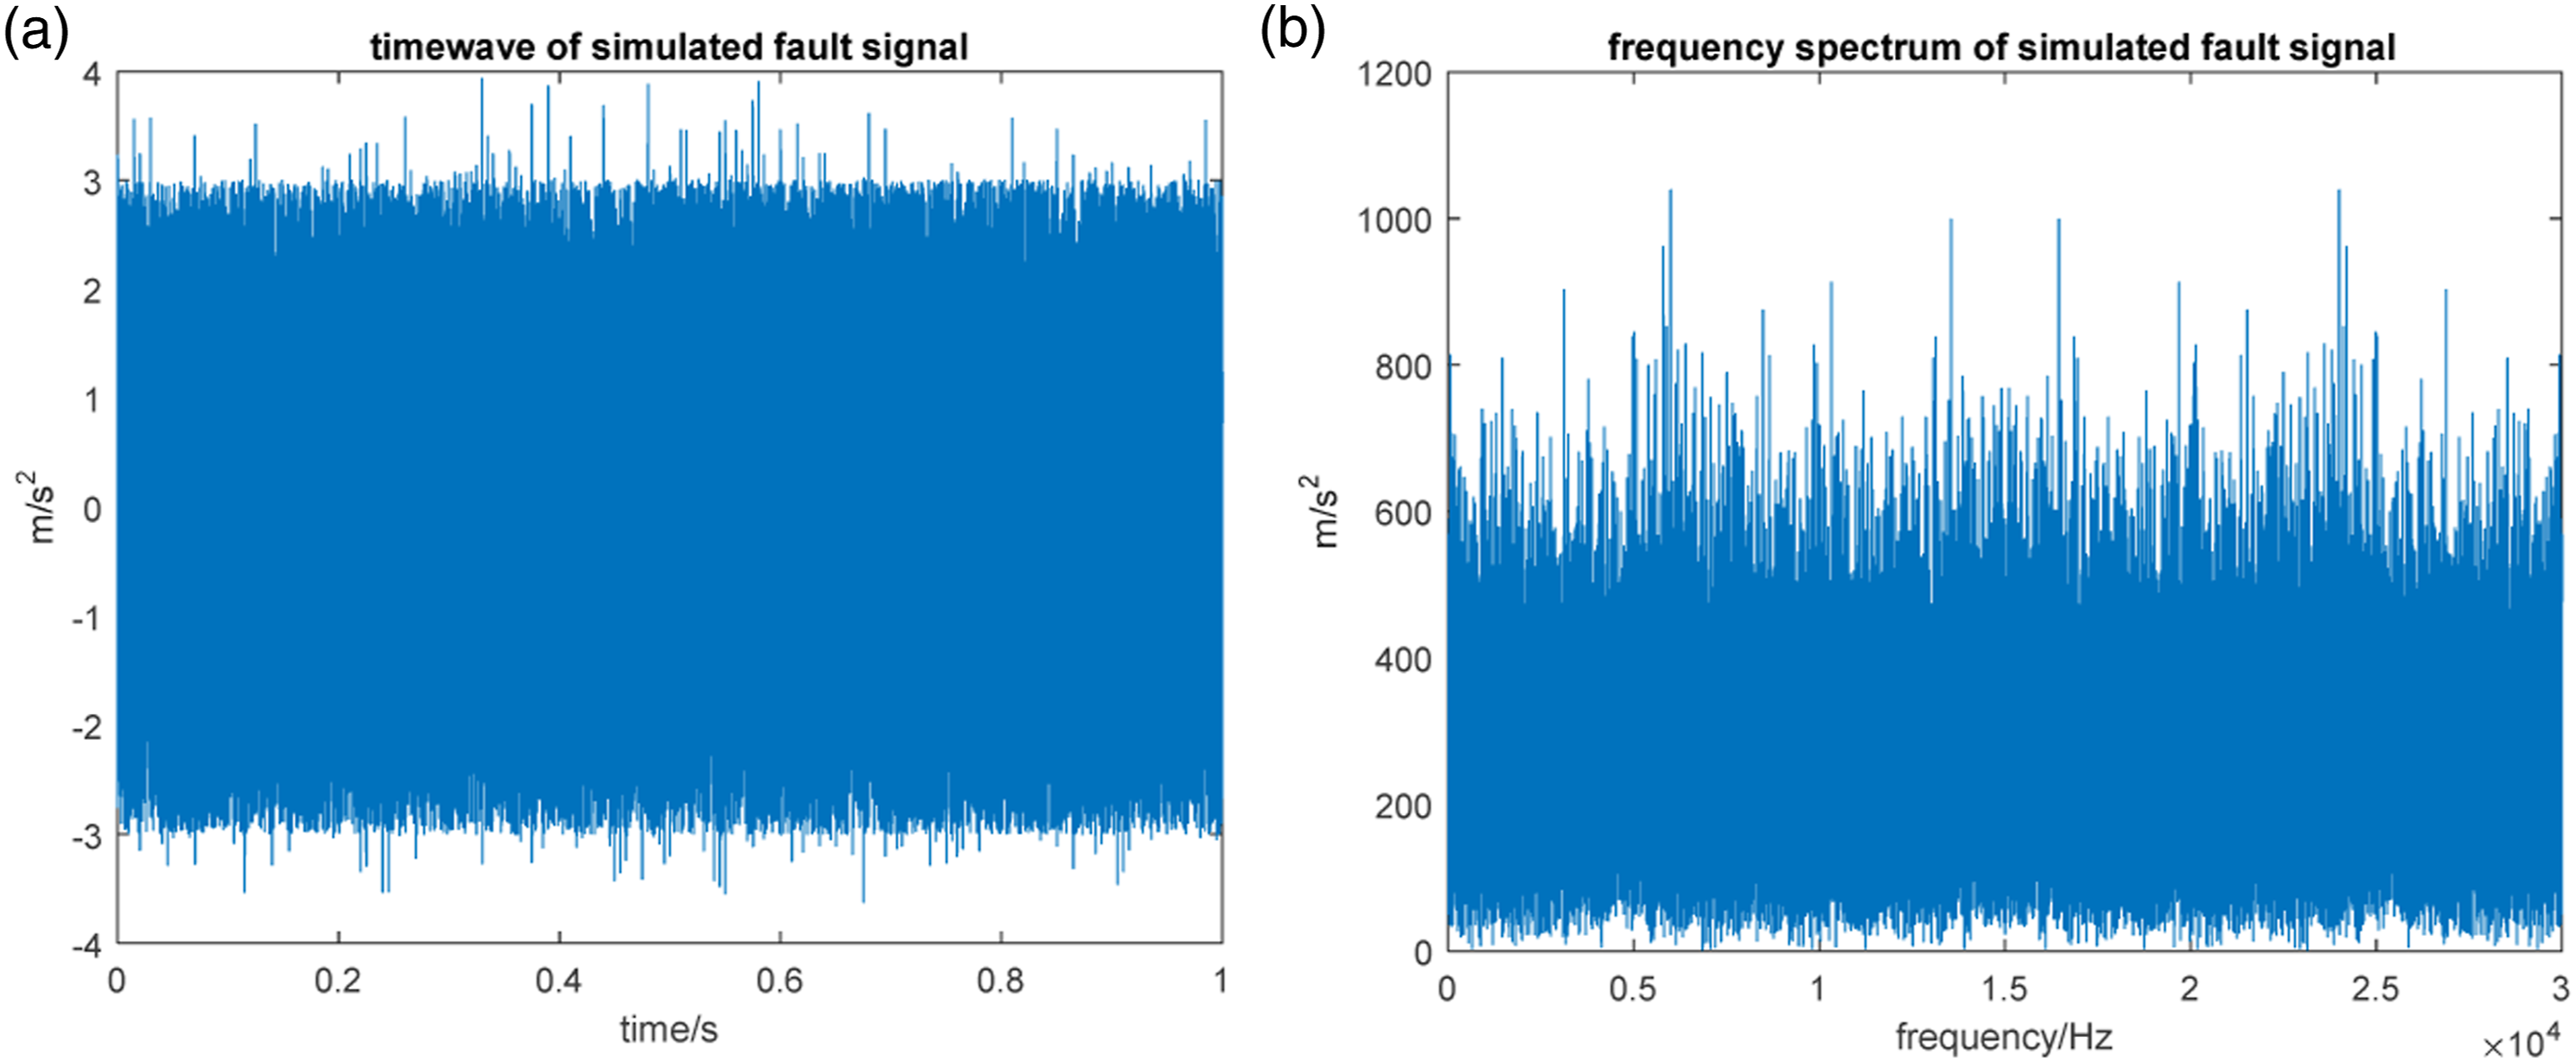
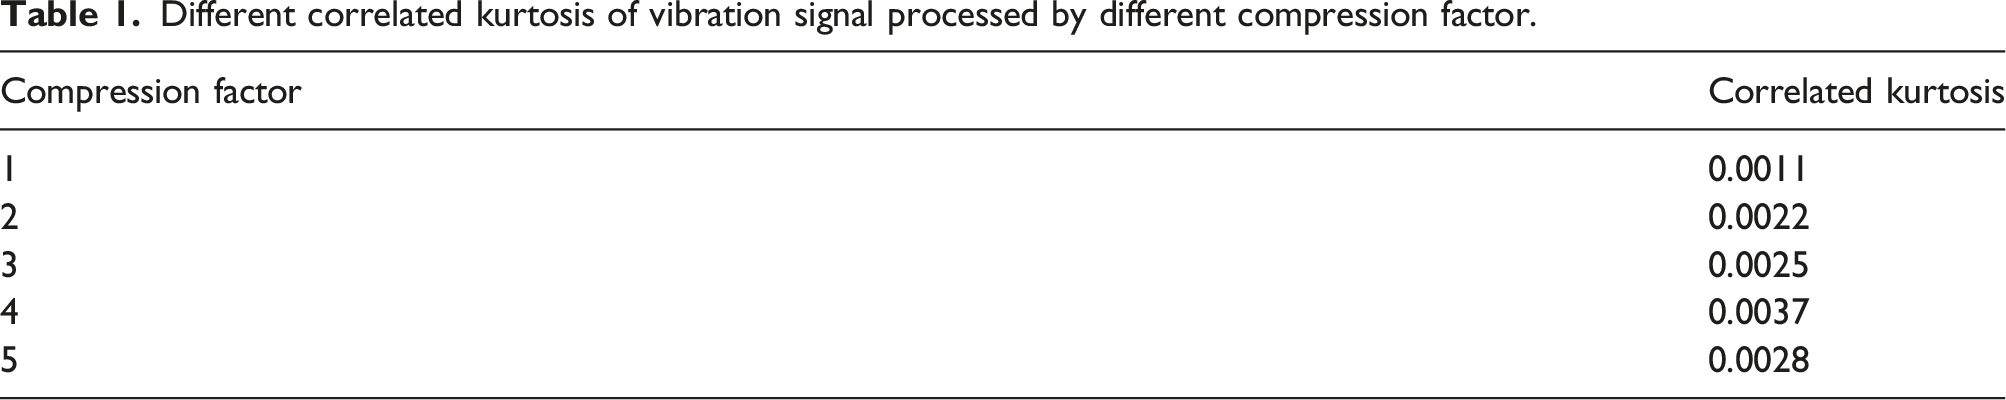
Different correlated kurtosis of vibration signal processed by different compression factor.
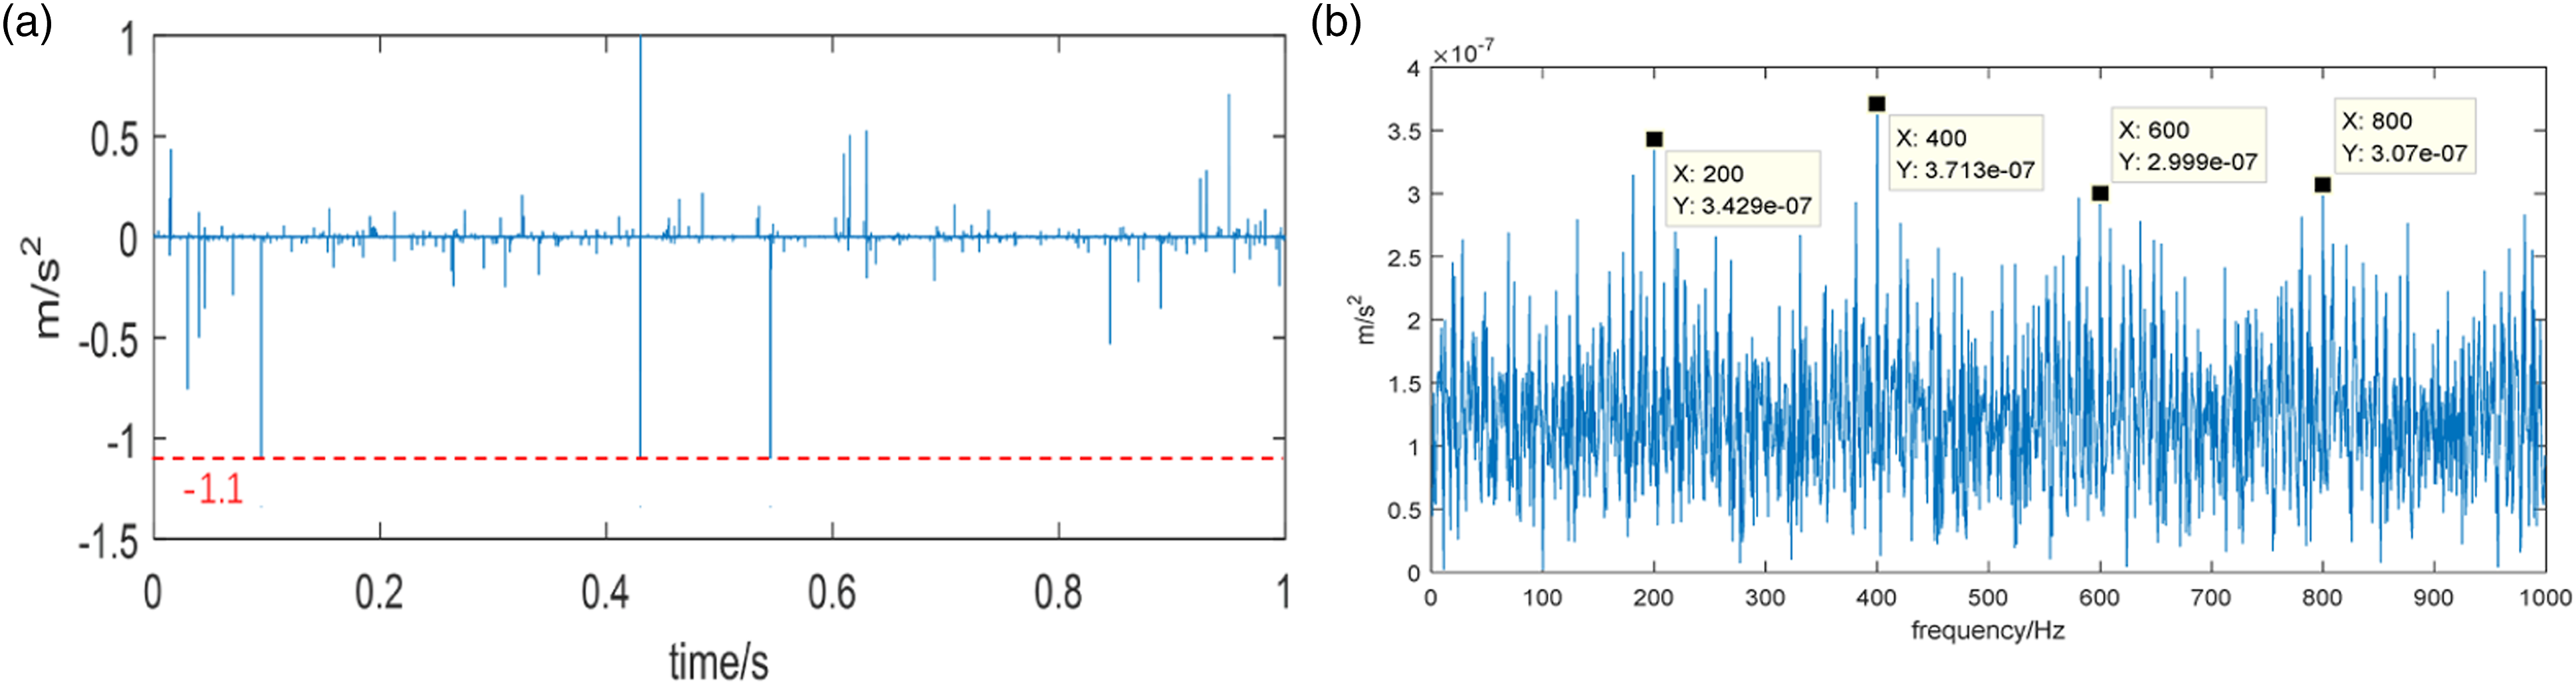
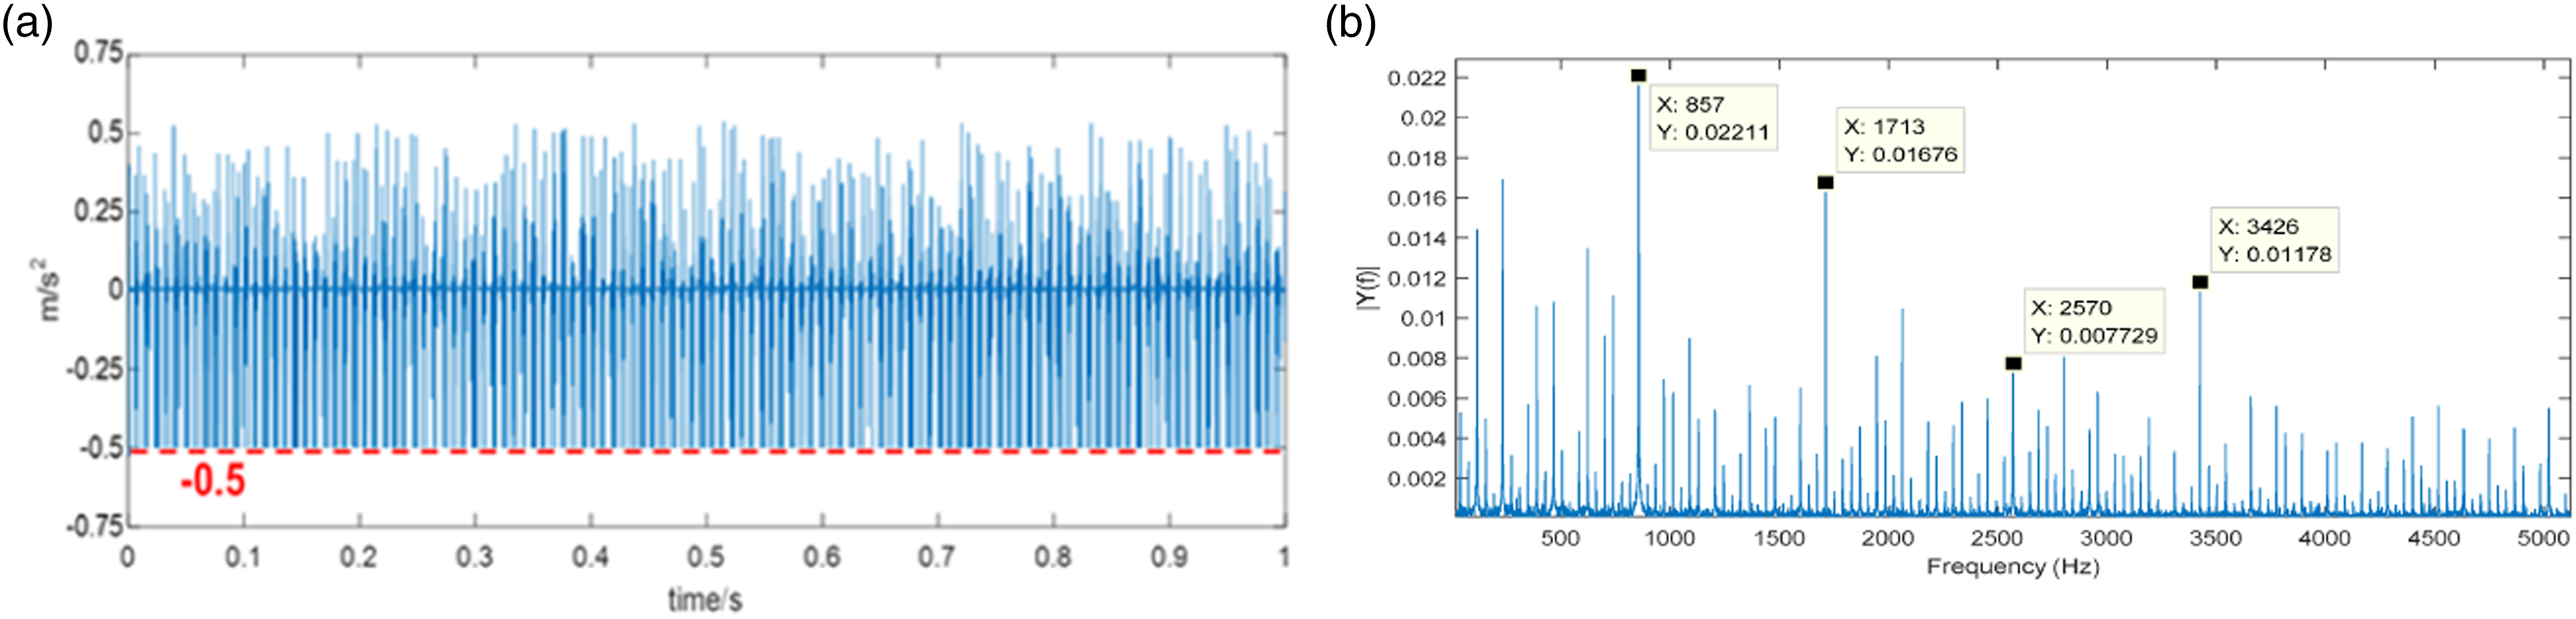
Timewave and the corresponding envelope spectrum (n = 1,
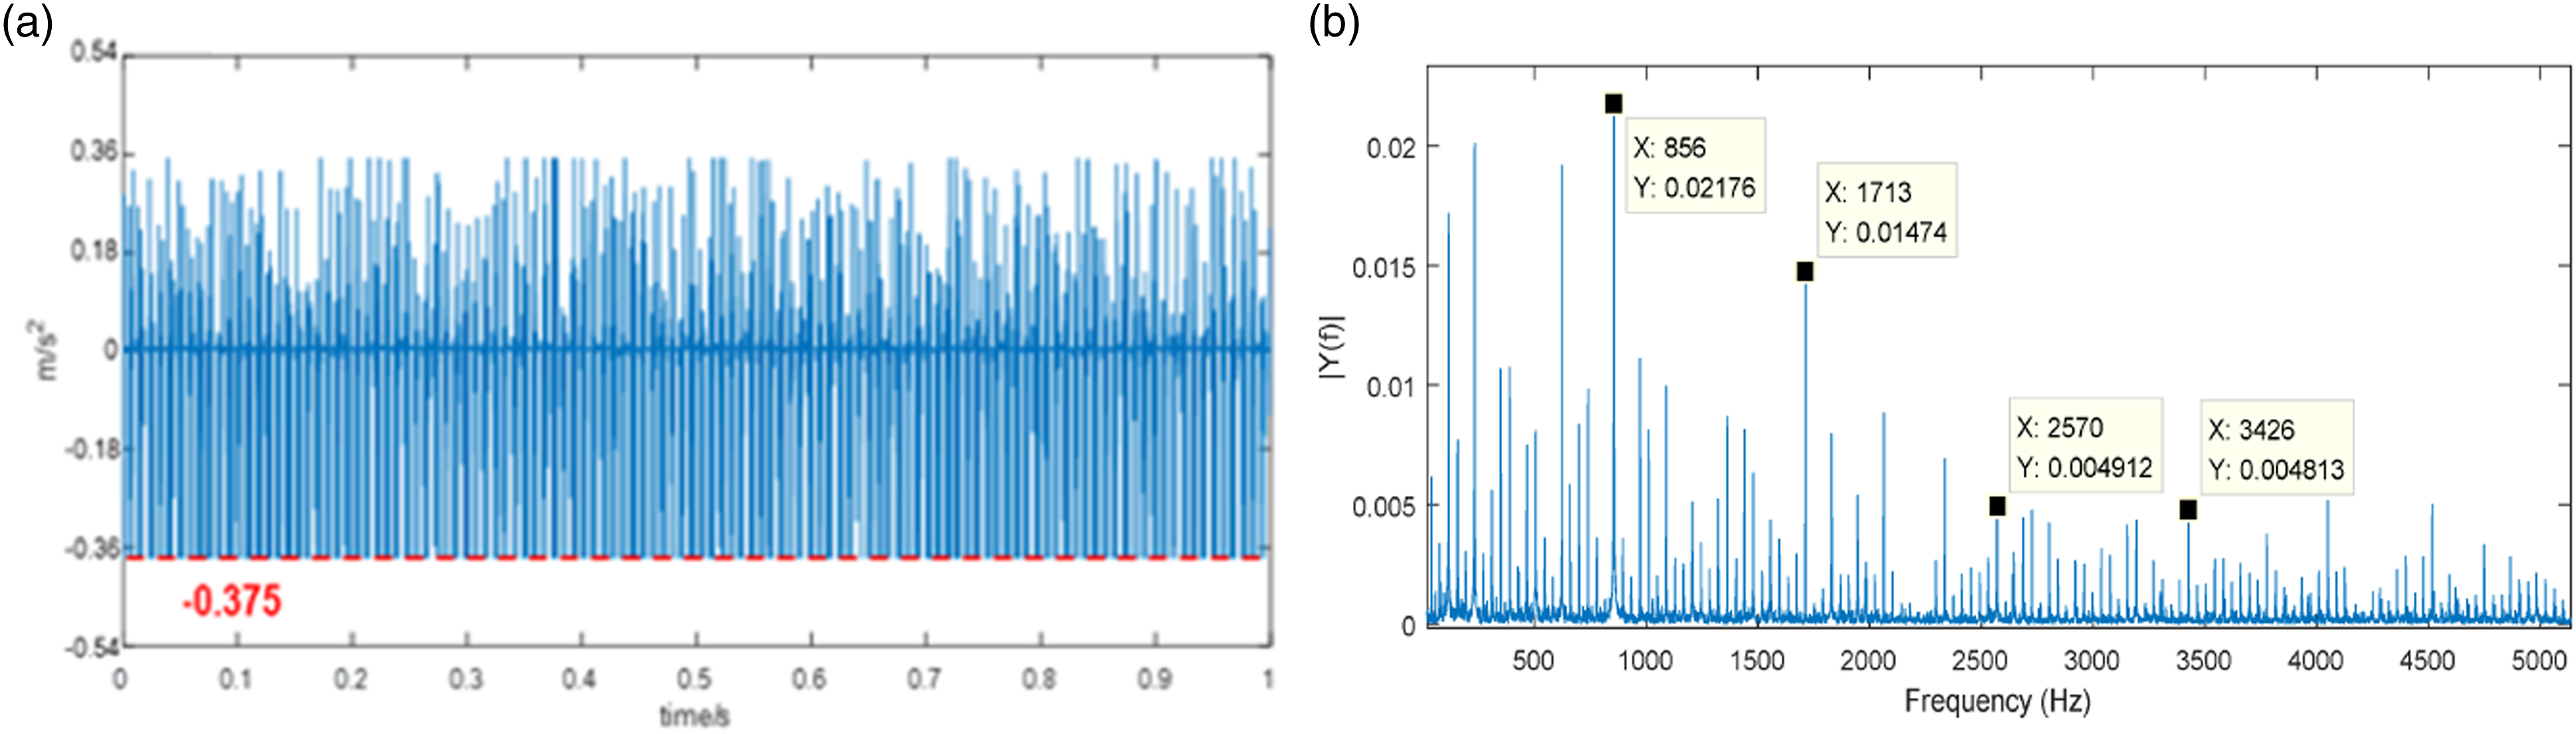
Timewave and the corresponding envelope spectrum (n = 2,
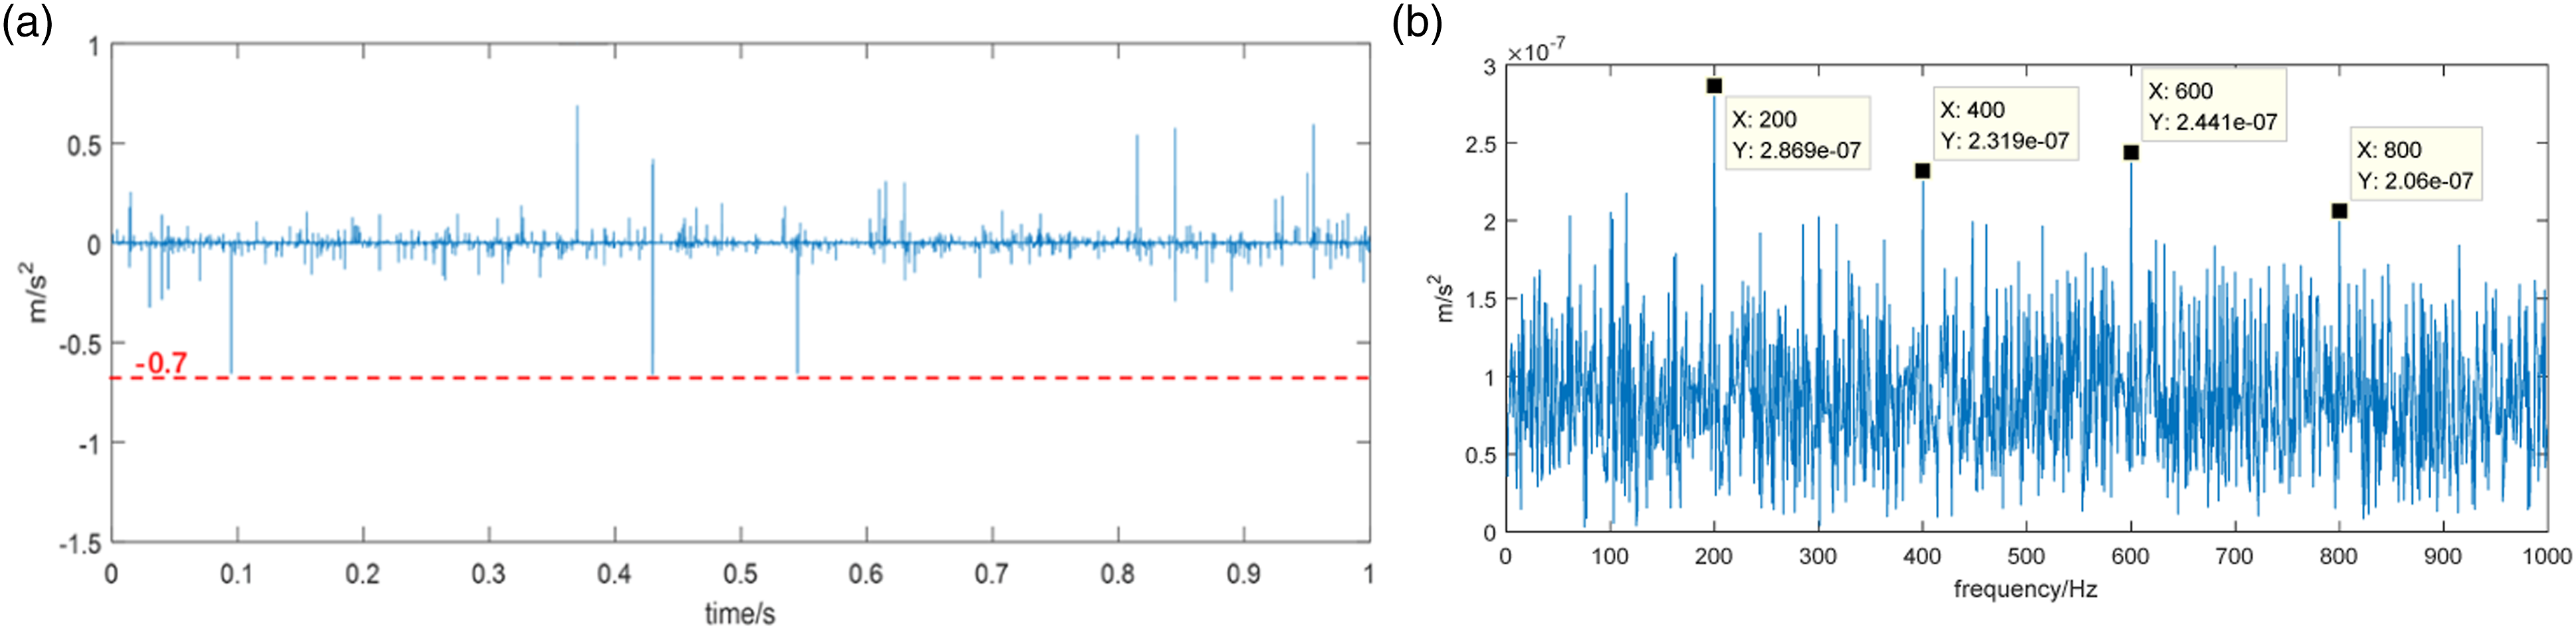
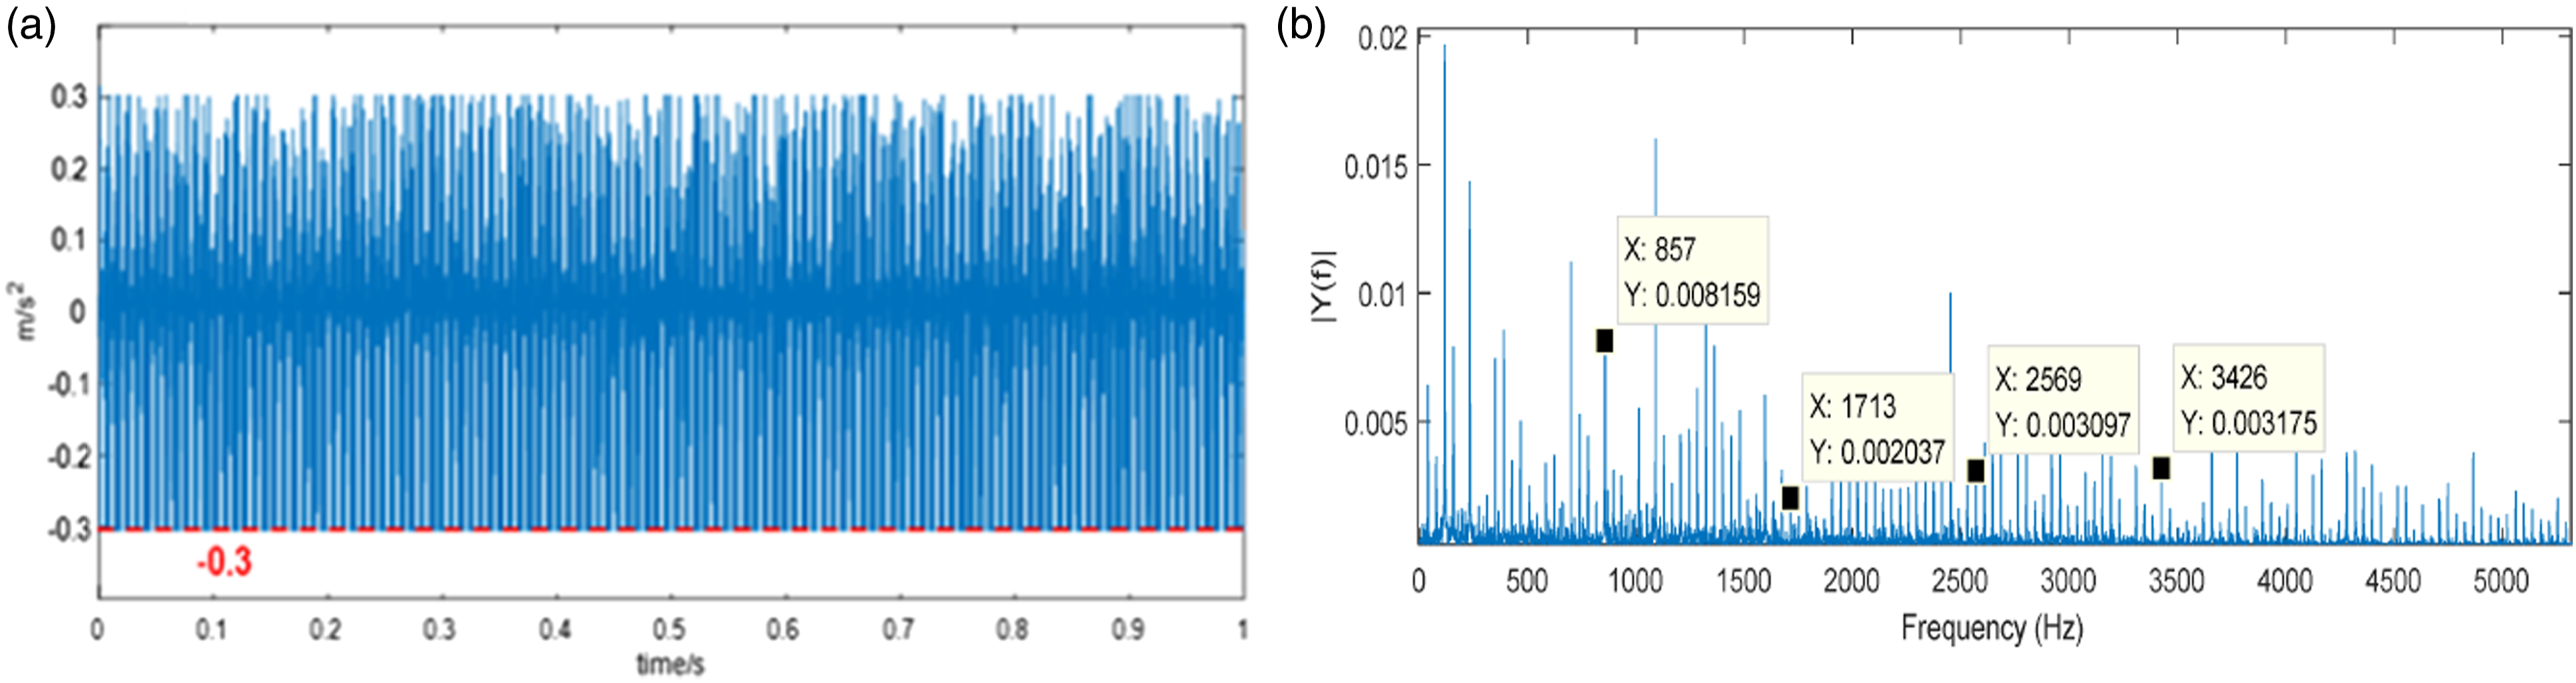
Timewave and the corresponding envelope spectrum (n = 3,
Timewave and the corresponding envelope spectrum (n = 4,
Timewave and the corresponding envelope spectrum (n = 5,
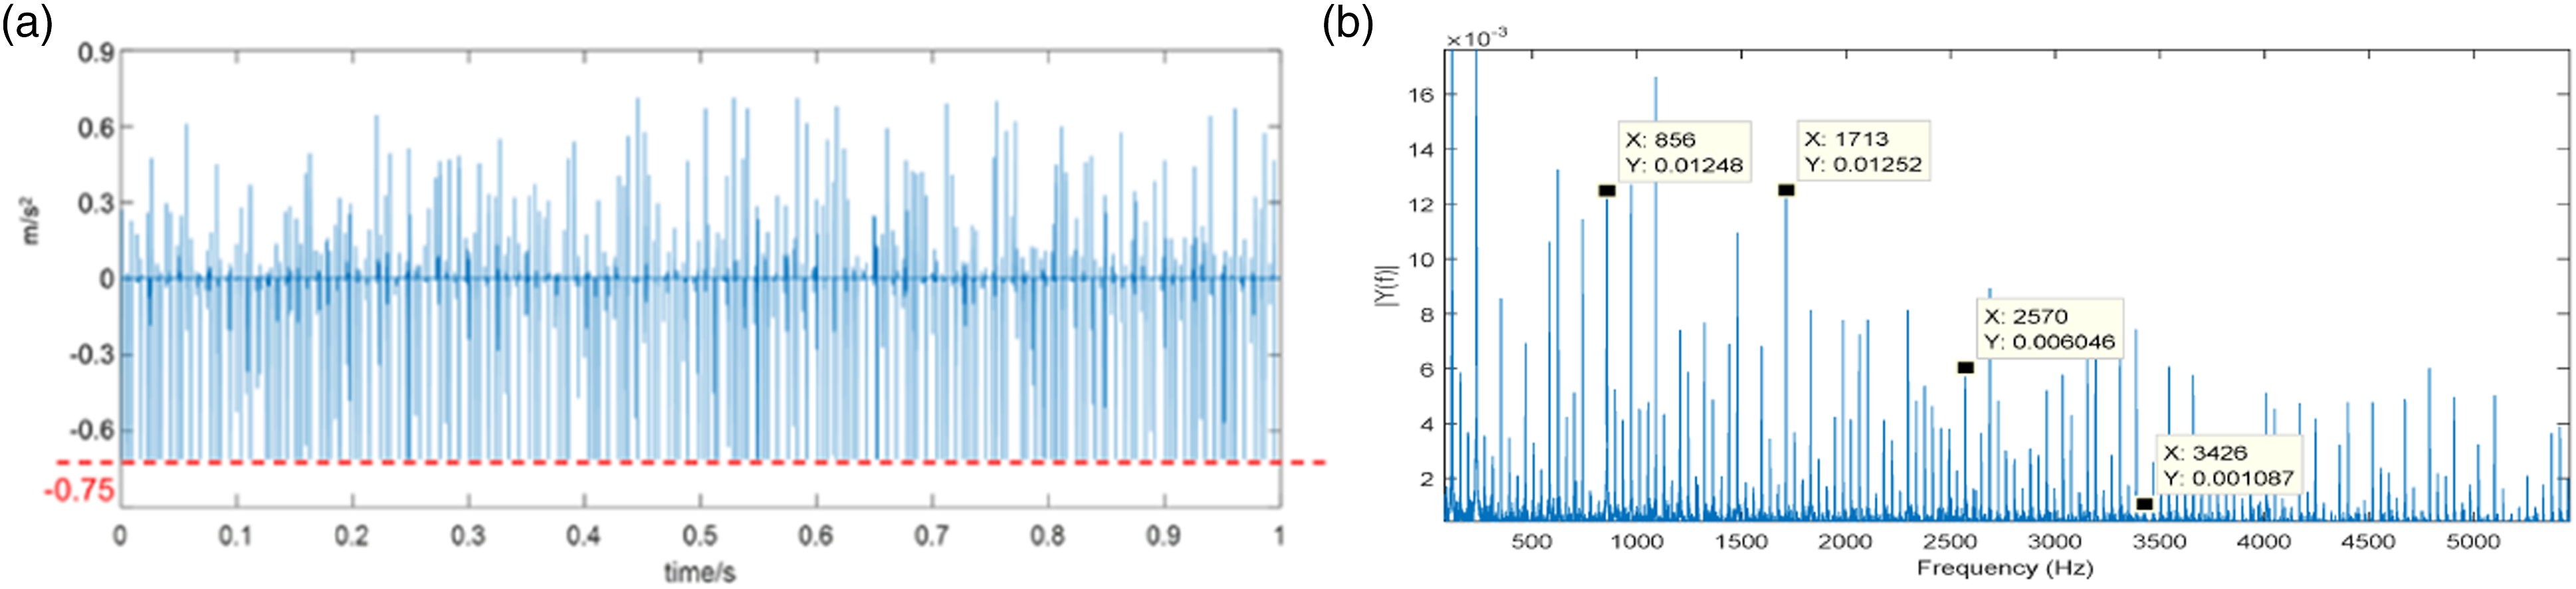
We can see that the impacts are enlarged and shown obviously in Figure 6(a). And we can also clearly see the preset fault frequency 200 Hz with its multiply order in Figure 6(b) which is the most optimal envelope spectrum in these figures. The timewave in Figure 3(a) with n = 1 shows several bigger impacts. However, the corresponding envelope spectrum can hardly show the fault frequency. That is because these several bigger impacts which are the main energy components of the signal are not periodic. Then the aperiodicity of these several bigger impacts covers up periodicity of the smaller fault impacts. Thus, the whole signal doesn’t show the fault impacts periodicity in envelope spectrum. Then as the compression factor become bigger, the fault frequency in the envelope spectrum becomes more obvious in Figure 4 and Figure 5. This is because bigger compression factor weakens these bigger impacts energy. And the SNR becomes high. Then CK reaches maximum value in Figure 6. Then as n become bigger, the fault frequency becomes unapparent in Figure 7. This is because the over compression reduces the amplitudes of the fault impacts sequence. And more small noise relatively becomes bigger, which reduce the SNR. Based on the above analysis, the optimal output envelope signal is Figure 6(a) relating to the biggest CK. The results show that the compression factor should not be too big or too small.
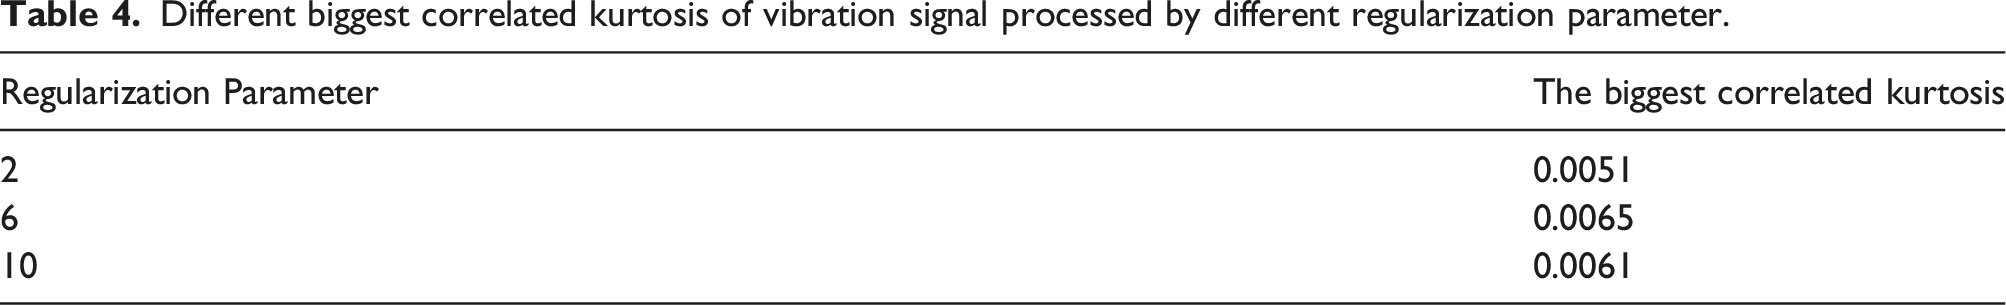
Then different regularization parameters Timewave and the corresponding envelope spectrum ( Timewave and the corresponding envelope spectrum ( Timewave and the corresponding envelope spectrum ( Different biggest correlated kurtosis of vibration signal processed by different regularization parameter.
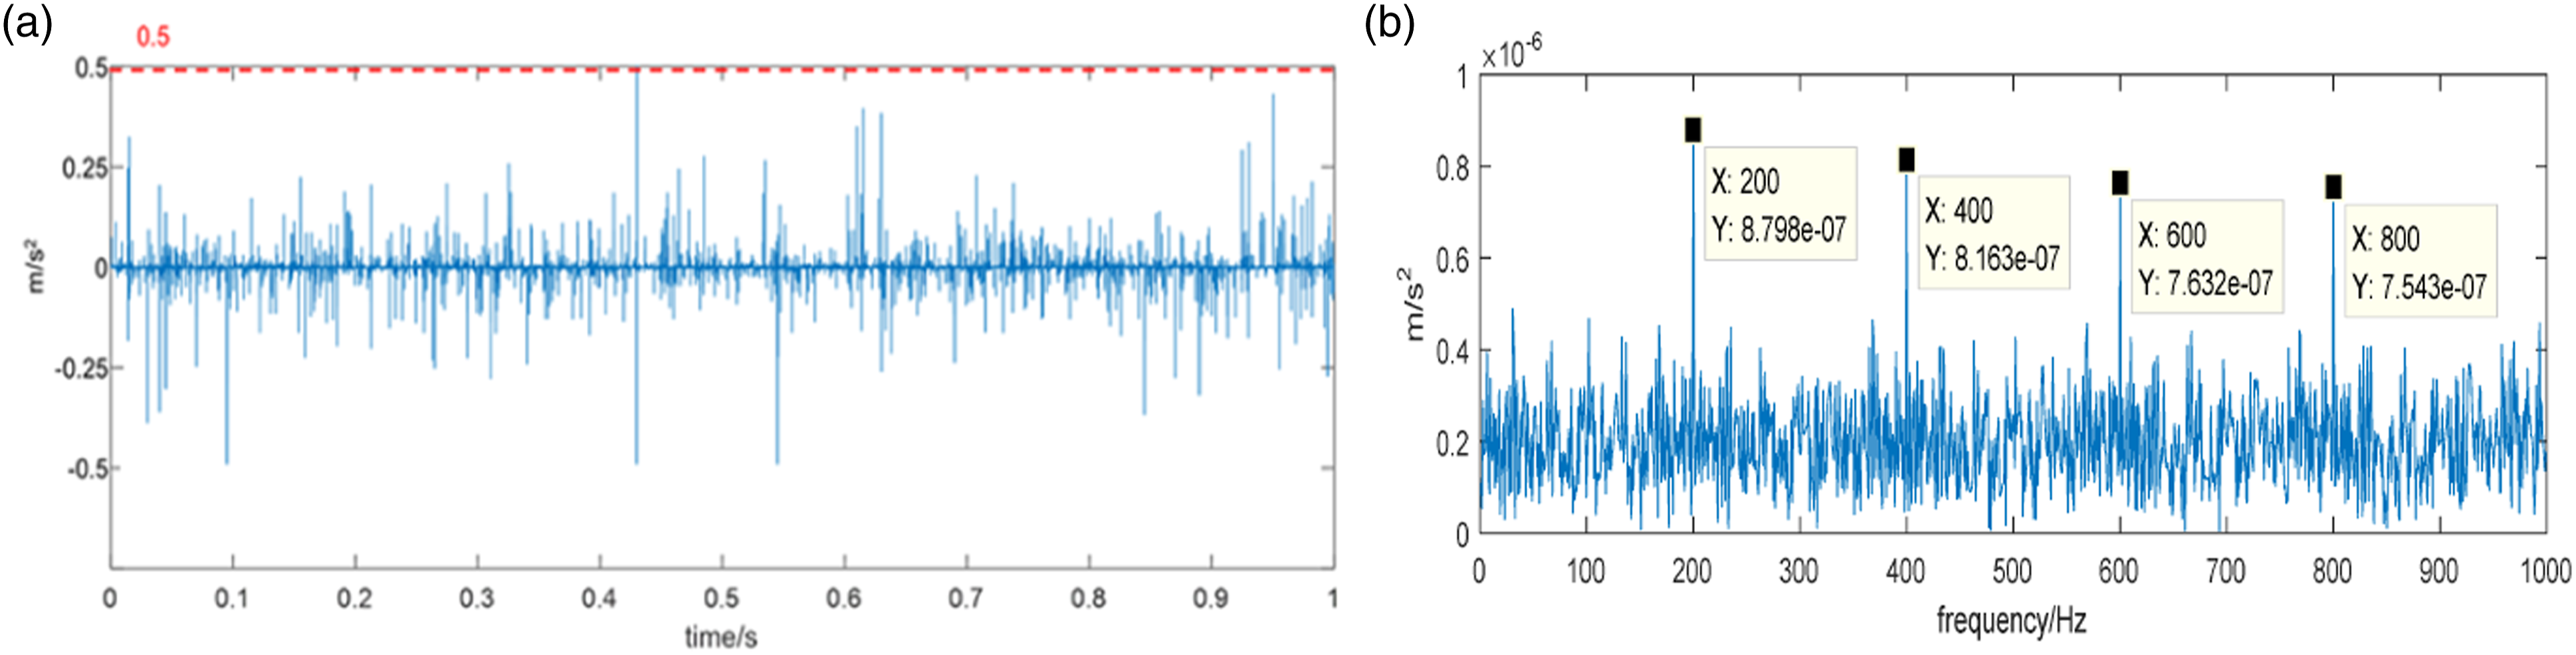
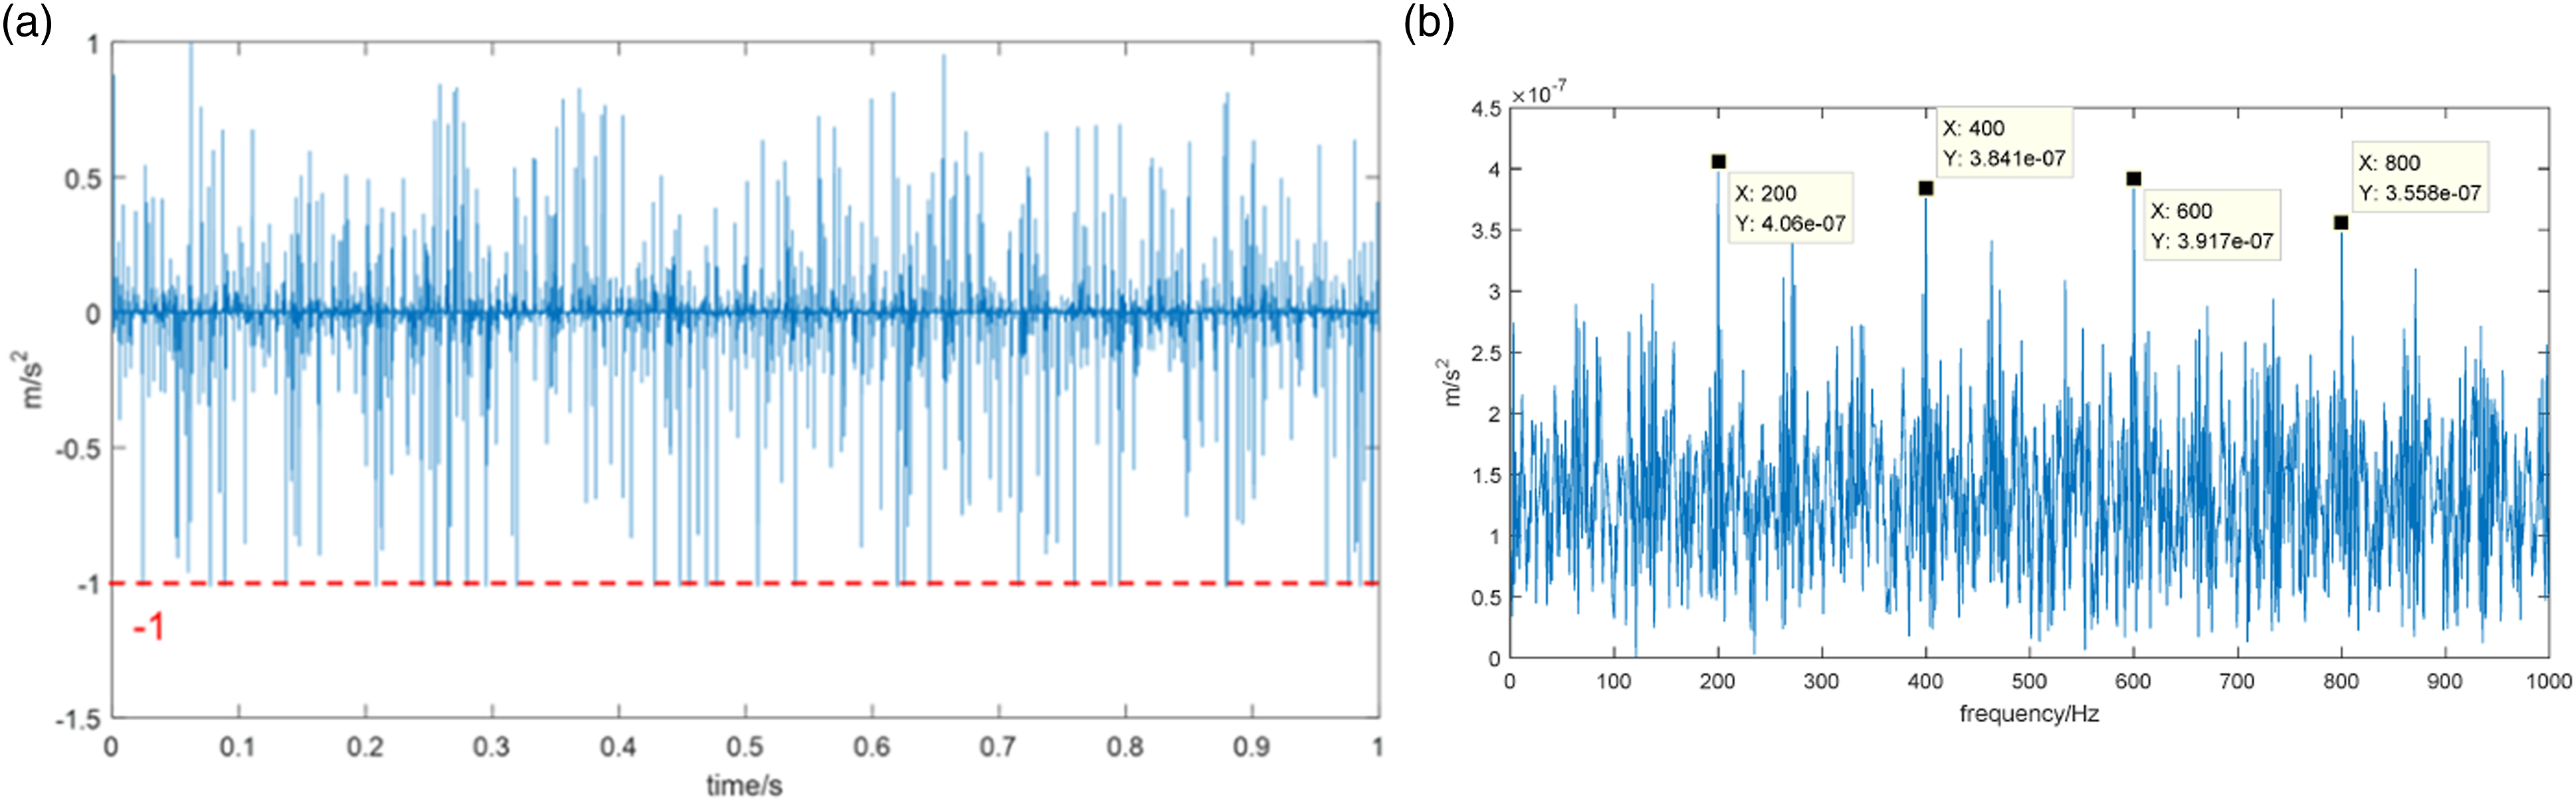
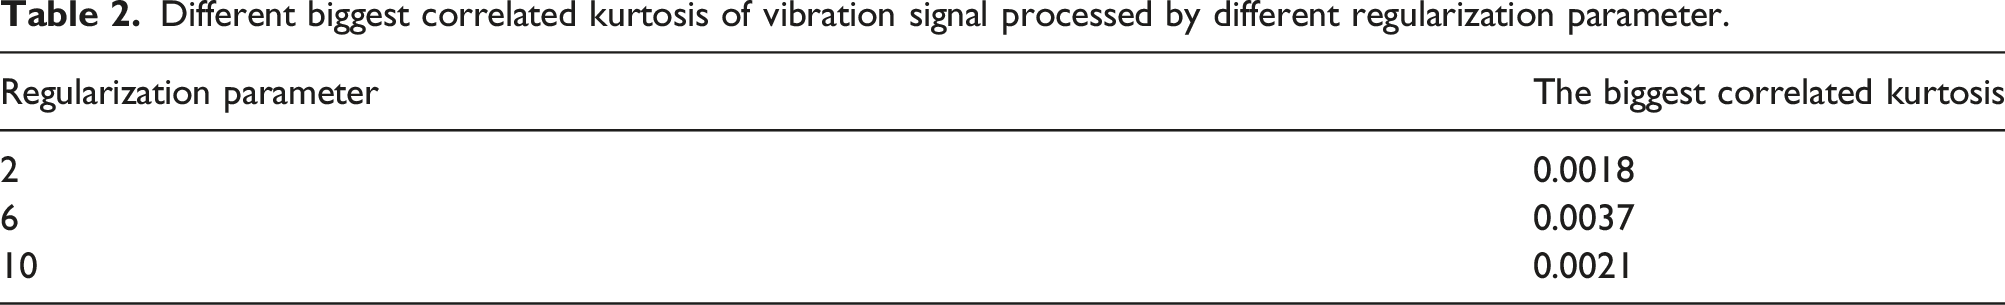
Figure 11 is the kurtogram obtained by fast-kurtogram method, which shows the optimal band in level 6.6 with its center frequency 8500. Then the corresponding envelope timewave and spectrum are, respectively, shown in Figure 11(b) and Figure 11(c). However, the timewave shown in Figure 11(b) is hardly to show the impacts. And the fault frequency cannot be seen in envelope spectrum. Fast-kurtogram method processing results (a) Fast-kurtogram (b) The optimal envelope timewave (c) The optimal envelope spectrum.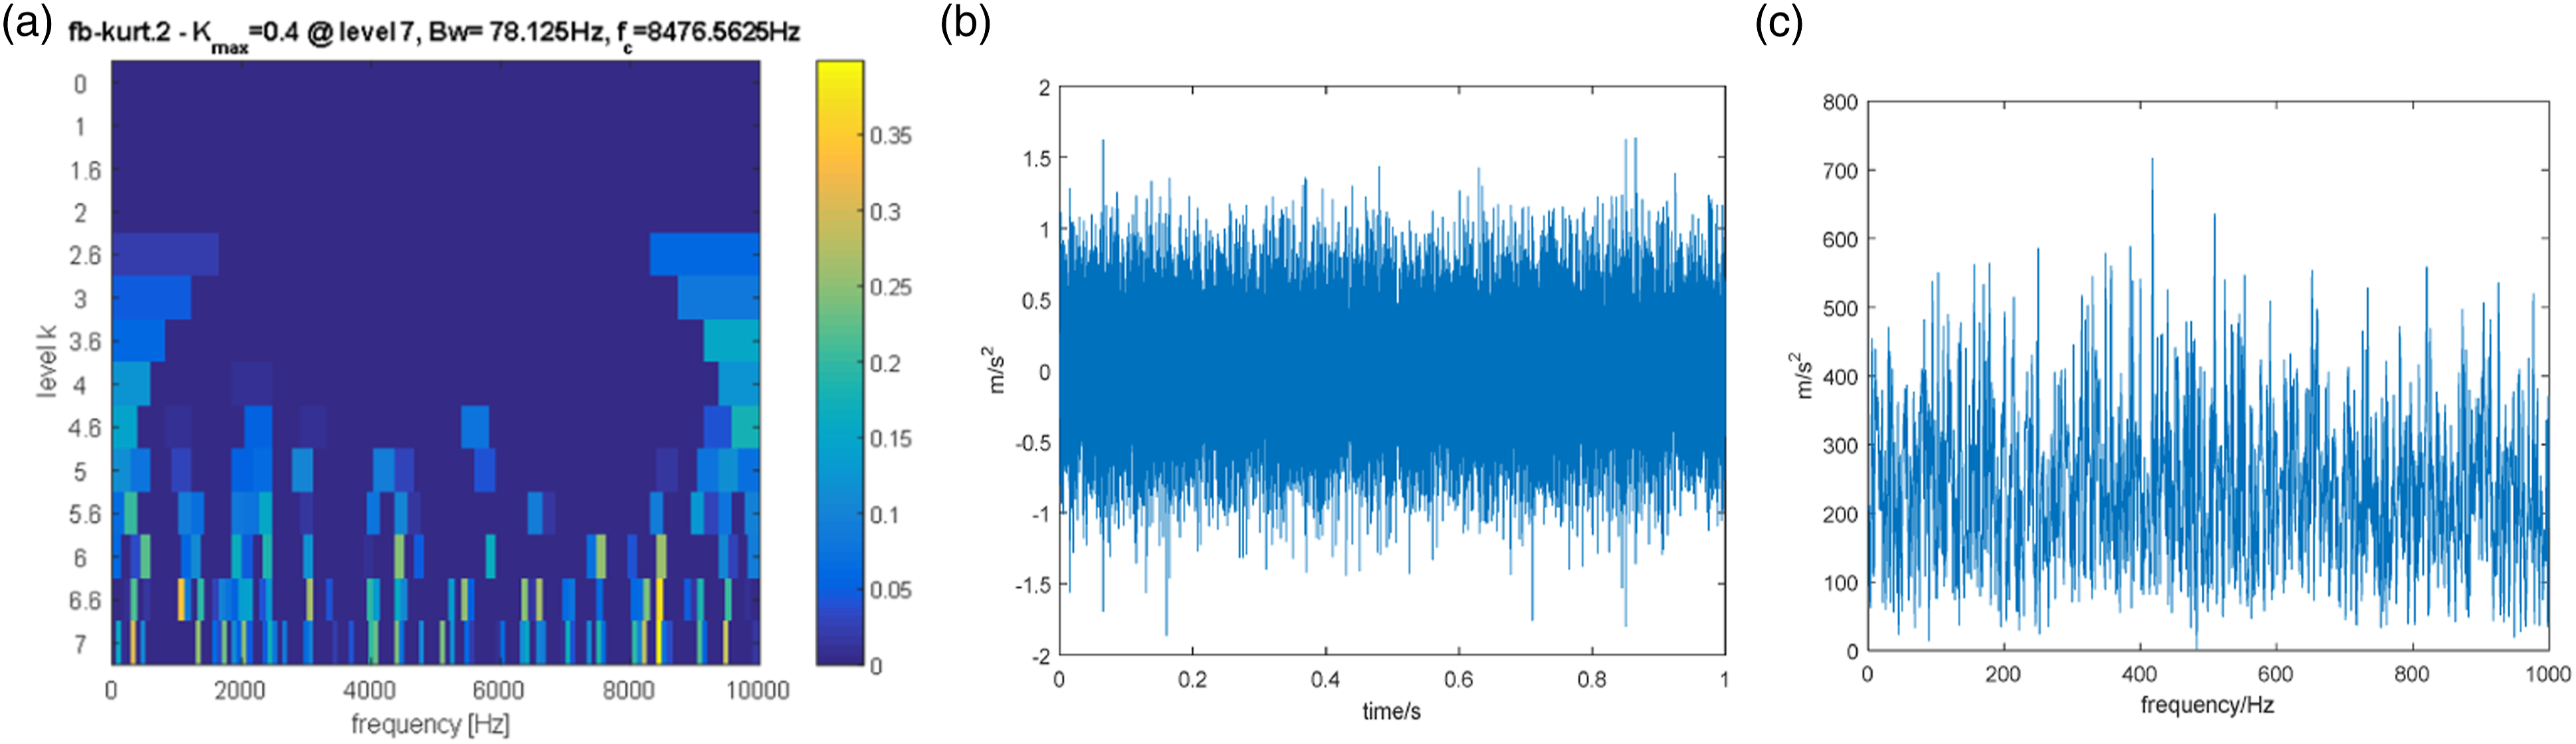
Therefore, fast-kurtogram method is less effective than proposed method.
Experiment validation
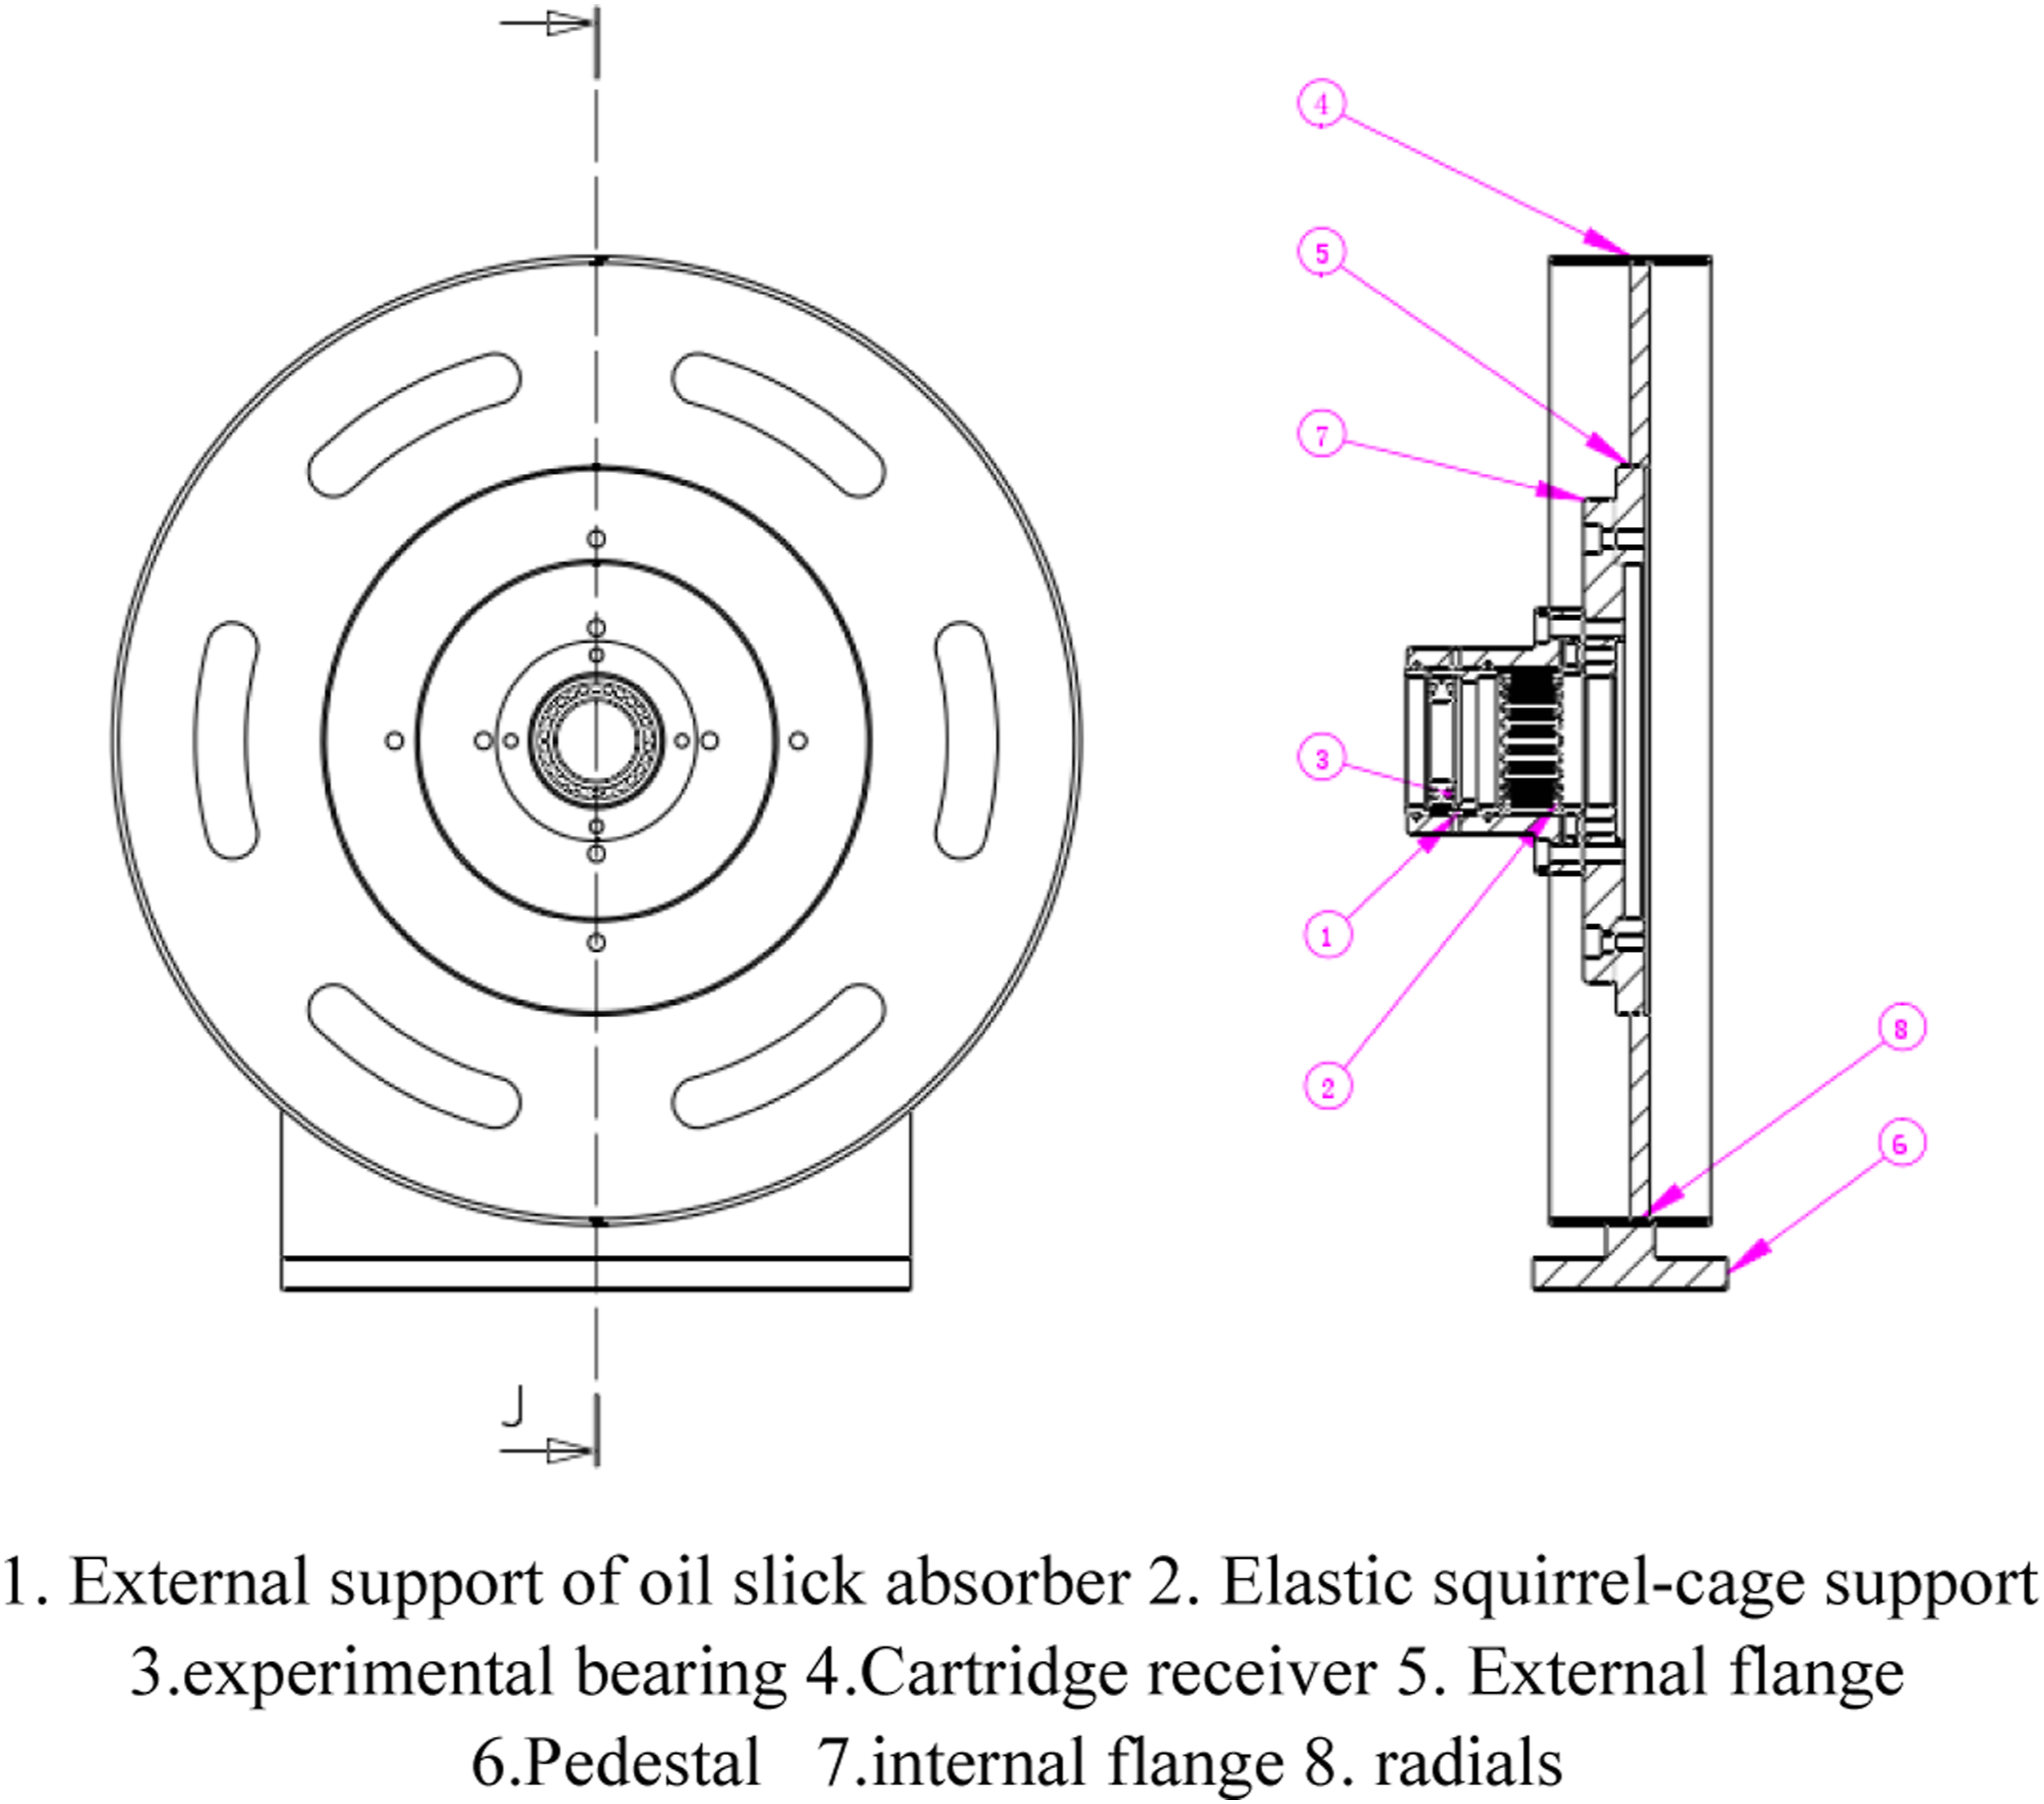
In this part, the experimental data is used for the modified envelope analysis. In order to acquire the complicated vibration signal, self-designed experimental device is built by simulating the motor output structure of the marine gas turbine. And the structure of the experimental device is shown in Figure 12 and Figure 13. The location of the bearing used for experiment is shown in Figure 14. From Figure 14, we can see that the vibration transfer path of the fault bearing is first to go through the cage, and then to pass the two flanges, and to go through the thick chassis, and at last to reach the position of sensor. Thus, this path is a complicated one, which means the fault signal may bury into the huge background noise. Therefore, the vibration collected from measure point can be used for the comparison filtering. The fault of bearing is made by wire-electrode cutting. The integral figure of the experimental device. Support structure for rolling elements bearing. Original vibration timewave and the corresponding frequency spectrum (7000r/min).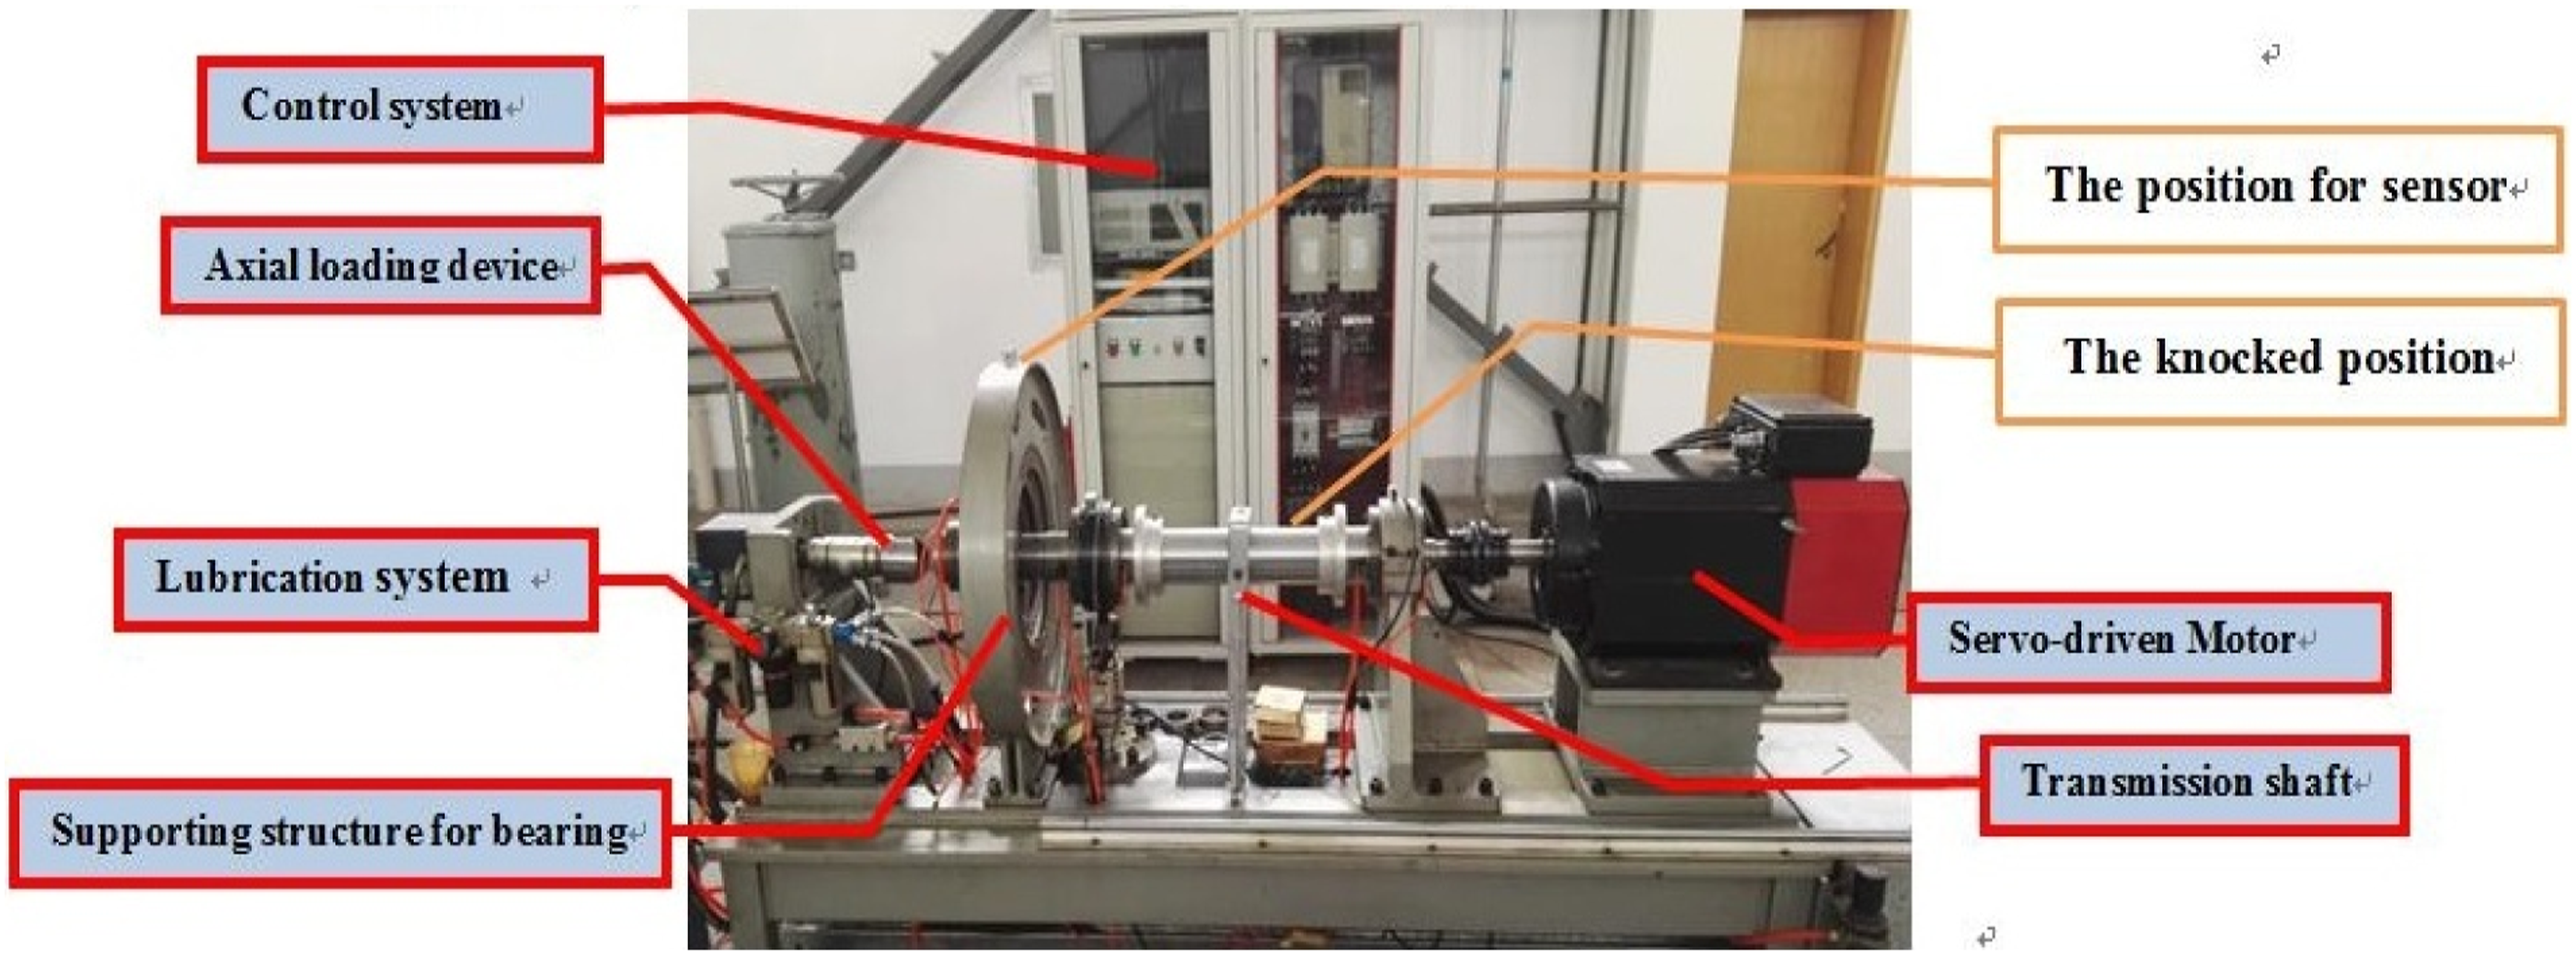
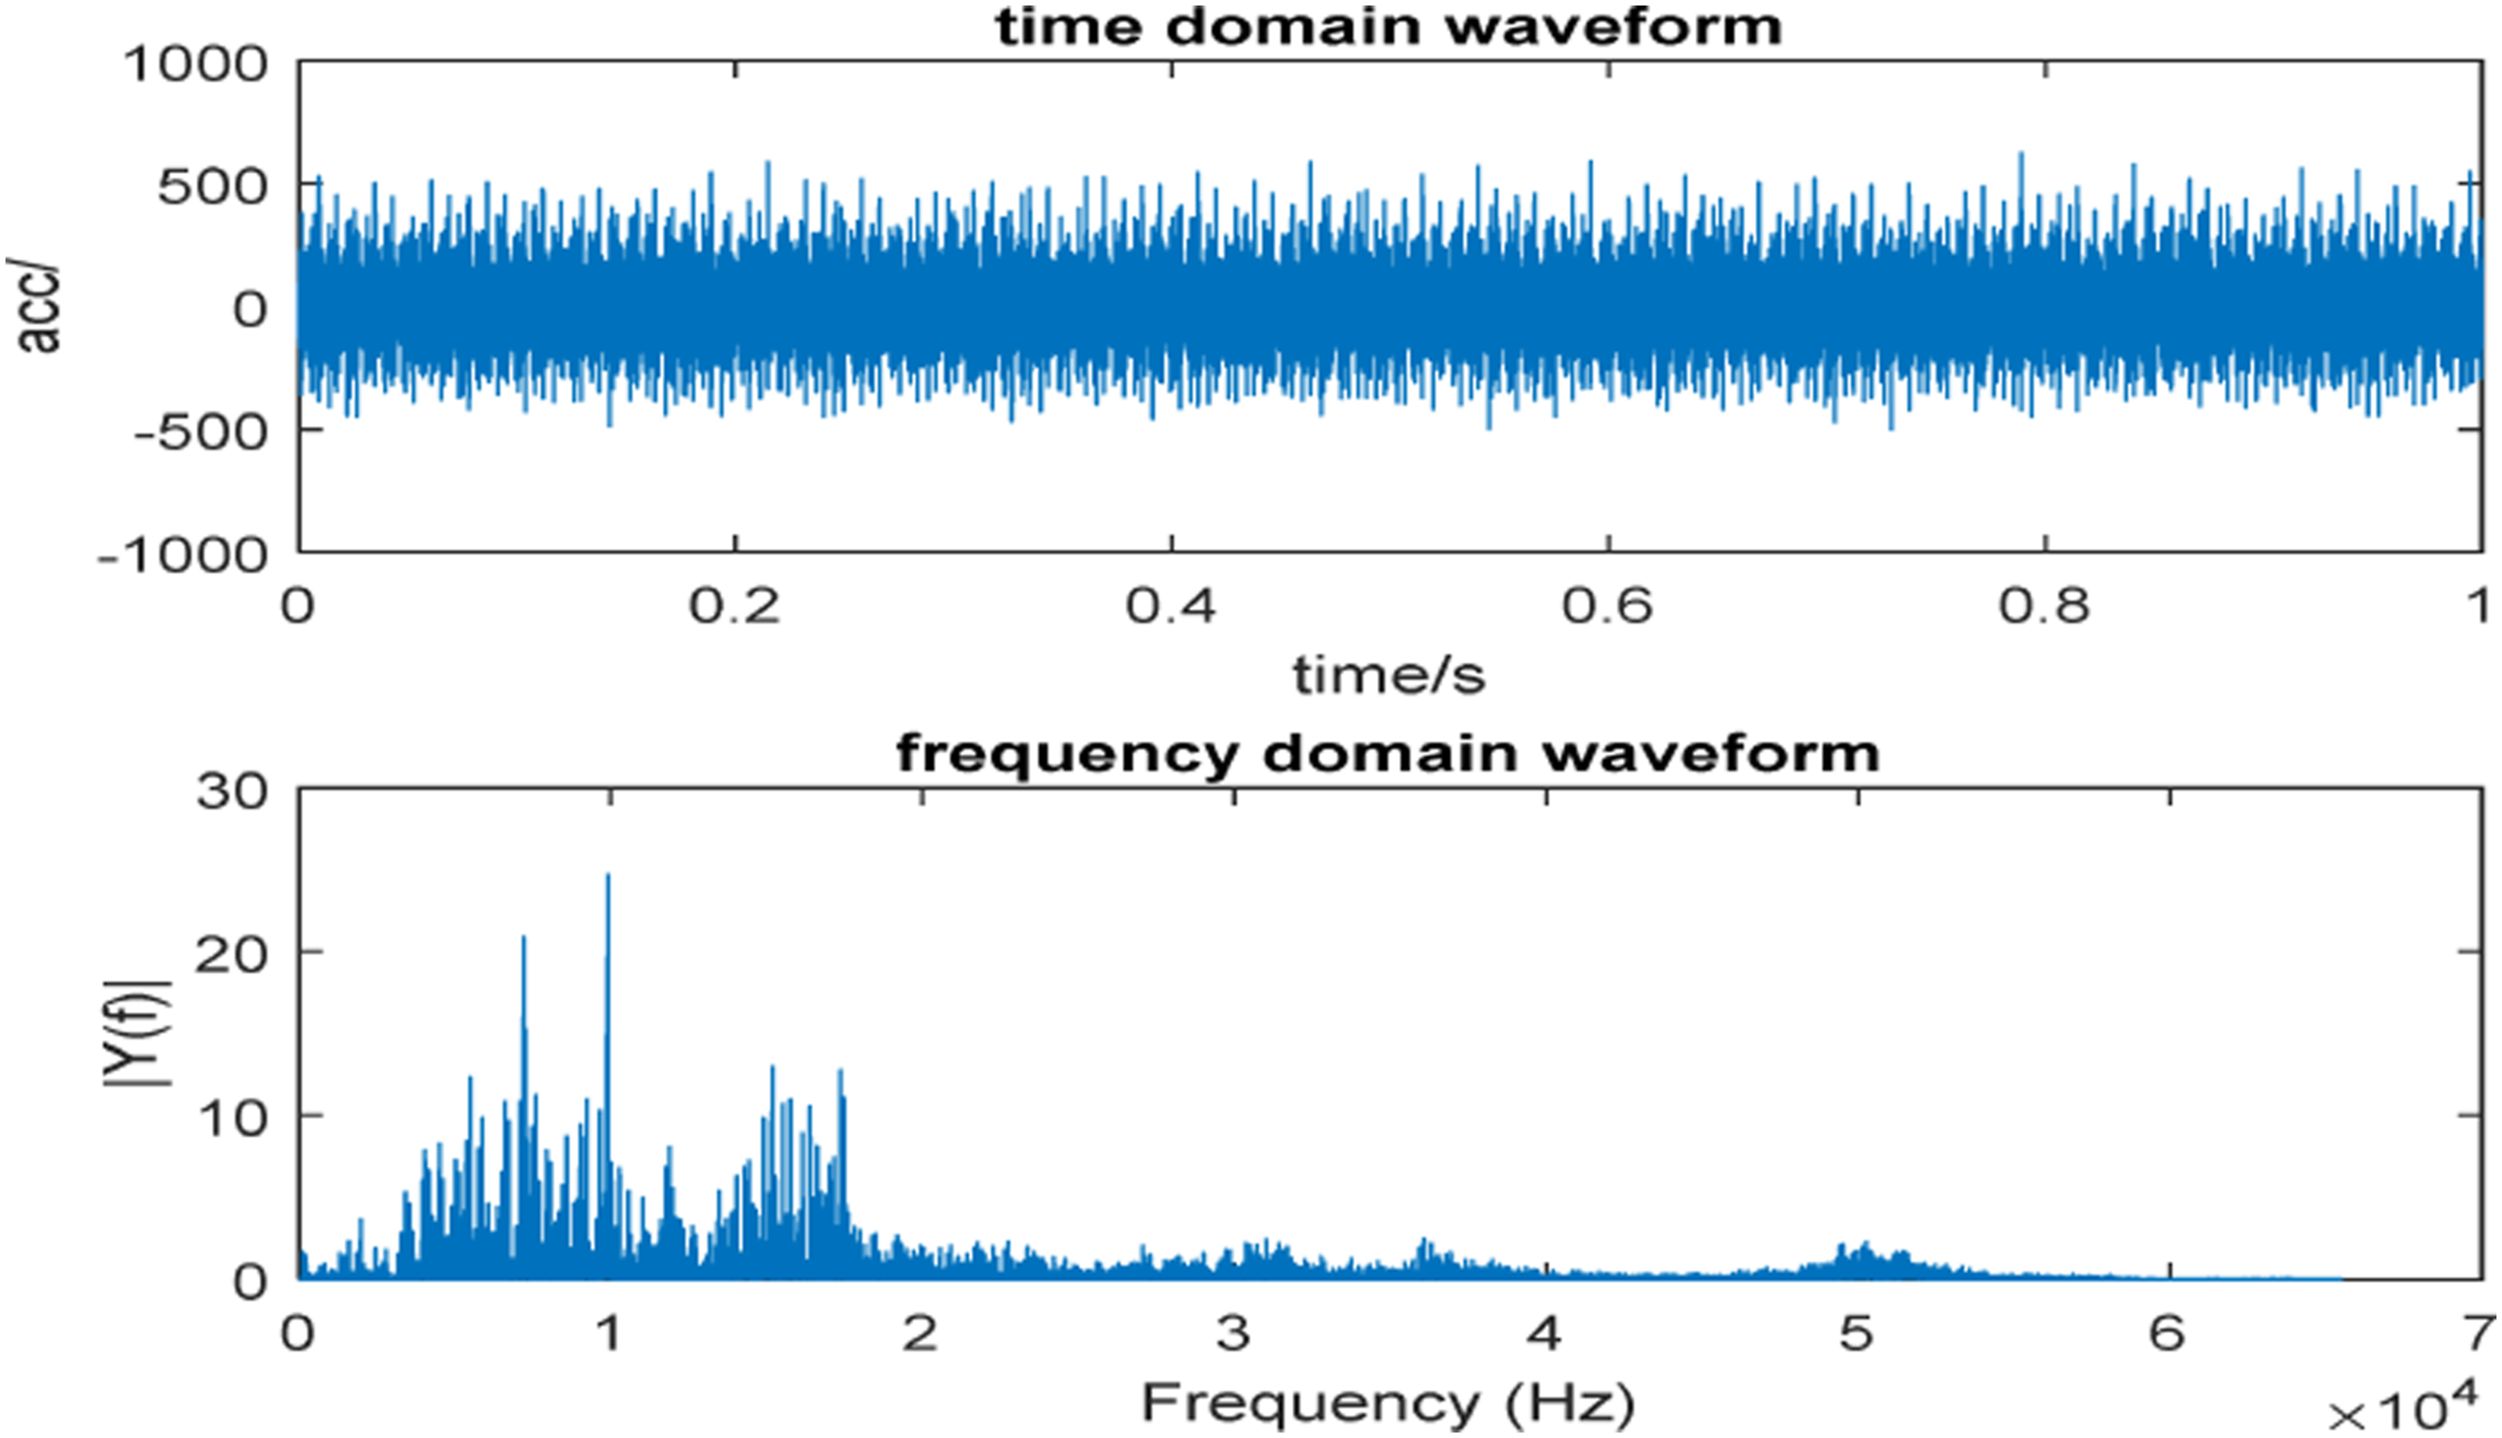
The bearing fault experiment is conducted at rotation speeds 7000r/min. The type of the device for vibration measurement is B&K3560 C. And the sample frequency is 131,072 Hz. The experimental bearing type is NSK6010, whose inner diameter and outer diameter, respectively, are 50 mm and 80 mm. The number of rolling elements is 13 with the element’s diameter 9 mm and
Here, the Timewave and the corresponding envelope spectrum (n = 1, Timewave and the corresponding envelope spectrum (n = 2, Timewave and the corresponding envelope spectrum (n = 3, Timewave and the corresponding envelope spectrum (n = 4, Timewave and the corresponding envelope spectrum (n = 5, Different correlated kurtosis of vibration signal processed by different compression factor.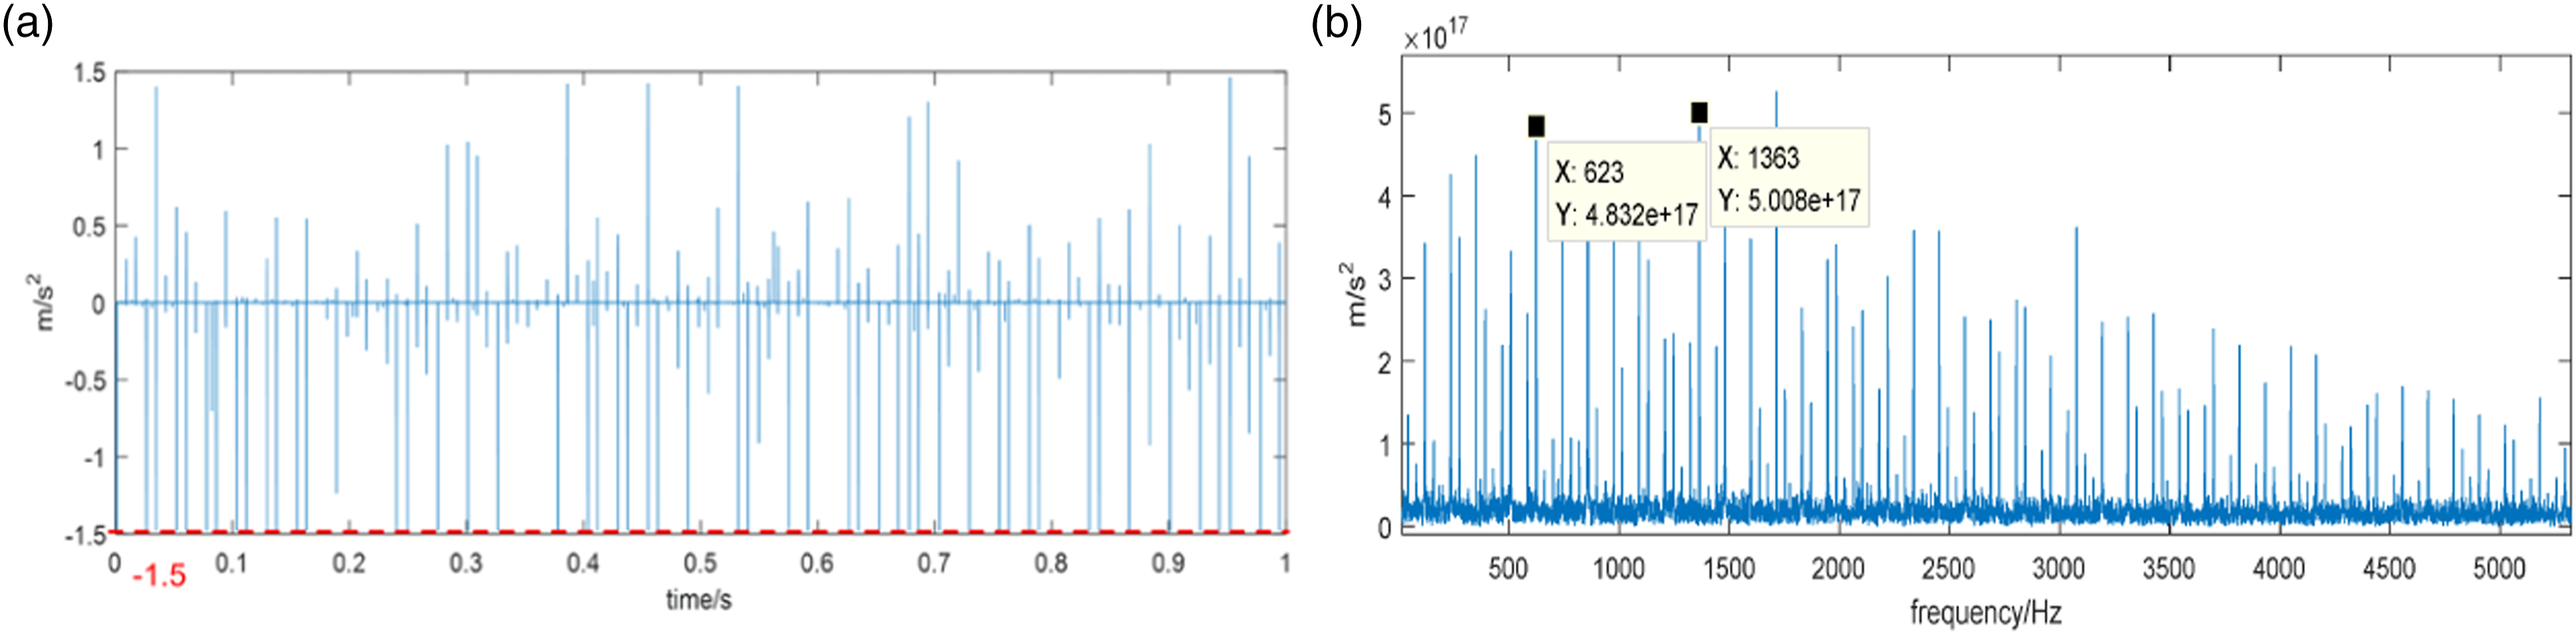

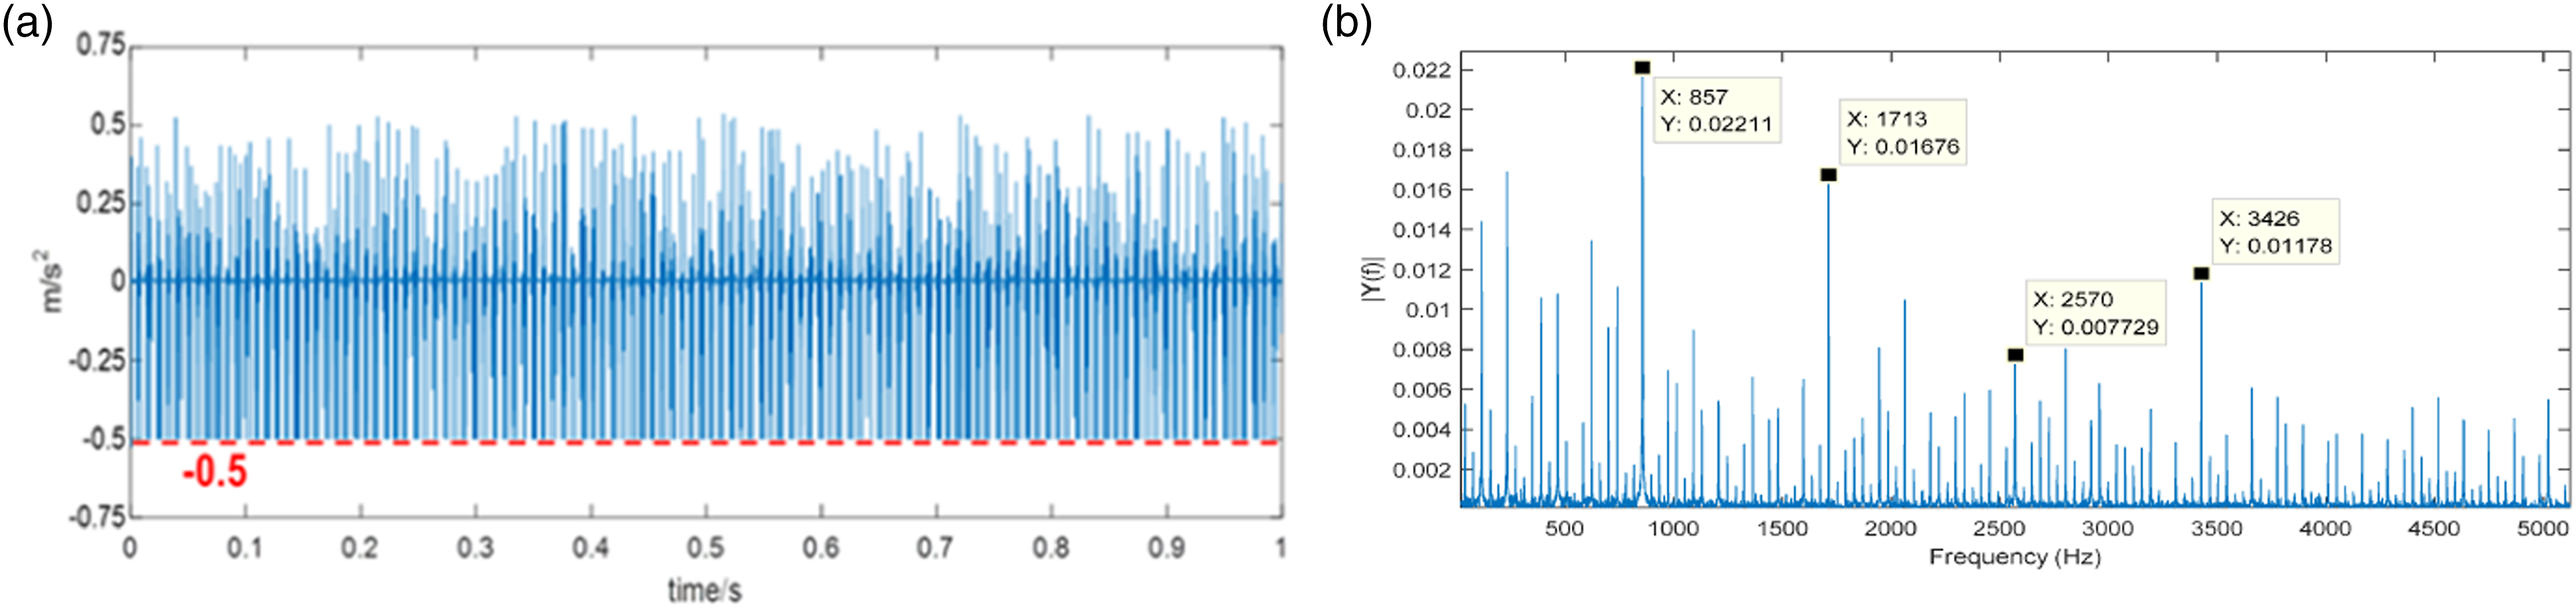
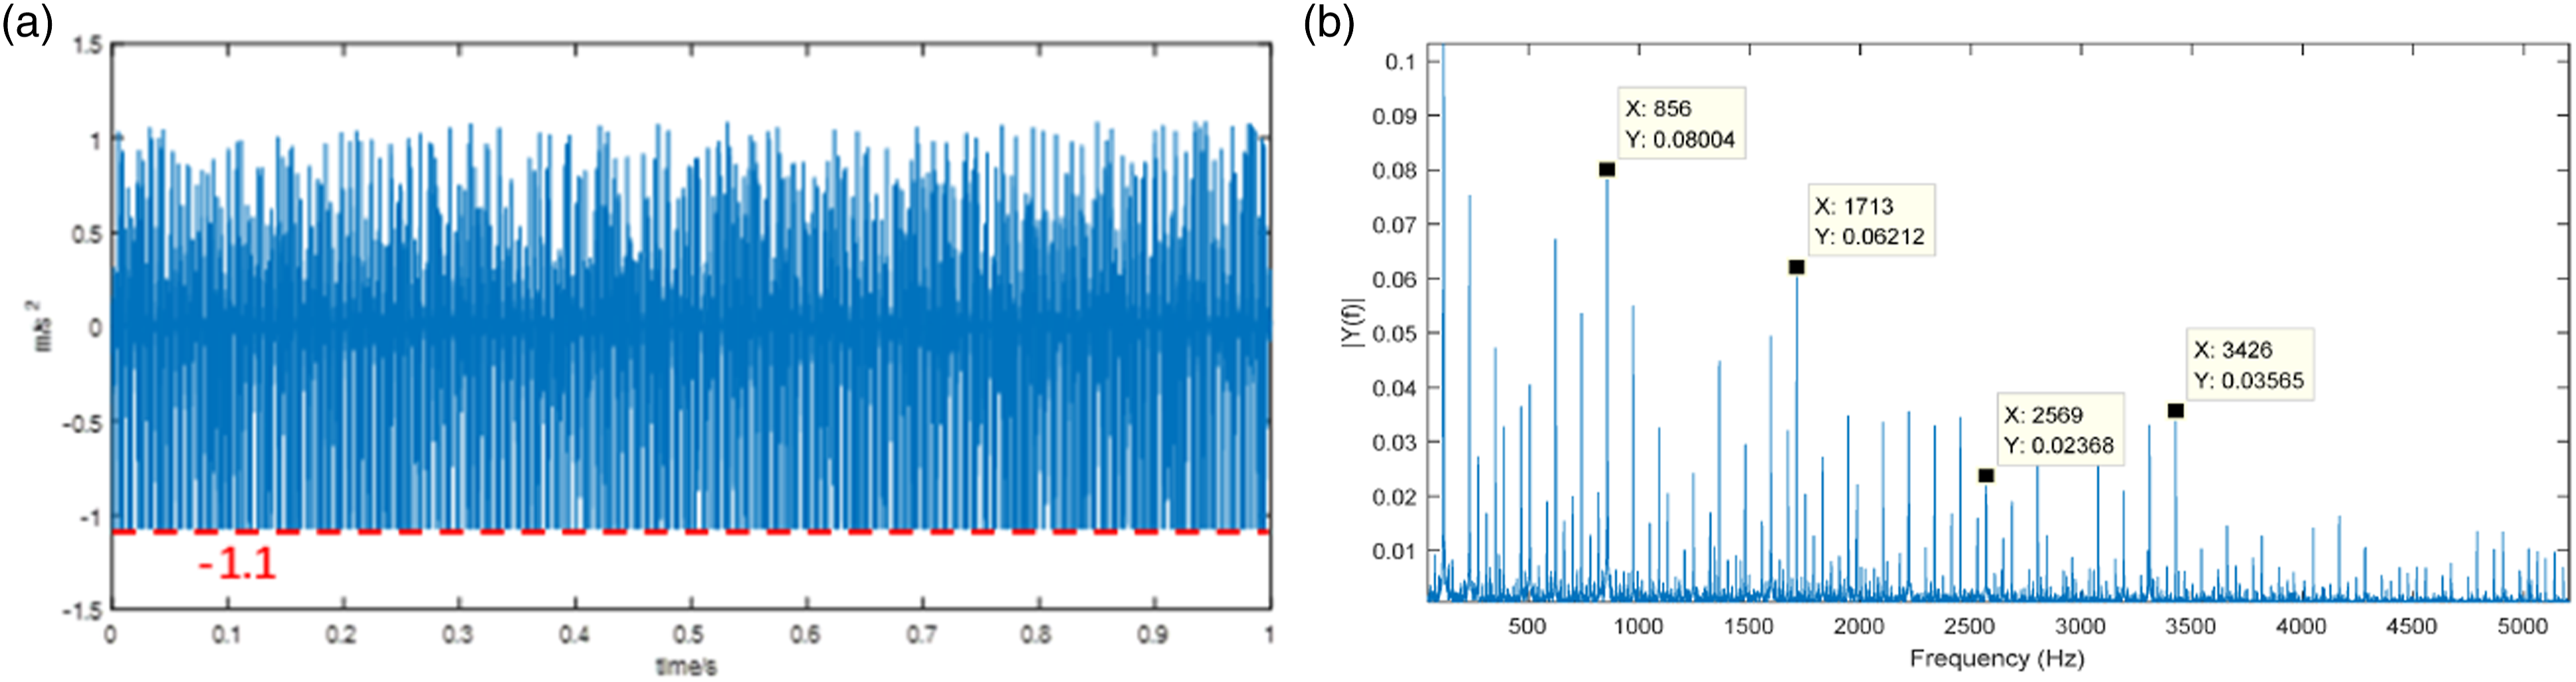
Then different regularization parameters are also used to process the signal. And the corresponding results are shown in Figure 20 and Table 4. In these figures, we can see that the output envelope spectrum corresponding to Timewave and the corresponding envelope spectrum ( Different biggest correlated kurtosis of vibration signal processed by different regularization parameter. Timewave and the corresponding envelope spectrum ( Timewave and the corresponding envelope spectrum (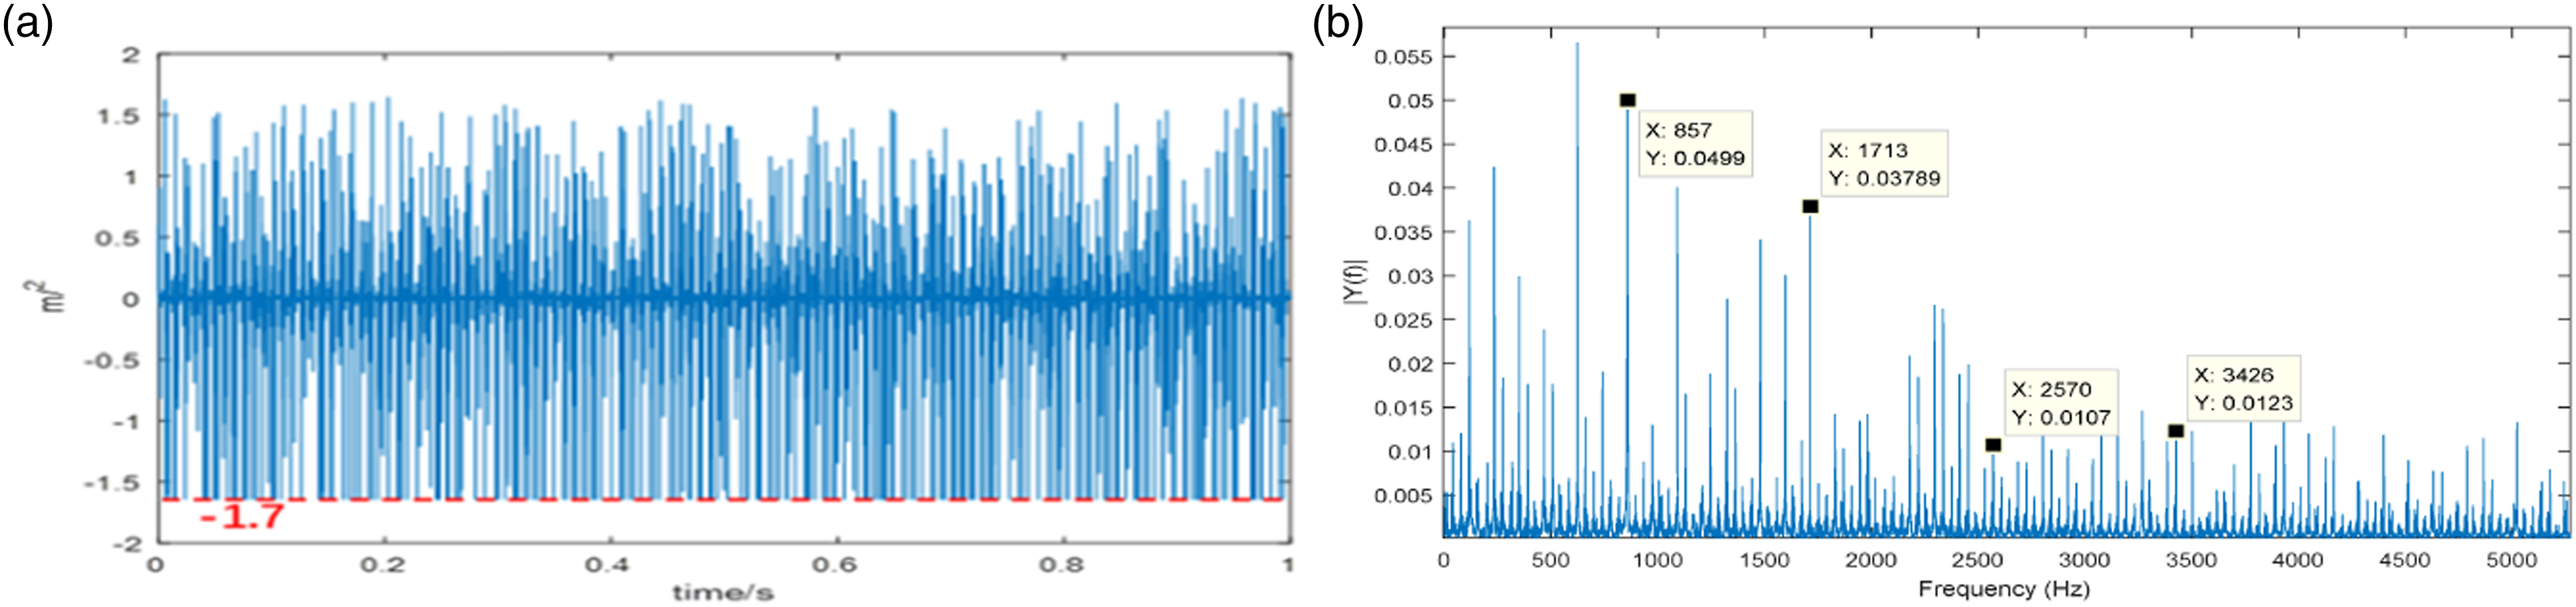
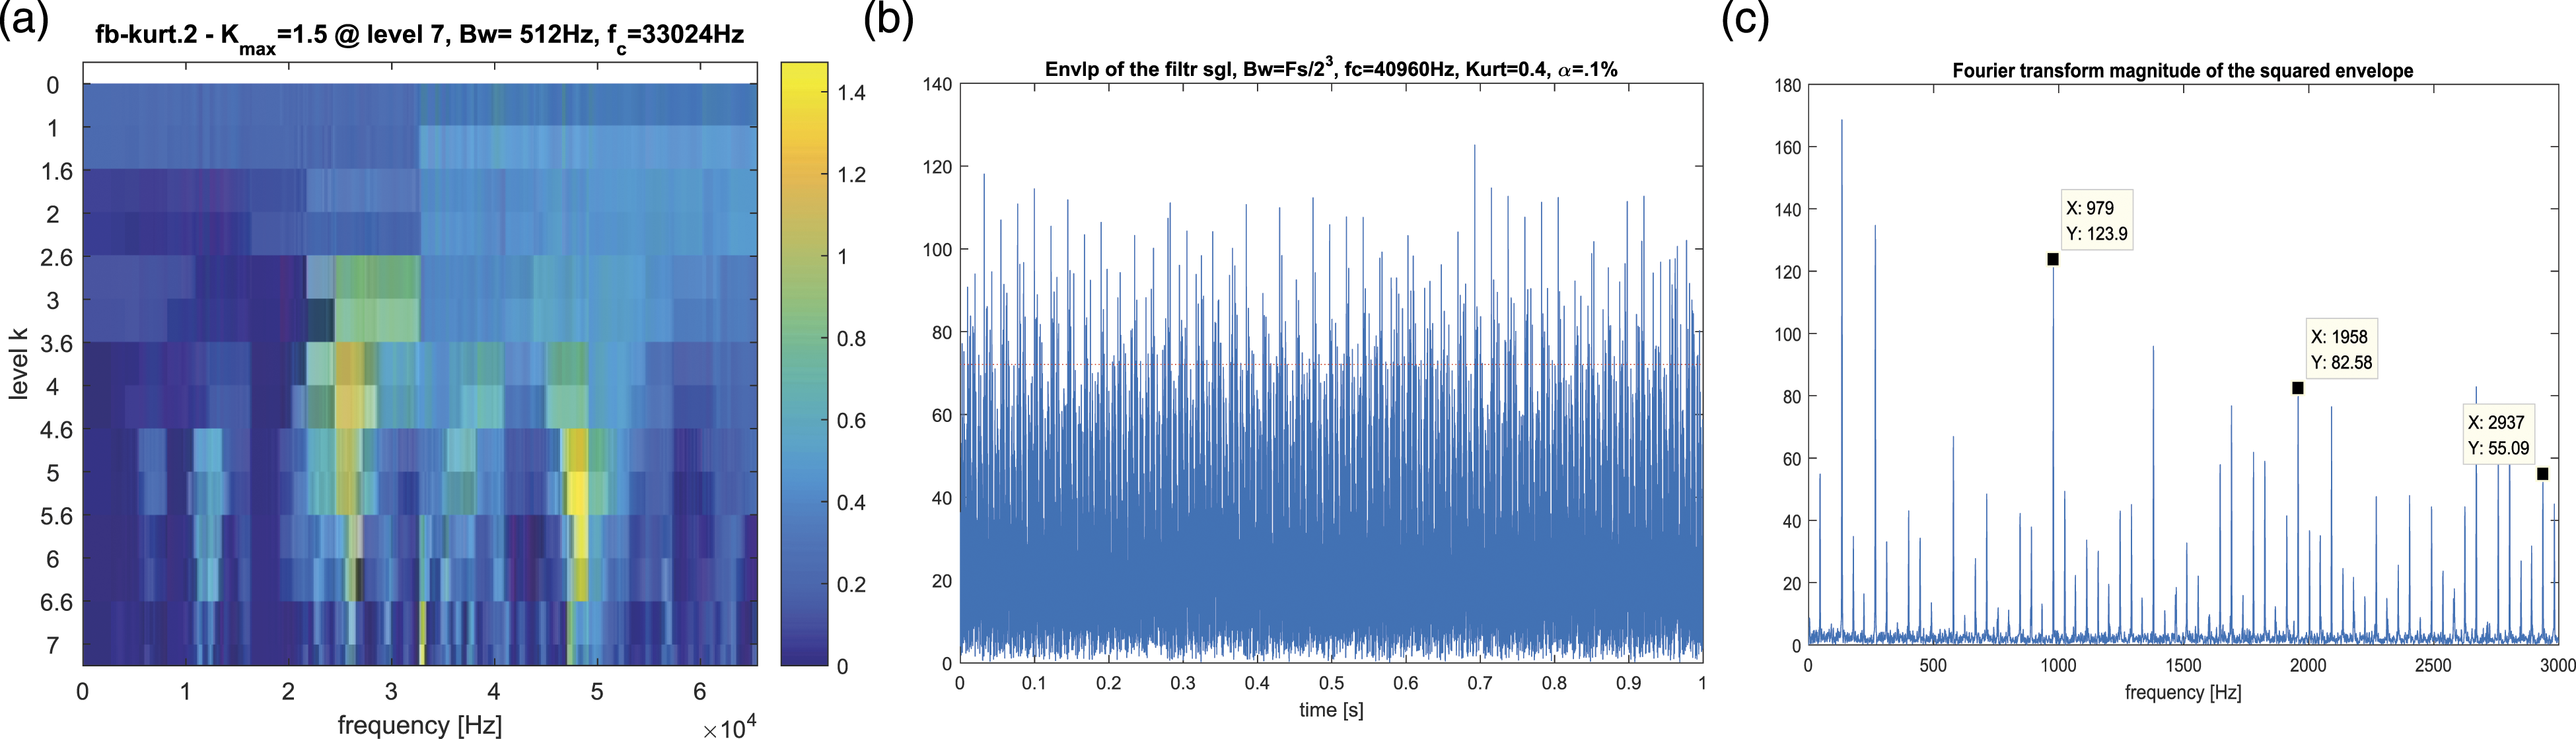
The kurtogram of the signal processed by fast-kurtogram method is shown in Figure 23, which shows the optimal band in level 5.6 with its center frequency 49,720 Hz. Then the corresponding envelope timewave and spectrum are, respectively, shown in Figure 23(b) and Figure 23(c). The timewave shown in Figure 23(a) only show the first order of fault frequency. And other order of the fault frequency cannot be seen in band. Thus the fast-kurtogram method cannot well handle with the detection of weak fault within the huge background noise. One important reason that cause this result is the stubborn filtering band selection. And this kind of selection can find optimal band in a tinny possibility. Experimental result obtained by fast-kurtogram method (a) fast-kurtogram (b) optimal envelope time wave (c) optimal envelope spectrum.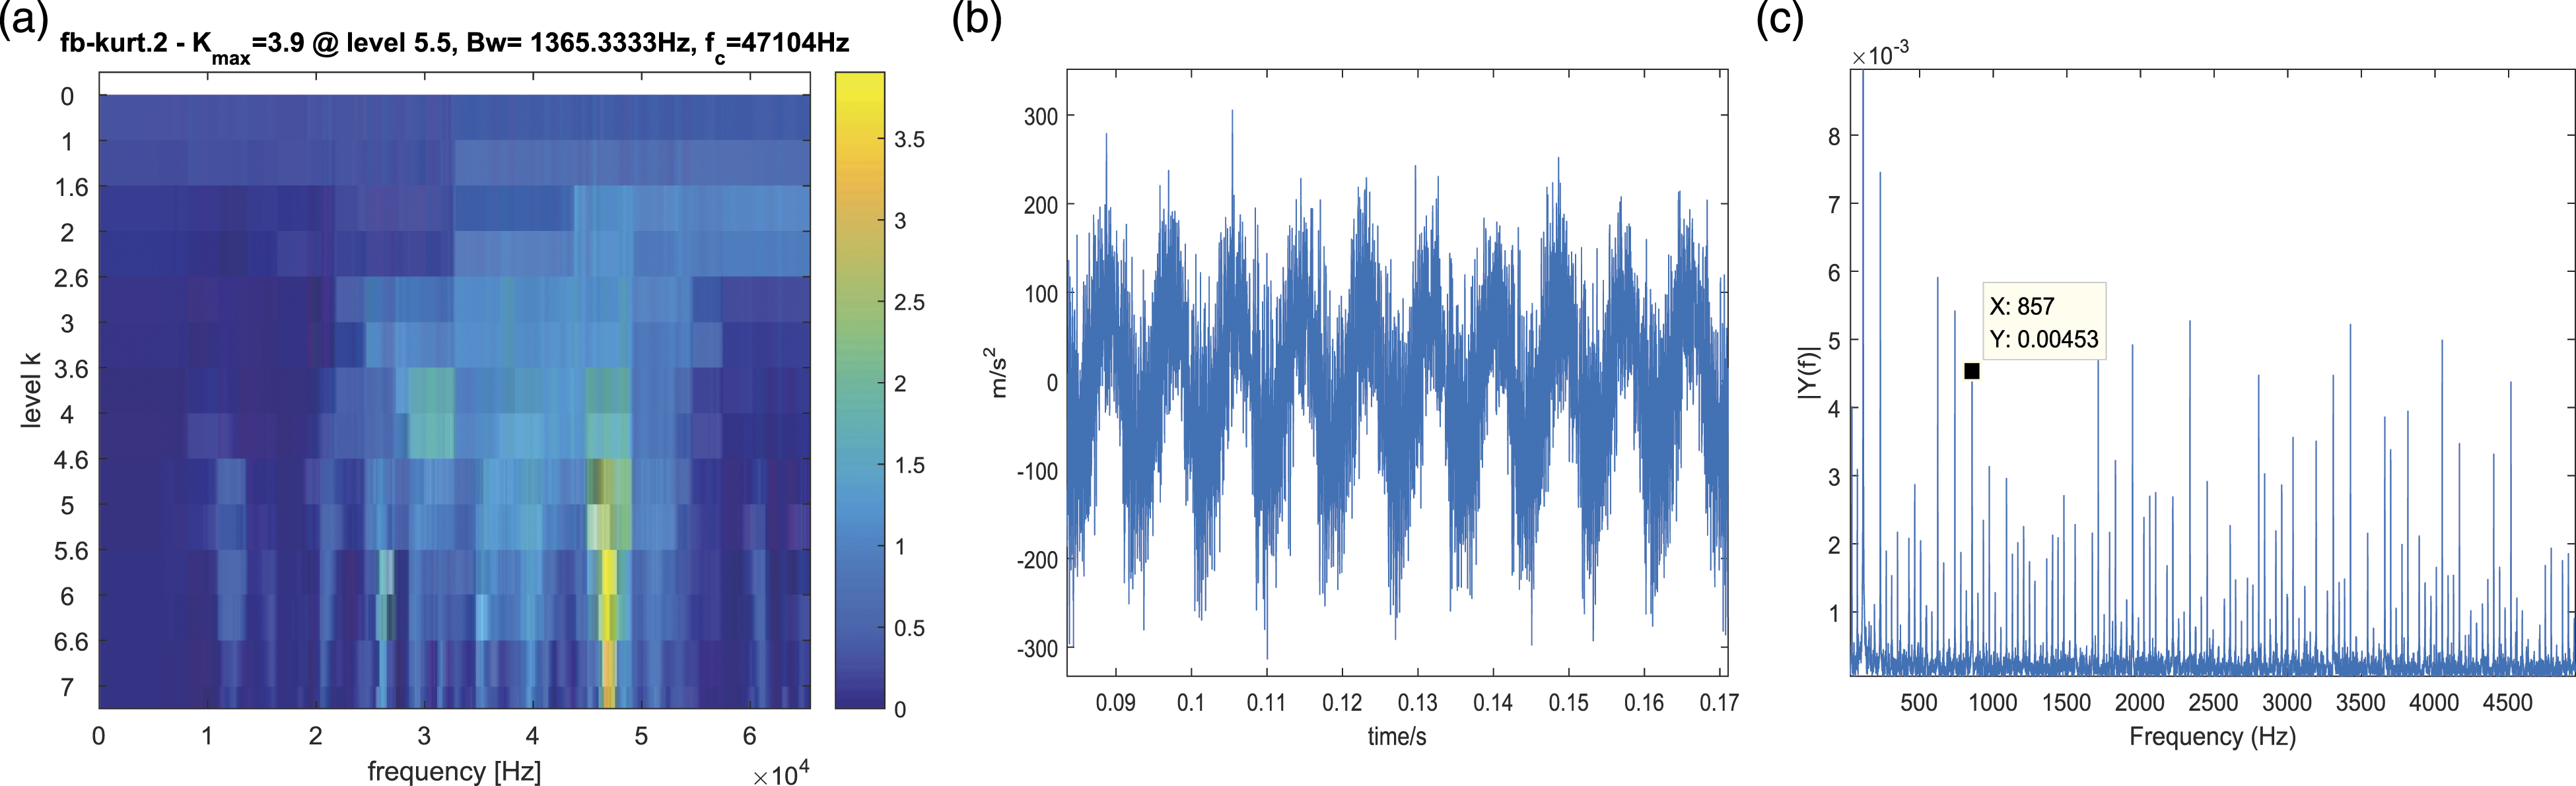
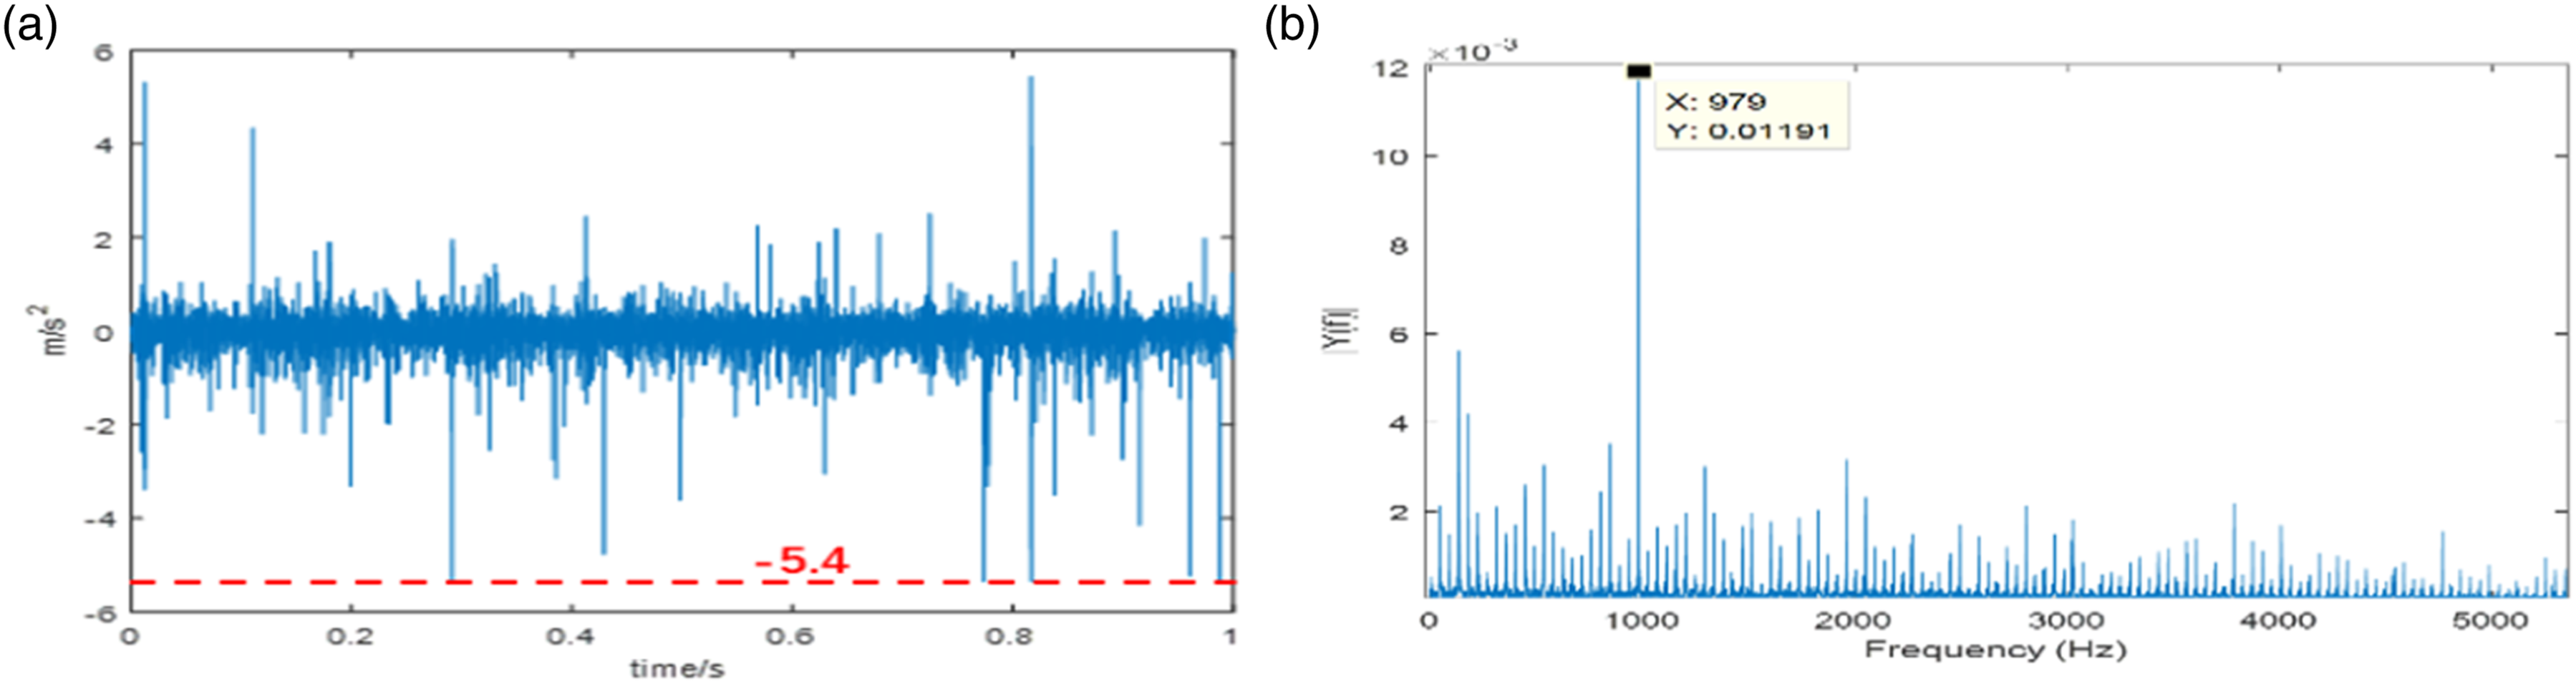
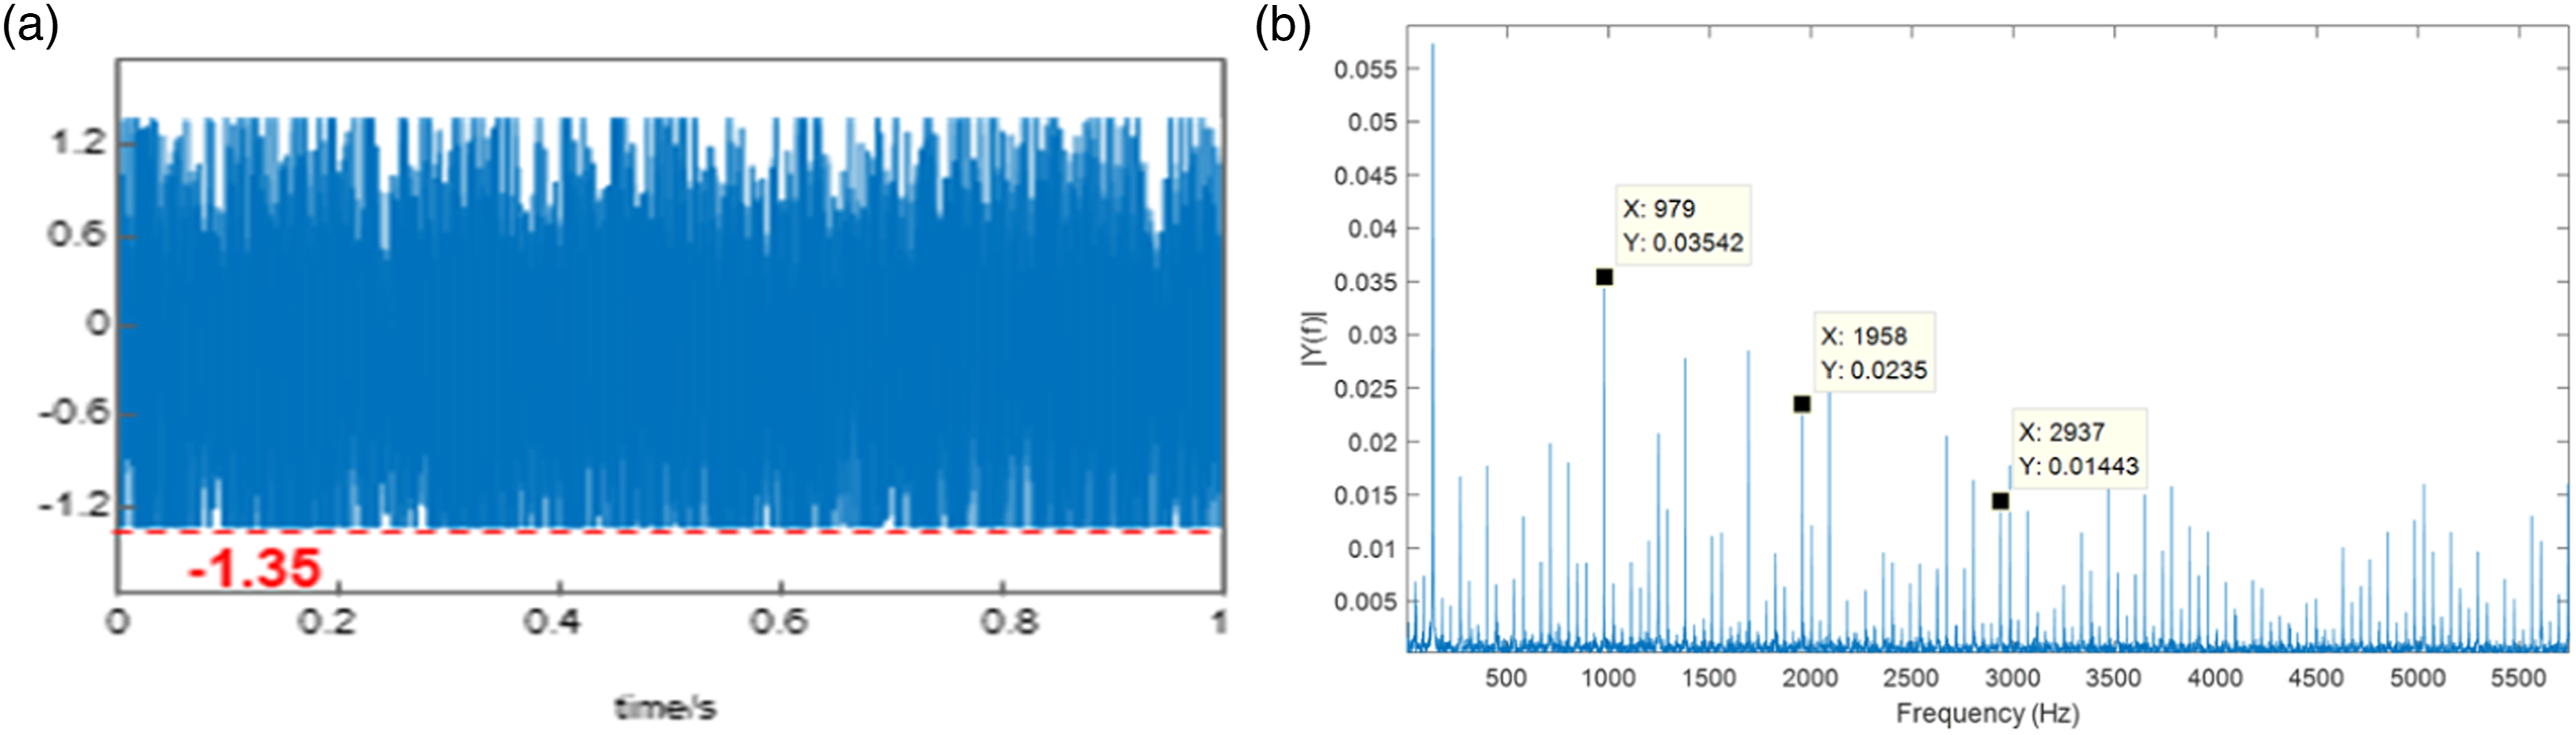
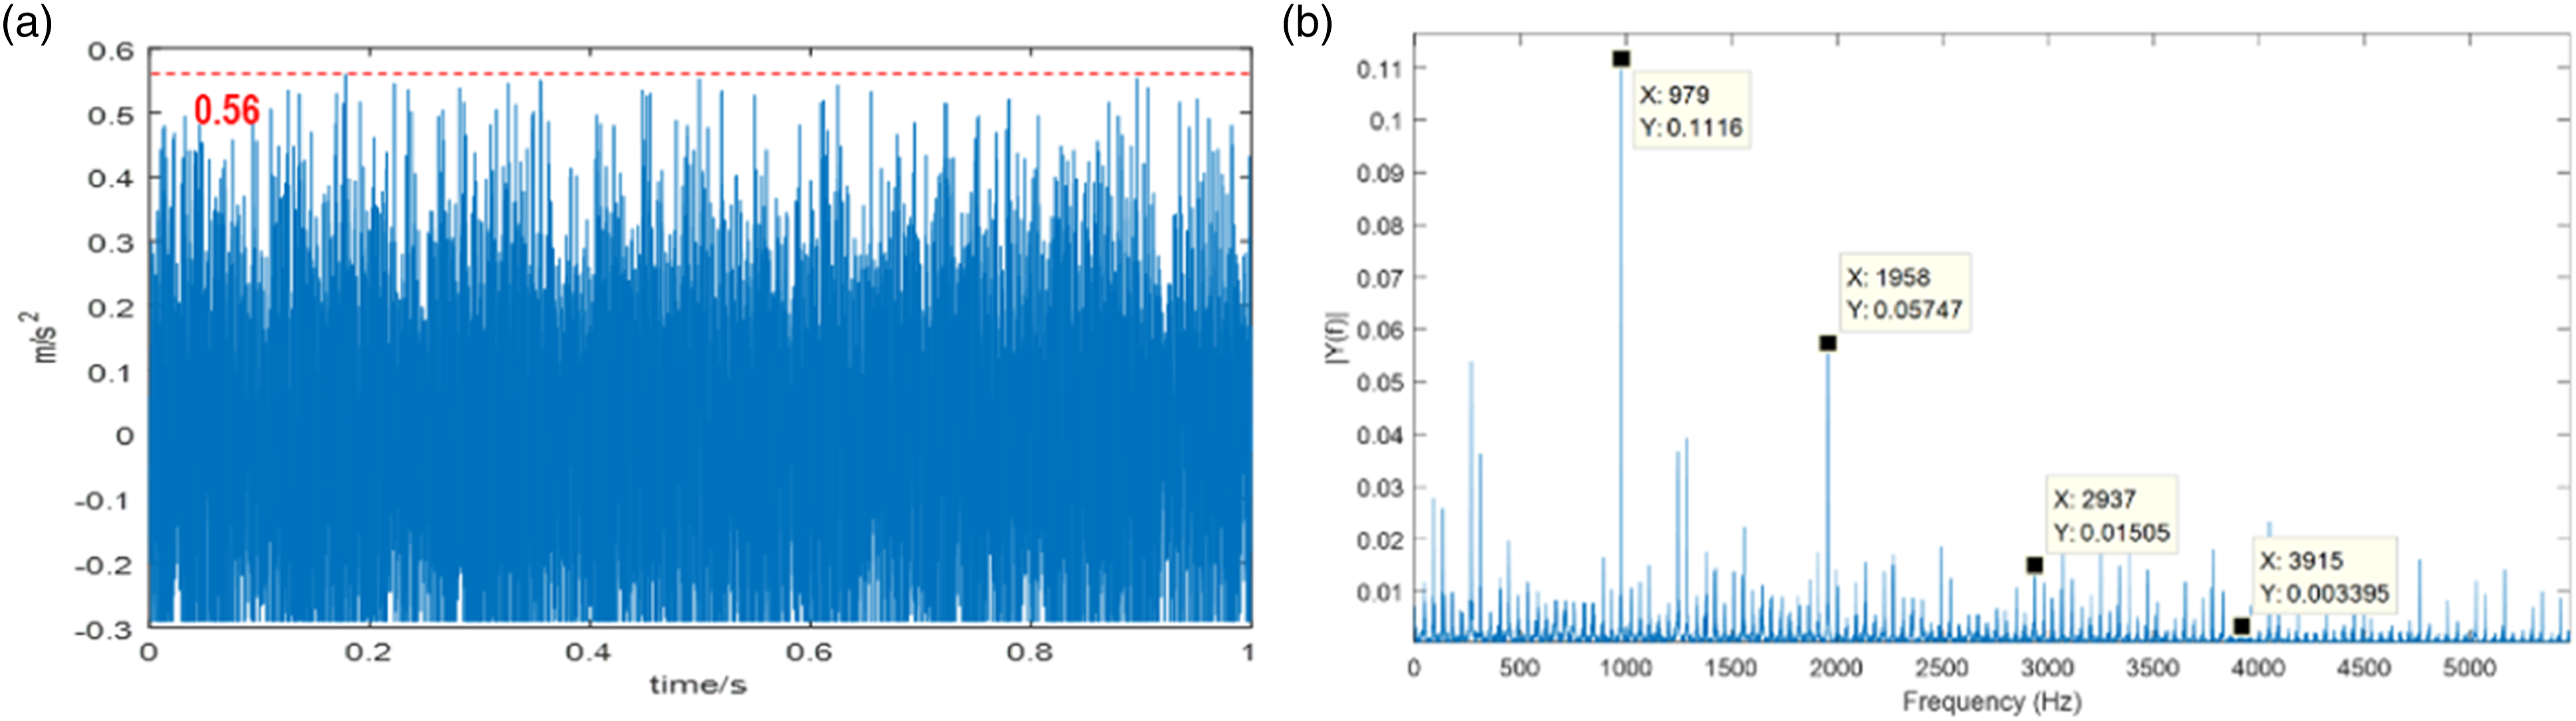
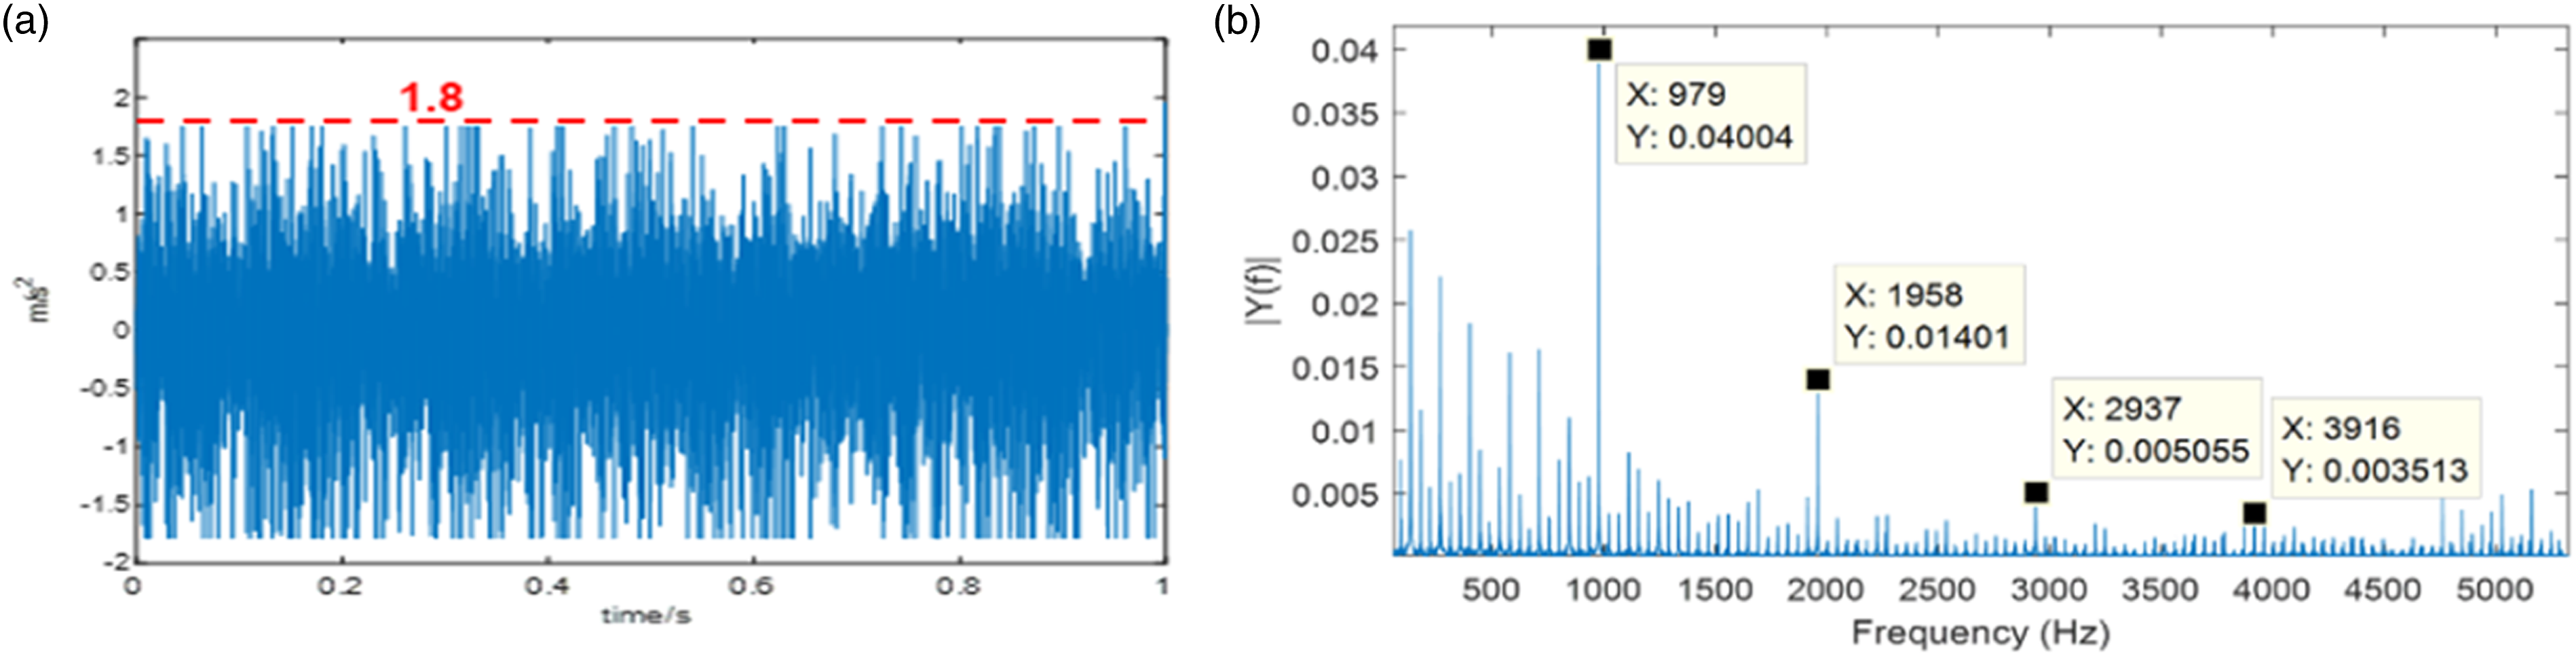
Another experiment with the same bearing is conducted, and the rotation speed is 8000r/min. The fault frequency is 986.67 Hz. The corresponding original vibration timewave and frequency spectrum are shown in Figure 24. The parameters of the previous experiment with rotation speed 7000 r/min are still used here, which means σ, Compression factor n, and the regularization parameter remain unchanged. Then the processed signal with different compression factor n are shown in Figure 25, Figure 26, Figure 27, Figure 28, Figure 29. Table 5 shows different correlated kurtosis of the signals processed by different compression factors. Table 6 shows different biggest correlated kurtosis of vibration signal processed by different regularization parameter. Figure 30, Figure 31, Figure 32 show that the effect different regularization parameters have on the envelope spectrum. Figure 33 is the optimal envelope timewave and spectrum obtained by fast-kurtogram method. Timewave and the corresponding frequency spectrum (8000r/min). Timewave and the corresponding envelope spectrum (n = 1, Timewave and the corresponding envelope spectrum (n = 2, Timewave and the corresponding envelope spectrum (n = 3, Timewave and the corresponding envelope spectrum (n = 4, Timewave and the corresponding envelope spectrum (n = 5, Different correlated kurtosis of vibration signal processed by different compression factor. Different biggest correlated kurtosis of vibration signal processed by different regularization parameter. Timewave and the corresponding envelope spectrum ( Timewave and the corresponding envelope spectrum ( Timewave and the corresponding envelope spectrum ( Experimental result obtained by fast-kurtogram method (a) fast-kurtogram (b) optimal envelope time wave (c) optimal envelope spectrum.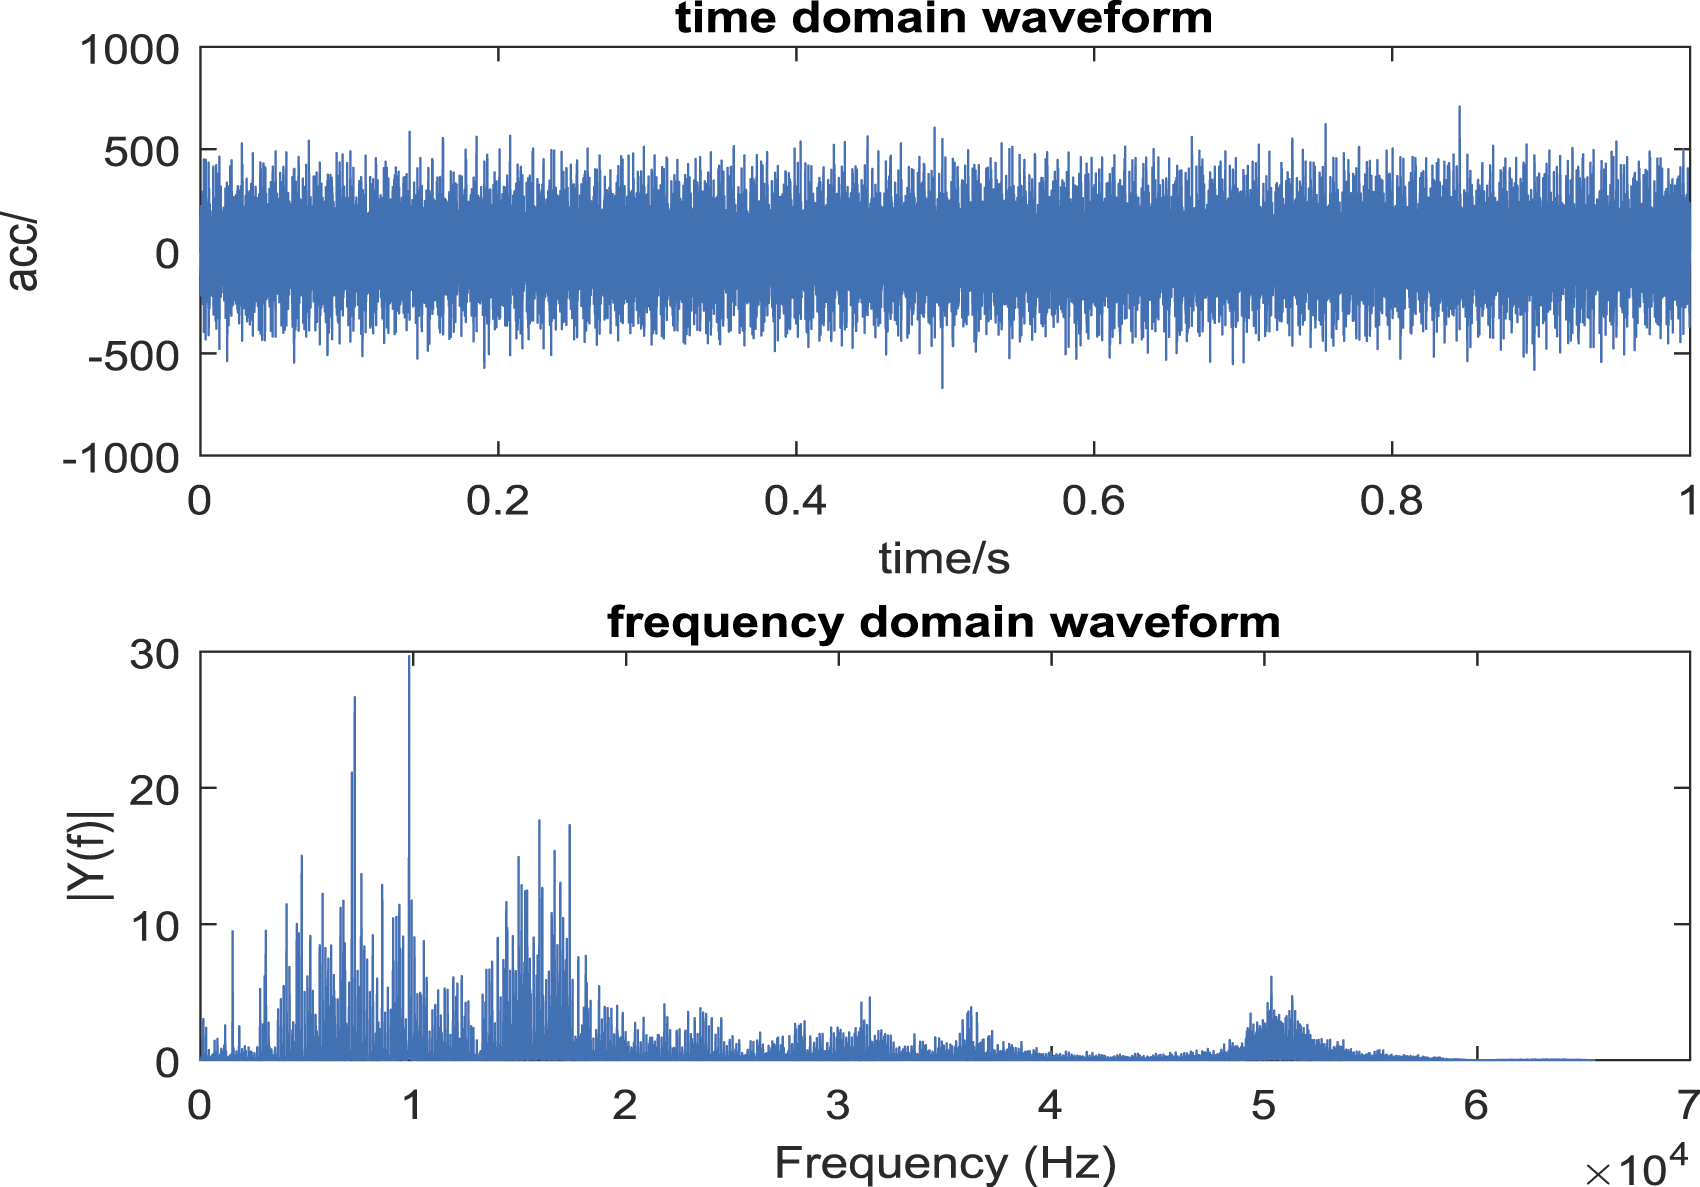
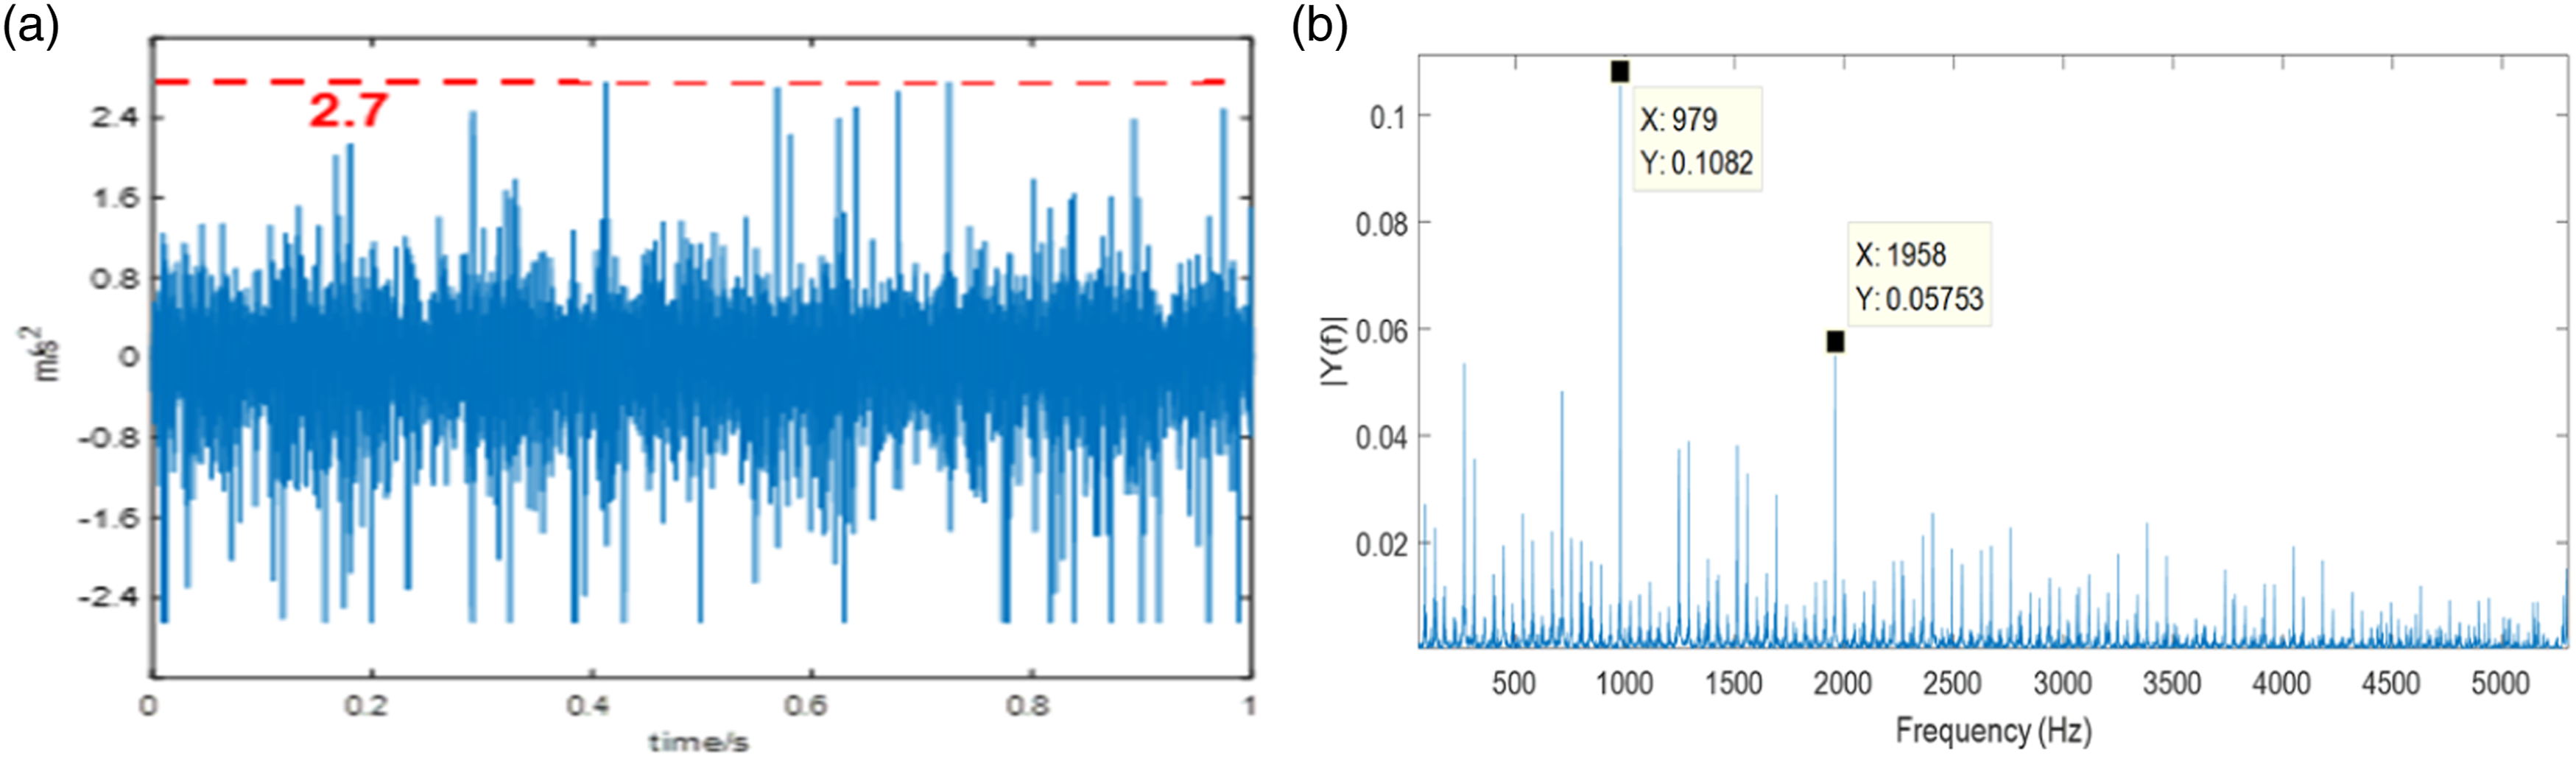
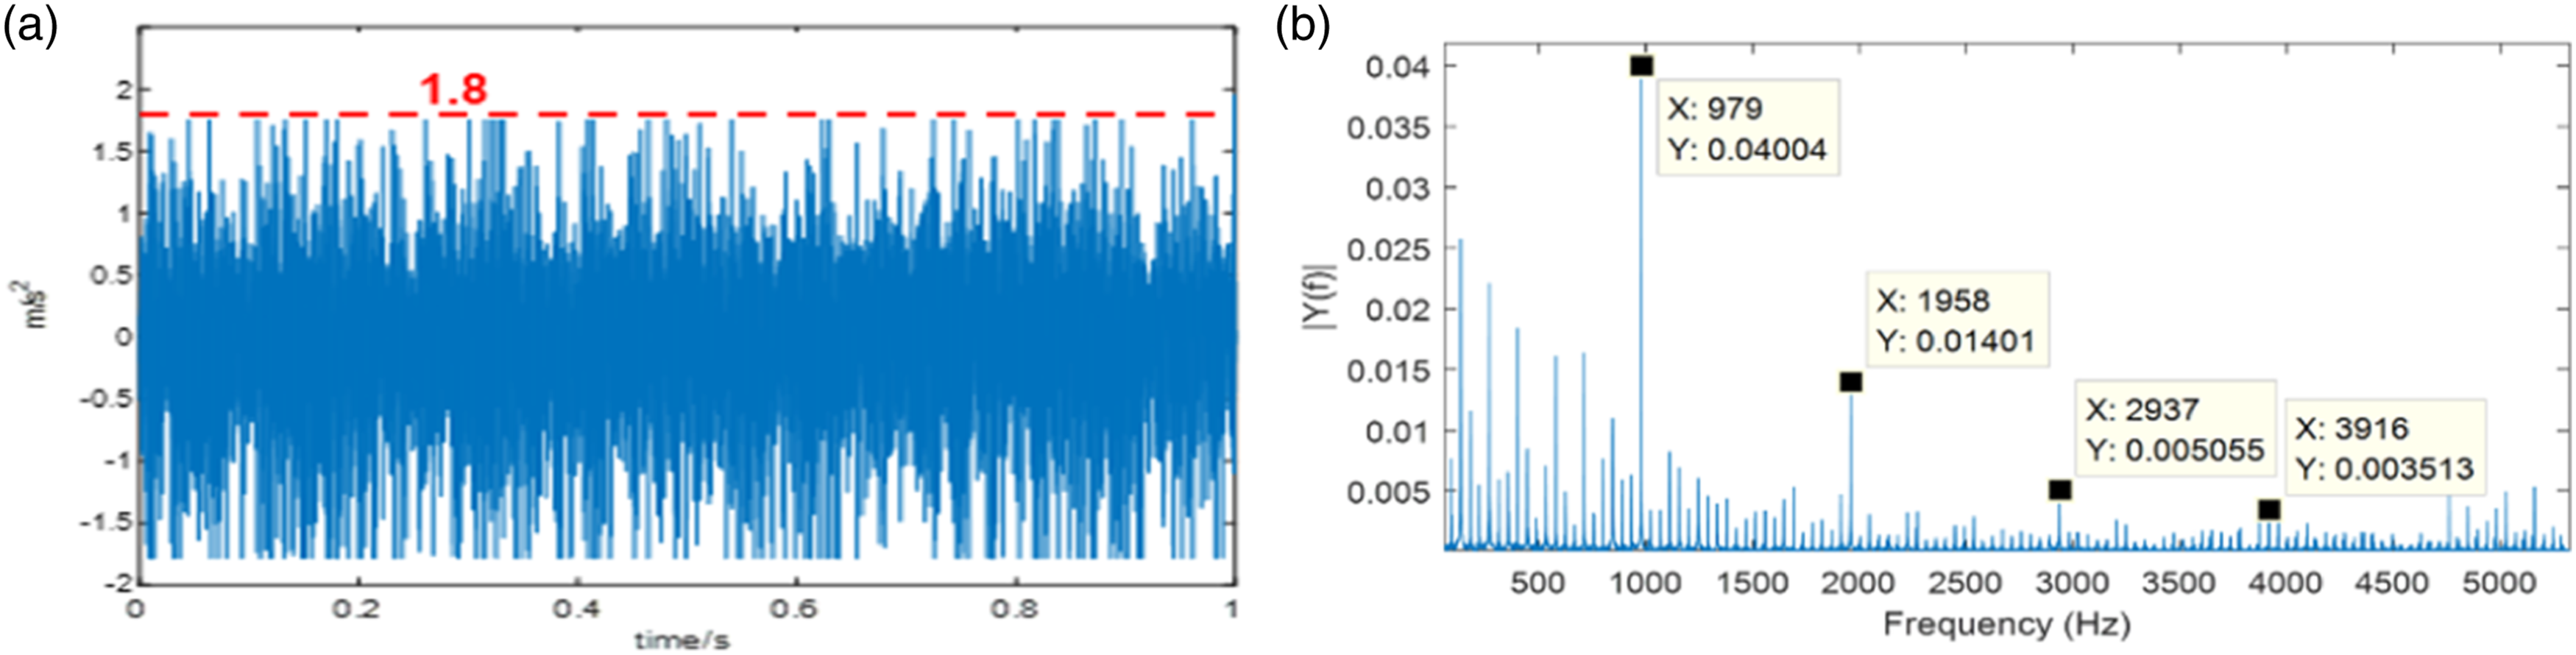
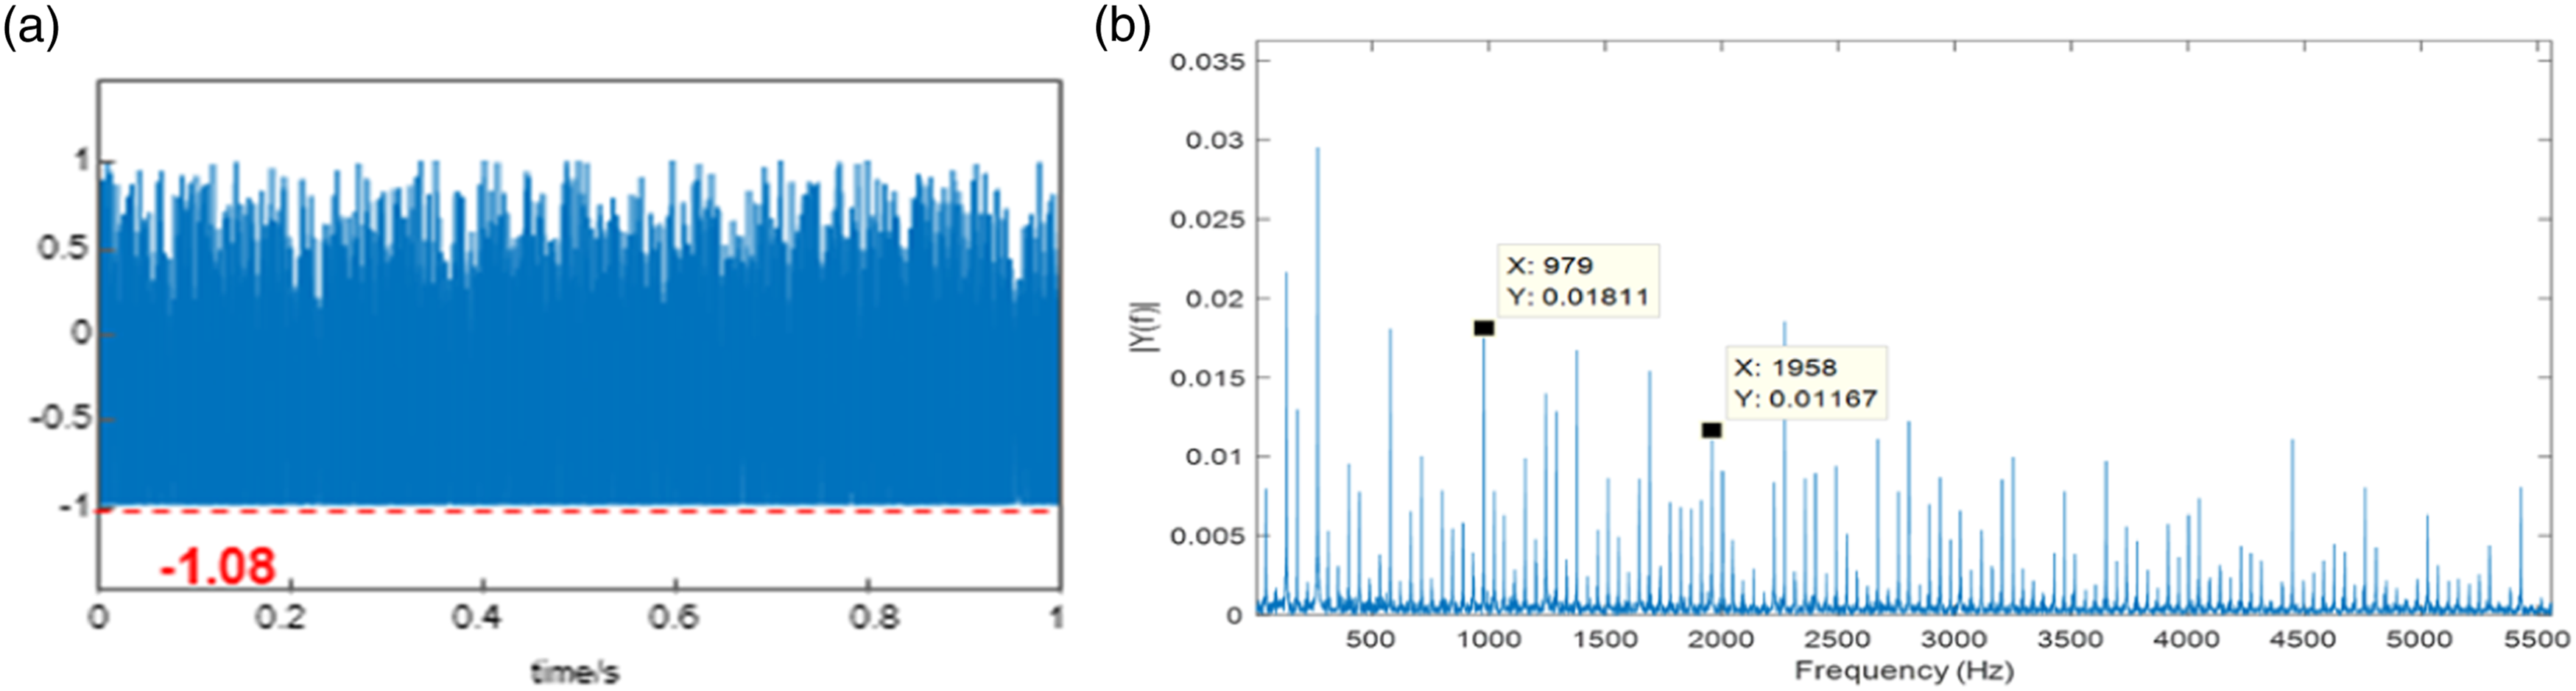
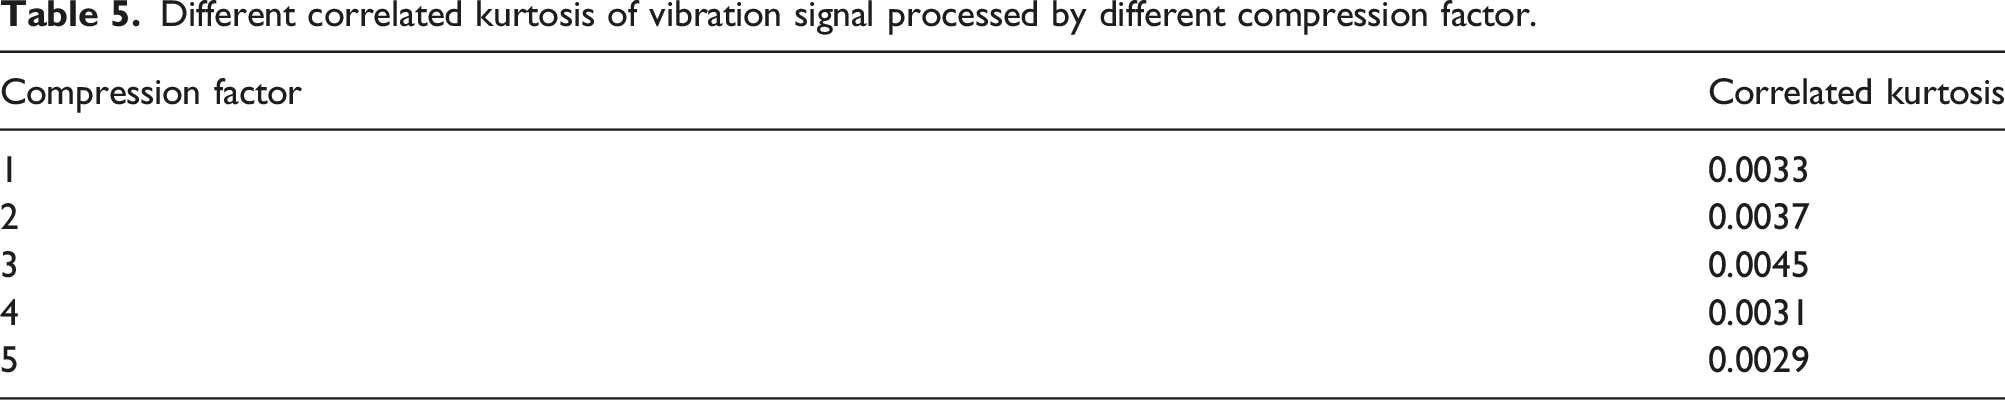
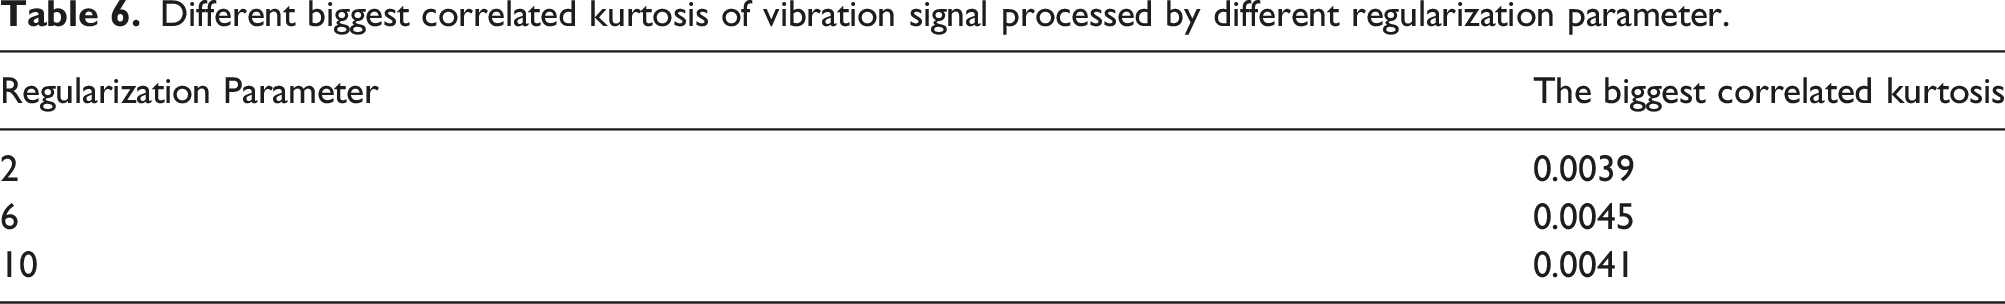
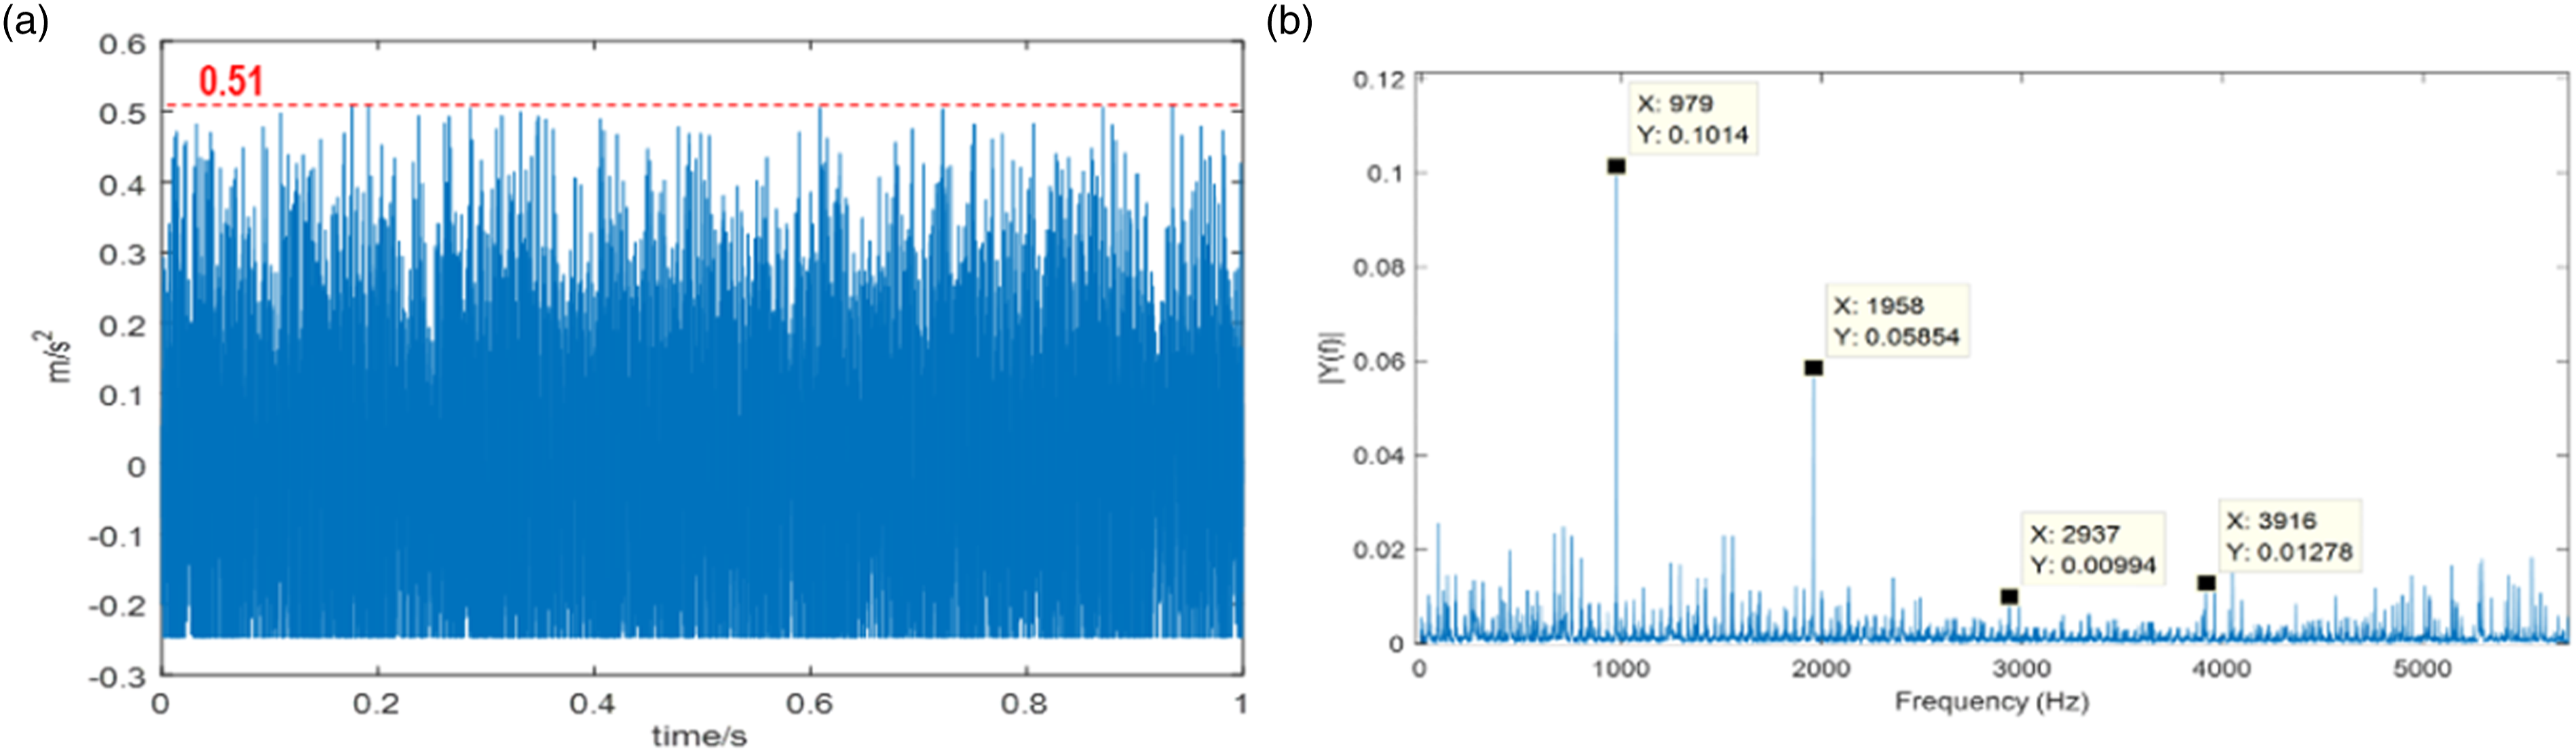
In Figure 25, Figure 26, Figure 27, Figure 28, Figure 29, we can see the best envelope spectrum whose compression factor is 3. In Figure 30, Figure 31, Figure 32, the fault feature of the spectrum with
Therefore, based on the above analysis, the proposed method can obviously amplify the weak fault impact. And the effect of the proposed method is better than the common method.
Conclusion
In this study, amplification-compression function and SSD algorithm are used to extract weak fault impact. Most of the common methods focus on the elimination of the noise. This paper tries another way to amplify the fault impact itself. And it is shown that the amplification-compression method can effectively amplify the small impact in the signal by remaining strong periodicity of the fault impact. Then the amplified impact can be extracted by SSD. The results show that amplification-compression procession can enhance the SNR with appropriate regularization parameter and compression factor. Therefore, the advantage of this method is able to extract weak impact under background noise with high amplitude. And this derivative feature is sensitive to the impact wave, which can apparently distinguish the transient component. Thus, it is more stable and applicable in the real-world application in comparison to the fault detection model based on data-training. Moreover, the extracted impact is closely related to the damage severity which can indicate the health condition. However, the selection of the most optimal regularization parameter or compression factor should be analyzed in depth using optimal algorithms, which can be studied in further research.
Footnotes
Declaration of conflicting interests
The author(s) declared no potential conflicts of interest with respect to the research, authorship, and/or publication of this article.
Funding
The author(s) disclosed receipt of the following financial support for the research, authorship, and/or publication of this article: This work was supported by the National Natural Science Foundation of China (grant 51579242).