
Abstract
Quantifying vehicle-bridge interaction mechanism is critical for bridge safety design, transportation weight control, condition assessments in maintenance, and structural health monitoring. In this paper, the stochastic non-stationary characteristics of a bridge under vehicle-bridge interaction are investigated. The response of the bridge under the loading of vehicles is, respectively, depicted in Fourier spectrum, spectrogram, and Hilbert spectrum. Both Fourier spectrum and spectrogram exhibit some cluster bands. The Hilbert spectrum exhibits time-varying frequencies in the proximity of low bridge natural modes, which suggests possible non-linear and non-stationary characteristics. The stochastic and non-stationary properties are further characterized by using bispectrum and recurrence analysis, and the weak nonlinear properties are characterized by using nonlinear invariants. The free-decay response of bridge (vehicle left the bridge) exhibits linear properties, which is correlated with the natural modes of bridge, whereas the bridge vibrations under moving vehicle exhibit complicated stochastic non-stationary and non-linear properties. These provide the insights into the conventional modal analysis-based approaches for heavy vehicle-loaded bridge condition assessments and structural health monitoring.
Introduction
In bridge engineering, understanding the vehicle–bridge interaction mechanism is critical for designing a safe bridge, assessing used bridge conditions during its maintenance phase, implementing traffic/vehicle weights control, and monitoring the structural health of bridge.1–7 In principle, the vibrations of bridge under passage vehicle could be non-linear, stochastic, time-varying, and non-stationary.8–17 The bridge responses may exhibit nonlinear properties due to a variety of issues such as aging, corrosion, crack, fatigue, uneven settlement, stress relaxation, and concentration. The traveling vehicle on bridge renders the problem to be time-varying. The surface roughness of pavement of bridge generates random excitation to traveling vehicle on bridge. Most of conventional analysis, testing, and identifications generally focused on only part of the abovementioned complicated properties to approximate the actual reality.
Traditionally, many research studies have been dedicated to both the use of computational methods and vibration testing methods to predict and estimate natural frequency, mode shape, damping, slope of mode shapes, curvature and high-order mode shape derivatives, modal flexibility, and strain energy of bridge to evaluate bridge stiffness and integrity and provide extra tools for bridge evaluation, as the load carry capability, structure damage, and some other structural characteristics are related to or can be indicated by modal properties. However, using linear vibrational methods to evaluate stiffness or detect damage is not a reliable scheme for bridge under moving vehicles. Damage such as cracks in structural members can produce non-linear structural parameters that result in different complicated nonlinear characteristics. Moreover, the uncertain and non-stationary properties of bridge due to the moving vehicle excitations render the identification of this problem to be more complicated.
Even though in most cases, the calculated modal parameters and tested modal parameters correlated very well, there have been huge discrepancy between analytical response and measured response of bridge under the load of moving vehicles, which is caused by the uncertainty of the interaction between vehicle and bridge and the non-linearity of large deformation of bridge under heavy vehicle load.
There are only a limited number of studies that focused on the examination of the physical mechanisms behind the interaction between vehicles and bridges.1–6 When a vehicle moves over the bridge, the vehicle–bridge interaction leads to the stochastic, time-varying modal parameters of the system. The identification of stochastic non-stationary and non-linear characteristics of bridge responses due to moving vehicle load is important and remains a challenging task.10–17
This paper attempts to comprehensively characterize the non-linear, stochastic non-stationary dynamic properties of the vibrations of a bridge under a moving vehicle, by using output only or data-driven methods. The tested response of a bridge under moving vehicle is characterized by using a variety of spectrums, including FFT, spectrogram, and EMD-based Hilbert spectrum (HHT). Then, the response is further evaluated by using higher order spectrum.18,19 Furthermore, the response is evaluated by using improved parameters in the context of contemporary non-linear dynamics theory. For comparison, the Fourier spectrum of the free decay response is depicted in the context of linear dynamics to make a preliminary assessment of the vibrational modal properties of the system. The time-varying properties of the spectrum of response are characterized by using spectrogram and HHT analysis. The stochastic properties are characterized by using bispectrum analysis. The non-stationary properties are characterized by using recurrence analysis. The non-linear invariants including momentary largest Lyapunov exponents and correlation dimension are used to identify non-linear properties, which were examined, and it is shown that the vibrations exhibit non-linear stochastic non-stationary features. The application of the bispectrum and recurrence analysis helps reliably characterize the non-stationary and uncertain responses of a bridge structure under excitations.
The extracted stochastic non-stationary and non-linear signatures of bridge–vehicle interaction offer insights to the bridge condition assessment, transportation management, and the structural health monitoring as well as for future structure design optimization.
Bridge response under moving vehicle load
The Chuitna River Bridge was built in 1970 between Fairbanks and Anchorage, Alaska, USA. Heavy, overloaded vehicles weighing up to 40,000 pounds (178 kN) regularly cross the bridge. The Chuitna River Bridge is a steel girder bridge, and this bridge has 790 ft (240.8 m) long. Figure 1 is a photo of the Chuitna River Bridge and the truck used in testing. Chuitna River Bridge (a); A-30 boom truck traveling on the bridge (b).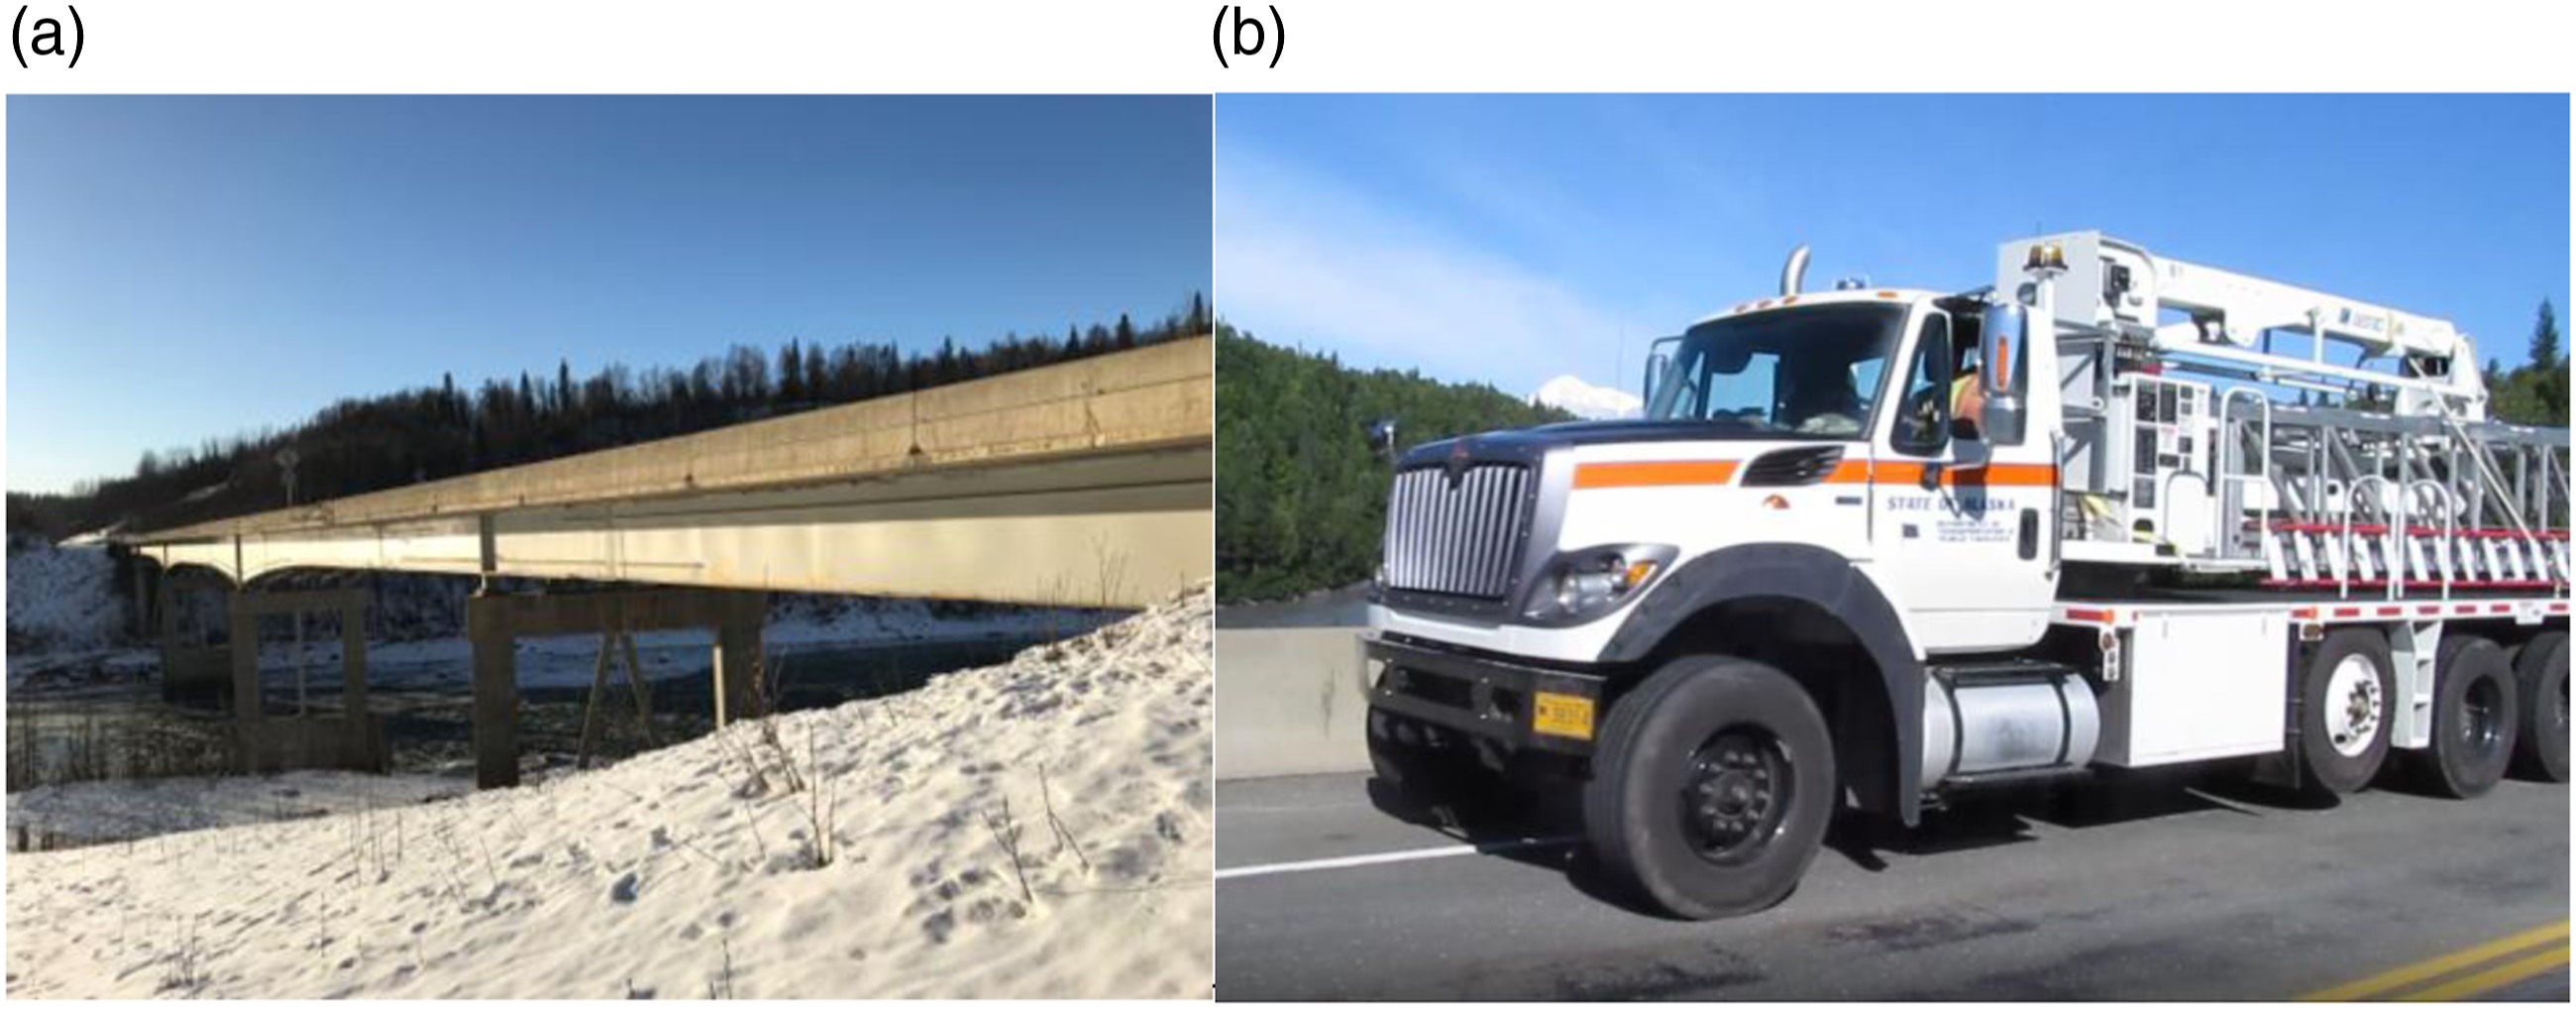
The A-30 boom truck acts as an actuator for the bridge. During the kinetic test, the conditions of the test site were windless (the lack of wind reduces the effects of other input loads). The truck crosses the bridge from north to south in the upstream lane at 45 mph (72.4 km/h). The bridge was closed to other traffic during the test procedure. All the following results are based on the measurement made under precise conditions.
Spectrum analysis
First, the acceleration data gained from a point is selected for analysis, the sensor is placed on the bridge deck surface, and the vibration in the vertical direction is measured. The accelerometer is EpiSensor ES-U2 force balance accelerometer, and the sampling rate is 1 kHz. In this study, the accelerometer was connected to a portable data acquisition system for data collection. Figure 2 shows the time history of a representative point’s acceleration. In Figure 2, there are two periods, one is the bridge–vehicle interaction period when the test vehicle is being driven on the bridge, and another one is the bridge free-decay period when the test vehicle has left bridge. Time history of measured acceleration.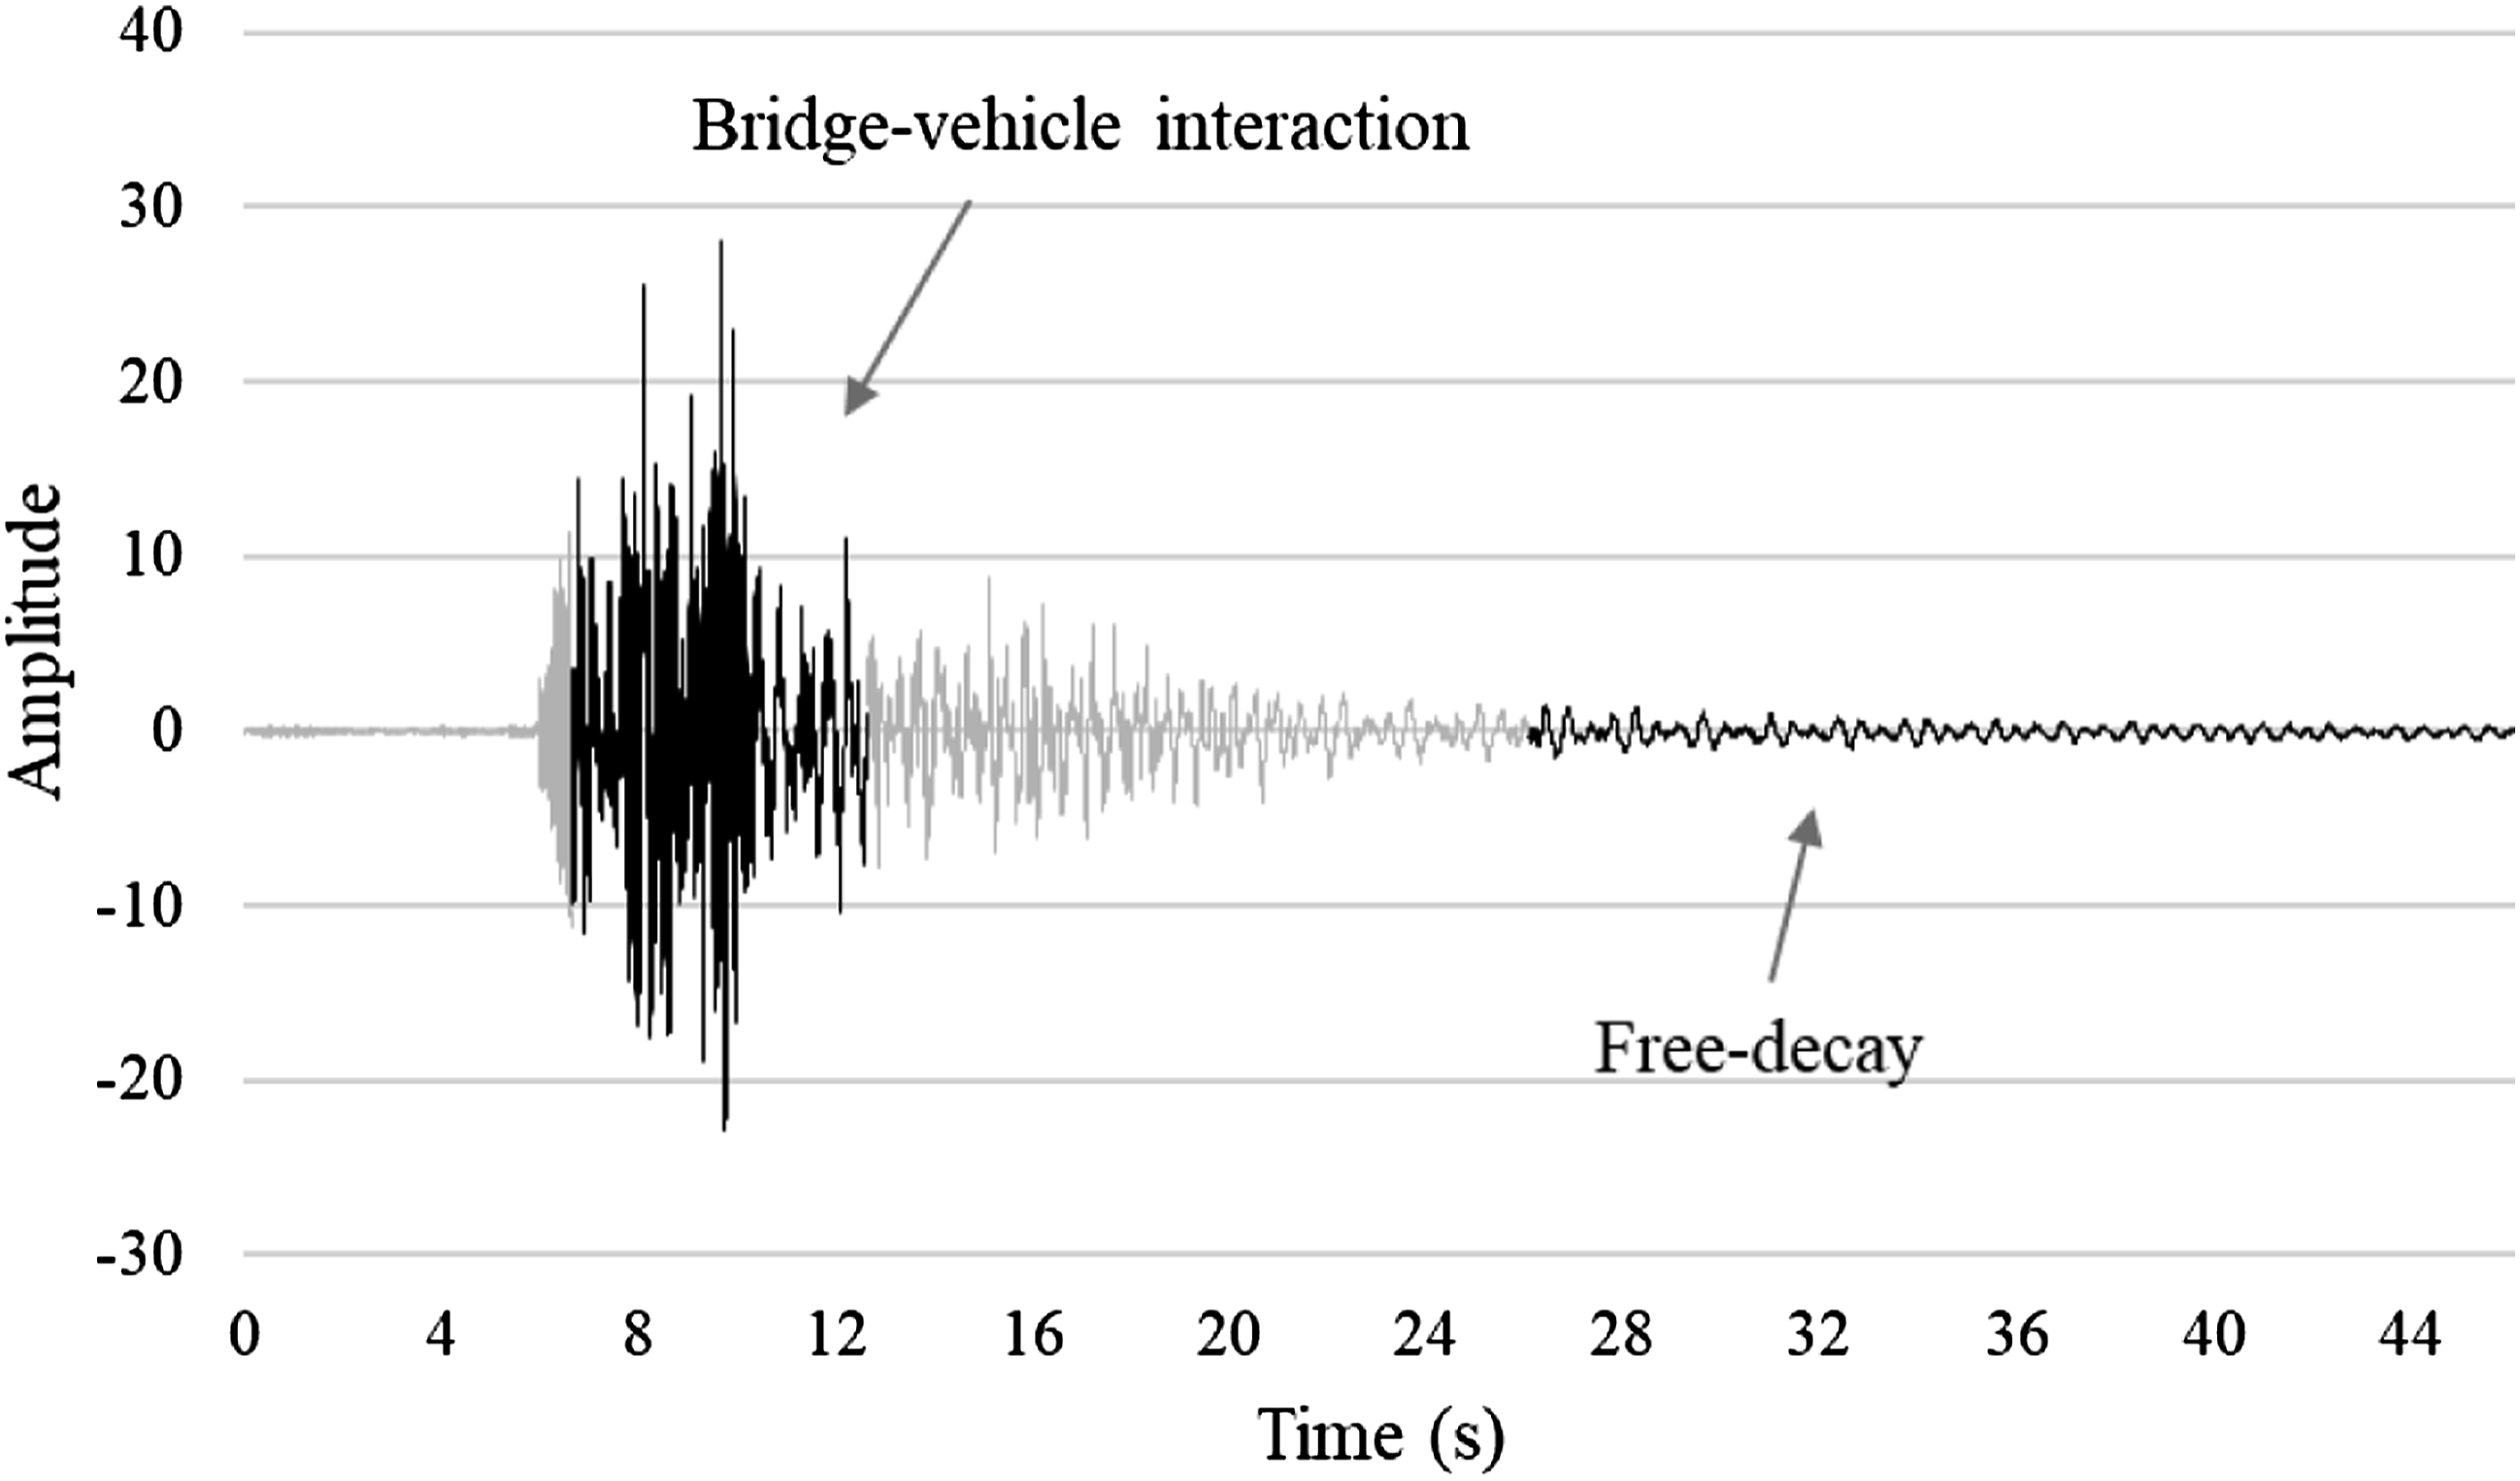
Figure 3(a) shows the time history of bridge free-decay period, and the corresponding FFT spectrum is also included in Figure 3(b). Figure 4(a) shows the time history of bridge–vehicle interaction period. The fast Fourier transform (FFT) and spectrogram are used to analyze the bridge–vehicle interaction period (Figure 4(b) and (c)). Bridge free-decay response and FFT spectrum. Response of bridge under moving vehicle, FFT, and spectrogram.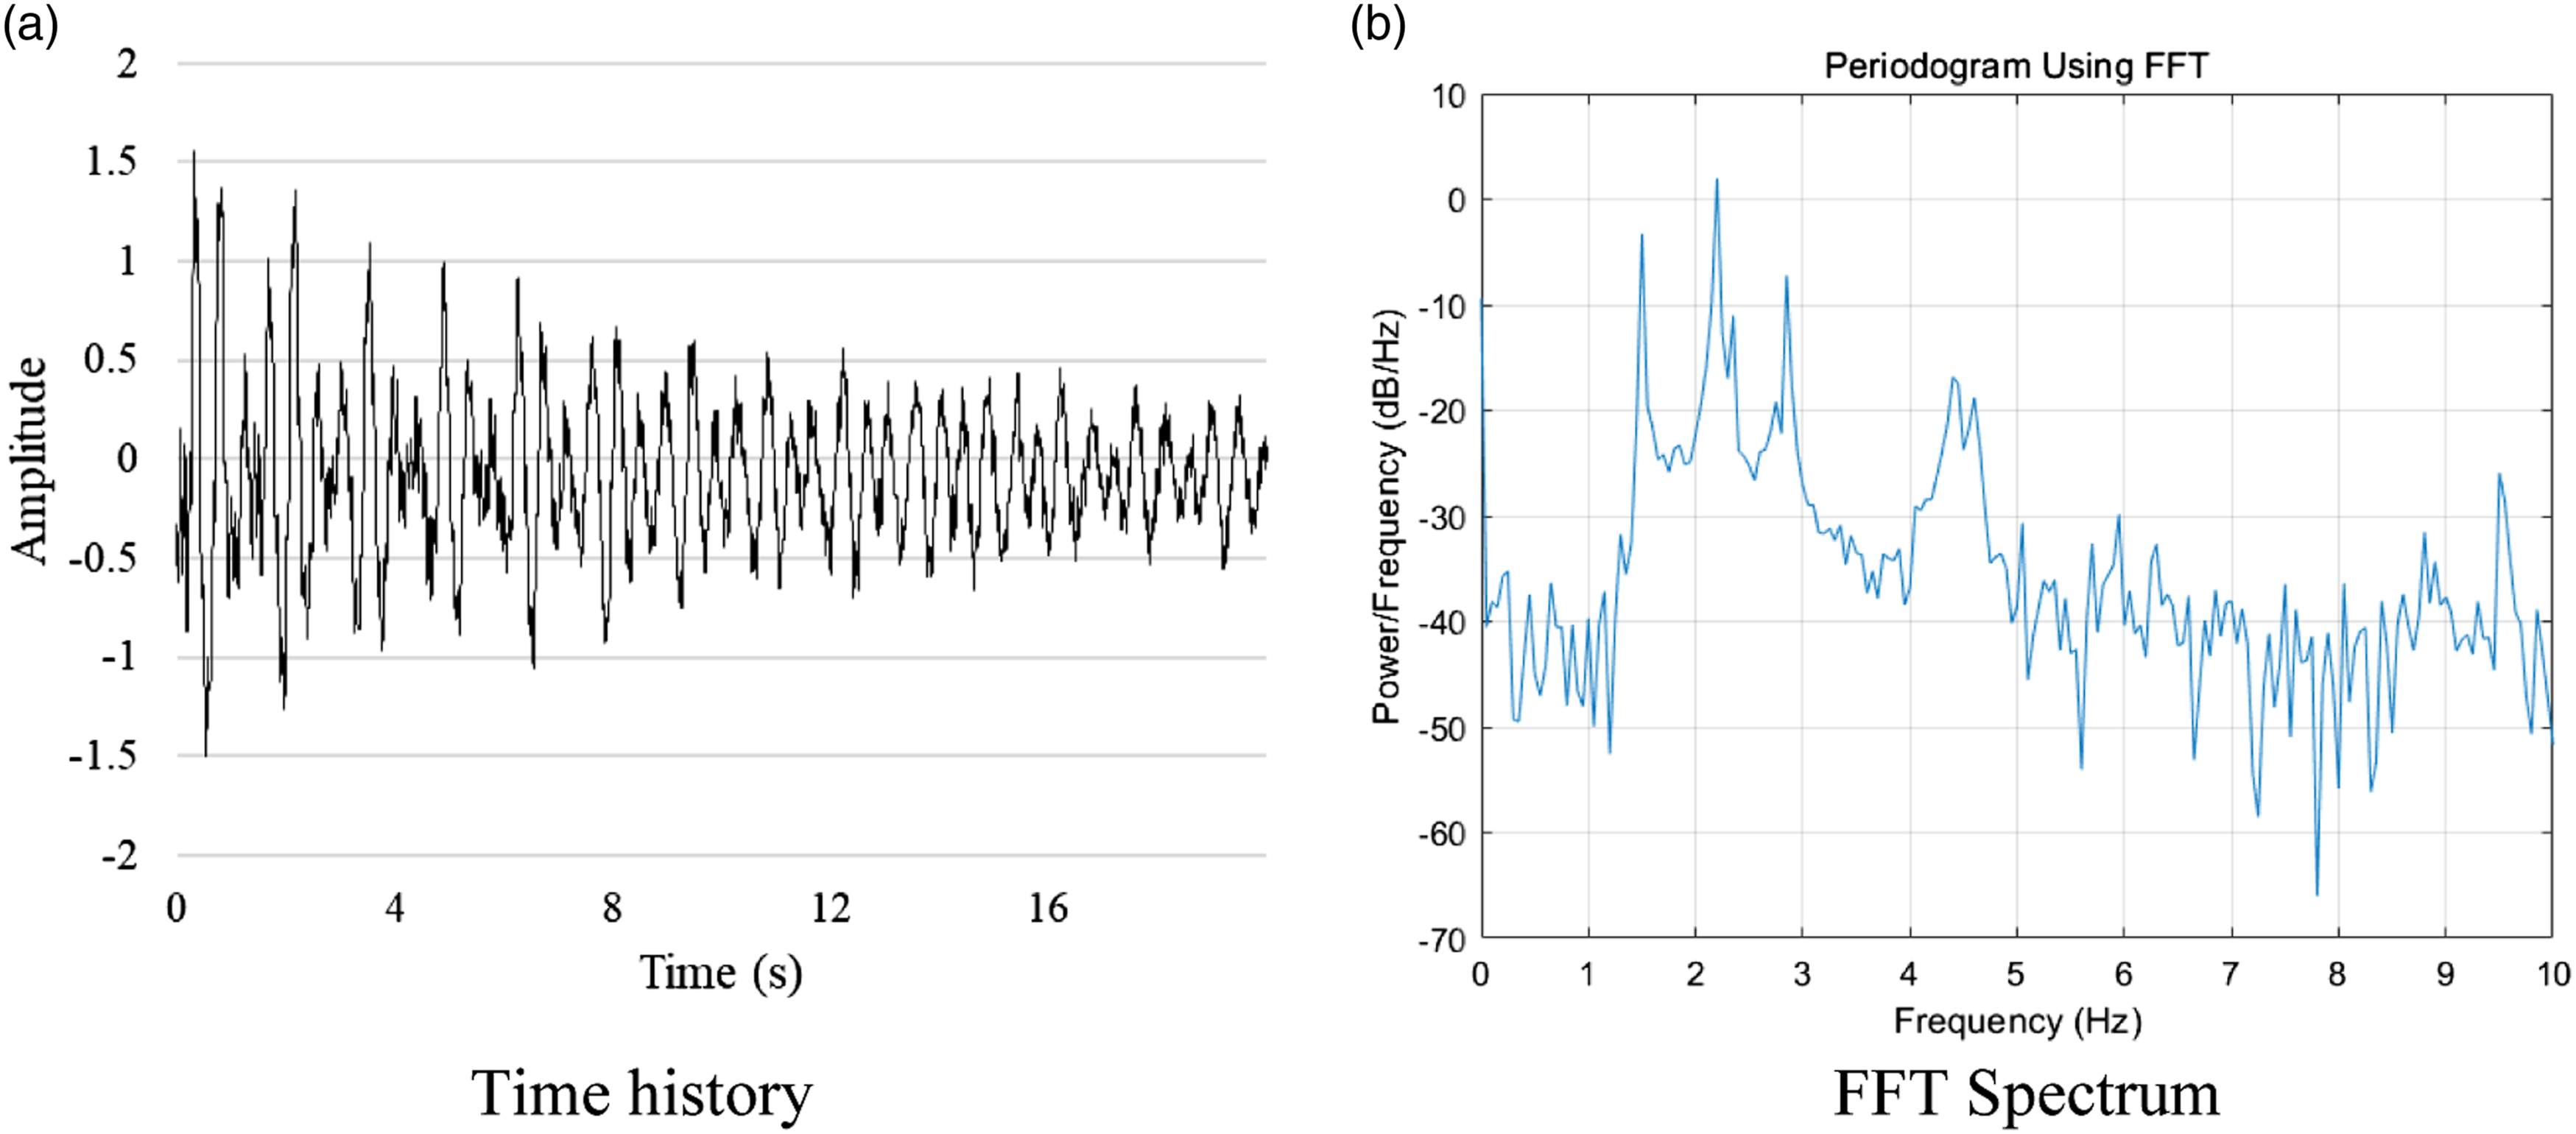
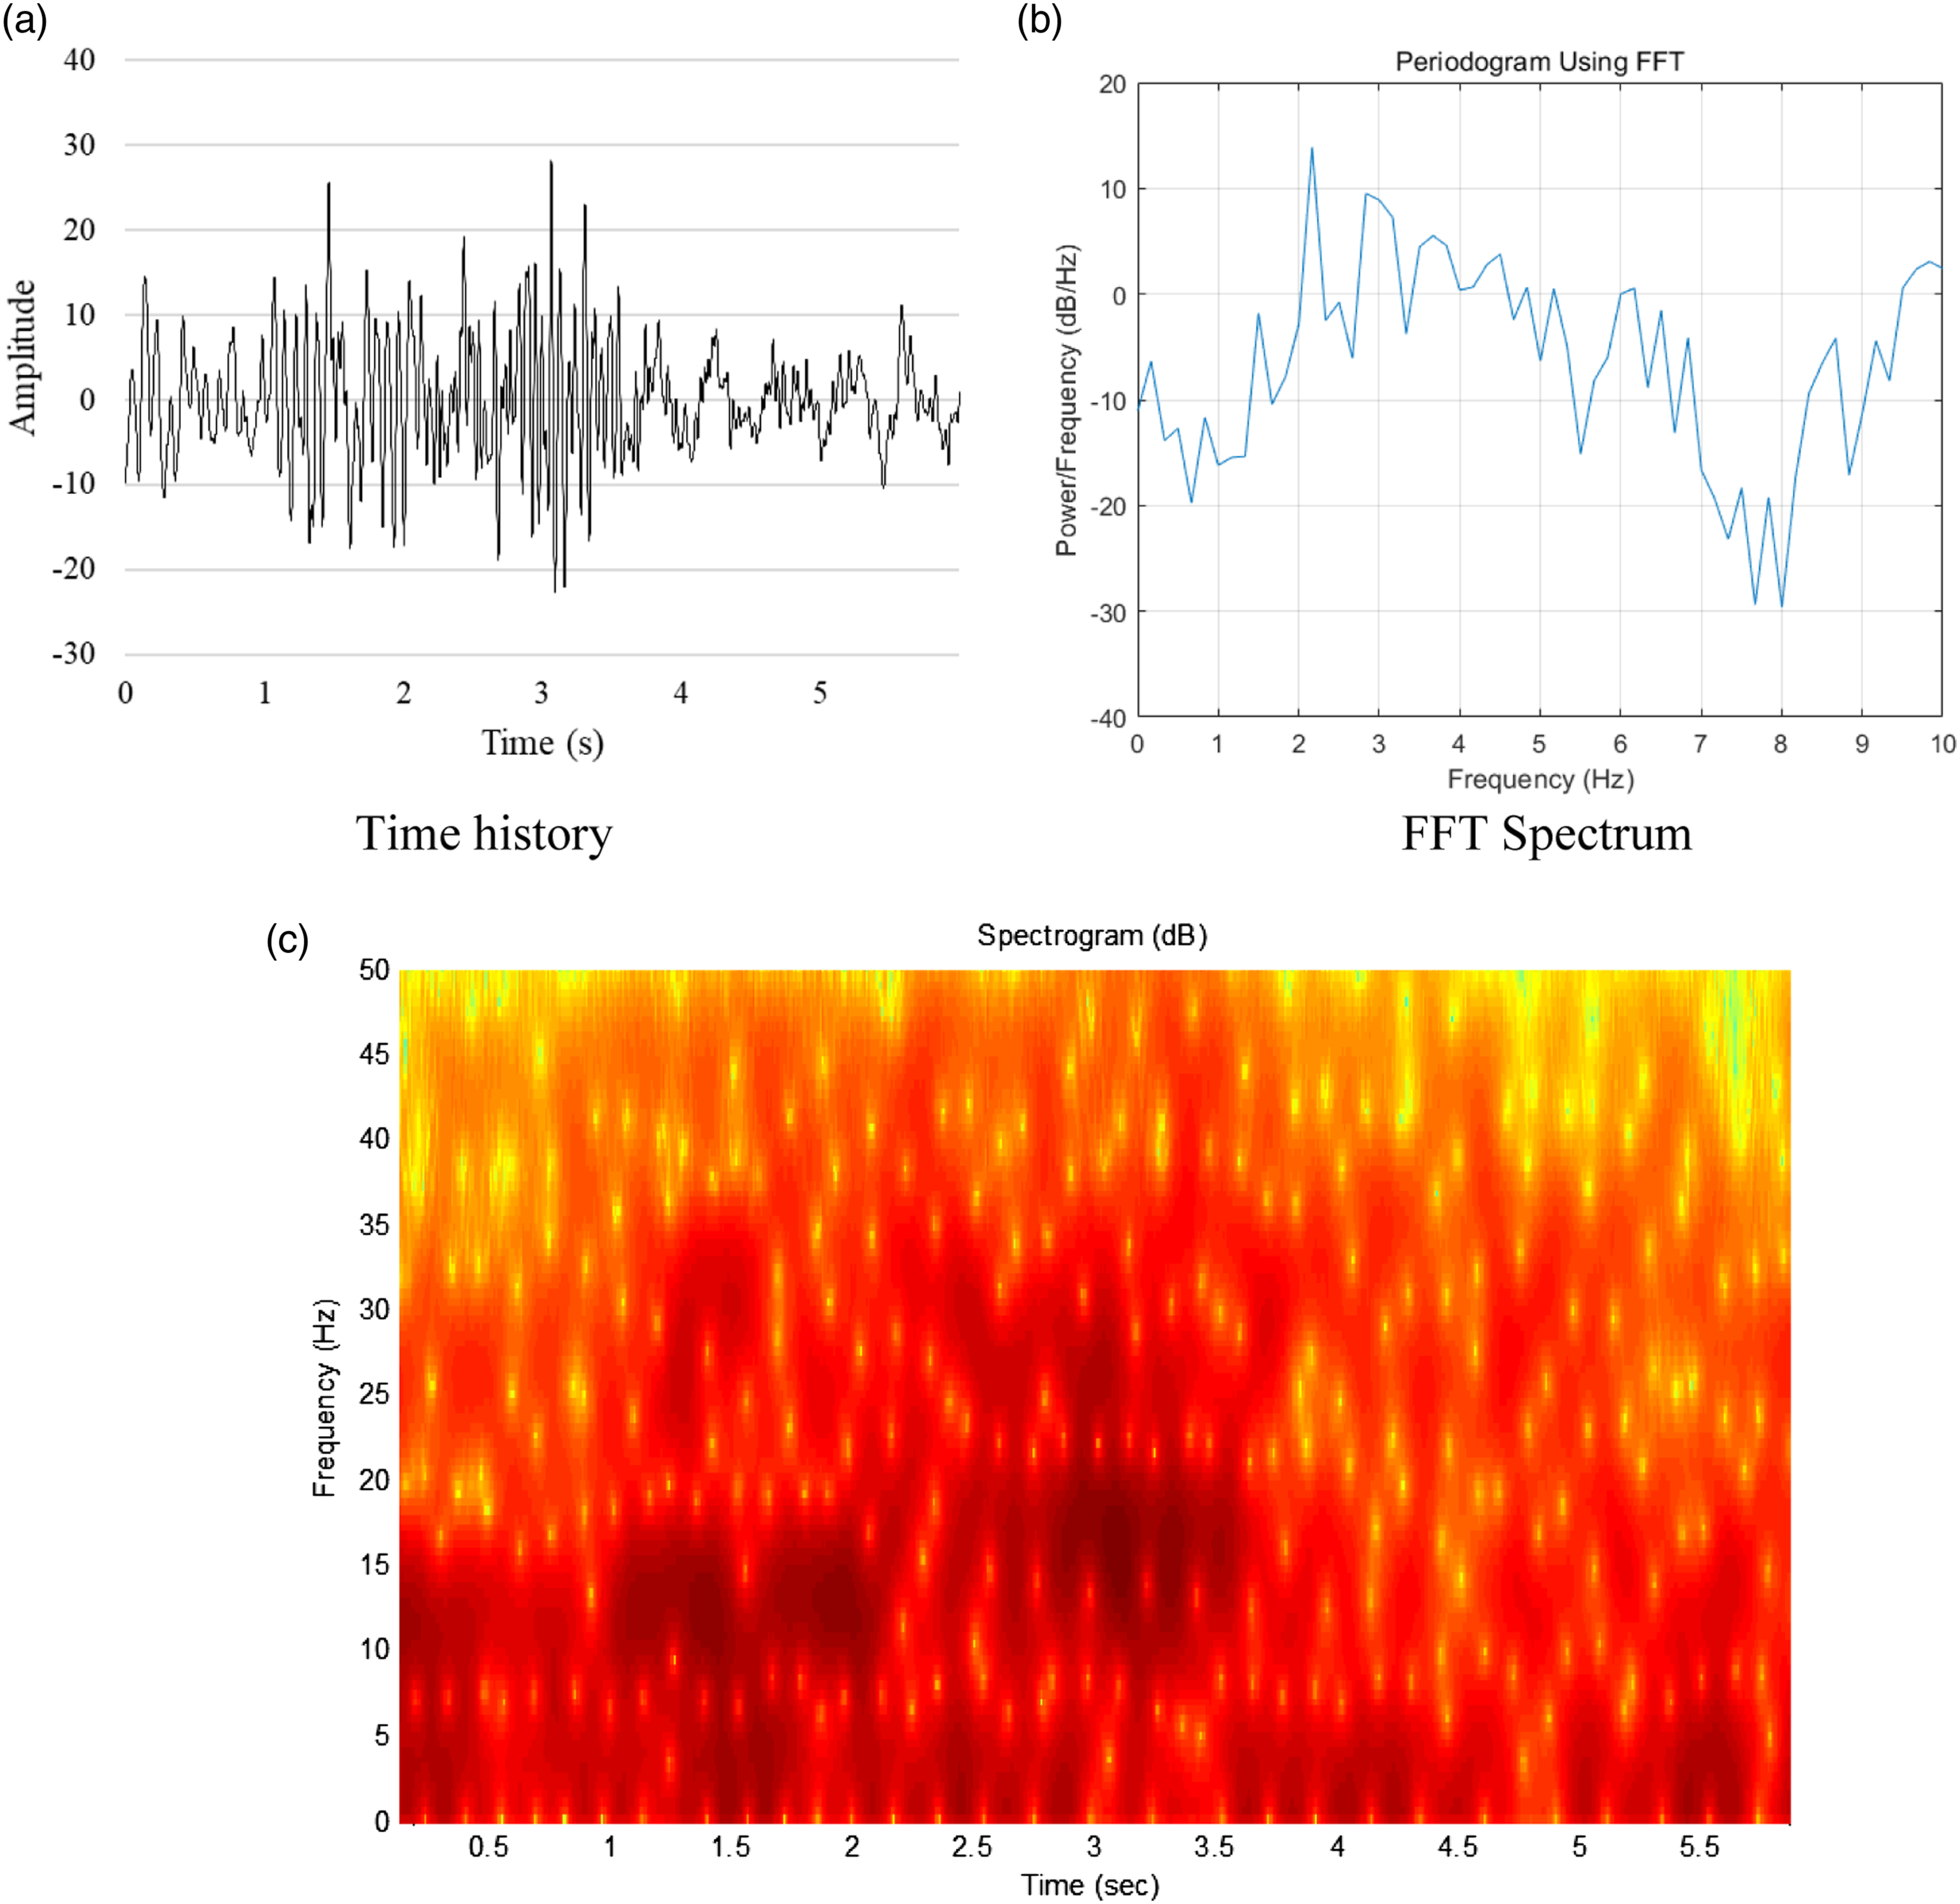
In Figure 3(b), the results of the FFT show that the natural frequencies of the system are 1.50 Hz, 2.20 Hz, and 2.85 Hz. However, these modes are not obvious or salient in the spectrum in Figure 4(b) which exhibits a narrowband. We assume that the free decay of system vibrations after the vehicle leaves the bridge is linear and then identify the spectral peaks in the Fourier transform (Figure 3(b)). Fourier spectra are considered as invariants in linear dynamical systems. However, during the bridge–vehicle interaction phase, non-linear, non-stationary dynamics may be prominent due to the uncertainties of the moving vehicle loads and the road surface (Figure 4(b) and (c)). The next section will use advanced non-linear non-stationary analysis to explain the result.
In order to further study the complex frequency characteristics, the Hilbert spectrum based on the HHT method is used to reprocess the acceleration signal at each point. Figure 5 is the Hilbert spectrum of these signals, where the individual components are clearly visible. Figure 5 clearly characterizes the time-dependent properties of frequency, with modal distributions in the range of 2–4 Hz. It can be seen that the Hilbert spectrum provides a clear non-stationary feature for the dynamic system response of the bridge. Hilbert Spectrum of HHT decomposed response signal.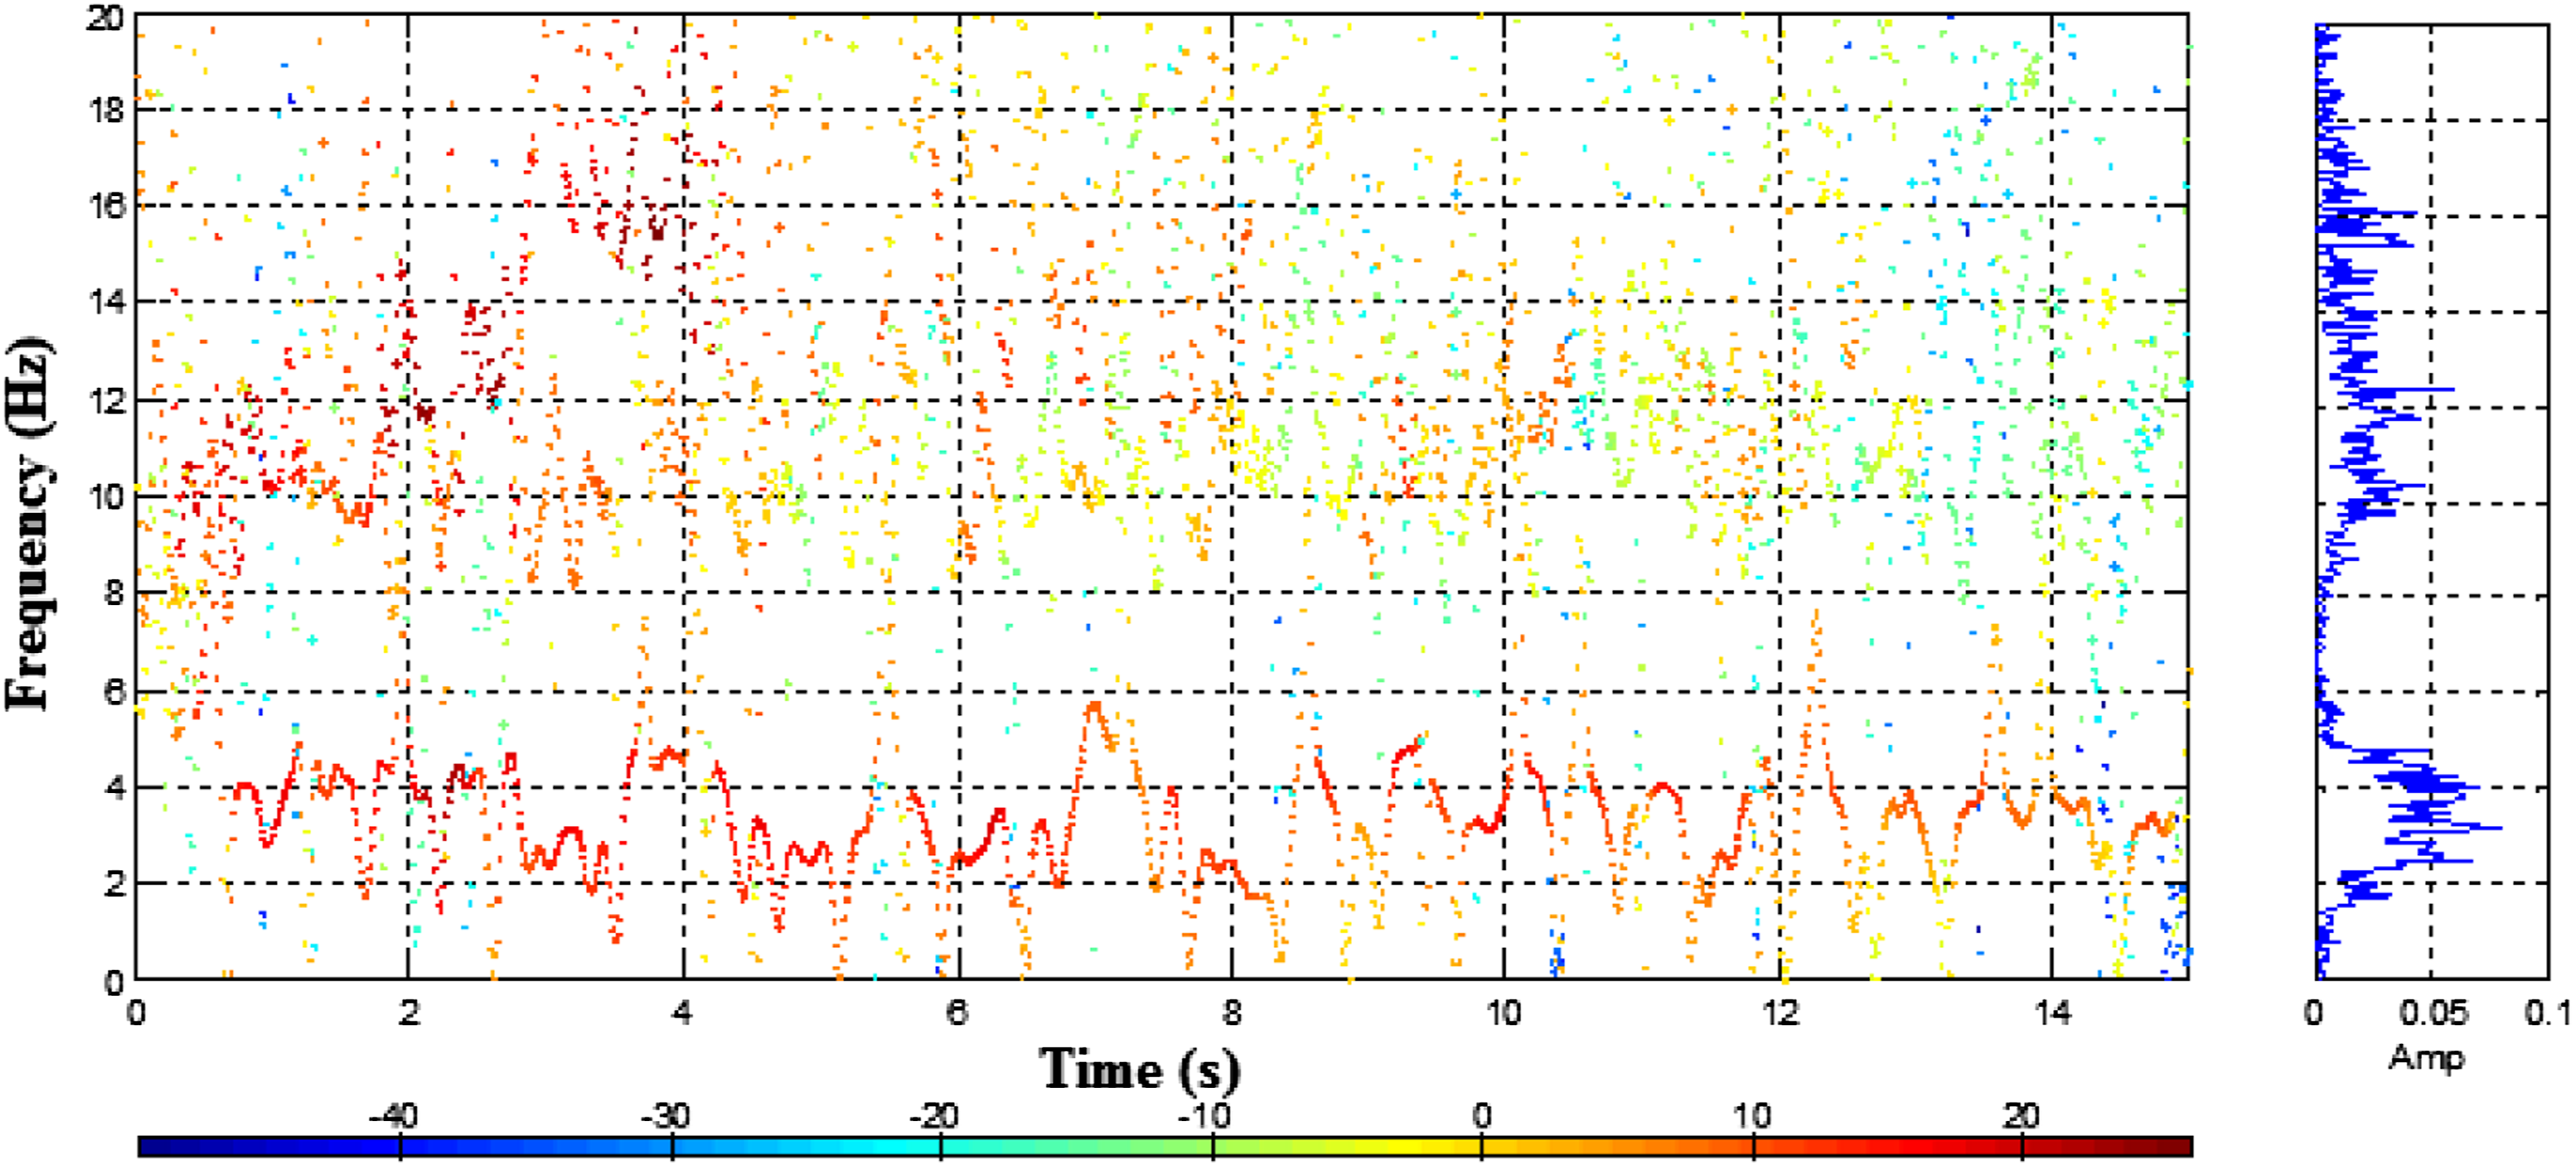
Uncertainty analysis
The vehicle–bridge interactions involved in stochastic factors due to uncertain tire–road interactions have been characterized by using Gauss process in many modeling and theoretical analyses. The forced vibrations of bridge under moving vehicle may exhibit complicated nonlinear and non-stationary properties. To further quantify the uncertainty of the response, we conduct the bispectrum analysis as follows.
It is well known that FFT is only suitable for Gaussian processes, while higher order spectra are suitable for analyzing non-Gaussian processes, and the vibration signal may not always be stationary and sometimes a lower level of signal-to-noise ratio exists. High order spectra have been proved to analyze the non-stationary, non-linear signals. This signal process method is not sensitive to Gauss signal, so that the noise existed in bridge vibration signal can be restrained.
Among the higher order genealogical families, the third-order or bispectral is most commonly used.20–23 It has been understood that the bispectrum is sensitive to detect the non-Gaussian signals. The bispectrum is identically zero if a signal is symmetrically distributed, and the bispectrum is non-zero for a non-Gaussian signal. On the other hand, for a Gaussian input, the output of the non-linear system will be non-Gaussian, so that bispectrum can also be used to detect the non-linearity of the system.
Generally, high-order spectra can be defined as follows. Let {x(n)} be a real, discrete, zero-mean stationary process with high-order cumulant c
kx
(τ1, τ2, ⋯, τk-1) defined as follows:

The high-order spectrum is defined as Fourier transform of cumulant:

The bispectrum can be defined as follows, let {x(n)} be a real, discrete, zero-mean stationary process with third-order cumulant c
xx
(τ1, τ2) defined as follows:

Then its Fourier transform is bispectrum


Then

In which “*” is conjugate. The high-order spectra provide the coupling between the frequencies at
Figure 6 shows the response signal, cumulant, the amplitude, and phase of bridge vibrations. Figure 7 shows the contour of bispectrum. Besides specific frequency and harmonics, the high-order spectra show how different harmonics non-linearly interact with one another indicated by the parallel lines of the diagonal of the high-order spectra. Response signal, cumulant, and high-order spectra of bridge vibrations. Contour of bispectrum.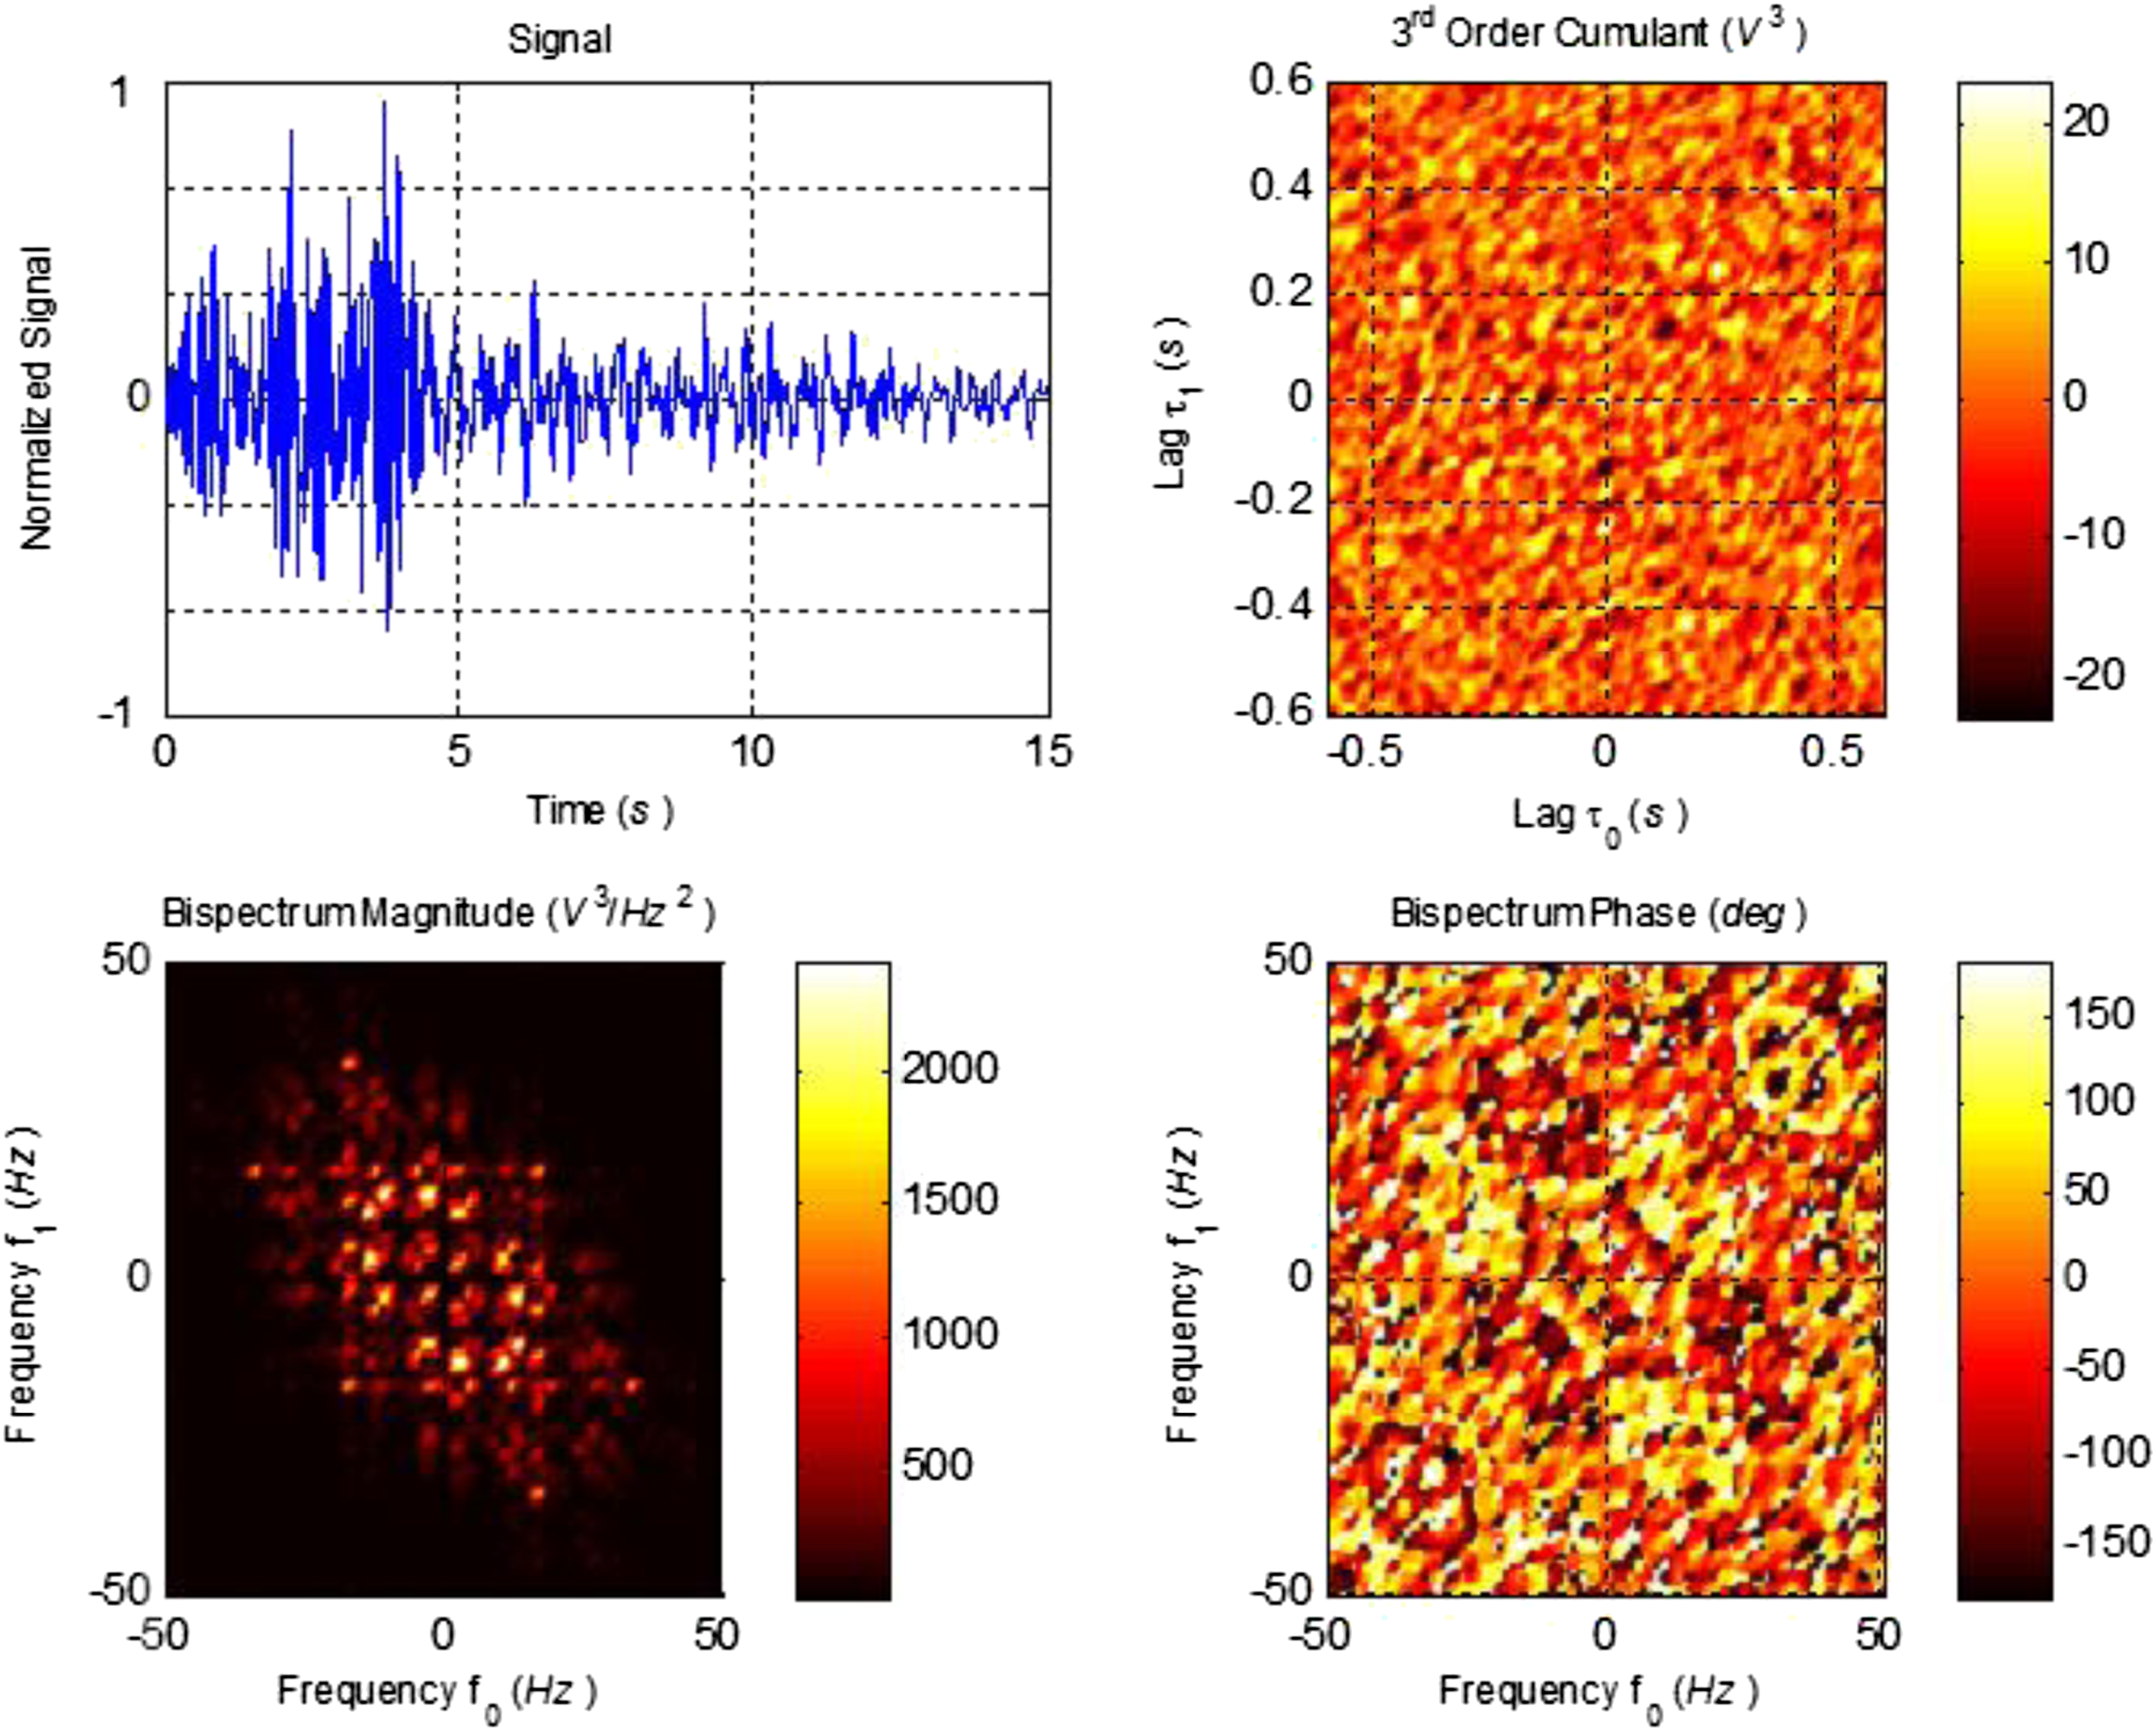
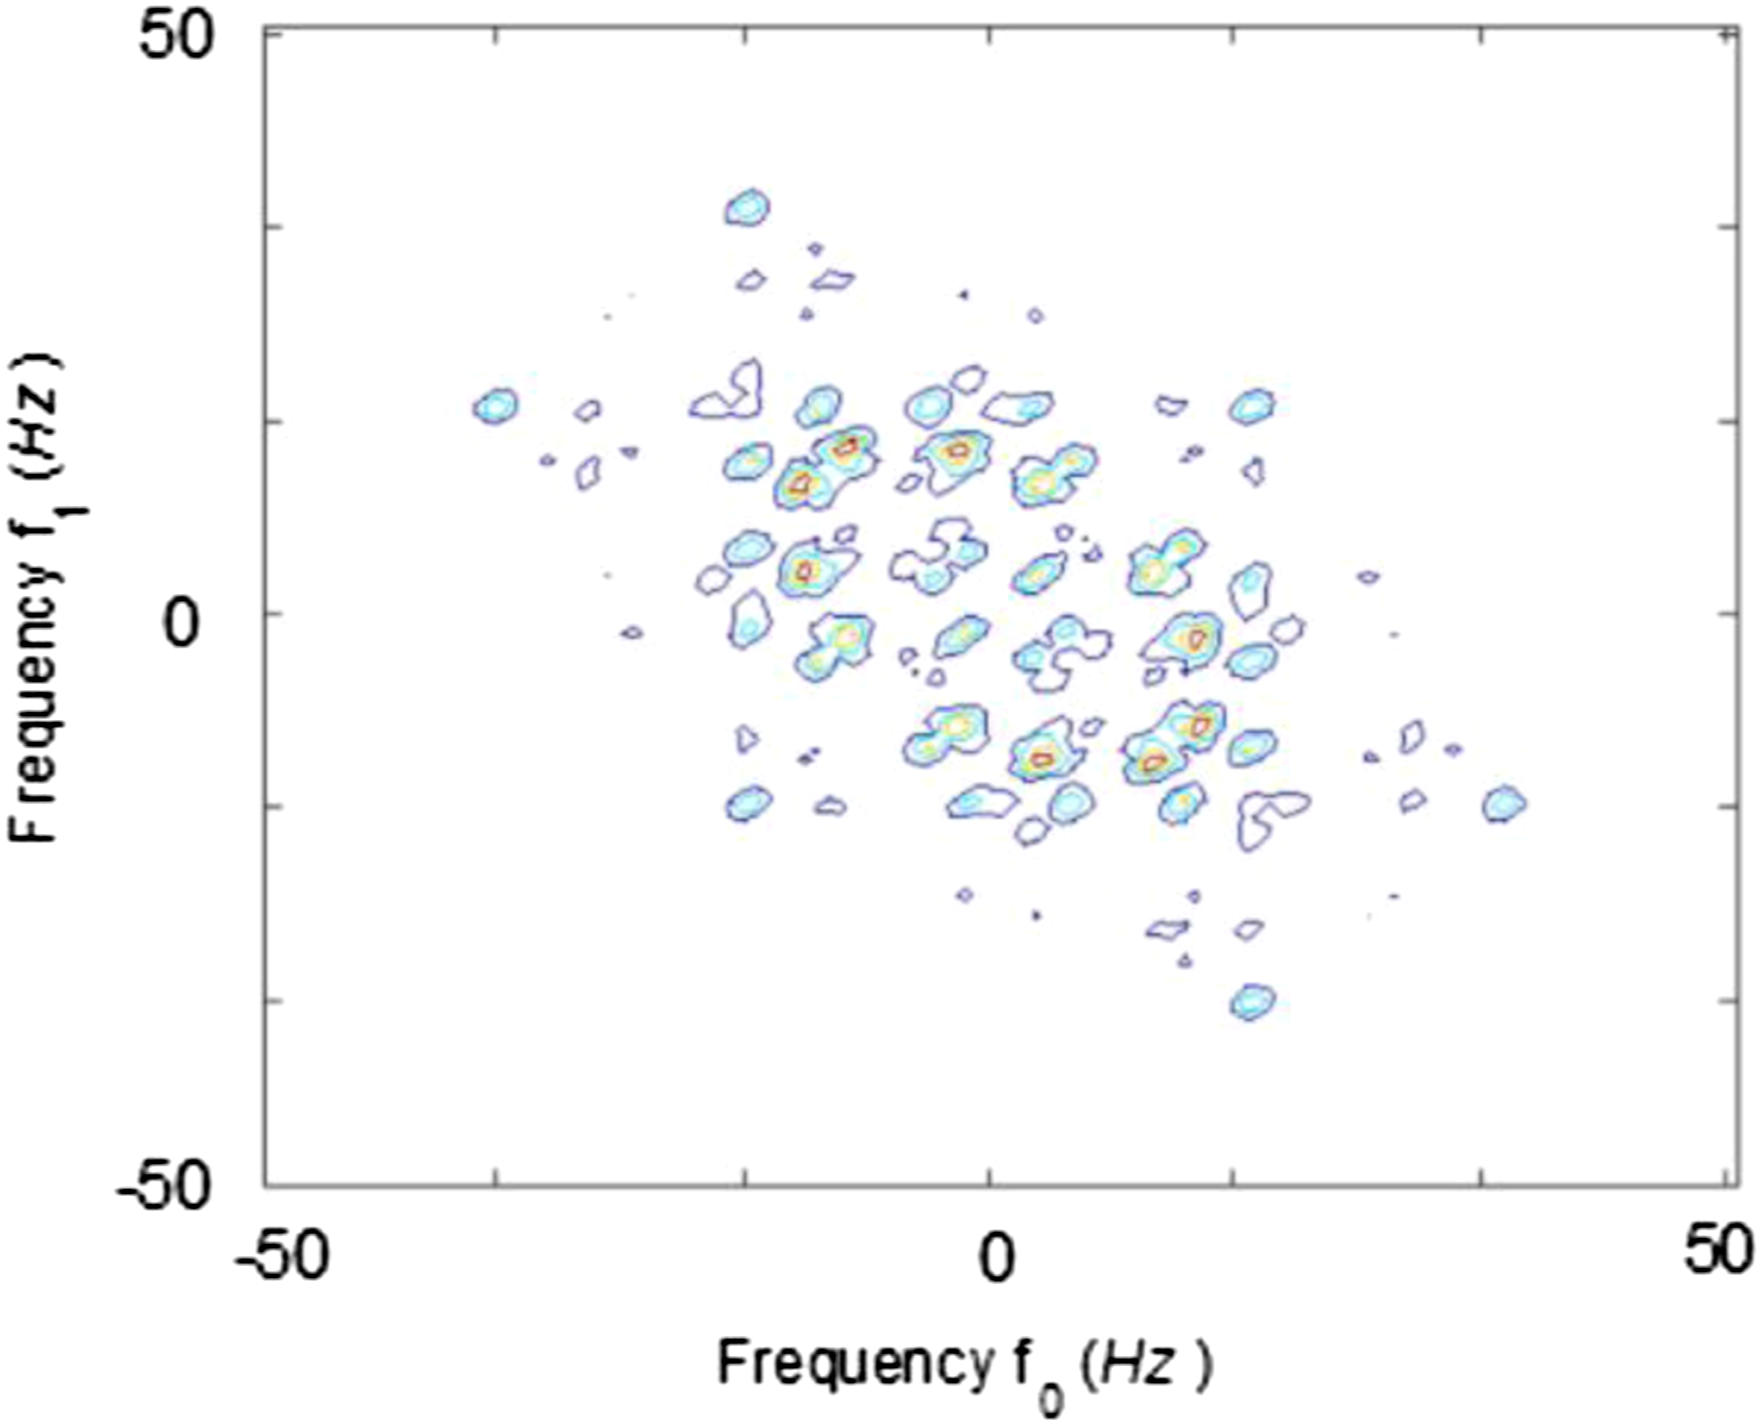
The parallel lines of the higher order spectral diagonal indicate the transfer of energy from one frequency to another, a unique non-linear phenomenon that cannot be obtained by traditional methods. This feature can be used to identify regions of transition from linear to weakly non-linear dynamics and to detect transitions and interactions with non-stationary, non-linear features that occur in vibration.
Second, both the amplitude and phase information can be extracted. The conventional FFT does not provide phase information, but the high-order spectra offer phase and phase coupling information caused by non-linearity, which can be further used to correlate with simulation.
Non-stationary property analysis
To further quantify the non-stationary properties, the recurrence plot analysis17–19 is conducted. Recurrence plots were originally designed to graphically show recurring patterns and non-stationary patterns in time series. Recurring patterns are important characteristics of non-linear non-stationary systems, while non-stationary may occur from several reasons such as road surface roughness parameter, time-varying nature of moving vehicle loads, sudden changes in contact/non-contact tire–road status, and uncertainty of vehicle dynamical systems.
The recurrence plot is based on analysis of the trajectories under an appropriate reconstruction of the dynamics using time delay embedding. It is a 2D square matrix of black and white dots. Each black dot at the coordinates (i, j) stands for a recurrence of the system’s state


The recursive graph of bridge vibration shown in Figure 8, which consists of diagonal lines, shows that there is periodic motion of the bridge. The distances between the diagonals represent characteristic periods, which appear as short finite diagonal structures, and the lengths of these diagonals may be related to positive Lyapunov exponents. The recursion graph is divided into several distinct parts by vertical lines, and the local recursion points of various parts are different. The lengths of lines in Figure 8 are different, the distance between the lines in the horizontal and vertical directions can be regarded as the characteristic period, and the stripes in different directions are associated with some phase shifts in the motion. The system vibration exhibits strong intermittence and discontinuity, which indicates that the bridge vibration is quasi-stationary, and the underlying dynamic invariants are the distribution of repetition rate and diagonal length. Figure 8 shows that the system exhibits periodic regularity and irregularity due to the presence of smooth parallel and non-parallel diagonal structures. Furthermore, there are discontinuities or irregularities in some of the diagonal bands, which indicate strong non-linearity and slight disorder in the system dynamics. The application of recursive graphs reveals non-stationary and chaotic features. Recurrence plots.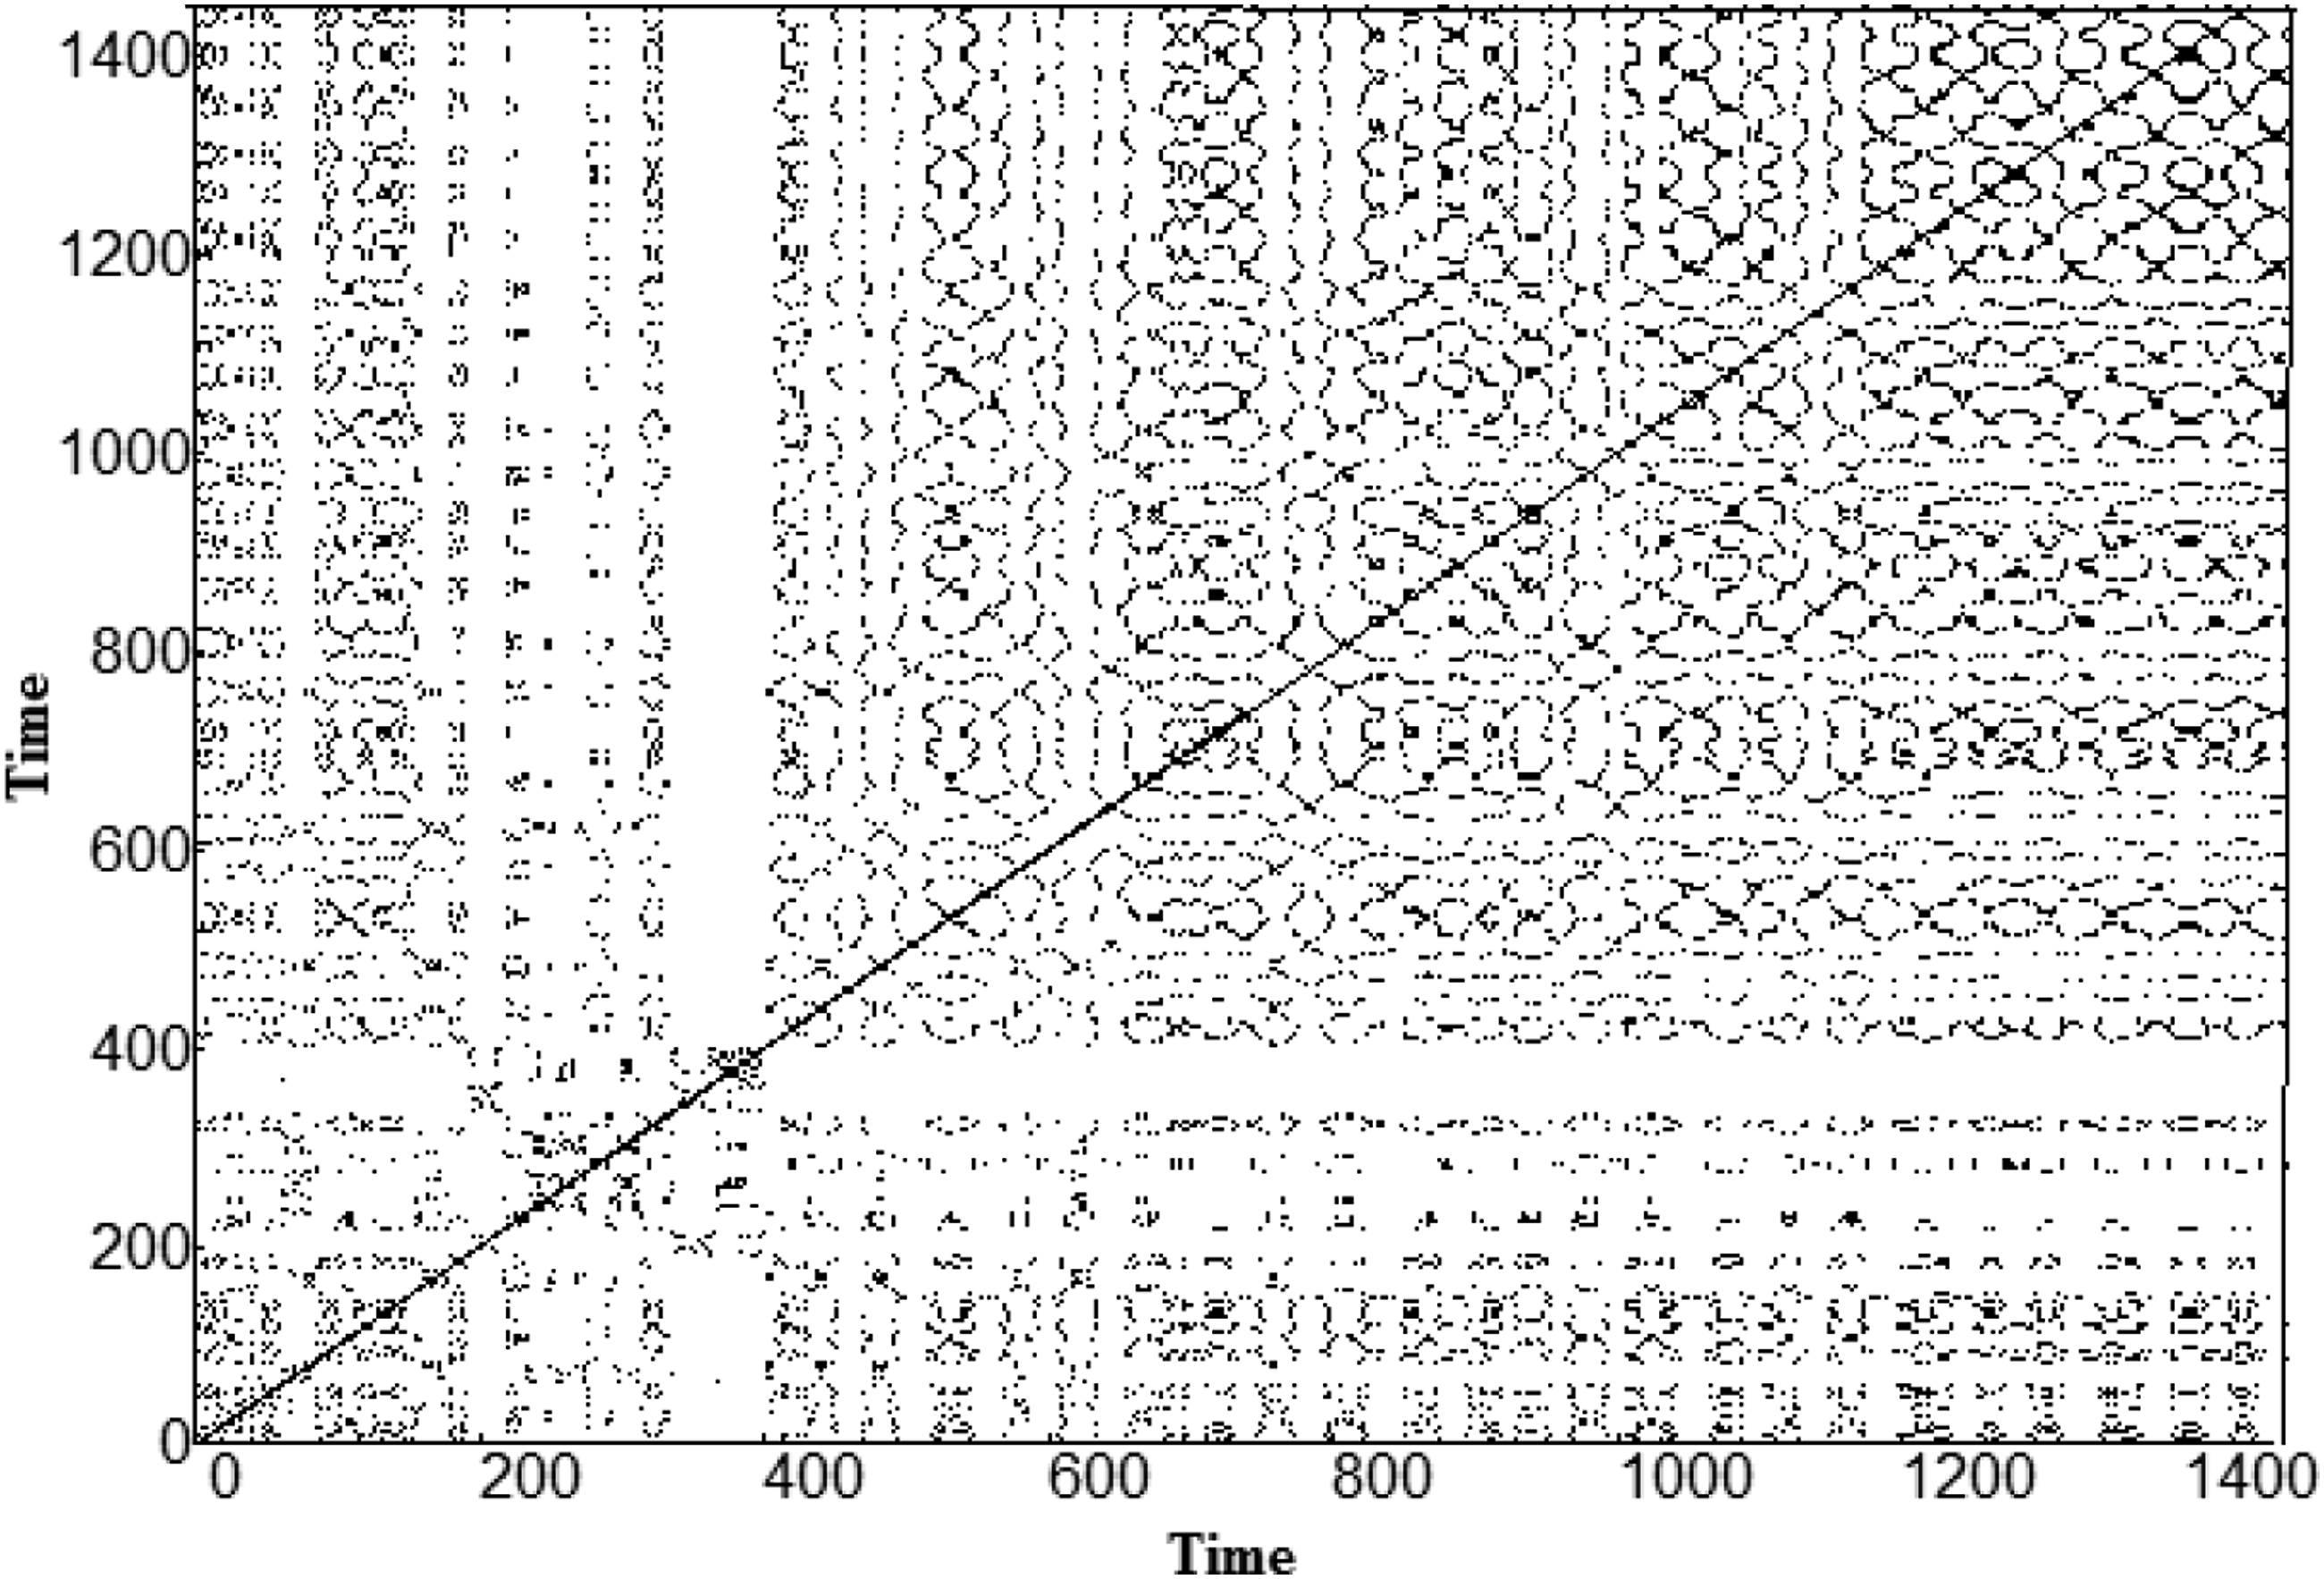
Non-linearity characterization
For structural dynamic systems, structural damage can cause non-linear characteristics. Recent studies have used non-linear methods to detect damage.24–30 Non-linear features such as the Lyapunov exponent are identical to the natural modes (natural frequencies, mode shapes, and damping) of a linear system, quantifying the system dynamics and substantive parameters. Aged highway structures exhibit complex non-linear dynamic behavior, which is caused by cracks, non-linear support conditions, broken joints, etc. Modal parameters associated with linear dynamics are insensitive to these local damages. Jin and Livingston explored the feasibility of using the spatial distribution of Lyapunov exponents for damage detection in non-linear bridge structures,24–25 considering the chaotic nature of the non-linear response of highway bridges caused by traffic loads. For example, they analyzed the clutter of bridge response data observed at various locations. The Lyapunov exponents are invariants of non-linear dynamical systems, so their different values are associated with different time histories obtained from the same structure. Jin and Livingston used the Lyapunov index as reference data for damage detection by identifying the Lyapunov index of cable-stayed bridges affected by traffic and wind.24–25 In their study, higher order modes exhibited positive exponents, while the sum of all exponents remained negative—a distinct feature of chaotic motion.
Cracks cause non-linear changes in stiffness. According to non-linear vibration theory, the response of a structure with stiffness non-linearity due to harmonic forcing can be chaotic. Changes in structural system invariants could be related to geometric or physical changes in the material. The Lyapunov exponent acts as a system invariant, like the role of modal characteristics in linear structural systems.
To further quantify the non-linear features, we evaluate the Lyapunov exponent and the associated dimension. In this study, the Lyapunov exponent is positive, and the system exhibits non-linear vibration. It is noted that the positive Lyapunov exponent is correlated with the narrowband of FFT of response in Figure 4(b). It is noted that the natural modes of the bridge (Figure 3(b)) in the range 1–3 Hz exhibit separate peaks, whereas under vehicle excitation the modes exhibit merge or narrowband. Both mode transition (from mode spikes to narrowband) and positive Lyapunov exponent are the indicators of nonlinearity and possible chaos of the system. 31
Fractal dimension is a measure of the singularity of attractors. The fractal number of the correlation dimension represents the non-linear characteristics of the response, there are different ways to represent the dimension of the fractal set, and the correlation dimension is an effective way to determine the dimension of the test data. In Figure 9, we plot the estimates of the relevant dimensions. Correlation dimension.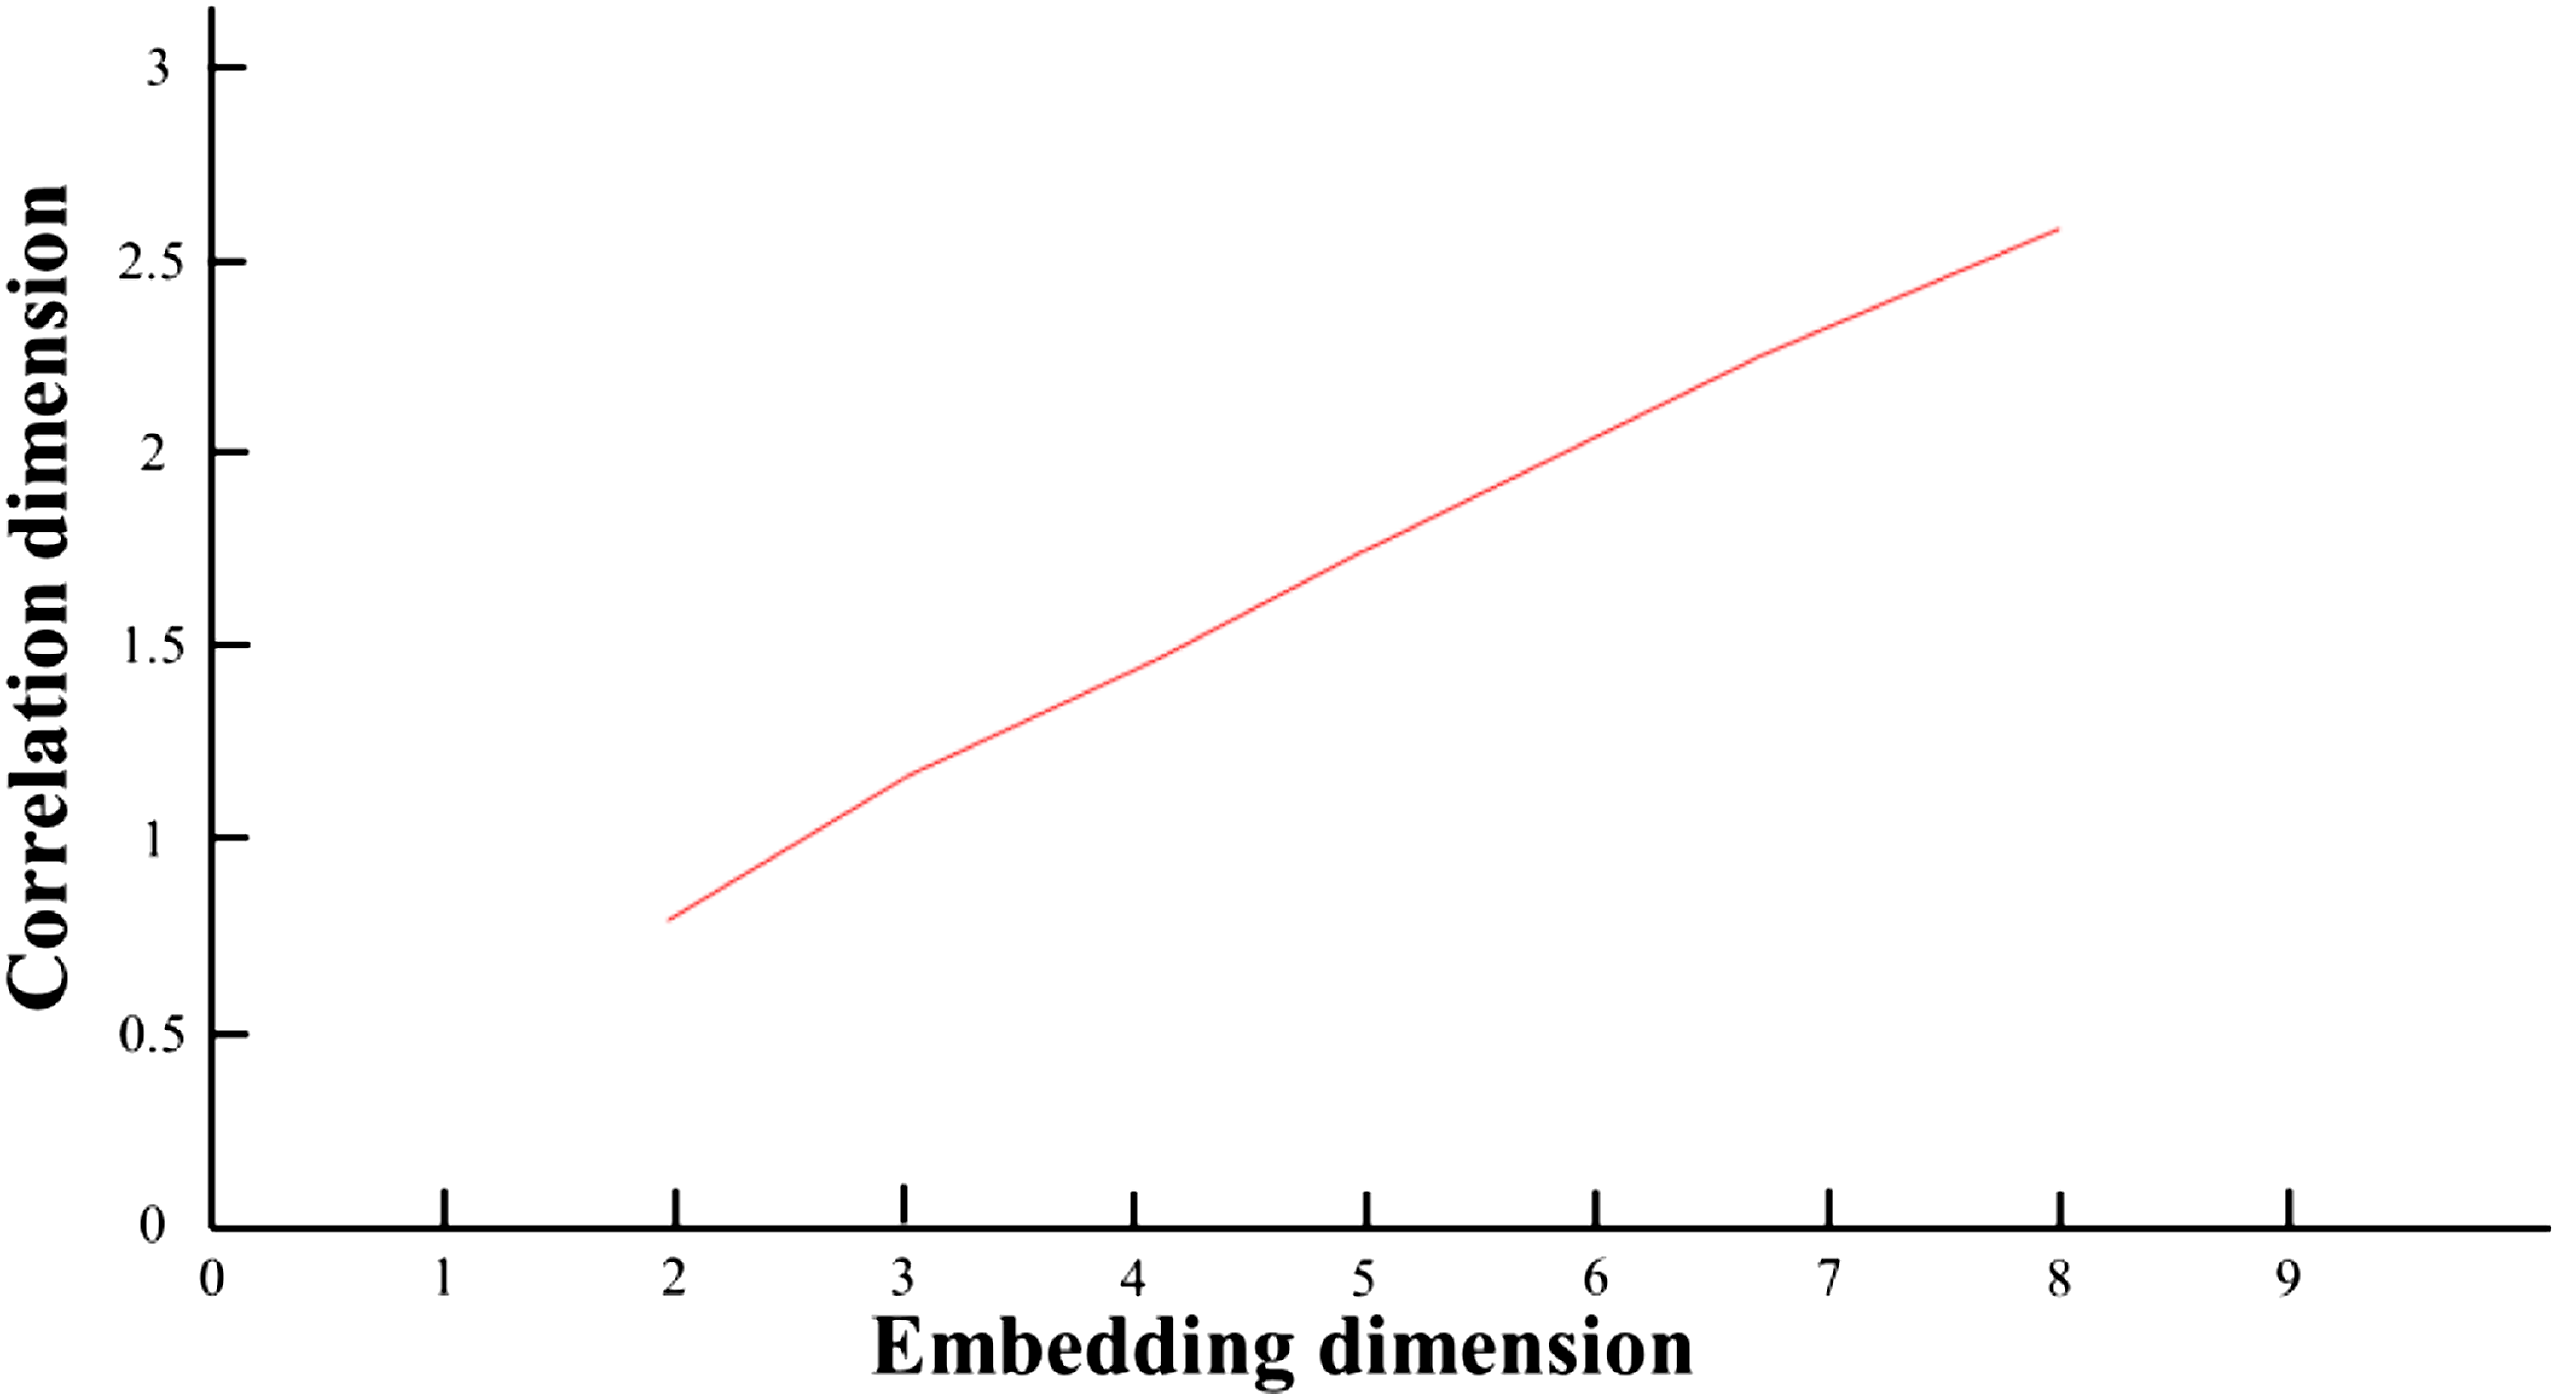
Discussion
Modal analysis is a very mature technology and is widely used in structural design, which can reflect the natural frequency of vibration and the corresponding vibration mode. However, modal analysis or FFT-based approach is also limited in that it is only valid for linear response performance analysis of a given structure. 32 Applying linear modal analysis to bridge health monitoring is very difficult due to the insensitivity of modal analysis to damage, which is subject to modeling non-stationary, non-linearities, and uncertainties associated with large vehicle-induced vibrations. EMD-based HHT method can be used to efficiently process non-stationary and non-linear signal, but it has the shortcomings, such as lack of theoretical basis, modal aliasing effect, lack of noise resistance, and insensitivity to the speed of the moving load.33,34 As such, more characterizations based on various signal processing approaches have been used to overcome the limitations of HHT.35,36
Complete experimental data and the effects of changes in operating conditions are also the factors. These uncertainties are related to specific construction, bridge aging, bridge structural modeling, etc.
The non-linear dynamics and vibrations of structures are quite complex. Nonetheless, dynamics may cause certain parameters (such as crack damage or joint disconnection) to affect non-linear behavior in a repeatable and predictable manner. Parameter changes usually lead to smooth changes in system behavior, and constantly changing parameters leads to singularities in the system’s dynamic behavior. One of the important aspects of detecting structural damage is increasing the sensitivity of monitored features to damage. There is a one-to-one correspondence between the characteristic invariants of non-linear chaotic systems and the natural frequencies in regular modal analysis of linear systems. Unlike previous techniques for obtaining information about the monitored structure, such as measuring the frequency response function, the non-linear dynamics method shows that only certain locations of the bridge exhibit chaotic behavior.
We also investigated the spatial distribution of the Lyapunov exponent, consistent with observations by others in previous studies.24–26 It is well known that under certain excitation conditions, the strong vibration of many non-linear systems with positive Lyapunov exponent can be regarded as a chaotic state. A chaotic state is defined as a state with sensitive dependencies on initial conditions. It is noted that the system vibration exhibits narrowband in the proximity of several lower natural modes (1–3 Hz), which is consistent with the possible chaotic characteristics specified by positive Lyapunov exponent. 31 These abnormal phenomena may be attributed to varied defects in this bridge built in 1970. In principle, if all design data are available for reference, damage can be identified by observing model modifications. The absolute value of the difference of Lyapunov exponents between new/designed bridge and used bridge can be used as the damage index, which is related to the damage situation. When pre-damage data is available, it is only a matter of detecting changes in vibration behavior (linear or non-linear). If no data are available, assumptions are made about the nature of the damage and its relationship to structural behavior. Damage is usually non-linear, that is, it is assessed using non-linear dynamic methods. Non-linear methods have advantages for damage detection. Post-damage comparisons may not require pre-damage vibration data. Damage to many important structures does not affect the overall vibration pattern, and damage may also occur locally. In both cases, non-linear methods should be used for detection, and detection using linear methods has a low success rate because the magnitude of damage is small and rarely accounts for the problem in linear systems. A non-linear approach to diagnosing structural health provides a method that does not rely on previously stored baseline data and is a reference-free technique.
Many factors affect the non-linear characteristics of bridges, including material inelastic properties, geometric or second-order effects, non-linear soil-foundation-structure interactions, gap opening and closing at hinge and abutment locations, concrete creep, and time-dependent effects of shrinkage, weather interactions, and temperature changes; the correlation of these factors requires further investigation. Vibration-based methods are non-destructive monitoring methods and thus can be used to detect inaccessible faults in structures. The non-linear vibration-based method is very sensitive to local damage and can form a comprehensive non-destructive monitoring method, formulate a non-linear dynamic structural health monitoring strategy, and improve its ability to locate damage.
The research results show that under the action of vehicle loads, the response of certain positions of the bridge exhibits non-linear chaotic dynamic characteristics. Compared with the existing methods using the largest Lyapunov exponent, the method proposed in this paper can be estimated more accurately and more reliably. By examining multiple parameters, the inherent estimation error in database methods with a single characteristic parameter can be greatly reduced.
Conclusions
We studied stochastic non-stationary dynamics of the Chuitna River Bridge in Alaska by using the acceleration response of the bridge under moving loads. Using spectral analysis of the free decay response, we identified the linear mode of the bridge and applied the linear modal properties as a benchmark to characterize complicated stochastic non-stationary vibrations. The nonlinear invariants derived from bridge response are used to characterize non-linear dynamic properties of the bridge. Through this study, it can be found that the Fourier spectrum of a certain point of the bridge during the interaction between the vehicle and the bridge presents complex narrowband dynamic characteristics, which may be related to the non-linear characteristics or even chaos of bridge vibration. Furthermore, the obtained chaotic dynamic invariants, such as the Lyapunov exponent and the correlation dimension, also suggest that the response exhibits chaotic non-linearity. The study provides a reference for further detecting the structural damage of bridges. The amplitude of the free vibration of the bridge (after vehicle left the bridge) is small and may be insensitive to possible structural damage. The strong and complicated vibrations of bridge excited by moving loads could be damage-sensitive and could be used to extract features for structural damage detection. It is noted that a response of a new bridge without defects under designed load should exhibit linear dynamic properties as quantified by linear mode analysis, whereas a damaged bridge response may exhibit non-linearity due to damage/defect effects. The linear and non-linear dynamic parameters of the bridge can serve as a benchmark for further research.
The potential of higher order spectrum to identify specific patterns is validated by actual bridge response data. It is found that higher order spectral analysis can be a very useful tool for the detection of non-stationary characteristics of bridge vibrations. Through high-order spectral analysis, we identified specific modes of bridge vibration.
In the process of bridge assessment and monitoring, it is very difficult to extract accurate assessment information from complex responses and unknown excitation by using mode analysis or specific single-parameter index. In different practical applications aiming to have reliable and comprehensive evaluation, using multiple parameters for assessment has been the main trend research in recent years. The current work illustrated the method to use comprehensive multiparameter approaches to characterize the dynamic properties of bridge. This study advances techniques for quantifying non-linear, stochastic non-stationary vibrations of bridges under moving vehicle.
Footnotes
Declaration of conflicting interests
The author(s) declared no potential conflicts of interest with respect to the research, authorship, and/or publication of this article.
Funding
Alaska Department of Transportation and Public Facilities, University of Alaska Fairbanks, and Alaska Native Science and Engineering Program (510015).