
Abstract
In this paper, we investigate vehicle–bridge interactions and propose a new method for assessing bridge conditions based on nonlinear vibration analysis. A vehicle model is presented, and the dynamic load on the bridge is quantified based on bridge road roughness. The vibration of a river bridge under a moving vehicle is recorded and analyzed. The Fourier spectrum of the bridge response due to vehicle loading exhibits complicated cluster bands in addition to multiple peaks, some of which are correlated with the bridge natural modes characterized by finite element method analysis and free decay testing, and some of which are correlated with the vehicle dynamic load spectrum. To characterize the unidentified narrow band in the bridge response spectrum, the Lyapunov exponent of the response is estimated, which is found to be a positive value indicating the nonlinear properties of the bridge’s large response under vehicle loading. This finding correlates with the bridge inspection, which shows that some supporting roller bearings do not properly contact the superstructure of the bridge. To elaborate this phenomenon, a model of beam with nonideal supporting condition is analyzed, and a narrow band spectrum is characterized using He’s variational-iteration method. This research offers insight to using the vehicle–bridge interaction to monitor the health status of a bridge by using nonlinear properties, as well as linear properties.
Introduction
For bridge health monitoring, there has been a wide interest in using a vibration-based approach to predict bridge response under moving vehicle loads. 1 , 2 Due to the vehicle forced vibration and nonlinearity of bridge large deformation, a notably large discrepancy can exist between the calculated bridge response and the measured response of the bridge under moving vehicle loads. There is much research on the dynamic response of a passing vehicle, particularly vehicle forced vibration.3–8 Vehicle acts as an exciter as it moves over the bridge and a vibration simultaneously acts on the bridge. The frequencies of the bridge are extracted indirectly from the dynamic response of vehicle as it passes over the bridge. 4 Therefore, the bridge dynamic response of a passing vehicle may contain the fundamental vibration frequency of the bridge and the fundamental frequency of the test vehicle, which are related to the pavement roughness, mechanical parts of the vehicle, and driving speed. 5
Methods based on the principles of linear structural behavior are applied with linear vibration data. Features such as resonant frequencies, damping ratios, and mode shapes are identified. However, the linear dynamic parameters are insensitive to damage. This characteristic is an intrinsic feature of structural diagnostics based on the linear treatment of the dynamic data. Damage, such as the opening and closing of a crack, on a structure member inherently gives rise to nonlinear structure parameters and corresponds to a different vibration characteristic. The results of recent limited efforts using a nonlinear approach for structural damage detection are highly promising.9–13 The nonlinear method uses damage-induced changes in the invariant features of the nonlinear dynamic system. Therefore, this approach may be used to determine the occurrence, extent, and development of damage. Invariants of a nonlinear dynamic system, such as Lyapunov exponents, 9 ,14–16 are equivalent to the natural modes, such as natural frequency, modal shape and damping, of a linear system and can be used to quantify the dynamic properties and substantial parameters.
Nonlinear phenomena appear in most areas of scientific and engineering fields. Identifying and modeling nonlinear vibrations is becoming increasingly important in a range of engineering applications. 17 This is particularly true in the design of flexible structures, such as bridges, in which the nonlinear problems are characterized by nonlinear stiffness and may exhibit strong nonlinearity. A broad class of classic analytical solution methods has been used for these problems. However, certain of these analytical solution methods are difficult to use because of the tedious work required, and a portion of the methods can only be applied for weak nonlinear problems. He’s variational iteration method is well-established and has been used to solve varied nonlinear differential equations efficiently and effectively18–21 and is used in many engineering communities.22,23
This study characterized the acceleration response of a bridge under vehicle loading using a combination of a theoretical model of stochastically excited vehicle dynamics and data-driven nonlinear dynamics analysis. The Fourier spectrum of a free-decay response was used to identify the preliminary modal vibration properties in the context of linear dynamics. These values were compared with a finite element model. The frequency domain approach based on the Fourier transform has such drawbacks as leakage, which requires averaging large amounts of data or tests. In principle, this method is not applicable to a nonlinear system. In fact, the Fourier spectra of the bridge response under vehicle loading at certain locations exhibits complex dynamic characteristics of a cluster band, some of which correlate with the vehicle dynamic load analysis,24–31 while the rest are attributed to nonlinear features. The nonlinear invariant of Lyapunov exponents is used to extract nonlinear features, which were examined, and the vibrations are shown to exhibit nonlinear properties.
Test bridge for response under moving vehicle
The five-span Chulitna river bridge is located between Fairbanks and Anchorage in Alaska, USA. The length of the bridge is 790 feet (240.8 m), and the bridge deck width is 42 feet, 2 inches (12.8 m). There are two exterior steel plate girders and three longitudinal composite trusses. Figure 1 shows the picture of the Chulitna river bridge.
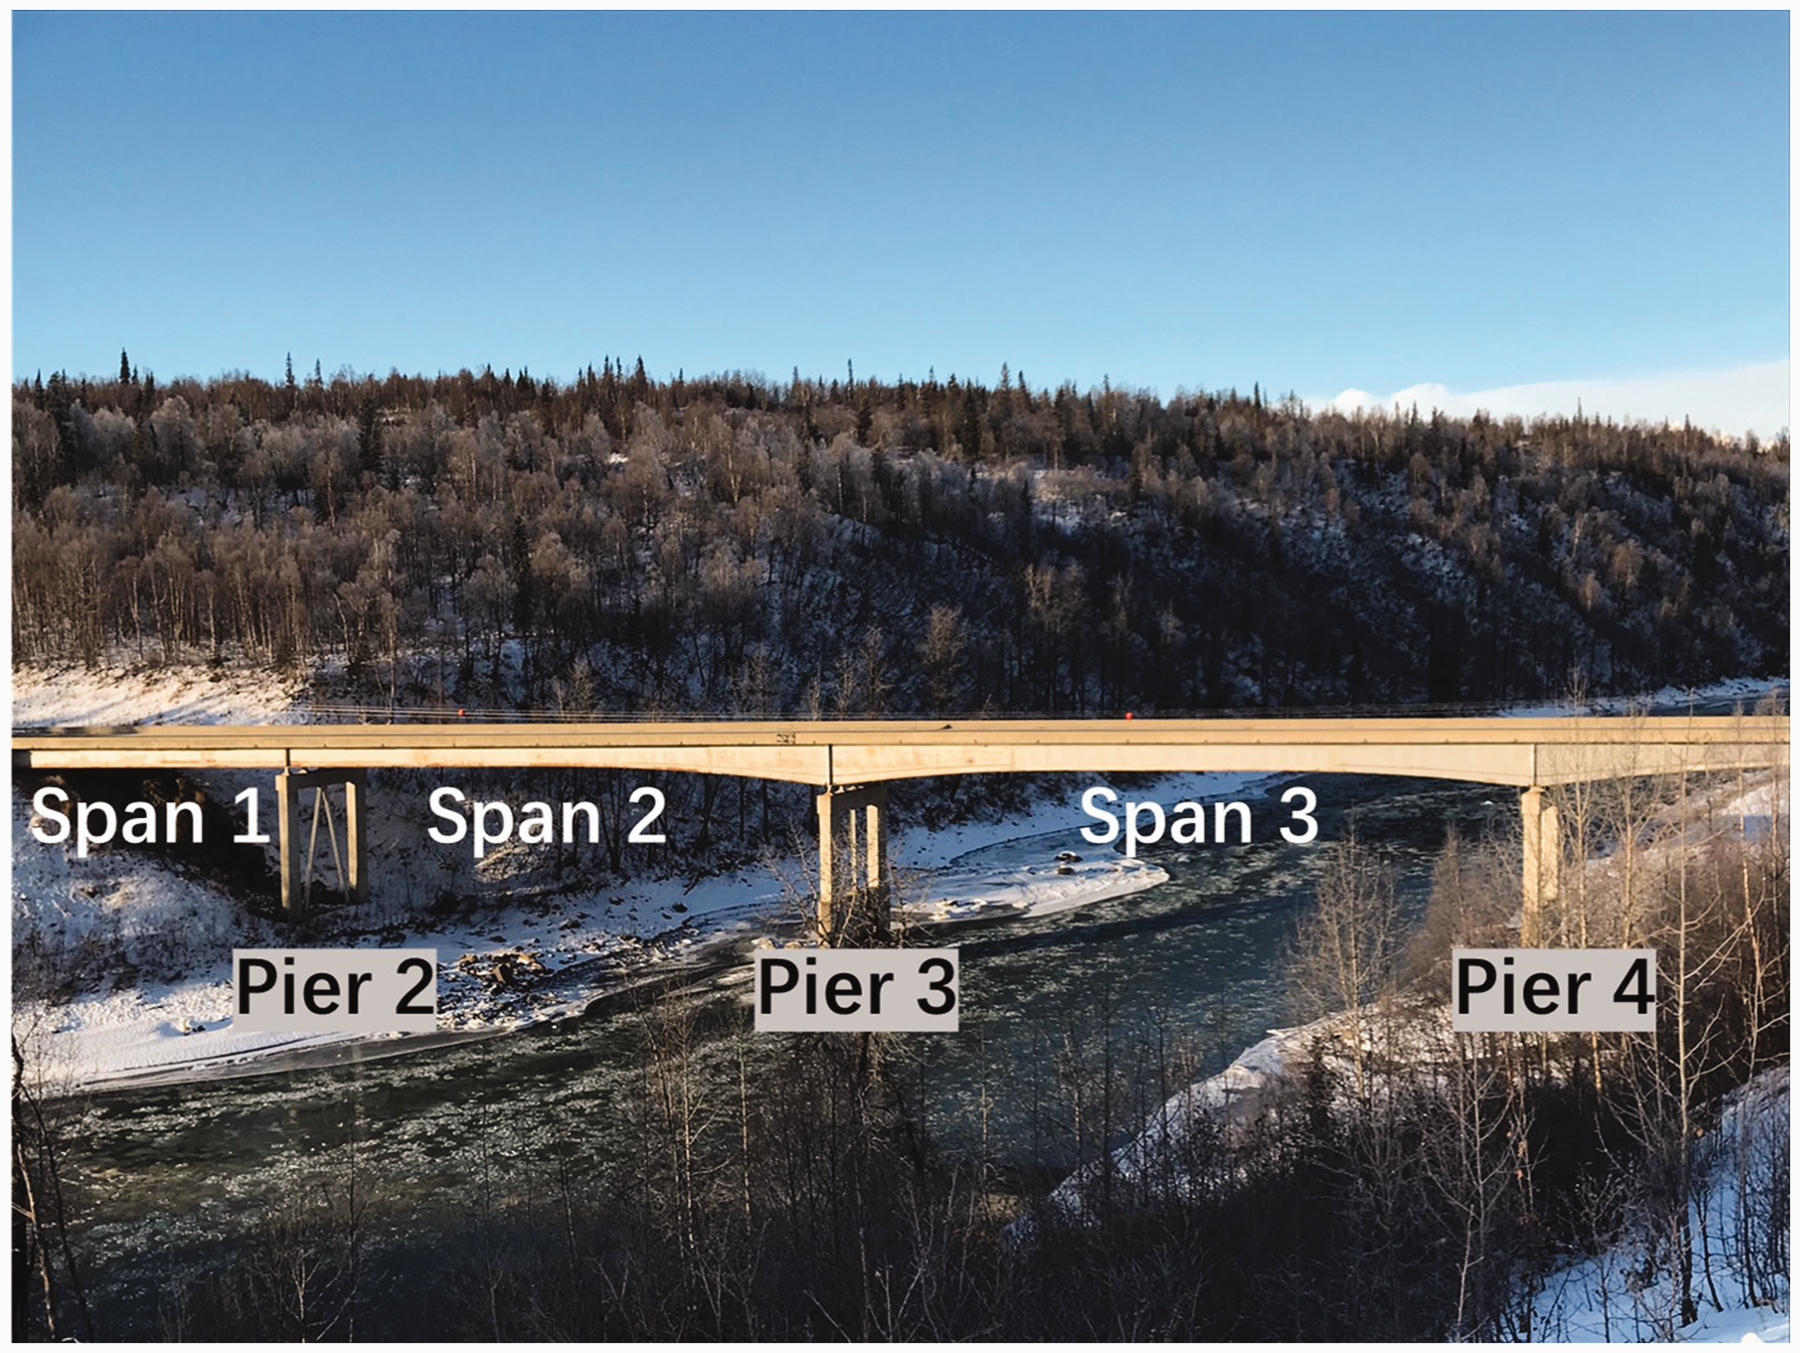
Chulitna river bridge.
In the investigation, EpiSensor ES-U2 uniaxial force balance accelerometers (Figure 2(a)) were placed on the surface of the concrete deck. Accelerometers were located on each pier and at mid-spans. All of the accelerometers were placed along a line in the center width of the deck and sit on a flat clean surface. The accelerometers were pointed to vertical direction. A test truck (Figure 2(b)) was used to excite the bridge. The bridge was closed to traffic and there was no wind during the dynamic test. The test truck crossed the bridge with a speed of 45 mph (72.4 km/h). The bridge was kept closed until the vibration was completed damped.
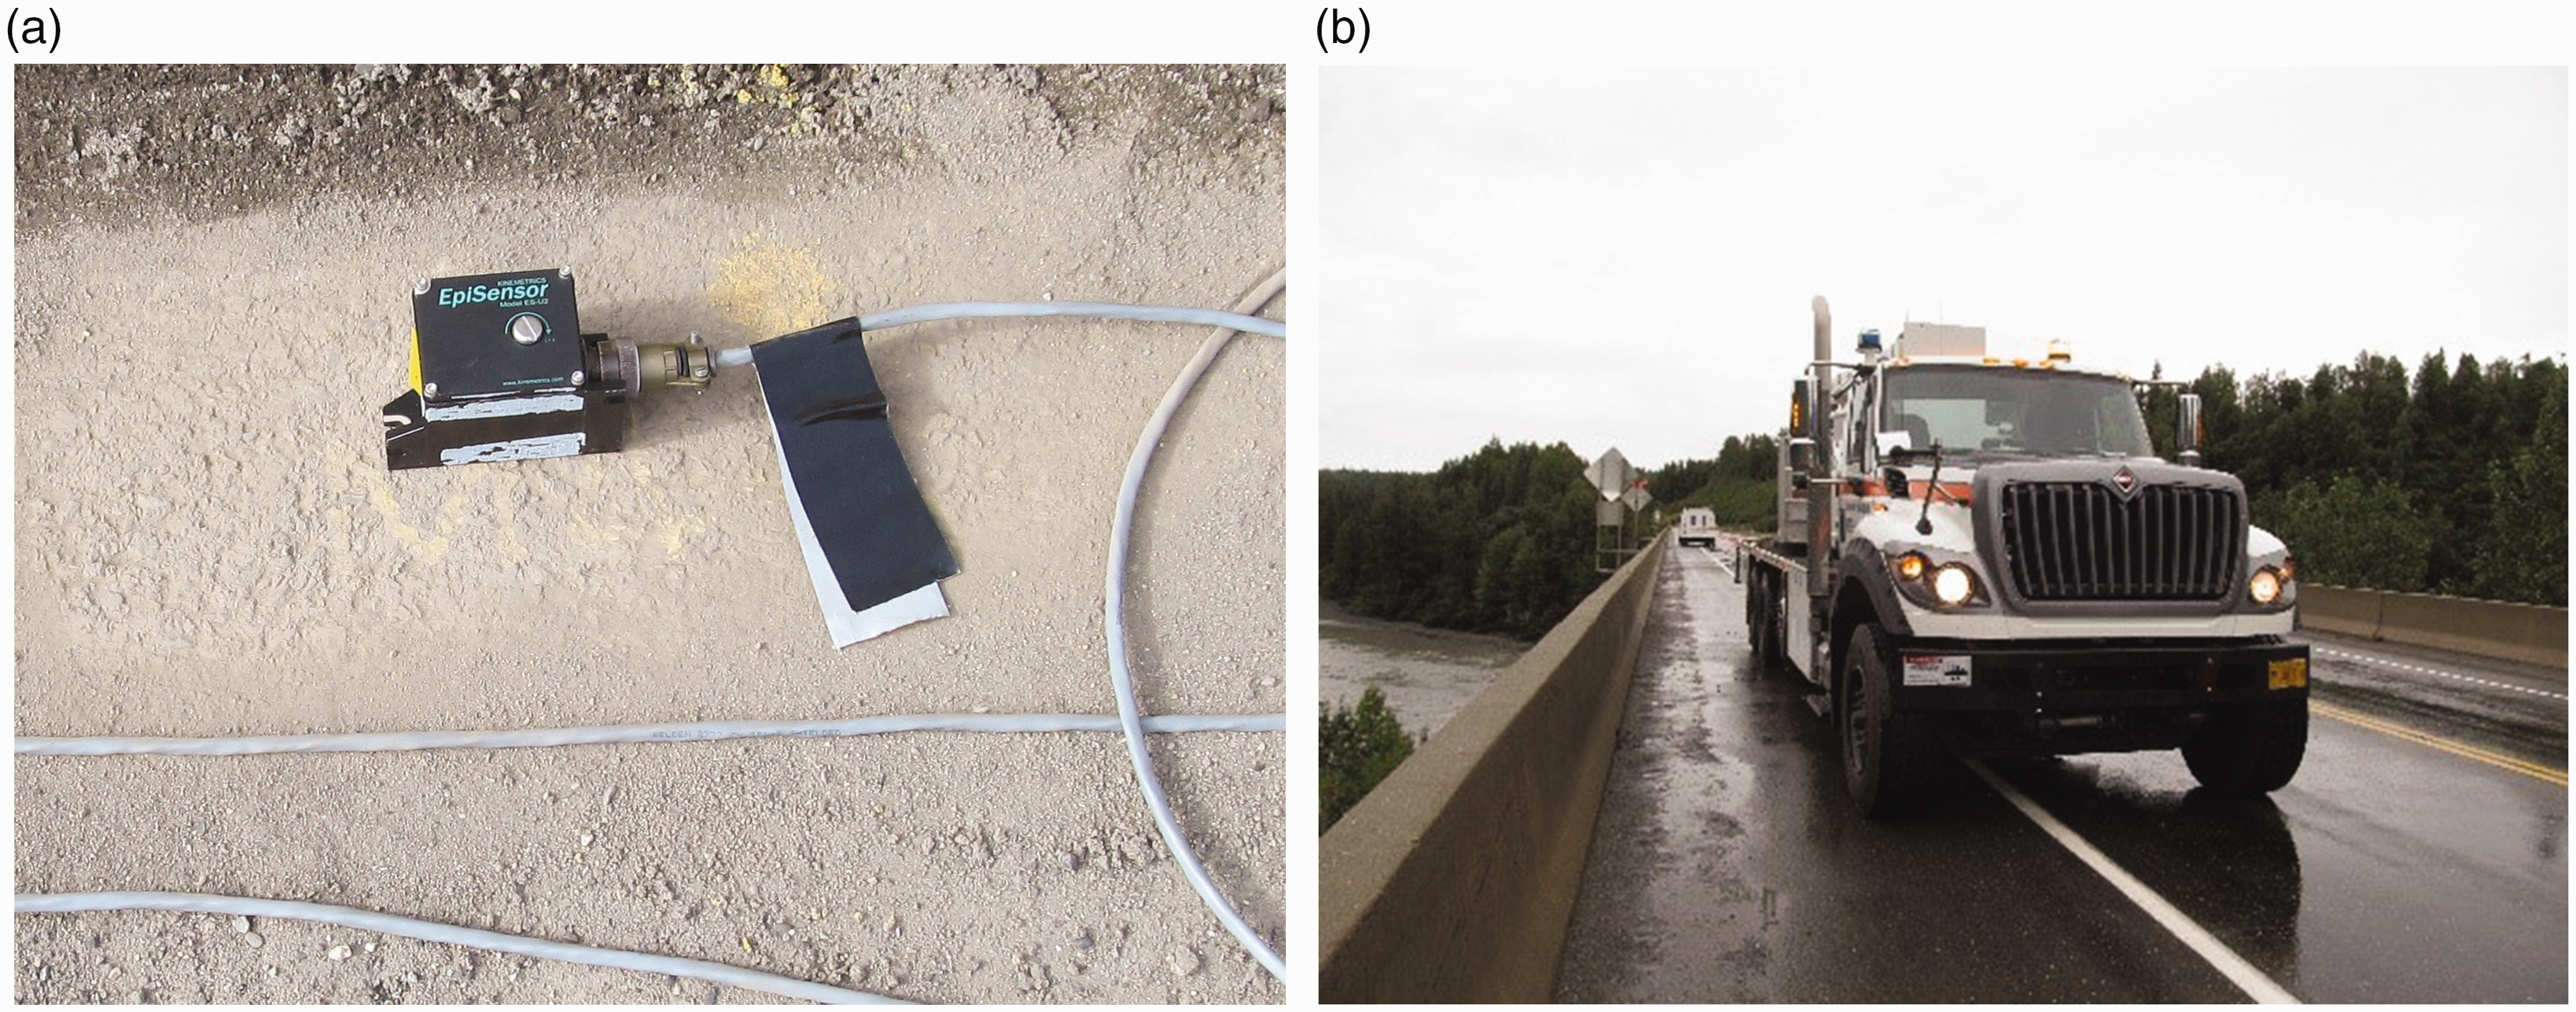
(a) Portable accelerometer and (b) test truck.
Spectrum analysis
As the vehicle passed over the bridge, the acceleration signal was recorded, and the data were processed using fast Fourier transform analysis. Acceleration data obtained from a representative point located on span 4 and close to pier 4 (i.e. 50 ft (15.2 m) from pier 4) was selected for processing and analysis. The truck crossed the bridge from northbound to southbound in the upstream lane at a speed of 45 mph (72.4 km/h). Figure 3(a) shows the time history of the measured acceleration for a representative point during the vehicle–bridge interactions. Figure 3(b) shows the Fourier spectrum.
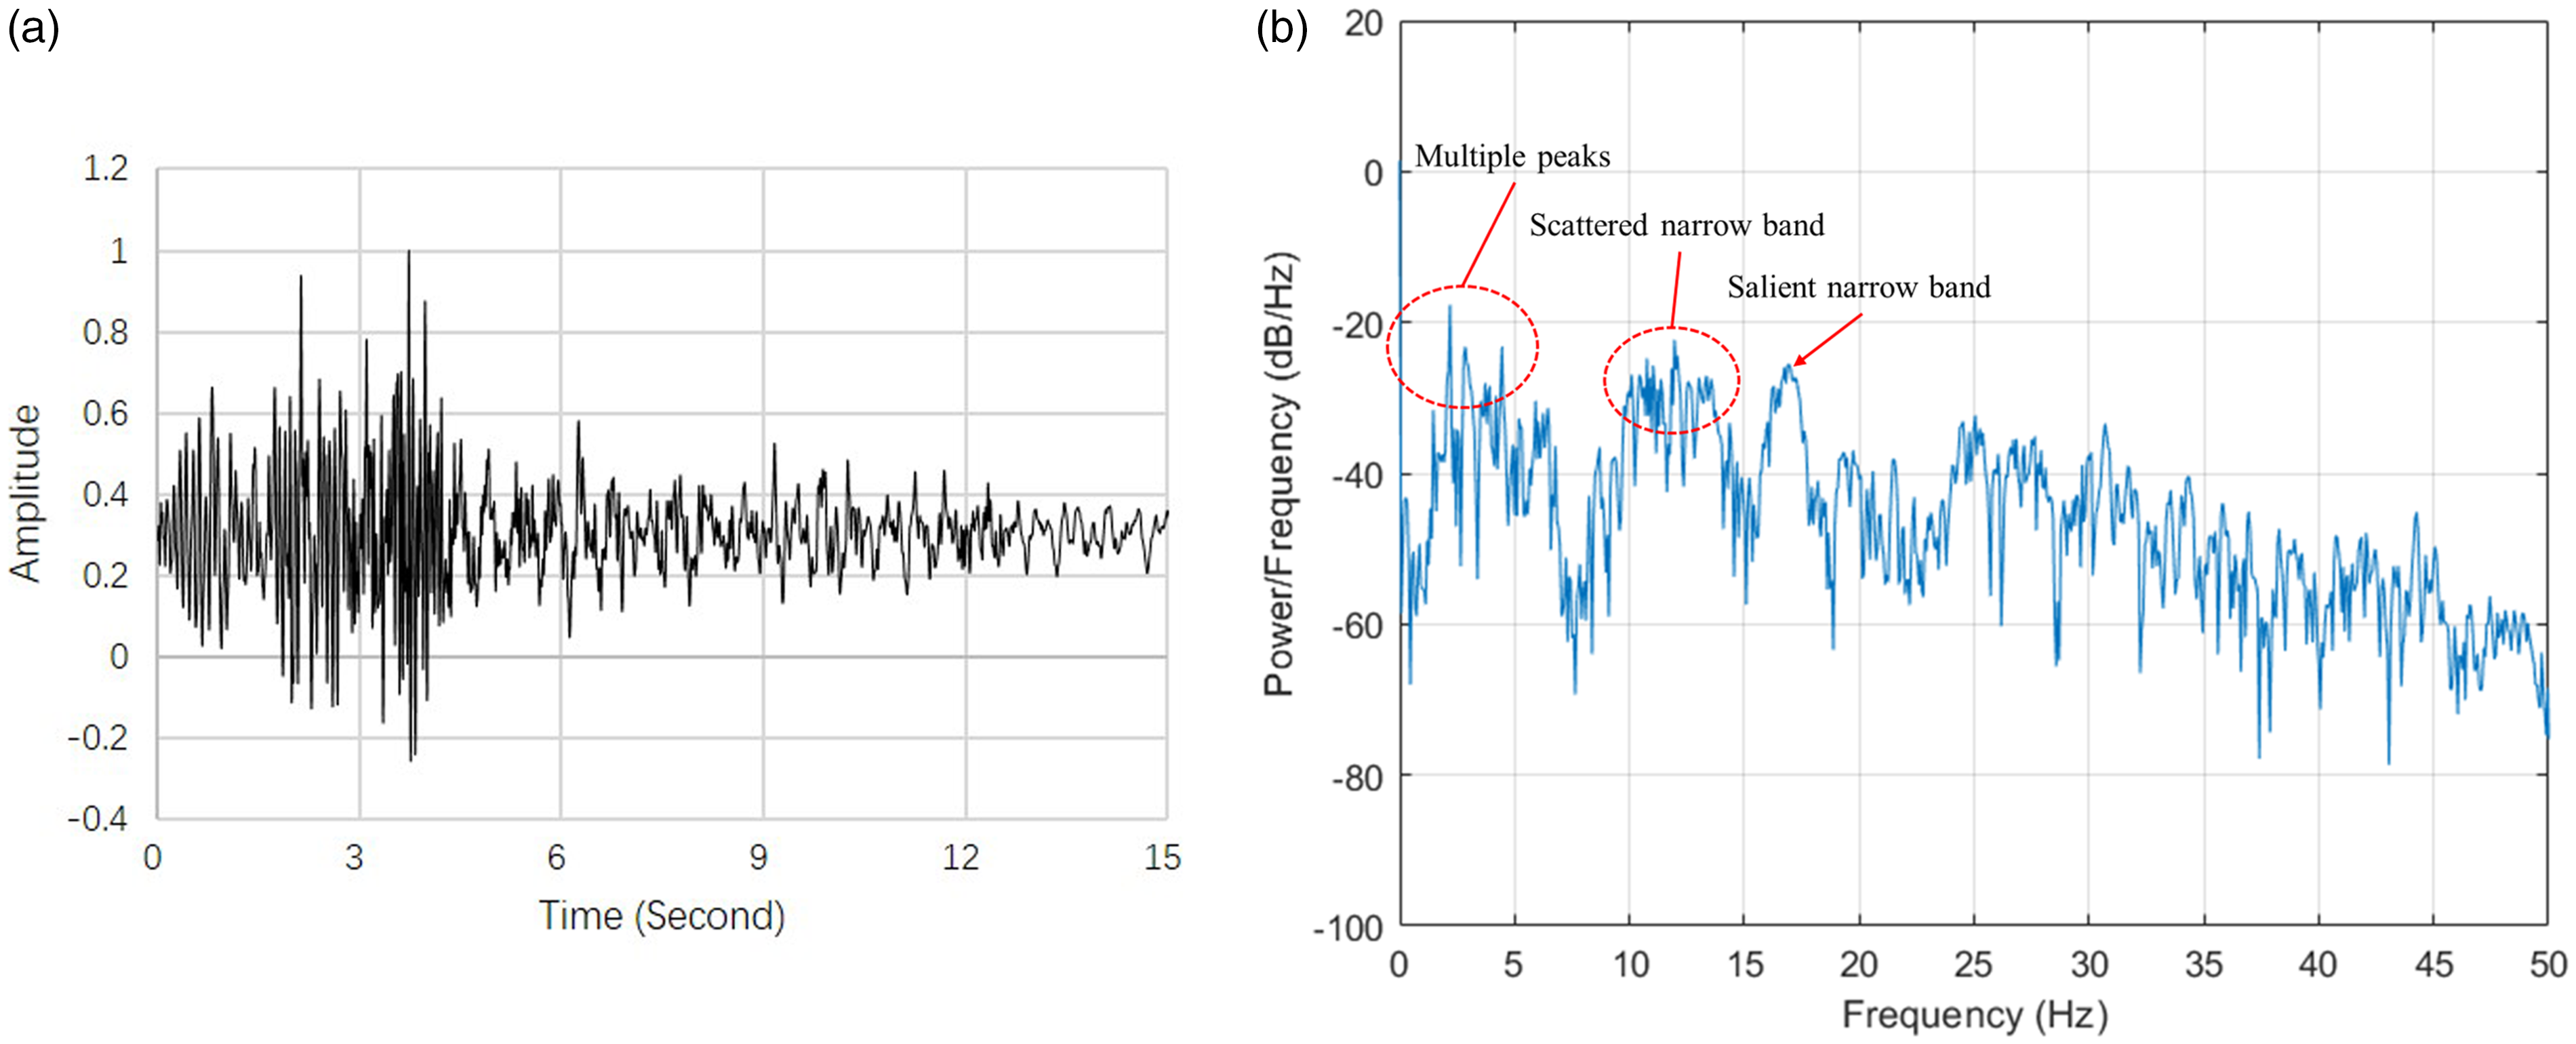
(a) Time history of measured acceleration of representative point during vehicle passing and (b) power spectrum of the acceleration signal.
In Figure 3(b), there are multiple peaks and narrow band in the spectrum. There are three groups of dominant components: 1. Below 5 Hz, there are multiple peaks; 2. A scattered narrow band between 10 and 15 Hz; and 3. A salient narrow band centered at 17 Hz. These findings are difficult to fully explain using linear finite element method (FEM) modeling of a bridge, even with moving vehicle loads plus noise excitation. They will be explained using vehicle dynamic load modeling and advanced nonlinear analysis of the bridge system. The results are presented in the next section.
To quantify the natural modes of the bridge, the free-decay response of the bridge after the vehicle exits the bridge was recorded and the spectrum is estimated. The natural modes of the system using the fast Fourier transform were 1.500 Hz, 2.190 Hz, 2.846 Hz, 3.224 Hz, and 4.586 Hz. The correlation between the spectrum of free-decay response of the representative point and the results of the FEM are shown in Table 1. 32
Field measurements and FEM results.
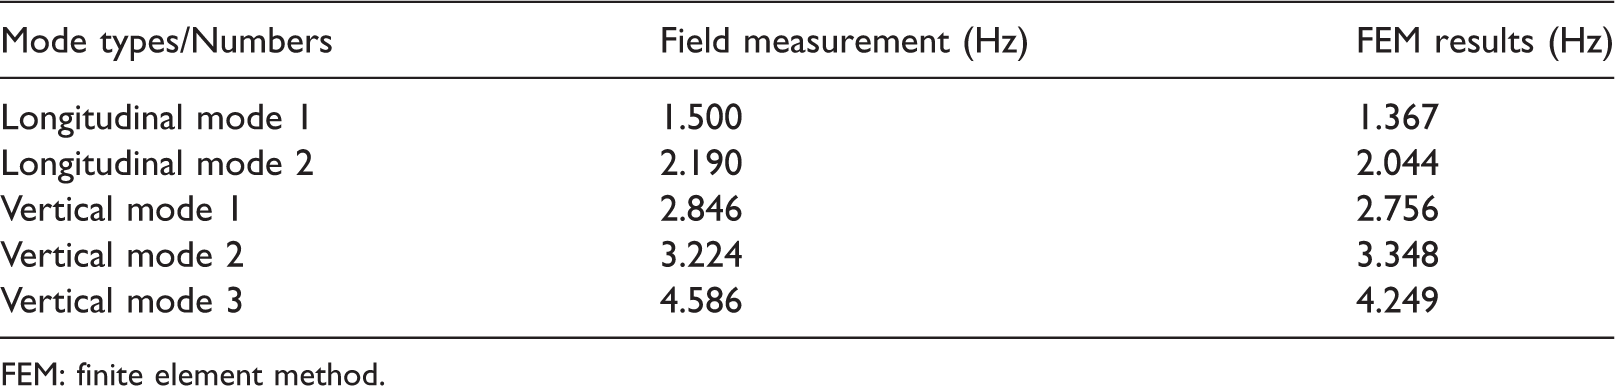
FEM: finite element method.
In the above analysis, spectral peaks in the Fourier transformation of the signal were identified by assuming the system vibrations are linear during the free-decay phase after the vehicle exits the bridge. These modes correlate with the multiple peaks in Figure 3(b) between 2 Hz and 5 Hz.
The Fourier spectrum is considered as an invariant for linear dynamics system motion. However, in the bridge–vehicle interaction phase, the excitation frequencies and vehicle response, and the nonlinear dynamic features of the bridge due to moving vehicle loads could be salient. The vehicle excitation frequencies are quantified in the following section.
Vehicle dynamical load analysis
To quantify the specific frequencies of excitations, the dynamical load of the truck is estimated by considering a single-axle, quarter-truck vehicle model with two degrees of freedom. The truck vehicle load is modeled by a two degrees-of-freedom system moving along a rough road at constant speed v, as shown in Figure 4.
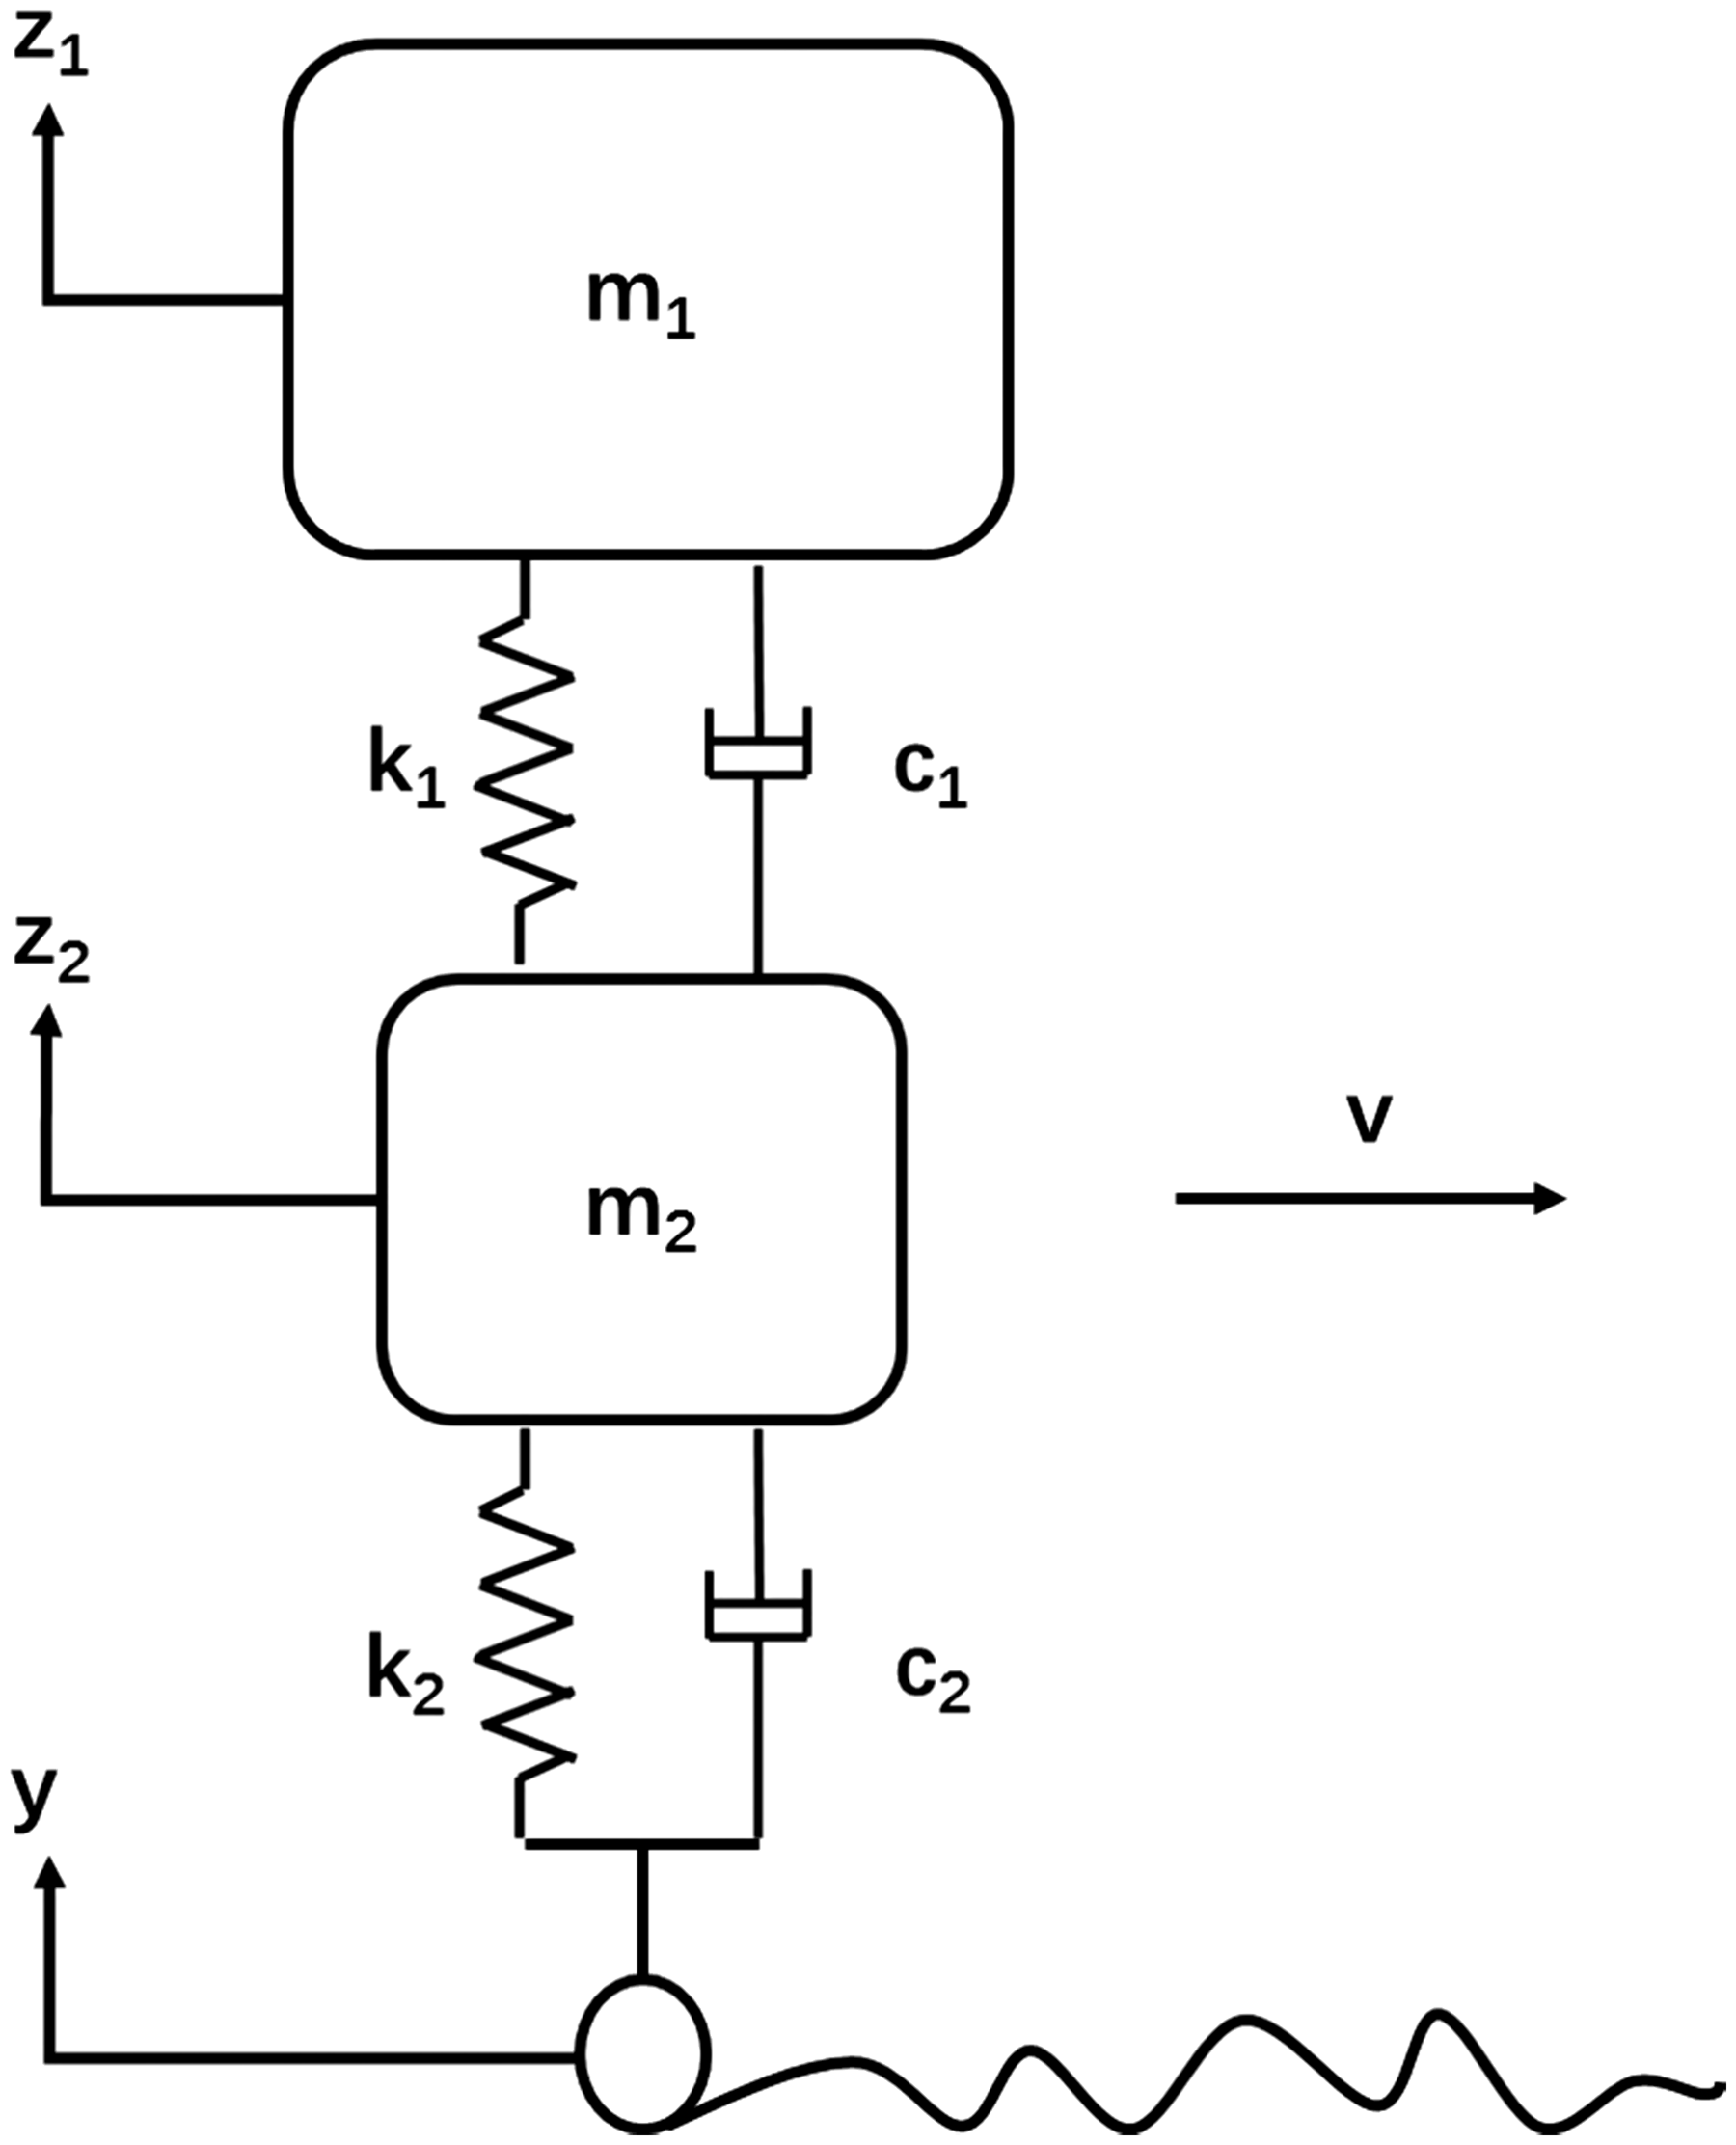
Quarter-truck model.
Vehicle responses usually exhibit linear elasticity. The road pavement roughness is considered to be a randomly determined stationary Gaussian process with a mean of zero. The wheels are assumed to maintain contact with the surface of the road without separation, and the contact pavement has negligible deformation relative to the responses associated with the vibration of the vehicle. It is assumed that the only significant factor associated with the vertical vibration of the vehicle is road roughness.
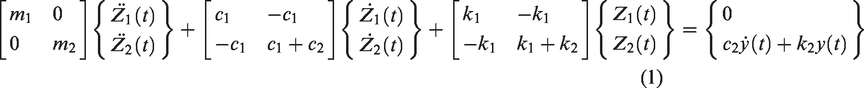
The vertical vibrations in the vehicle as well as the roughness of the road are functions of time. If a static vehicle load is not considered, the equation of motion associated with the body of the vehicle can be presented as follows
The road profile is described in the literature as the sum of waves of different lengths that form road macro profiles and micro profiles. Road parameters are determined based on the autocorrelation and power spectral density (PSD) function under the assumption of the stationary function of random road surface irregularities. According to ISO 8606, roads are divided into several classes to the description of which the PSD function was used.
Conventionally, the study can proceed under the assumption that a surface profile of pavement is the manifestation of a random process that can be described using a LaBarre road spectrum model
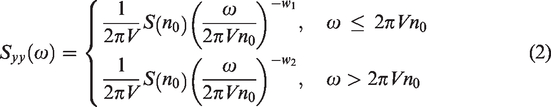
Roads with a rough surface can produce vertical vibrations in the body of moving vehicles, thereby transmitting the inertial force associated with the vibration through the suspension system and wheels into the pavement. Dynamic vehicle load 
In accordance with the theory of random vibration, by considering uncertainty, Lin’s closed-form solution was extended for the dynamic vehicle load spectrum 

The following parameters were selected for the vehicle model: m1 = 4500 kg, m2 = 650 kg, k1 = 570 kN/m, k2 = 3000 kN/m, and c1 = 21.07 kN·s/m, c2 = 5 kN·s/m. The associated dynamic vehicle load spectra were estimated. Figure 5 shows the dynamical load spectrum of the truck. From Figure 5, the second mode of the truck is centered at 12.5 Hz, which is well-correlated with the scattered narrow band between 10 Hz and 15 Hz as shown in Figure 3(b).
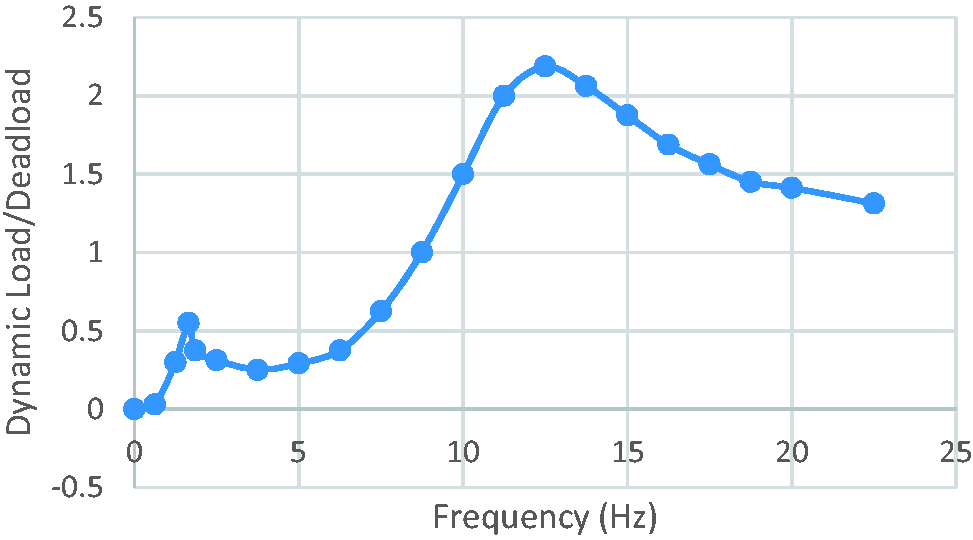
Dynamical load spectrum of truck.
To further characterize the salient narrow band centered at 17 Hz, the nonlinear dynamics analysis of the bridge under a moving load and the correlation with bridge inspection is conducted in the next section.
Bridge inspection and nonlinearity characterization
Aged bridges can have many defects, such as cracks, material deterioration, separation between superstructures, and understructures. In our inspection, the most serious defects of the bridge were that some supporting bearings lost full contact with the superstructure.
In the report by HDR, Inc., 35 five roller bearings of the bridge did not fully connect with the superstructure. Figure 6 shows the locations of the bearings with issues. This study placed five displacement sensors at these locations to measure the movement of the roller bearings in the vertical direction. 36
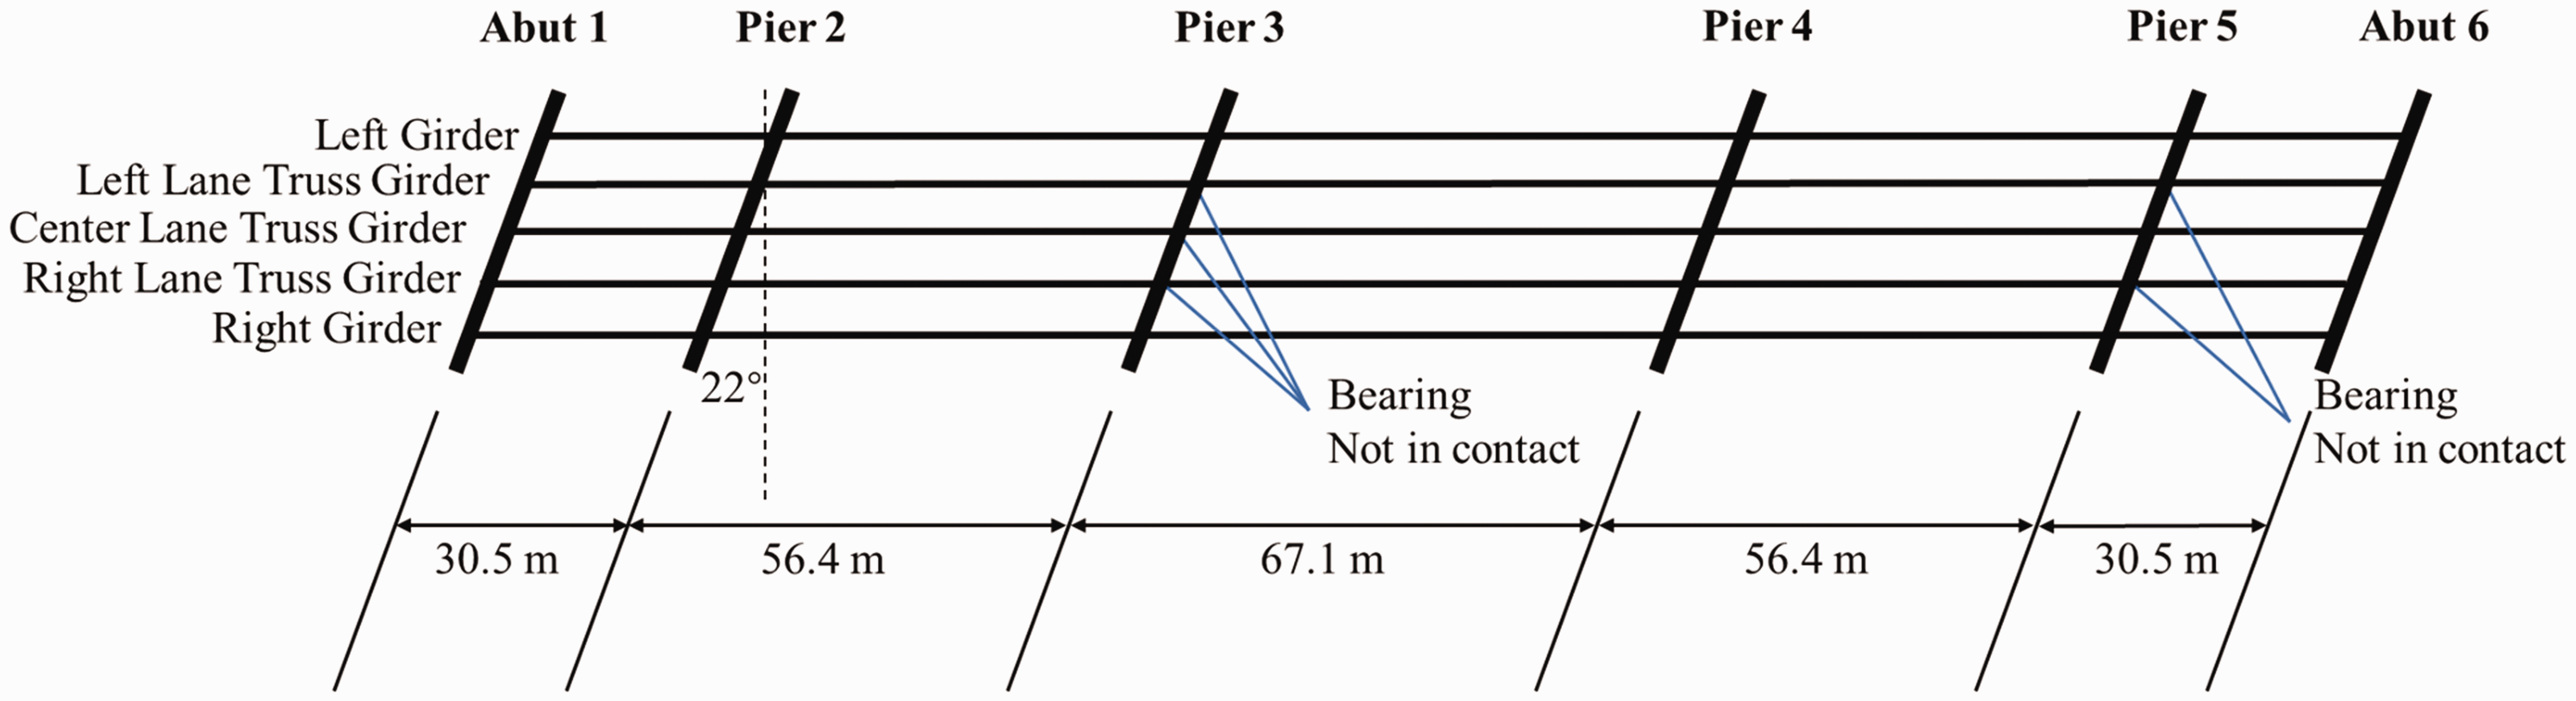
Bearing issue locations.
To conduct bearing inspection, heavily loaded trucks were made to cross the bridge at low speeds. The vertical movement of the displacement sensors is shown in Figure 7(a) to (e). These graphs illustrate the response for 50 data points averaged over time for each of the five bearing locations.
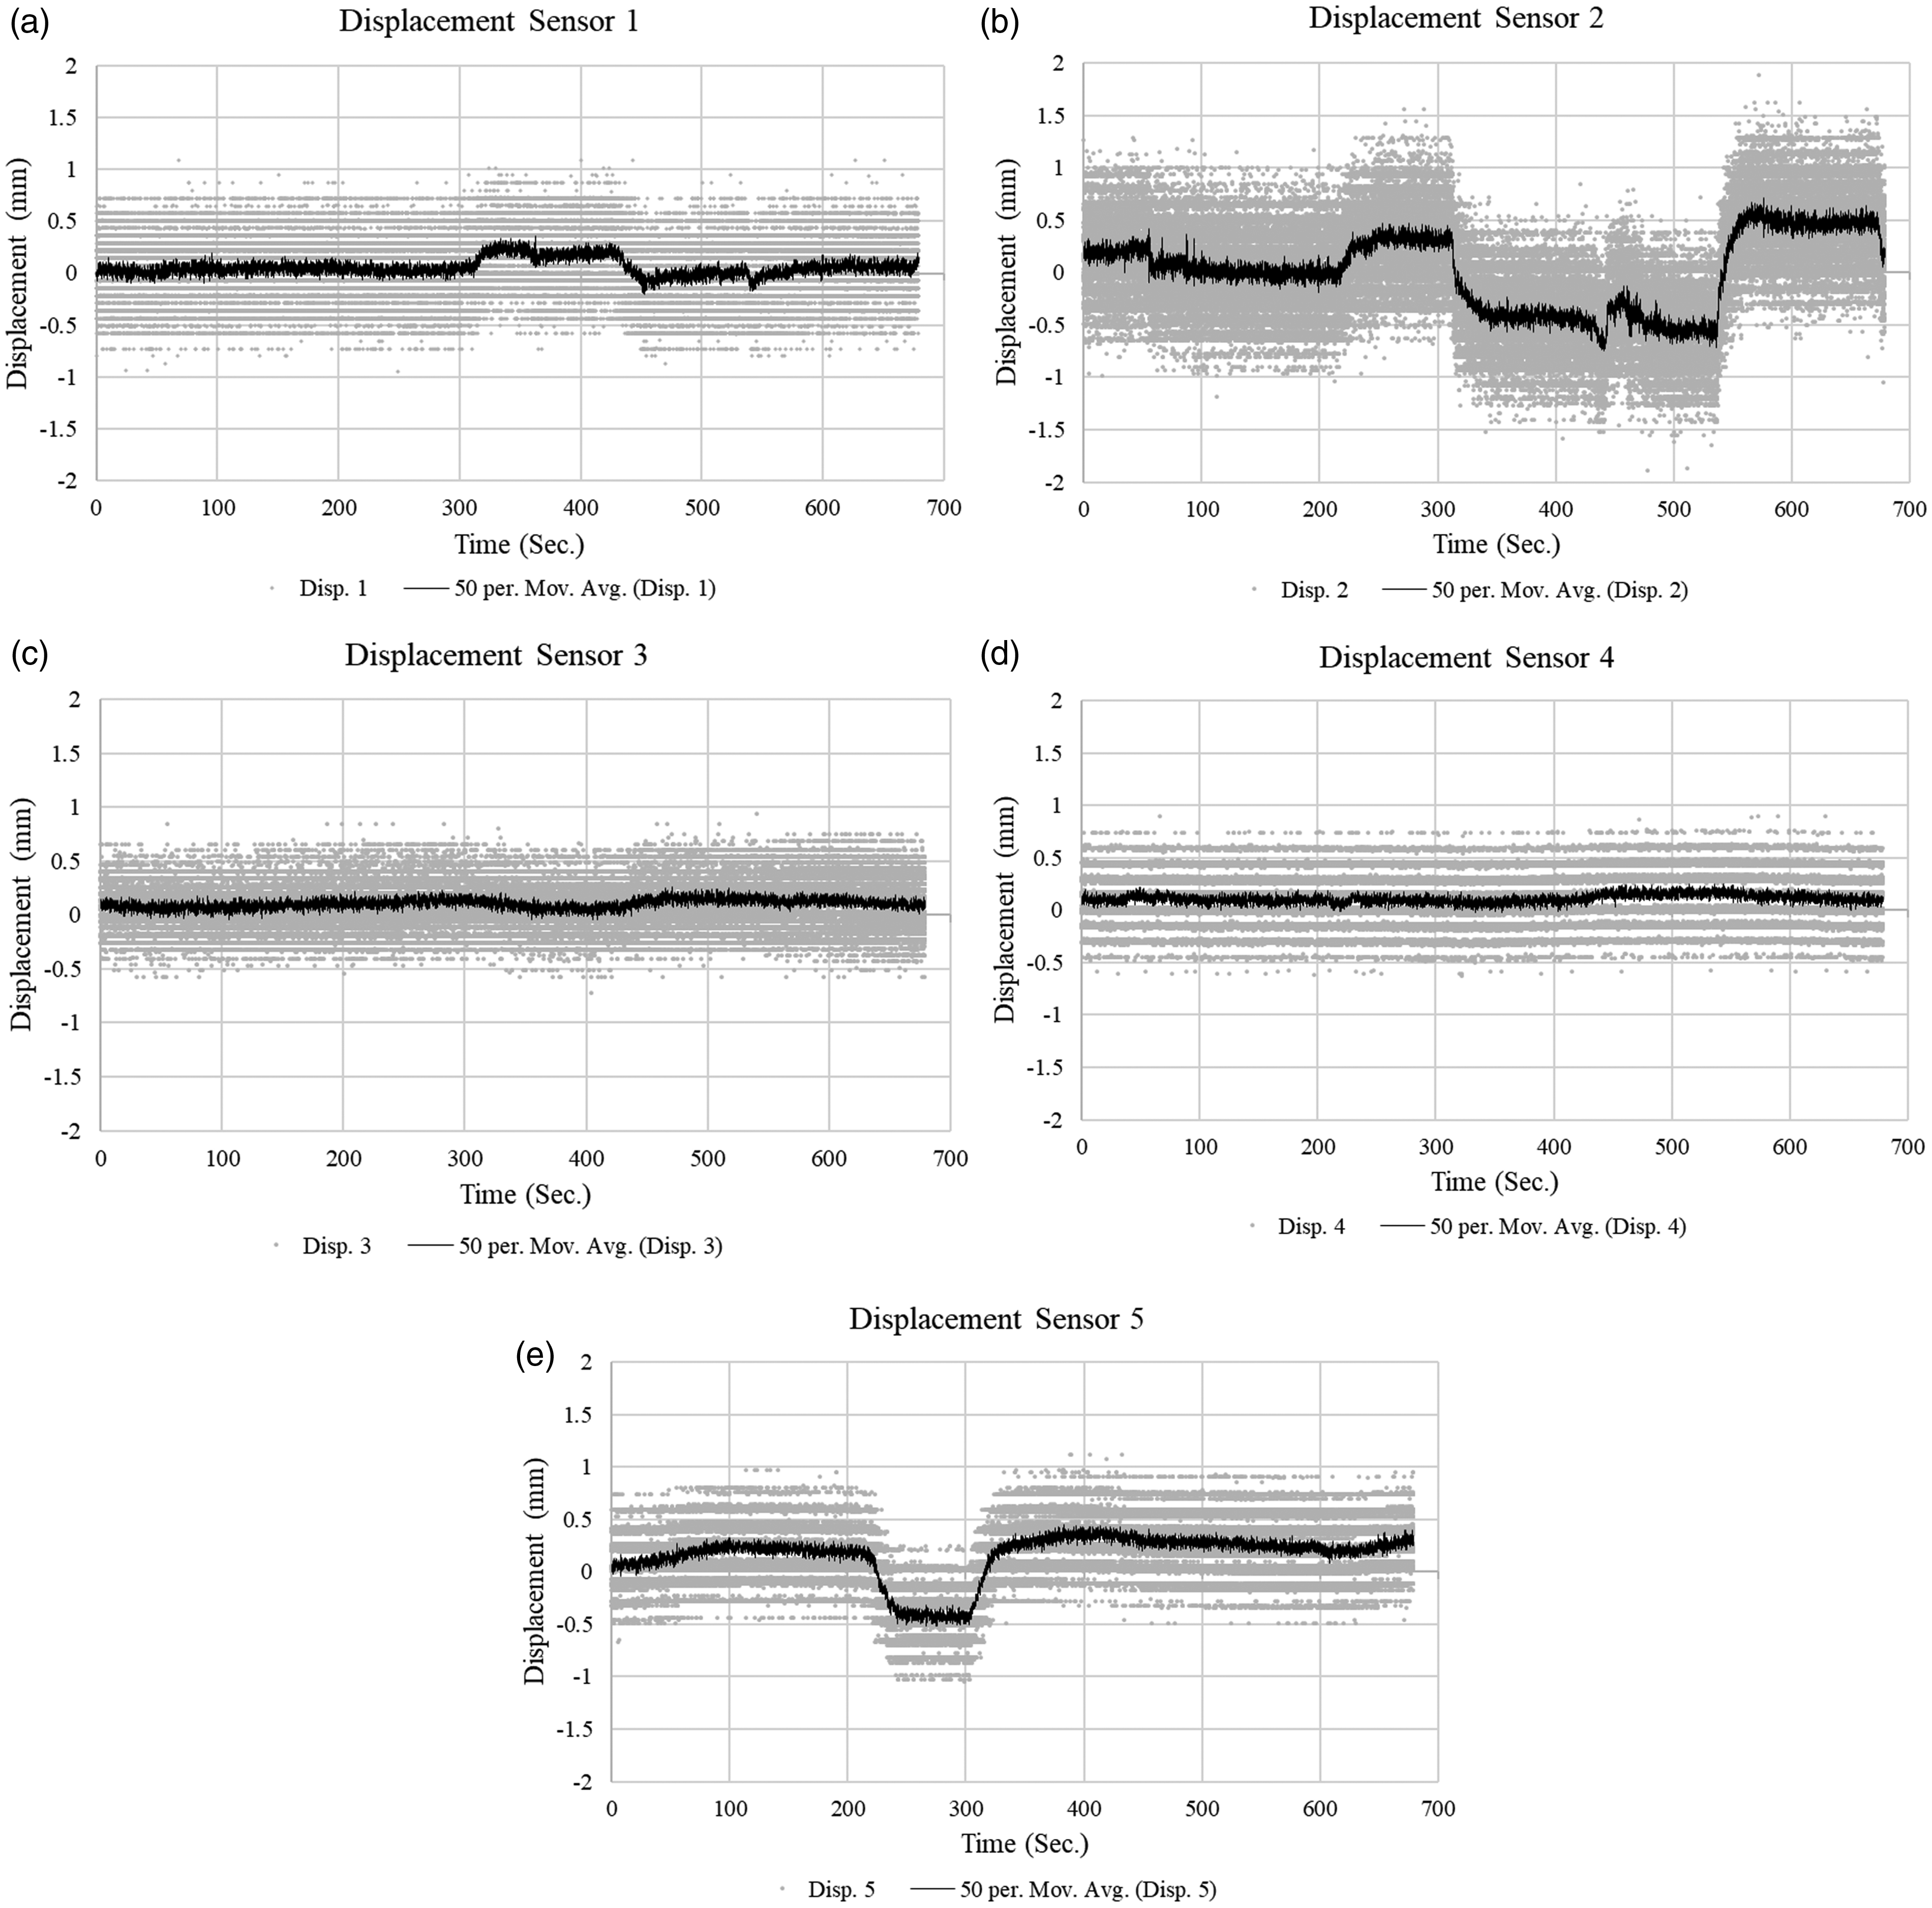
Vertical movement at five unconnected bearing supports: (a) vertical movement at displacement 1; (b) vertical movement at displacement 2; (c) vertical movement at displacement 3; (d) vertical movement at displacement 4; and (e) vertical movement at displacement 5.
According to the displacement sensor results, roller bearings 1, 3, and 4 have limited movement in the vertical direction. Compared with the other roller bearings, bearings 2 and 5 are more flexible in the vertical direction. This bridge clearly exhibits nonlinear behavior.
We also attempt to use the tested response to characterize the system for possible nonlinearity. Note that the change of system invariants of a structure must be related to the physical changes in geometry or material properties. Lyapunov exponents act as system invariants, which is similar to the role of modal characteristics in a linear structural system. To quantify the nonlinear properties, the nonlinear dynamics invariants, Lyapunov exponents, are evaluated such that the essence of the dynamic system during its evolution can be quantified. In Figure 8, Lyapunov analysis of the bridge response shows that the largest Lyapunov exponent of the bridge vibration is slightly greater than zero during the test. This finding suggests that the system exhibits weak nonlinear features.
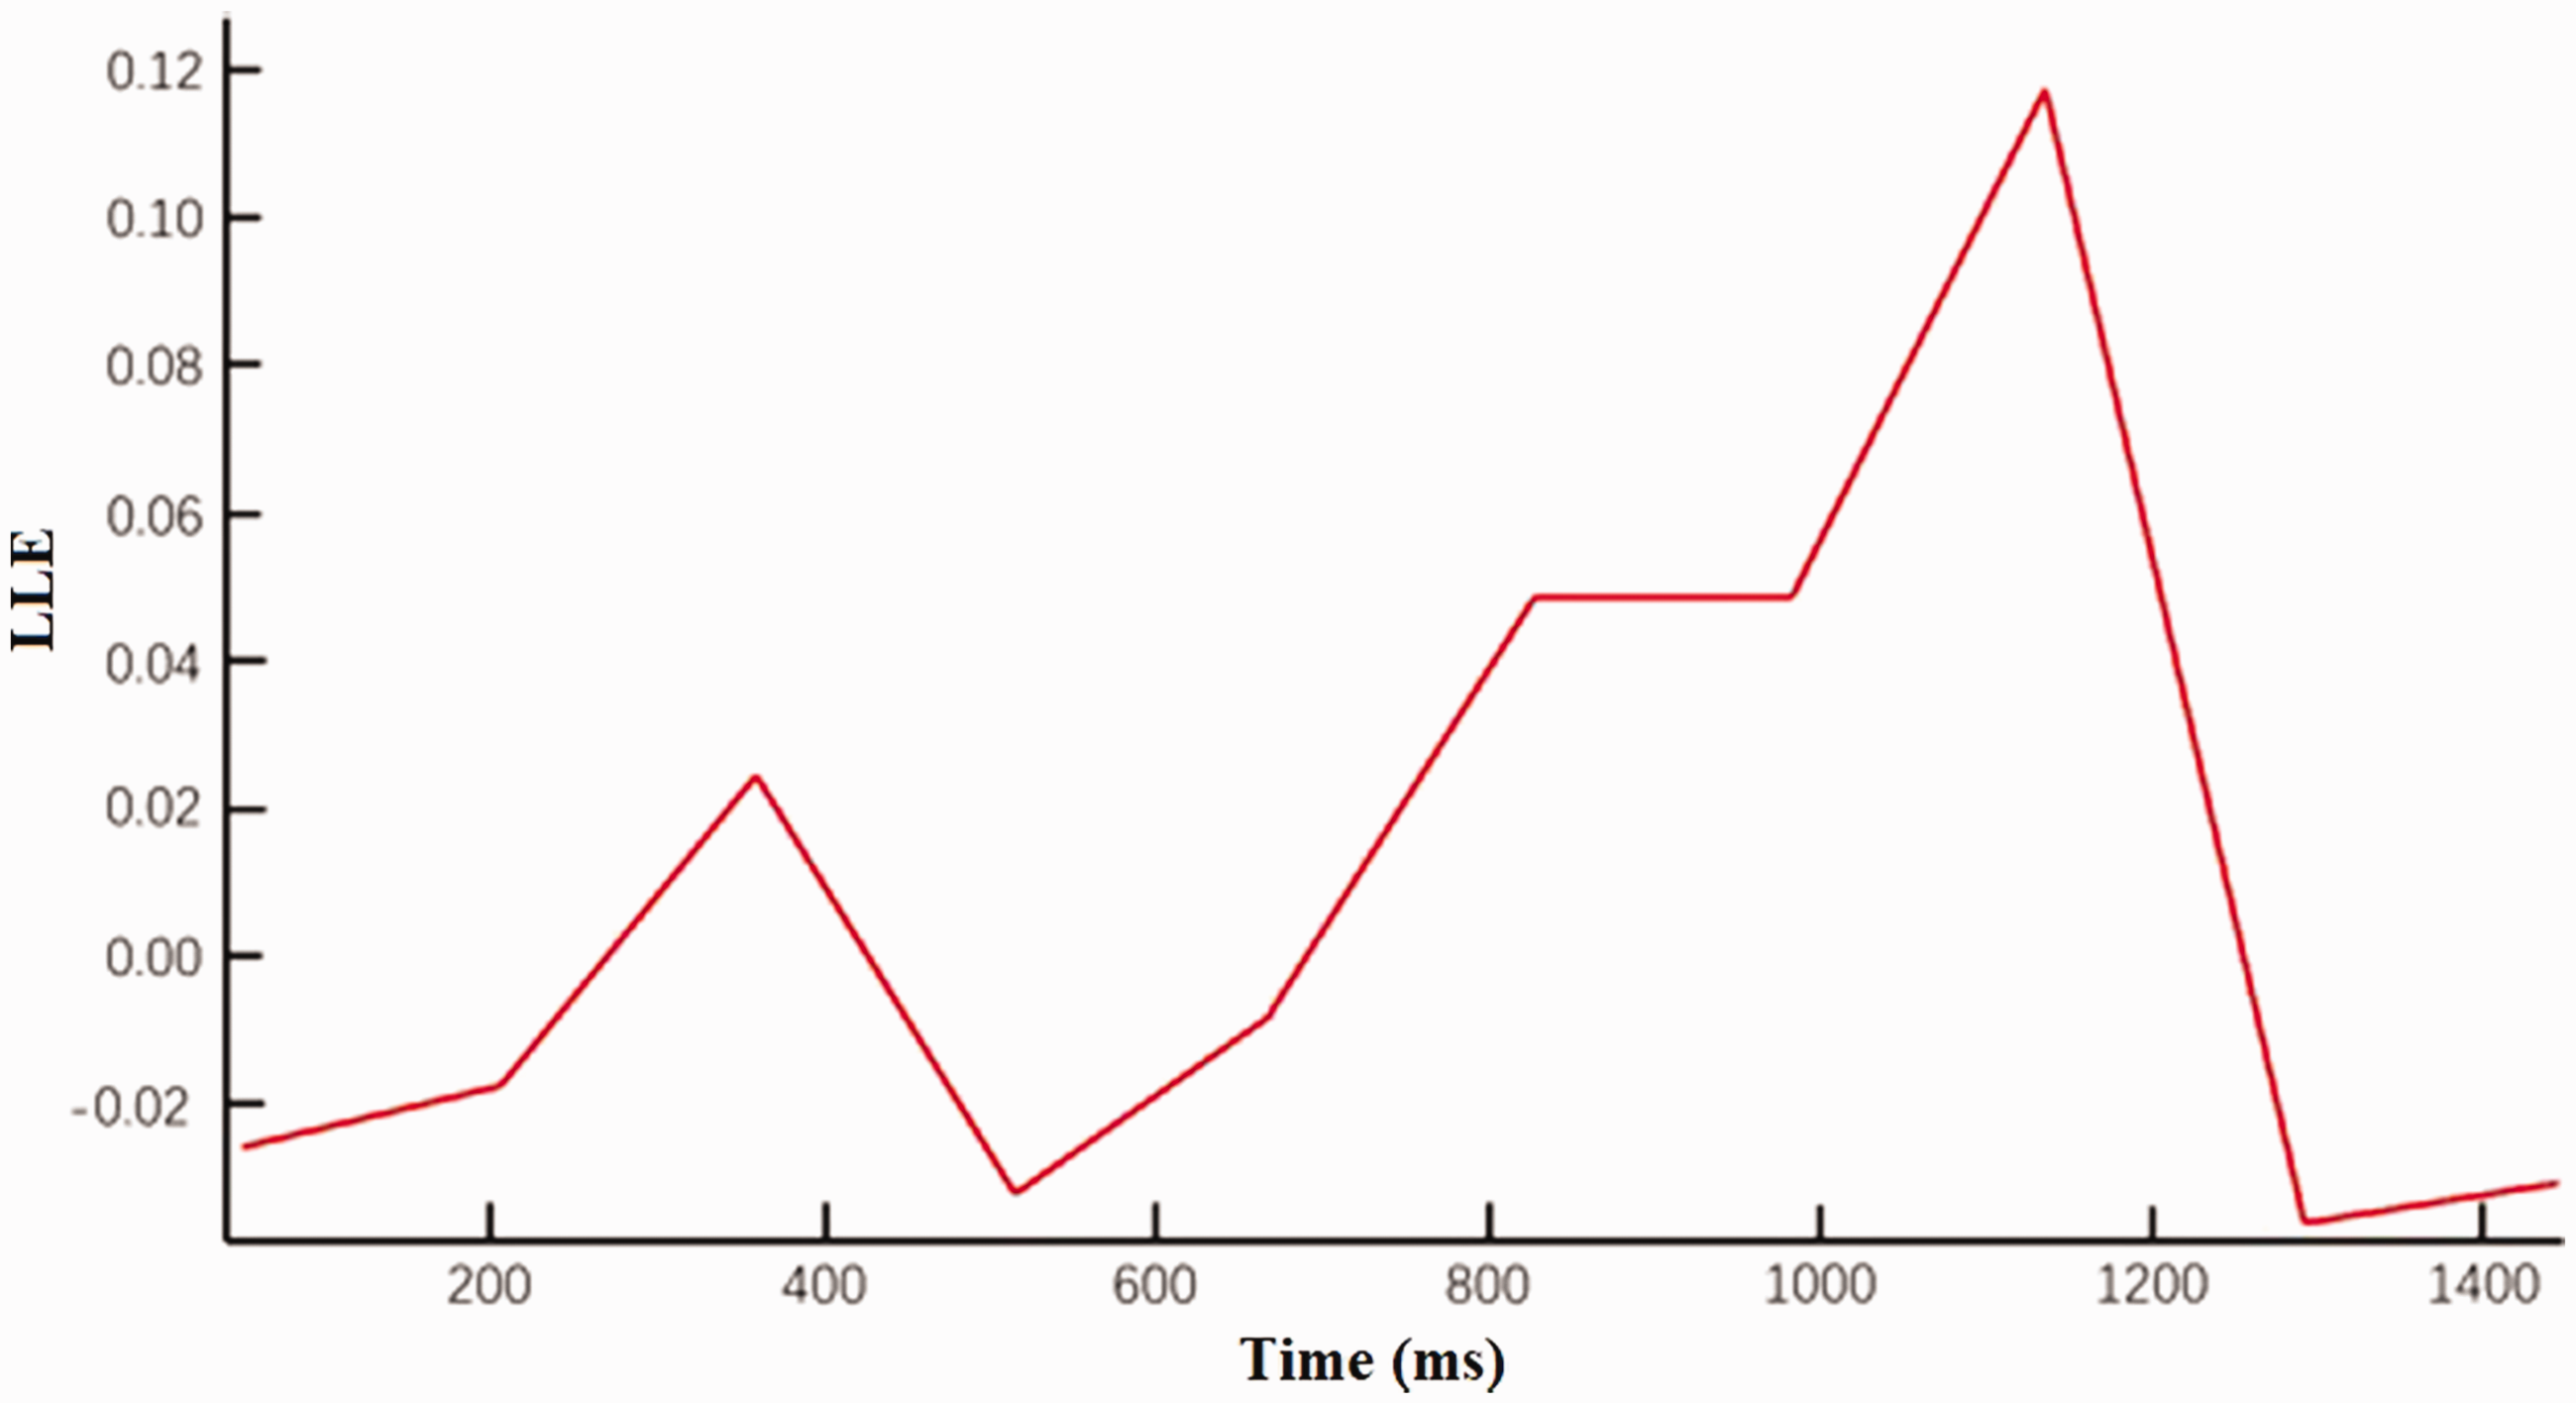
Momentary largest Lyapunov exponent.
To further correlate the dynamic feature of the salient narrow band centered at 17 Hz in the bridge response spectrum and the above characterized nonlinearity based on inspection and response data analysis, we explore the spectrum signature of a bridge span under faulted bearing support, which is modeled as a beam supported by a nonideal boundary condition. This approach may increase our understanding of the root cause of the unidentified narrow band in the response spectrum.
For a span of a bridge, the Euler–Bernoulli beam model can be used to quantify the vibration property. Consider the beam to possess nonideal boundary conditions. Using approximation methods such as the Galerkin method or Harmonic Balance methods, the idealized beam model can be transformed to a multiple-degrees-of-freedom lumped system with polynomial nonlinear terms.
37
,
38
The idealized model can be further simplified as a single-degree-of-freedom system

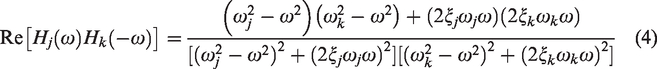
To characterize the vibration of the system equation (4), we apply a contemporary method – the variational iteration method by He18–21 to derive a spectrum estimation. To derive the spectrum “fingerprint”, we ignore the damping term and periodic excitation term in equation (5) and rewrite equation (5) in the following form

In which 
If the transient peak of vibration at the initial 

where 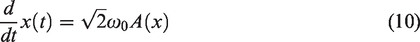
Integrating the above equation, we obtain the time necessary to allow the vibration displacement from transient peak 
If the valley value of the vibration waveform is 
As such, the transient vibration period and transient frequency can be estimated

In equation (14), the nonlinear effect in the combined nonlinear force could have different contributing components

From the approximate solution, the specific frequency is a complex function of displacement. During the vehicle–bridge interaction, the nonideal boundary conditions or contact condition of the bearing varies and the displacement varies, which causes the specific system frequency to vary, and results in a narrow band.
By using He’s variational-iteration method, a closed-form spectrum estimation of the bridge span model with nonideal boundary conditions is derived. The derived formulation offers insight into the relationship between the narrow band observed in the response spectrum and the faulted components of the bridge.
Discussion
In certain cases, modal parameters, such as natural frequencies and the corresponding mode shapes, are insensitive to damage, and the application of linear modal parameters for bridge health monitoring can be difficult due to, for instance, the modeling uncertainty and nonlinearity resulting from the bridge-vehicle interaction. Conversely, bridge damage, such as cracks or disconnection of joints, affects the nonlinear behavior in repeatable and predictable ways. Different from the measured frequency response functions, the new approaches study the nonlinear dynamical behavior at certain locations on the bridge. The spatial distribution results of the Lyapunov exponents show that at some locations, the response exhibited positive exponents at some locations and all others exhibited negative exponents. An increase in the positive values of the Lyapunov exponents can possibly be used to detect damage. The nonlinear approach for diagnosing structural health is a reference-free technique. The damage index is the absolute value of the difference between the positive Lyapunov exponents associated with the damaged and undamaged situations.
Many factors can contribute to the nonlinear behavior of a bridge, such as the nonlinear contact between the bridge and bearing supports in this study. Other factors could include material inelasticity, geometric or second-order effects, nonlinear soil–foundation–structure interaction, gap opening and closing at hinges and abutment locations, time-dependent effects due to concrete creep and shrinkage, weather interactions, and temperature change. Most of these factors can be modeled using a polynomial function of displacement. Vibration-based methods can detect damage in areas difficult to access, and the methods are sensitive to local damage. Nonlinear dynamics structural health monitoring could be established, especially, for damage identification.
In this study, the results showed the bridge response under vehicle loading at certain locations exhibits nonlinear dynamic characteristics. The largest Lyapunov exponents are a feature index that exhibit positive values indicating the nonlinearity.
Conclusions
The dynamical behavior of a bridge was studied based on the vibration under truck loading. The results clarified the contribution of the vehicle for bridge vibration, and the decay response consisted of two parts: forced vibration and free vibration. The bridge linear modes were identified and compared with FEM results, and the vehicle excitation frequencies were quantified.
Additionally, the nonlinear properties of the bridge were analyzed based on the vehicle–bridge interaction signal. Nonlinear invariants are used to identify the bridge nonlinear dynamic characteristics directly. In this study, the Fourier spectrum of the bridge response at certain representative points during vehicle–bridge interactions were found to exhibit complex dynamic characteristics of varied peaks and narrow bands, which are correlated with the bridge natural modes, vehicle dynamical load spectrum and related to the nonlinear nature of the bridge vibration.
The nonlinear characteristics were identified using Lyapunov exponents. To illustrate the nonlinear modes, a simplified nonlinear model and spectrum estimation of a bridge span was derived using He’s method. This analysis provided insight into the structural health monitoring efforts for the bridge. In certain cases, the structural damage cannot be identified using the free vibration of the bridge since it has a relatively low amplitude. In this case, the nonlinear dynamic properties can be used as damage-sensitive features to monitor bridge health. The identified linear modal parameters and nonlinear dynamics invariant and narrowband spectrum of the bridge can be used as benchmarks for further study. This study advances the method of using multiple invariant parameters and nonlinear analysis to improve bridge health monitoring and advances the understanding and characterization techniques for quantifying the nonlinear vibrations of a bridge excited by a passing vehicle.
Footnotes
Acknowledgements
The authors wish to acknowledge the support of Nanjing University of Science and Technology, University of Alaska Fairbanks, University of Alaska Anchorage, and Alaska Native Science and Engineering Program.
Declaration of conflicting interests
The author(s) declared no potential conflicts of interest with respect to the research, authorship, and/or publication of this article.
Funding
The author(s) received no financial support for the research, authorship, and/or publication of this article.