
Abstract
Aiming at the problem of vibration caused by underground high-speed railways, this paper proposes a vibration prediction method based on the multi-point transfer ratio in the frequency domain. The transmission information of vibration signals from the tunnel to the surface was obtained by an in situ hammer excitation test, and the acceleration response near the vibration source was calculated via high-precision vehicle-track coupling analysis and a finite element model of the tunnel. Then, the superposition operation was carried out in consideration of the position change of the train, and the surface vibration response caused by the underground high-speed railway was finally predicted. An in situ vibration test was carried out near an underground high-speed railway line and the measured data were compared with the predicted data. The results demonstrate that the predicted and measured time domain peaks were similar, and the main vibration frequencies were both located in the range of 30–70 Hz. Moreover, the 1/3-octave spectra were also very similar, and the root mean square error of acceleration and the Z vibration level error were less than 1.9%. The comparison results show that the proposed method can be used to predict the vibration response caused by the operation of underground high-speed railways with high precision.
Introduction
High-speed railways have developed rapidly in recent years. With the increase of railway networks and the shortage of urban land, increasingly more underground high-speed railways are passing through cities. Examples in China include the Beijing North–Changping section of the Beijing-Zhangjiakou high-speed railway, the Shijiazhuang section of the Beijing–Guangzhou high-speed railway, and the Dongguan-Liaobu section of the Guanhui high-speed railway. This has resulted in increasingly prominent environmental vibration problems.1–5 Current research on vibration induced by rail transit is mainly focused on subway trains, while there is comparatively little research on vibration caused by underground high-speed railways. Due to the wide adoption of the ballastless track structure for underground high-speed railways and the absence of a gravel ballast for cushioning, the dynamic effect of the train wheel-rail system is greatly enhanced. Furthermore, compared with that of subways, the operating speed of high-speed trains is much faster. Thus, the intensity of vibration caused by high-speed trains is stronger than that caused by subway trains. 6 Therefore, accurate vibration prediction for sensitive targets near the railway line is the key to the evaluation of the vibration impact caused by underground high-speed railways, and to the implementation of effective vibration reduction measures.
The commonly used methods for the prediction of the vibration response caused by rail transit include analytical, semi-analytical, empirical, and numerical methods. Breccolotti et al. 7 developed a method by which to predict the level of vibration caused by railway traffic. Ding et al. 8 used the periodic finite element-boundary element (FE-BE) method to predict the free-field vibration caused by trains. Chebli et al. 9 proposed a method by which to calculate the responses of periodic structures caused by moving loads. Based on multiple linear regression, Paneiro et al. 10 comprehensively considered factors such as the track type, geological conditions, building type, train speed, and distance, and put forward a ground vibration prediction model applicable to underground railway traffic in Lisbon, Portugal. Kouroussis et al.11–14 established a finite element model (FEM) to reconstruct complex ground topology, and developed a prediction model involving a vehicle/track/soil composite system to predict the free-field vibration caused by train operation. Nielsen et al. 15 developed a hybrid model by which to predict ground vibration caused by discrete wheel-rail irregularities. Verbraken et al. 16 proposed an empirical prediction method of railway-induced vibration, the validity of which was verified by numerical simulation.
Among the many available prediction methods, while empirical prediction methods are simple and rapid, their accuracy is low, and they cannot meet the vibration prediction requirements of sensitive targets in areas with strong vibration. Many analytical, semi-analytical, and numerical methods with higher prediction accuracy have been developed, such as the pipe-in-pipe (PiP) model 17 and the periodic FE-BE coupling model. 18 These prediction methods utilize computer simulation technology to predict the vibration of sensitive targets, each subsystem is considerably simplified during model establishment and prediction, and there is uncertainty in the accuracy and reliability of prediction. In addition, the workload of calculation is heavy and takes a long amount of time. Therefore, some scholars have investigated hybrid methods for the prediction of vibration response based on field measurement data.19,20 For example, Kuo et al. 21 used a hybrid model combining field measurements and the numerical method to predict the environmental vibration along a railway line; the results revealed that the hybrid model can complement the numerical and empirical methods and exhibited improved prediction accuracy. Crispino et al. 22 measured road traffic-induced vibration in a heritage building and compared the results with a prediction model. Santos et al.23,24 proposed a three-dimensional numerical model for the prediction of ground vibration caused by railway traffic via the field measurement and analysis of a section of the Portuguese railway network. Kouroussis et al. 25 proposed a hybrid experimental numerical method that can predict ground vibration levels in the presence of various railway artifacts on existing networks, such as transition zones, turnouts, crossings, and track joints.
This paper proposes a new prediction method based on the measured multi-point transfer ratio of vibration response to quickly predict the vibration impact caused by underground high-speed railways. The core concept of this method is to obtain the vibration transfer ratio from the vibration source to the ground prediction point based on a hammer excitation test, and then to carry out the superposition operation in consideration of the change of the train phase in combination with the vibration source data to ultimately achieve vibration prediction. This method can accurately predict the vibration response without complex modeling and calculation. The field measurement results show that the proposed method can be used to predict the vibration response in the time domain, frequency domain, and 1/3 octave with high accuracy, which can provide a reference for researchers in the field of vibration prediction induced by rail transit.
Principle of the prediction method
The key to the prediction of the vibration caused by underground high-speed railways is the accurate acquisition of the vibration propagation in the stratum. Due to the complexity of the stratum and soil system, it is often simplified as a multi-layer elastic structure in traditional analyses and simulation calculations, based on which it is difficult to restore the real situation. In addition, it is difficult to accurately obtain the dynamic soil parameters, which will have a great impact on the prediction accuracy. The vibration caused by the train is at the micro-vibration level, and the soil structure is basically in the stage of elastic deformation. Thus, the transmission of vibration in the soil layer can be obtained by measurement, which can be used to accurately restore the natural transmission characteristics of the stratum, and can then be combined with the vibration source data to accurately predict the impact of train vibration.
If the external load acting on a multi-degree-of-freedom (multi-DOF) system is set as a simple harmonic load, the dynamic equation of the system can be expressed as

According to the principle of dynamics, equation (1) can be expressed as

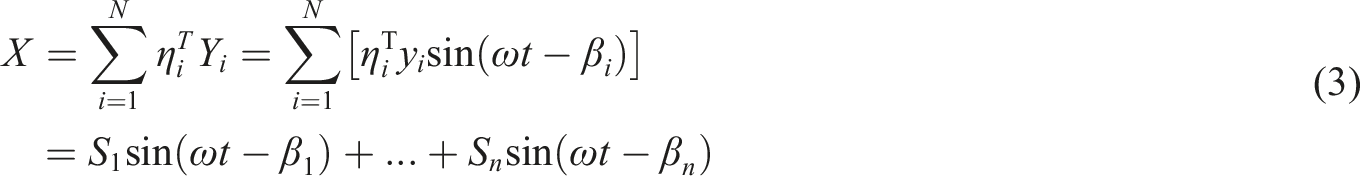
It can be seen from equation (3) that the steady-state response of the multi-DOF system under single-frequency excitation is still single-frequency, and the vibration frequency is the same as the excitation frequency.
When the input load in equation (1) varies with the slope , the dynamic equation of the system can be expressed as

The solution of equation (4) is
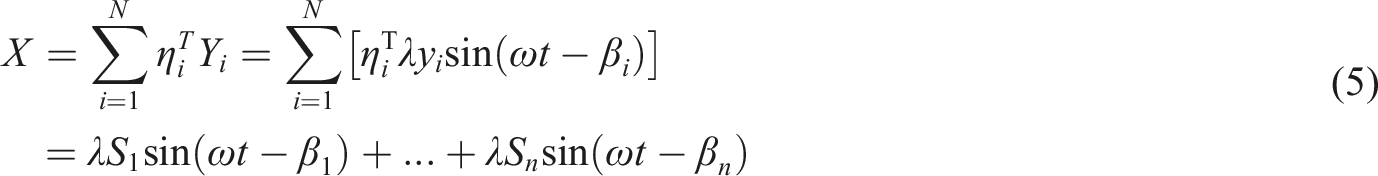
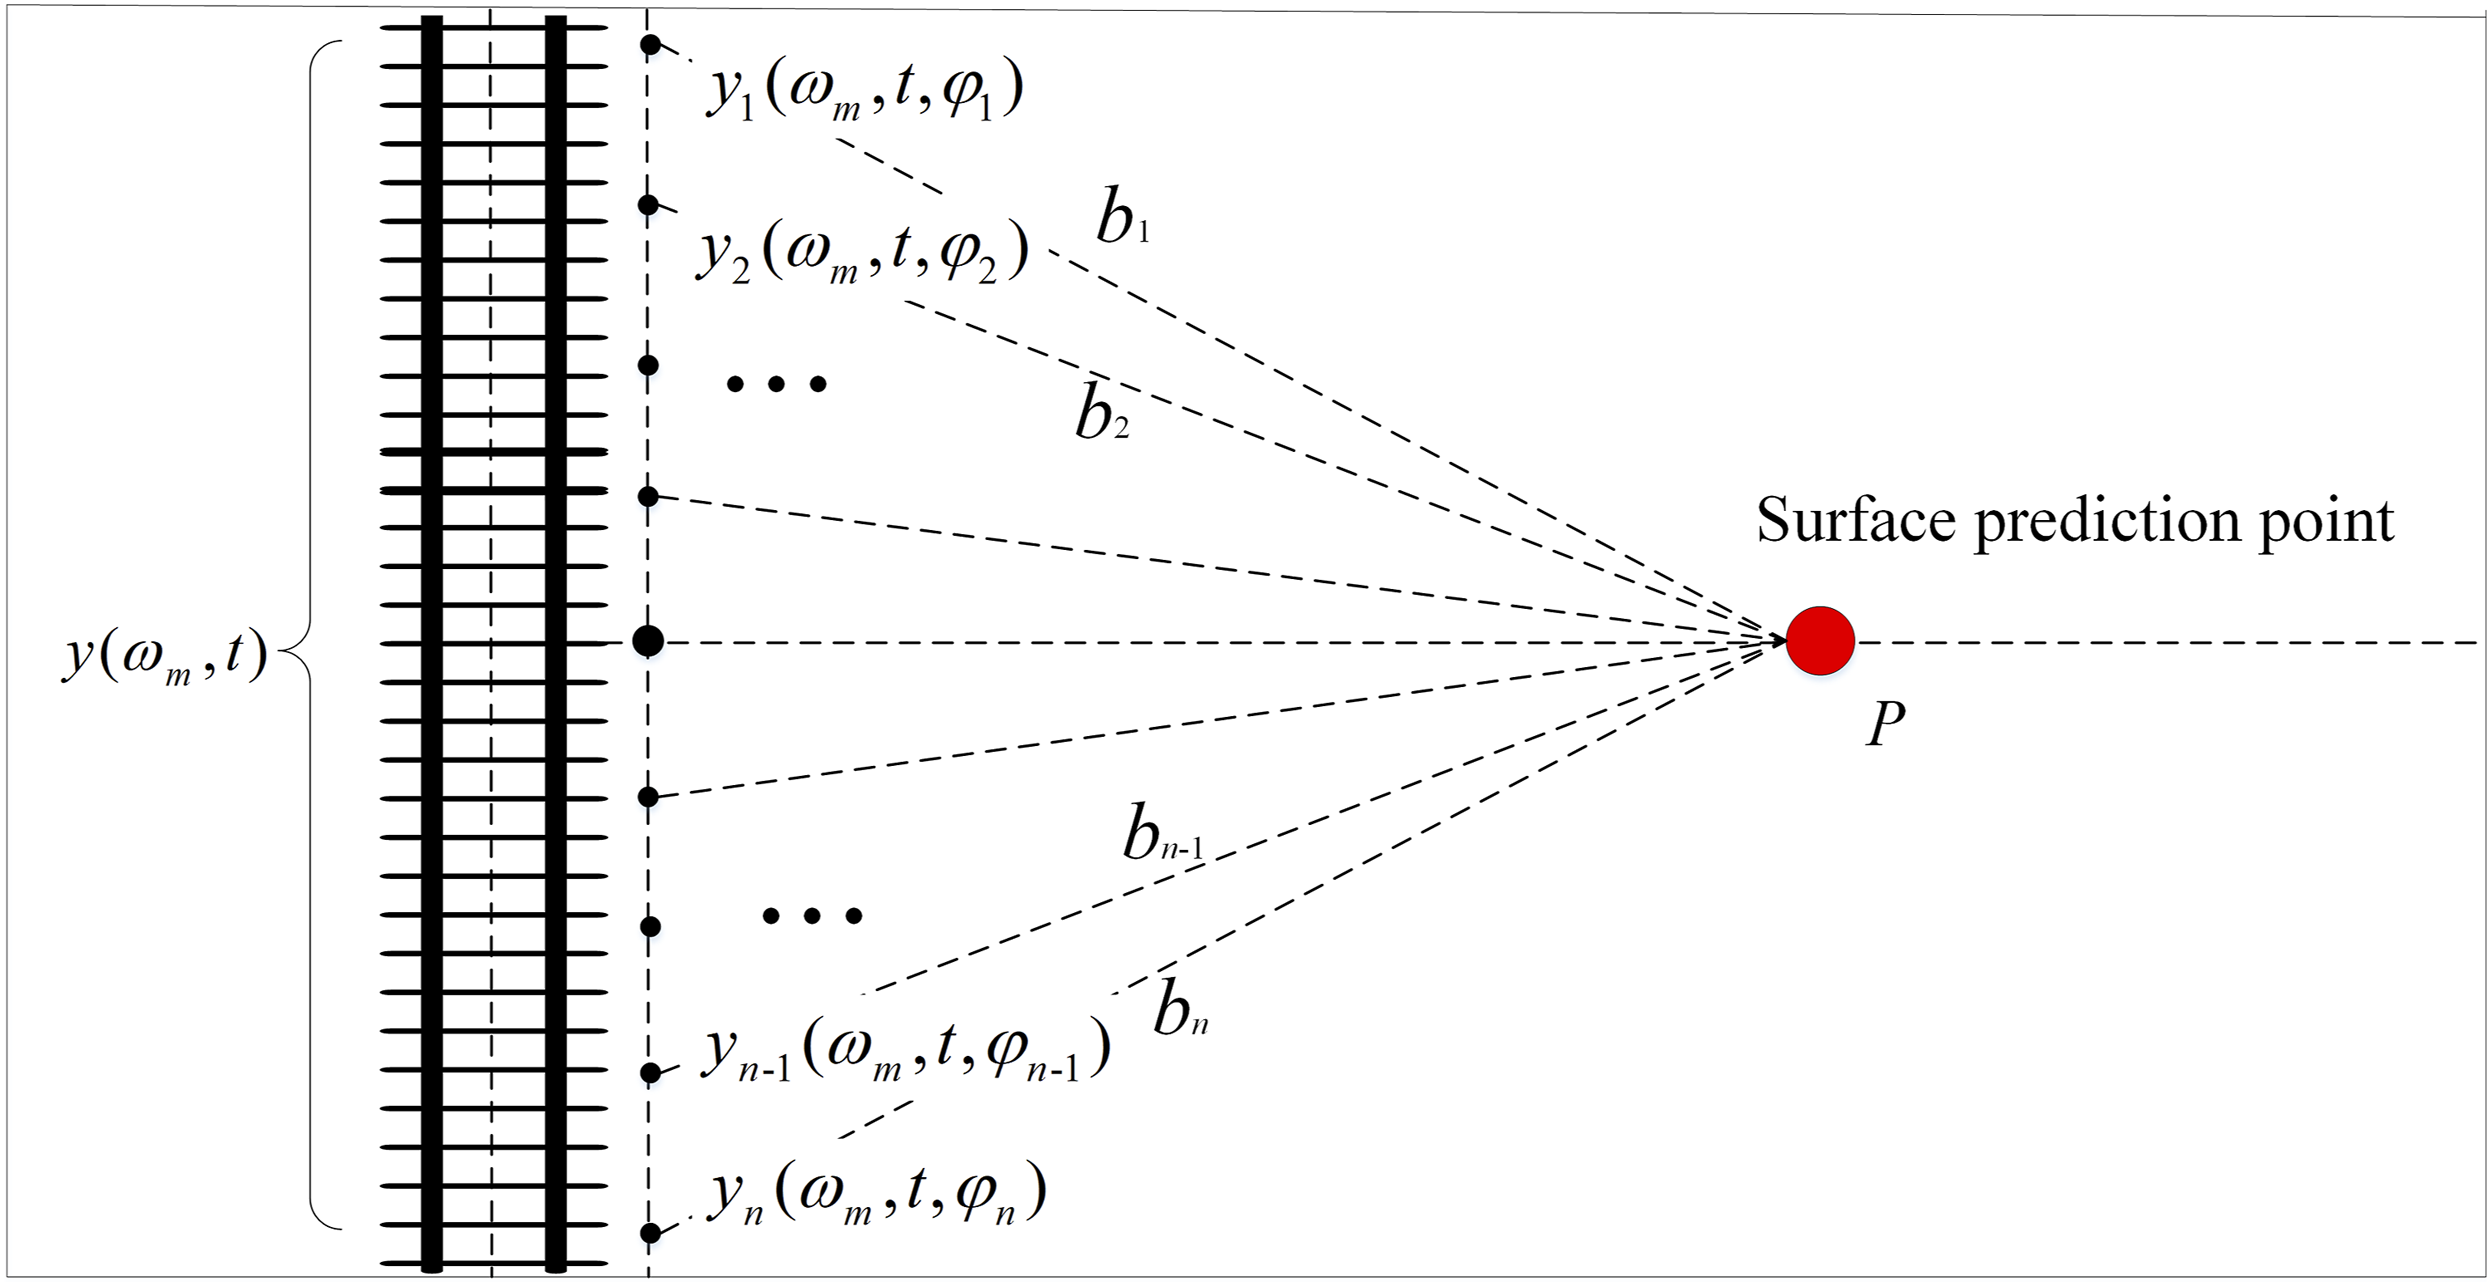
Therefore, when the input load increases linearly with the slope λ, the amplitude ratio between different DOFs is constant. The vibration wave signal at any time can be regarded as the superposition of a series of simple harmonic signals with different frequencies. If the transmission law between two points on the vibration transmission path is obtained, via combination with the vibration source data and in consideration of the influence of the train operation phase, the vibration response can be predicted. The entire prediction method is divided into the following five main steps. (i) A hammer excitation device is used for pulse excitation in the tunnel, and the vibration acceleration time histories The excitation and distribution of the measurement points.
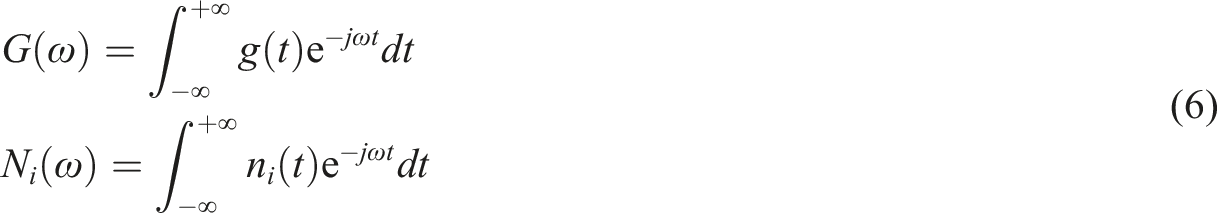
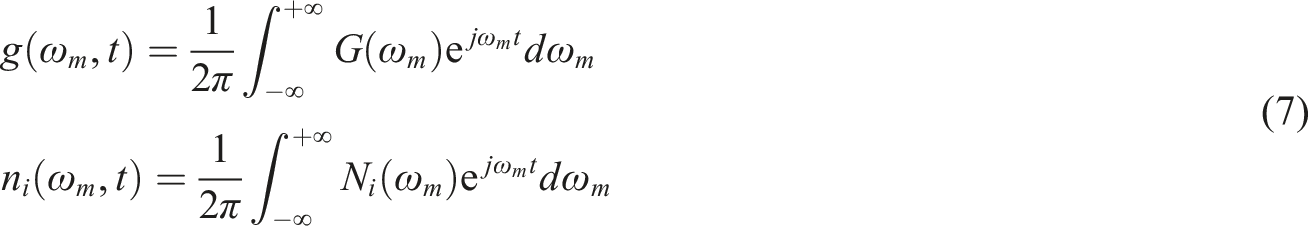
The signal data of each measurement point are transformed by a Fourier transform, as follows.
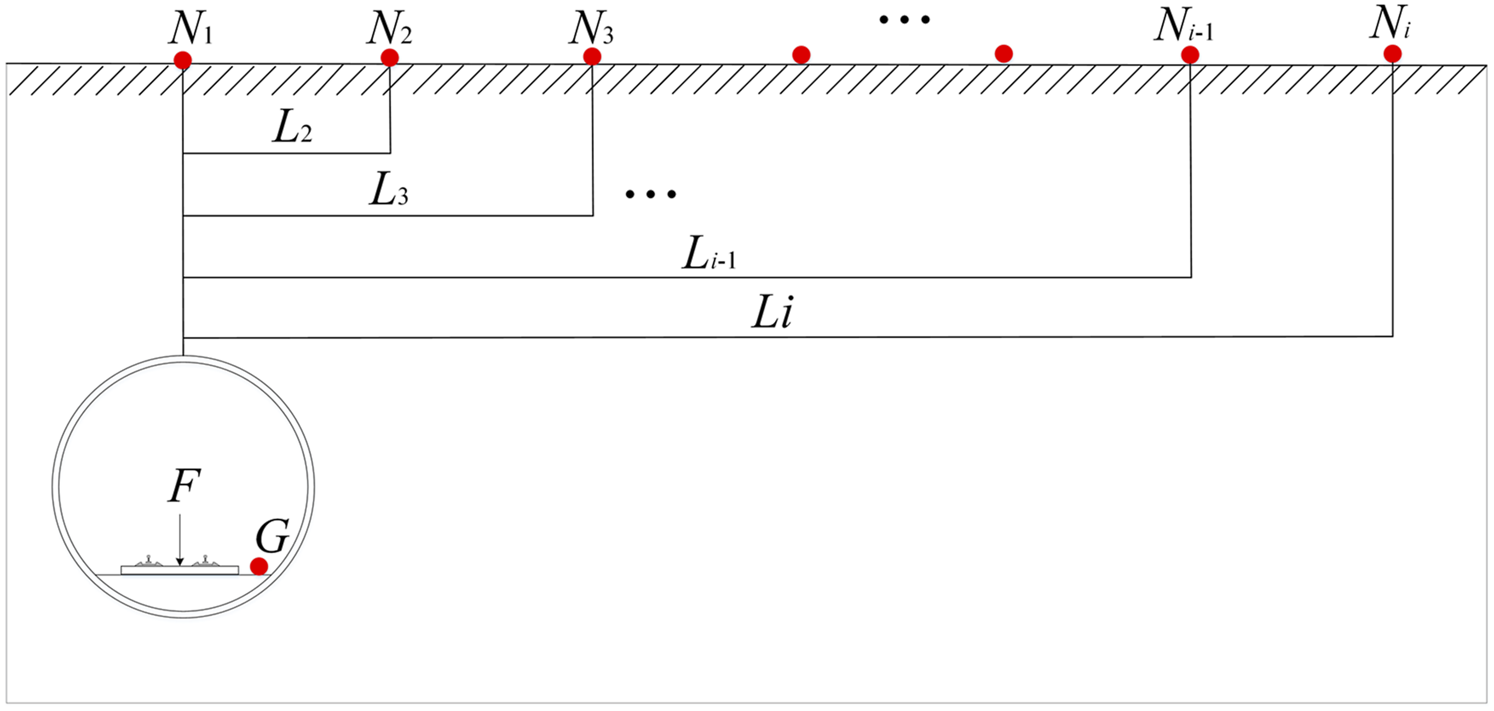
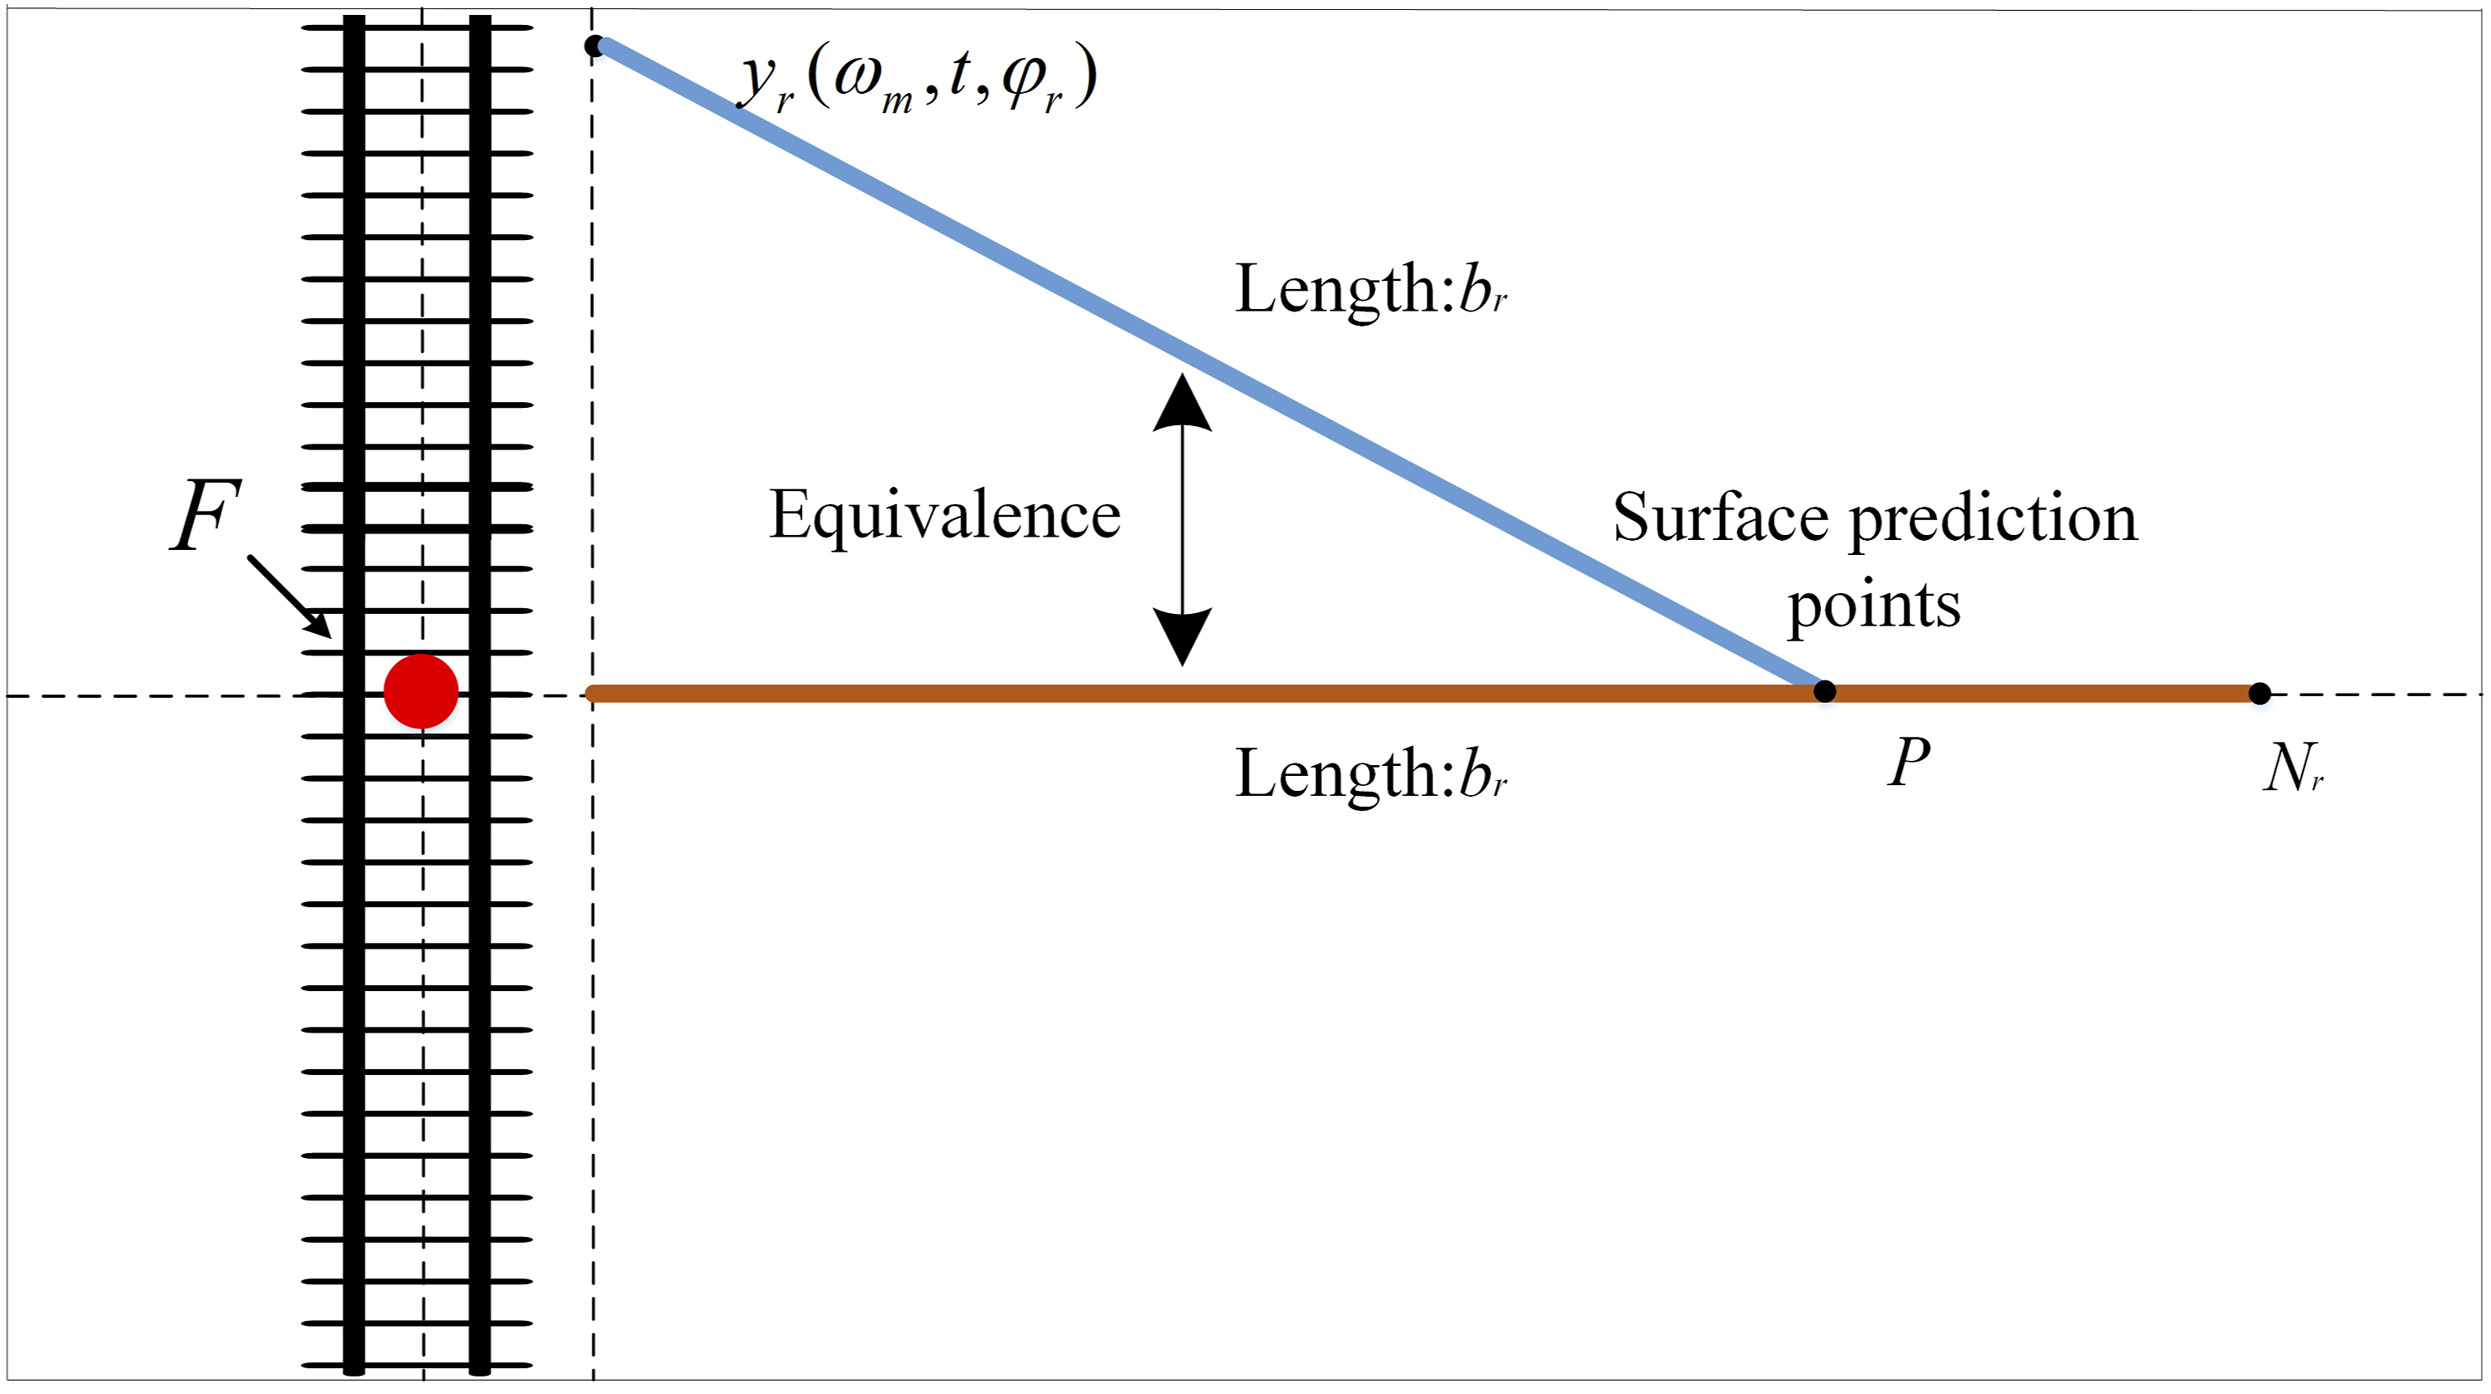
The acceleration time history of each frequency band (ii) The transfer ratio of each frequency band signal from the near point (iii) Another vibration signal (iv) A single excitation point and the surface multi-point sampling mode are adopted for the in situ hammer excitation test (Figure 1). Because the changes in the stratum property within a certain distance are small, the equidistant transformation of transmission between actual train operation and the hammer excitation test is considered, as shown in Figure 3. The schematic diagram of acceleration time history decomposition. The equidistant transformation of transmission.


The vibration transfer ratio from the vibration action point

Moreover, the transfer ratio (v) The time histories


Then, the final vibration acceleration time history of the ground prediction point

The flowchart of the proposed prediction method is shown in Figure 4. The flowchart of the proposed prediction method.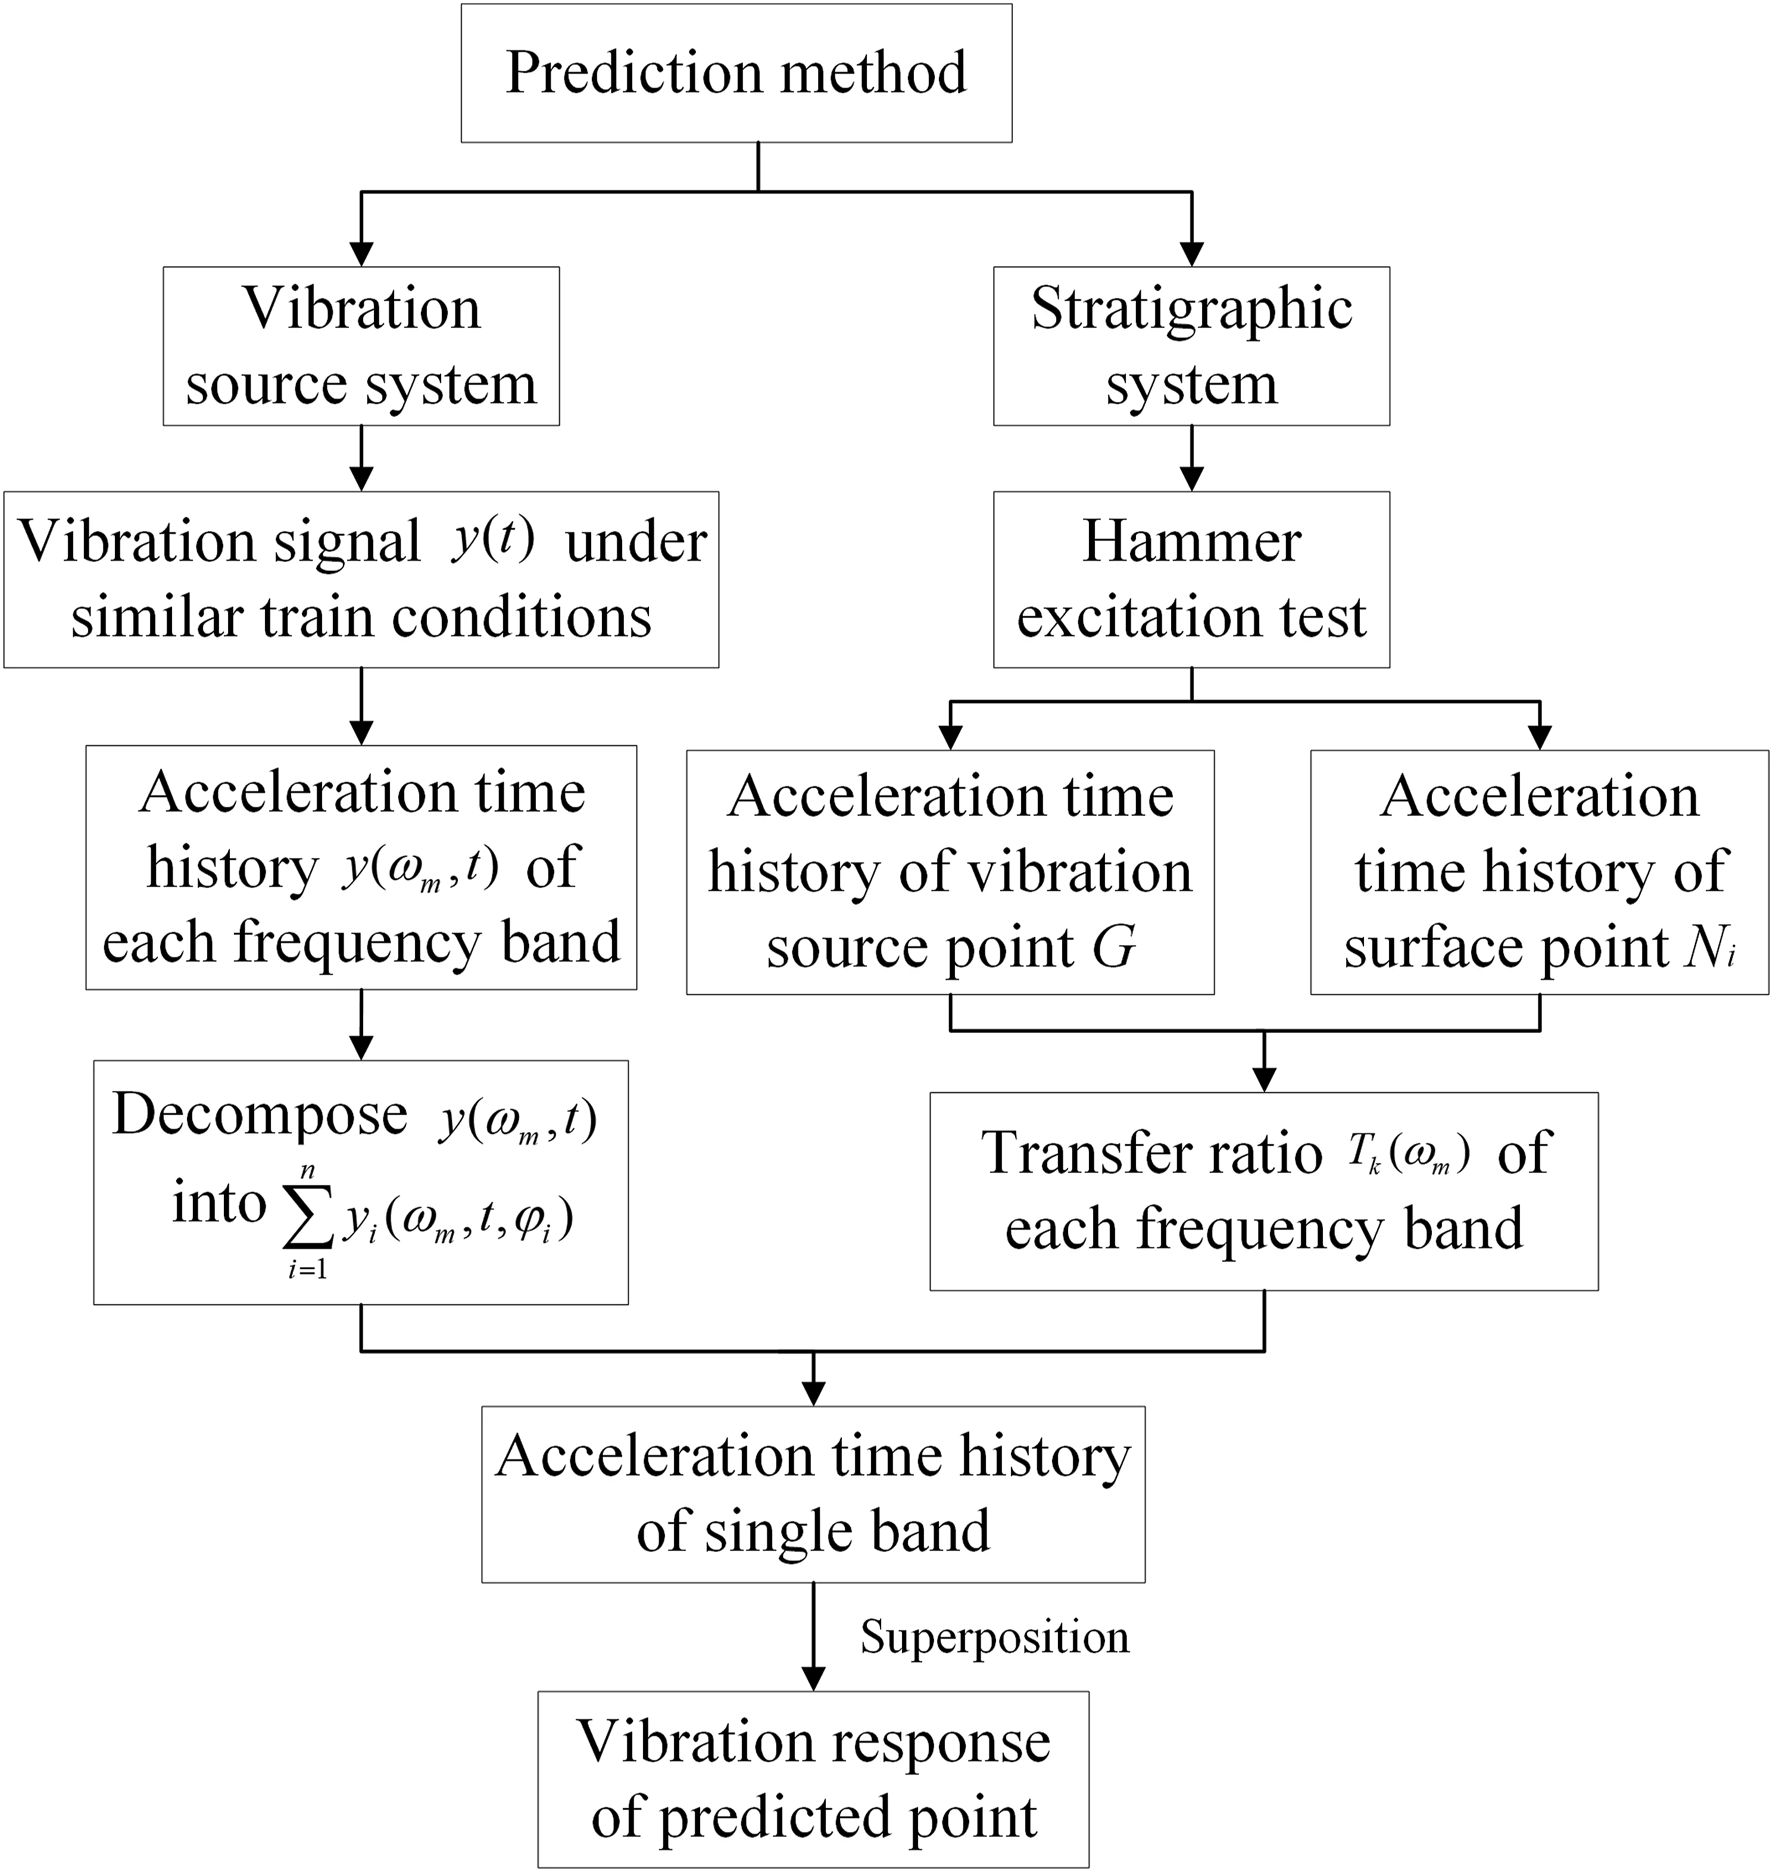
Field excitation test
The core of the prediction method is to efficiently and accurately obtain the ground vibration transmission data via an in situ field excitation test, and then to apply these data to ground vibration prediction, which can greatly improve the accuracy of the prediction method.
General information about the test
An extensive hammer excitation field test was carried out at a site in Shijiazhuang, which is located on the newly established high-speed line N6 between Beijing and Hebei, China. The total length of the underground tunnel line is 4980 m, and the depth of the tunnel at the test site is 22 m. The high-speed line consists of two ballastless tracks with continuously welded rails that are supported every 0.6 m by an elastic fastener on monolithic concrete sleepers. The train that operates on the line is train CRH6, the target speed of which is 250 km/h. At the time of the test, the tunnel had been completed and the train had not yet been put into operation.
The spatial relationships of the tunnel and the layout of the measurement points are shown in Figure 5. It is necessary to obtain the vibration transmission law on the transmission path in as much detail as possible to consider the equidistant transformation of transmission between actual train operation and the excitation test. Therefore, considering the influence range of vibration caused by train operation, and to ensure the accuracy of the calculation results, the measurement points were arranged on the surface every 5 m over a range of 40 m. One measurement point was also arranged on the track slab of the tunnel. The spatial relationships of the tunnel and the measurement points (a) section drawing; (b) plane drawing.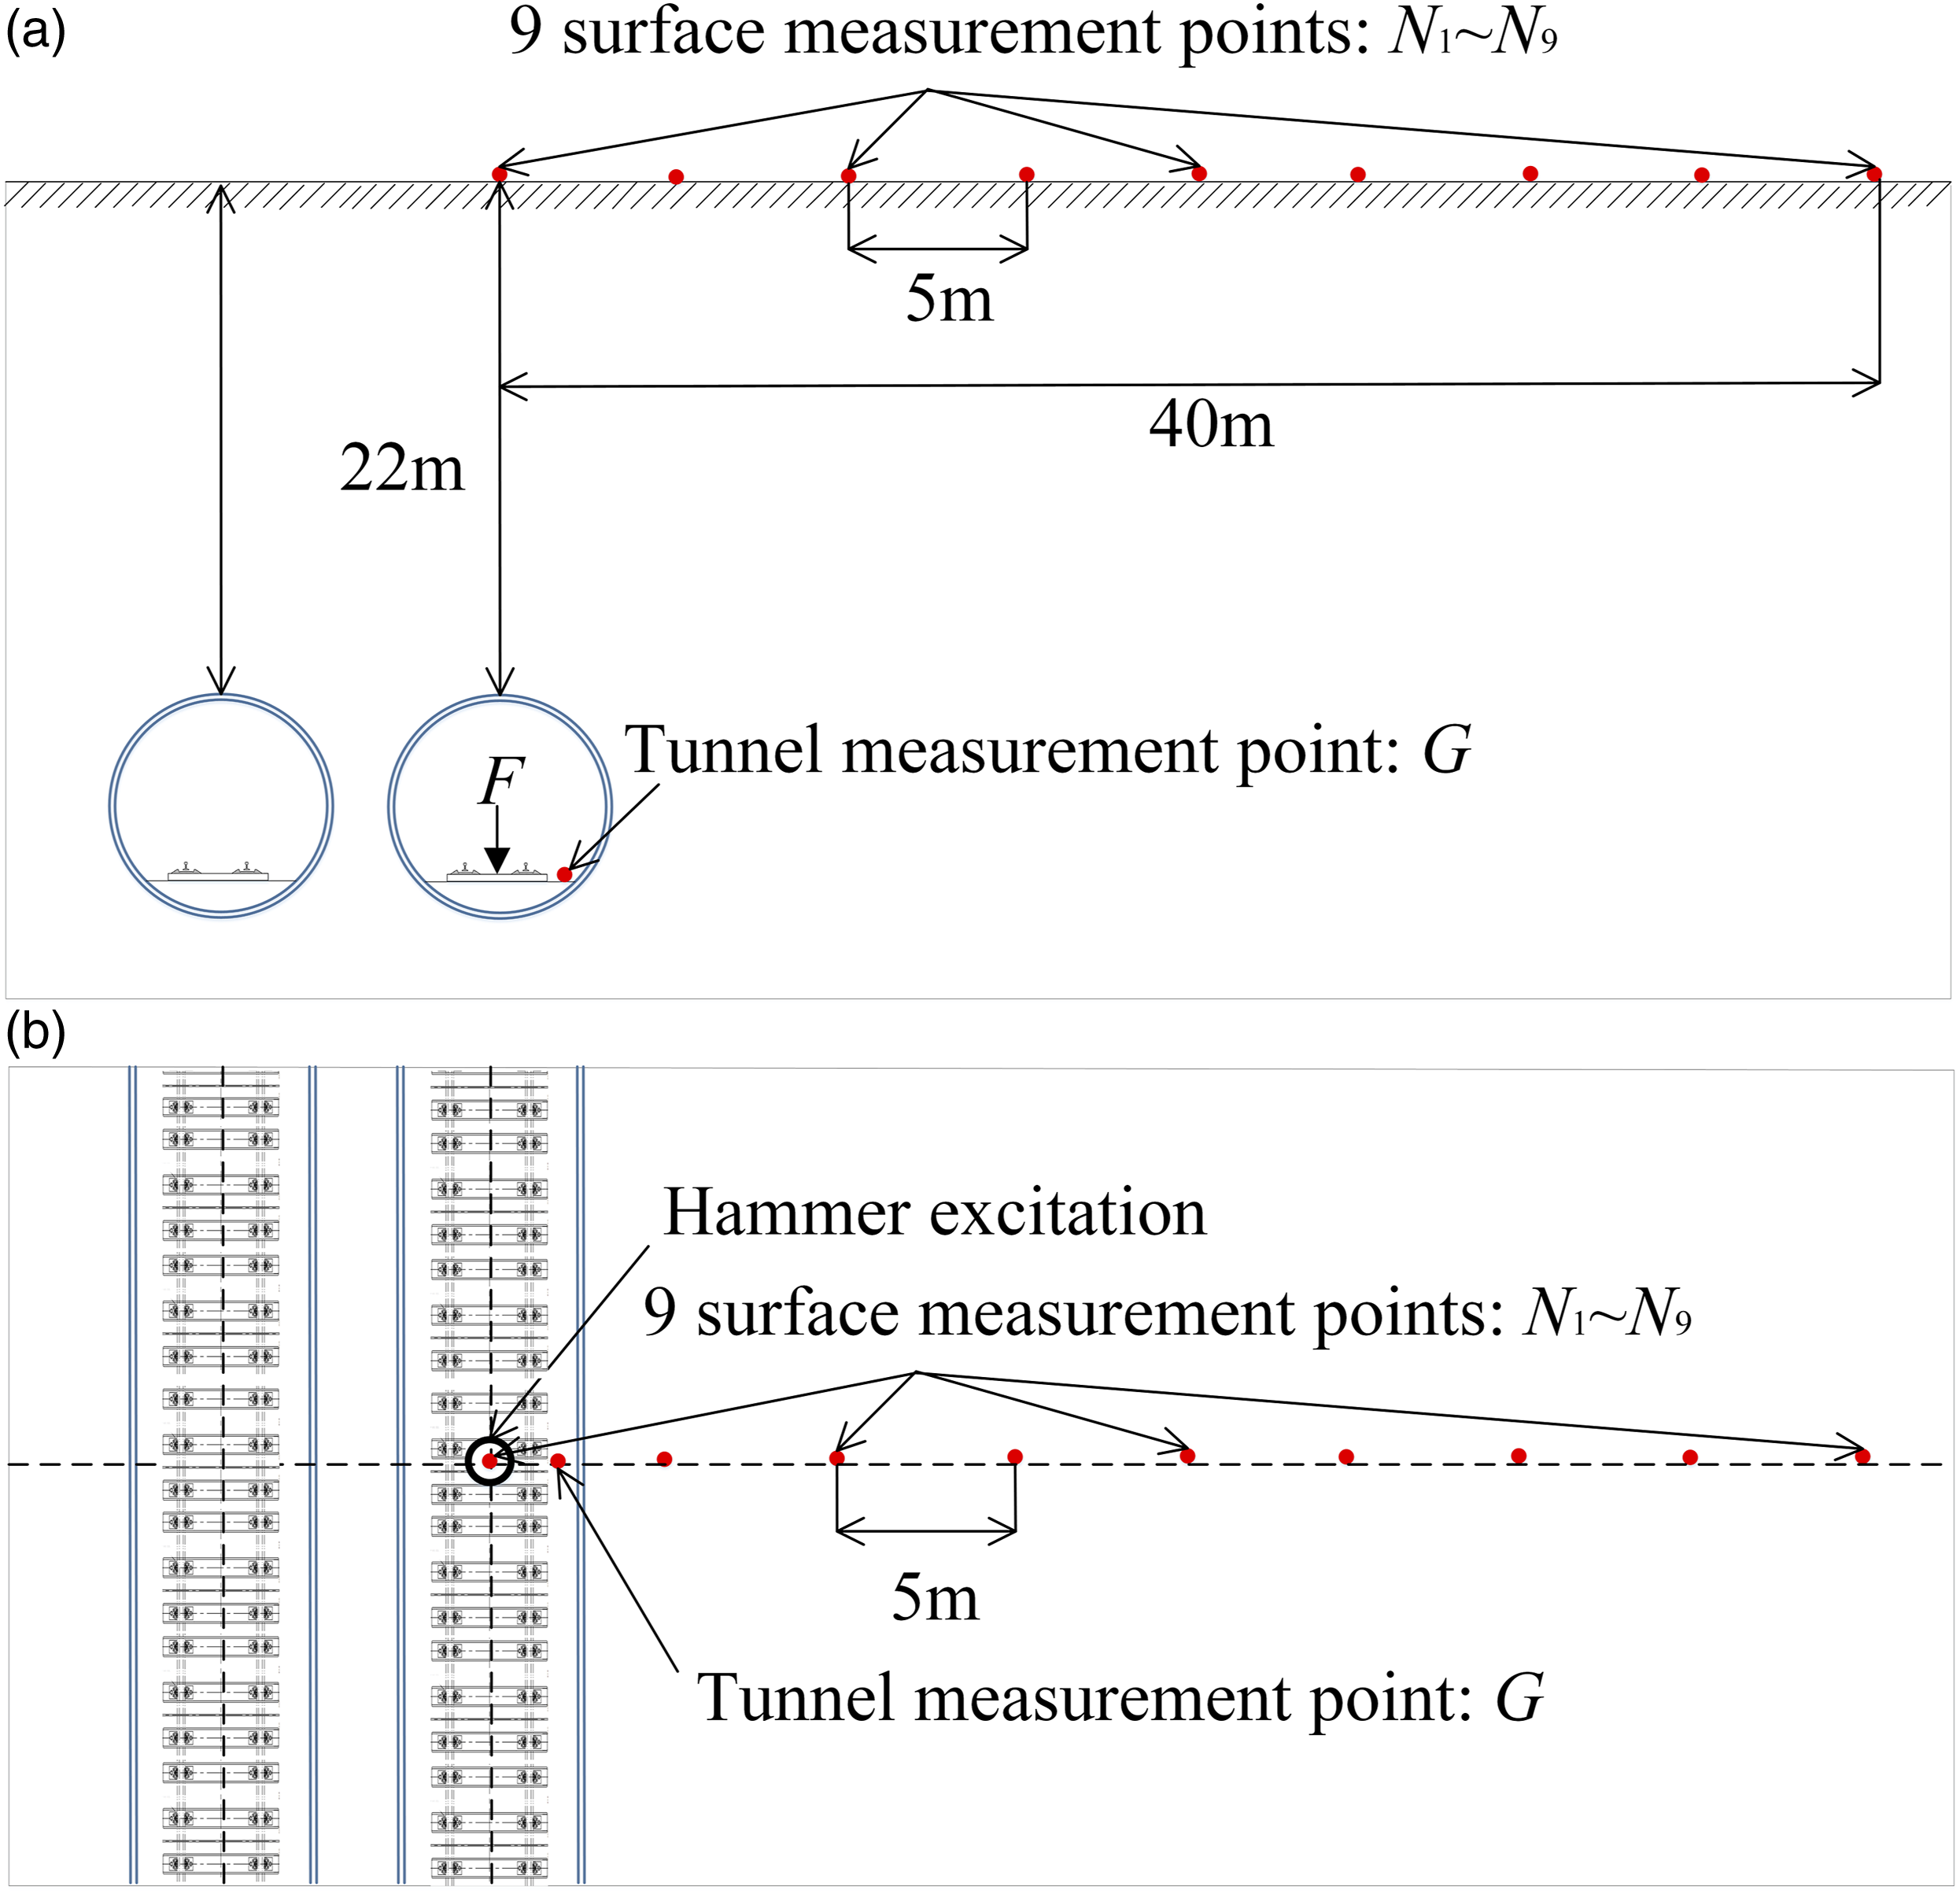
The excitation force should be large enough to clearly transmit the vibration signal to the surface. Therefore, a 50 kg hammer device with a rubber head was lifted by 20 cm and then dropped freely to the center of the concrete sleeper, which produced a pulse excitation with a peak value of about 40 kN to stimulate an effective surface vibration response. In this case, the excitation was far greater than the background vibration, and met the signal-to-noise ratio (SNR) requirements. Based on previous studies, the vibration caused by trains is mainly vertical vibration, and the horizontal vibration is far less than the vertical vibration. Therefore, vertical acceleration sensors were arranged at each measurement point to synchronously sample the force signal and ground vibration response with high precision.
During a hammer excitation test, it is necessary to ensure that there is no obvious vibration interference source nearby. The vibration signal acquisition equipment used for the test was an INV3018 acquisition instrument manufactured by the Beijing Dongfang Institute of Vibration and Noise Technology. Moreover, the 941B ultra-low frequency vibration sensor manufactured by the Institute of Engineering Mechanics, China Seismological Bureau, was adopted as the acceleration sensor. Continuous excitation acquisition was adopted for the test, and the sampling frequency was 512 Hz. Each group of data was excited 10 times, and each trigger ensured that the excitation force was about 40 kN. At least 10 groups of effective data were collected for average processing. The layouts of the hammer excitation and measurement points are shown in Figure 6. The hammer excitation test (a) the hammer excitation; (b) the surface measurement points.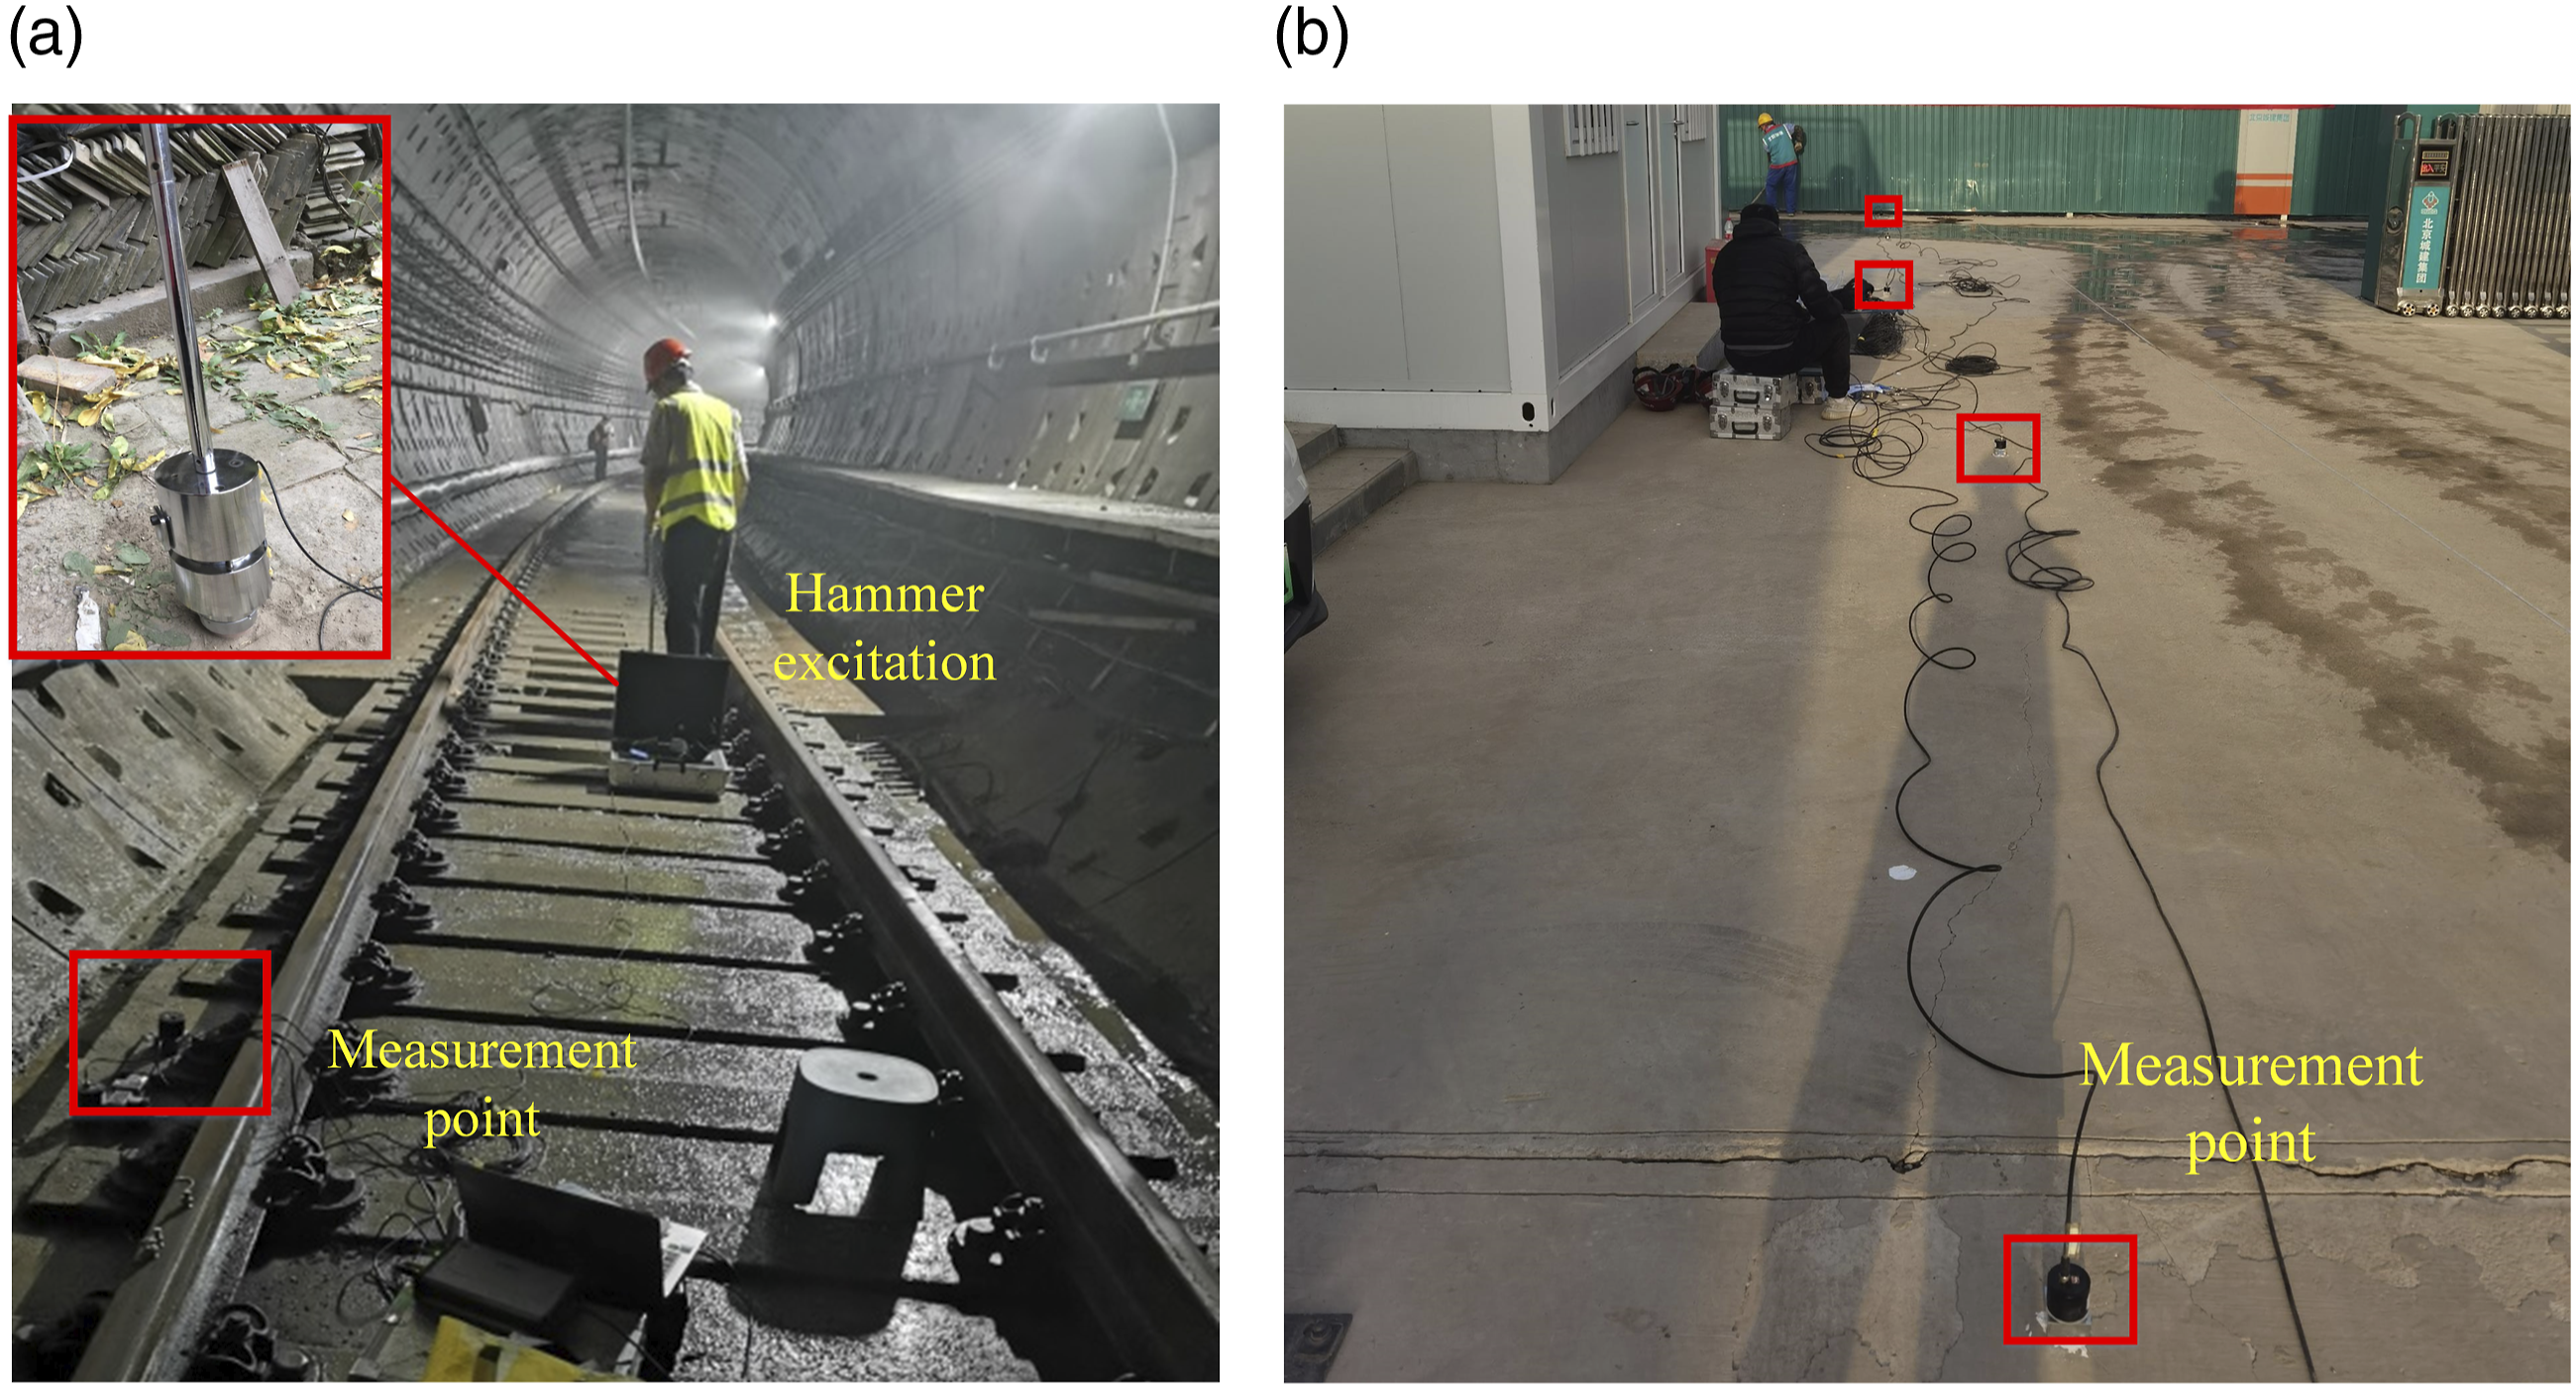
Test results
The time history and spectrum curves of the excitation force in the tunnel are shown in Figure 7, from which it can be seen that the amplitude of the hammering force was in the range of 35–40 kN, and the excitation frequency was evenly distributed in the range of 0–100 Hz. This can meet the frequency requirements of the vibration caused by underground high-speed railways. Apart from the frequency content, the intensity/envelope function of the vibration is also an important parameter for the prediction of underground high-speed railway-induced vibration.
26
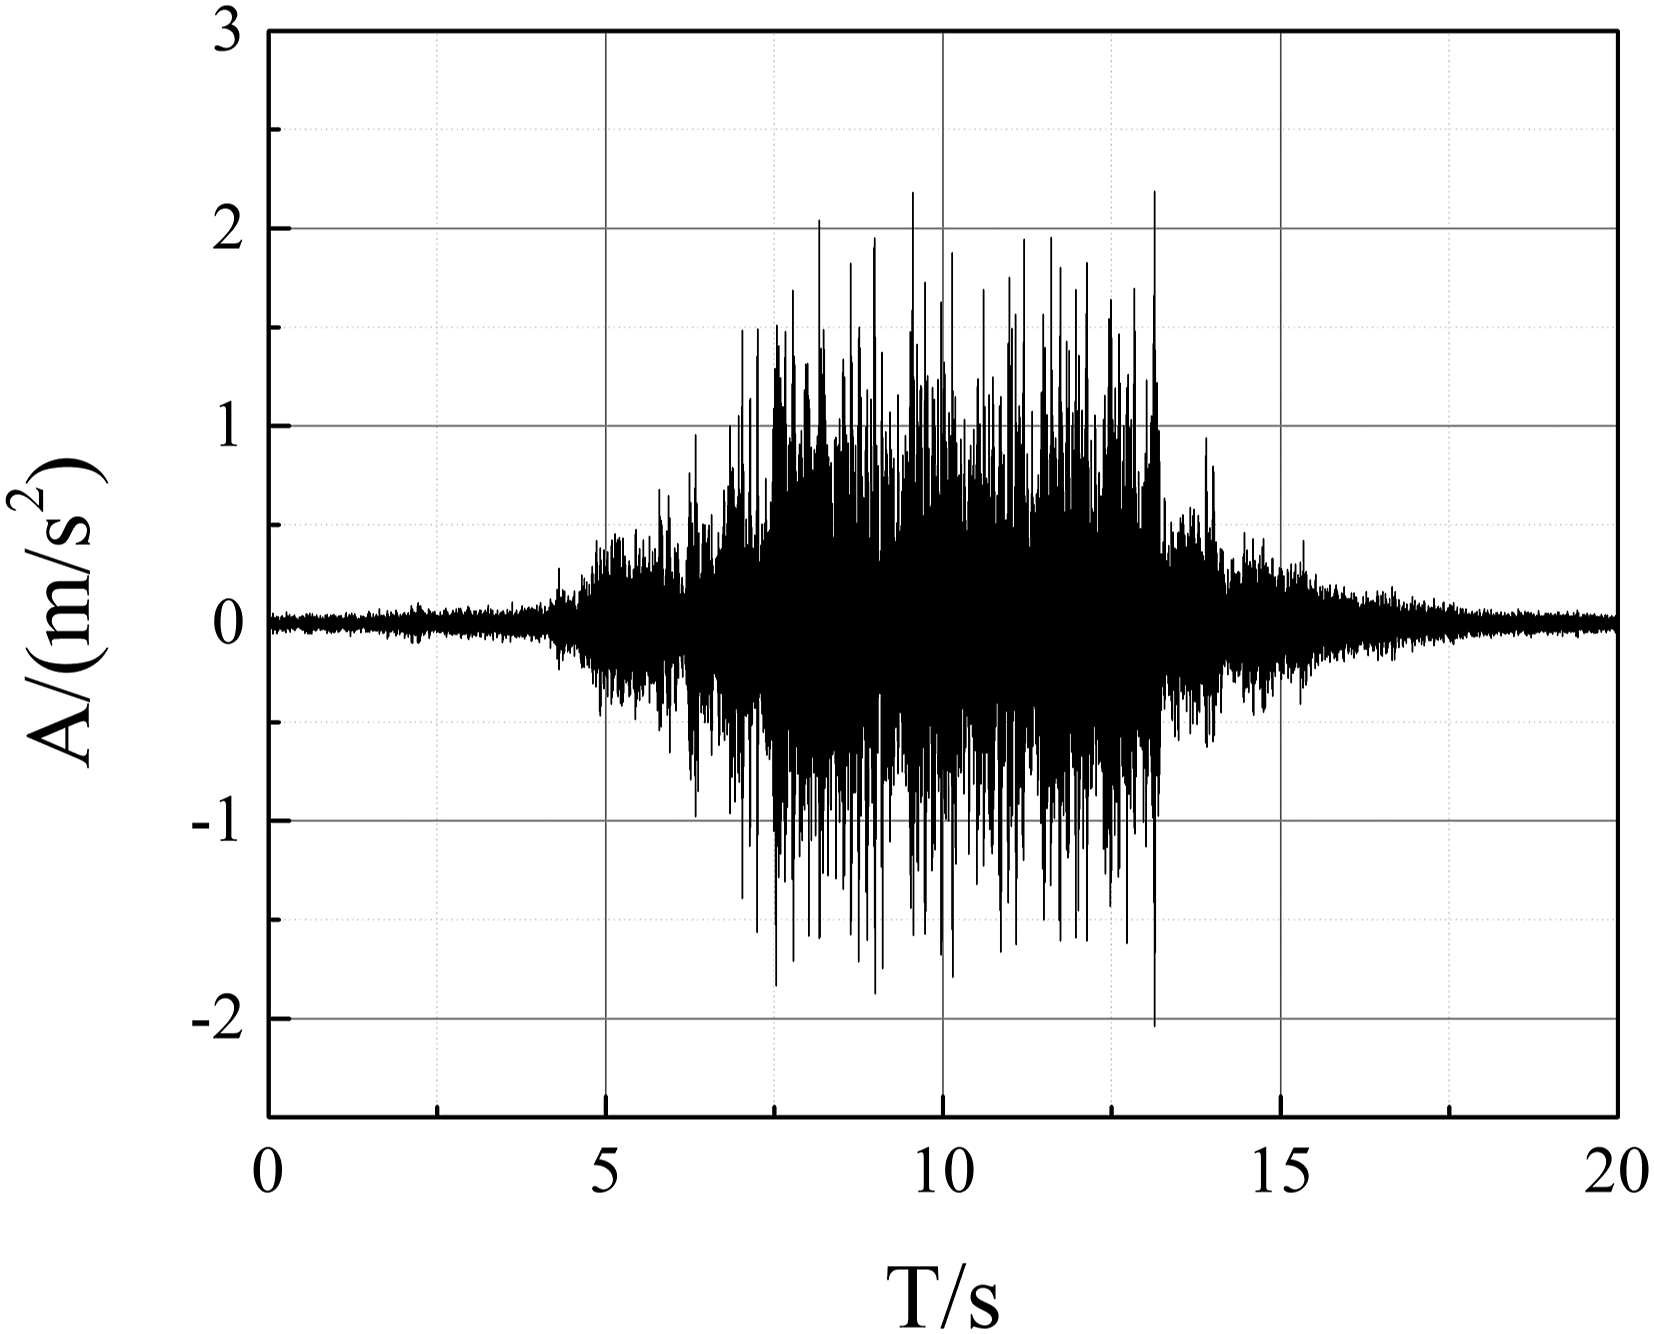
Different signal intensities determine the vibration transmission ratio results. The typical acceleration time history and spectrum of each measurement point under hammer excitation are respectively presented in Figures 8 and 9. It can be seen that the vibration response of the measurement point in the tunnel was the most significant because of its close distance to the vibration source, and obvious vibration signals were detected at all the measurement points on the ground. With the increase of the distance from the vibration source, the vibration response tended to gradually weaken. The time history and spectrum curves of the vertical excitation force (a) the time history curve; (b) the spectrum curve. The typical vertical acceleration time histories of the measurement points (a) tunnel; (b) 0 m; (c) 10 m; (d) 20 m; (e) 30 m; (f) 40 m. The typical vertical acceleration spectra of the measurement points (a) tunnel; (b) 10 m; (c) 20 m; (d) 40 m.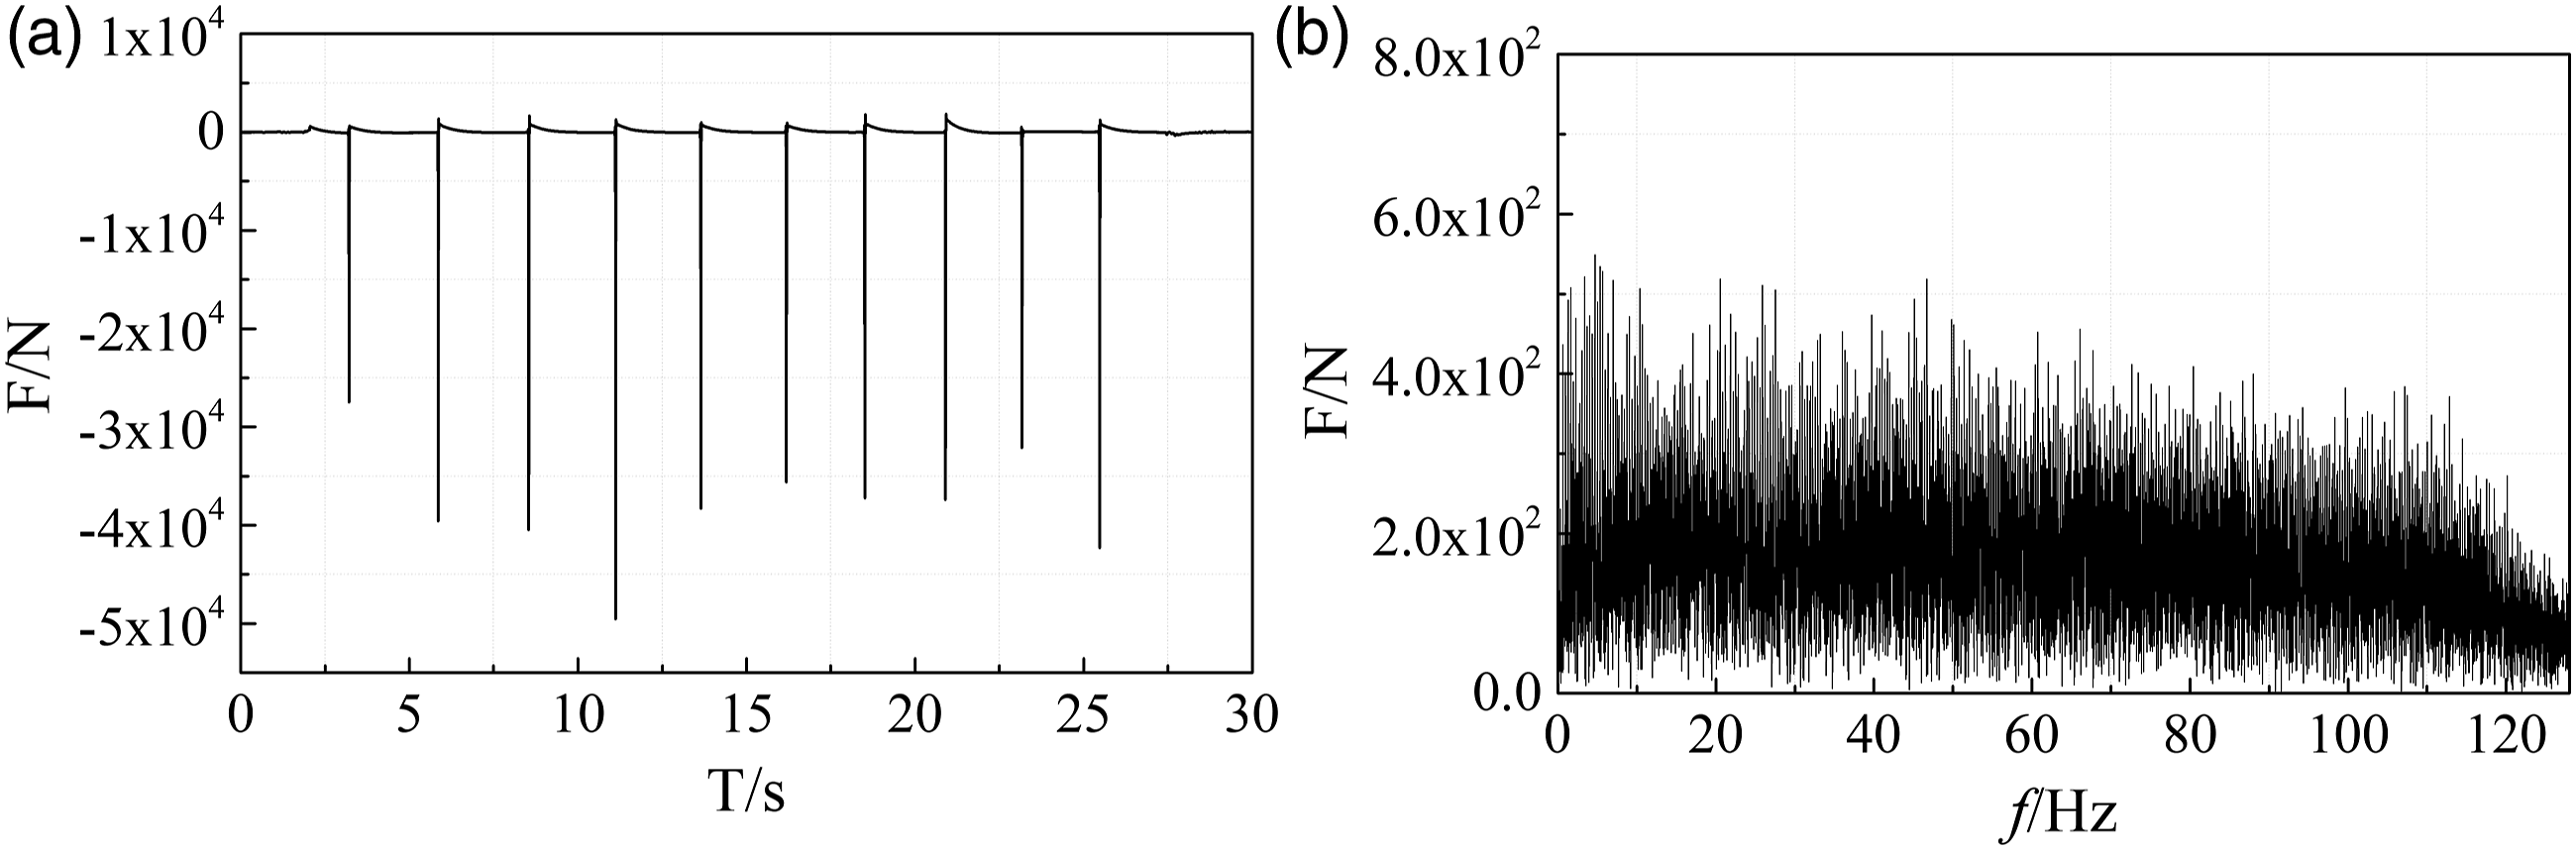
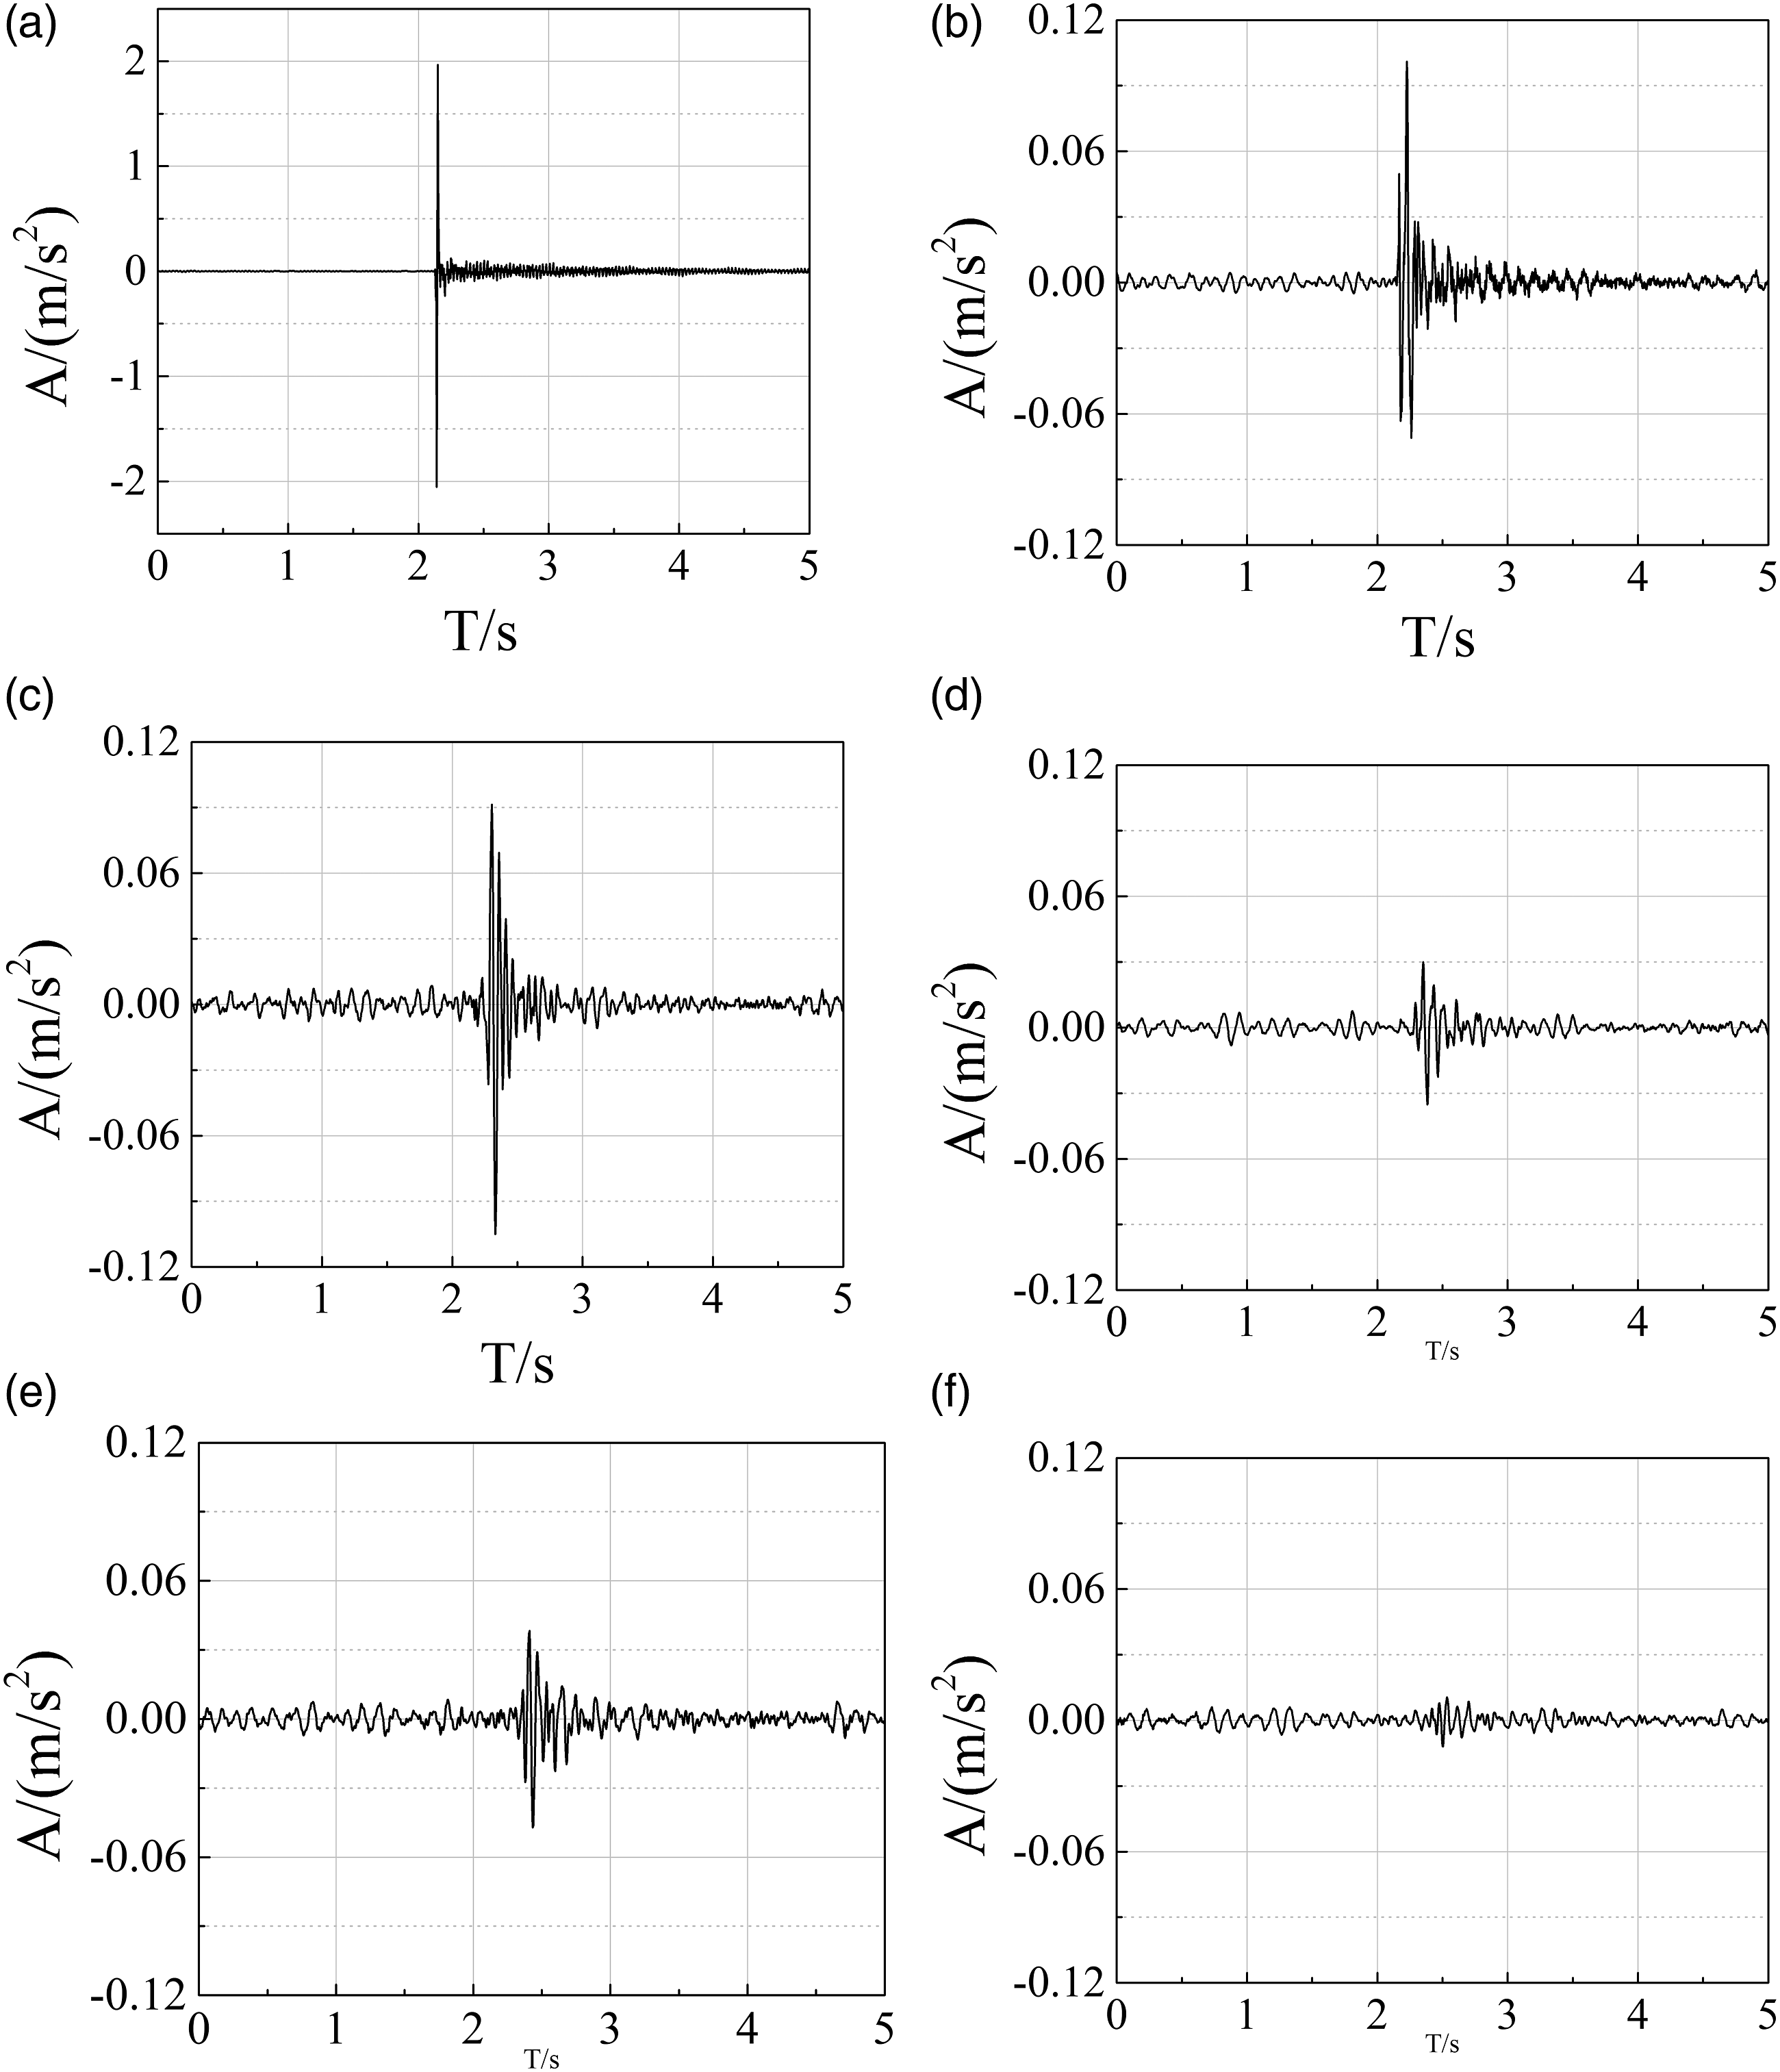
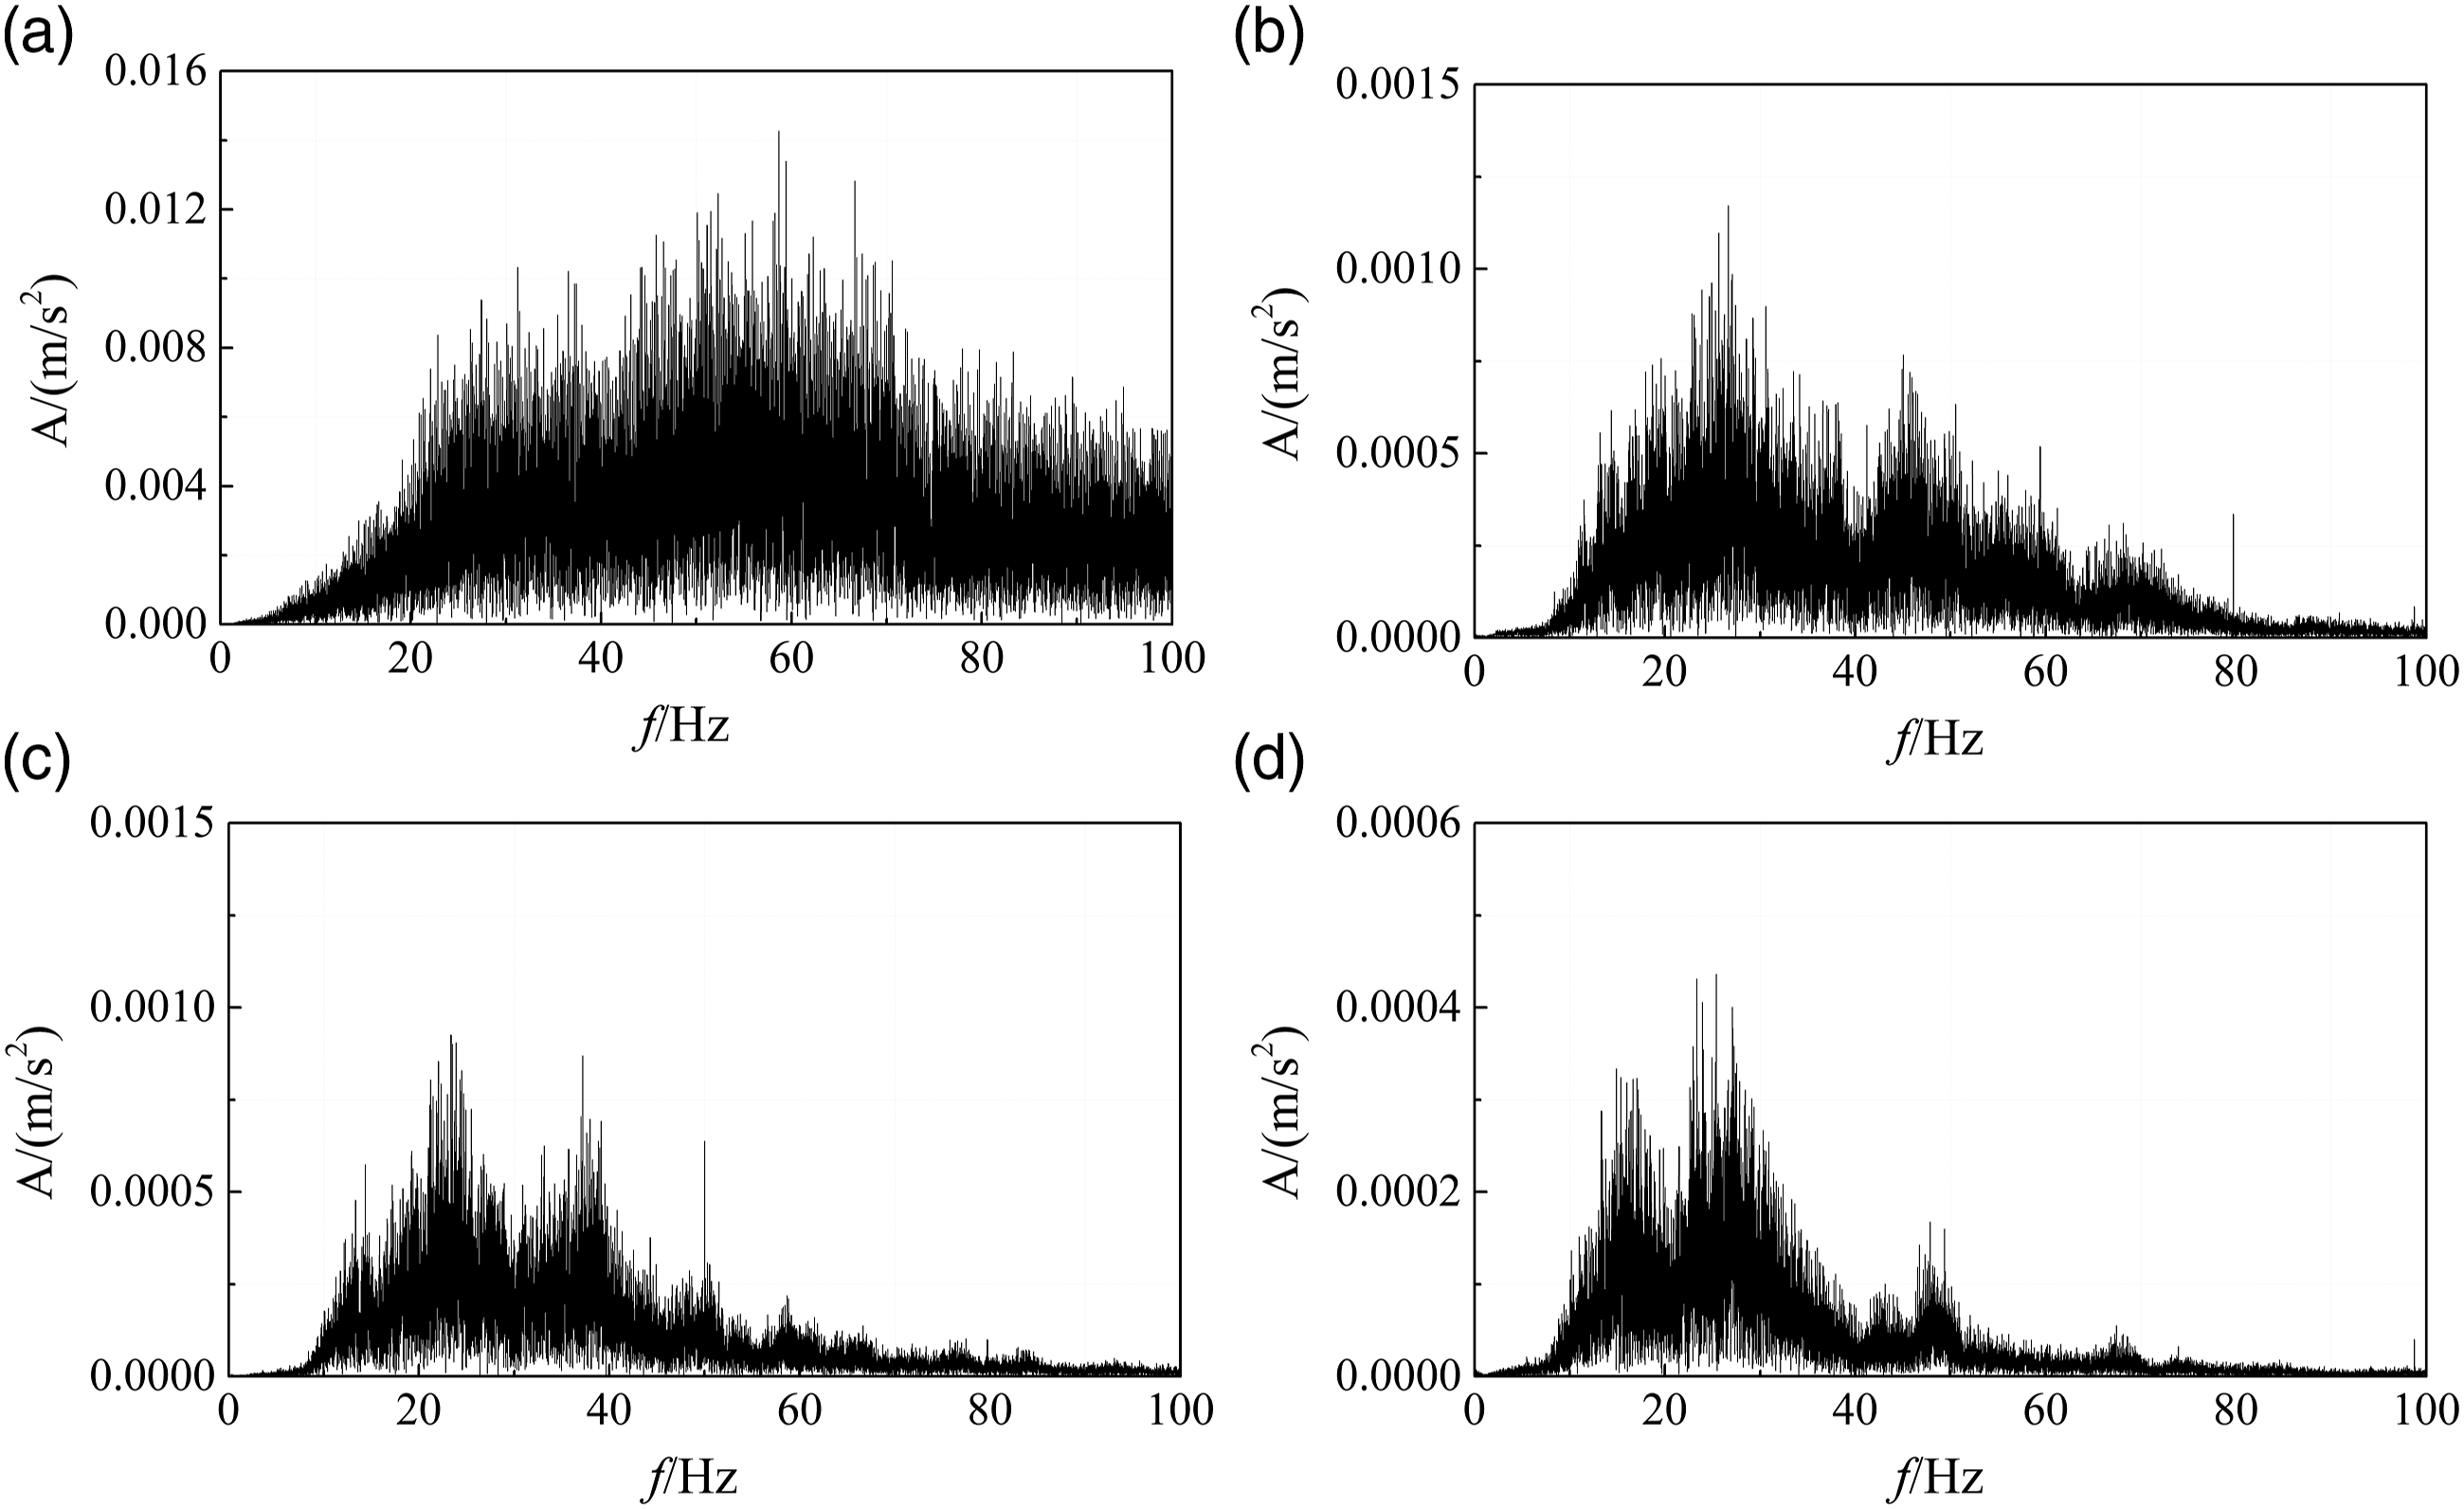
It can be seen from the spectrum chart that the dominant frequency band of the acceleration of the tunnel measurement point induced by hammer excitation was 20–80 Hz. Because of the long distance from the ground measurement point to the vibration source, the vibration energy was found to attenuate during the transmission process, especially in the high-frequency band.
Vibration source system analysis
According to the steps of the prediction method proposed in section 1.2, it is necessary to accurately obtain the vibration acceleration time history of the tunnel measurement point
Coupled train-track system
In consideration of the parameters of the CRH6 high-speed railway, a four-car formation was considered in the calculation, and each car included one train body, two bogies, and four pairs of wheelsets. The components of the train carriage also included linear springs and viscous dampers. One linear spring and one viscous damper in the X-, Y-, and Z-directions were, respectively, set on the left and right sides of each bogie. The front and rear bogies were connected with a corresponding wheelset by springs and dampers. There was one linear spring and one viscous damper in the X-, Y-, and Z-directions on the left and right sides of each wheelset. The rail was simplified as an infinite Euler beam, the sleeper was simplified as a mass block, and the fastener and under-rail support were simplified as spring damping components. Hertz contact was adopted between the wheel and rail, and track irregularity was added on the rail surface as the excitation source.
27
The vehicle and track coupling model is shown in Figure 10. The model of the coupled train-track system.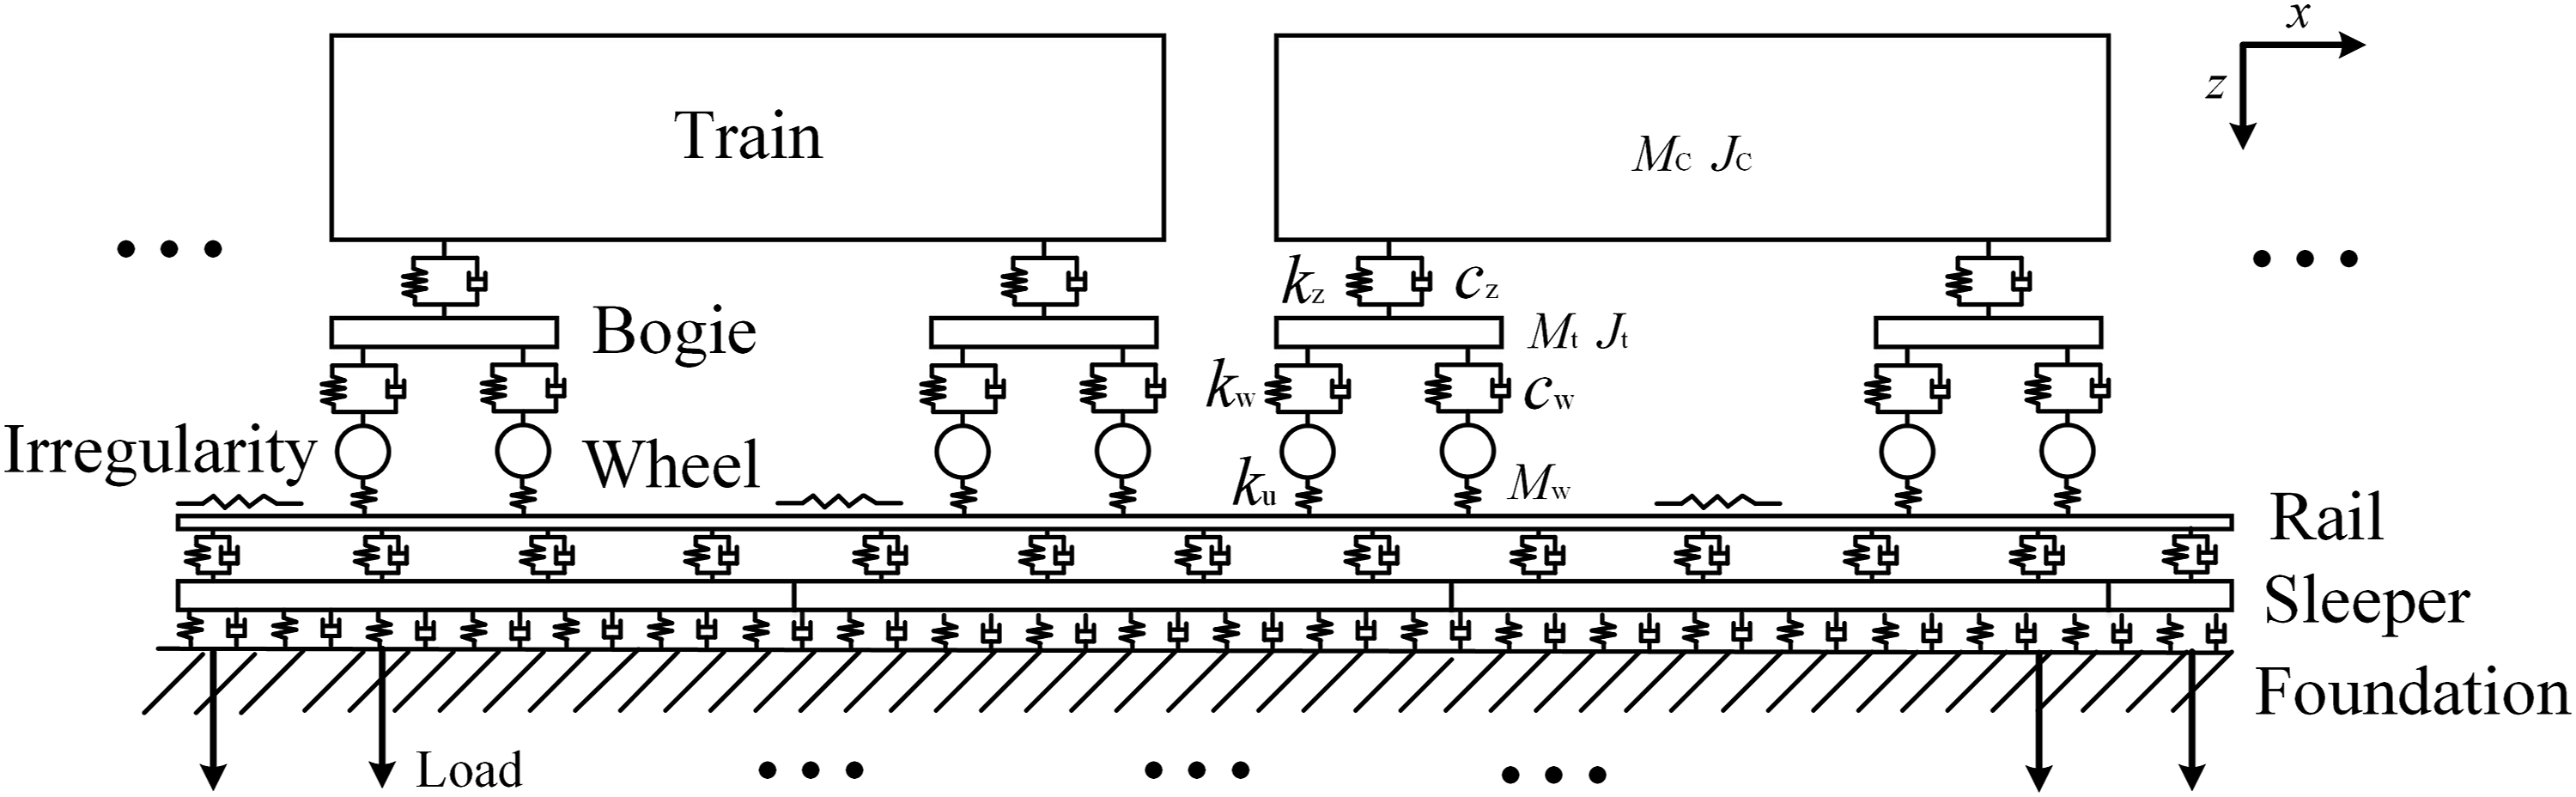
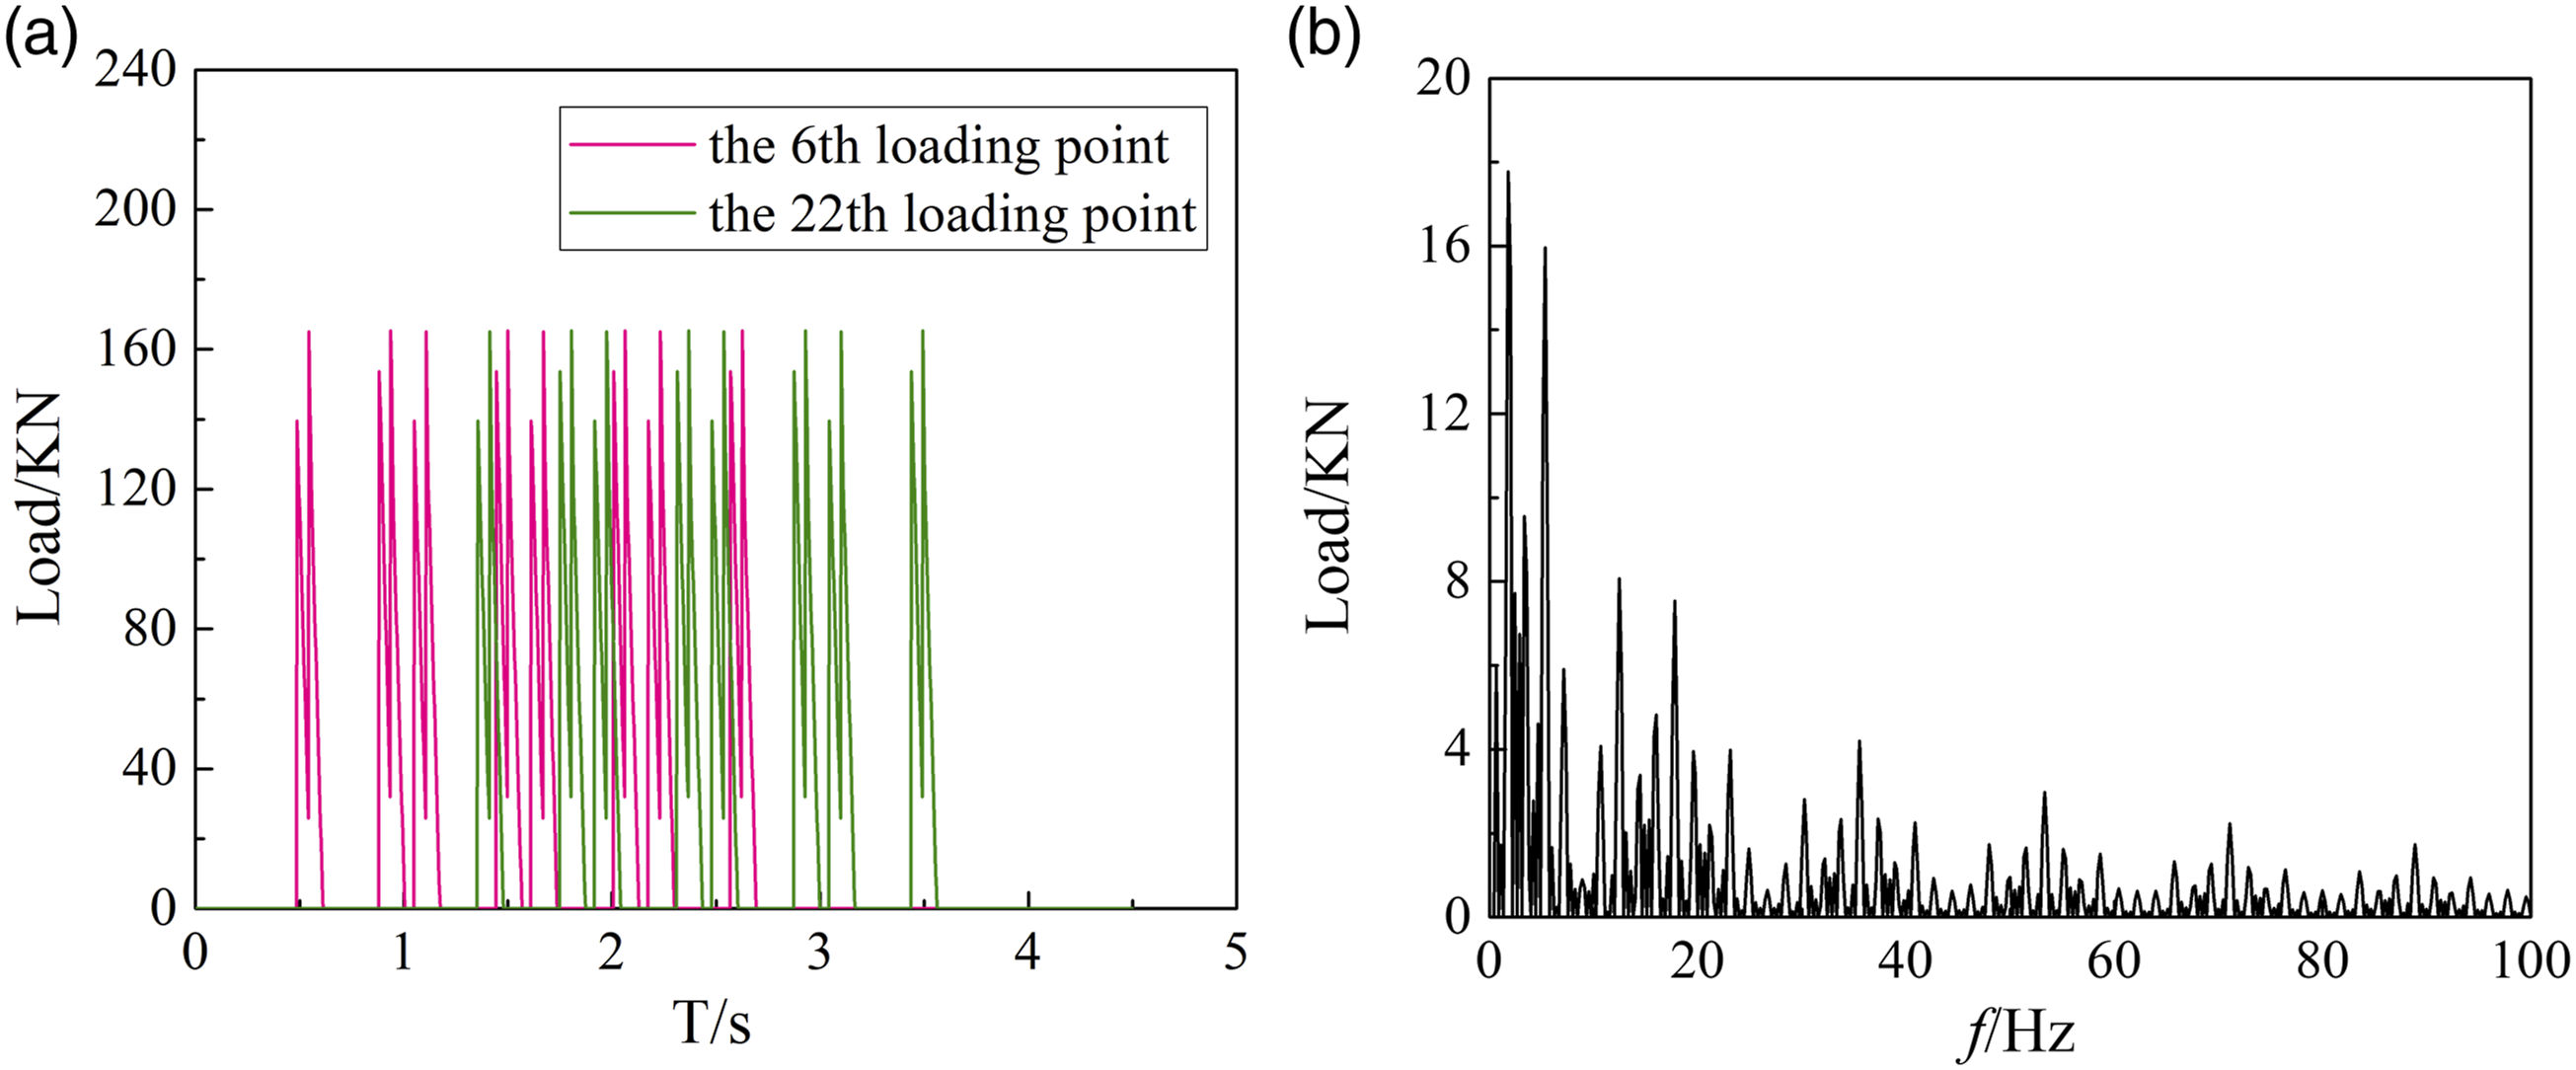
The vibration response caused by train operation was superimposed by multiple concentrated harmonic loads, and the changes caused by time and location factors were considered, as shown in Figure 11. The vertical concentrated load column matrix acting on the track plate was calculated by the coupled train-track model, and its time history and spectrum curve are presented in Figure 12. It was applied on the track plate as the excitation load. According to the number of carriages and the wheel-rail spacing of the train, the spacing between each load excitation point was 3 m, and a total of 33 loading points were considered along the train running direction. In this work, the integral time step was set to 1/256 s, and the 128 Hz vibration frequency calculation results were obtained. Regarding step loading, there were 900 loading steps, which can fully meet the accuracy requirements of vibration frequency calculation. The diagram of vertical harmonic loads. The vertical forces in the time and frequency domains (a) the time history; (b) the frequency spectrum.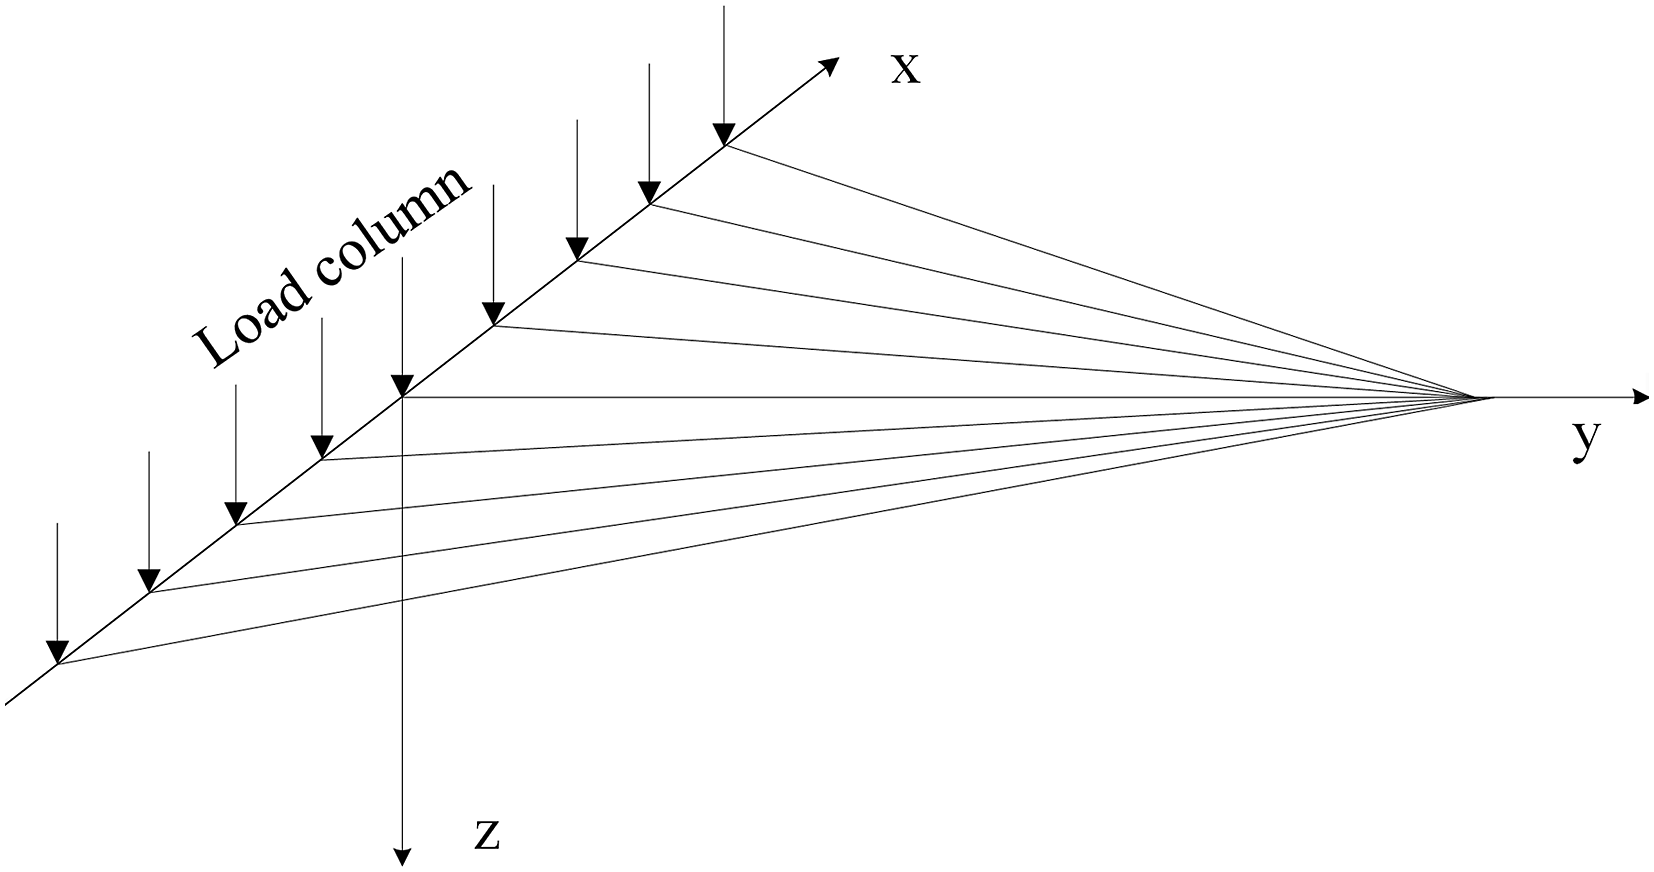
The finite element model
Dynamic model parameters.
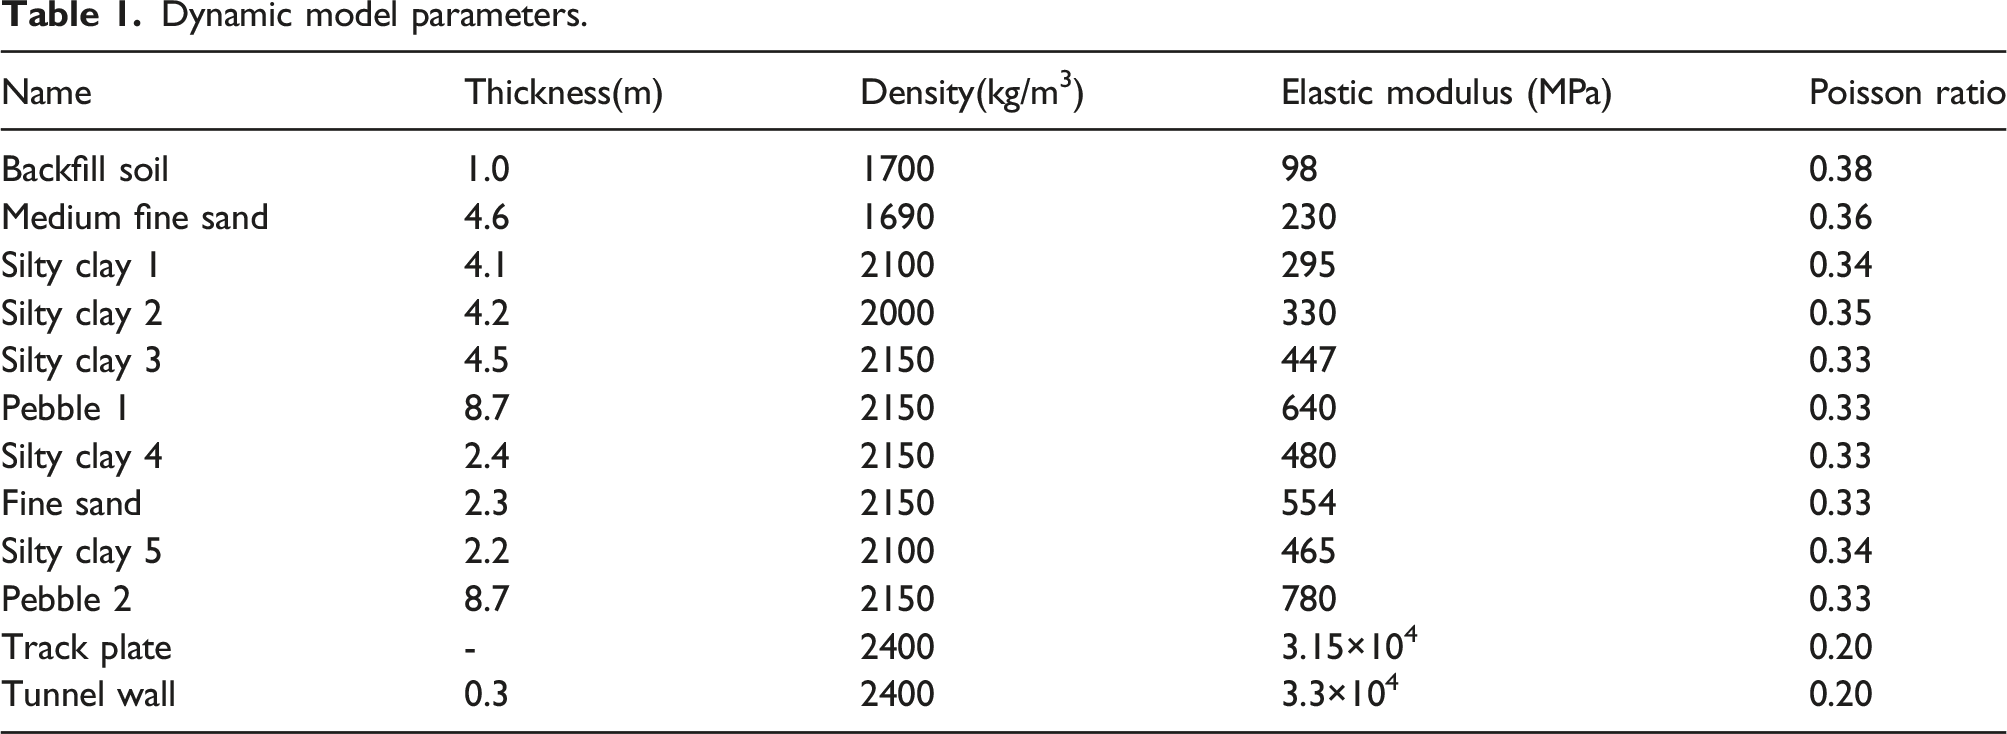
To prevent the distortion of the calculation results caused by the reflection of the boundary wave in the semi-infinite medium, artificial boundary conditions are usually set around the soil. In this study, a three-dimensional uniform viscoelastic artificial boundary was adopted.
28
The equivalent shear modulus 

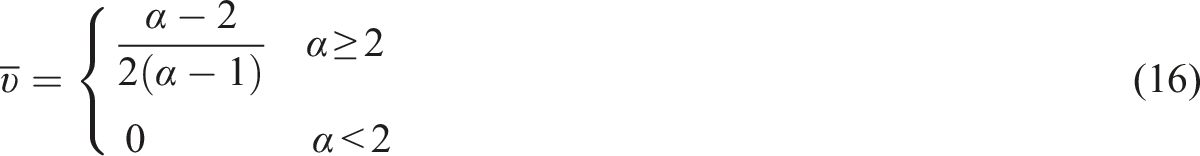
To ensure that the three-dimensional viscoelastic artificial boundary applied in this study could achieve good results, with reference to previous research, the thickness of the boundary element considered in this study was set as 0.5 m, the normal correction coefficient was 2/3, the tangential correction coefficient was 4/3, and the equivalent elastic modulus was 2.01 MPa; these parameters meet the accuracy requirements of the model.
Rayleigh damping was used to define the damping characteristics of the finite element model. It was assumed that the damping matrix of the system was a linear combination of mass matrix and stiffness matrix, namely

Equation (18) gives the relationship between the damping ratio, the mass matrix coefficient α, and the stiffness matrix coefficient β, where
In the dynamic analysis, the finite element mesh can accurately simulate the vibration wave transmission. The convergence study for the number of elements was presented to demonstrate the accuracy of the finite element model. When further element refinement did not affect the output results, it was considered that the element had converged. Combined with the requirements of the calculation accuracy and computer performance, the element mesh size in the final model was in the range of 0.5–1.5 m. The finite element model of the tunnel is shown in Figure 13. The finite element model of the tunnel.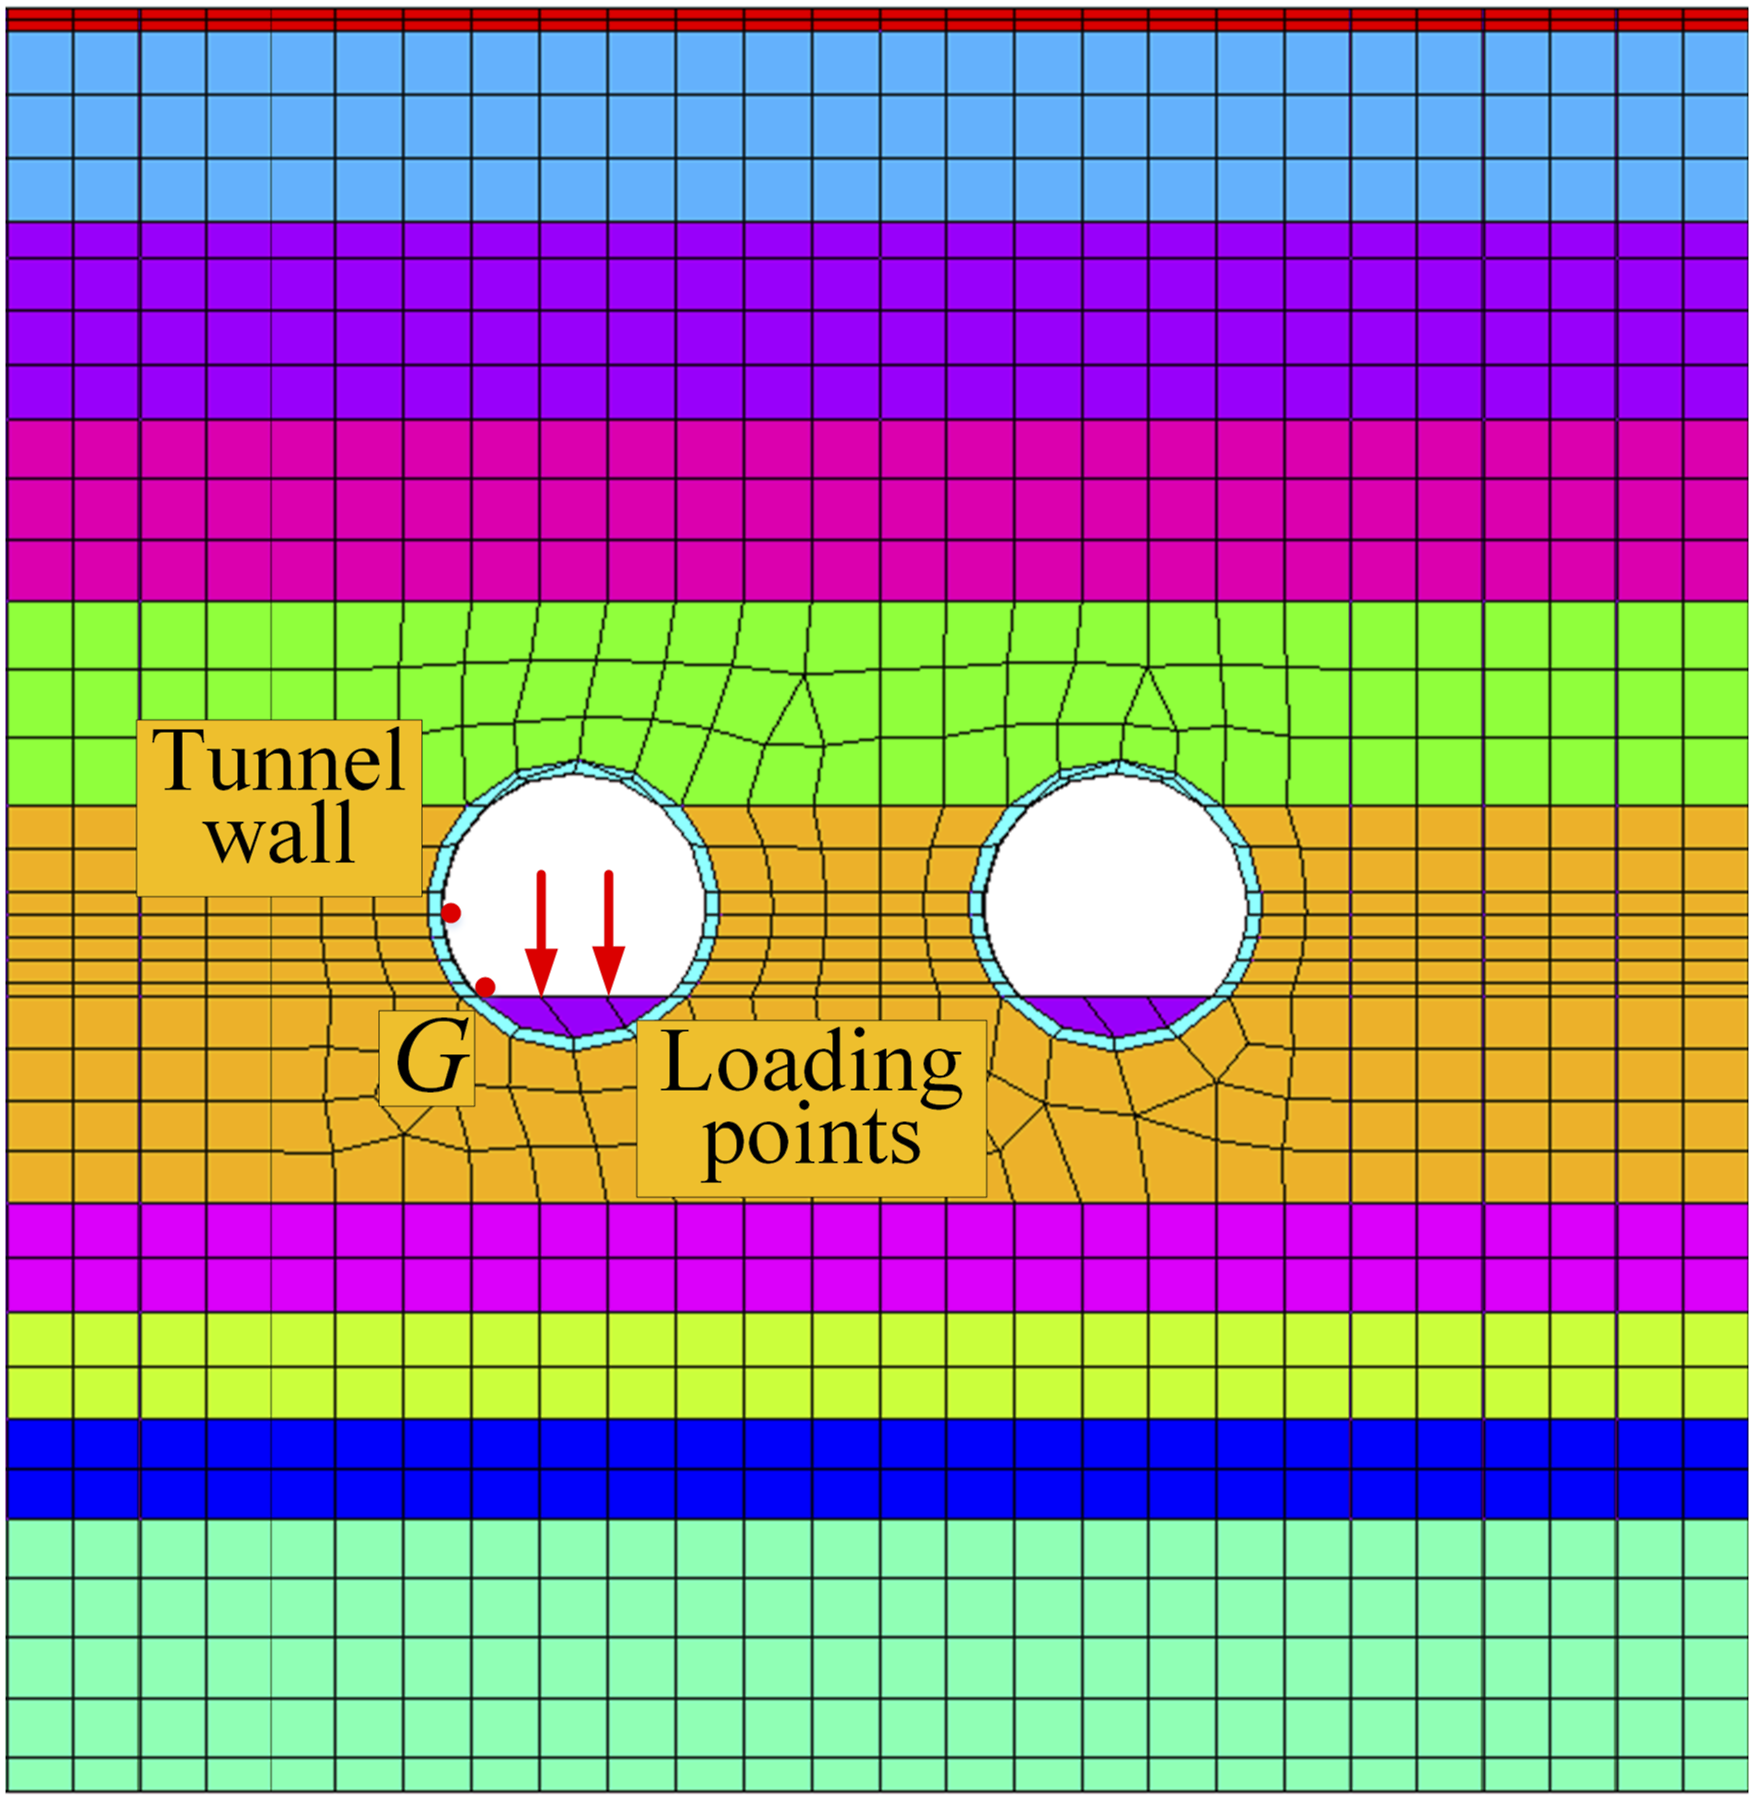
Near-point vibration response of the tunnel
After the train vibration source load was applied, the calculated vibration response of the tunnel wall was compared with the measured results (Figure 14); it was found that the vibration energies were equivalent and the frequency domain distributions were similar. The main frequency and vibration magnitude were basically the same. Figure 15 exhibits the calculated vibration acceleration time history of the near point The comparison of the acceleration frequency spectra. The vertical acceleration time history of tunnel measurement point G.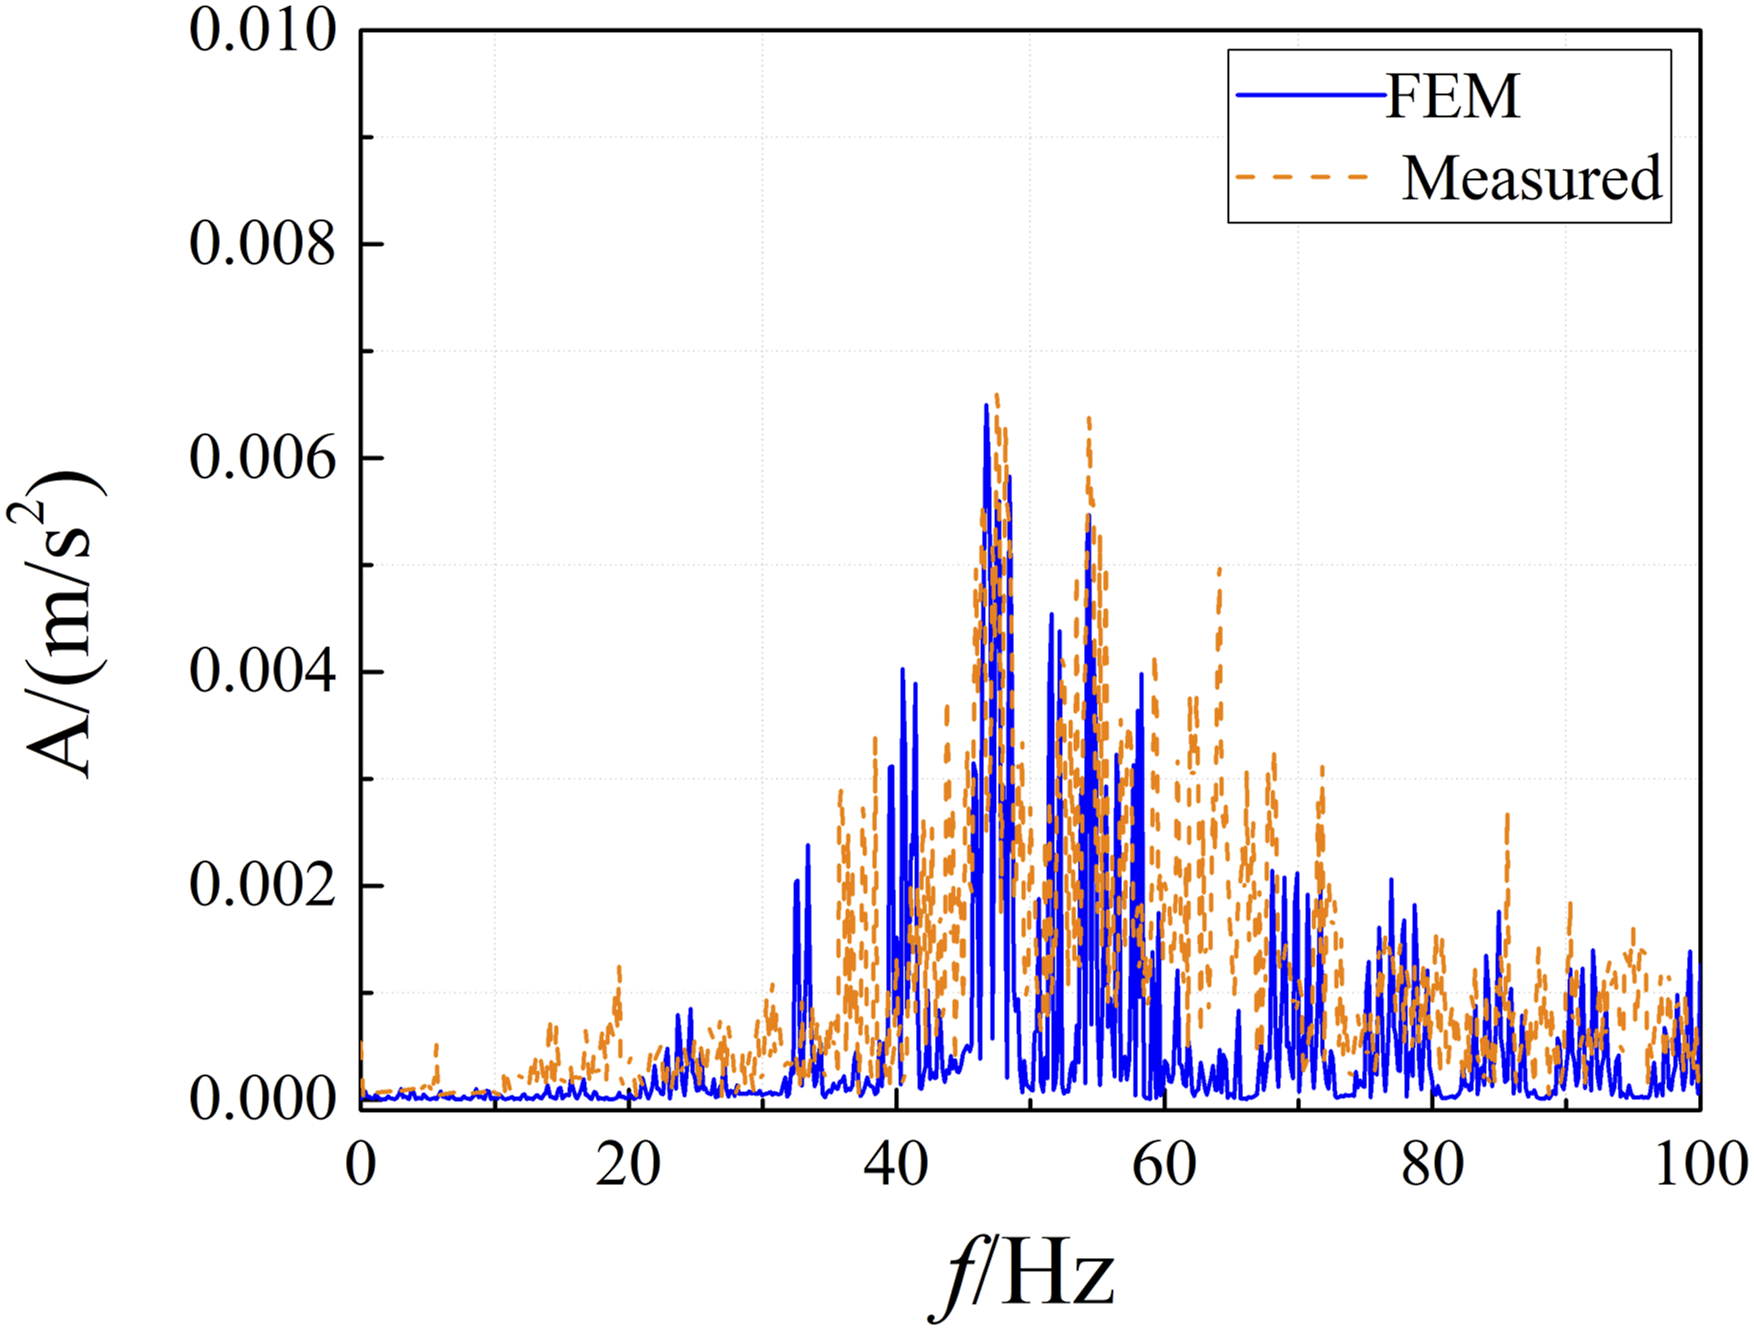
Prediction and verification of the vibration response
Transfer function based on a field test
The key step of the prediction method proposed in section 1.2 is to obtain the frequency transfer ratio between the measurement point near the vibration source and the ground prediction point. The acceleration time histories of tunnel measurement point G and the surface measurement points caused by hammer excitation obtained by the excitation field test were processed, and the acceleration time history curves of each frequency band were obtained. Because the vibration energy contained in a single frequency band is small, each frequency band was divided by 10 Hz to ensure the accuracy of the vibration transfer ratio. The acceleration time histories of typical frequency bands are shown in Figure 16. The vertical acceleration time histories of the measurement points at 40–50 Hz (a) tunnel; (b) 0 m; (c) 10 m; (d) 20 m.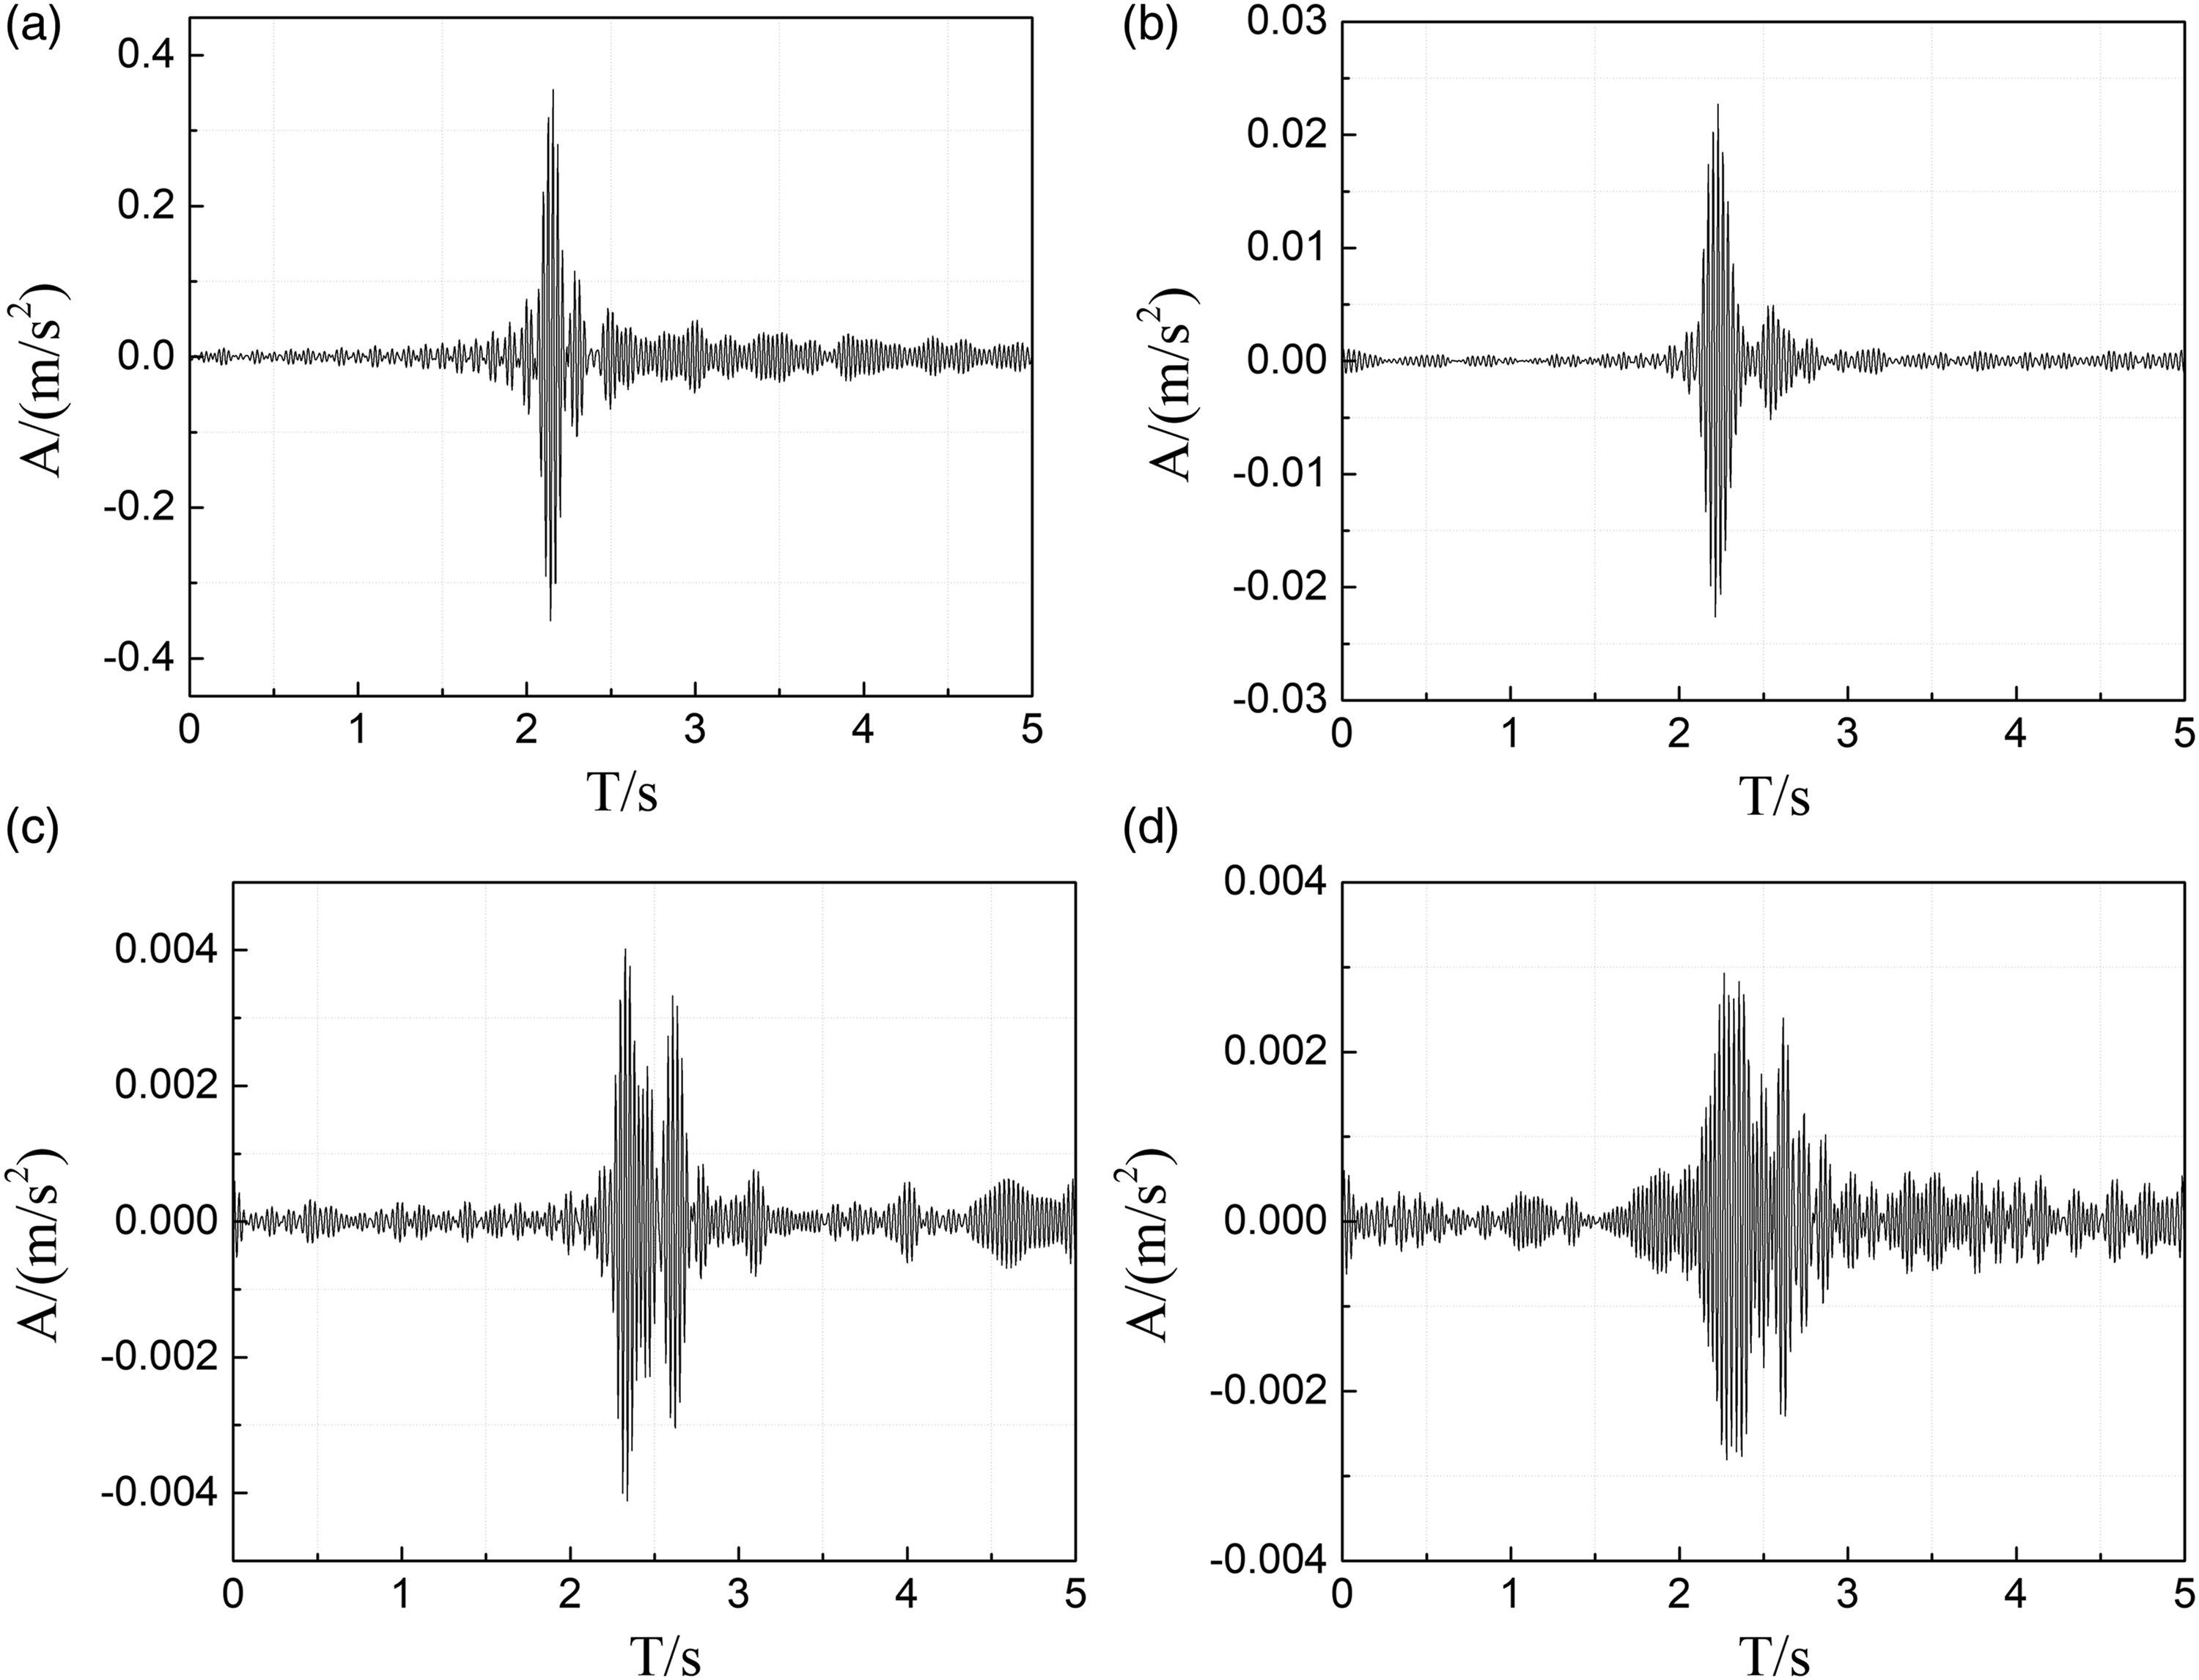
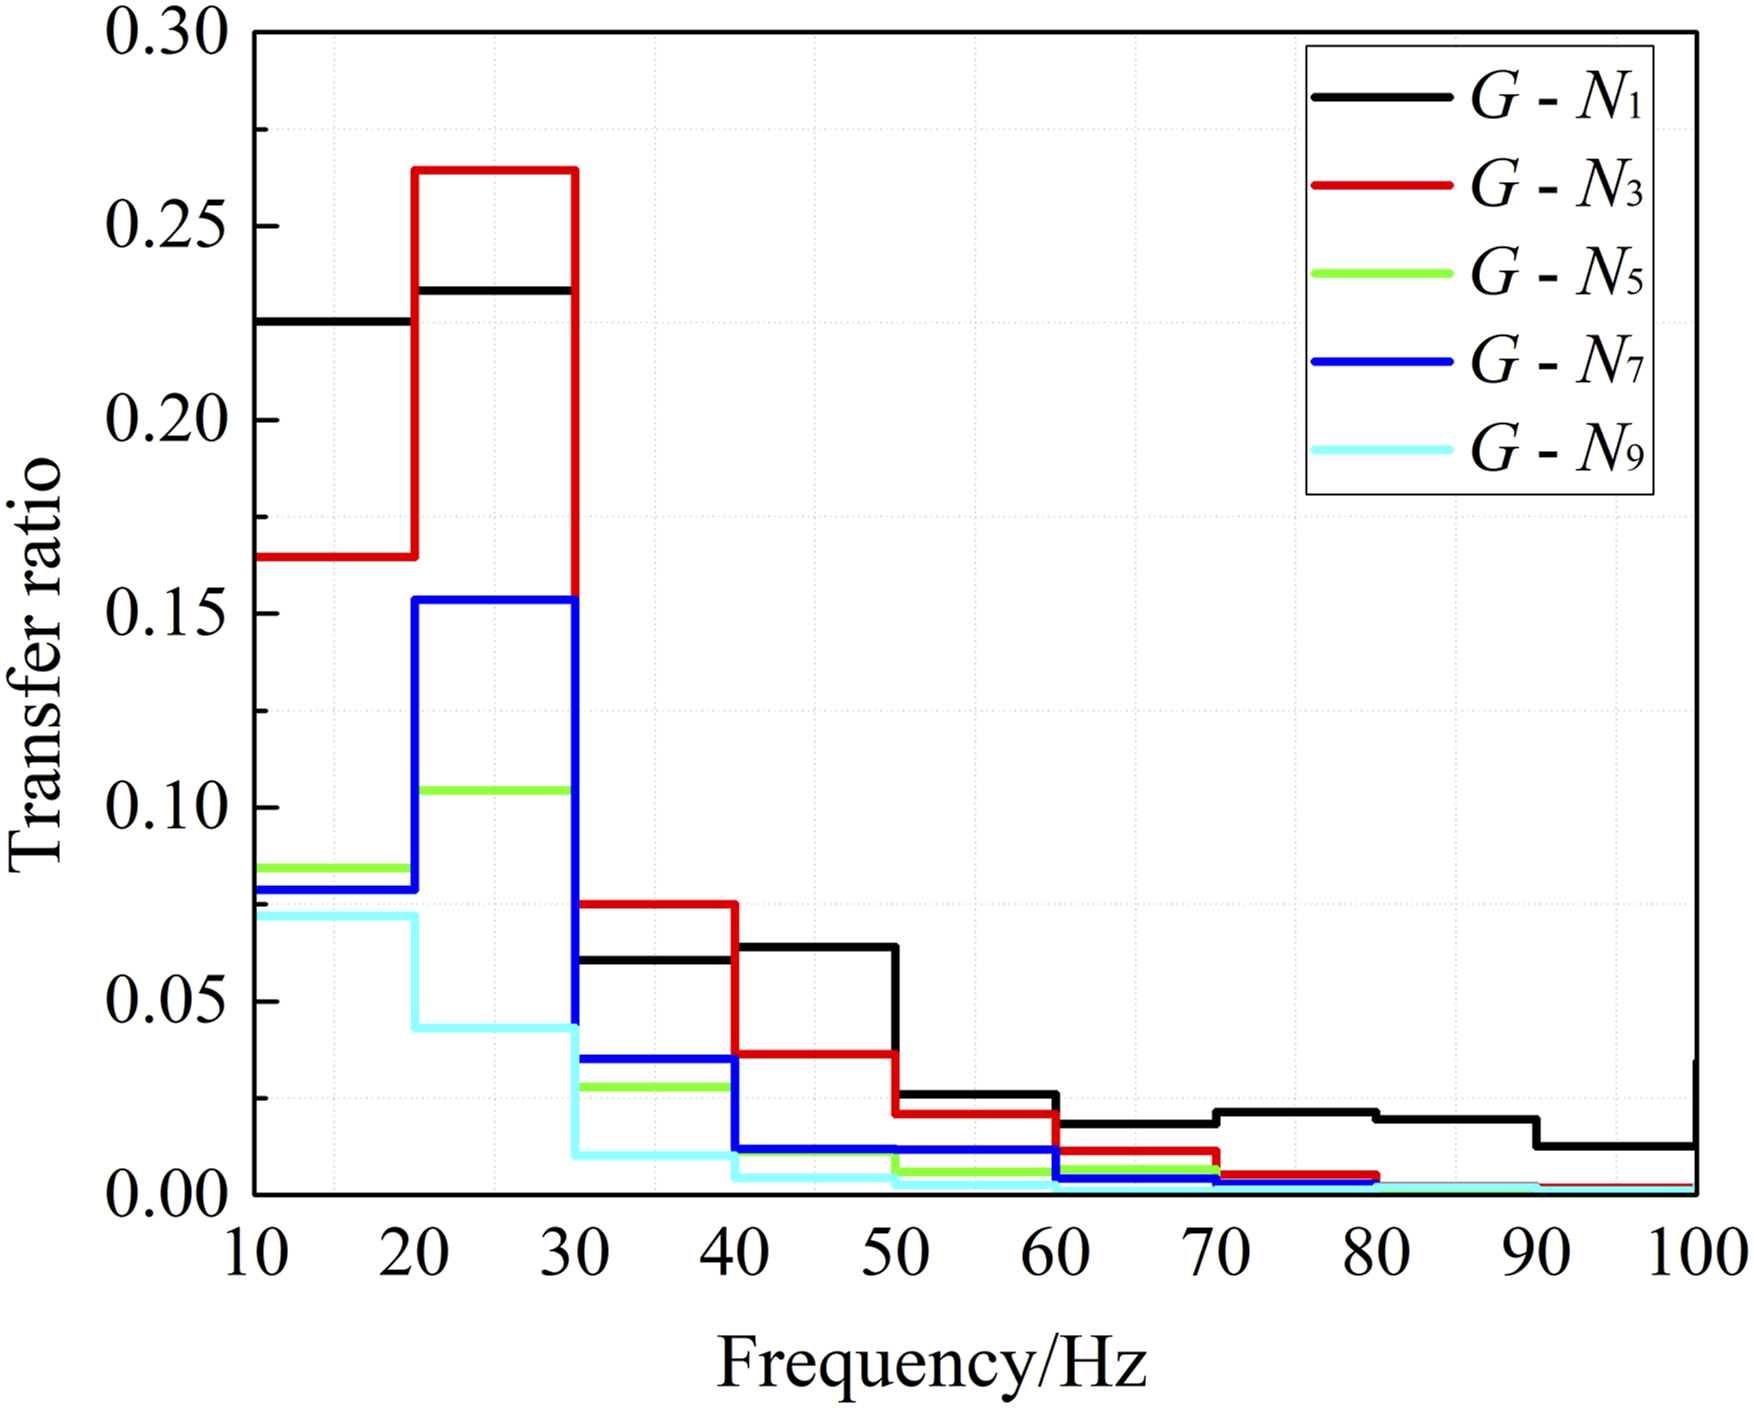
The vibration transfer ratio is defined as the ratio of the maximum value of the acceleration time history in each frequency band. Multiple groups of hammering test data were analyzed and averaged to reduce the interference of environmental vibration. The peak acceleration time history of each frequency band is presented in Figure 17, and the calculated vibration transmission of each surface measurement point as compared with that of the tunnel measurement point is exhibited in Figure 18. The peak acceleration of each frequency band. The transfer ratios between different measurement points.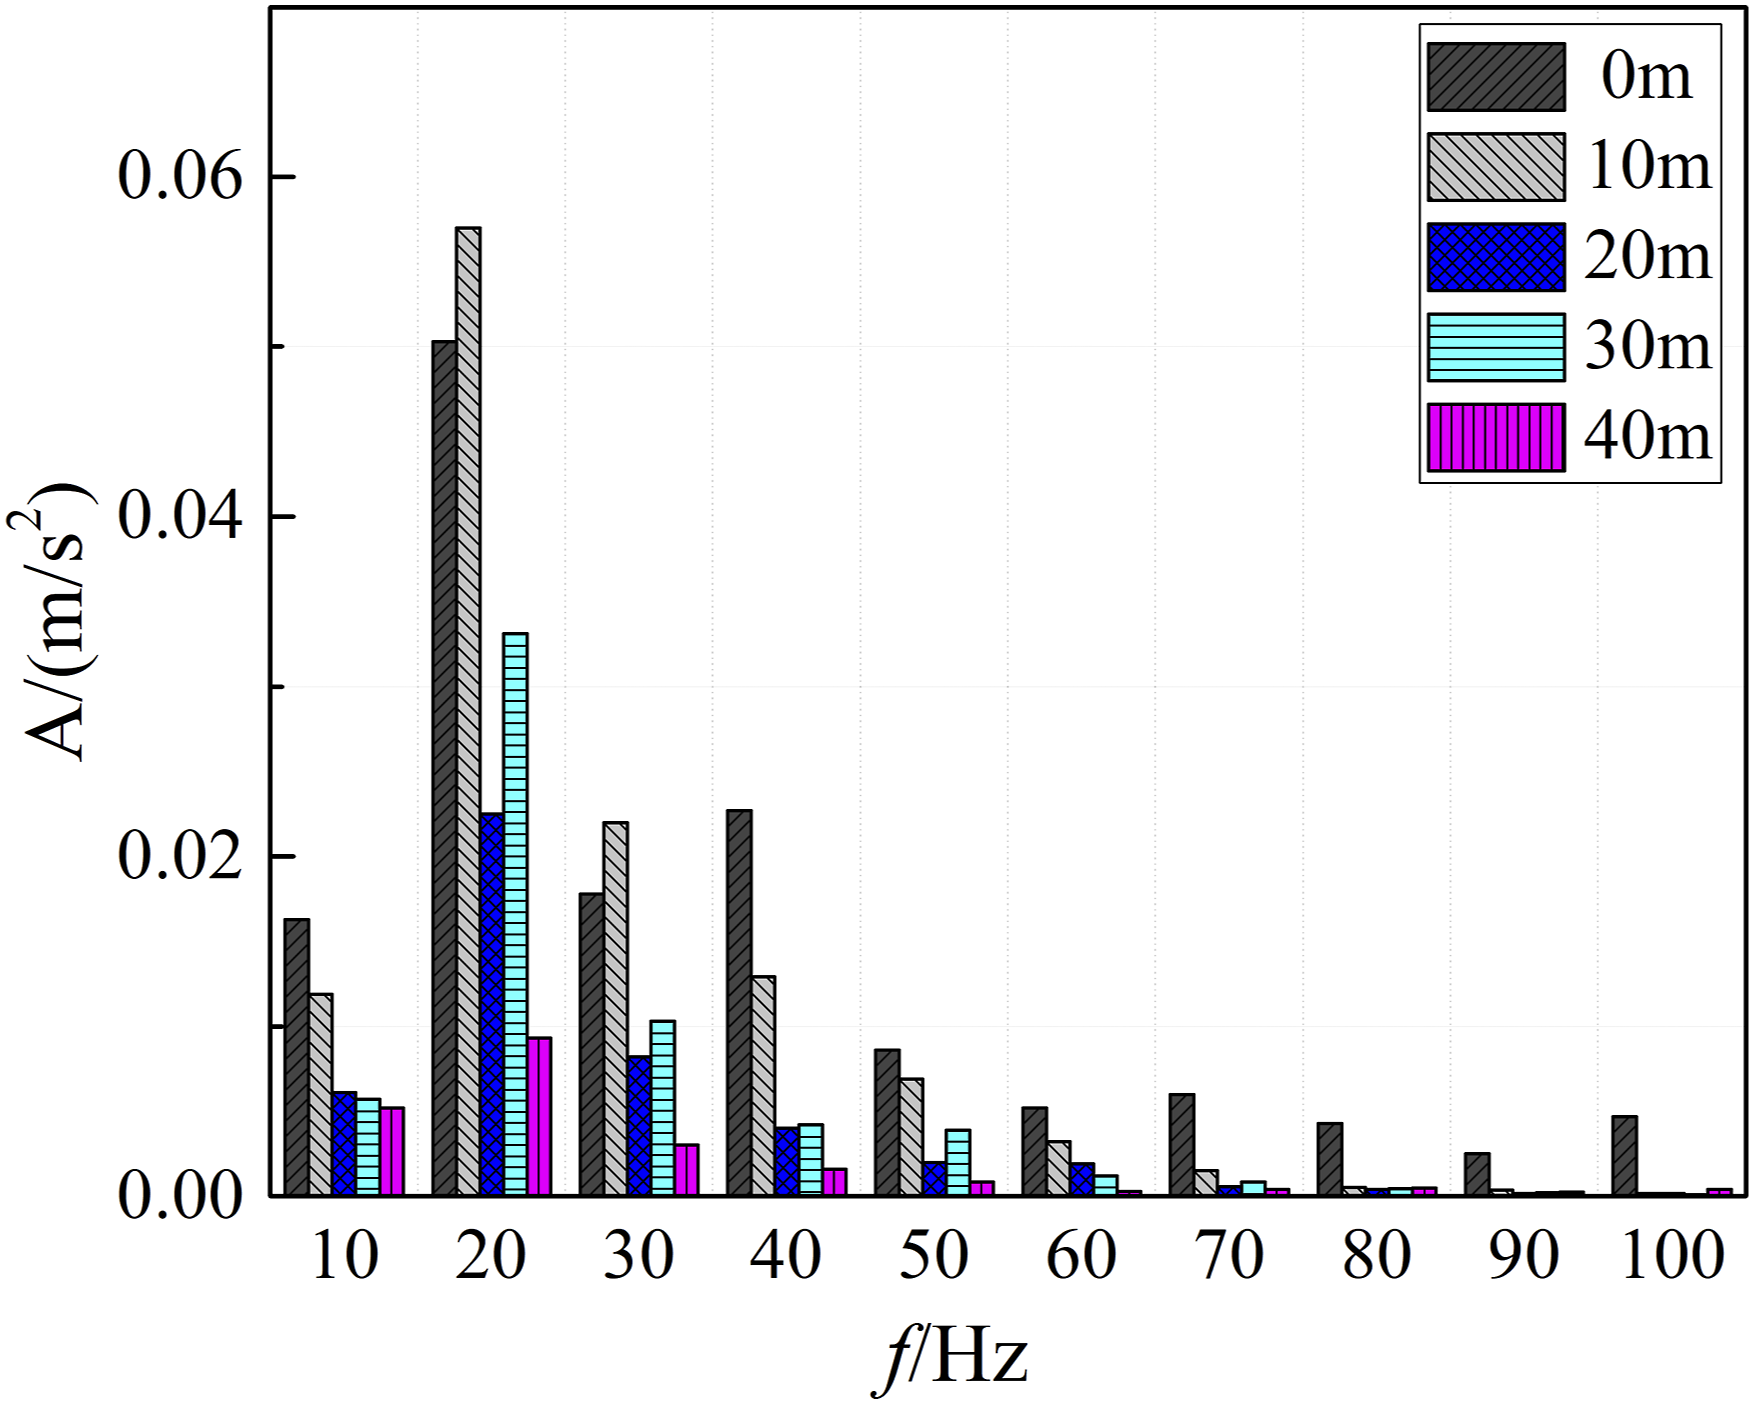
Prediction and verification
To verify the accuracy and effectiveness of the proposed prediction method, the vibration response of point
The acceleration time history data of the tunnel measurement point The vertical acceleration time histories of N at different frequency bands (a) 30–40 Hz; (b) 80–90 Hz. The acceleration time history decomposition.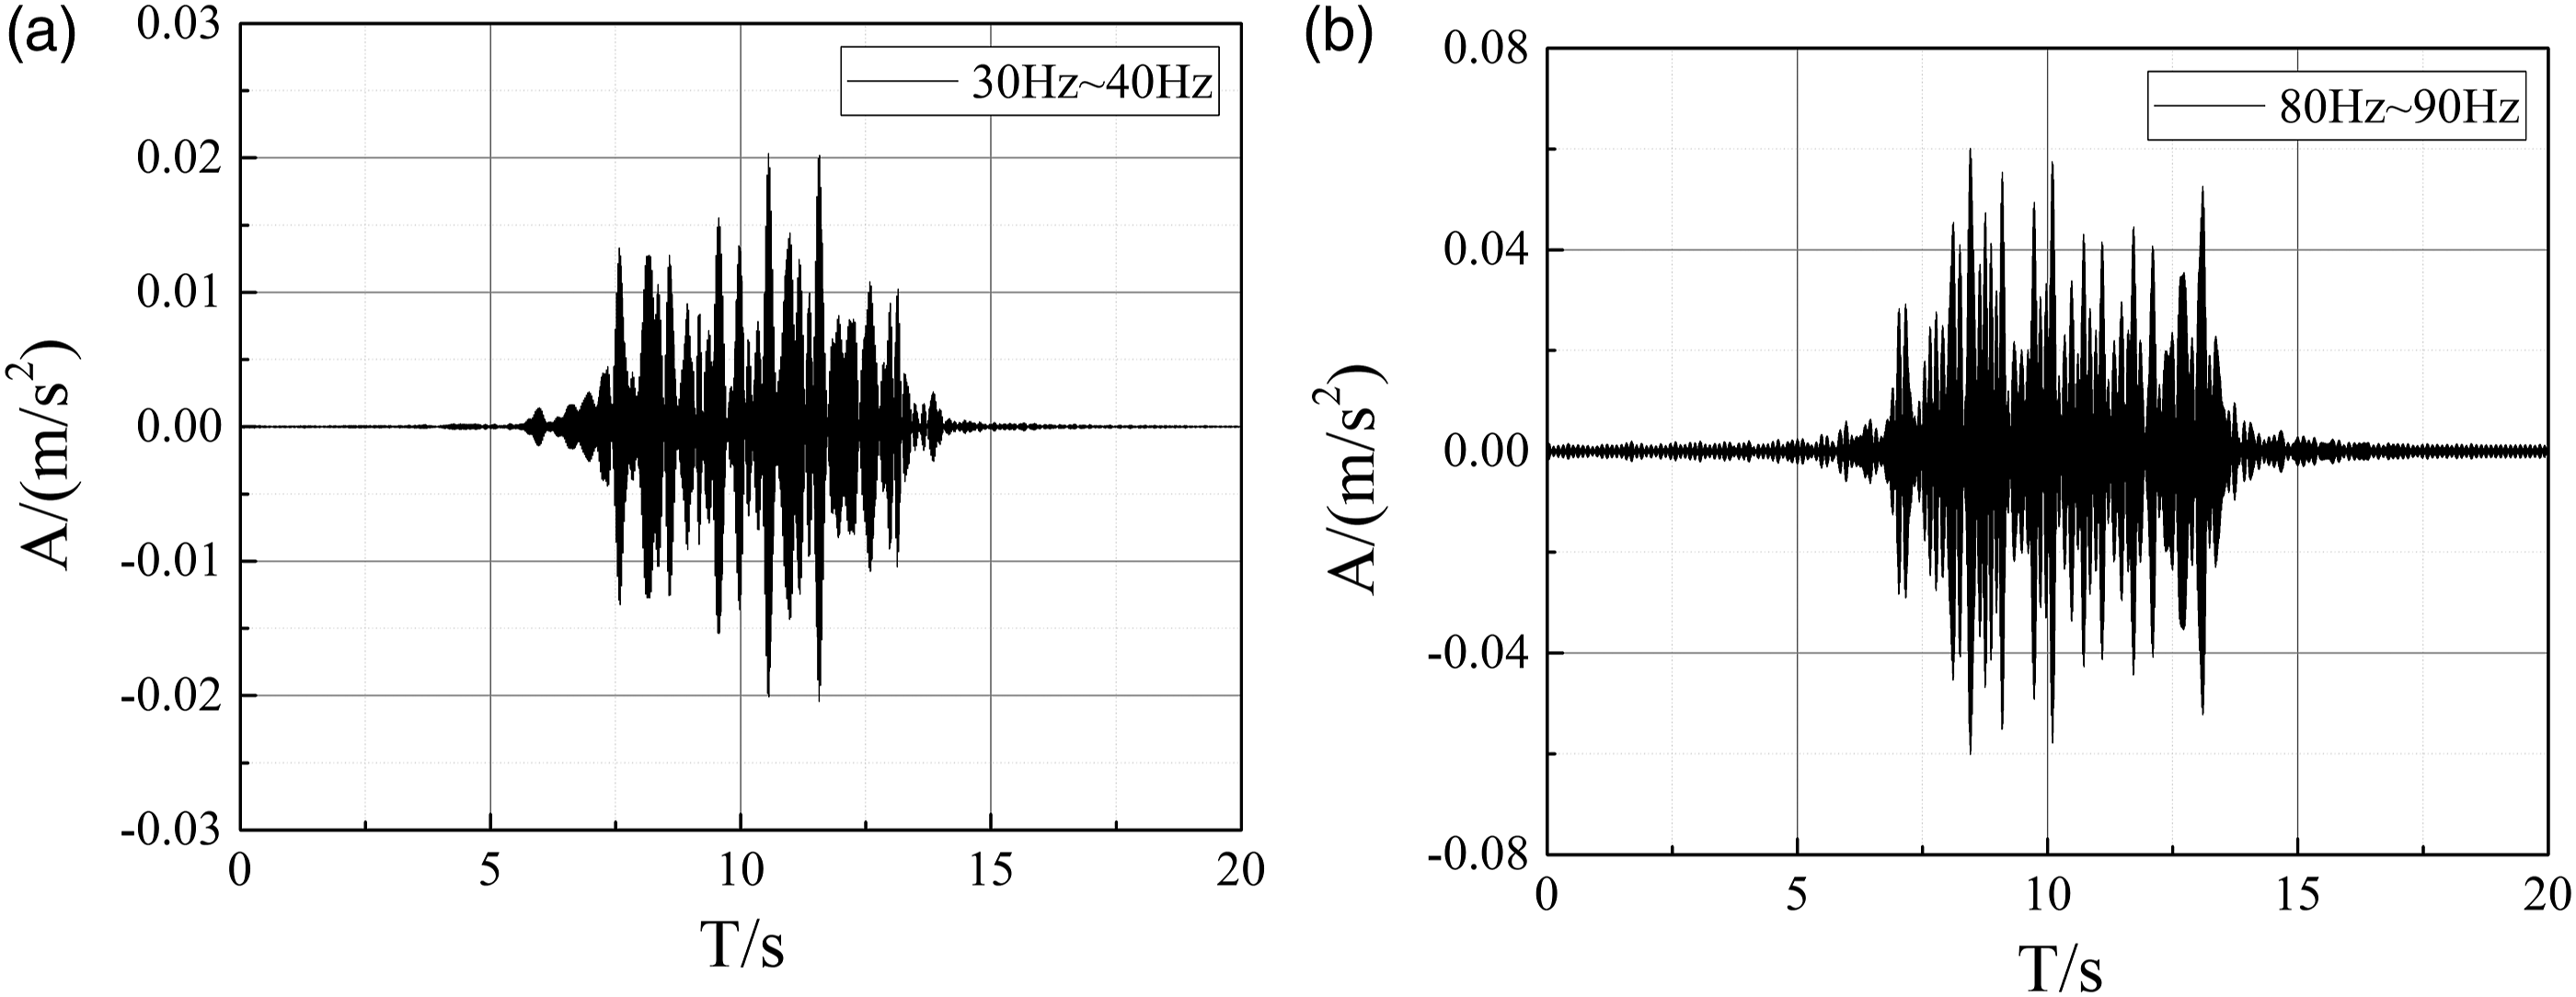
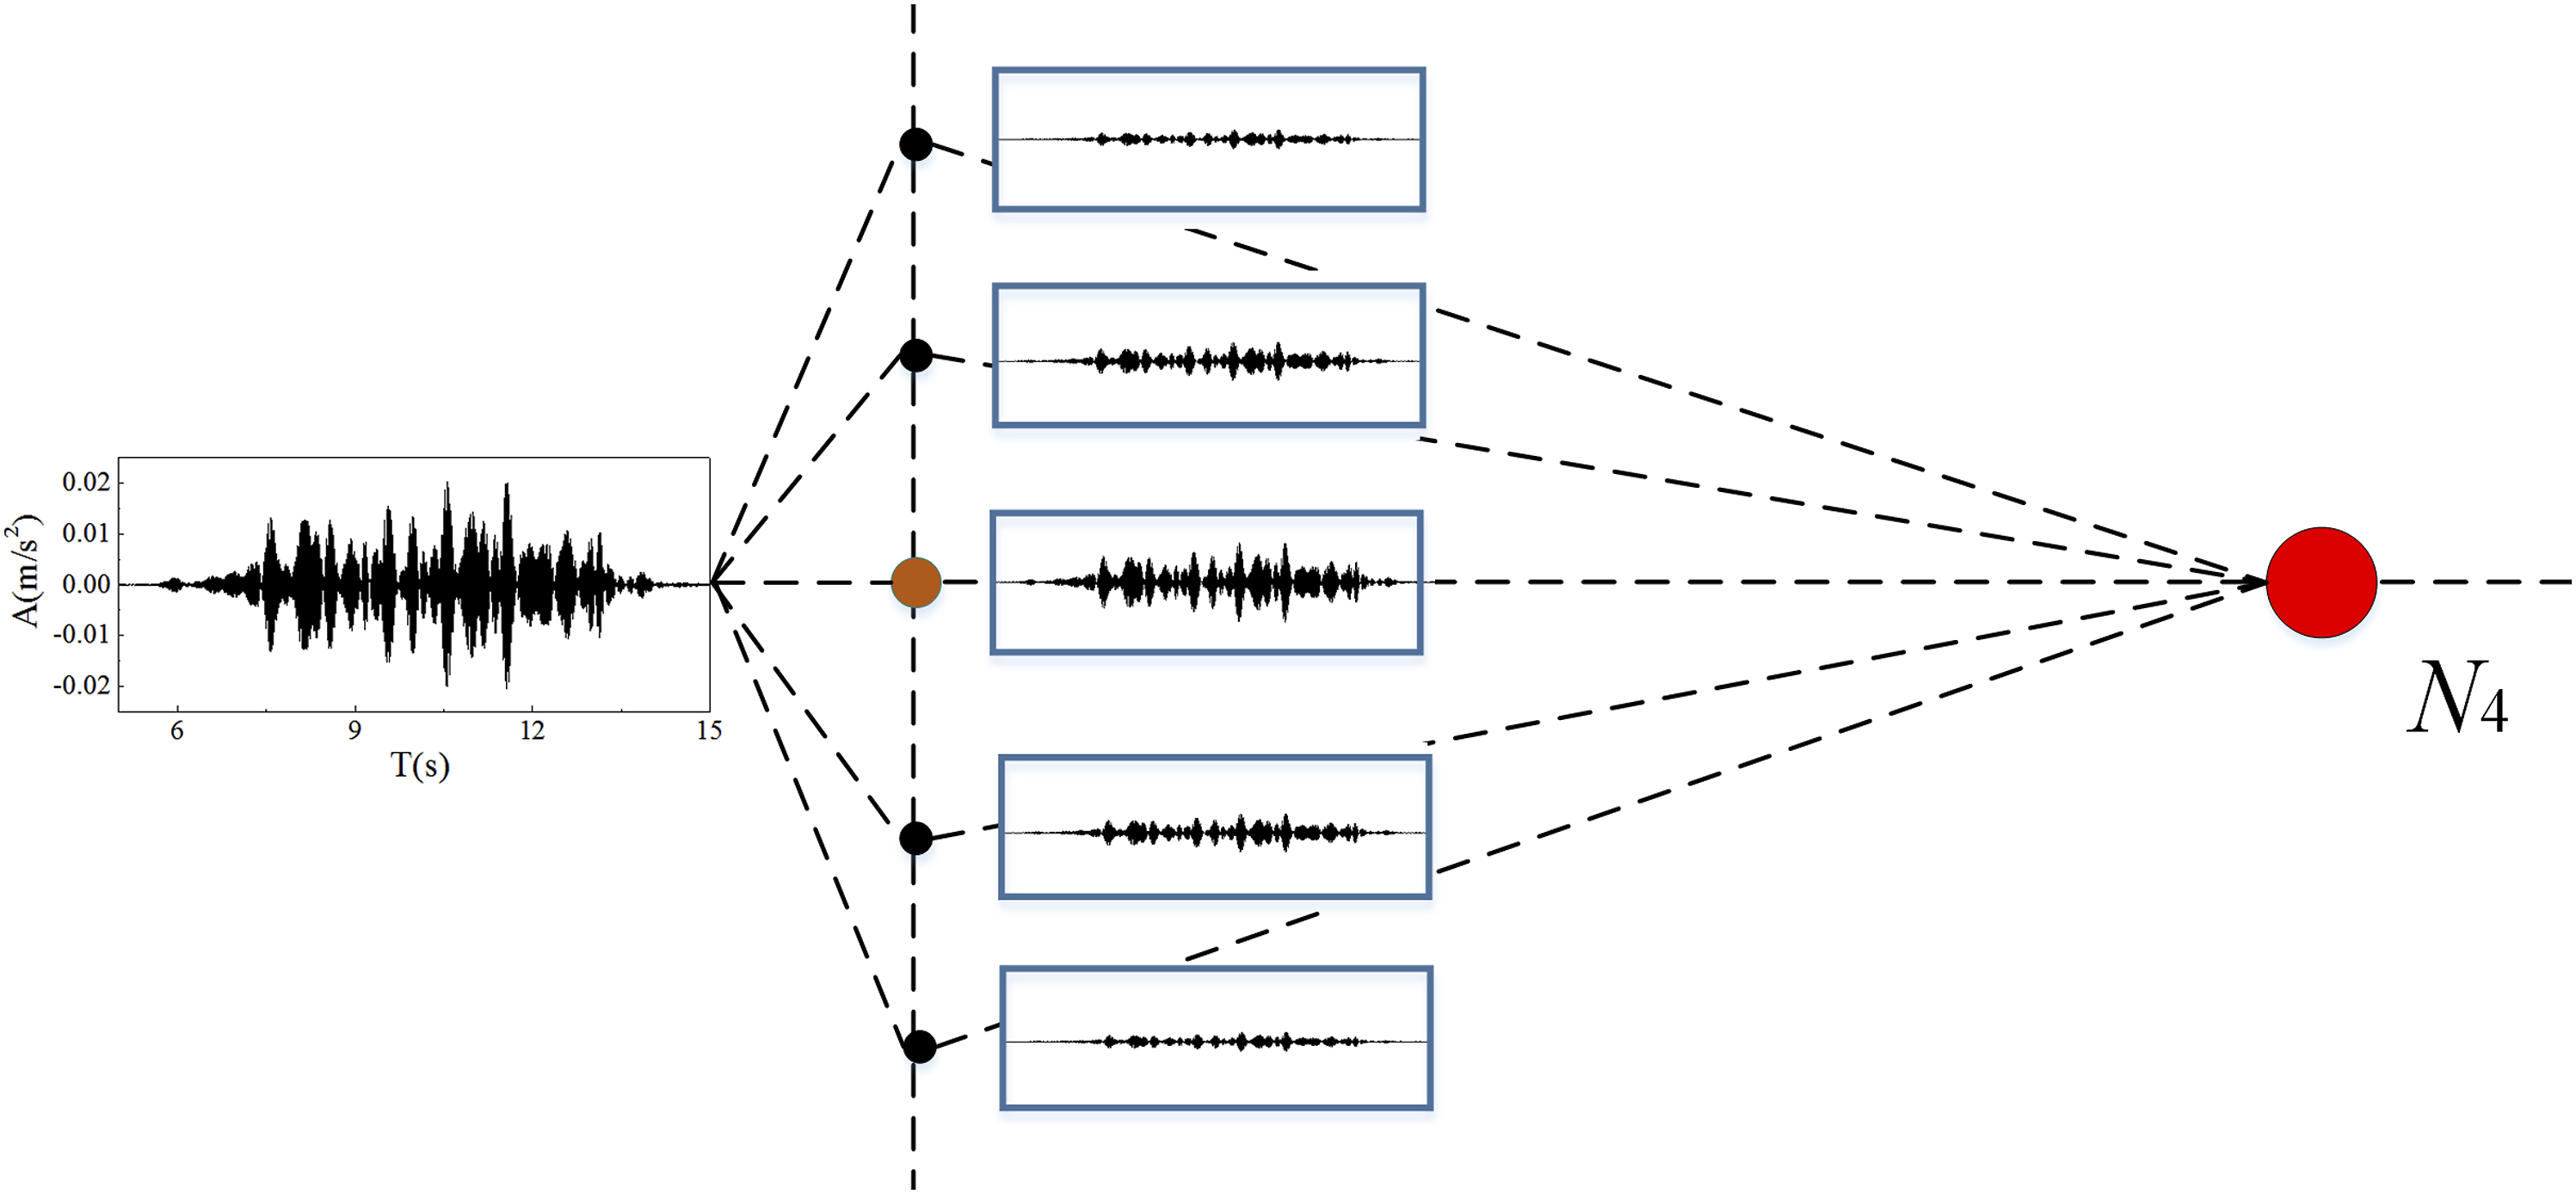
According to the vibration transmission equivalence principle of the proposed prediction method (Figure 3), the predicted vibration responses of each frequency band of point N4 were obtained by combining the decomposed vibration acceleration time history with the transfer ratio shown in Figure 18. Finally, the predicted vibration acceleration time history of N4 was obtained after superposition, and is exhibited in Figure 21(a). The vertical acceleration time histories of N4: (a) the predicted time history; (b) the measured time history.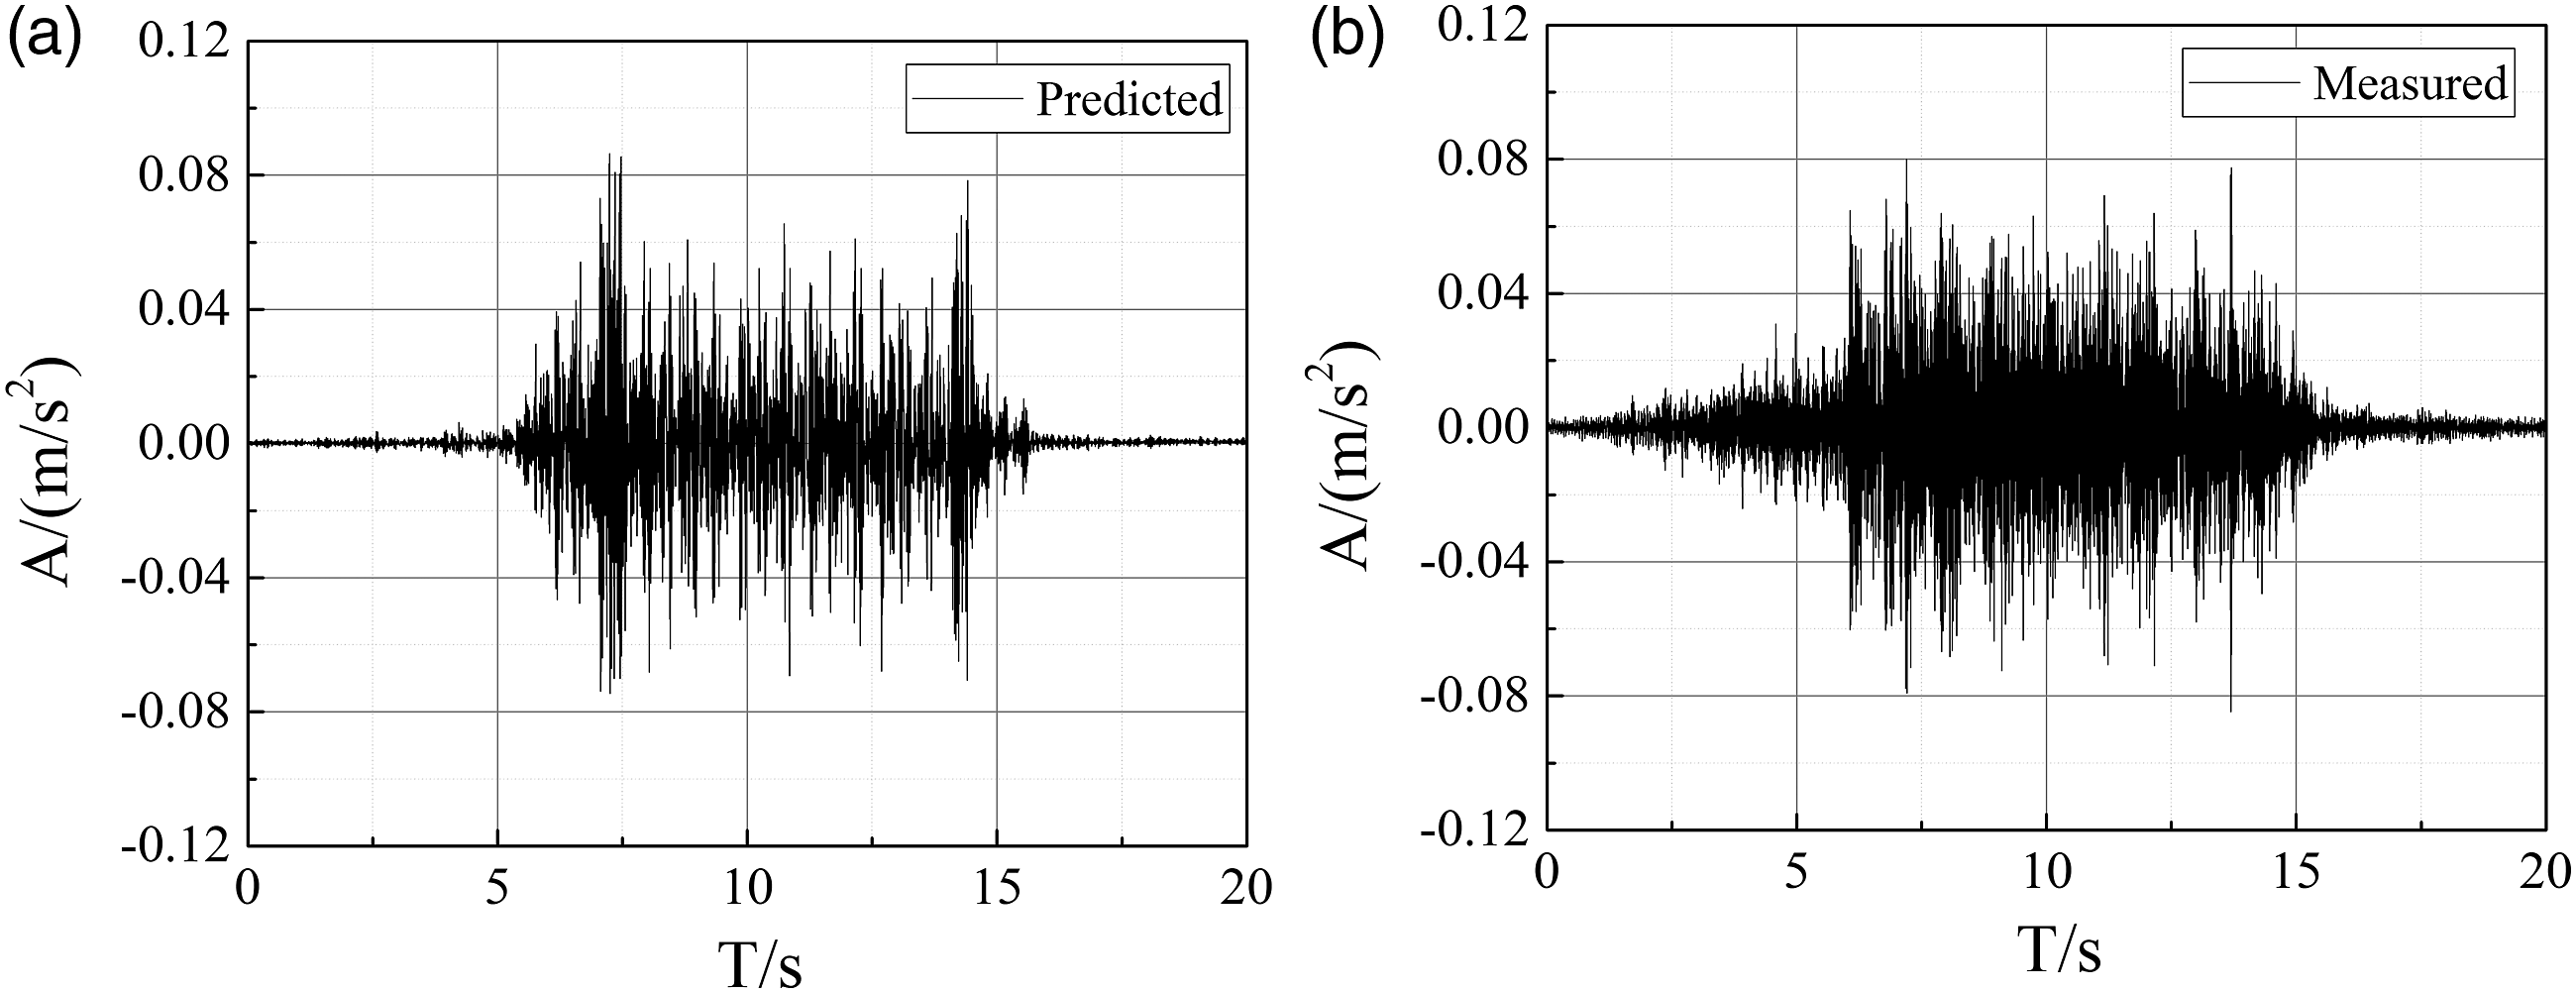
Figure 21(b) presents the vibration acceleration response measured at the same position under actual train operation, and the comparison between the predicted and measured acceleration spectra is exhibited in Figure 22, from which the following is evident: (1) the predicted and measured time history waveforms of ground vibration acceleration were consistent, including in the processes of train arrival, passing, and departure. The predicted vibration amplitude was about 0.086 m/s2, and the measured vibration amplitude was about 0.081 m/s2; (2) the predicted spectrum of the ground vibration acceleration was similar to the measured spectra. The main vibration frequency was in the frequency band of 30–70 Hz, and the vibration frequency distribution and vibration magnitude were basically the same. The vertical acceleration spectra of N4: (a) the predicted spectrum; (b) the measured spectrum.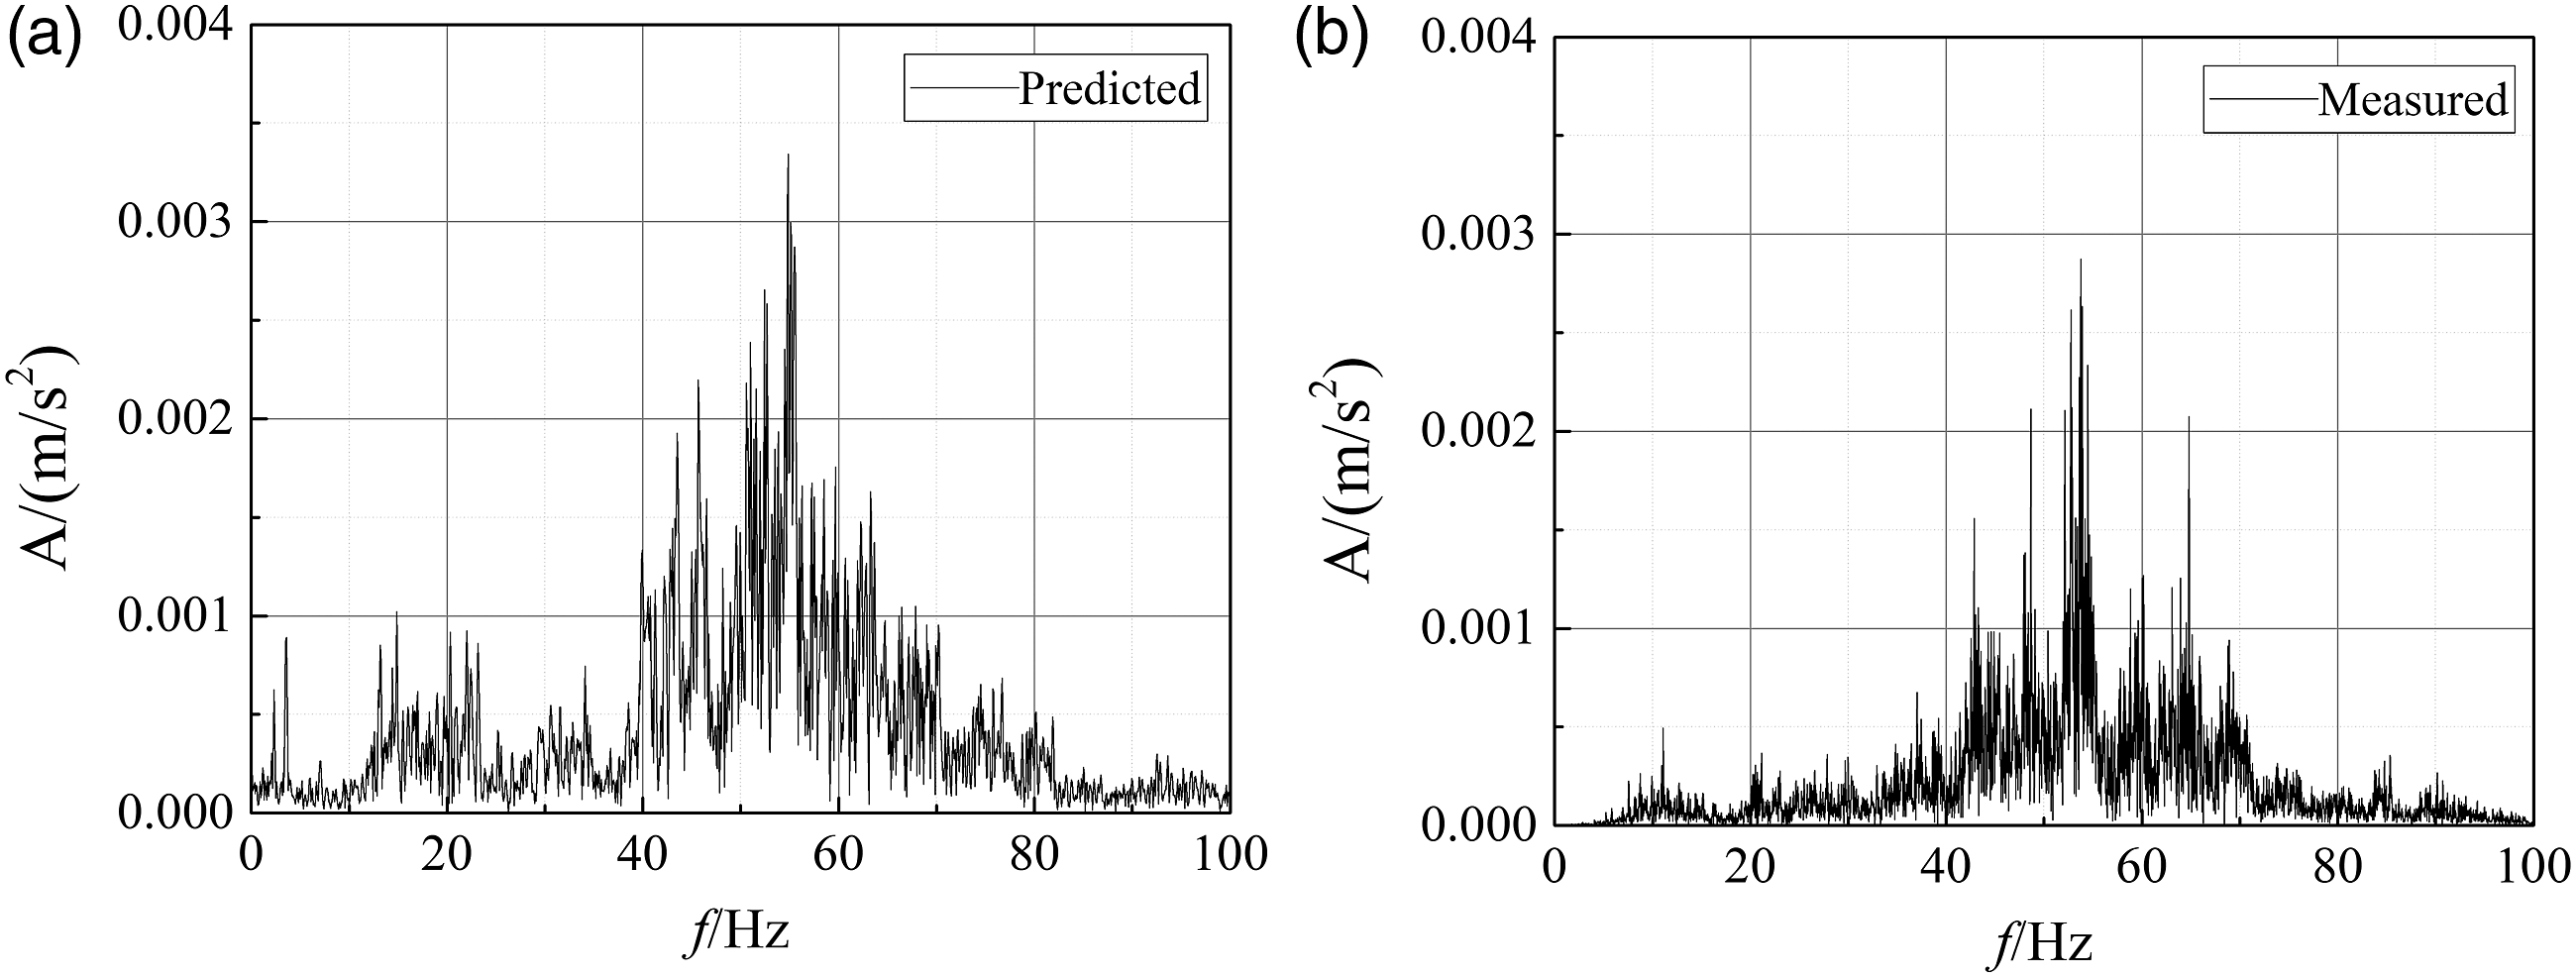
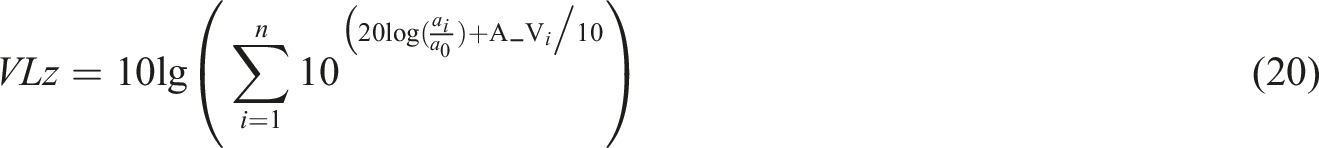
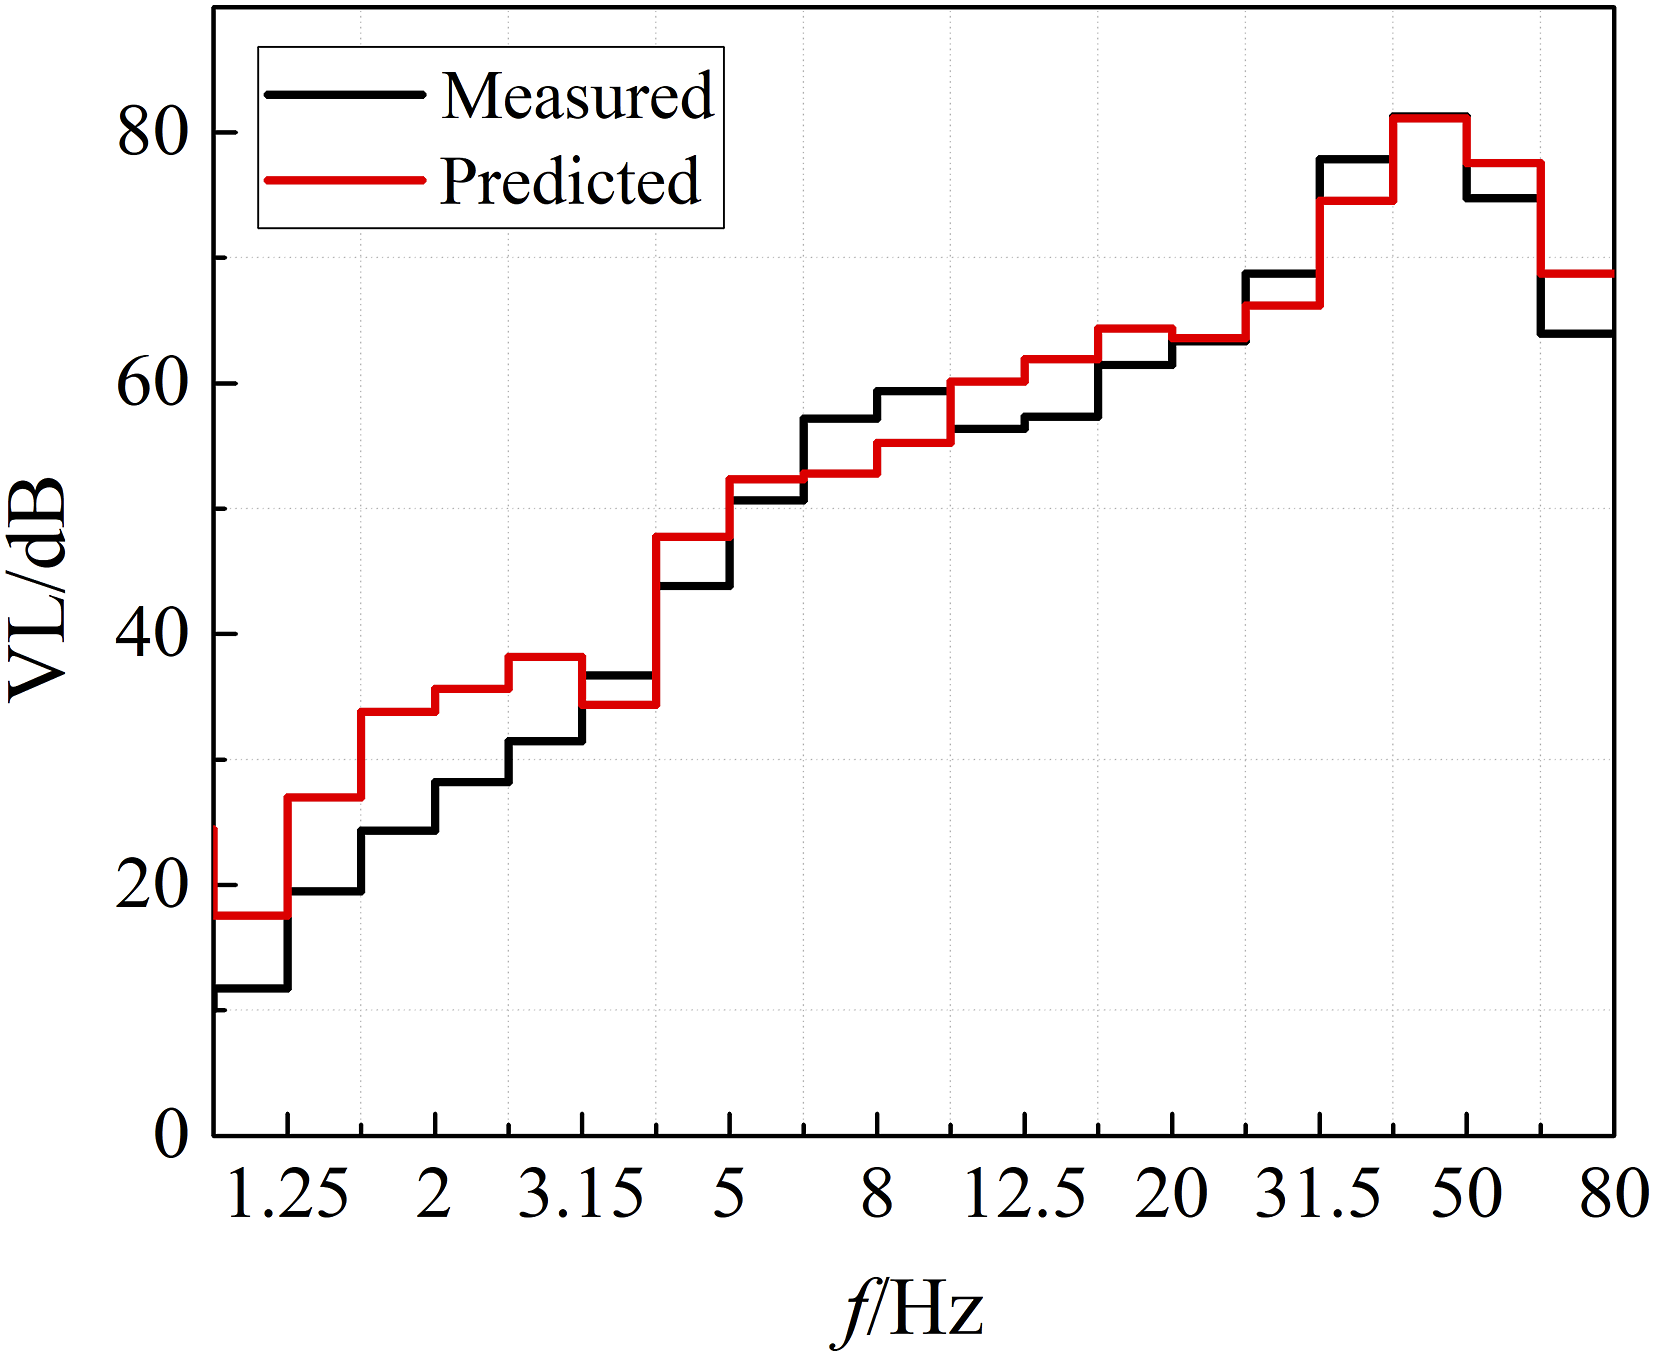
The measured and predicted 1/3-octave spectra of the acceleration vibration level at point N4 are presented in Figure 23. The predicted and measured 1/3-octave spectra of the ground vibration acceleration level were found to basically coincide, and the vibration magnitude and variation law were basically consistent, especially in the excellent frequency band (20–80 Hz) of train vibration. The root mean square (RMS) and Z vibration level (VL
Z
) of acceleration were used as the evaluation references, and can reflect the vibration energy in a certain period. The RMS value of the discrete-time signal can be expressed as The 1/3-octave spectra of the vertical acceleration vibration level of N4.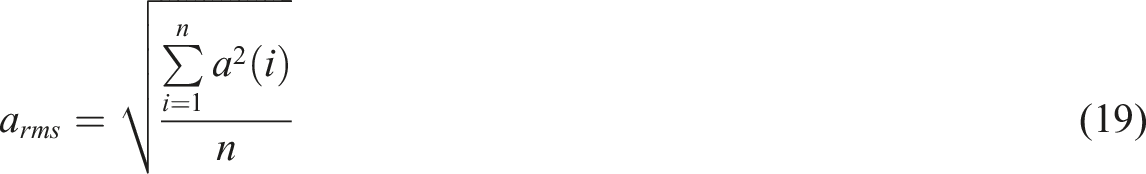
The root mean square (RMS) and the Z vibration level (VL Z ) of acceleration.
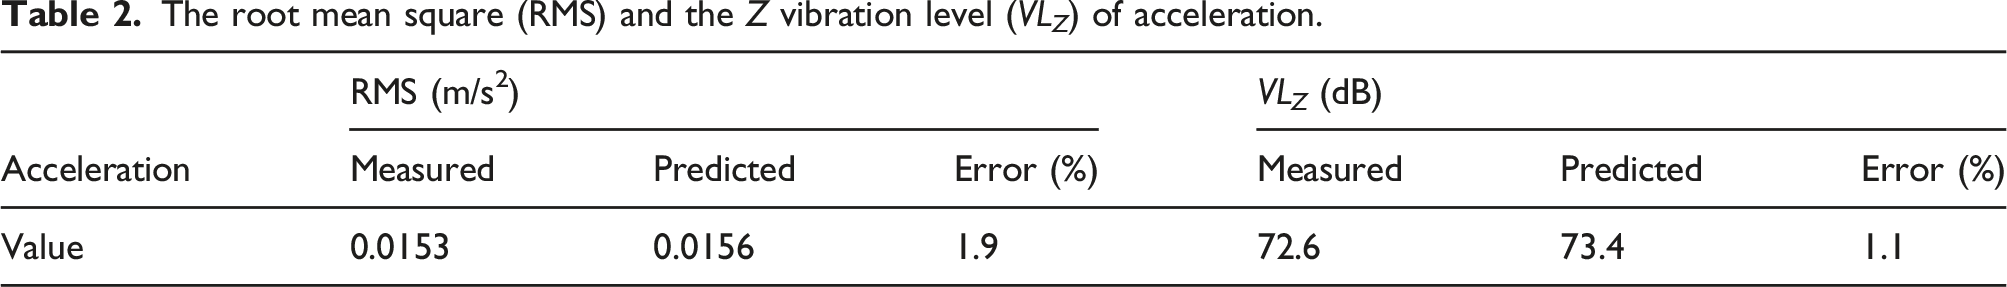
The reason for the presence of some errors is the influence of environmental background vibration. Although the magnitude of the hammering vibration was much greater than the magnitude of background vibration, some non-predominant frequency bands were still affected by environmental vibration, resulting in some errors in the vibration transfer ratio in these frequency bands. Nevertheless, the overall comparison results demonstrate that the proposed method is characterized by high accuracy for the prediction of vibration response caused by underground high-speed railways.
Conclusions
(1) Aiming at the high-precision prediction of vibration caused by underground high-speed railways, this paper proposed a prediction method based on the multi-point transfer ratio in the frequency domain. The proposed method can accurately predict the vibration impact caused by underground high-speed railways without the need for a complex FEM. Moreover, the detailed prediction and analysis processes were explained. (2) Extensive hammer excitation field tests of an underground high-speed railway line were carried out, and the law of vibration propagation from the tunnel to the surface was obtained based on the transfer ratio in the frequency band. Furthermore, combined with the vibration source data, the superposition operation in consideration of the change of the train running phase was carried out. Finally, the vibration response of the on-site surface was calculated by the proposed prediction method. (3) Vibration measurement was carried out during the operation of the on-site train, and the prediction results were compared with the measured surface vibration data. The results revealed that the proposed prediction method exhibited high calculation accuracy and good agreement with the frequency spectrum characteristics. Thus, this method can be used to predict the vibration of similar sites with high precision in the time domain, frequency domain, and 1/3 octave.
Footnotes
Declaration of conflicting interests
The author(s) declared no potential conflicts of interest with respect to the research, authorship, and/or publication of this article.
Funding
The author(s) disclosed receipt of the following financial support for the research, authorship, and/or publication of this article: The research described in this paper was financially supported by the National Key R&D Program of China (Grant no. 2019YFC1521000) and the Fundamental Research Funds for the Central Universities (Grant no. 2020YJS120; 2020JBZ110)