
Abstract
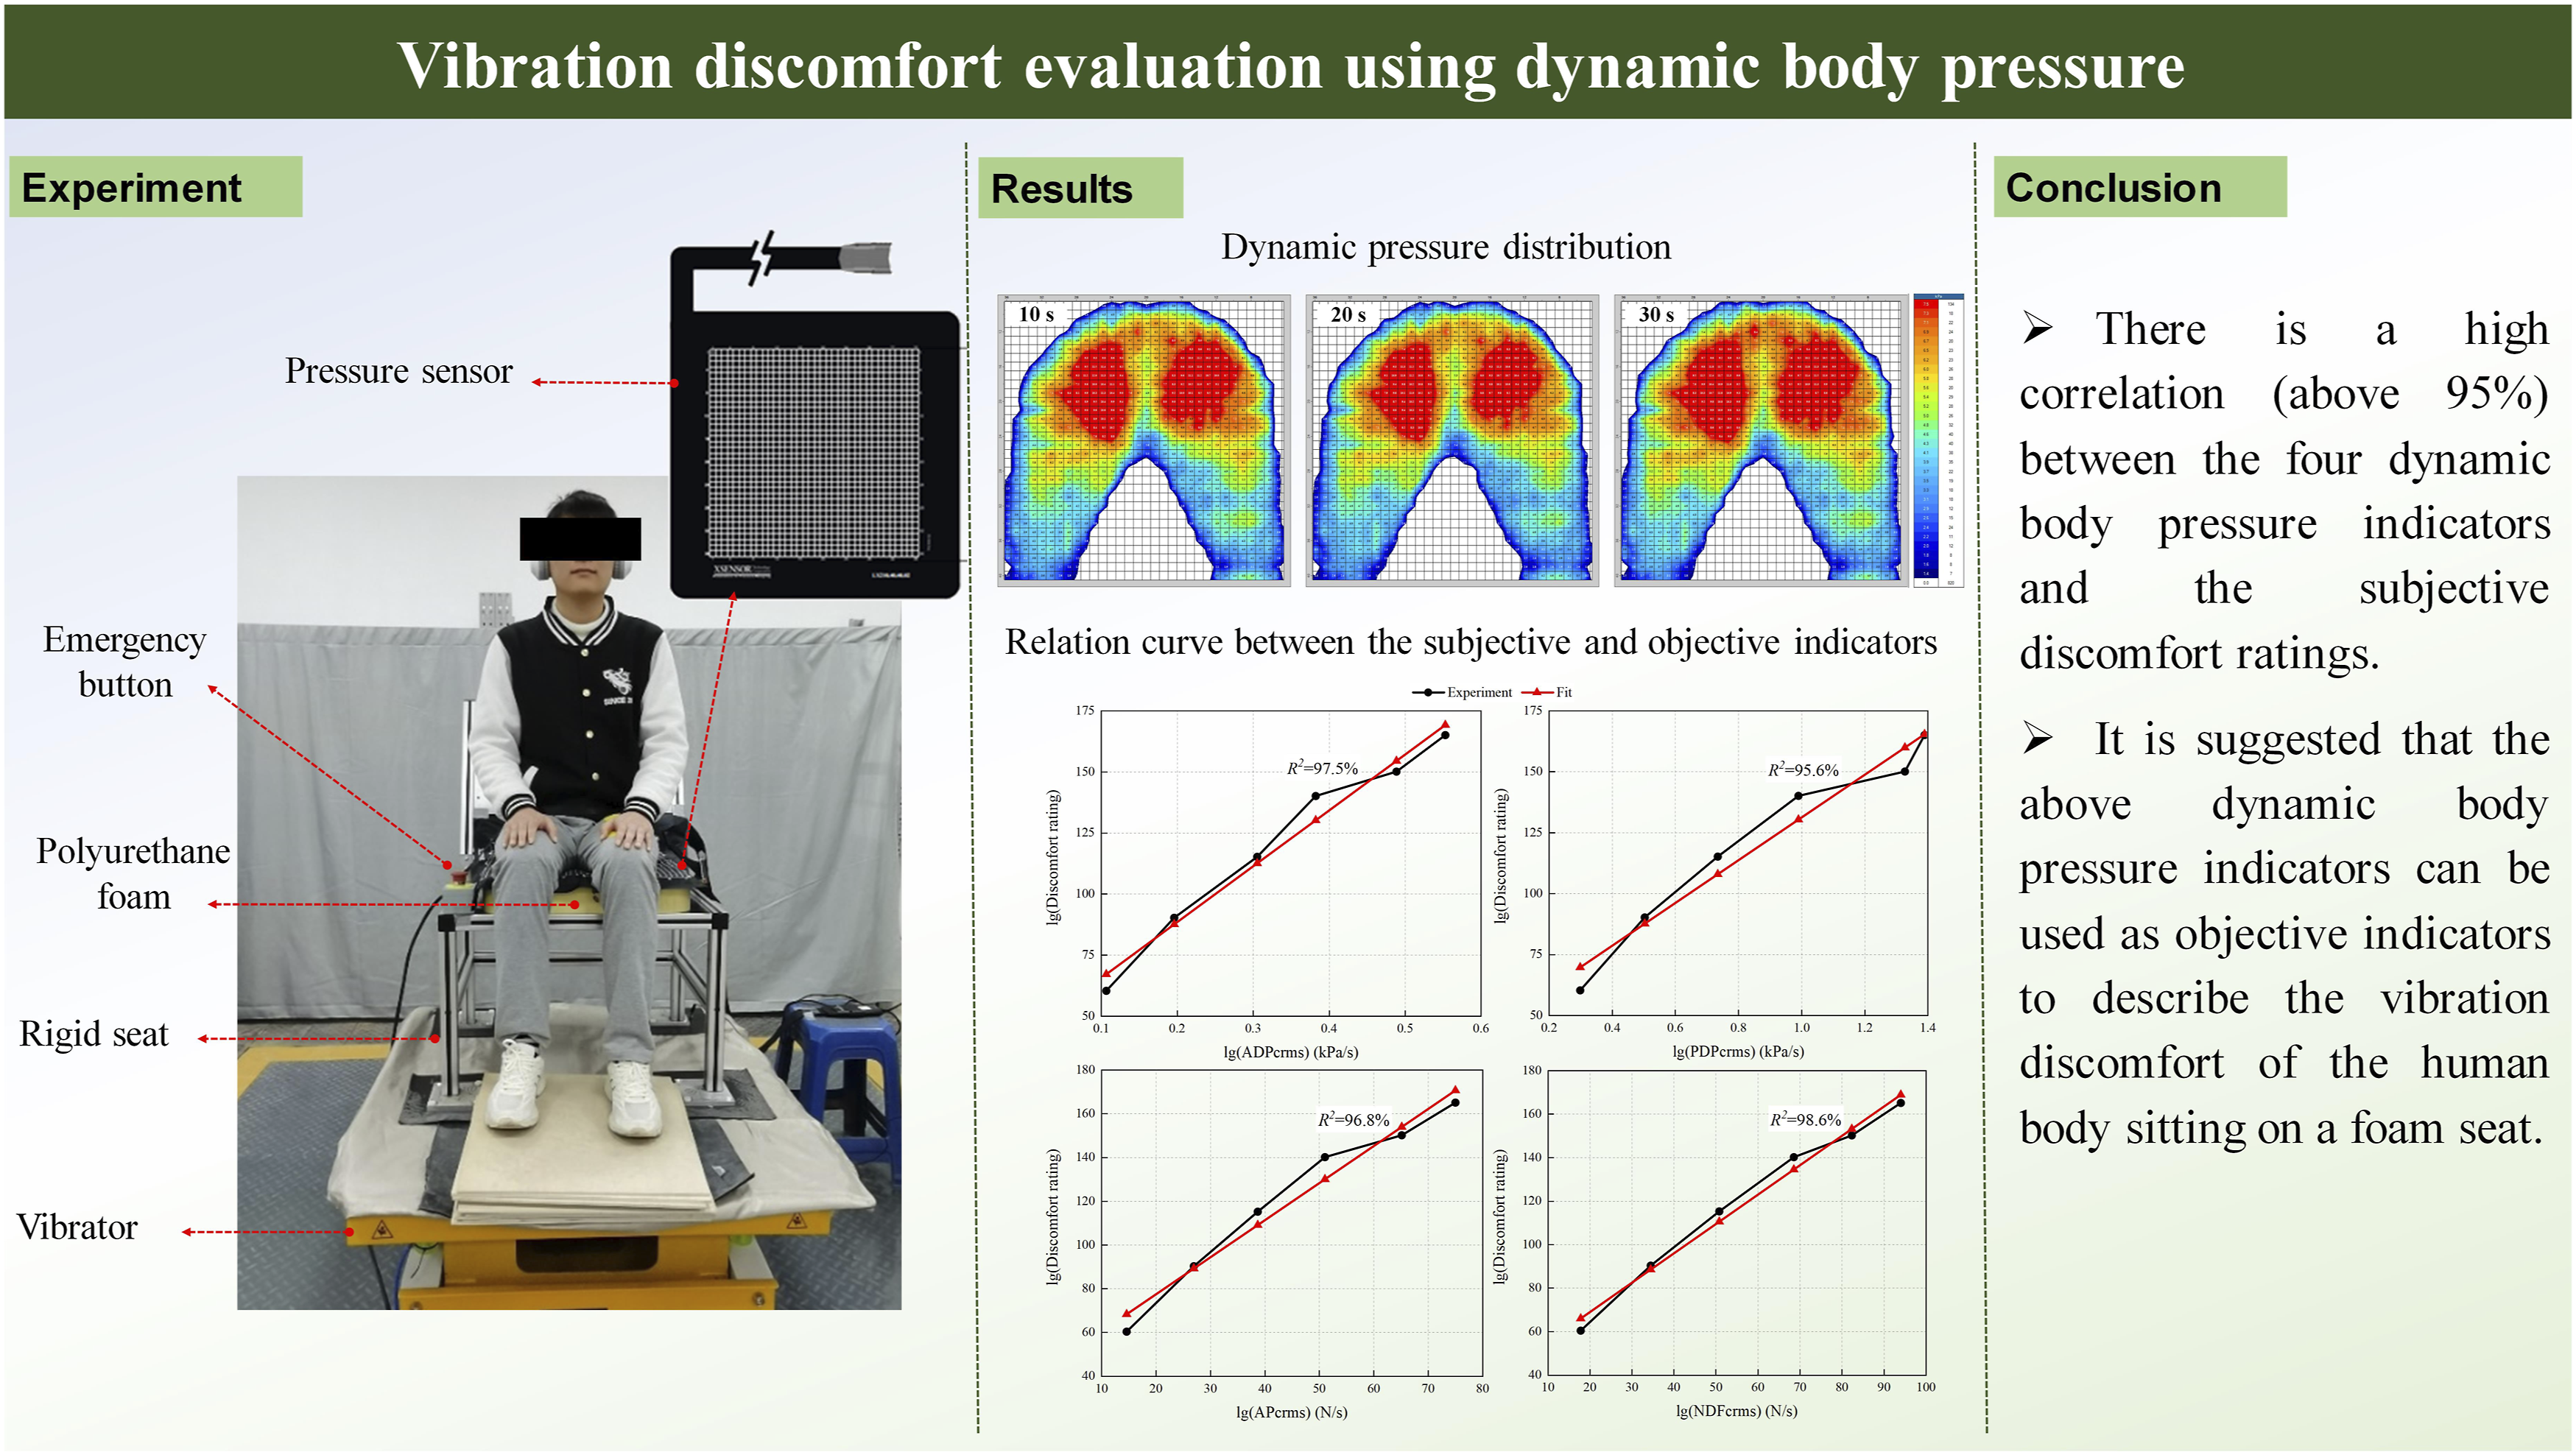
Pressure distribution has been regarded as a crucial parameter for static comfort evaluation of the seated human body. However, the association between the pressure distribution and subjective rating, exposed to vertical vibration, is still unclear. This study devotes to characterizing the vibration discomfort of the seated human body on a foam seat using dynamic body pressure distribution and investigating the associations between them. First, the dynamic body pressure of twelve subjects seated on a foam seat exposed to vertical random excitation was measured at frequencies from 0.5 to 20 Hz with six magnitudes (0.2, 0.4, 0.6, 0.8, 1.0, and 1.2 m/s2 r.m.s.). Meanwhile, the subjective discomfort rating of the foam seat was evaluated with the relative magnitude estimation method. Then, the influence of vibration magnitude on subjective discomfort ratings and dynamic body pressure indicators was investigated. The results show that with the increase of vibration magnitude, the mean average dynamic pressure, the mean peak dynamic pressure, the mean dynamic contact area, and the normal dynamic force had no significant change. On the contrary, the subjective discomfort ratings, normal dynamic force change rate root-mean-square, and the indicators related to pressure change rate root-mean-square increased significantly. Finally, the relation between the subjective discomfort ratings and dynamic body pressure indicators was analyzed using Stevens’ power law. The linear regression fitting accuracy of the average dynamic pressure change rate root-mean-square, peak dynamic pressure change rate root-mean-square, area pressure change rate root-mean-square, and normal dynamic force change rate root-mean-square with discomfort ratings were above 95%. The four dynamic body pressure indicators are highly correlated with the subjective discomfort ratings, which can be used as objective indicators for vibration discomfort evaluation.
Keywords
Introduction
With the development of the automobile industry, increasing concern about automobile performance has led to much requirement for seat comfort. Vehicle seat comfort has also become a research focus of automobile manufacturers. There are two types of research on seat comfort as follows: (i) Subjective evaluation methods, such as semantic difference method, 1 scale method, 2 and questionnaire survey 3 and (ii) objective evaluation methods, such as body pressure distribution measurement, 4 acceleration measurement, 5 myoelectric signals measurement, 6 and posture analysis. 7 The pressure distribution between the human body and the seat has been observed as one of the most crucial indicators for seat comfort evaluation in many studies.8–10
Previous studies have concentrated on measuring the pressure distribution under static conditions and established the relationship between subjective discomfort and static pressure. 11 Studies have reported that the discomfort of the seated human body is related to the average pressure12,13 or the maximum pressure near the ischial tuberosity.14,15 In addition, there is a relationship between discomfort over time with pressure dose, that is, the longer the duration, the greater the discomfort. 16 The static pressure patterns at the human-seat interface provide helpful information for seat comfort design.11,17 However, human bodies would experience various vibrations in daily life, especially during riding in vehicles such as cars and trains. Studies of pressure distribution under dynamic conditions might provide more valuable information.
Since driver discomfort is a dynamic phenomenon, it is suggested to capture the dynamic pressure varying with time at the human-seat interface for vibration discomfort evaluation. 18 Measurement of the dynamic pressure between the human body and the seat provides a new method to quantify the interaction at the human-seat interface, which has been paid more and more attention by scholars. Na et al. 19 predicted the driver’s posture and its change by measuring and analyzing the dynamic body pressure distribution. Jin et al. 20 focused on applying the pressure distribution to predict driver discomfort combined with the changes in posture and movement frequency. This study also proved the effectiveness of body pressure distribution for discomfort evaluation. Tahir et al. 21 quantitatively analyzed the dynamic pressure of drivers with different stature and weights, which can be used to guide the ergonomic seat design. Dynamic body pressure distribution has gradually become an important indicator for evaluating drivers’ vibration discomfort.
Vibrations usually cause unwanted or unpleasant sensations in the human body, such as motion sickness and vibration discomfort. 22 The discomfort caused by vibrations is affected by the magnitude, frequency, and direction of excitation. 23 Several studies have suggested that the vibration magnitude has a significant influence on the vibration discomfort of the human body24,25 and can also lead to dynamic pressure changes. 26 Matsumoto and Griffin 27 studied the effect of vibration magnitude on the subjective estimates under continuous and transient vertical vibration and found that the discomfort estimates increased significantly with vibration magnitude, especially with continuous vibration. Wu et al. 26 investigated the effect of vertical excitation on the dynamic pressure distribution at the human-seat interface and also found that an increase in the vibration magnitude resulted in a considerable increase in the dynamic pressure near the primary resonance of the human body. In addition, Uenishi et al. 28 compared three types of foam seats by measuring the dynamic body pressure distribution and found that the pressure change rate root-mean-square was the most appropriate indicator for evaluating “unpleasant sensations.” The above studies show that there may be some associations between dynamic body pressure distribution and subjective comfort, but a clear and consistent conclusion on the relationship between them has not been achieved. Therefore, the relationship between dynamic body pressure distribution and subjective sensations of the seated human body under vibration is worth further exploring.
The primary objective of this study is to investigate how to characterize the subjective discomfort of the seated human body on a foam seat under vertical random vibration using dynamic body pressure distribution. Measurements of subjective discomfort and dynamic pressure distribution at the human-seat interface are conducted with twelve subjects under different random excitation. The non-parametric tests are further conducted to explore the effect of vibration magnitude on the dynamic body pressure distribution and subjective discomfort ratings (DCR). In addition, the relation between the dynamic body pressure indicators and subjective DCR is established with Stevens’ power law. This study advances the understanding of dynamic body pressure distribution between the human body and the foam seat and could provide a reference for vehicle comfort evaluation.
Methods
Apparatus
A ±150 mm electromagnetic vibrator was employed to generate vertical vibration (Beijing Siqizhixin Technology Co., Ltd., Beijing, China). The vibrator can produce a vertical vibration in the frequencies range of 0.1–50 Hz and a max dynamic load of 3 kN. A rigid flat seat with a foam cushion was rigidly mounted on the plate of the vibrator (Figure 1(a)). The XSENSOR Pressure Imaging System (XSENSOR Technology Corporation, Calgary, AB, Canada) measured the dynamic body pressure at the human-seat interface. The system includes 40 × 40 sensors pads with a sensing area of 50.8 × 50.8 cm2, and a sampling frequency of 40 Hz, shown in Figure 1(b). Experimental set-up: (a) The vibrator and subject; (b) Pressure sensor.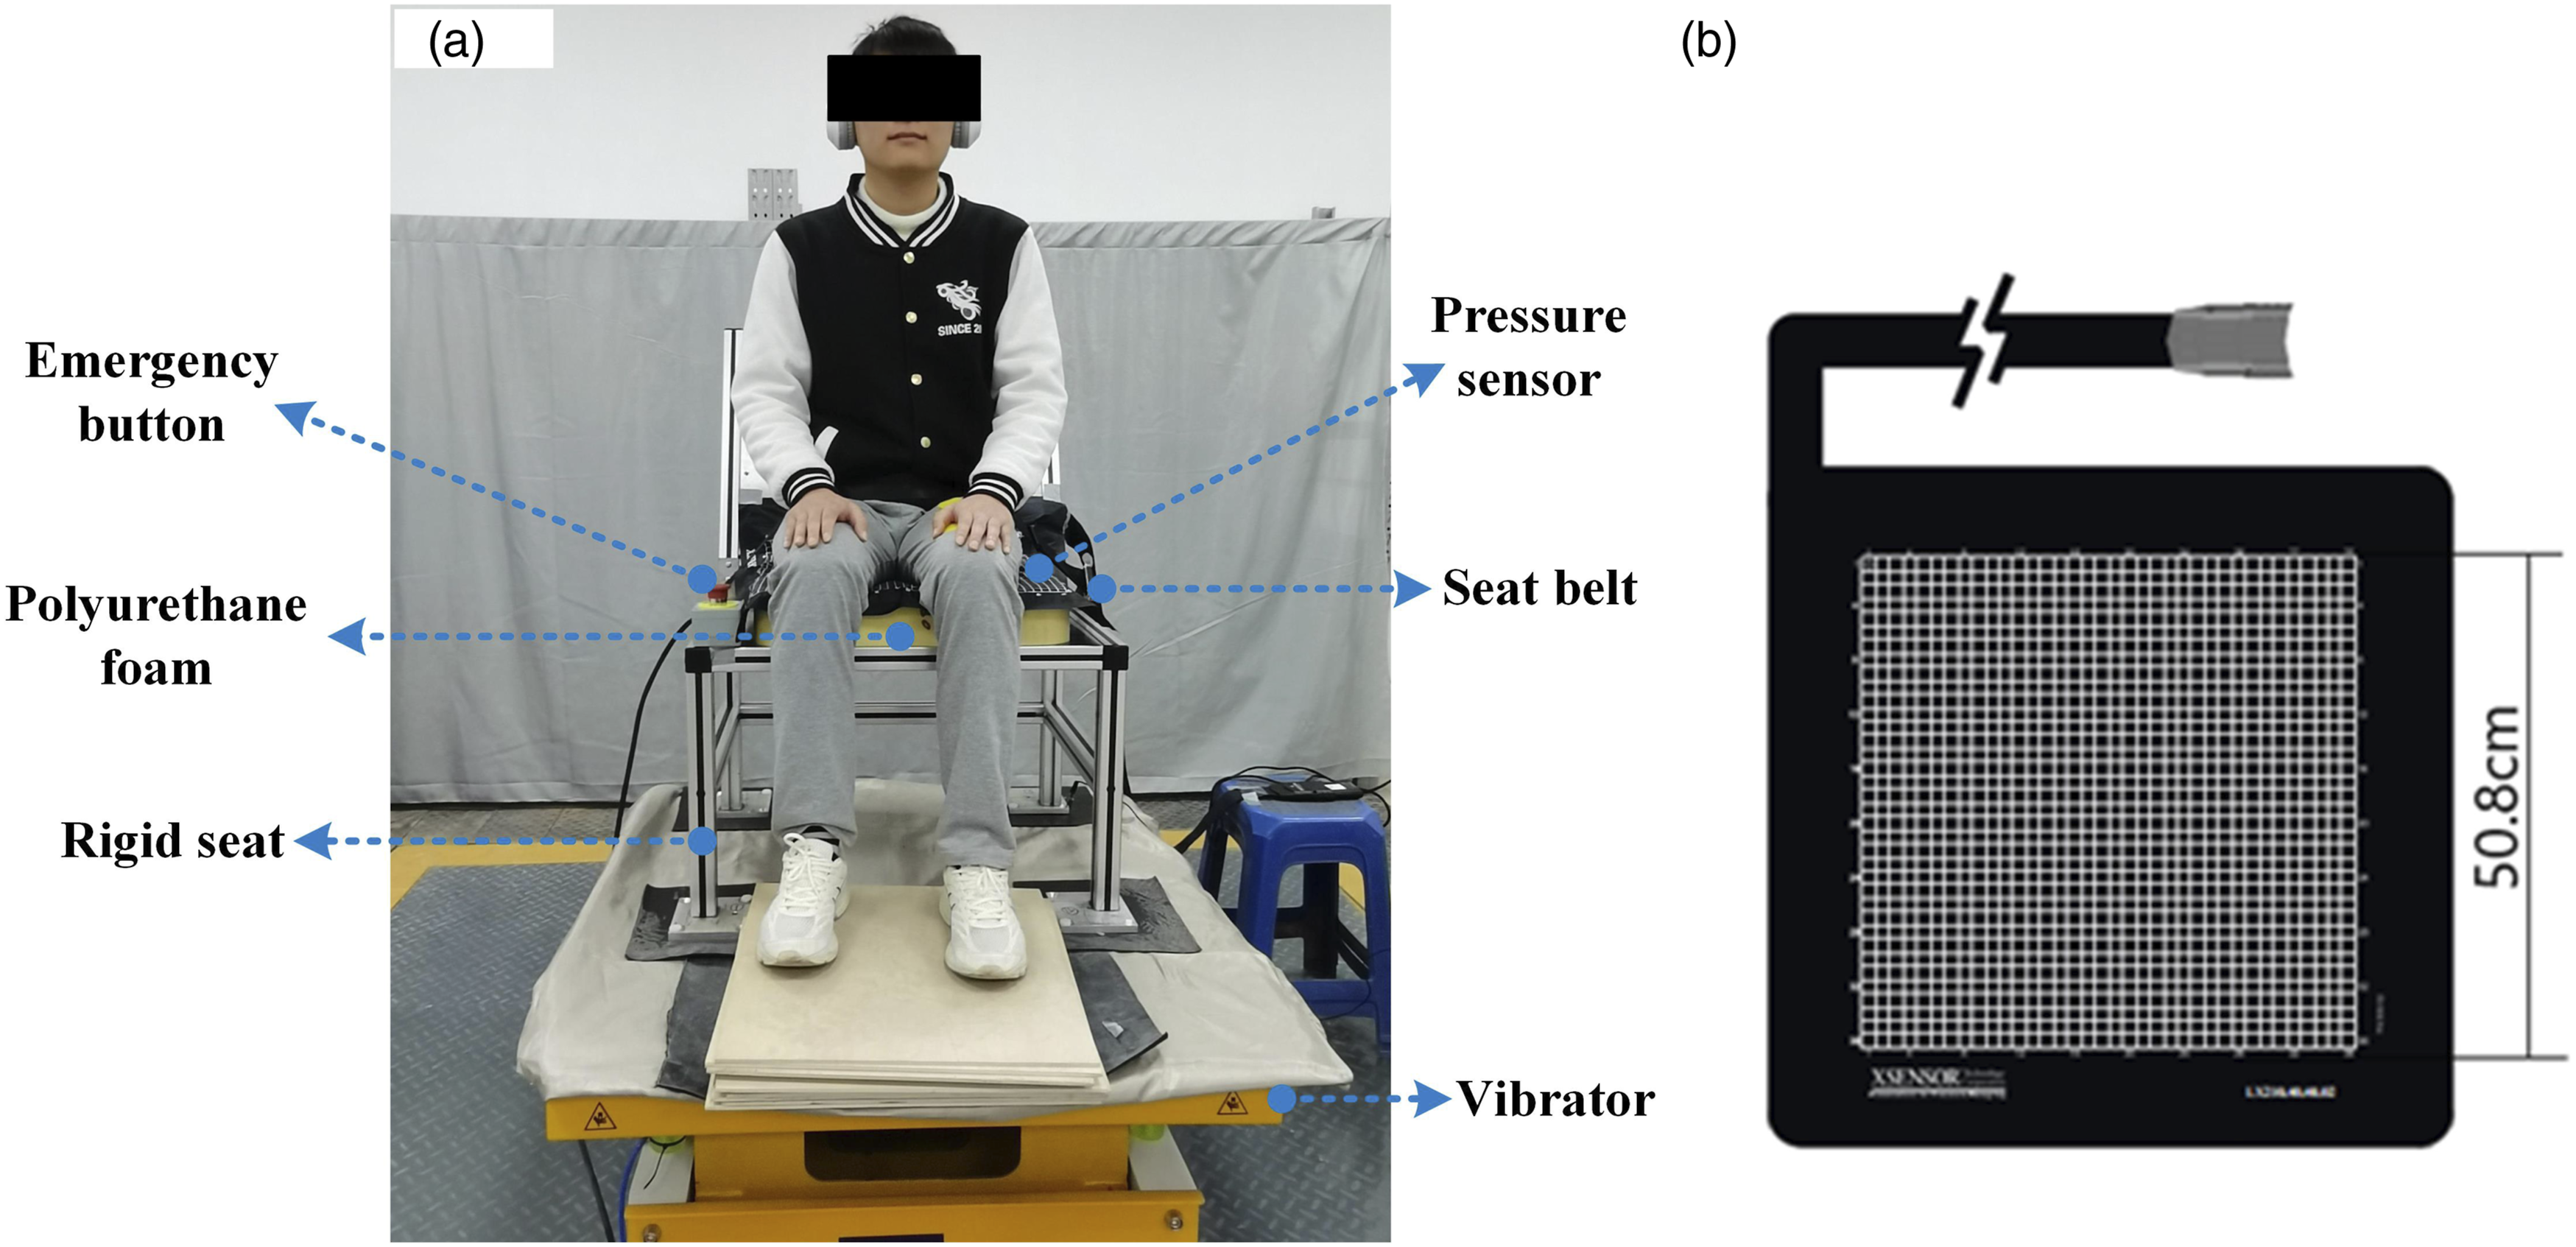
Subjects and conditions
Subject characteristics.
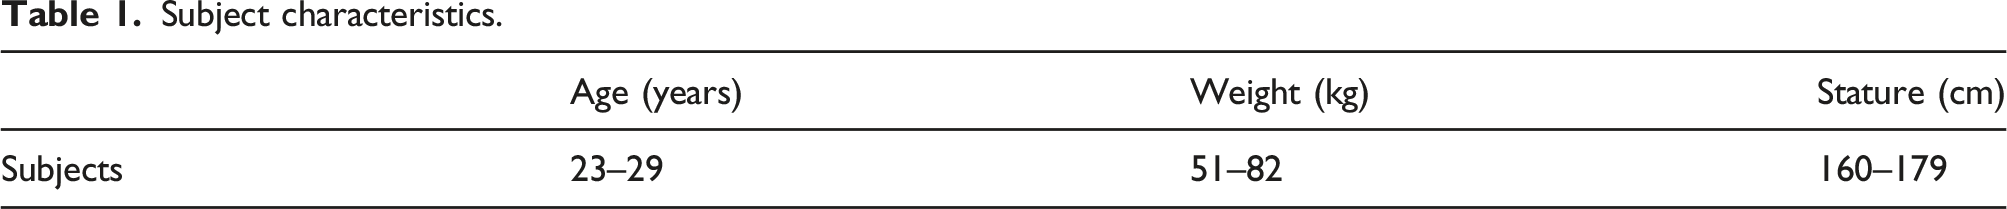
Subjects were relaxed and sat on the seat without contacting the backrest and with their hands on their thighs naturally. Their feet rested on the footrest with the thighs were kept horizontal by adjusting the height of the footrest (Figure 1(a)). All subjects were required to wear soft trousers to ensure the reliability of the test results. These random excitation signals were iteratively reproduced with the SIControl analysis system. Each excitation signal is iterated at least three times to ensure the reproduction error is less than 1%. During the test, all subjects wore seat belts. The seat belt does not affect the contact between the human body and the seat, and does not affect the human body’s judgment of subjective rating. Subjects can press the emergency stop button to terminate the test if they feel uncomfortable.
Experimental settings
A polyurethane foam cushion widely used in vehicles was selected for the test. The size of the foam cushion is 500 × 500 × 80 mm, the CLD40% hardness is 62 N, and the density is 46.99 kg/m3. Before the formal test, all subjects were required to sit on the foam seat for 3 min to ensure that the relaxation of the foam seat cushion reached a stable state. Brief instruction for each subject was required to help them familiar with the test content and procedures. Then place and fix the pressure sensor correctly to ensure that the surface was flat and without wrinkles.
In this study, the relative magnitude estimation method, as employed by Huang and Griffin, 30 was used to measure the relative discomfort caused by the vertical random vibration. In each condition, the subjects experienced vertical random excitation with a fat bandwidth from 0.5 to 20 Hz at six magnitudes (0.2, 0.4, 0.6, 0.8, 1.0, and 1.2 m/s2 r.m.s.), each excitation lasts 60 s. For each formal test, subjects were first exposed to the reference stimuli (0.5 m/s2 r.m.s.) for 30 s, and the discomfort rating to the reference stimuli was to give a value of 100. After 5 s, subjects experienced a vertical excitation (presented in random order) and gave DCR according to their experience. For instance, when the subject considers the discomfort caused by test excitations was half as unpleasant as the reference excitation, the corresponding discomfort rating should be 50. The total duration of a test for each person took about 10 min.
All subjects experienced white noise presented via a pair of headphones and closed their eyes to reduce the influence of sight and noise on subjective judgments. Each test was repeated twice. If the subject is unsure of their judgment, they can ask to replay the paired excitation.
Dynamic body pressure indicator
The mean average dynamic pressure (MADP) 
The mean peak dynamic pressure (MPDP) 
The mean dynamic contact area (MDCA) 
Pressure change rate root-mean-square P
crms
is the pressure change rate of dynamic body pressure p(t) on each time history.
28
P
crms
is defined as follows:
Its discrete form is

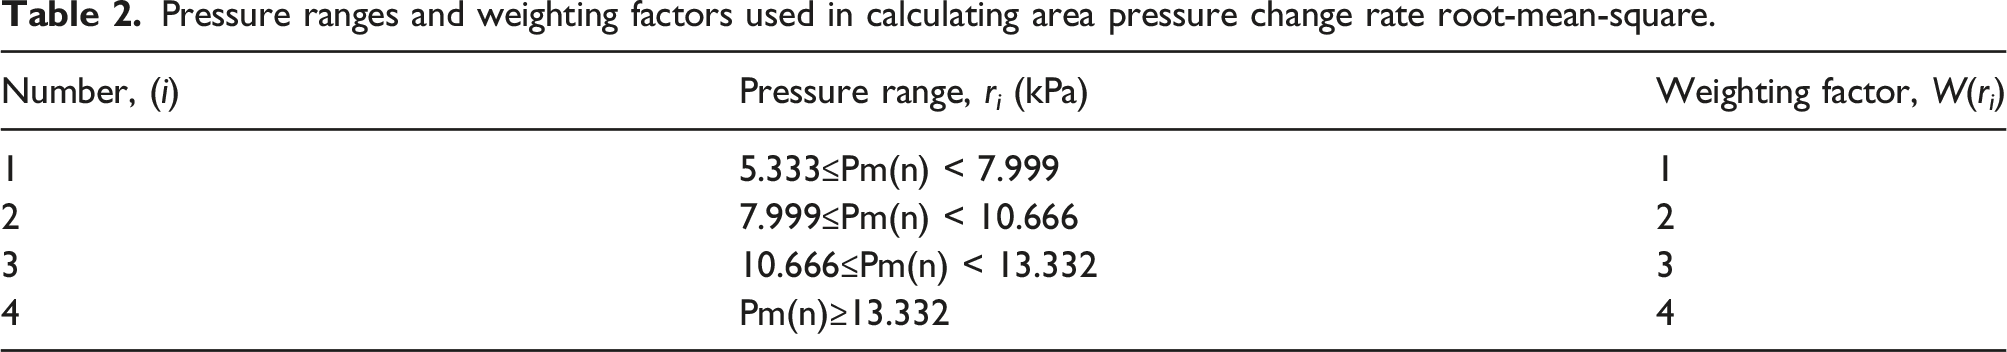
Pressure ranges and weighting factors used in calculating area pressure change rate root-mean-square.
The previous research showed that the discomfort of the seated human body under vibration is related to the force at the human-seat interface.
32
For this reason, this study proposes the mean normal dynamic force (MNDF) and normal dynamic force change rate root-mean-square (NDFcrms) considering dynamic body pressure distribution and contact areas. The MNDF is the arithmetic average of the normal dynamic force (NDF) in all frames of a period, defined as follows:
The NDFcrms is defined as follows:
Statistical analysis
The relation between the objective physical magnitude of the stimulus and the rating of corresponding subjective sensations can be described with Stevens’ power law,33,34 and it is defined as
Stevens’ power law is used to investigate the relationship between dynamic body pressure indicators (in section 2.4) and the DCR in this study. Linear regression was performed after the logarithmic transformation of equation (9) to
The median dynamic body pressure indicators of the twelve subjects were taken as the objective physical magnitude, and the median DCR was taken as the subjective sensation rating. The linear regression of subjective and objective test data was realized with equation (10). The fitting effect is judged by equation (11)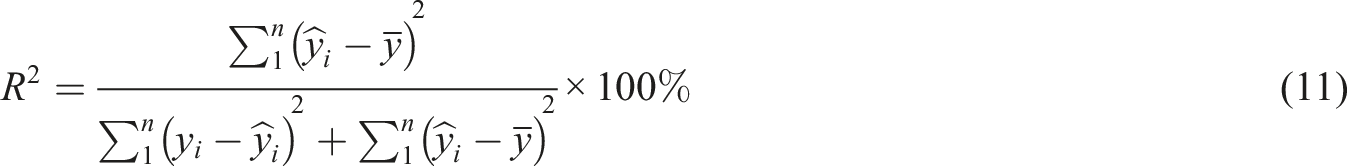
The hypotheses were tested with non-parametric tests. The statistically significant difference between related samples was estimated using the Friedman two-way analysis of variance and Wilcoxon matched-pair signed-rank test. The Spearman rank-order correlation was used to investigate associations between the dynamic body pressure indicator and the discomfort rating.
Result
The subjective discomfort rating
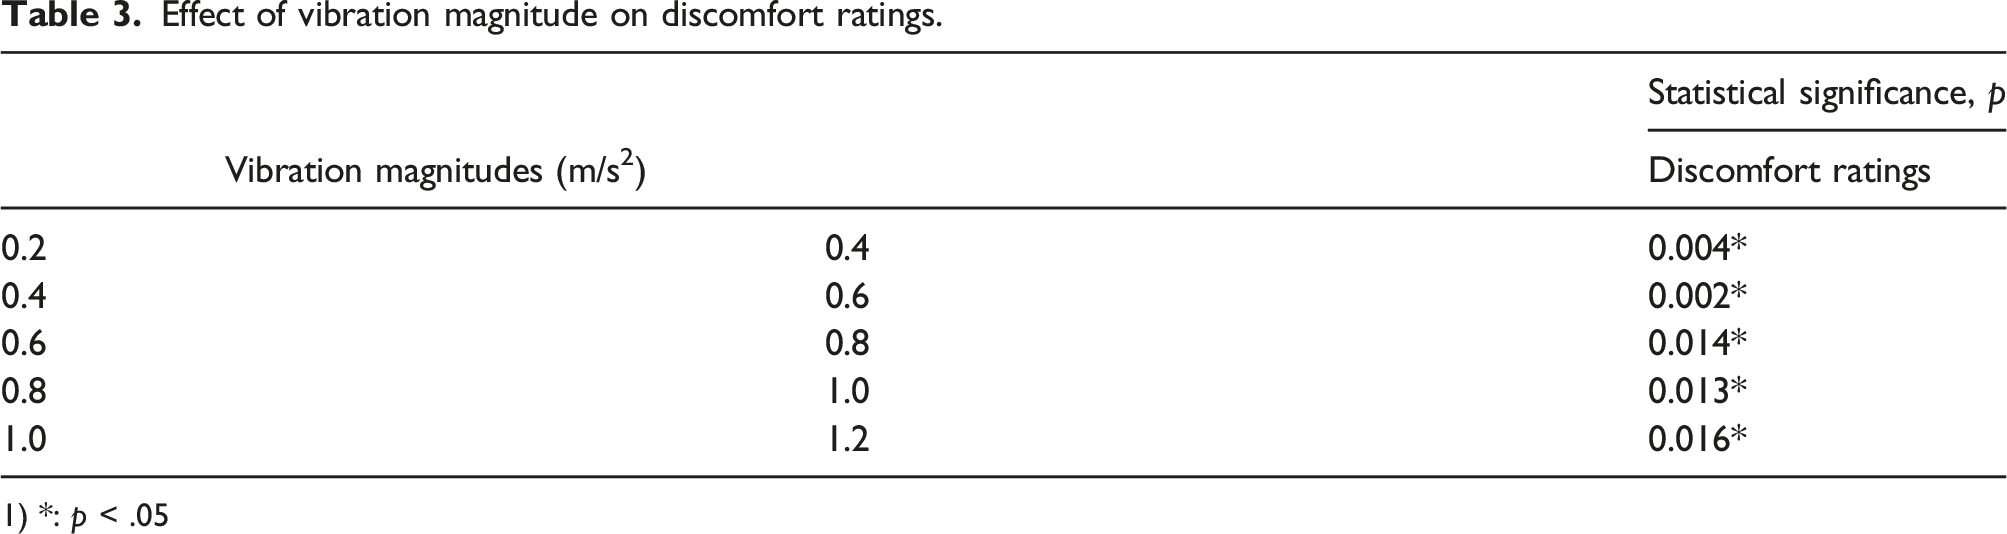
With the increase of vibration magnitude, the vibration transmitted to the human body through foam cushion increases. For the same foam cushion and fixed sitting posture, the change of vibration magnitude leads to changes in discomfort. The DCR of the twelve subjects at different vibration magnitudes are shown in Figure 2. The DCR increase with the increase of the vibration magnitudes (from 0.2 to 1.2 m/s2). For the same vibration magnitude, the DCR of different subjects are different, which indicates that the differences among subjects may lead to a different subjective sensation at the same vibration magnitude. The statistical analysis showed that the changes in vibration magnitudes had a significant effect on DCR (Friedman, p < .01). These samples were grouped and paired according to the different vibration magnitudes and performed the non-parametric statistical analysis, shown in Table 3. It can be seen that the increase of vibration magnitude can significantly change DCR (Wilcoxon, p < . 05). Discomfort ratings under different vibration magnitudes. Effect of vibration magnitude on discomfort ratings. 1) *: p < .05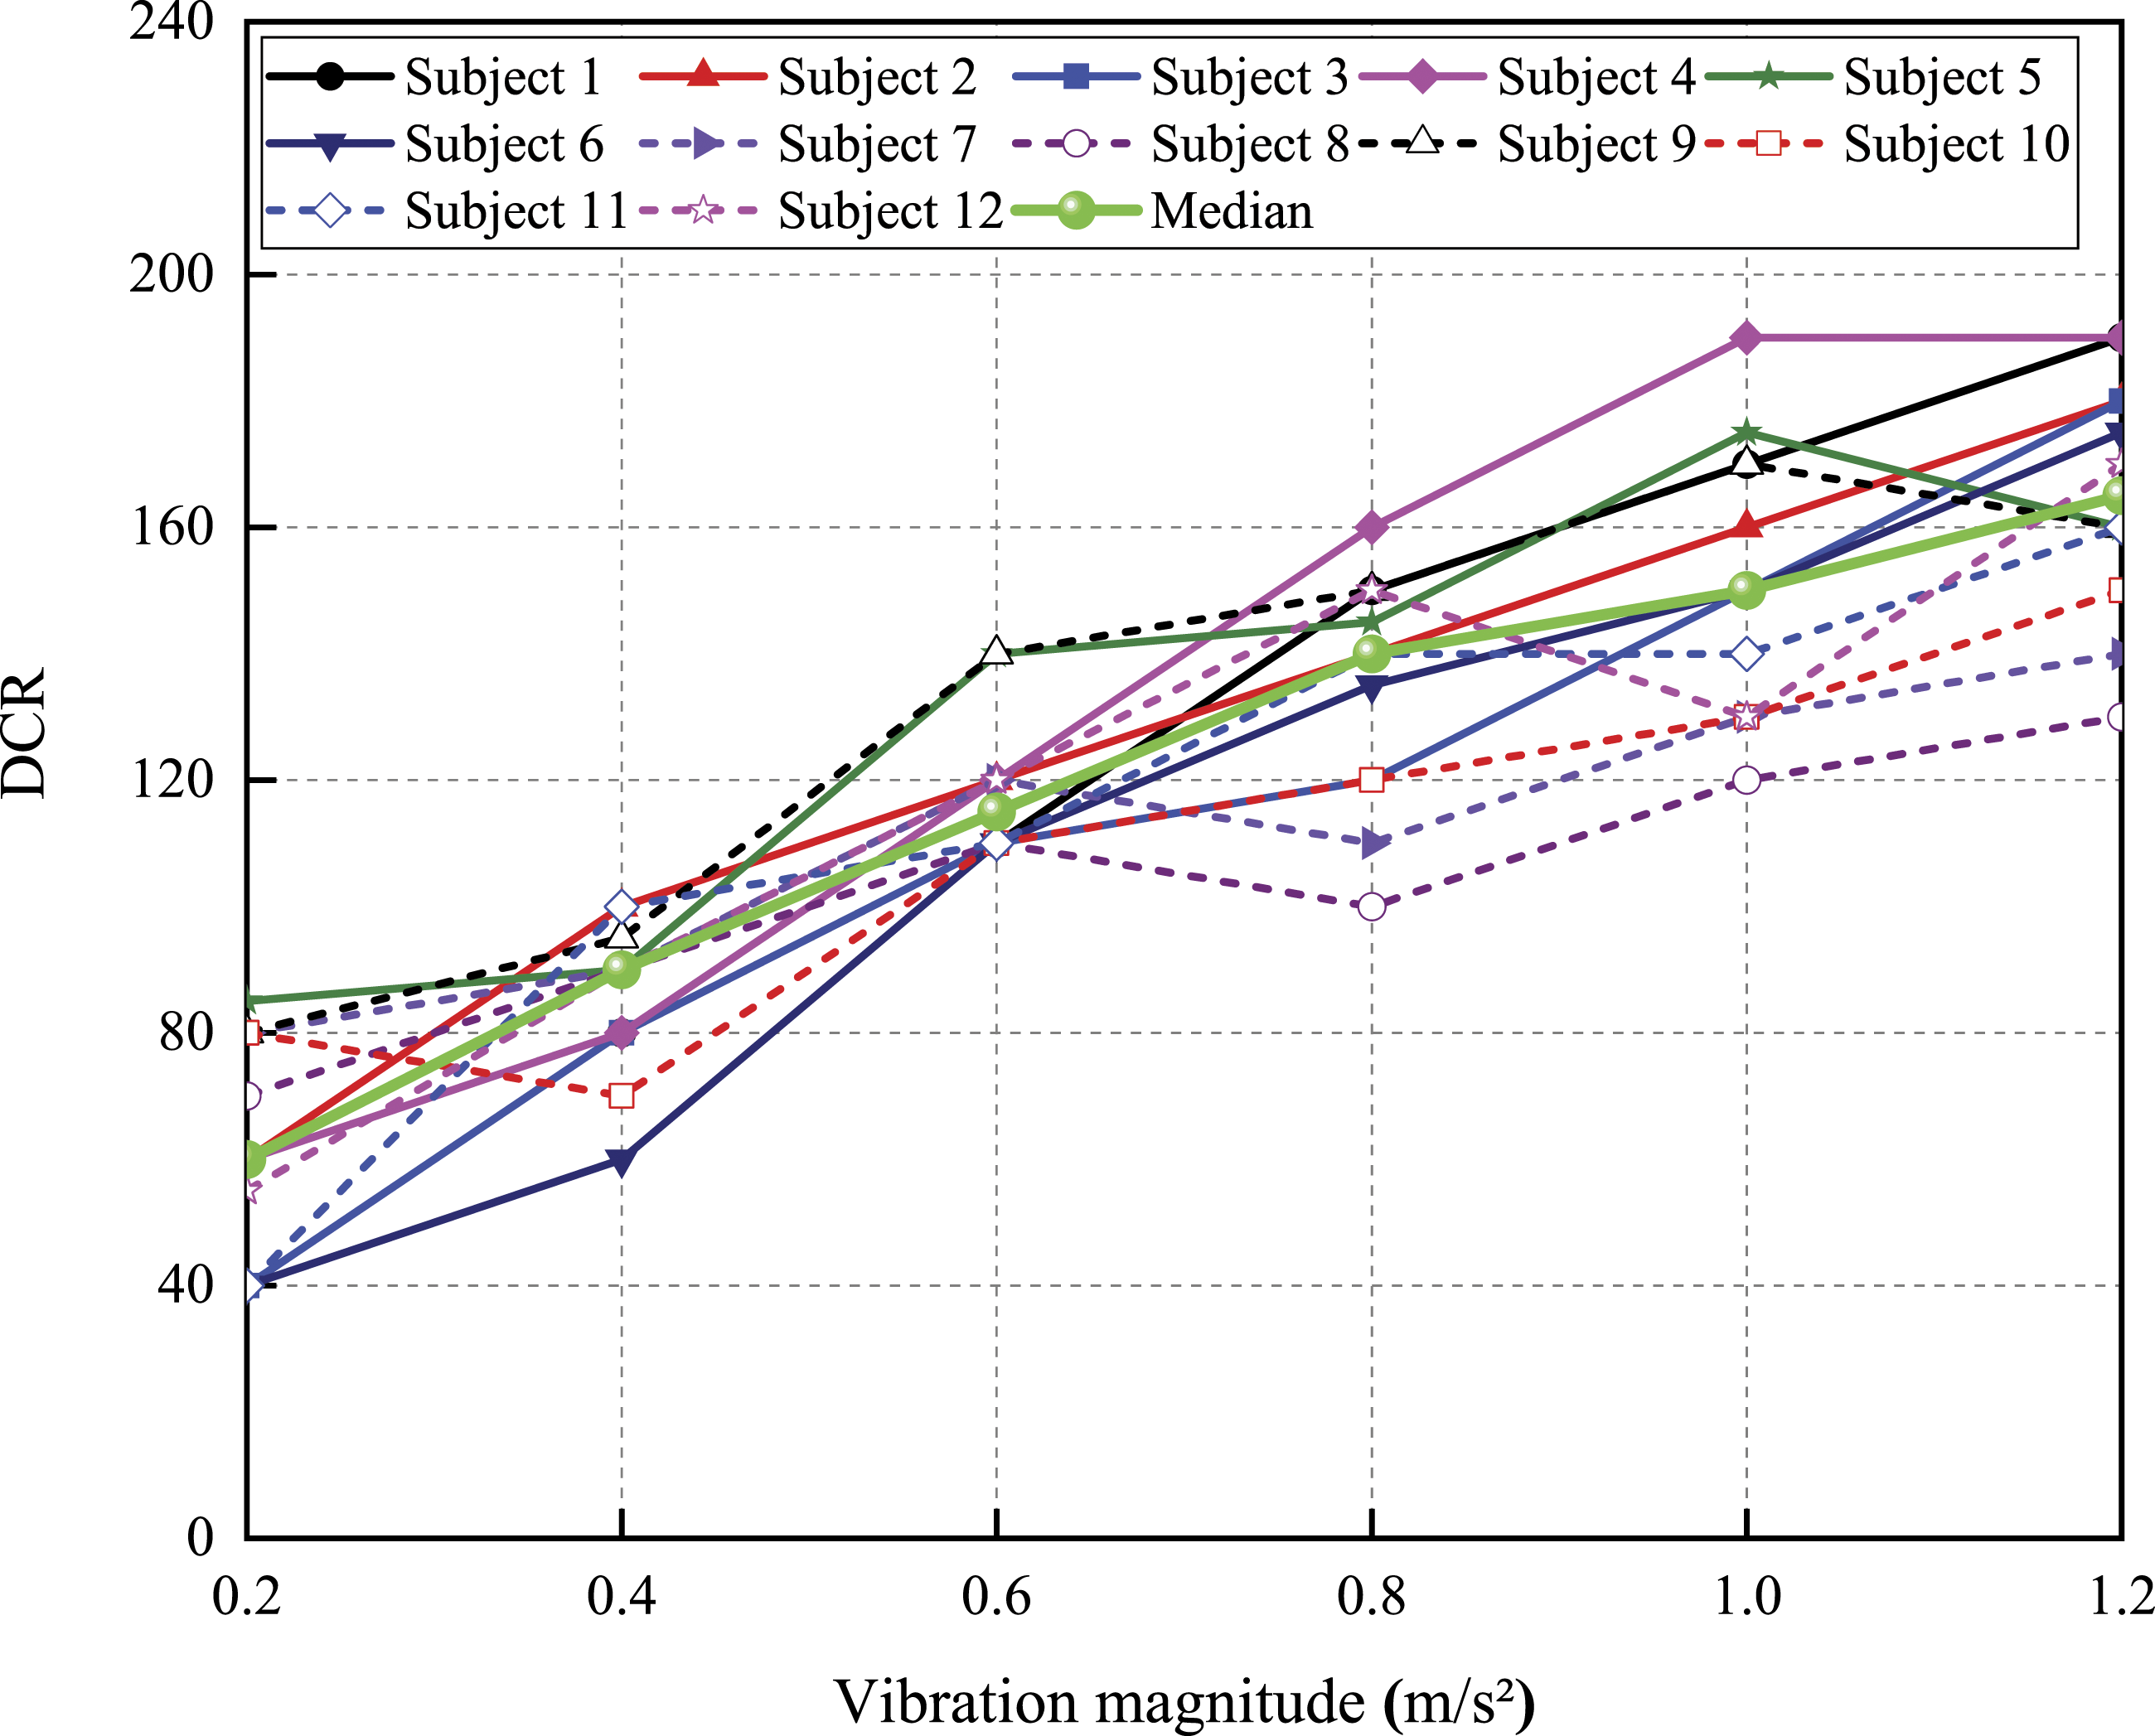
The objective indicators related to dynamic body pressure
Figure 3 shows the dynamic body pressure contours of a subject at 10 s, 20 s, and 30 s. It could be seen that the pressure changed at different times under random vibration excitation. The maximum pressure occurred in the vicinity of the ischial tuberosity and gradually decreased outward from the ischial tuberosity as the center. The distribution form of the dynamic body pressure is similar to the results reported by Wu et al.
14
However, it is difficult to directly compare the test pressure data with that in the literature due to the differences between experimental conditions and subjects. Pressure distribution of a subject at different times: (a) 10 s; (b) 20 s; and (c) 30 s.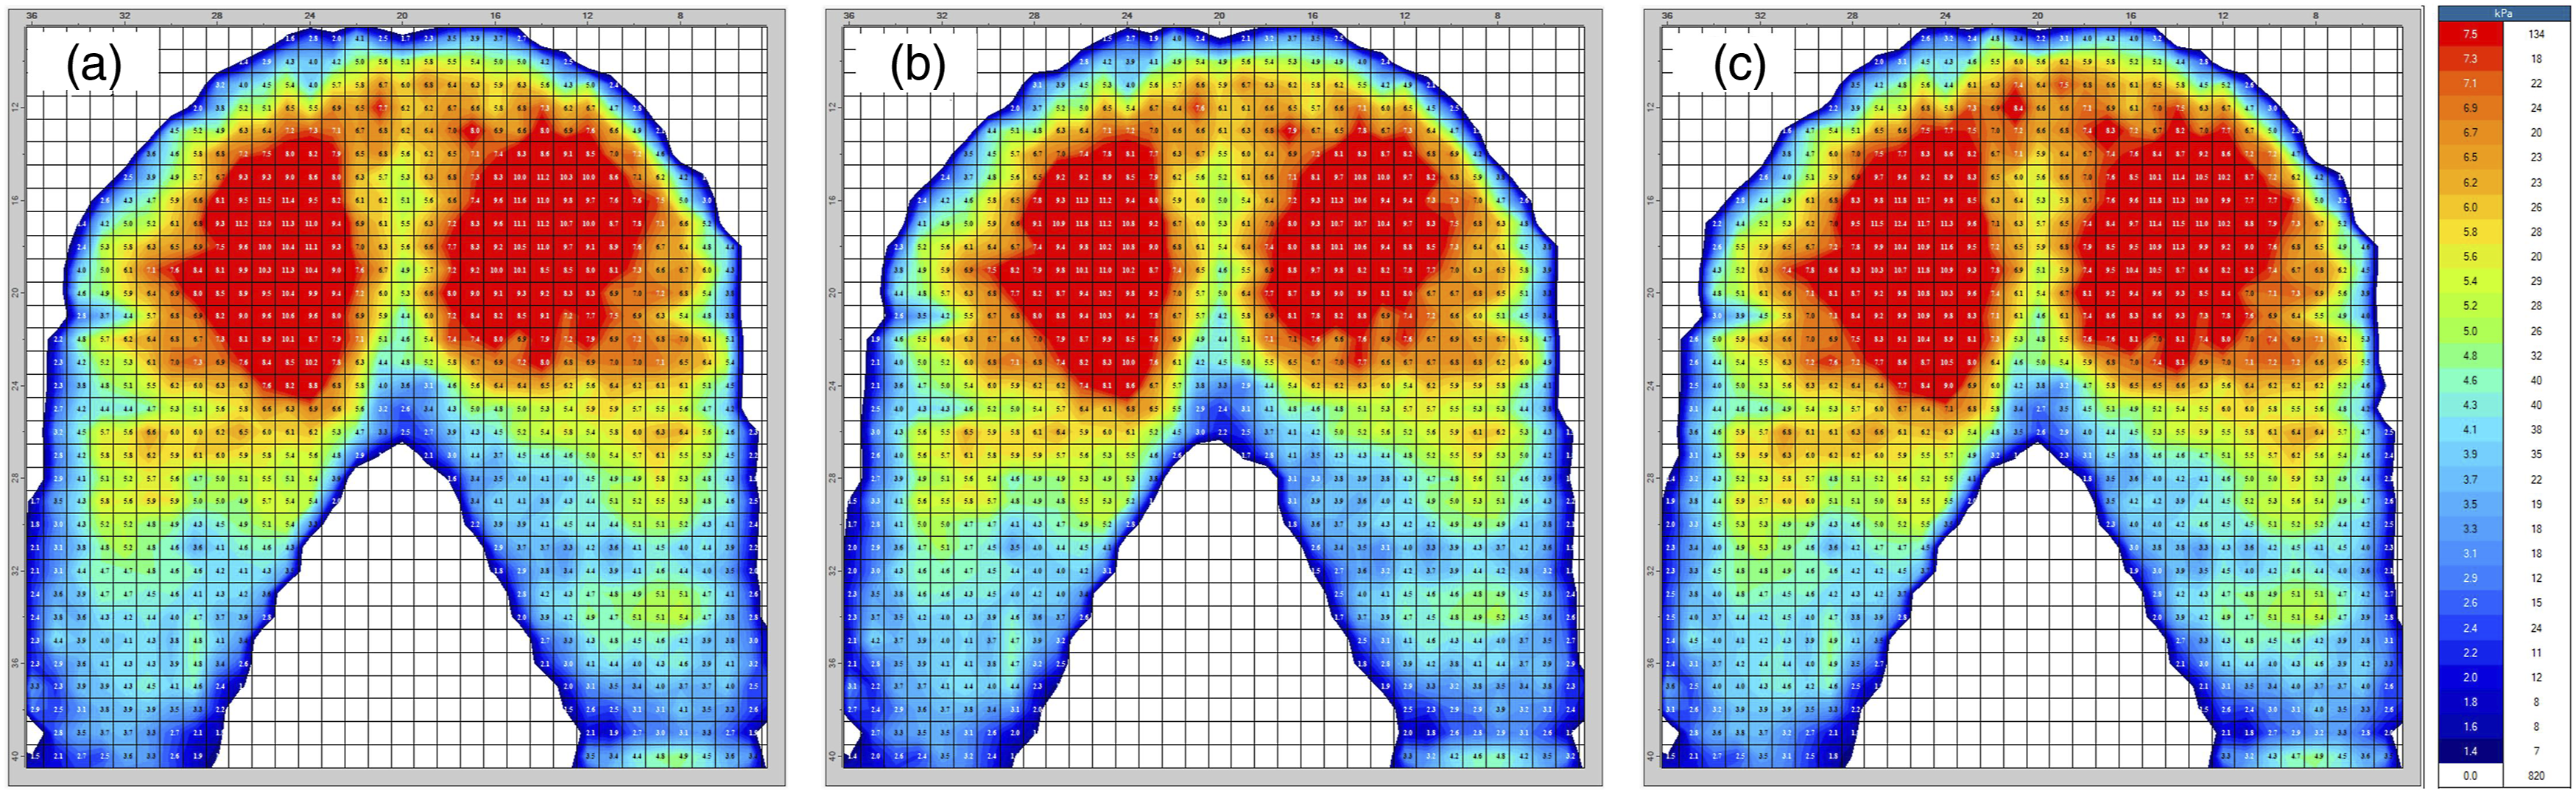
A stable 50 s data of dynamic body pressure was selected for processing. The MADP, MPDP, MDCA, ADPcrms, and PDPcrms of each subject under different vibration magnitudes were obtained, as shown in Figure 4 and Figure 5. These pressure indicators of each subject are slightly or significantly different under the same vibration magnitude due to the differences between subjects (such as stature and weight). The statistical significance of the effect of excitation magnitudes on dynamic body pressure indicators shows that the increase of vibration magnitude has no significant influence on the MADP (Friedman, p > .05), MPDP (Friedman, p > .05), and MDCA (Friedman, p > .05). On the contrary, the variation of vibration magnitude has a significant influence on the ADPcrms (Friedman, p < .01) and PDPcrms (Friedman, p < .01). These samples were grouped and paired according to vibration magnitudes for non-parametric statistical analysis, shown in Table 4. The results show that the ADPcrms and PDPcrms (except 1.0 and 1.2 m/s2) increase with the increase of vibration magnitude (Wilcoxon, p < .05). Indicators related to dynamic body pressure under different vibration magnitudes: (a) Mean average dynamic pressure; (b) Mean peak dynamic pressure; and (c) Mean dynamic contact area. The average dynamic pressure change rate root-mean-square and peak dynamic pressure change rate root-mean-square under different vibration magnitudes. Effect of vibration magnitude on dynamic body pressure indicators. 1) *: p < .05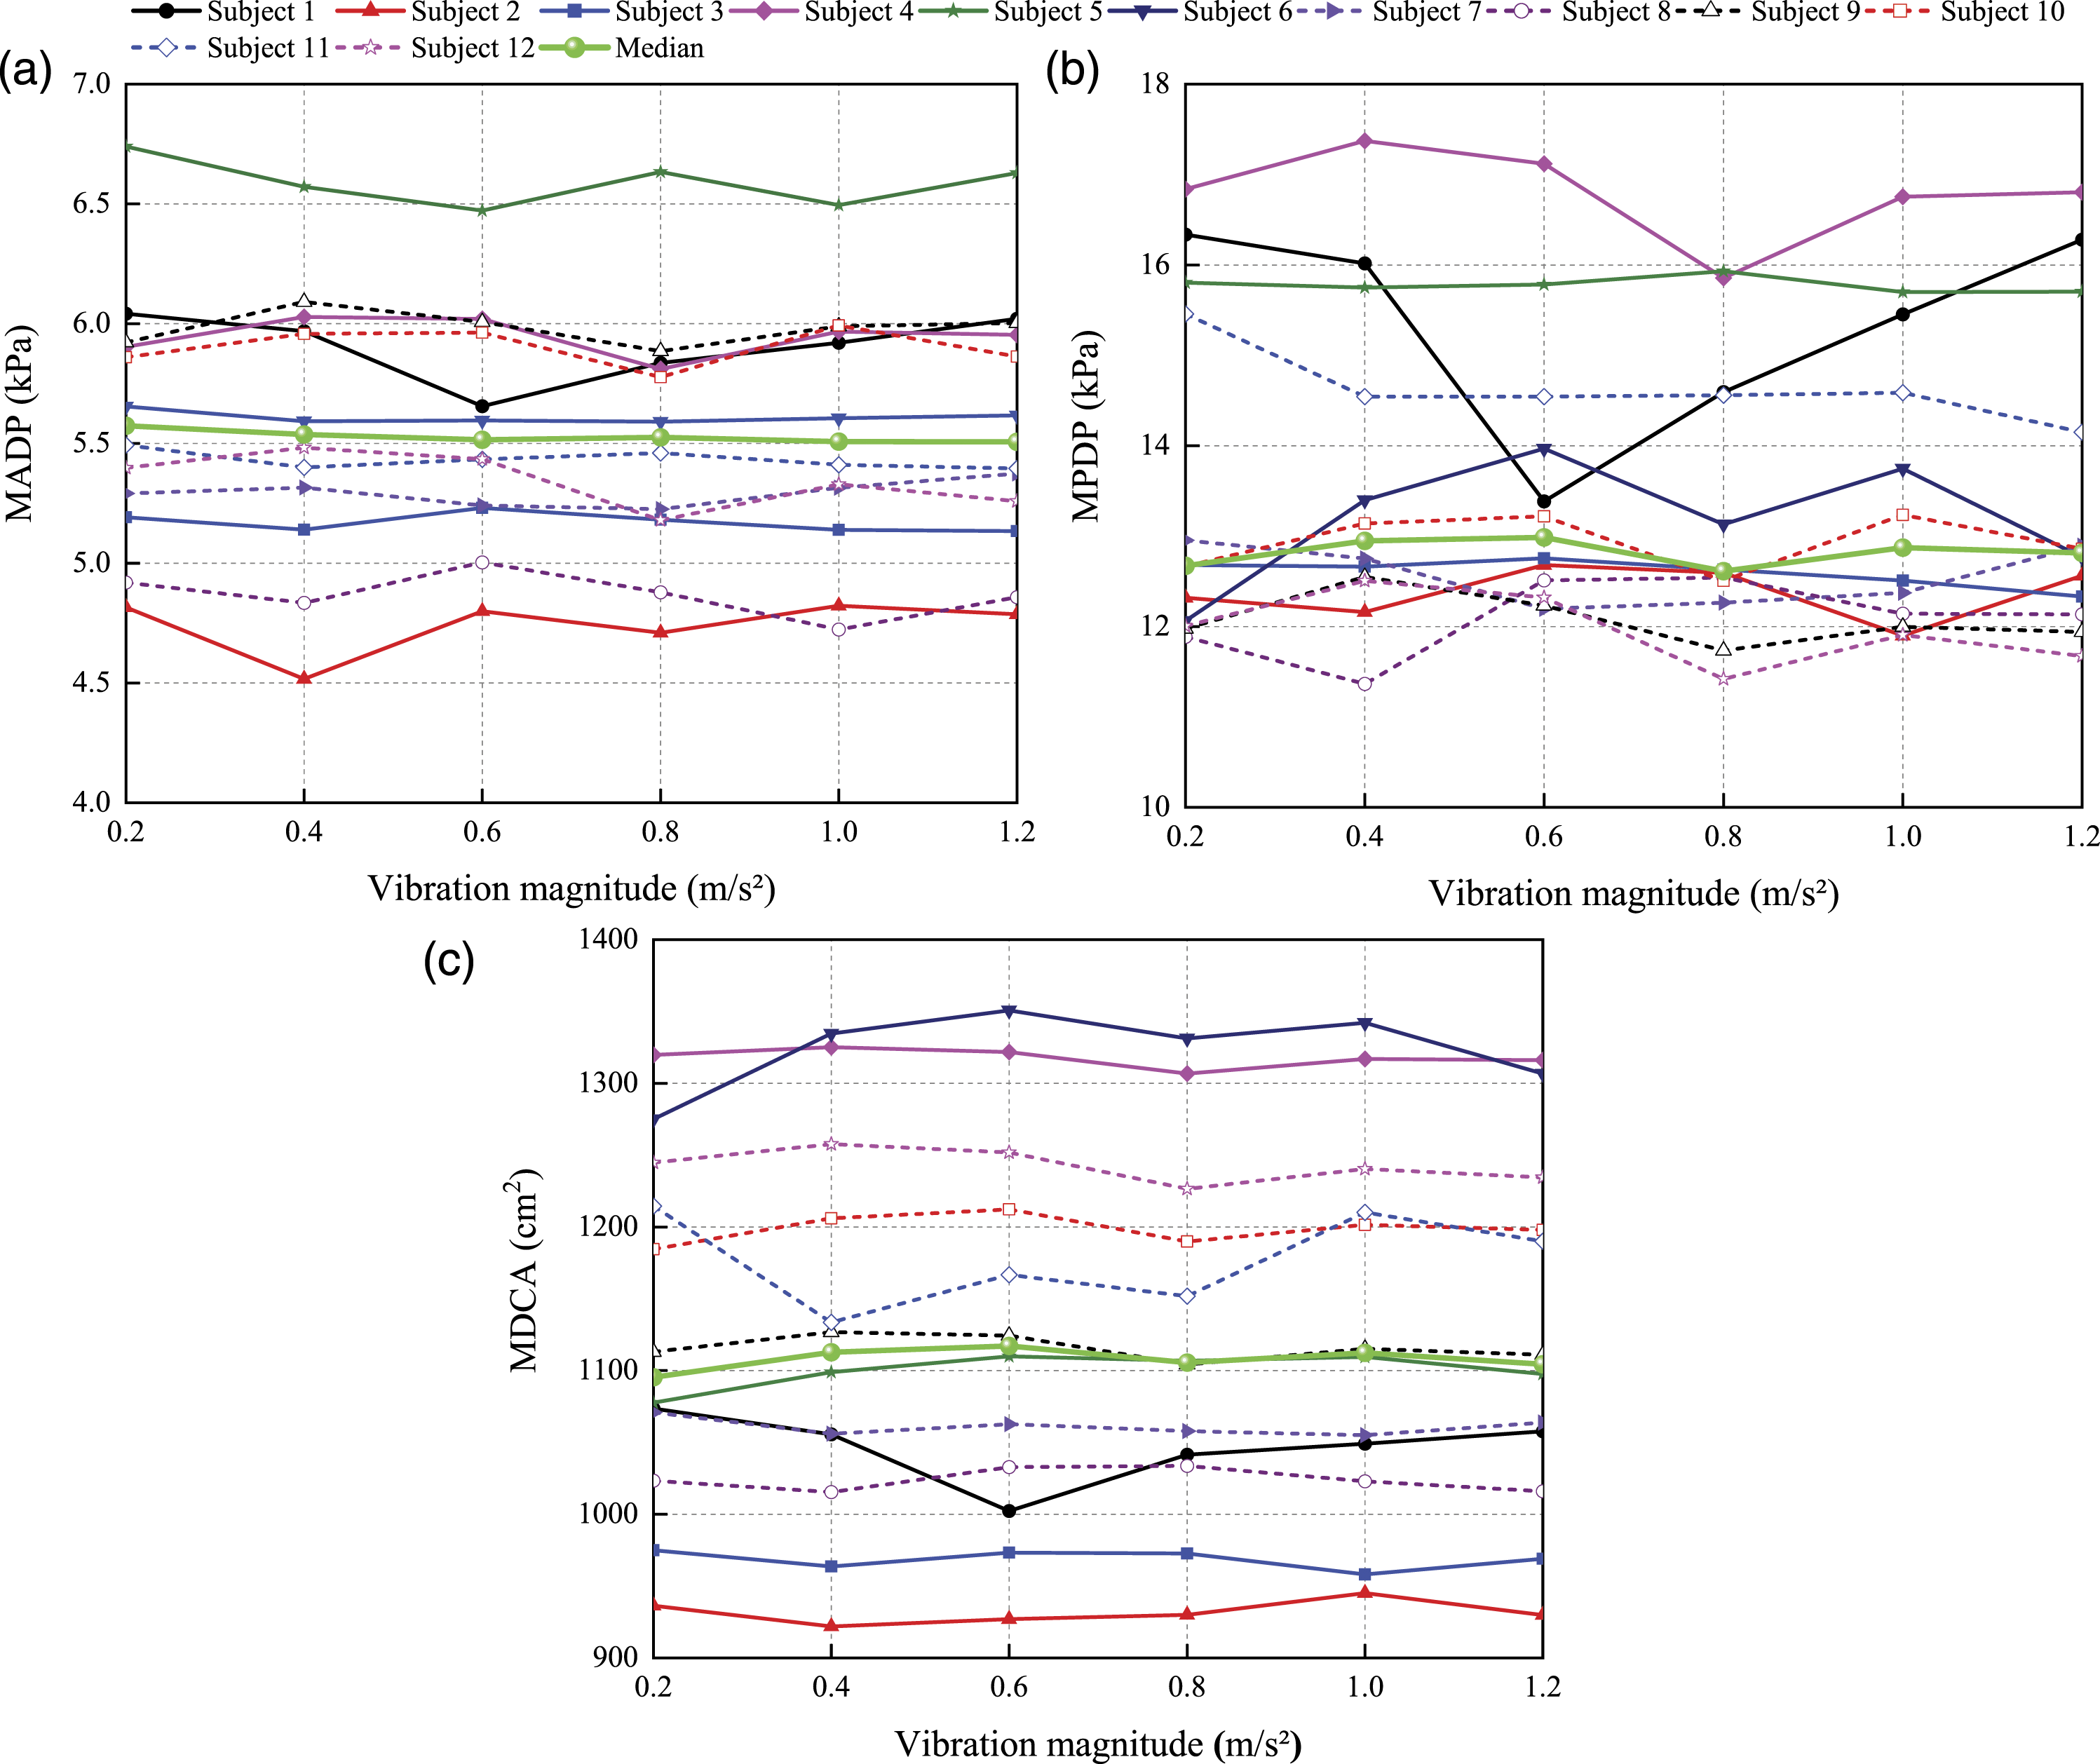
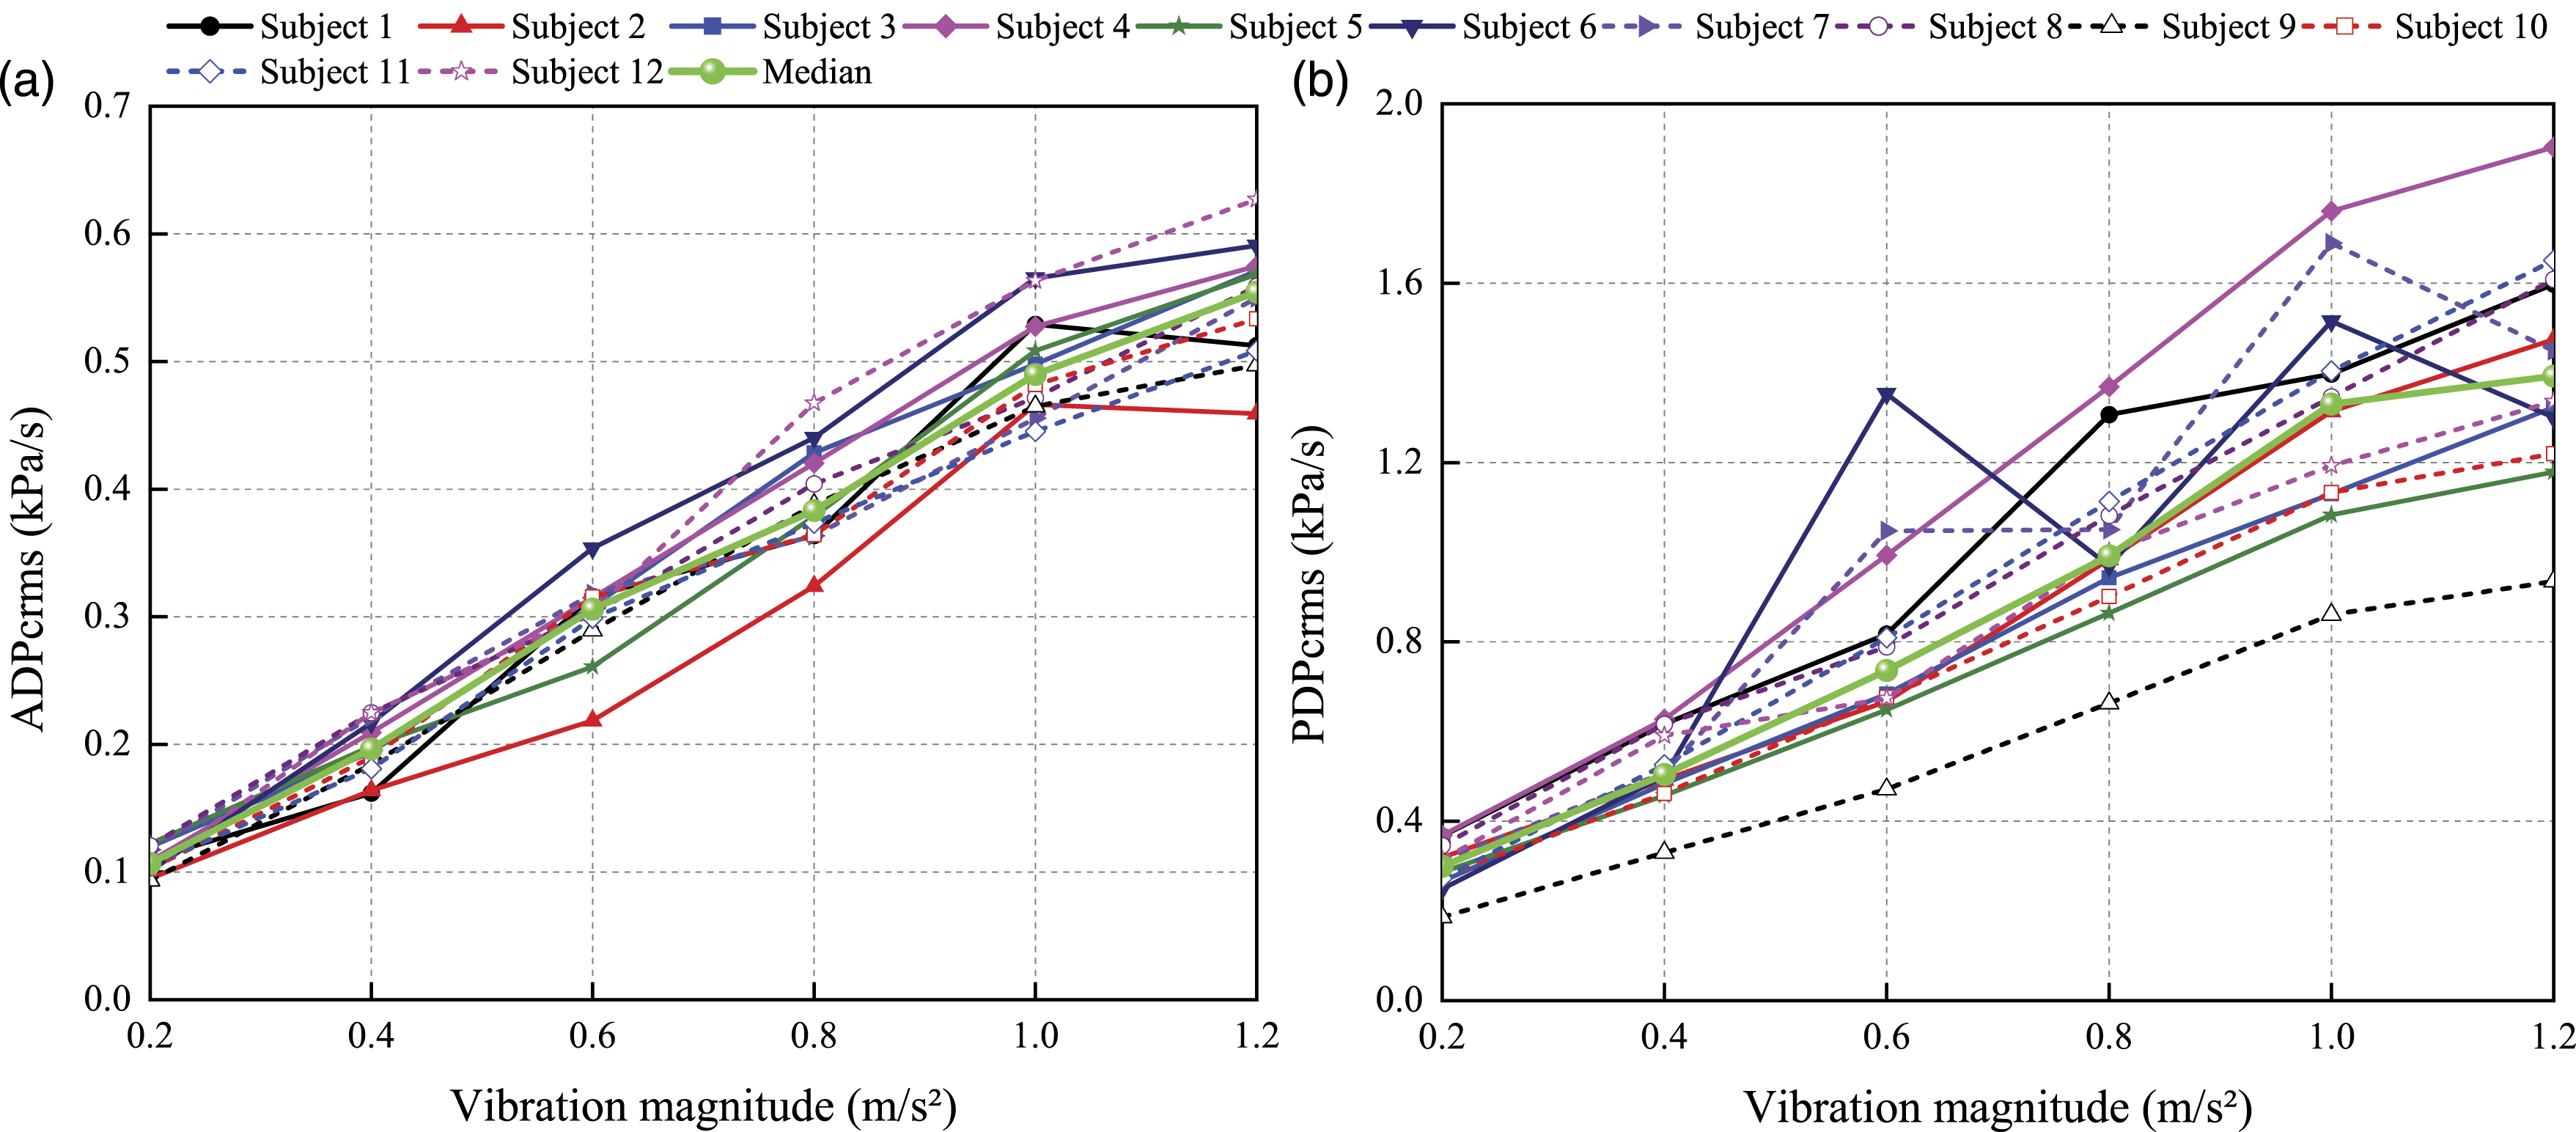
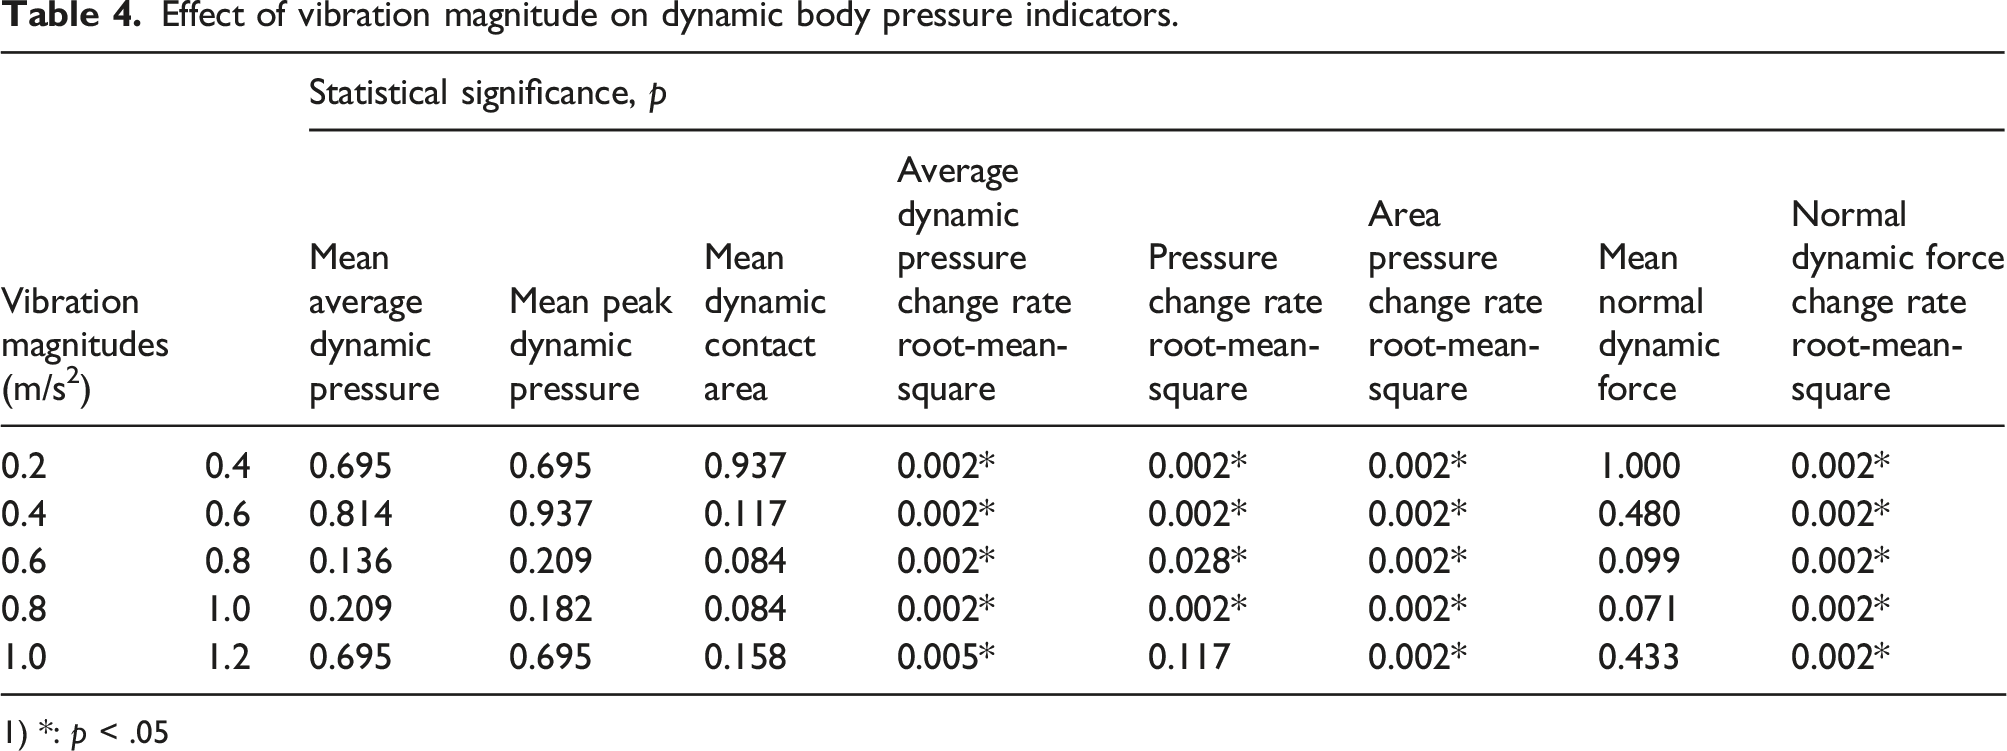
Figure 6 shows the effect of the vibration magnitude on the APcrms. It can be seen that the APcrms gradually increase with the increase of vibration magnitude. The difference in the APcrms between different subjects is more significant at higher vibration magnitude. The results of non-parametric statistical analysis show that the change of vibration magnitude has a significant influence on the APcrms (Friedman, p < .01). The APcrms gradually increased with vibration magnitude increase (Wilcoxon, p < .05). The area pressure change rate root-mean-square under different vibration magnitudes.
The analysis results of MNDF and NDFcrms under different vibration magnitudes are shown in Figure 7. The same variation of the NDFcrms was found as the APcrms with the increase of vibration magnitude. It is worth noting that the individual difference of the NDFcrms between different subjects is smaller compared to APcrms with the increase of vibration magnitude. The results of statistical significance show that the increase of vibration magnitude has a significant influence on the NDFcrms (Friedman, p < .01) but has no significant effect on the MNDF (Friedman, p > .05). It can be seen from Table 4 that the increase of vibration magnitude leads to a significant increase of the NDFcrms (Wilcoxon, p < .05). Indicators related to normal dynamic force under different vibration magnitudes: (a) Mean normal dynamic force and (b) Normal dynamic force change rate root-mean-square.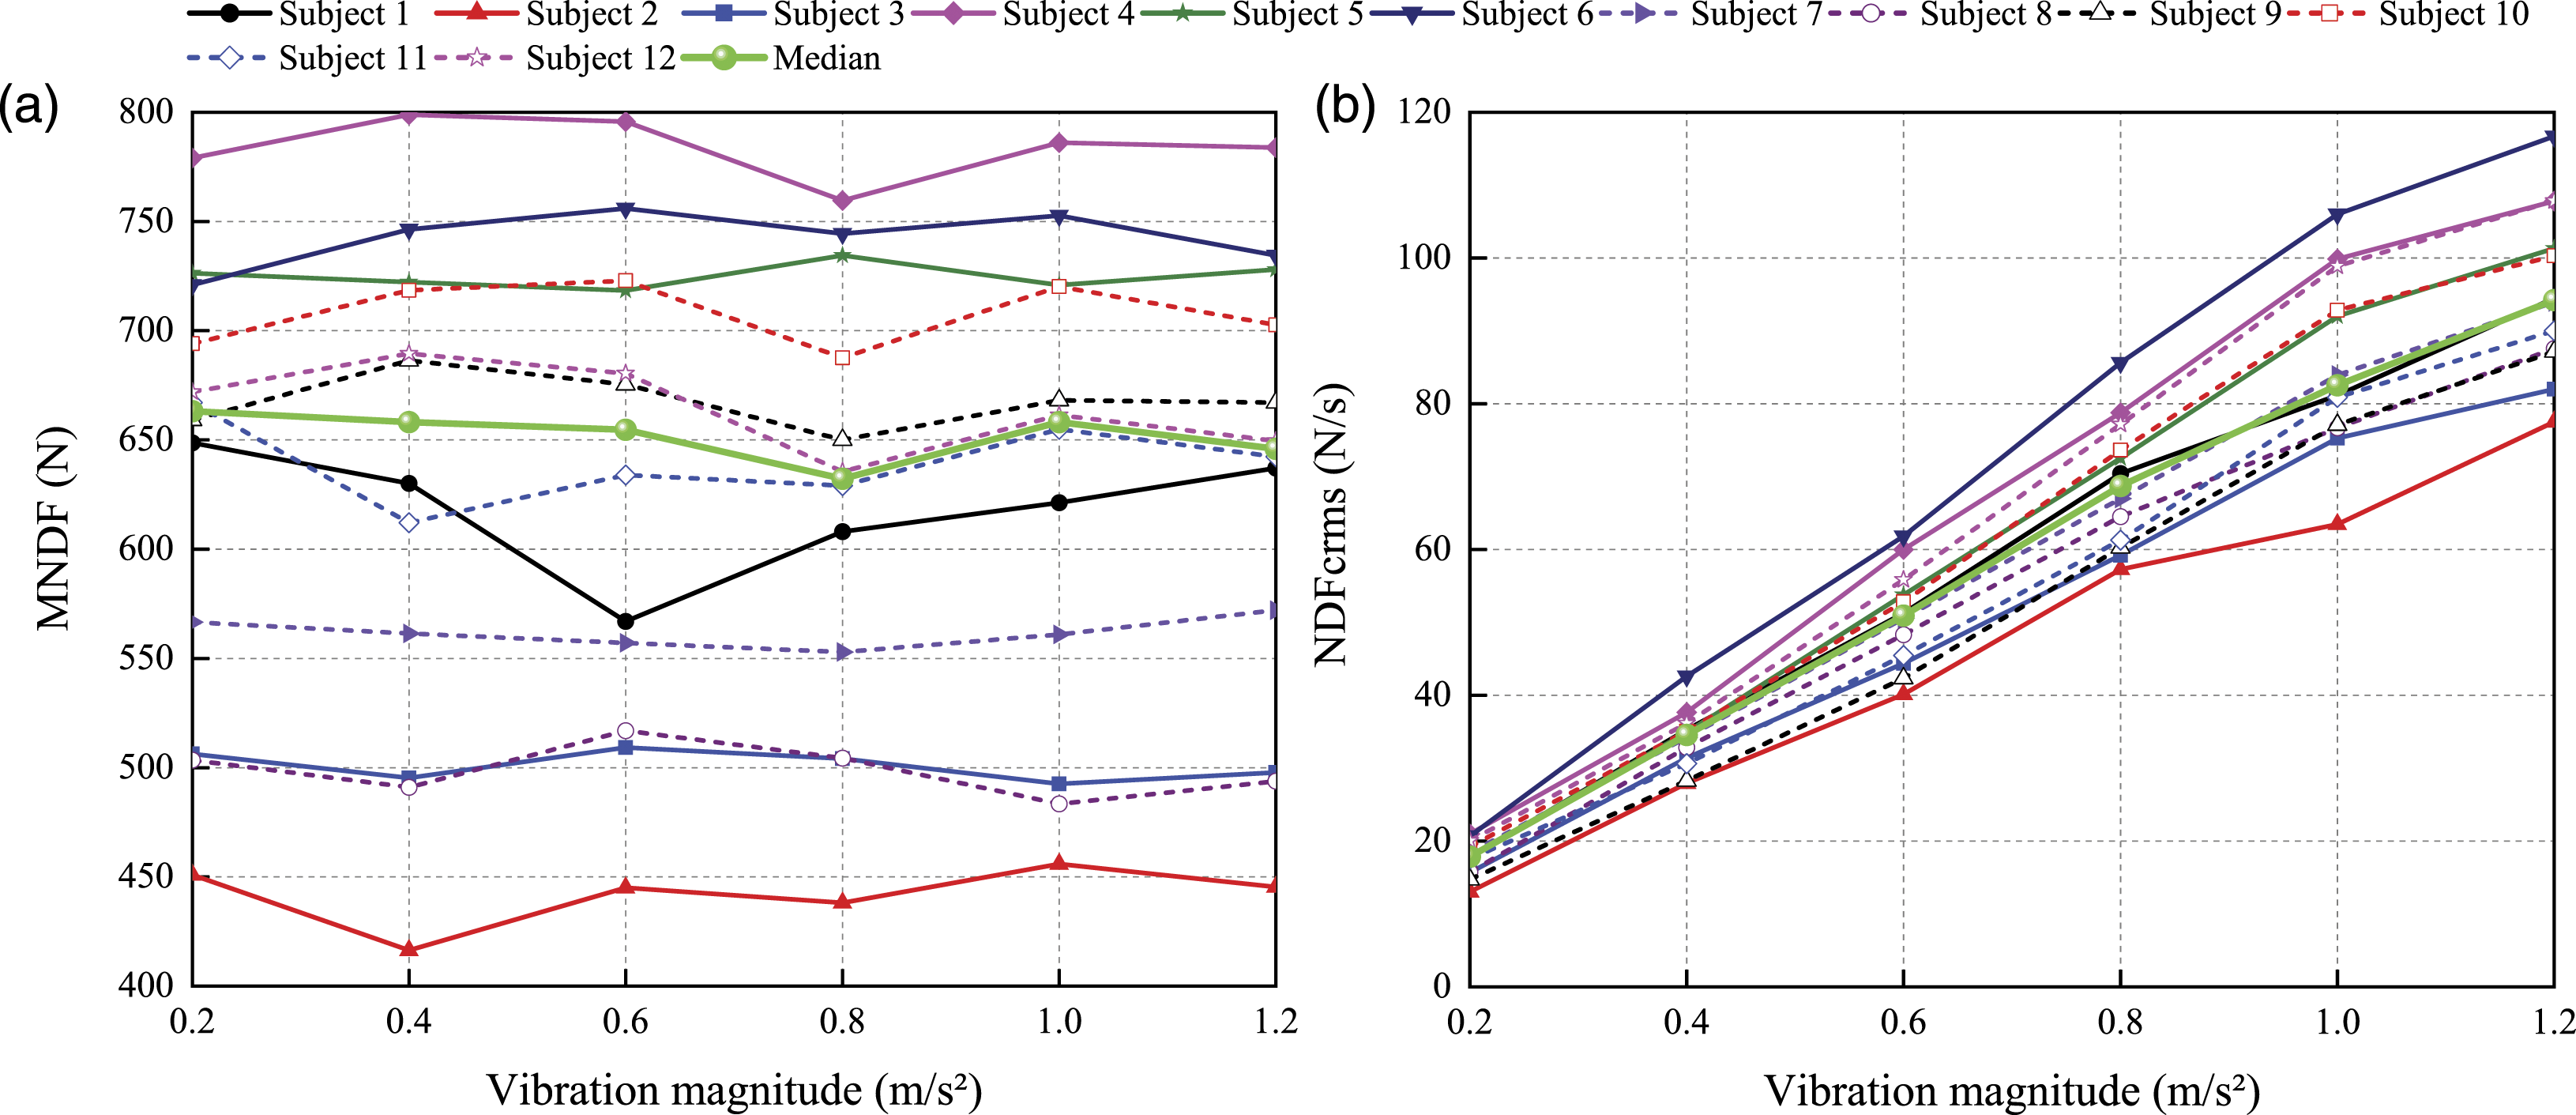
Relation between subjective discomfort ratings and objective indicators
Correlation coefficient between discomfort ratings and dynamic body pressure indicators.
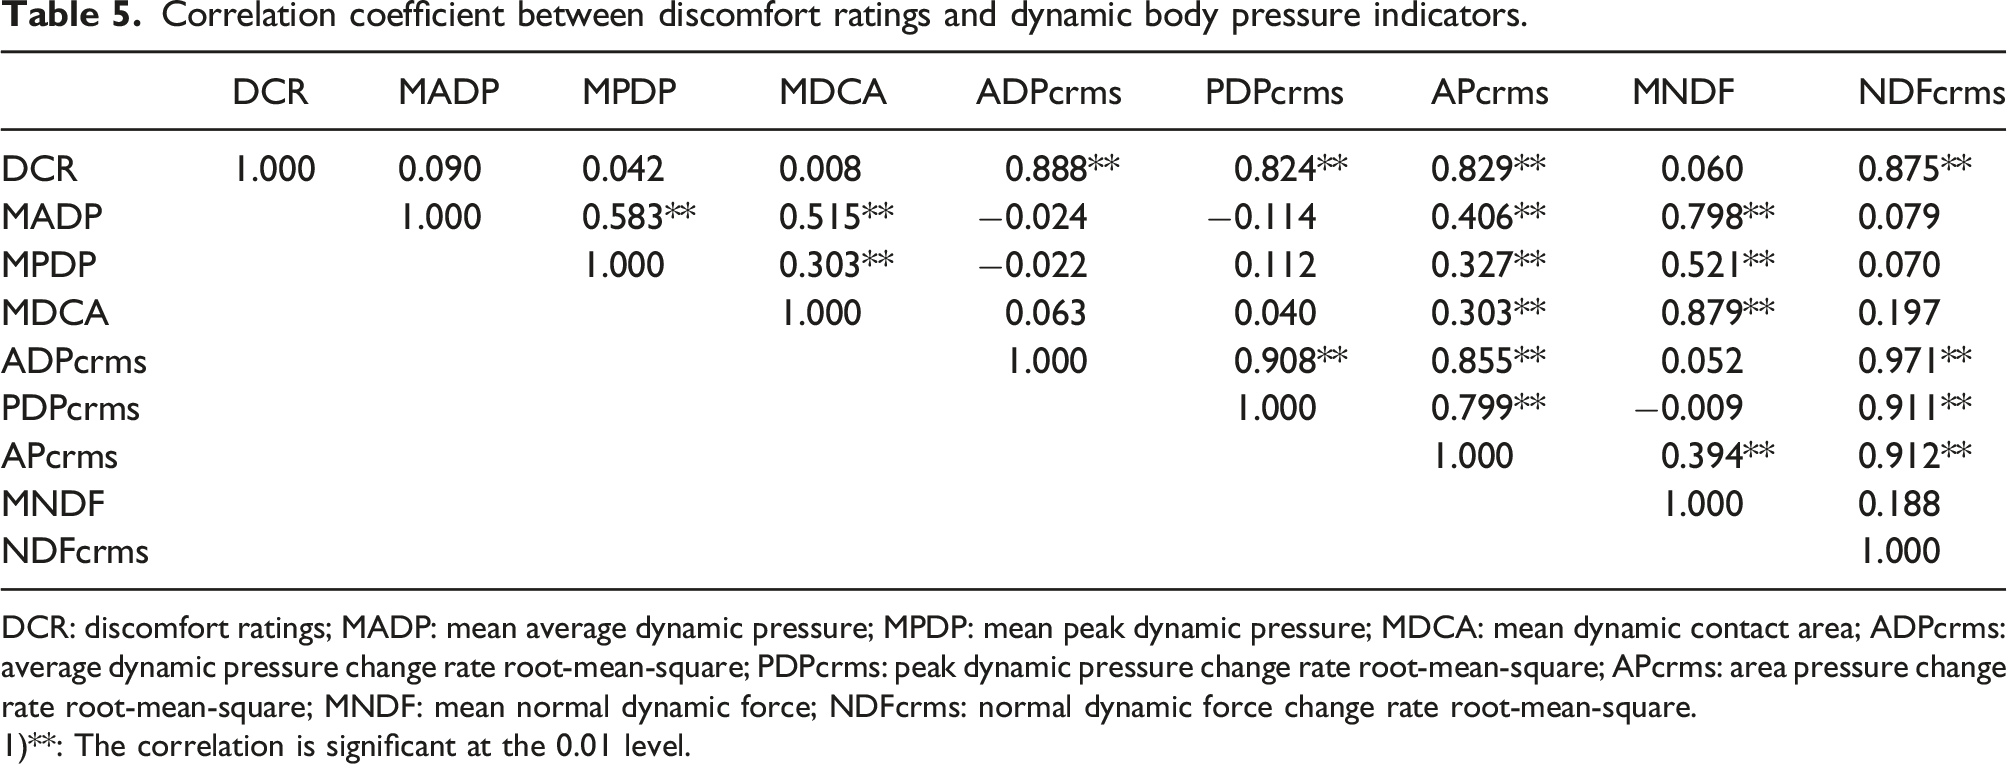
DCR: discomfort ratings; MADP: mean average dynamic pressure; MPDP: mean peak dynamic pressure; MDCA: mean dynamic contact area; ADPcrms: average dynamic pressure change rate root-mean-square; PDPcrms: peak dynamic pressure change rate root-mean-square; APcrms: area pressure change rate root-mean-square; MNDF: mean normal dynamic force; NDFcrms: normal dynamic force change rate root-mean-square.
1)**: The correlation is significant at the 0.01 level.
Discussion
The seat cushion is a crucial interface between the human body and the seat, and the driver-seat interface pressure has a significant impact on seat comfort. 36 Therefore, the pressure distribution at the human-seat interface should be considered to study the vibration discomfort of the human body. This study aims at characterizing the subjective sensations of the seated human body on a foam cushion under vertical random excitation using dynamic body pressure distribution, which can provide a reference for the seat vibration comfort evaluation.
Effect of vibration magnitude on discomfort rating
In this study, the DCR obtained by the relative magnitude estimation method were affected by the vibration magnitude with the frequency of 0.5–20 Hz (Figure 2). The results of statistical significance show that the DCR are increased significantly with the increase of vibration magnitude. The research on the effect of vibration magnitude on subjective sensations also found that the vibration discomfort caused by vertical vibration was affected by the vibration magnitude.35,37 A similar conclusion was also found by Matsumoto and Griffin, 27 either exposed to continuous or transient vertical vibration. The previous research also suggested that the variation of subjective sensation with the vibration magnitude may be affected by body dynamics, and people feel uncomfortable when experiencing high vibrations. 38
As discussed above, there is a close relationship between the subjective discomfort of the seated human body caused by vertical vibration and vibration magnitude, that is, the greater the vibration magnitude, the higher the discomfort rating.
Effect of vibration magnitude on dynamic body pressure indicators
The results of the non-parametric statistical analysis show that the change of the vibration magnitude has no significant effect on the MADP, MPDP, MDCA, and MNDF but has a significant influence on the ADPcrms, PDPcrms, APcrms, and NDFcrms (Table 4). Wu et al. 26 also found that the variation of vibration magnitude had no effect on average dynamic pressure. The possible reason is that the contact conditions between the human body and the seat change greatly with the increase of the vibration magnitude, which causes an increase in the change rate root-mean-square related to dynamic pressure or dynamic force. It is worth noting that the vibration magnitude from 1.0 to 1.2 m/s2 r.m.s has no significant influence on the PDPcrms (Wilcoxon, p > .05). It can be speculated that the nonlinearity of soft tissue and foam cushion might be responsible for the small change in PDPcrms.
The above analysis shows that the effect of vibration magnitude on the ADPcrms, PDPcrms, APcrms, and NDFcrms is consistent with the corresponding DCR. It is reasonable to consider that there is some relation between the DCR and the objective indicators related to dynamic body pressure.
Relation between subjective discomfort ratings and objective indicators
The fitting parameters of the linear regression between subjective and objective indicators.
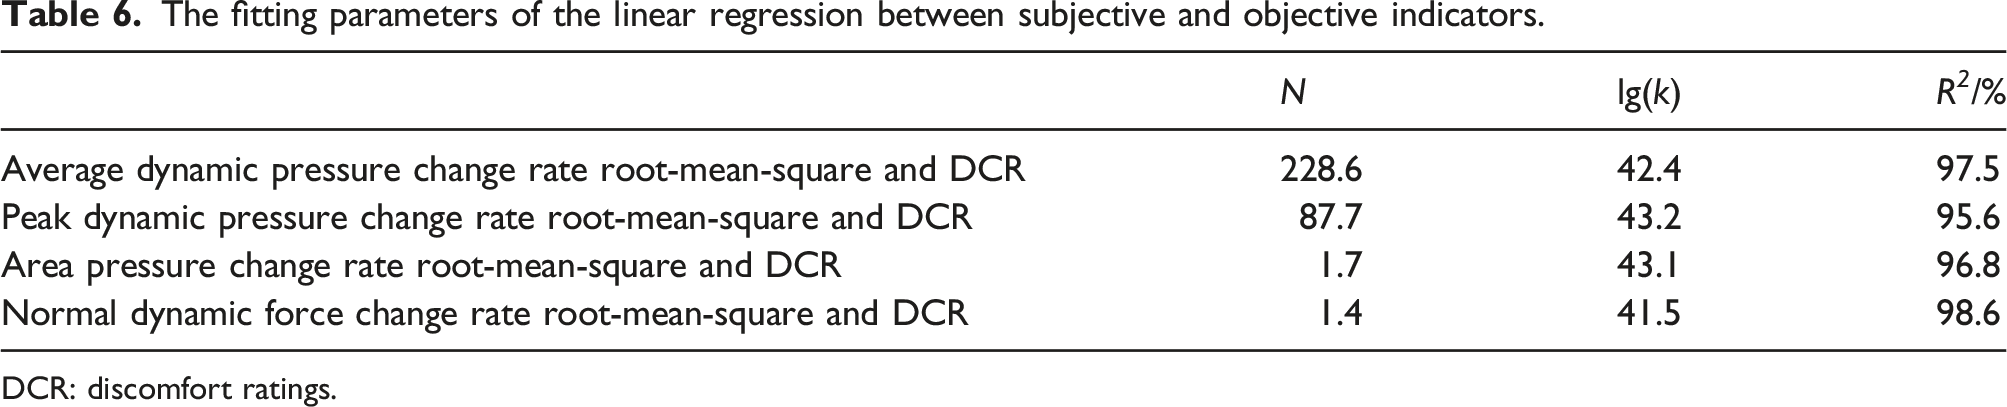
DCR: discomfort ratings.
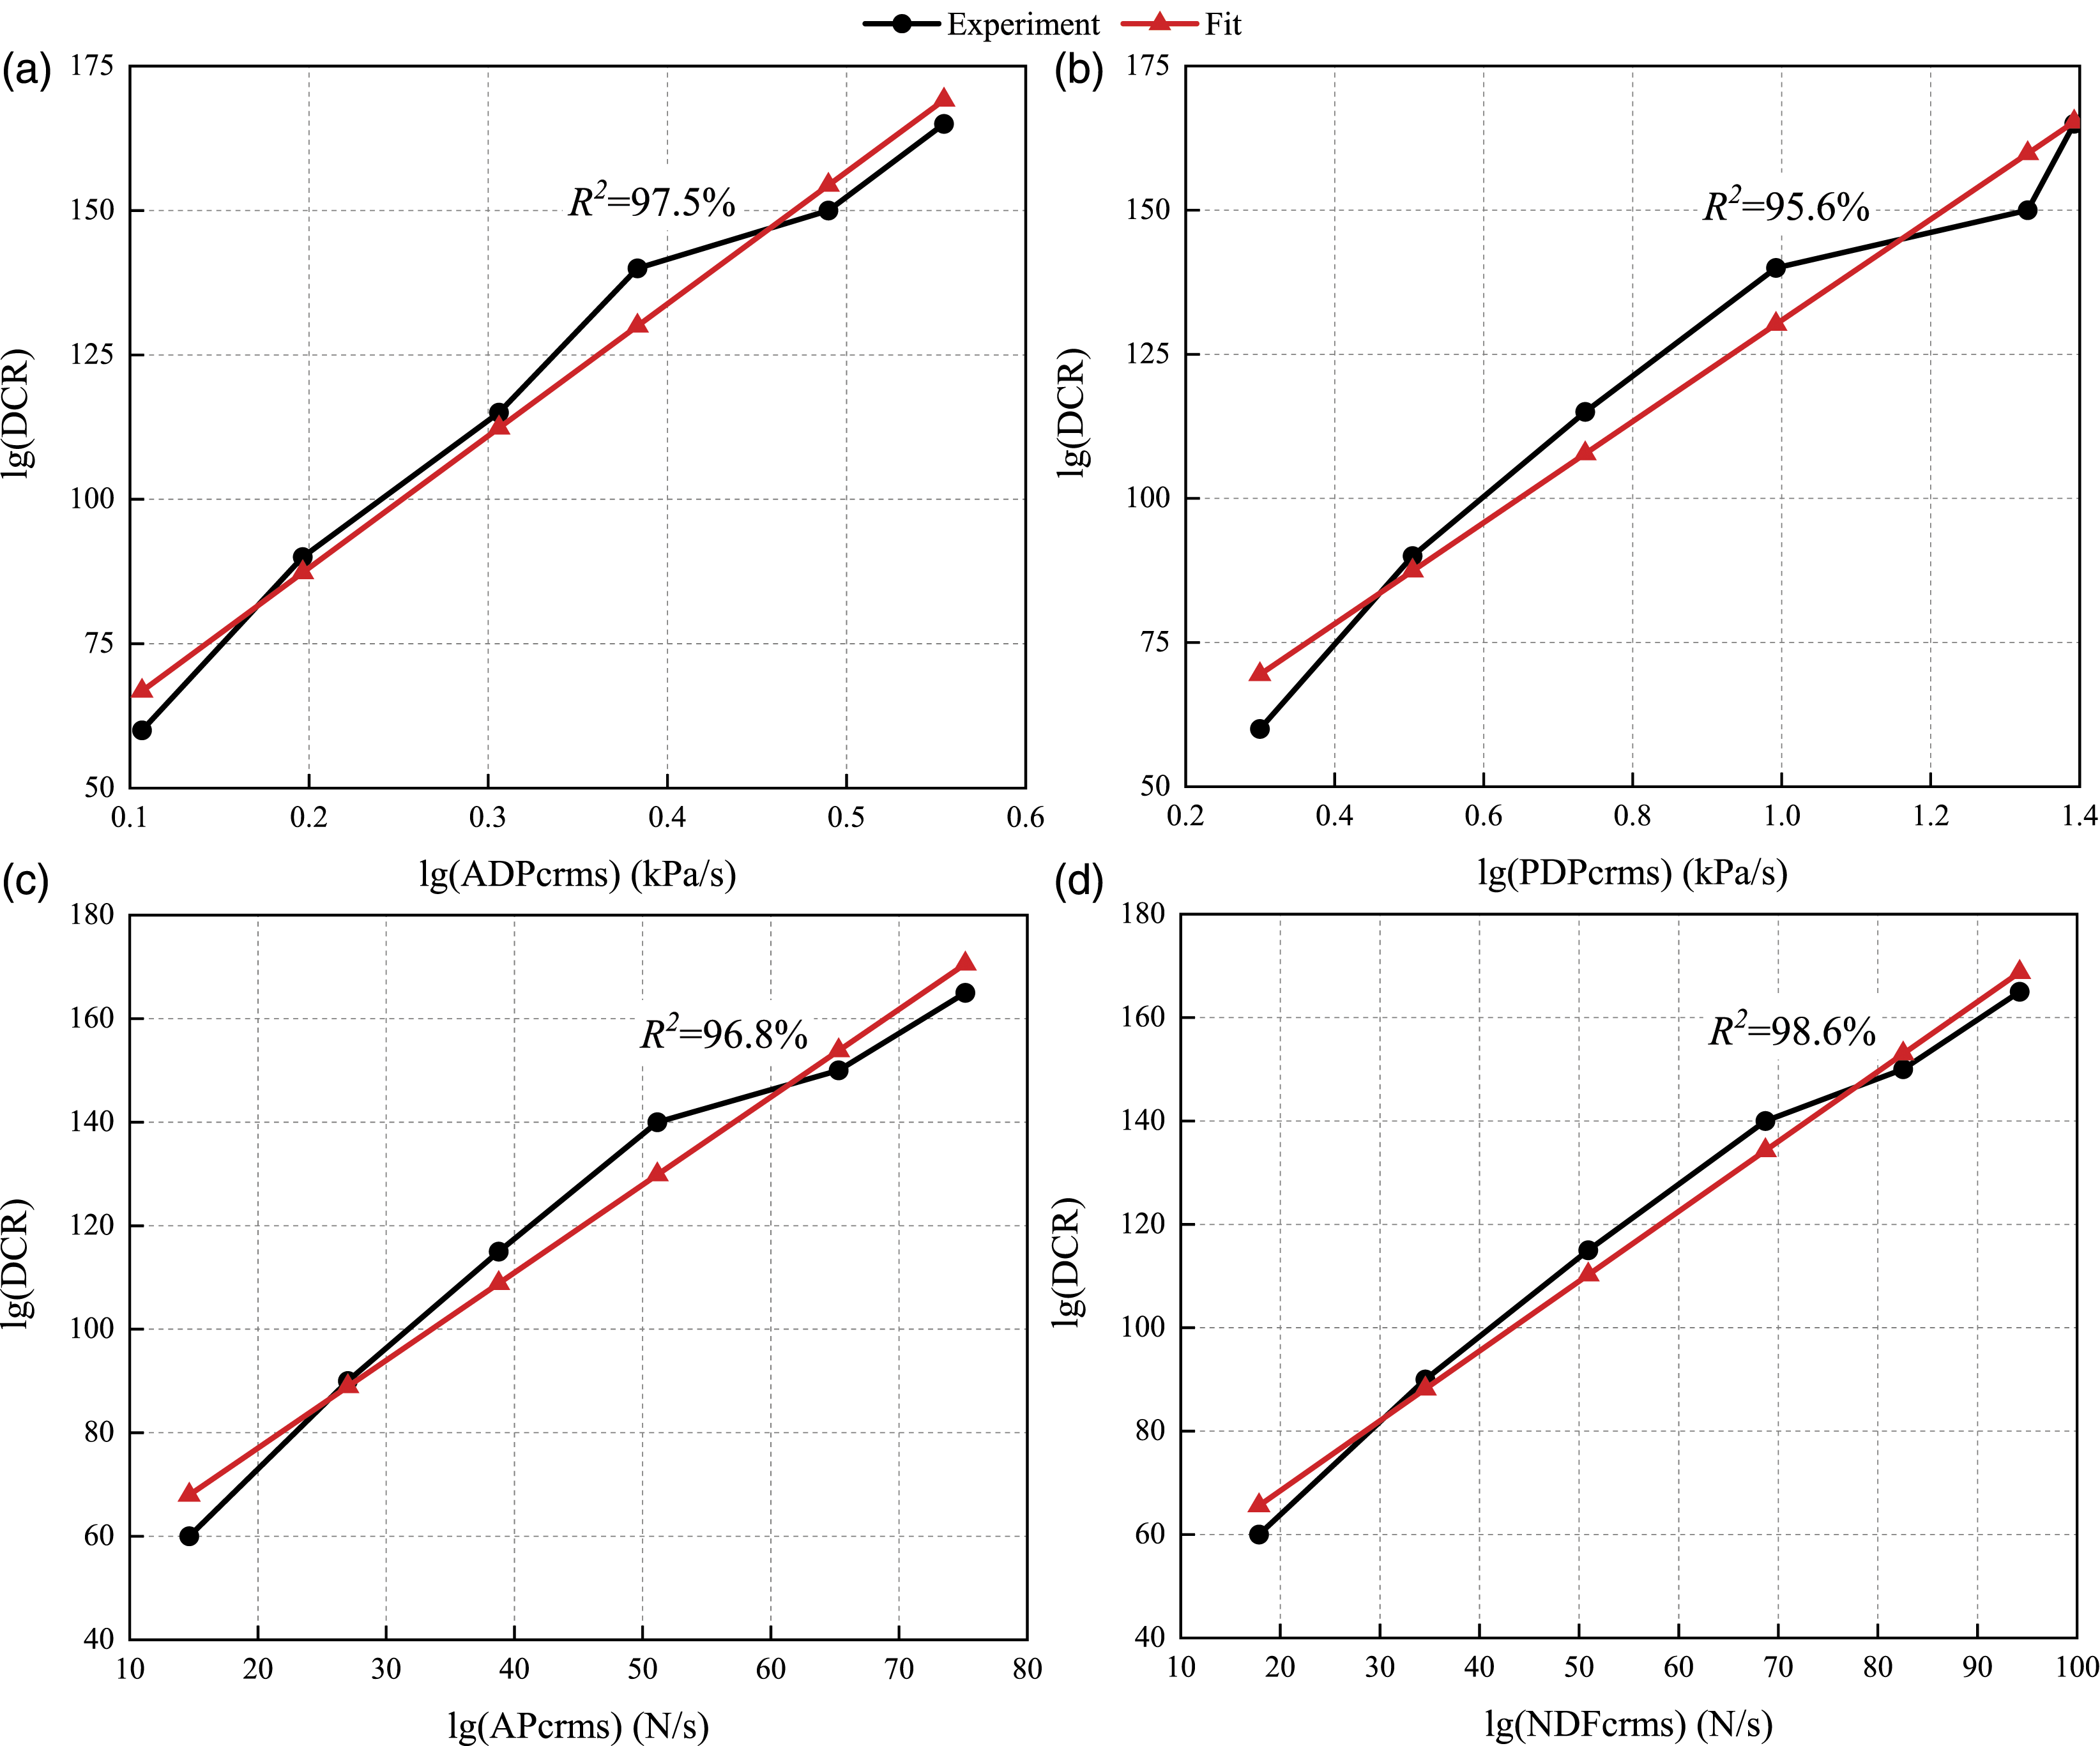
Relation curve between discomfort ratings and dynamic body pressure indicators.
To sum up, the change rate of the velocity versus time (i.e. acceleration) at the human-seat interface can be used as an indicator to describe the discomfort of the human body under vibration. 39 Similarly, the change rate of dynamic body pressure or normal dynamic force at the human-seat interface caused by vibration versus time can also be used as an indicator to describe vibration discomfort on a foam seat.
Conclusion
In this study, measurement of the dynamic body pressure and DCR with different vertical vibration magnitudes were performed by experimental methods and the relationship between them were investigated. The results of non-parametric statistical analysis showed that the trend of the changes in the DCR was similar with ADPcrms, PDPcrms, APcrms, and NDFcrms, but not with the MADP, MPDP, MDCA, and MNDF. Furthermore, there was a significant correlation between DCR and the ADPcrms, PDPcrms, APcrms, and NDFcrms, but not with the MADP, MPDP, MDCA, and MNDF. It implies that the three indicators (MADP, MPDP, MDCA, and MNDF) have limitations in reflecting vibration discomfort. The relation between DCR and four body pressure indicators, including ADPcrms, PDPcrms, APcrms, and NDFcrms, was established using Stevens’ power law. The fitting goodness of the linear regression between subjective and objective indicators was above 95%, indicating a high relation between them.
Based on the experimental results and discussion above, it is suggested that the ADPcrms, PDPcrms, APcrms, and NDFcrms can be used as objective indicators to describe the vibration discomfort of the human body sitting on a foam seat. However, the effect of frequency on subjective response and dynamic body pressure indicators was ignored, which is a potential limitation of this study. Considering the effect of frequency variation on subjective response and objective indicators is an interesting study that deserves further exploration in future research.
Footnotes
Declaration of conflicting interests
The author(s) declared no potential conflicts of interest with respect to the research, authorship, and/or publication of this article.
Funding
The author(s) disclosed receipt of the following financial support for the research, authorship, and/or publication of this article: This work was supported by the National Natural Science Foundation of China (Grant No. 51875060).