
Abstract
The vibration characteristics of car seats directly influence the ride comfort. Polyurethane foam is the key part of a seat, and its physical parameters have an important impact on the seat. In this study, the influence of the foam thickness and foam hardness on the vibration characteristics of seat cushion with different excitation magnitudes was investigated by using transmissibility and seat effective amplitude transmissibility (SEAT) value. First, vibration tests were carried out at a vertical vibration simulator with width-limited white noise vibration frequencies from 0.5 to 20 Hz with root-mean-square (r.m.s.) values of 0.4, 0.8, and 1.2 m/s2, the acceleration at the platform and the body-foam interfaces were measured to calculate the transmissibility, and the influence of the foam physical properties on the transmissibility was analyzed. Then, the SEAT value was introduced to assess the vibration isolation efficiency of the foam cushion, and the influence of the foam physical properties of the foam cushion on the vibration isolation efficiency was analyzed. With increasing thickness of the foam and decreasing hardness of the foam at the seat pan, the peak transmissibility increased and the resonance frequency decreased. The SEAT values show that increasing the foam thickness is beneficial to the improvement of the vibration isolation efficiency of the seat, but there is a diminishing return; the combination of physical parameters of low hardness and high thickness could make the vibration isolation performance of the seat better. In addition, the nonlinearity of human-seat system during different vibration magnitude was found.
Keywords
Introduction
As the component with the widest contact area with the passenger, the car seat directly influences the riding comfort of the passenger, and is related to the user’s evaluation of the comfort of the car. The filling of car seats is usually polyurethane foam, and its physical properties have a great influence on the comfort of passengers. Therefore, understanding the effect of foam physical parameters on the vibration characteristics of the seat can help seat design to improve the riding comfort. Car seat cushions carry most of the weight of the human body, which will have a non-negligible impact on occupant comfort.
Researchers have, for many years, conducted extensive research on the comfort of foam cushions. Physical parameters such as stiffness and thickness of foam material are related to seat static subjective comfort. 1 It is found in the study of static comfort of seats that the pressure of the seat interface decreases with the increase of the thickness of the seat cushion, and increasing the thickness of the cushion layer has a positive effect on the improvement of the seat comfort.2–4 However, a seat requires not only static comfort, but also dynamic comfort. The dynamic properties of polyurethane foams depend on the cell walls which are made of the structural and material properties,5,6 these properties are affected by many factors, such as thickness, firmness, density, vibration magnitudes, temperature, and relative humidity.6–10 The dynamic characteristics of the foam cushion are closely related to the thickness of the foam cushion, with increasing thickness, the dynamic stiffness and the damping of the foam decreased. 9 The degree of hardness of the foam has an impact on the seat comfort, with the soft seat offering better dynamic pressure distribution. 11 A firmer foam produces a lower transmissibility at the resonance, and high-density foam tends to attenuate more quickly and produce a lower amplitude at the assumed wheel hop. 10 Foam hardness and foam thickness as main design factors of seat cushion are closely related to the dynamic comfort of the seats. The most common method of quantifying the dynamic properties of a seat is the seat transmissibility. 12 Reasonable seat transmissibility can bring a better driving experience to the occupants. For the optimization of the vehicle seat cushion transmissibility, there are two main aspects. First, the resonance frequency of the human-seat system should avoid the sensitive frequency range of the human body and the resonance frequency of the vehicle chassis. 10 Second, the peak transmissibility should be as low as possible. 13 However, previous studies on the vibration characteristics of foam cushions have shown that sometimes the reduction of the resonance frequency is accompanied by an increase of the peak transmissibility.9,14,15 With the thickness of the foam increasing between 50 mm and 120 mm, the resonance frequency increased and the peak transmissibility decreased during vertical vibration. 15 Similar findings are also found during fore-and-aft vibration. 14 The balance between the low resonance frequency and the low peak transmissibility seems to be an issue.
The SEAT value as an indicator not only includes the two factors of resonance frequency and peak transmissibility, but also considers the sensitivity of the human body to frequency. So the SEAT value can provide numerical evaluation of seat vibration isolation efficiency. 16 Niekerk et al. 17 used the SEAT value to evaluate the vibration isolation efficiency of car seats and established a link between the subjective ratings and the SEAT values. Basri et al. 12 established a quantitative relationship between the subjective ratings and the SEAT values through Stevens’ power law, demonstrating the validity of using SEAT values to predict seat comfort. Gong et al. 16 and Ciloglu et al. 18 used the SEAT value as an objective indicator to evaluate the vibration isolation efficiency of train seats and airplane seats, respectively. Patelli et al. 19 through the study of two different thickness foam cushion found that with vertical mechanical shocks at low, medium, and high magnitudes (0.5, 1.0, and 2.0 ms−1.75 VDV) at frequencies between 1.0 and 16 Hz, the measured SEAT values were similar to the subjective SEAT values, the measured SEAT value was a good indicator of the effect of the seat on the discomfort. The above studies show that the SEAT value is a proper indicator for the research of the seat comfort, but a clear and consistent conclusion on the relationship between the SEAT value and the foam physical parameters has not yet been achieved. Therefore, the relationship between the SEAT value and the foam physical parameters under vertical vibration is worthy of further exploring.
The primary objective of this study is to analyze the influence of foam hardness and thickness on the transmission characteristics of the seat cushion and to study the effects of foam thickness and foam hardness on the SEAT values during different excitation magnitudes. The polyurethane foam material commonly used in automobiles is selected and 12 square foam seat cushions with 3 hardness and 4 thicknesses are made. Measurement of seat transmissibility was conducted with 15 subjects under different random excitation. The relationship between the SEAT value and the foam physical parameters under vibration is studied, and the SEAT value is introduced to assess the dynamic performance of the foam cushion. This study could help the understanding of the relationship between the SEAT value and the foam physical parameters and could provide a reference for the study of the vehicle comfort.
Tests and methods
Apparatus and excitation
The vibration was produced by using the vertical vibration simulator. The maximum load on the platform of the simulator is 300 kg, the maximum stroke is ±150 mm, and the operating frequency range is 0.1–50 Hz. A rigid seat was installed on the platform of the vibration simulator, and the foam block was attached to the pan of the rigid seat. A single-axis accelerometer (B&K 4508 with sensitivity of 10.04 mv/m/s2) was mounted on the rigid seat for measuring acceleration in the direction of vertical and a tri-axial SIT-pad (B&K 4322 with vertical axial sensitivity of 0.984 mv/m/s2) at the subject-seat interface for measuring acceleration at the interface. The acceleration signals were collected by a data sampling apparatus (IMC CNONOS-PL-2-DIO) and acquired at 200 samples per second via 50 Hz anti-aliasing filters with a sampling time of 60 s.
Width-limited white noises of 0.5–20 Hz with three different magnitudes were used as the excitation signals. The r.m.s. values of the excitation signals are 0.4, 0.8, and 1.2 m/s2. The duration of the vibration is 80 s with the first 5 s and last 5 s tapered by cosine function.
Test subjects
Fifteen male volunteers with mean stature 173.3 cm (170–178 cm), mean age 24.7 years (24–26 years), and mean weight 70 kg (63–76 kg) participated in the study. The number of subjects was determined based on the sample size of 12–20 subjects used in existing studies of human subjective and objective responses to whole-body vibration.20–25 Since the target of this study is to investigate the influence of foam parameters and excitation magnitudes on the vibration characteristics of the human-seat system, there is not much difference in gender, height, weight, and age of the subjects.
Test scheme
The test used 12 square foam blocks (500 mm* 500 mm) with three different CLD40% hardness (measurement of foam hardness refer to ISO 3386-1) 26 levels and four different thicknesses as the test objects. The thicknesses of the four foams are 40 mm, 60 mm, 80 mm, and 100 mm, and the CLD40% hardness of the three foams are 62 N, 88 N, and 110 N.
In order to consider the influence of thickness, hardness, and excitation magnitude on the transmission characteristics of the seat, the transmission characteristics of the above 12 foams were tested under three excitation magnitudes (0.4, 0.8, and 1.2 m/s2 r.m.s.). A full factorial dynamic test was designed to improve the test accuracy and avoid missing of important information.
The temperature in the laboratory was kept around 25°C. Before the experiment, the purpose, process, and safety precautions of the experiment were explained to the subjects. During the test, the subjects were required to maintain a normal relaxed posture without a backrest, place their hands on their thighs, make an included angle of about 105° between their calves and thighs, look forward with their eyes, and fasten the seat belt (Figure 1). Before commencing the measurements, a subject sat on the seat for at least 5 min to allow the properties of the foam to be stabilized. Vertical vibration simulator with: (a) the rigid seat attached with foam and SIT-pad transducer; (b) a subject sitting on the foam.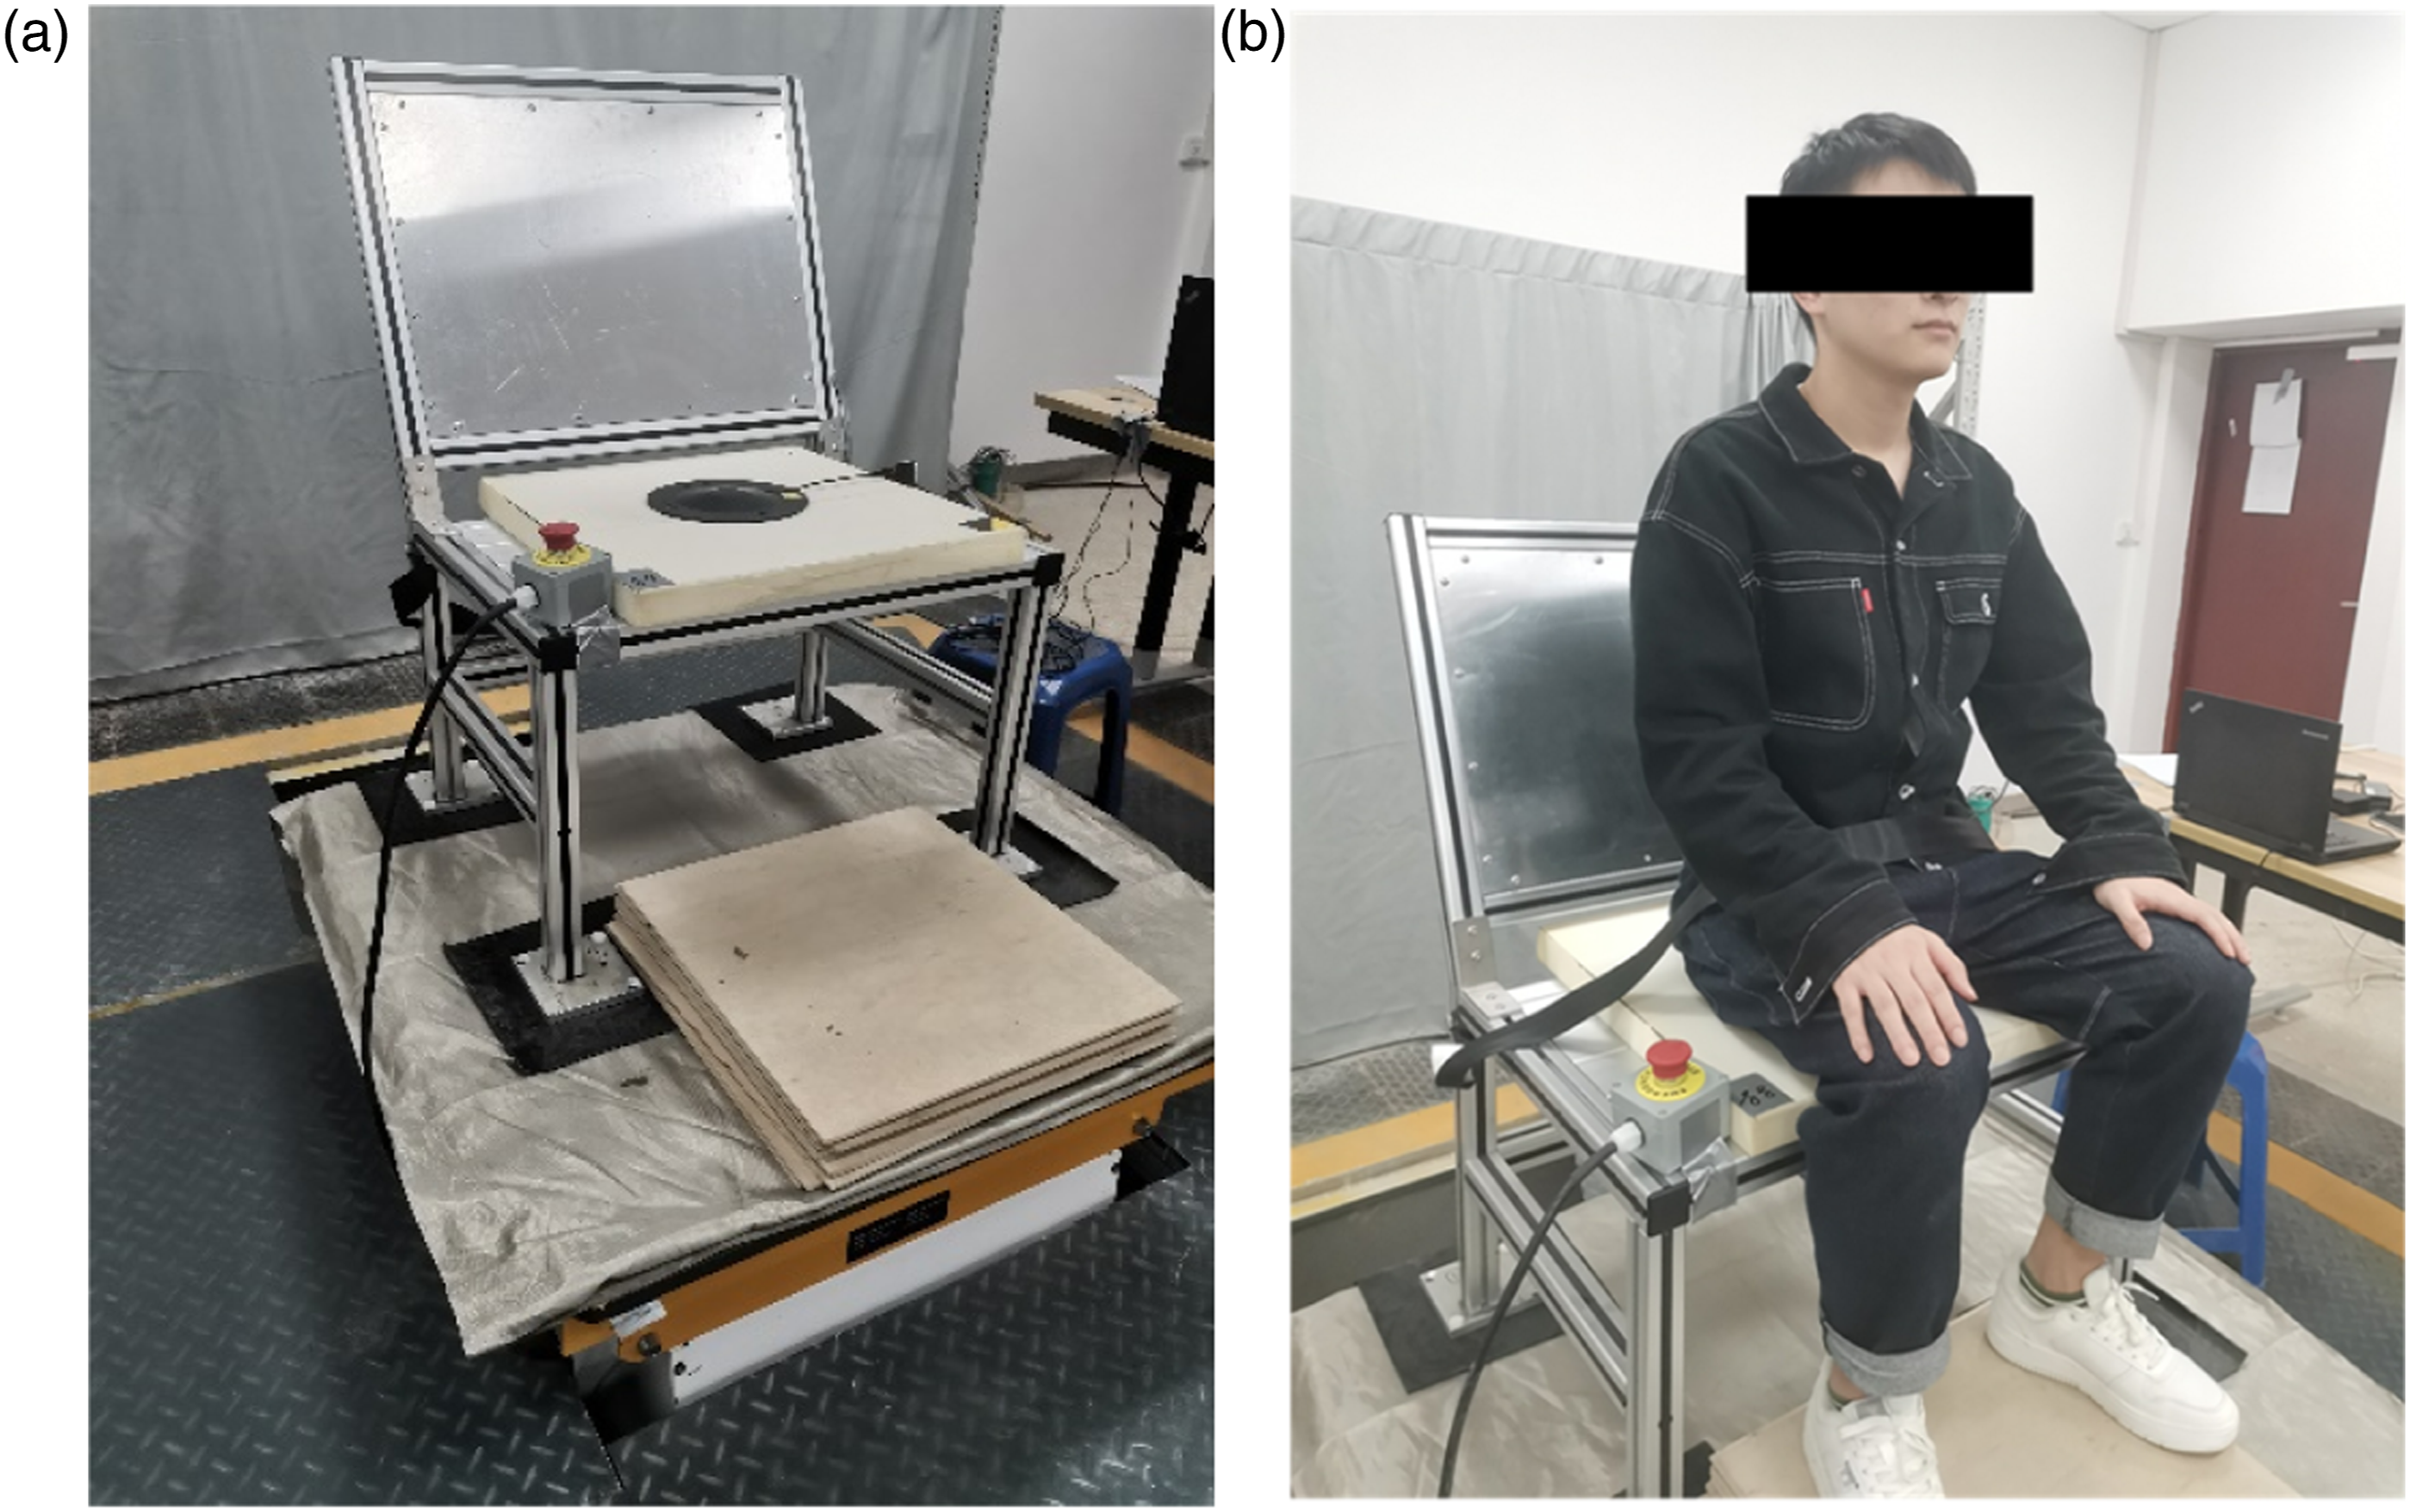
Statistical analysis
The differences of the individual physical parameters of the human body determine the complexity of the distribution type of the research population; nonparametric statistical methods are generally used to test multiple related samples.27,28 The Friedman two-way analysis does not require samples to be normally distributed, and only depends on the rank observed in each block. Therefore, Friedman two-way analysis of variance was used to test differences drawn from the 15 subjects among three various magnitudes of the excitation (0.4, 0.8, and 1.2 m/s2), four various thicknesses of the foam (40, 60, 80, and 100 mm), and three various kinds of hardness of the foam (62, 88, and 110 N).
Results and discussion
After conducting the foam cushion transfer characteristic test, the test data were analyzed and the influence of foam thickness and hardness on the transfer characteristics of the seat cushion was explored, and the SEAT value was introduced to evaluate the dynamic performance of the foam cushion.
Evaluation index of seat vibration comfort
Seat transmissibility
The most common way to quantify seat vibration comfort is vibration transmissibility. Transmissibility is the non-dimensional ratio of the response amplitude of a seat system to the excitation amplitude in steady state forced vibration, expressed as a function of the vibration frequency.
29
The ratio may be one of forces, displacements, velocities, or accelerations. The most direct method of measuring the transmissibility is to compare the acceleration on the seat with that at the base of the seat. Usually, the cross-spectral density method is used to calculate the transmissibility, and the calculation formula is as follows

SEAT value
SEAT value is the ratio of the vibration experienced on top of the seat and the vibration that one would be exposed to when sitting directly on the vibrating floor. There are a number of different ways to measure or estimate SEAT value.
29
For the purpose of this work where data with low crest factors are analyzed, it is sufficient to use the weighted r.m.s. values to calculate the SEAT values. The expression is as follows

The weighted root-mean-square value of acceleration can be completed in the frequency domain using the power spectral densities of the measured vibration and the relevant frequency weighting curves. The expression is as follows


Effect of seat cushion parameters and excitation magnitudes on seat transmissibility
Effect of foam thickness on seat transmissibility
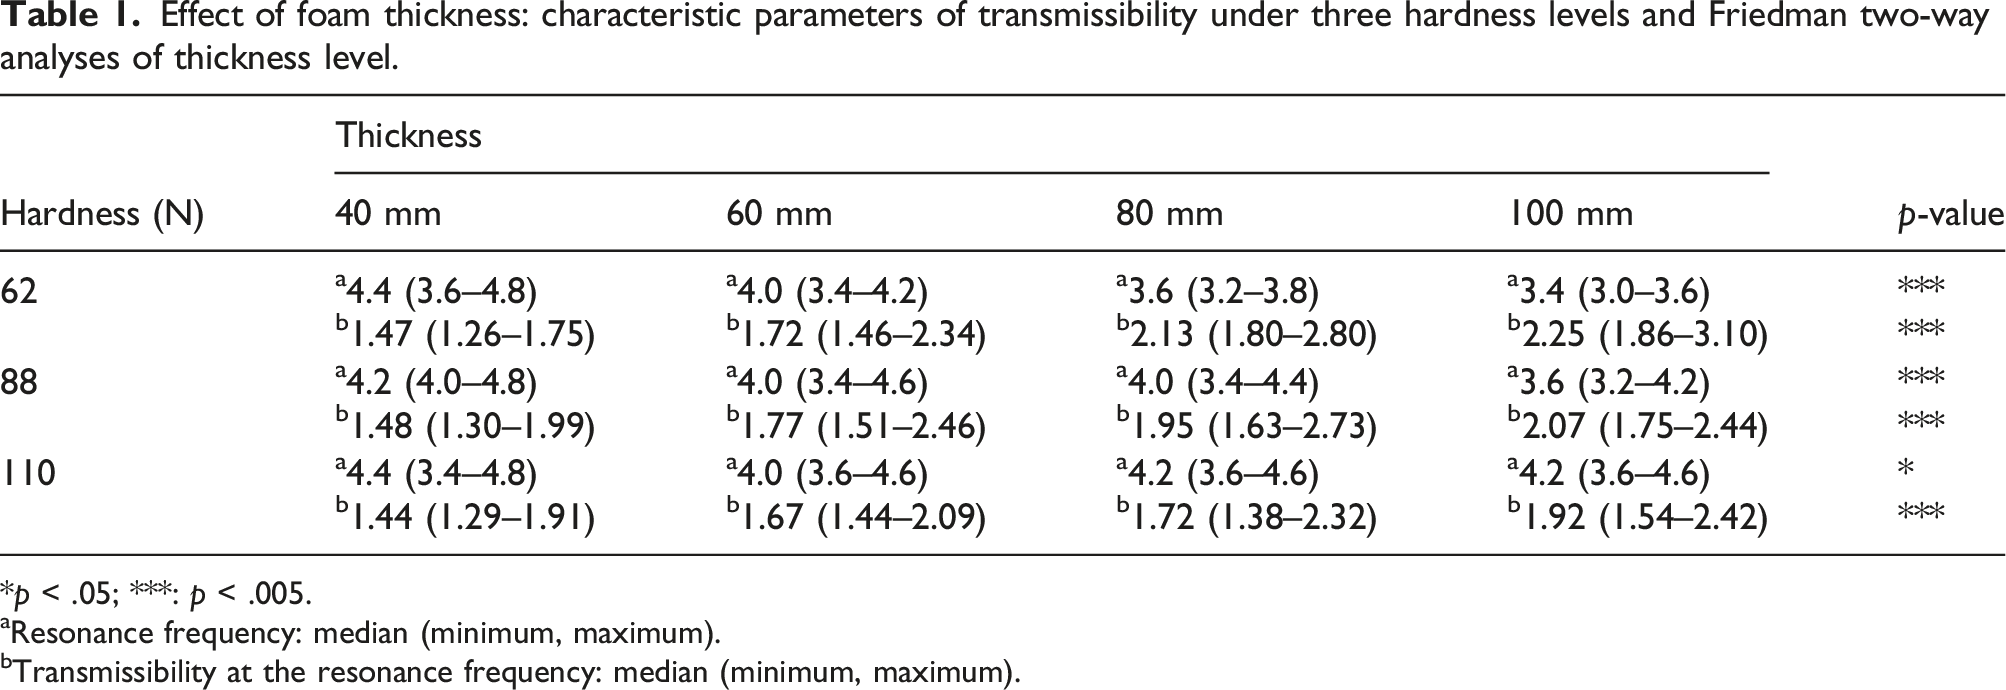
The median transmissibility curves of the three hardness foam cushions at different thickness levels are illustrated in Figure 2 (taking the test results with an excitation magnitude of 0.4 m/s2 as an example). Friedman two-way analyses of the effects of changing foam thickness (40, 60, 80, and 100 mm) at the seat pan on the resonance frequencies and the transmissibility at resonance are given in Table 1, and the median (min-max) values are given. Effect of foam thickness on transmissibility: (a) 62 N; (b) 88 N; (c) 110 N. Effect of foam thickness: characteristic parameters of transmissibility under three hardness levels and Friedman two-way analyses of thickness level. *p < .05; ***: p < .005. aResonance frequency: median (minimum, maximum). bTransmissibility at the resonance frequency: median (minimum, maximum).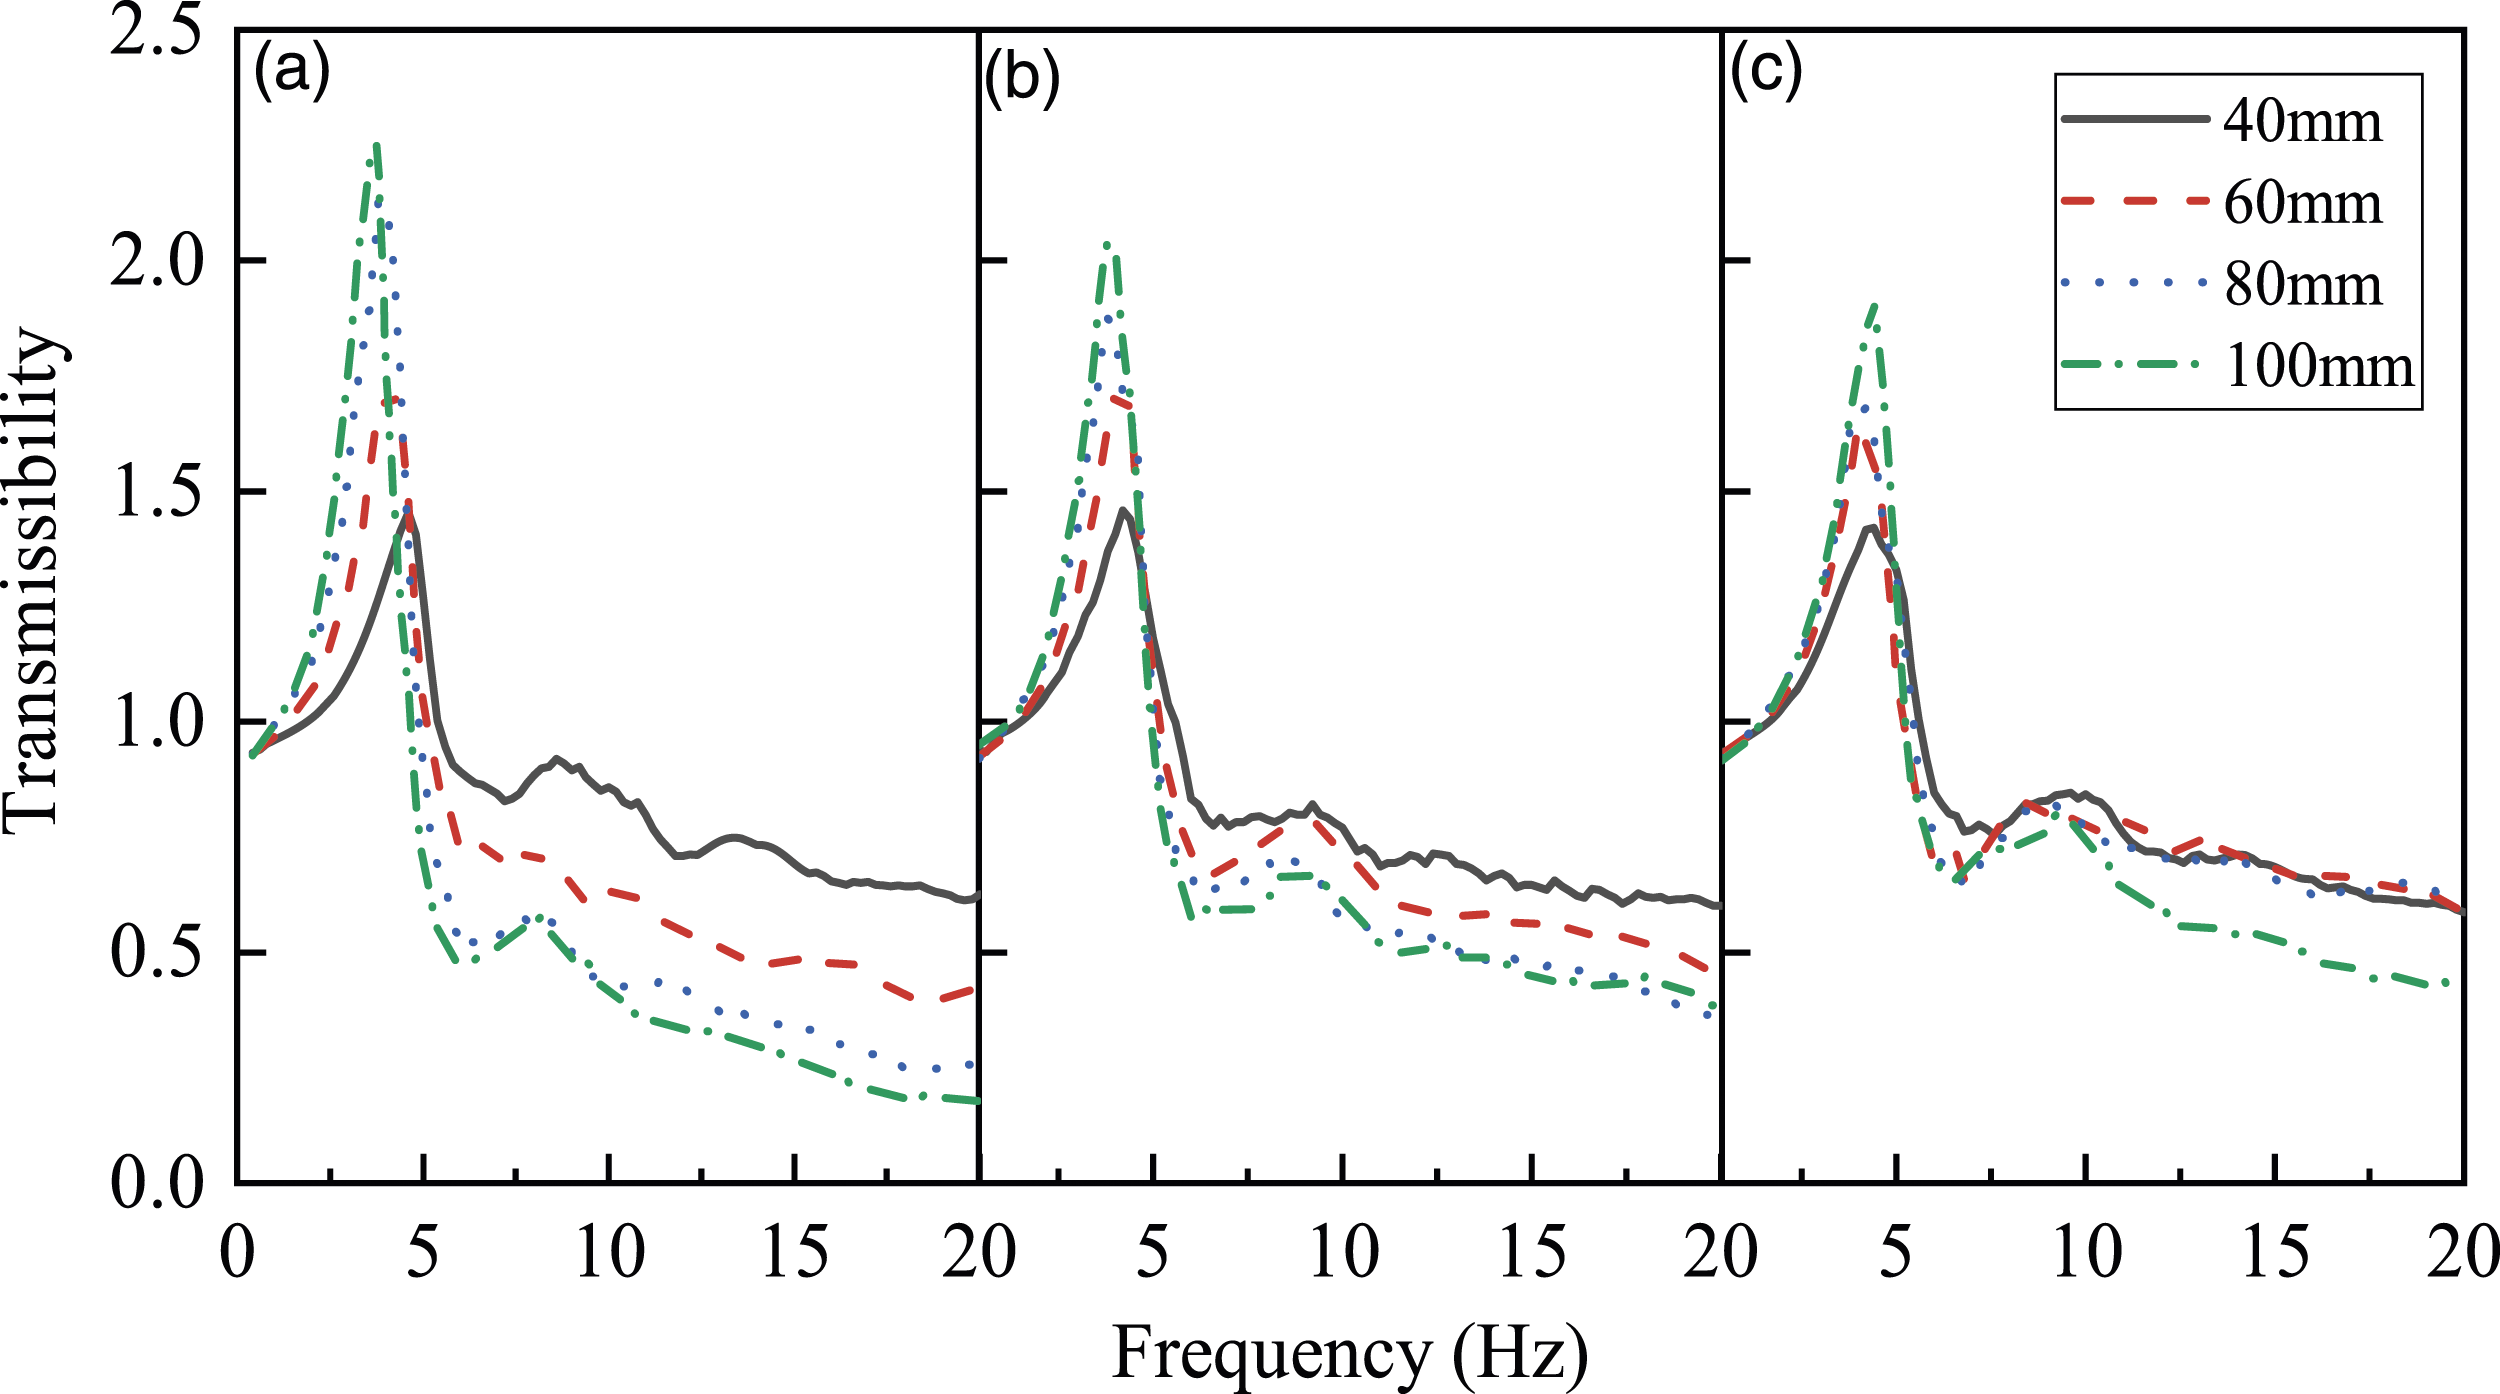
The results at the three hardness levels show that increasing the foam thickness has an effect on the transmissibilities, which leads to a decrease in resonance frequencies (p < .05, Friedman) and an increase in the peak transmissibilities (p < .001, Friedman). The results under the other two excitation magnitudes are similar. The effect of foam thickness on the seat pan is expected to mainly arise from the decrease in the foam stiffness and damping due to the increase of the foam thickness, 9 while the increase of foam thickness only brings a small change in mass. During fore-and-aft vibration, increasing the foam thickness also results in a decrease in the resonance frequencies and an increase in the peak transmissibilities. 14 In addition, in the frequency range 5–10 Hz, thicker foams attenuate vibration to a greater extent (Figure 2).
Effect of foam hardness on seat transmissibility
The median transmissibility curves of the four thickness foam cushions at different hardness levels are also exhibiting differences, as shown in Figure 3 (taking the test results with an excitation magnitude of 0.4 m/s2 as an example). Table 2 shows the Friedman two-way analyses of the effects of changing foam hardness (62, 88, and 110 N) at the seat pan on the resonance frequencies and the transmissibility at resonance. Effect of foam hardness on transmissibility: (a) 40 mm; (b) 60 mm; (c) 80 mm; (d) 100 mm. Effect of foam hardness: characteristic parameters of transmissibility under four thickness levels and Friedman two-way analyses of hardness level. -: p > .05; *: p < .05; ***: p < .005. aResonance frequency: median (minimum, maximum). bTransmissibility at the resonance frequency: median (minimum, maximum).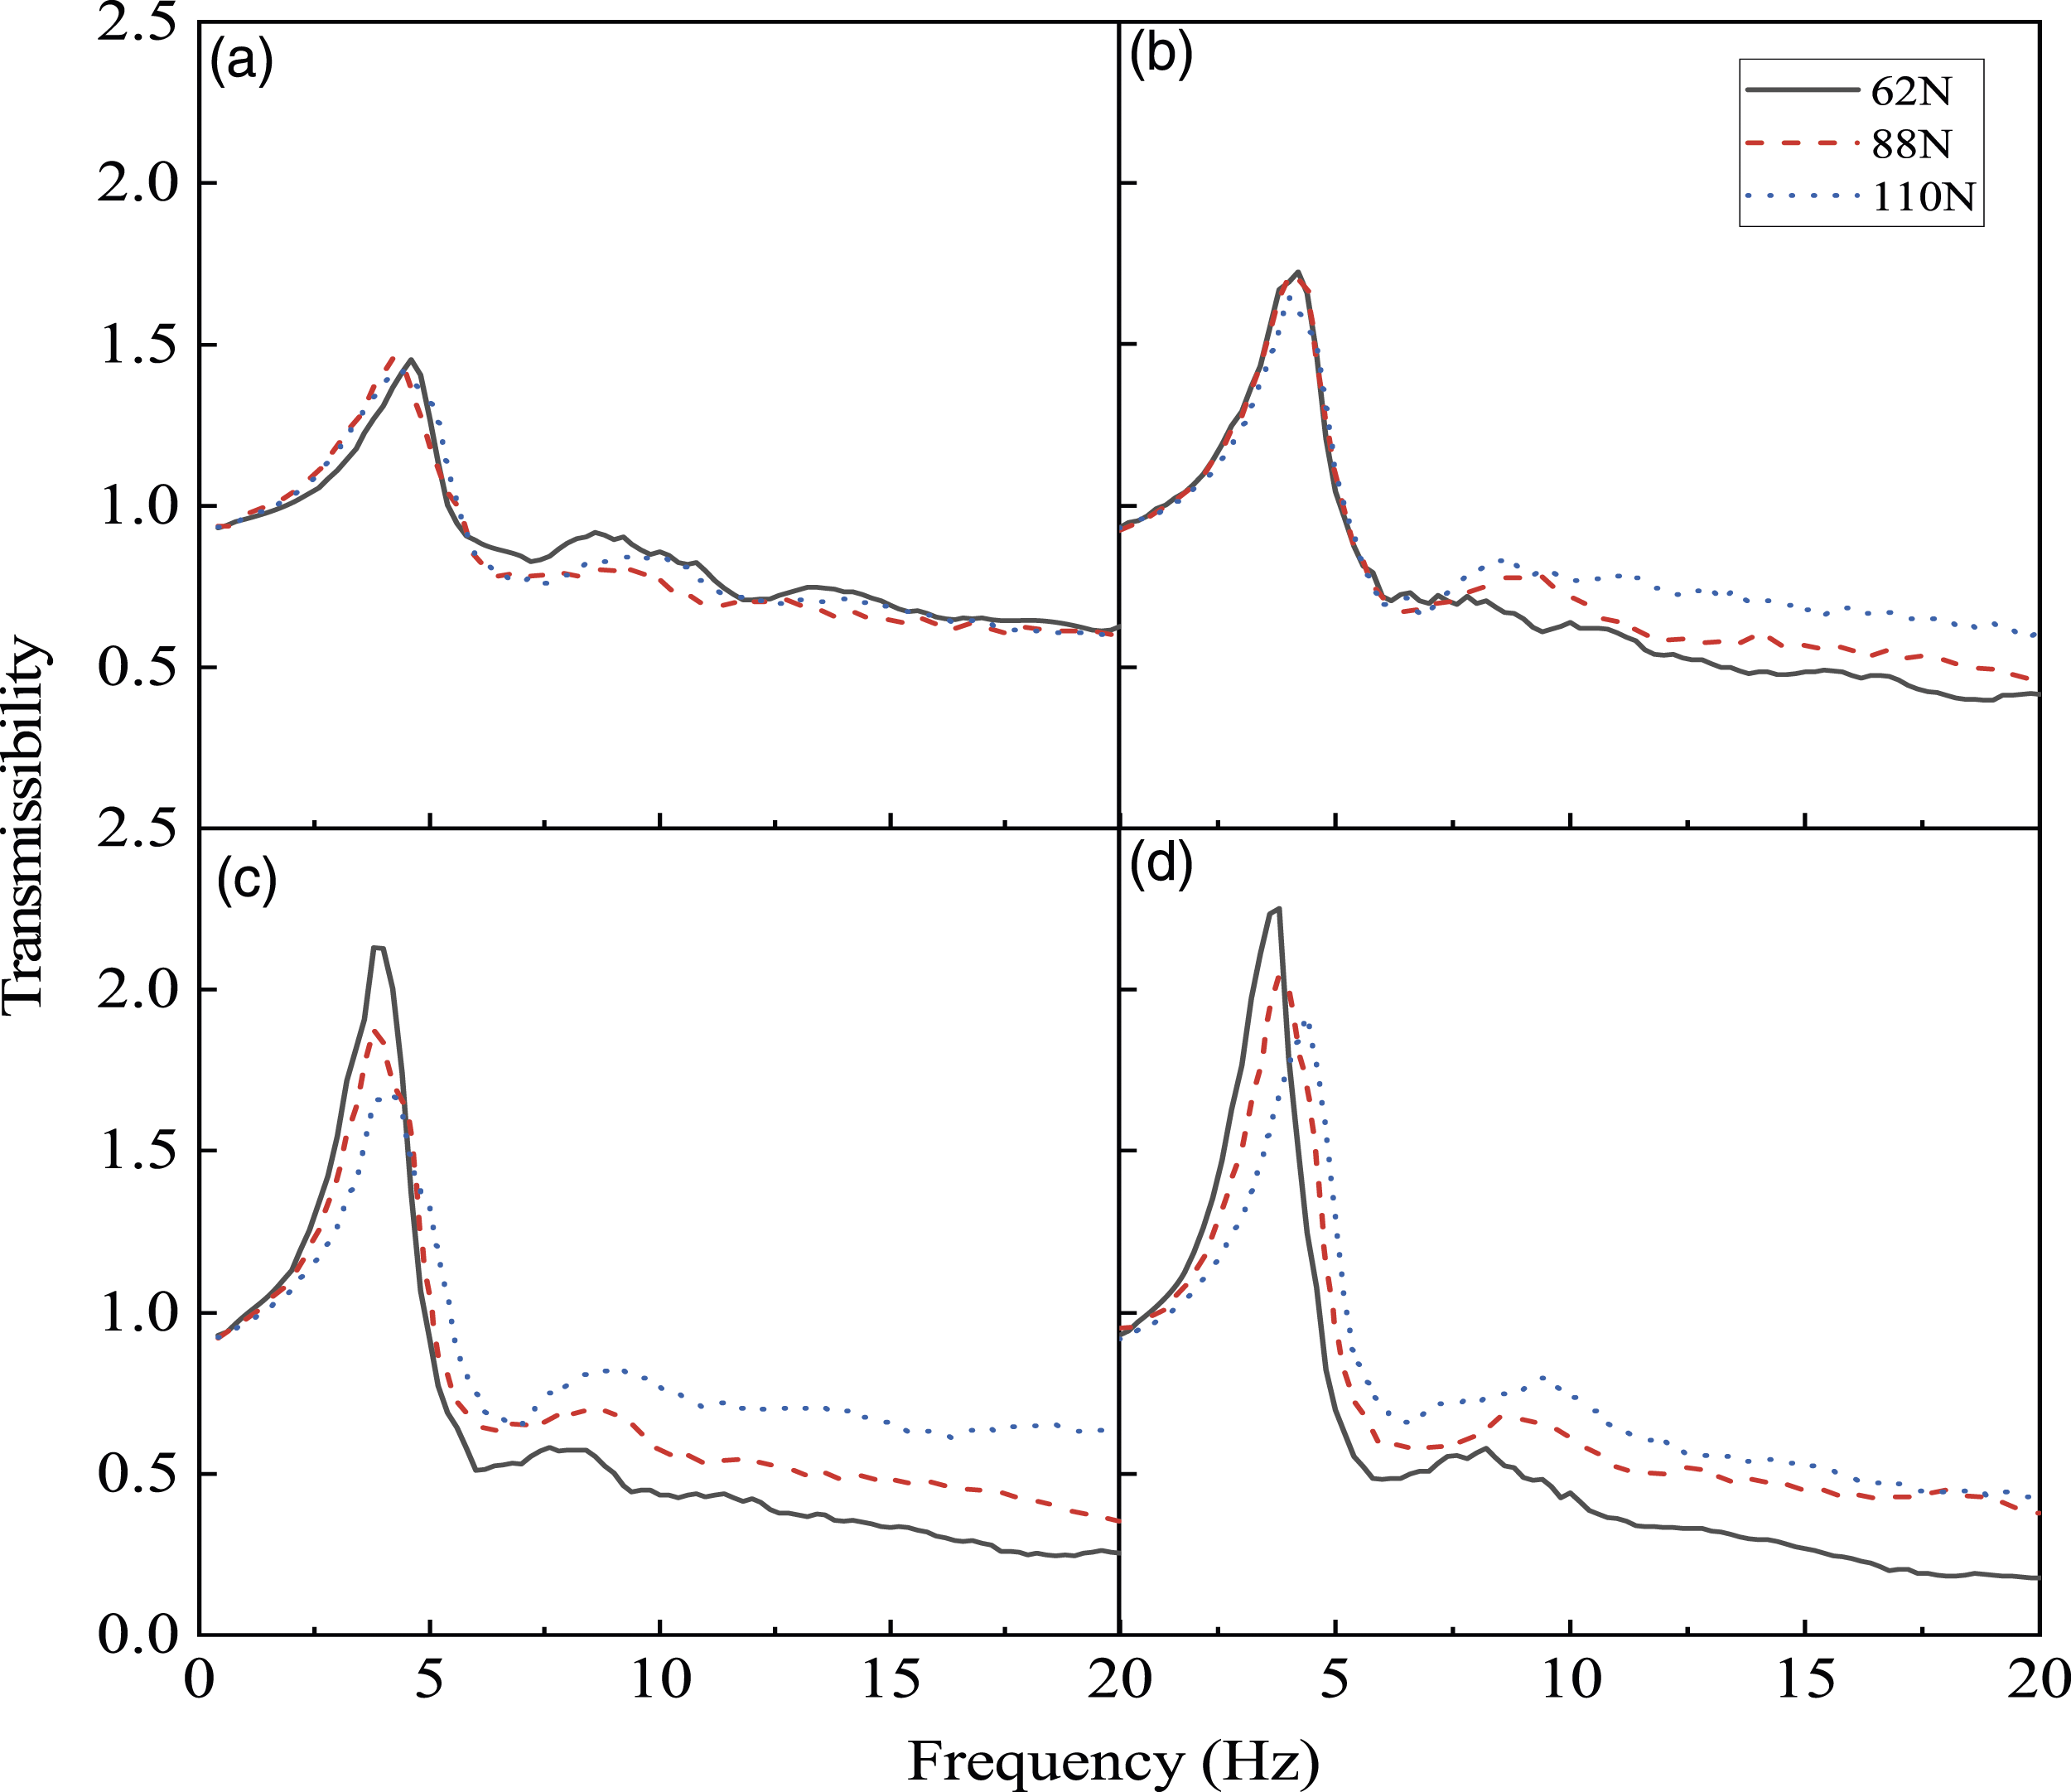
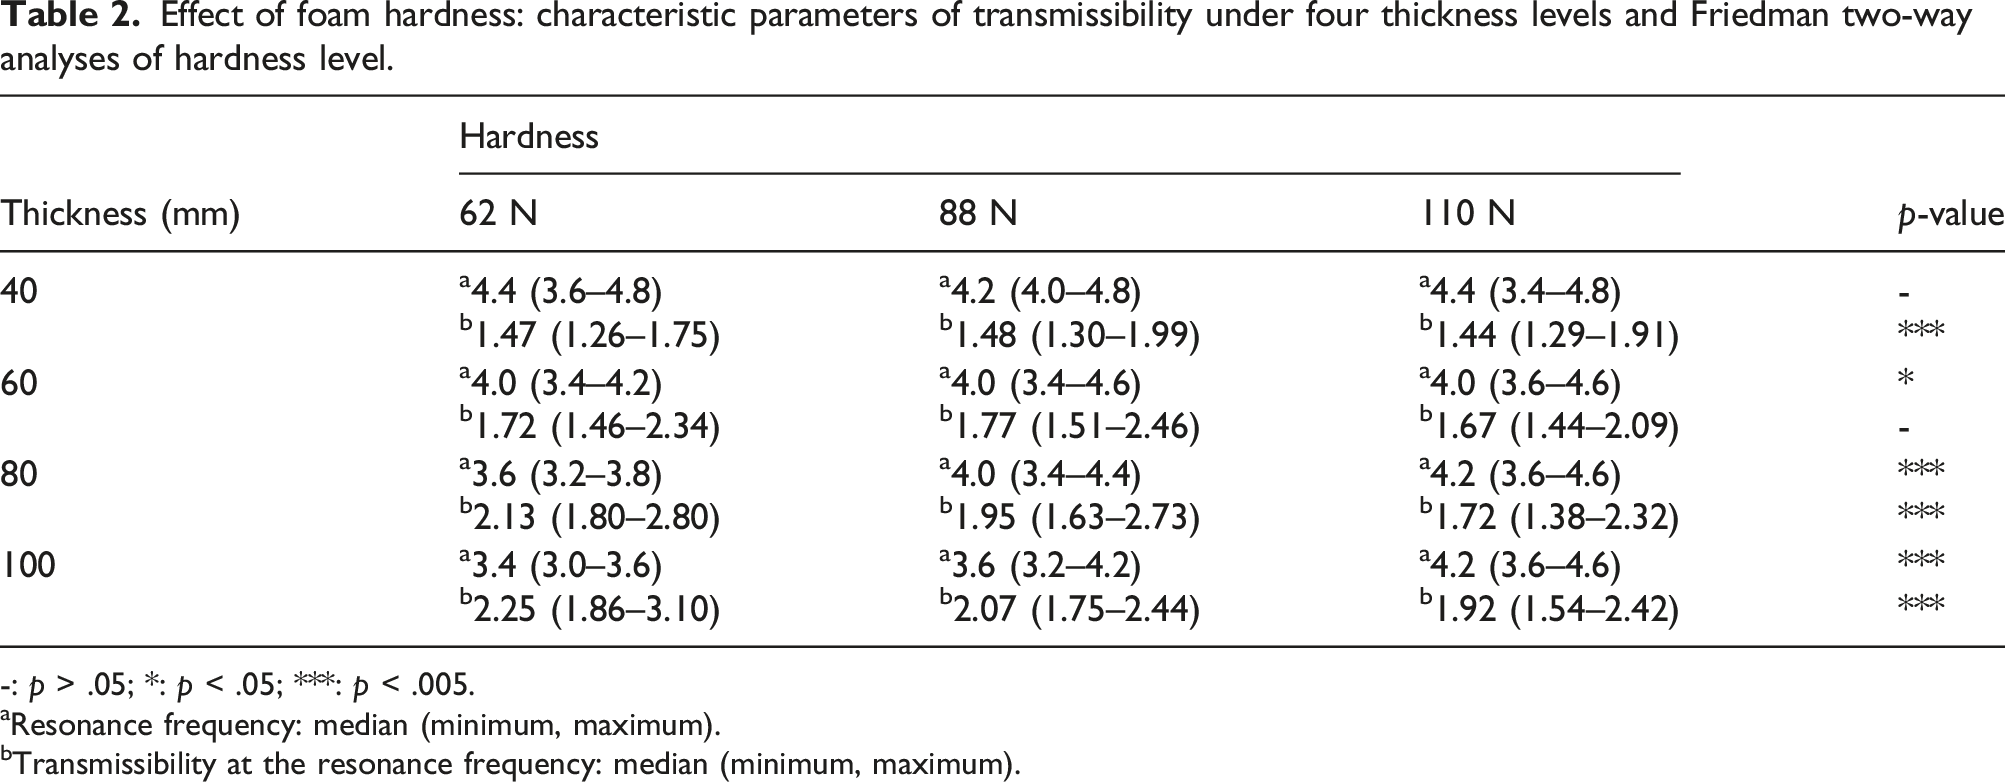
At a foam thickness of 40 mm and 60 mm, the resonance frequencies and peak transmissibility have no obvious change trend with the hardness change, this may be due to the small thickness which is not enough to provide the amount of compression generated by the subject’s sitting, so that the foam is compressed to the limit, and the foam stiffness tends to be consistent where the SIT-Pad is placed. At the foam thicknesses of 80 mm and 100 mm, foam hardness has an effect on the transmissibilities, the harder foam seat has a higher resonance frequency (p < .05, Friedman) and smaller peak transmissibilities (p < .001, Friedman), also similar to results of the other two excitation magnitudes. The effect of hardness of foam at the seat pan is expected to mainly arise from the increase in the foam stiffness and damping due to the increase of the foam hardness. 30 Except for the thickness of 40 mm, in the frequency range 5–10 Hz, softer foams attenuate vibrations to a greater extent (Figure 3).
Nonlinearity of human-seat system during different vibration magnitudes
Figure 4 illustrates the median transmissibility curves for a foam cushion with a thickness of 80 mm and a hardness of 62 N at three different vibration magnitudes. Friedman two-way tests of the effects of changing vibration magnitude (0.4, 0.8, and 1.2 m/s2 r.m.s.) at the seat pan on the resonance frequencies and the transmissibility at resonance are given in Table 3. Transmissibility of foam cushion with a thickness of 80 mm and a hardness of 62 N under different vibration magnitudes. Effect of vibration magnitude: characteristic parameters of transmissibility of the foam with 80 mm thickness and 62 N hardness and Friedman two-way analyses. ***: p < .005. aResonance frequency: median (minimum, maximum). bTransmissibility at the resonance frequency: median (minimum, maximum).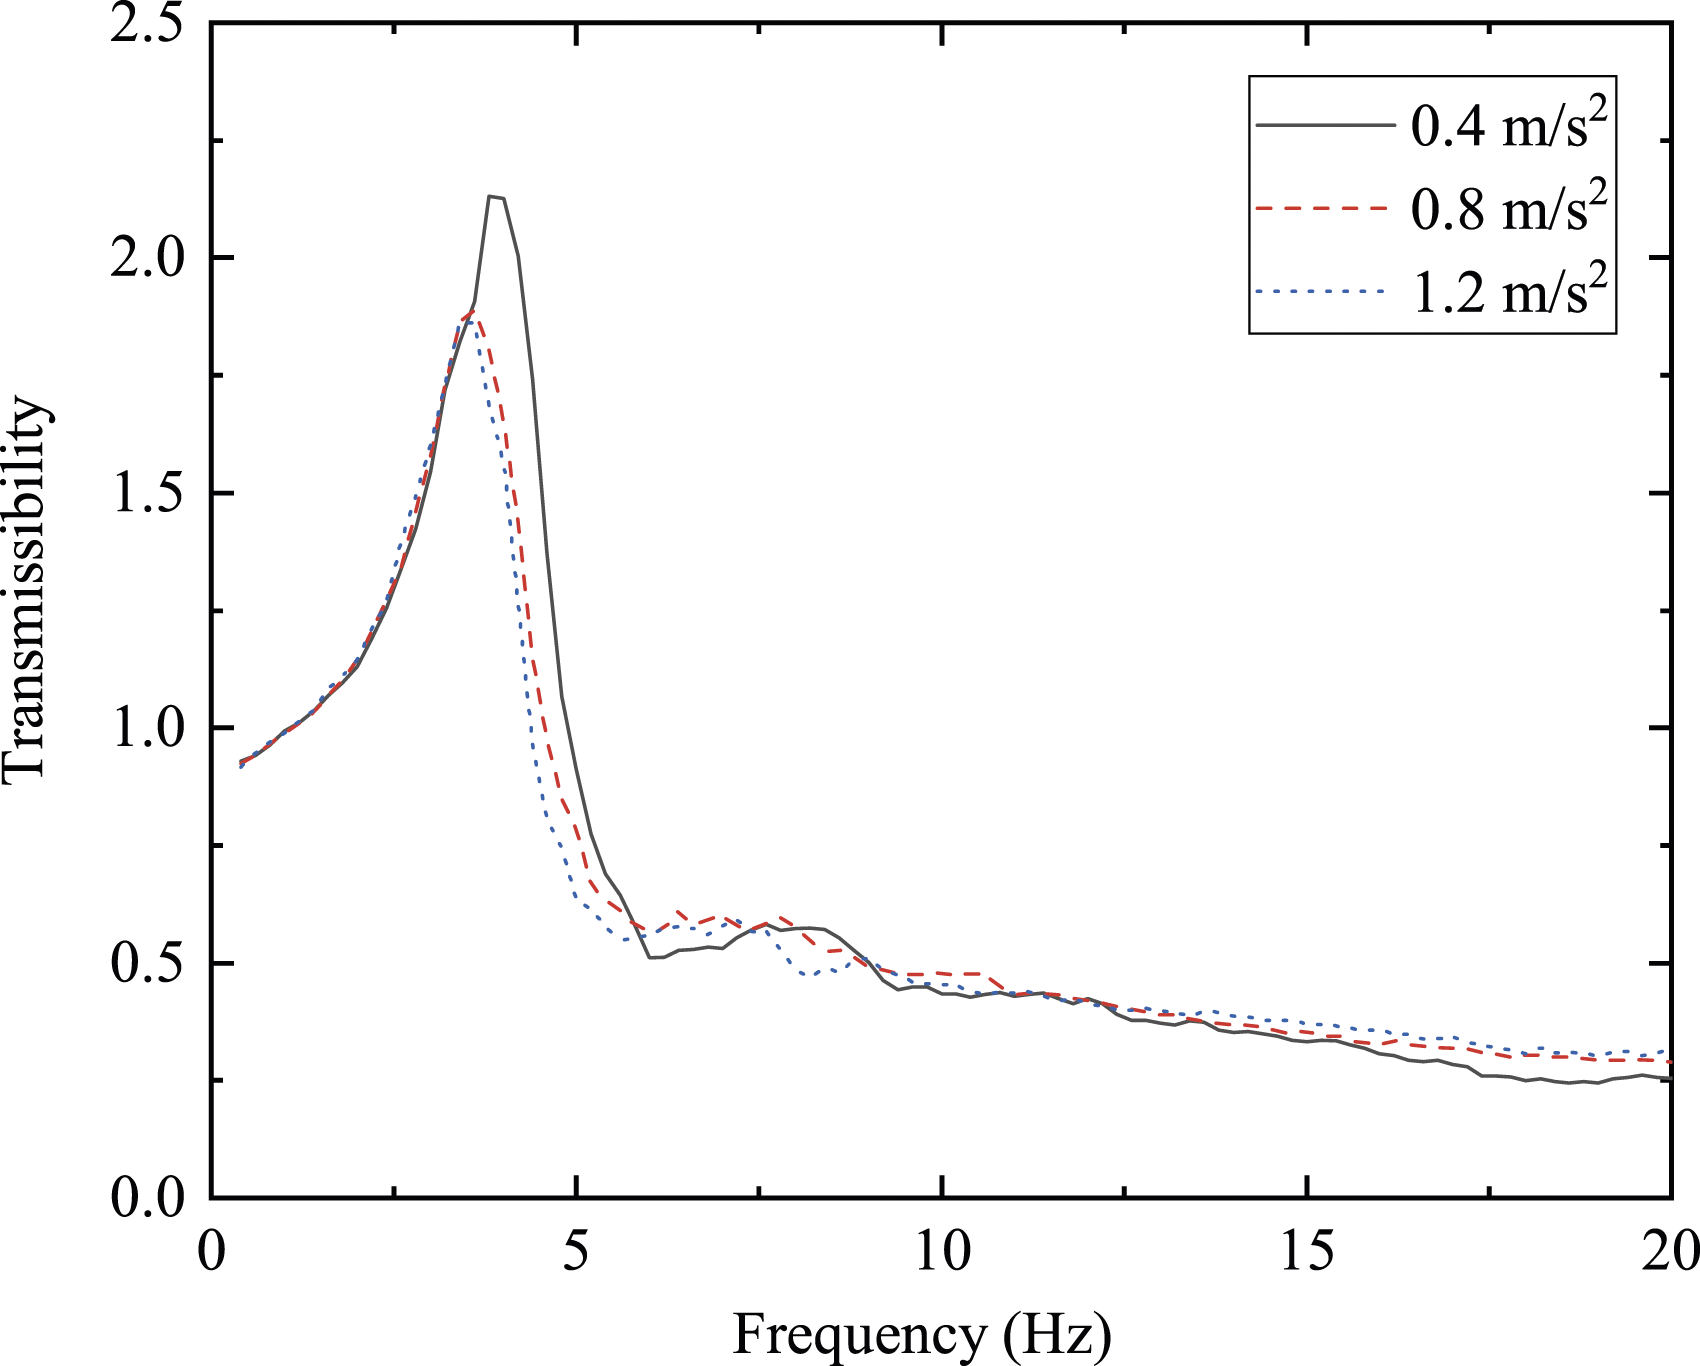
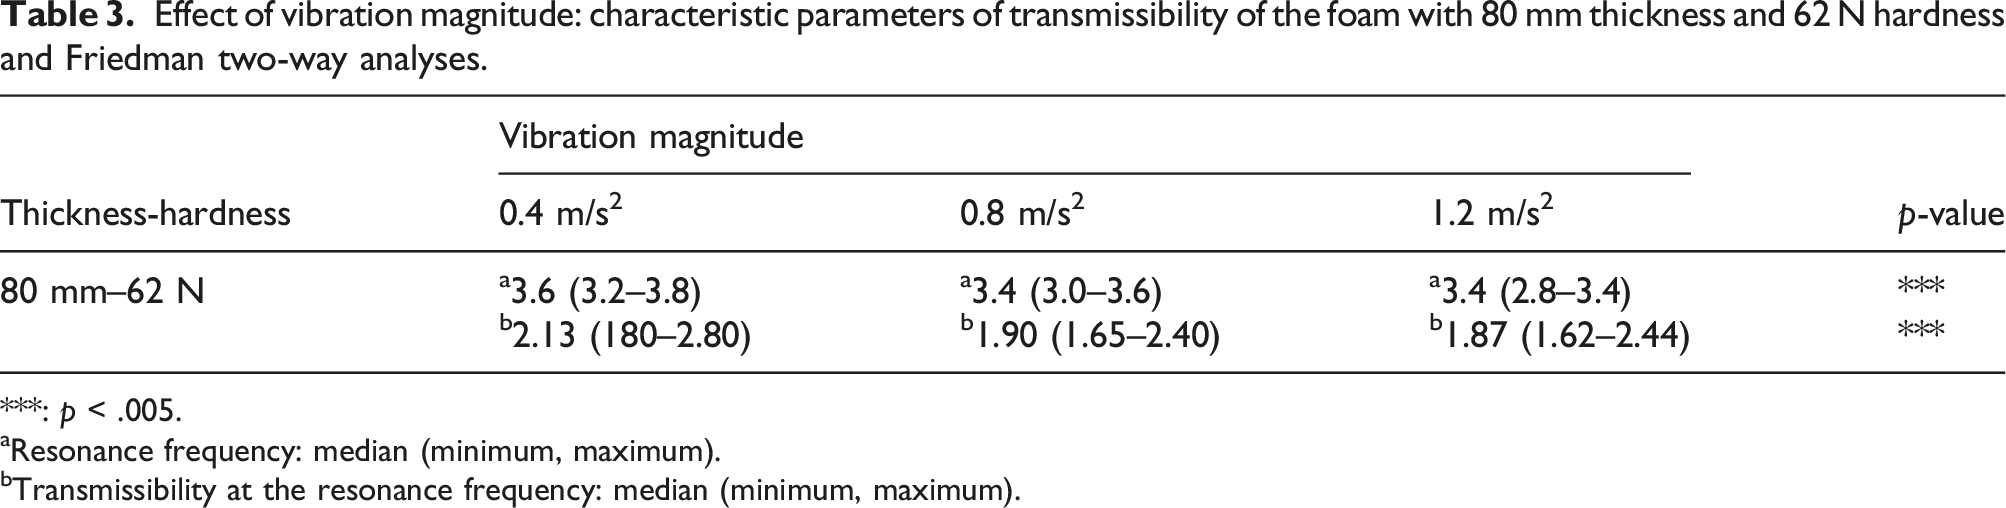
As the magnitude of the vertical excitation increased from 0.4 to 1.2 m/s2 r.m.s., the principal resonance frequency reduced (p < .001, Friedman). The decrease of the resonance frequencies with magnitude increase from 0.4 m/s2 to 0.8 m/s2 was more obvious than the change of magnitude increase from 0.8 m/s2 to 1.2 m/s2. Similar nonlinearity during different vibration magnitudes has been found in previous studies on the transmissibility during vertical or horizontal vibration.27,31,32 In addition, many scholars have also found the nonlinearity of the man-seat system in the study of the apparent mass. Muscle tension and sitting posture had a nonlinearity effect on apparent mass.33,34 The passive thixotropy of soft tissues, rather than the geometric nonlinearity, is the most likely primary cause of the nonlinearity in biodynamic responses.34,35 Qiu et al. 36 and Huang et al. 35 found that with the increase of excitation magnitude, the resonance frequency of apparent mass decreased which is similar to the results of this study. When the human body is exposed to higher excitation magnitude, the muscle tension of the subject may increase involuntarily, resulting in an increase in the stiffness of the tissues of the ischial tuberosities which might be the reason for a decrease in the nonlinearity. 33 The nonlinearity of the human-seat system found in this study may be largely contributed by the nonlinearity of human body, and it may be the same mechanisms responsible for nonlinearities found in apparent mass studies. In addition, the nonlinearity of the foam material may contribute to the nonlinearity of the human-seat system in response to vibration, although the extent of its contribution is impossible to quantify.
Effect of seat cushion parameters and excitation magnitude on SEAT values
Effect of foam thickness on SEAT values
The SEAT values of the three hardness foam cushions at different thickness levels are calculated and illustrated in Figure 5 (taking the test results with an excitation magnitude of 0.4 m/s2 as an example). And the Friedman two-way test of the effects of changing foam thickness (40, 60, 80, and 100 mm) at the seat pan on the SEAT values is given in Table 4. Effect of foam thickness on SEAT value: (a) 62 N; (b) 88 N; (c) 110 N. Effect of foam thickness: Friedman two-way analyses for the significance of difference in the SEAT values for each foam hardness. -:p > .05; ***: p < .005.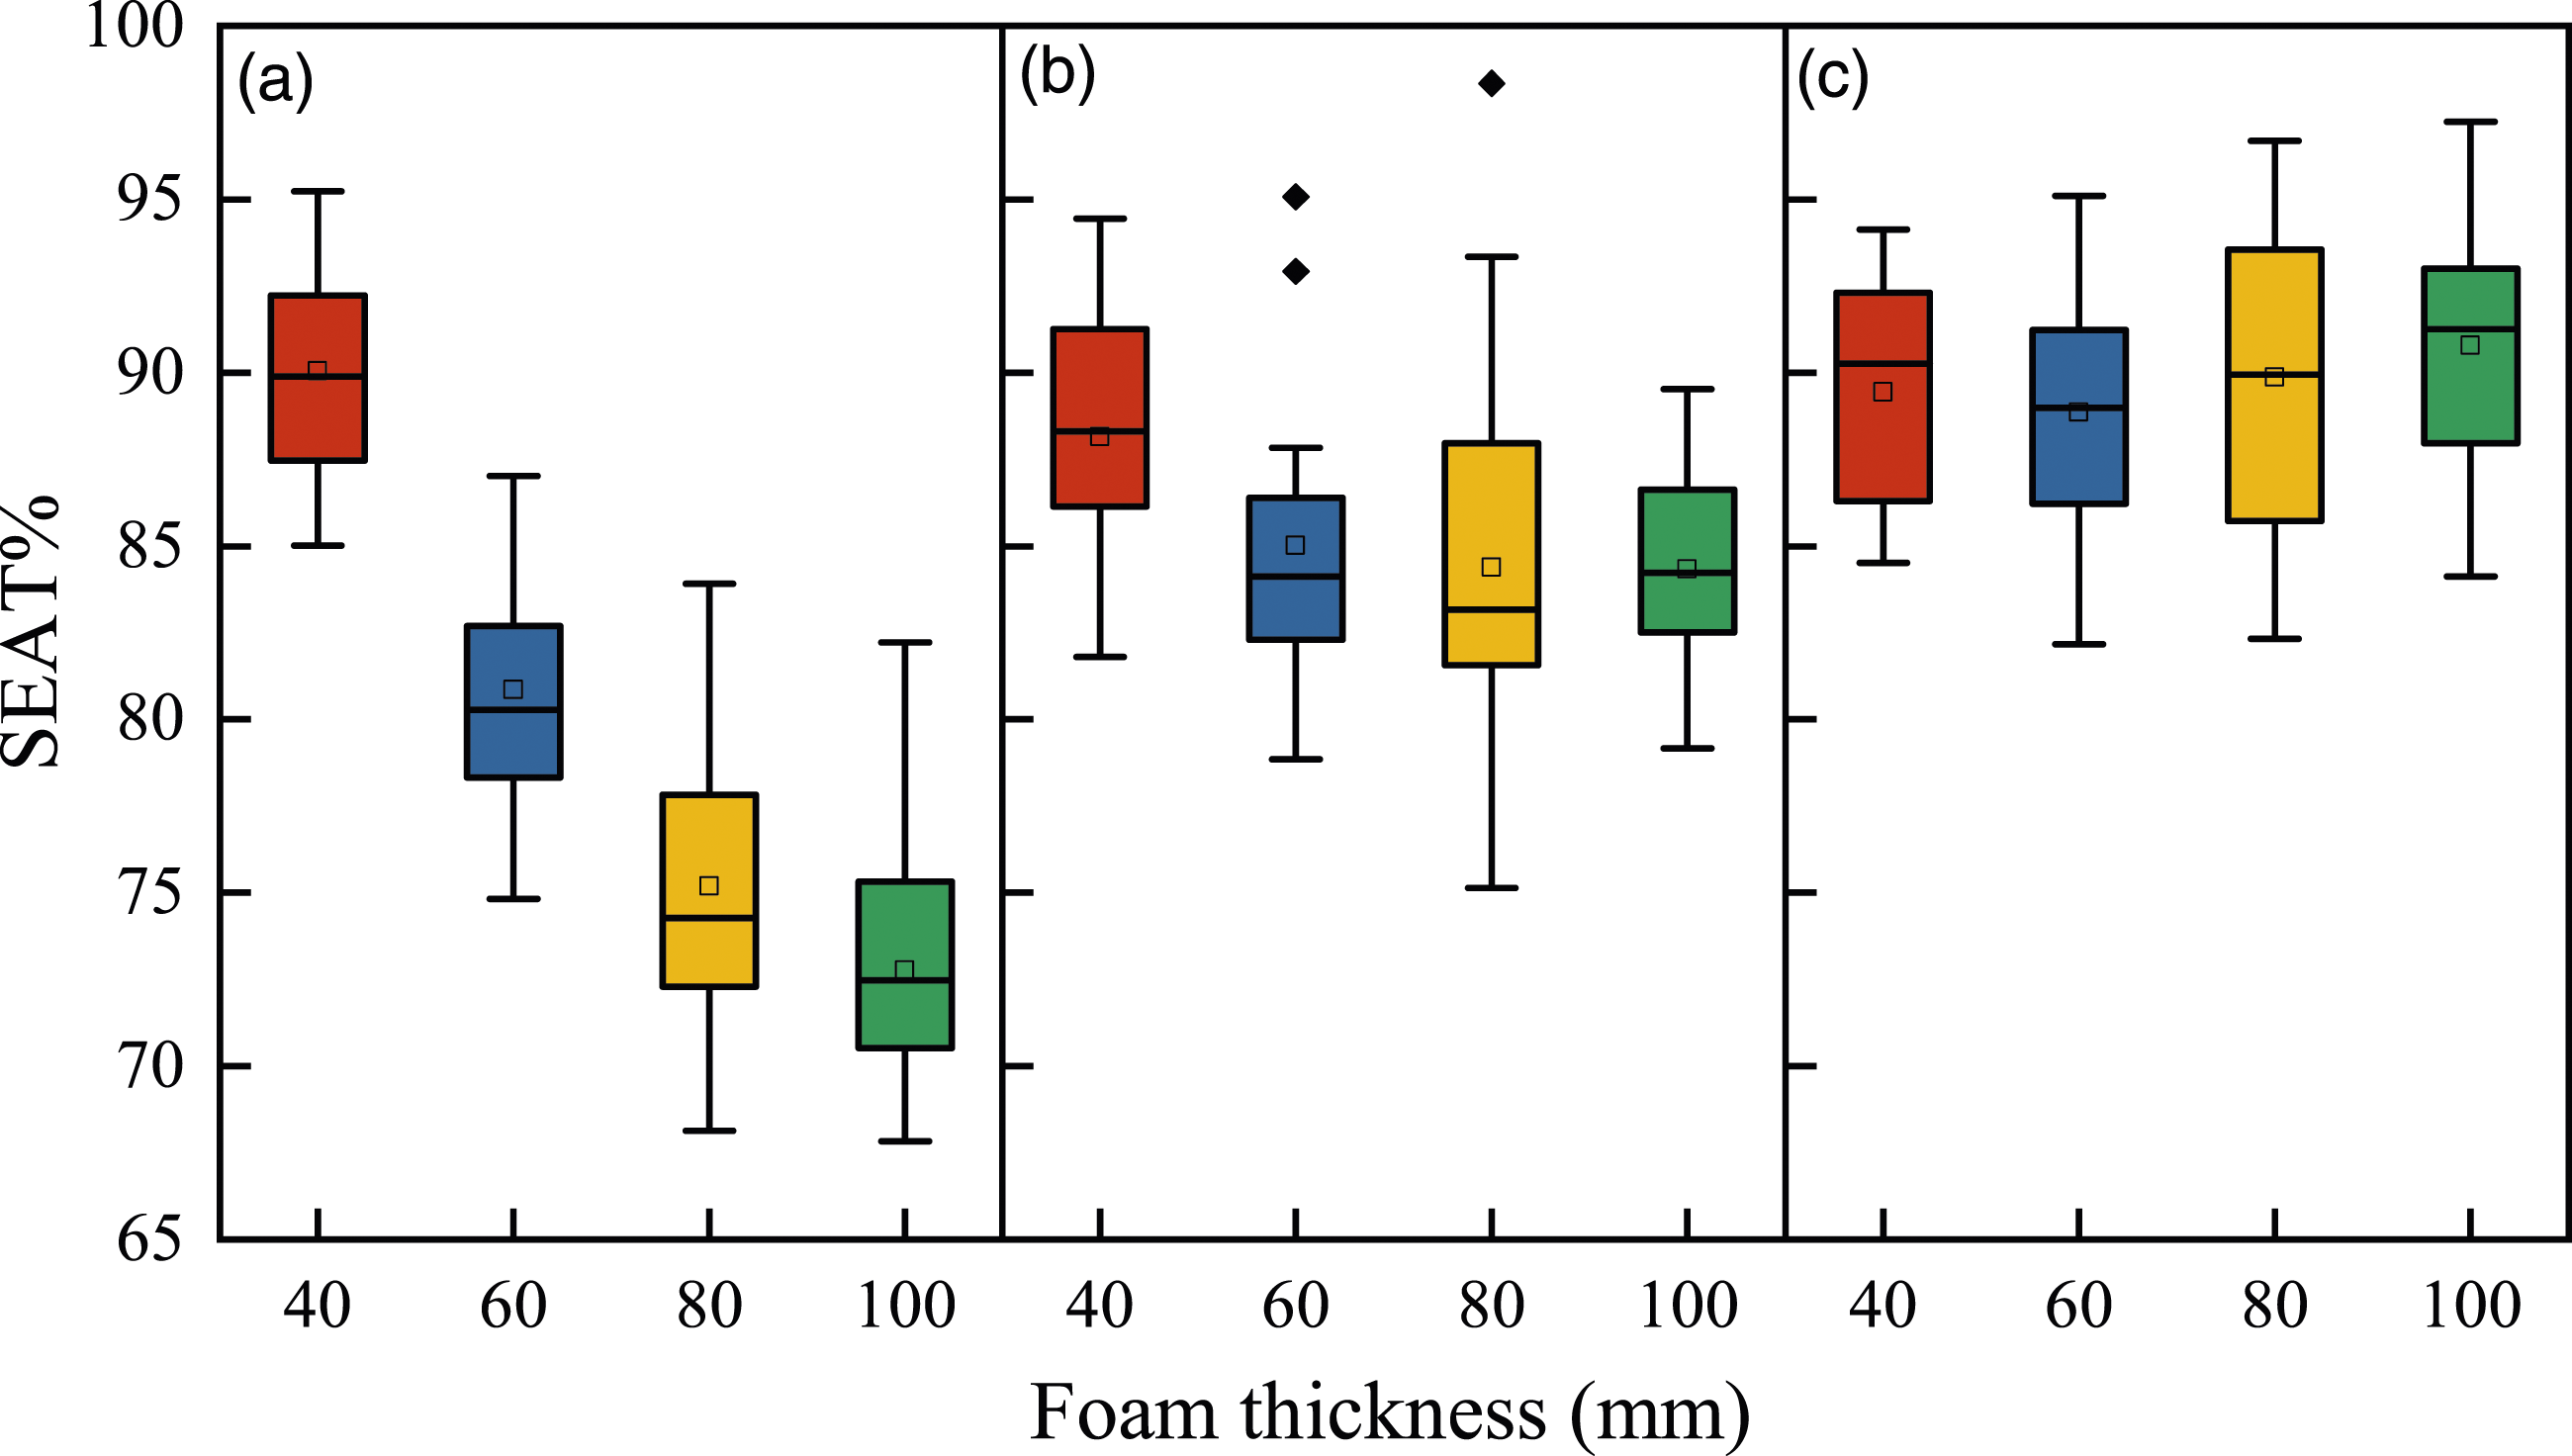
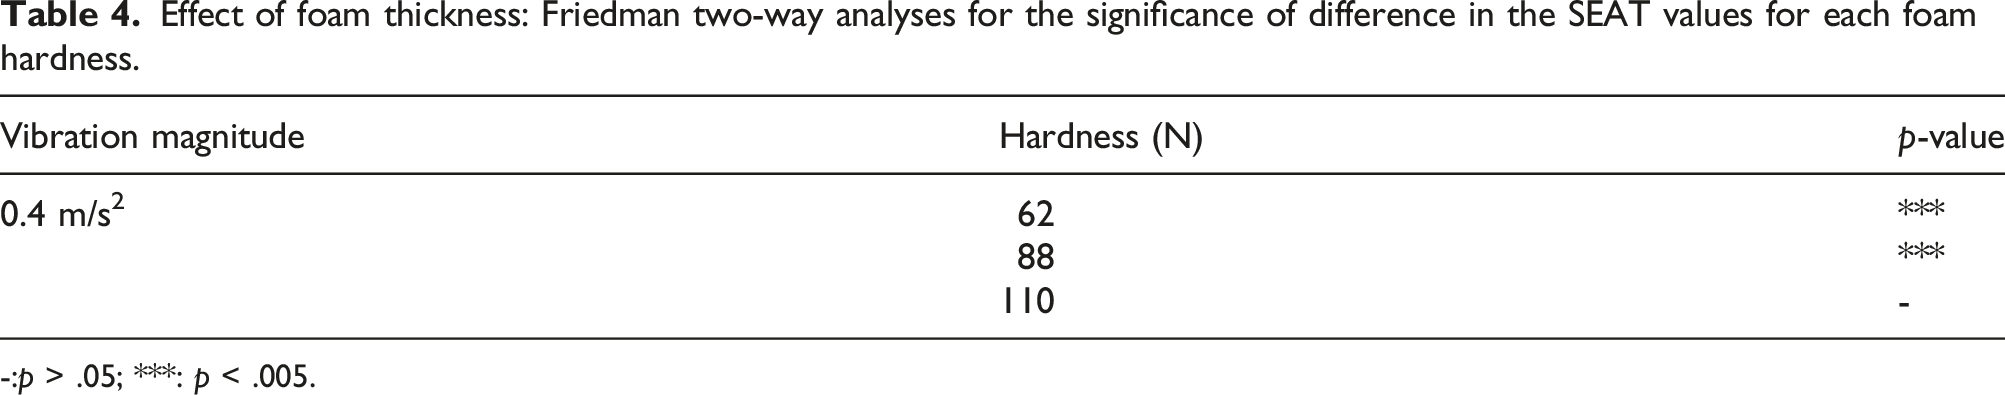
At a hardness of 62 N, the SEAT value decreased with increasing foam thickness (p < .001, Friedman); at a hardness of 88 N, the SEAT value decreased with the increasing of foam thickness except for a thickness of 100 mm (p < .001, Friedman); and at a hardness of 110 N, the influence of thickness on SEAT value is not significant (p > .05, Friedman). The SEAT value showed a decreasing trend with increasing foam thickness, but with diminishing returns at a hardness of 62 N (Figure 5(a)). When the foam thickness increased from 40 mm to 60 mm, 60 mm to 80 mm, and 80 mm to 100 mm, the SEAT value decreased by nearly 10%, about 6%, and less than 2%, respectively. This is similar to the findings of Ragan et al., 2 Ebe et al., 3 and Singh et al. 4 that increasing the thickness of the cushion layer has a positive effect on improving the static comfort of the seat, but there is a diminishing return. At a thickness of 40 mm, the median SEAT values obtained by the test subjects are about 90% that means the vibration isolation efficiency of the foam is relatively poor at this thickness (Figure 5 (red boxplot)). It can be seen from Figure 5(c) that at 110 N hardness, increasing the thickness does not help to improve the vibration isolation efficiency of the foam.
Effect of foam hardness on SEAT values
As shown in Figure 6, the SEAT values of the four thickness foam cushions at different hardness levels are exhibiting differences (taking the test results with an excitation magnitude of 0.4 m/s2 as an example). Table 5 shows the Friedman two-way analyses of the effects of changing foam hardness (62, 88, and 110 N) at the seat pan on the SEAT values. Effect of foam hardness on SEAT value: (a) 40 mm; (b) 60 mm; (c) 80 mm; (d) 100 mm. Effect of foam hardness: Friedman two-way analyses for the significance of difference in the SEAT values for each foam thickness. -:p > .05; ***: p < .005.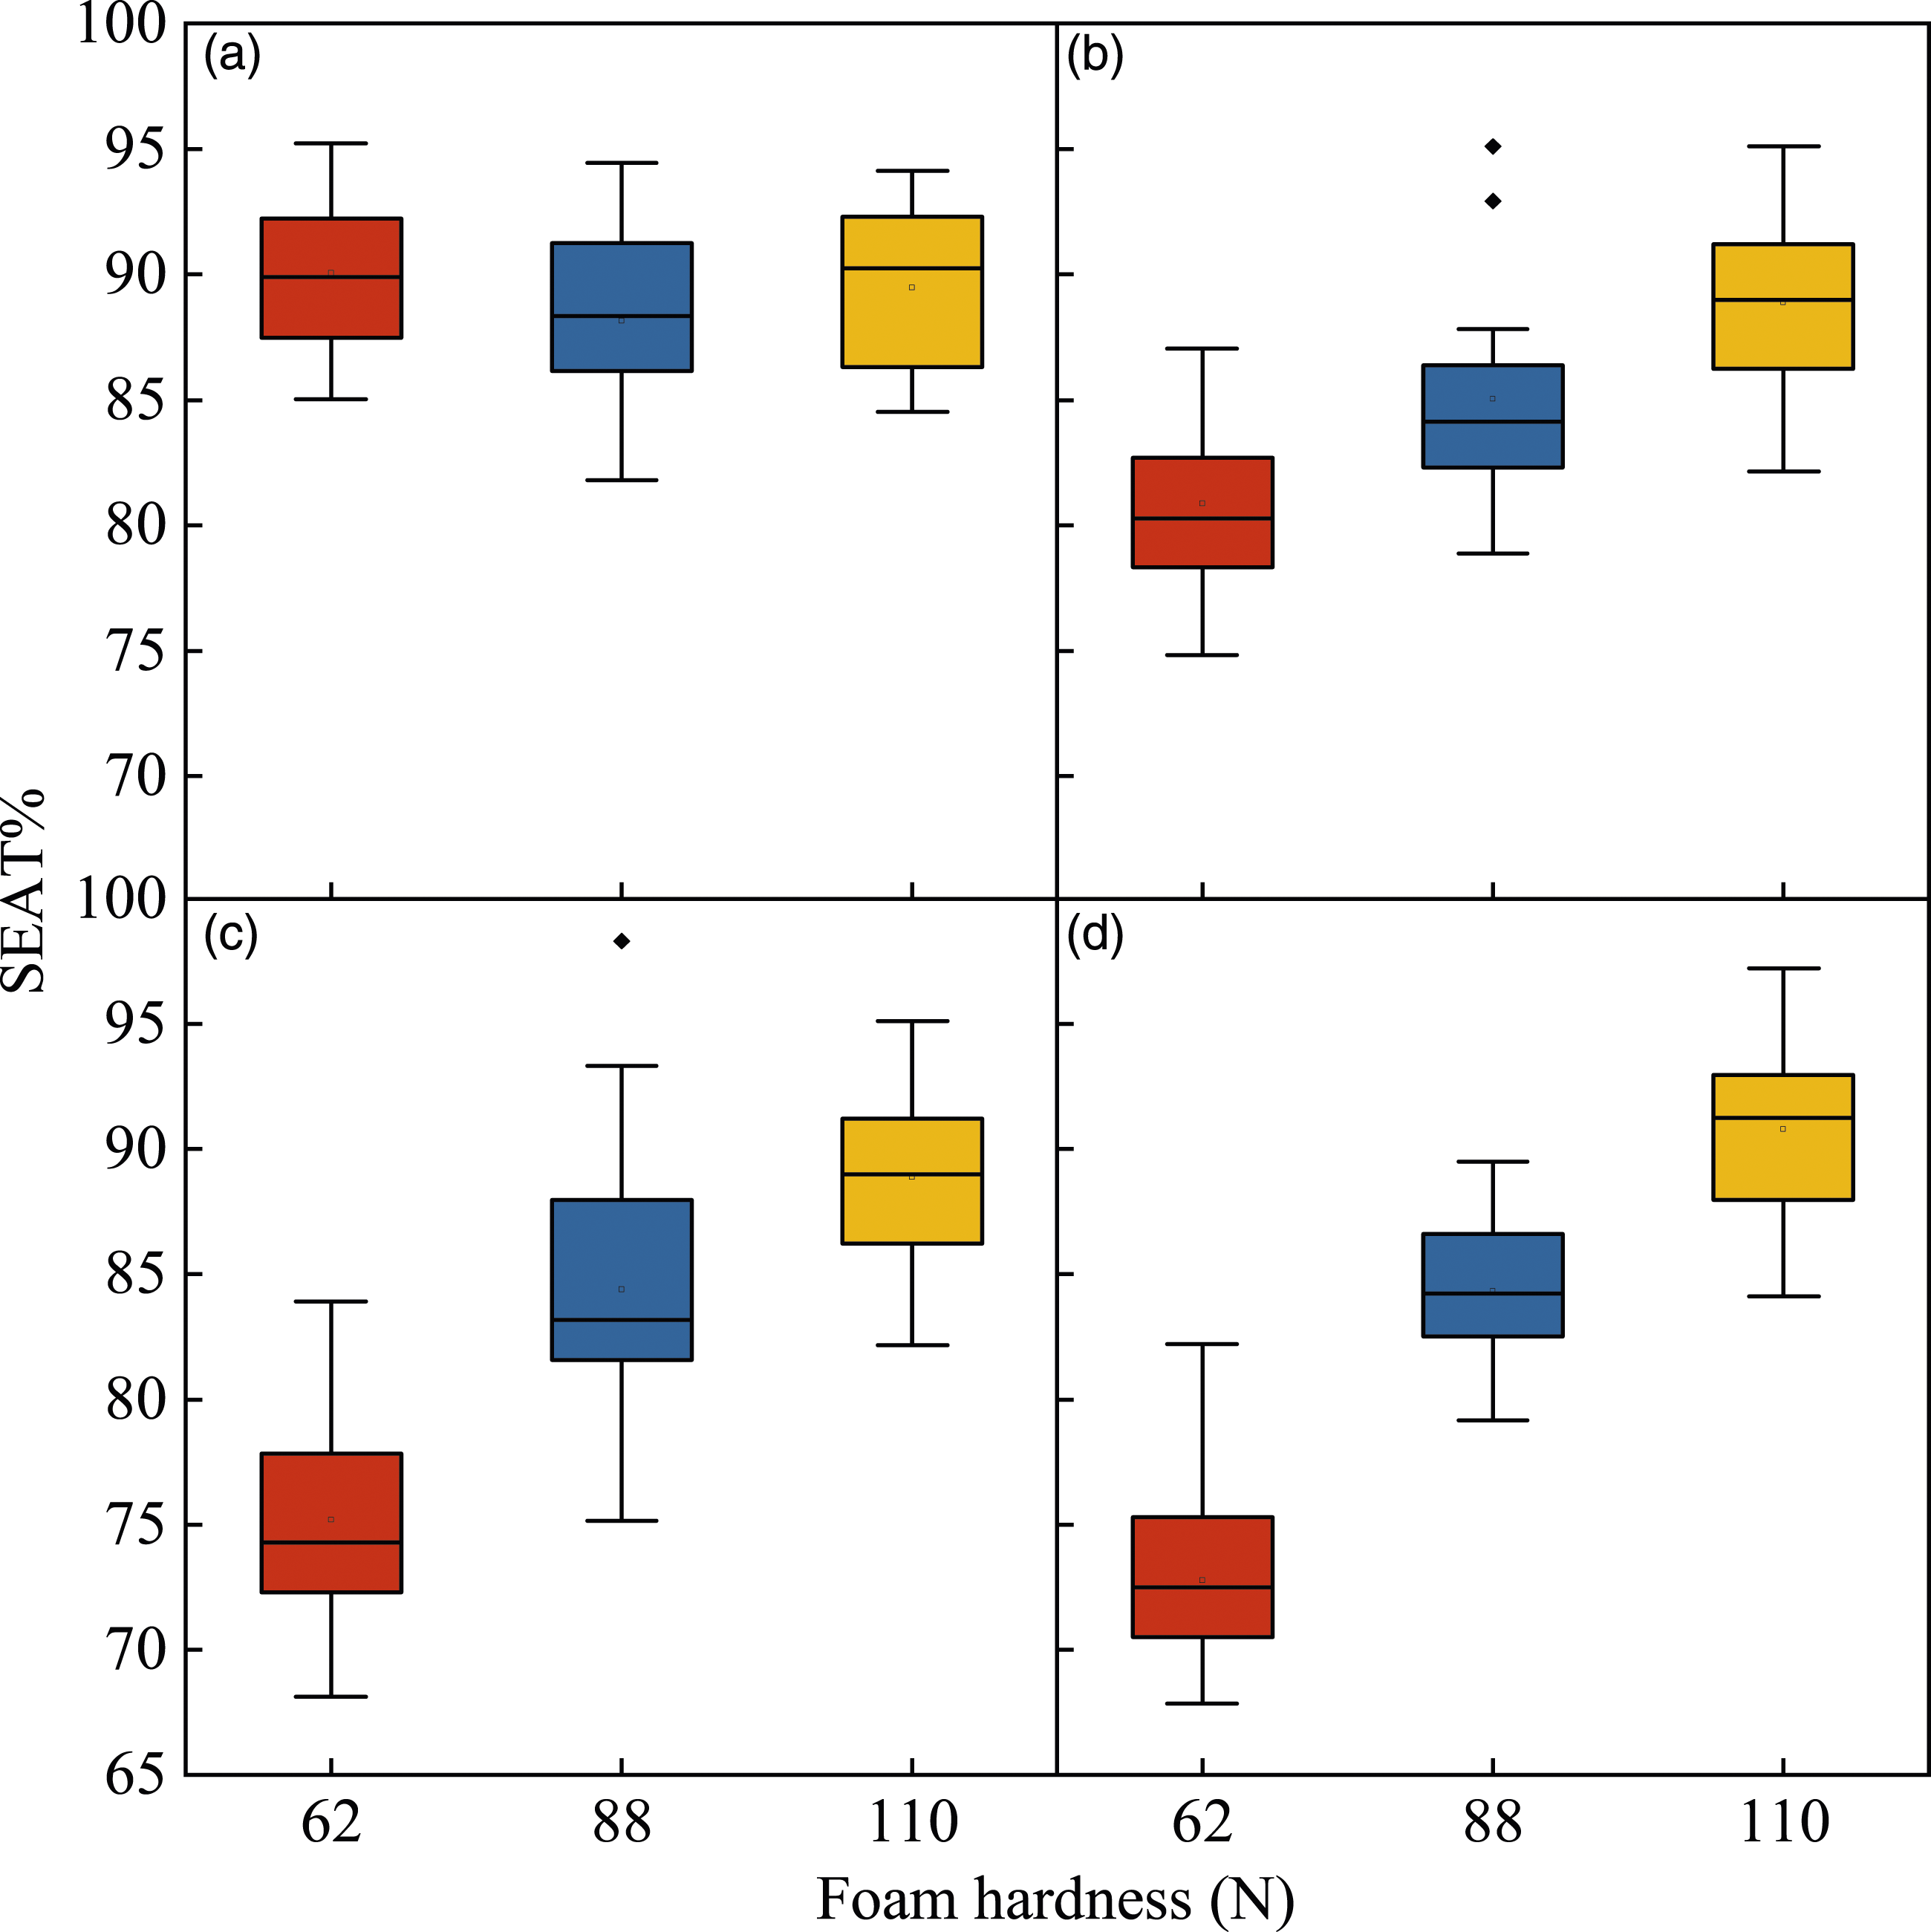
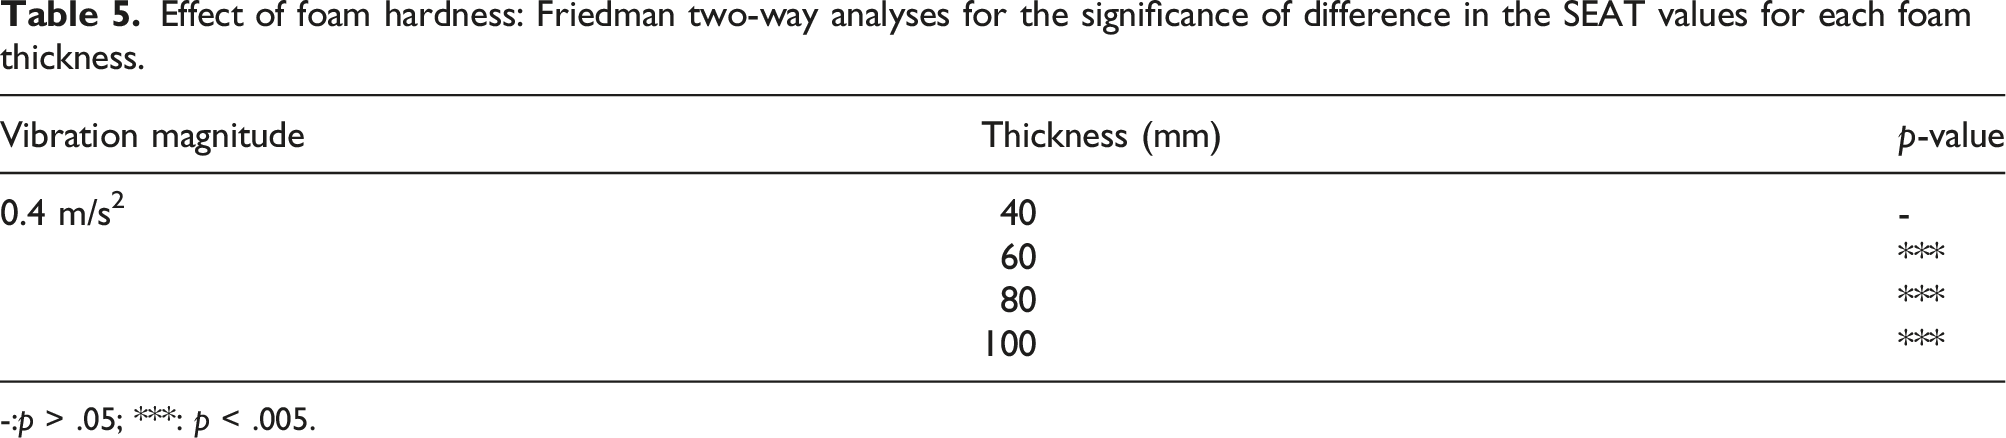
There was no statistically significant influence of foam hardness on the SEAT values at a thickness of 40 mm (p > .05, Friedman). At the other three thicknesses, the SEAT value increases with the increase of foam hardness (p < .001, Friedman). Compared with the change of foam hardness from 62 N to 88 N, the foam hardness from 88 N to 110 N has no obvious effect on the SEAT values. The median SEAT values of the foam with a hardness of 110 N is about 90% at all four thicknesses, indicating that the vibration isolation efficiency of the foam is relatively poor at this hardness (Figure 6). For foams with a thickness of 40 mm, reducing the hardness has little effect on improving the vibration isolation efficiency of the foam (Figure 6(a)). It can be seen from Figure 6(b)–(d) that except for the foam cushion at 40 mm thickness, decrease in the hardness can help to improve the vibration isolation efficiency of the foam.
Evaluation of vibration isolation performance of foam seat cushion
The median SEAT values for each foam cushion at an excitation magnitude of 0.4 m/s2 are illustrated in Figure 7. Median SEAT value of each foam cushion.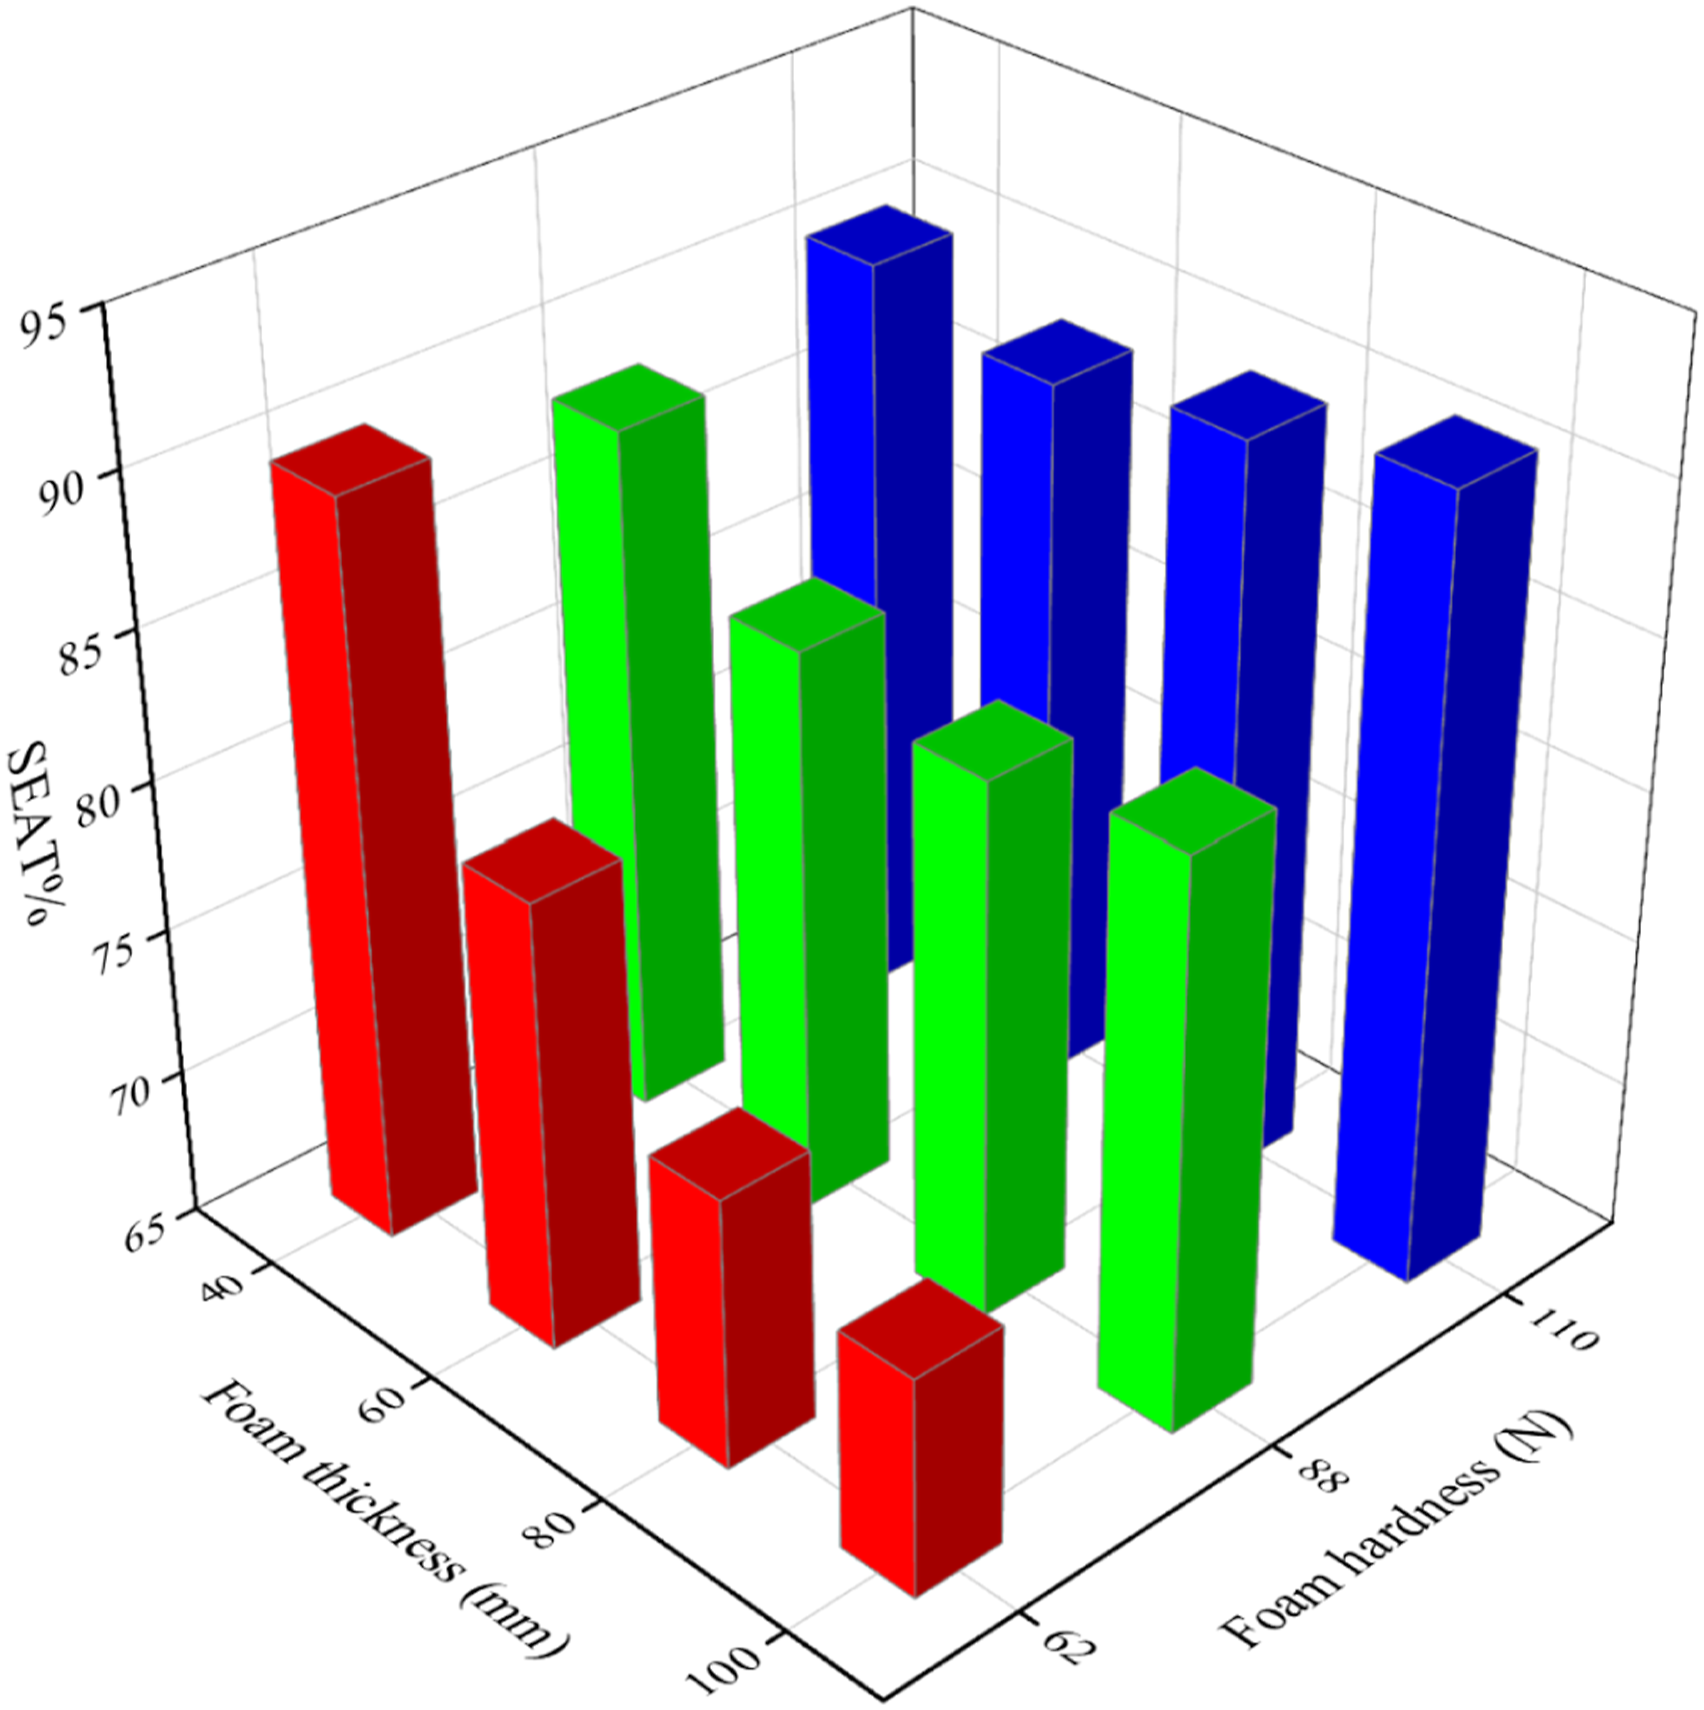
The SEAT values of 12 foam cushions are all less than 100%, which shows that these foam cushions can attenuate vibration in the frequency range of 0.5–20 Hz. The vibration isolation efficiency of high-hardness foam cushions is less affected by thickness, and the vibration isolation efficiency of low-thickness foam cushions is also less affected by hardness. Both high-hardness foam cushions and low-thickness foam cushions have poor overall vibration isolation efficiency. There are 6 foam cushions with a thickness of 40 mm or a hardness of 110 N, and their SEAT values are both greater than 88%. Among all the 12 foam cushions, the foam cushion with a hardness of 62 N and a thickness of 80 mm, and the foam cushion with a hardness of 62 N and a thickness of 100 mm have the best vibration isolation efficiency, their SEAT values are both lower than 75%. The two foam cushions with a hardness of 110 N and thicknesses of 80 mm and 100 mm have the worst vibration isolation efficiency, and their SEAT values reached 90% and above. From the measurement results, the combination of low hardness and high thickness can make the vibration isolation efficiency of the foam seat cushion better.
The SEAT values which vary with vibration magnitude are illustrated in Figure 8. Figure 8(a) shows the variation trend of SEAT value with the vibration magnitude for the foam under different hardness (taking the median of all thicknesses), and Figure 8(b) shows the variation trend of SEAT value with the vibration magnitude for the foam under four thicknesses (taking the median of all hardness). It can be seen that regardless of the hardness and thickness, the SEAT value decreases with the increase of the excitation magnitude (Friedman two-way analyses for the effect of excitation amplitude on all foams, p < .001, not listed here), this shows that the vibration isolation efficiency of the foam is improved at a larger excitation magnitude. SEAT value changes with vibration magnitude: (a) at different hardnesses; (b) at different thicknesses.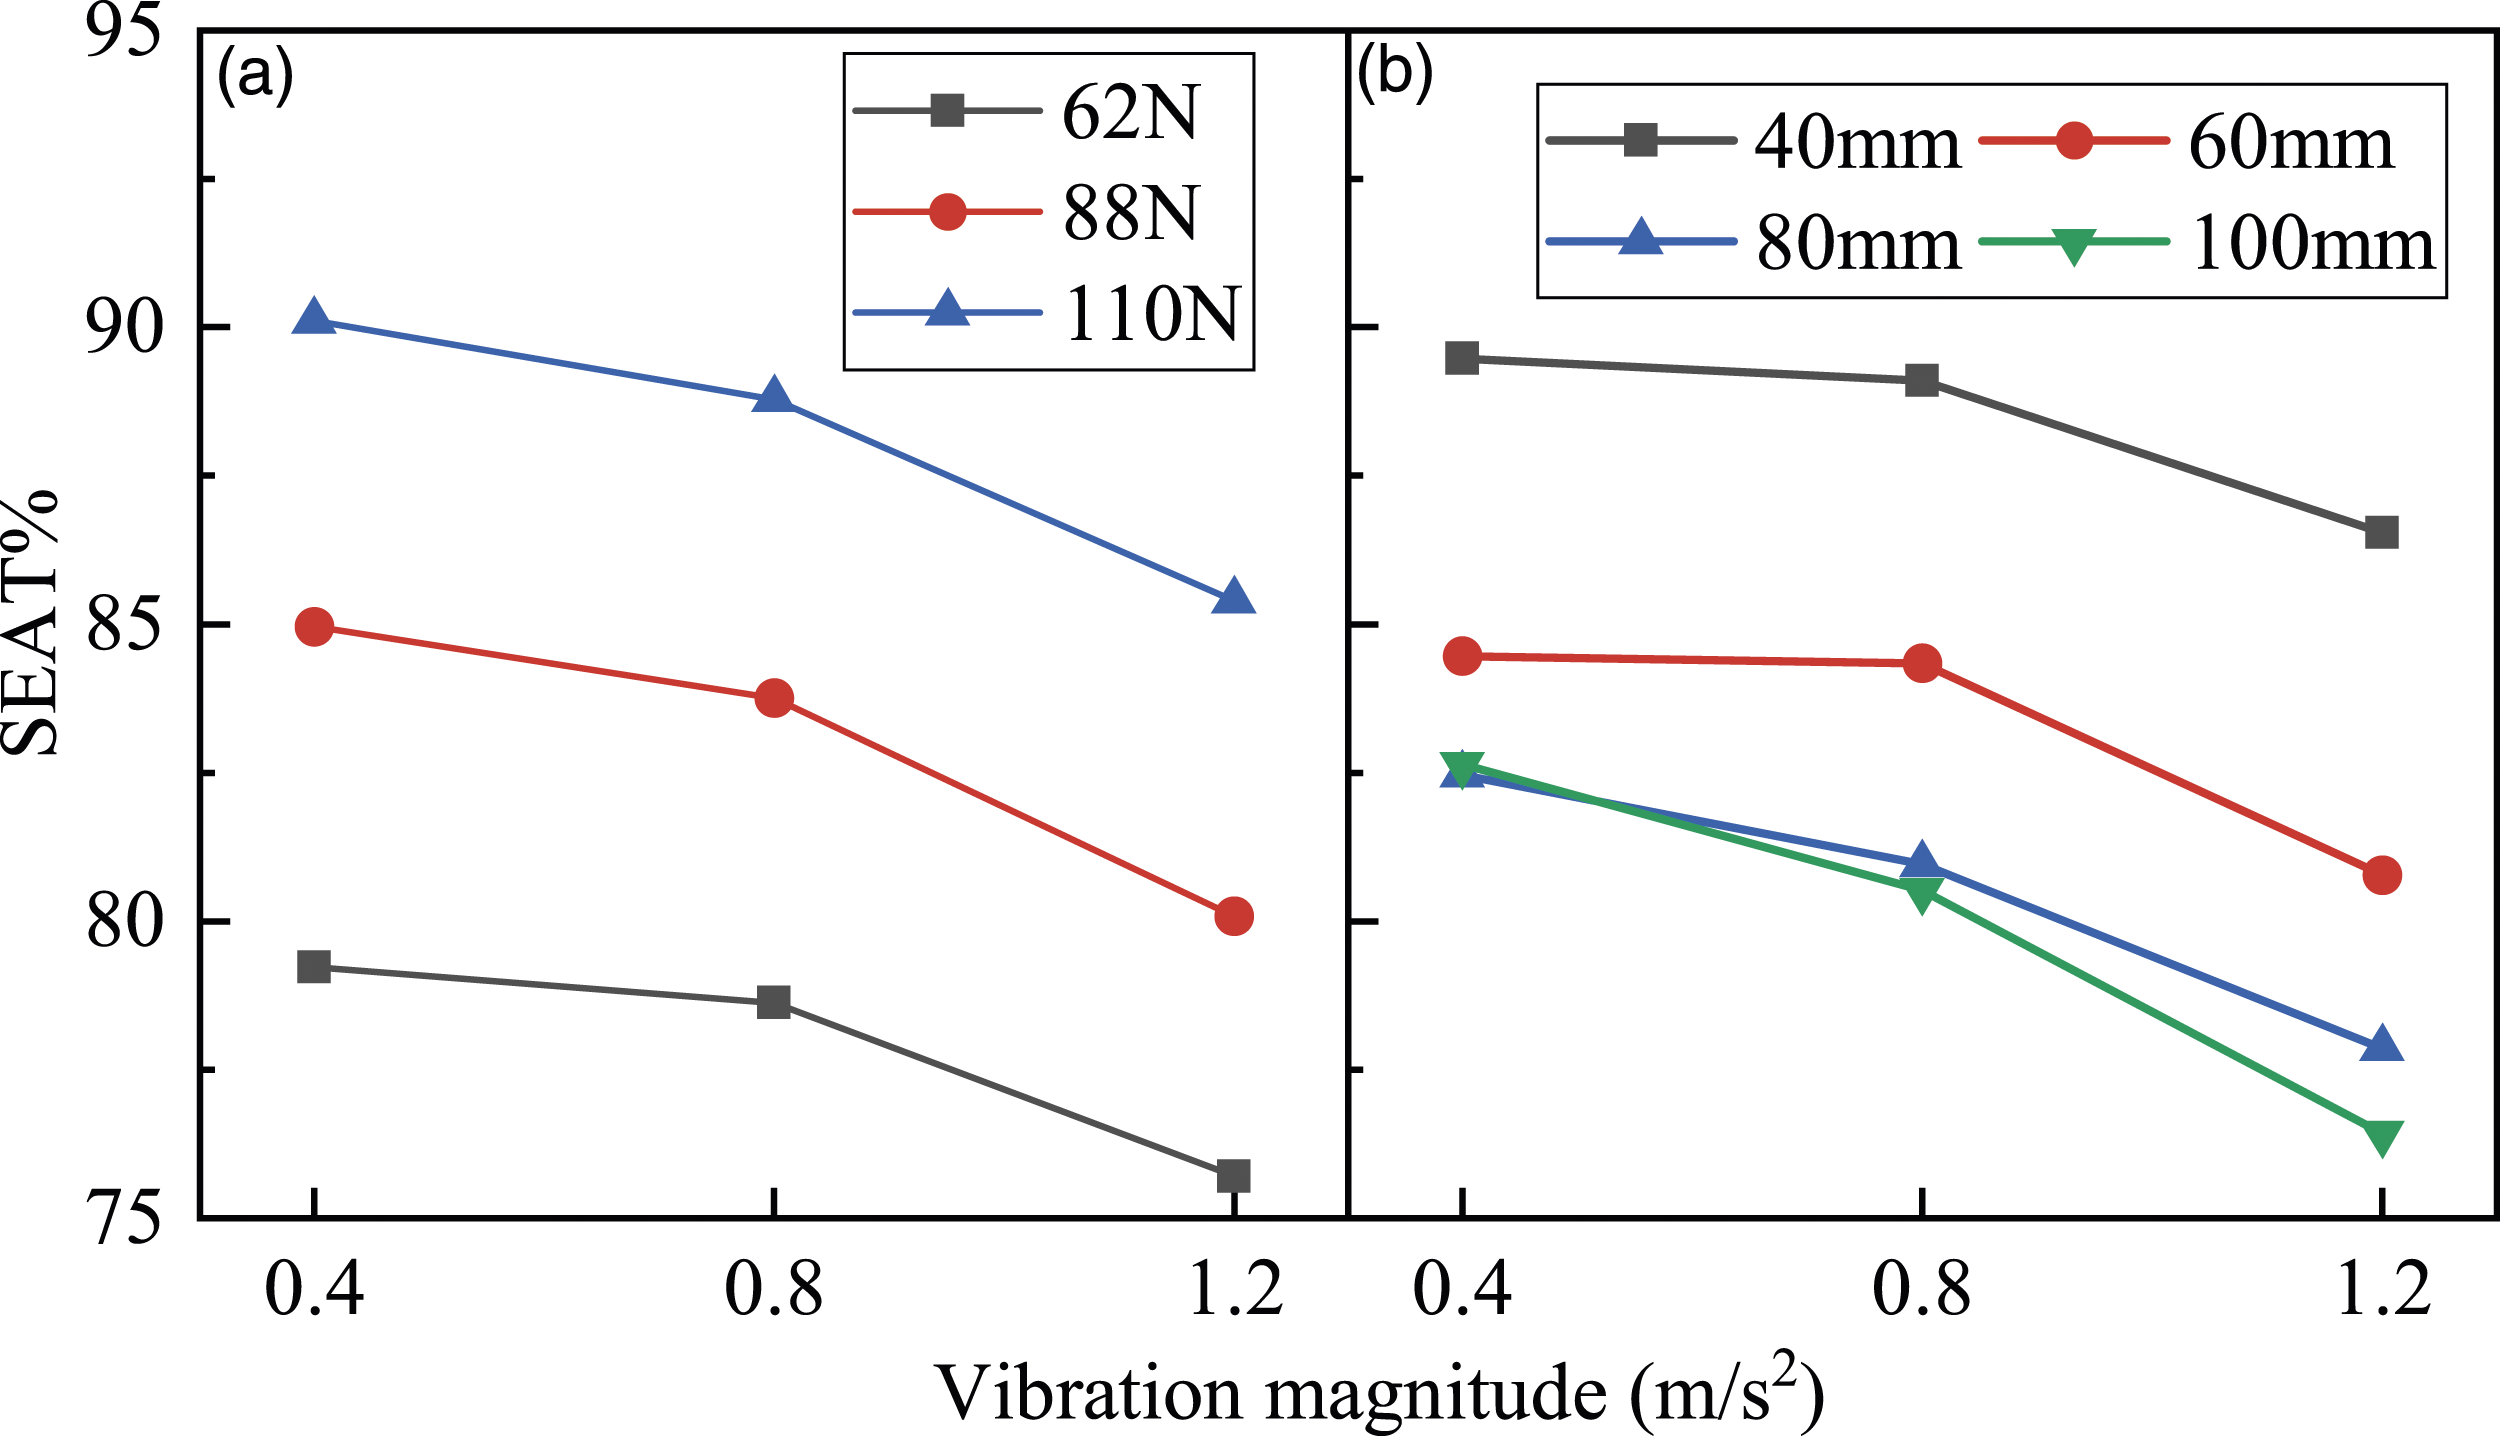
Implications for seat design and sitting comfort
The influences of the thickness and hardness have been systematically identified in the current study. Previous studies focused on the relationship between the transmissibility and the foam physical parameters during vibration,9,10,14 while the current study not only found the relationship between the transmissibility and the foam physical parameters but also identified the influences of the thickness and hardness on the SEAT value during different excitation magnitudes.
The transmissibility of a seat is determined by the dynamic properties of human-seat system, so that the findings about transmissibility of the study can apply to the design of vehicle seats to minimize the transmission of vibration to the body. According to the frequency weighting function of the vertical axis given in ISO 2631, 37 the most sensitive frequency range of the human body is 4–12.5 Hz. Therefore, the resonance frequency of the seat should avoid this frequency range as far as possible, and lower transmissibility in this frequency range is better. This study shows that at 40 mm thickness and 60 mm thickness, the resonance frequency is not less than 4 Hz (Figure 2 and Table 1). That is to say, a thickness less than 60 mm is not conducive to occupant comfort. And the findings of the effect of hardness on the transmissibility show that at 110 N hardness, the resonance frequency is bigger than 4 Hz (Figure 3 and Table 2). This may suggest that the foam material with 110 N hardness is not suitable for car seat cushion.
Through the transmissibility, we can exclude some foam material parameters that are not suitable for car seat, but the rest is still hard to decide. For example, two foam cushions with same hardness of 62 N and their thickness are 80 mm and 100 mm, respectively, the thicker foam has a higher peak transmission rate, but its transmissibility in the 5–10 Hz frequency range is lower. Compared with transmissibility, the SEAT value provides numerical evaluation of seat vibration isolation efficiency, guiding the car seat design more directly. 16 By comparing the SEAT value of 12 foam cushions, it is easy to find that the foam cushions with a thickness of 100 mm and hardness of 62 N have the smallest SEAT value. Therefore, when the parameters of foam materials cannot be determined by transmissibility, the SEAT value can provide a reference. In addition, due to the nonlinearity of the human-seat system, the seat nonlinearity should be taken into account for a car seat design.
Conclusion
In this study, the transmissibility of a variety of foam cushions during different vertical vibration magnitudes was measured. The influence of the physical parameters of the foam cushion on the cushion transmissibility was explored, and the SEAT value was introduced to evaluate the cushion vibration isolation efficiency. The cushion transmissibility shows that except for 110 N hardness foam, with the increase of foam thickness, the resonance frequency decreases, but the peak transmissibility increases; except for 40 mm thickness, with the increase of hardness, the peak transmissibility decreases, but the resonance frequency increases. With the increase of the excitation amplitude, the human-seat system exhibits a nonlinear resonance frequency decrease and the peak transmissibility decreases. The results of the SEAT values show that the vibration isolation efficiency of foam cushions with higher hardness and smaller thickness is poor, and the vibration isolation efficiency of foam cushions with higher hardness is less affected by the thickness of the foam. When the thickness of foam cushion is smaller, the vibration isolation performance is also less affected by the foam hardness; the combination of physical parameters of high thickness and low hardness seems to make the vibration isolation performance of the seat cushion better. Increasing the thickness is beneficial to improving the vibration isolation performance of the seat cushion, but with diminishing returns.
Footnotes
Declaration of conflicting interests
The author(s) declared no potential conflicts of interest with respect to the research, authorship, and/or publication of this article.
Funding
The author(s) disclosed receipt of the following financial support for the research, authorship, and/or publication of this article: This work was supported by the National Natural Science Foundation of China (Grant No. 51875060).