
Abstract
The bridge pavement subjected to vehicle loads is the most vulnerable component in the highway bridge and overloaded vehicles can result in serious damage to the bridge pavement more easily. Therefore, it is necessary to consider the pavement in vehicle-bridge interaction (VBI) system. However, the bridge pavement is not considered in the traditional VBI system or the viscoelasticity of bridge pavement is ignored. In this study, a new vehicle-pavement-bridge interaction (VPBI) system is established. The viscoelastic asphalt pavement is simulated with the continuously and uniformly distributed spring-damper. The equivalent stiffness coefficient and equivalent damping coefficient of the pavement are determined through dynamic mechanical analysis (DMA) test and finite element method. The equations of motion for VPBI system can be derived using Lagrange equation and the modal superposition method. Then the crucial parameters such as displacement at mid-span of bridge, acceleration of vehicle body, tire contact force, and pavement deformation are obtained. The effects of vehicle velocity, bridge span, tire contact area, pavement stiffness coefficient, and pavement damping coefficient on VPBI responses are analyzed. The results show that (1) The pavement is compressive during vehicle passing bridge and its dynamic deformation fluctuates around initially static deformation of pavement. (2) Increasing the stiffness of pavement can rapidly reduce the deformation of pavement, while the pavement damping has the opposite effect. (3) The increase of bridge span can conduct exponentially growth of dynamic responses of VPBI system. The pavement deformation will increase by 7.9% if the bridge span is lengthened by 5 m. This study provides a reliability response analysis method for VPBI system.
Introduction
The vehicle bridge interaction (VBI) system model has been established by many researchers through the observation and investigation of the vibration of vehicle and bridge. 1 In the early VBI system, vehicles were generally simplified as a moving constant load 2 or a moving mass, 3 and the dynamic responses of a bridge were discussed. Currently, more complicated and actual models are appeared and used to analyze VBI system. A three-mass VBI system based on semi-analytical approach was proposed by Judy P. Yang. 4 The dynamics of a two-axle vehicle and a continuous elastic beam were studied to analyze the separation of the vehicle and the beam by Dan St˘ancioiu et al. 5 The beam was supported by elastic bearing modelled as linear springs. The governing equations of the vehicle and the beam were derived and the results showed that most probably separation will occur if the beam has three linear elastic bearing. The VBI system with different boundary conditions was studied by Zhenhua Shi and Nasim Uddin. 6 The vehicle was modelled as a damped sprung mass and the Euler–Bernoulli beam had three boundary conditions including both ends fixed, fixed simply supported, and one end fixed the other end free (cantilever). This study indicated that boundary conditions have obvious effect on the bridge frequency. The dynamic amplification factor of the bridge was investigated by Yingyan Li et al. 7 via the VBI system. A quarter car with two degrees of freedom and a Euler–Bernoulli with T-shape webs were used and the influence of road roughness irregularities on the dynamic amplification. A two-mass vehicle model with single degree of freedom moving on a simply supported beam was proposed by Judy P. Yang and Bo-How Chen 8 to extract frequencies more realistically. Most of the works mentioned above were based on the analytical or semi-analytical VBI system. In addition, the finite element method (FEM) is also a common technique for the analysis of VBI system.9–12 Both the vehicle and bridge can be modelled and simulated by FEM. Although many achievements have been obtained in the research field of VBI system, the influence of pavement is always neglected or seldom considered directly in VBI system.
The pavement directly bears the loads from vehicles and environment and is important to the bridge maintenance and preservation. 13 Leilei Chen et al. 14 proposed a numerical multiscale analysis method to determine the critical cracking zone of steel bridge deck pavements. The full-scale bridge analysis, subsection analysis and sub-element analysis were utilized by the consideration of vehicle pavement interaction. Linbing Wang et al. 13 proposed a coupled static-and-dynamics analysis to analyze the pavement structure stress state. An elastic layered model of the pavement was established by the dynamic module of ANSYS software and a half sine periodic loading was applied to bridge deck pavement. The results showed that the suggested thickness of the upper layer pavement is 3.5 cm–4.5 cm and this range for the lower layer is 5 cm–7 cm. Xuntao Wang et al. 15 established a three-dimensional finite element steel bridge and its deck pavement by ANSYS software. The viscoelasticity of asphalt concrete is described by Burgers model and the parameters were converted into Prony series in the ANSYS software. The stress values of asphalt concrete deck pavement were calculated and analyzed with the consideration of the characteristic of asphalt concrete and the interlayer bonding condition. Niujing Ma 16 proposed an eight-node solid-plate element for simulating the pavement and analyzed the local dynamic behavior of orthotropic steel bridge decks subjected to impact loads, wherein the impact loads considered as triangular loads. Its results indicated that the bridge deck pavement cannot be neglected in the mechanical analysis of bridge deck structure. Chenchen Zhang 17 studied the mechanical performance of the steel-bridge deck pavement of the multitower suspension bridge under random traffic flow through the multiscale numerical approach and experimental program. It is found that the pavement layer can reduce the stress of the steel-box girder roof. However, most of the reported studies did not consider the effect of the interaction between pavement and vehicle-bridge. And the material of asphalt pavement is often considered as elastic properties rather than viscoelasticity in vehicle-bridge interaction. And the equation derivation models are fewer than FEM models for the pavement researches considering vehicle-bridge interaction.
To obtain dynamic responses of the pavement and understand mechanical behavior of the pavement in vehicle-bridge interaction, a vehicle-pavement-bridge interaction (VPBI) system model is proposed in this study. The vehicle model and bridge model are set as a quarter car and a simply supported Euler–Bernoulli beam, respectively. The viscoelastic asphalt pavement is regarded as continuously and uniformly distributed spring-dampers and its equivalent stiffness coefficient and damping coefficient are estimated by dynamic mechanical analysis (DMA) test and finite element method. The dynamic responses of VPBI system can be obtained by solving the derived motion equations of VPBI system. Furthermore, the effect of vehicle velocity, bridge span, tire contact area, pavement stiffness coefficient, and pavement damping coefficient on dynamic responses of VPBI system is also discussed quantitatively. The results of theoretical analysis provide practical guidelines for preventing serious damage to bridge pavements.
The motion equations of VPBI system
Vehicle-pavement-bridge interaction system model is depicted as Figure 1. The quarter vehicle model moves on a simply supported Euler–Bernoulli beam with constant speed v. The bridge damping property is neglected, and the beam cross section is constant. The quarter vehicle model has three degrees of freedom which are the vertical displacement y
i
(i = 1,2,3) of the tire, the axle, and the vehicle body, respectively. The motion equations of the VPBI system are given in the following derivation. The VPBI system.
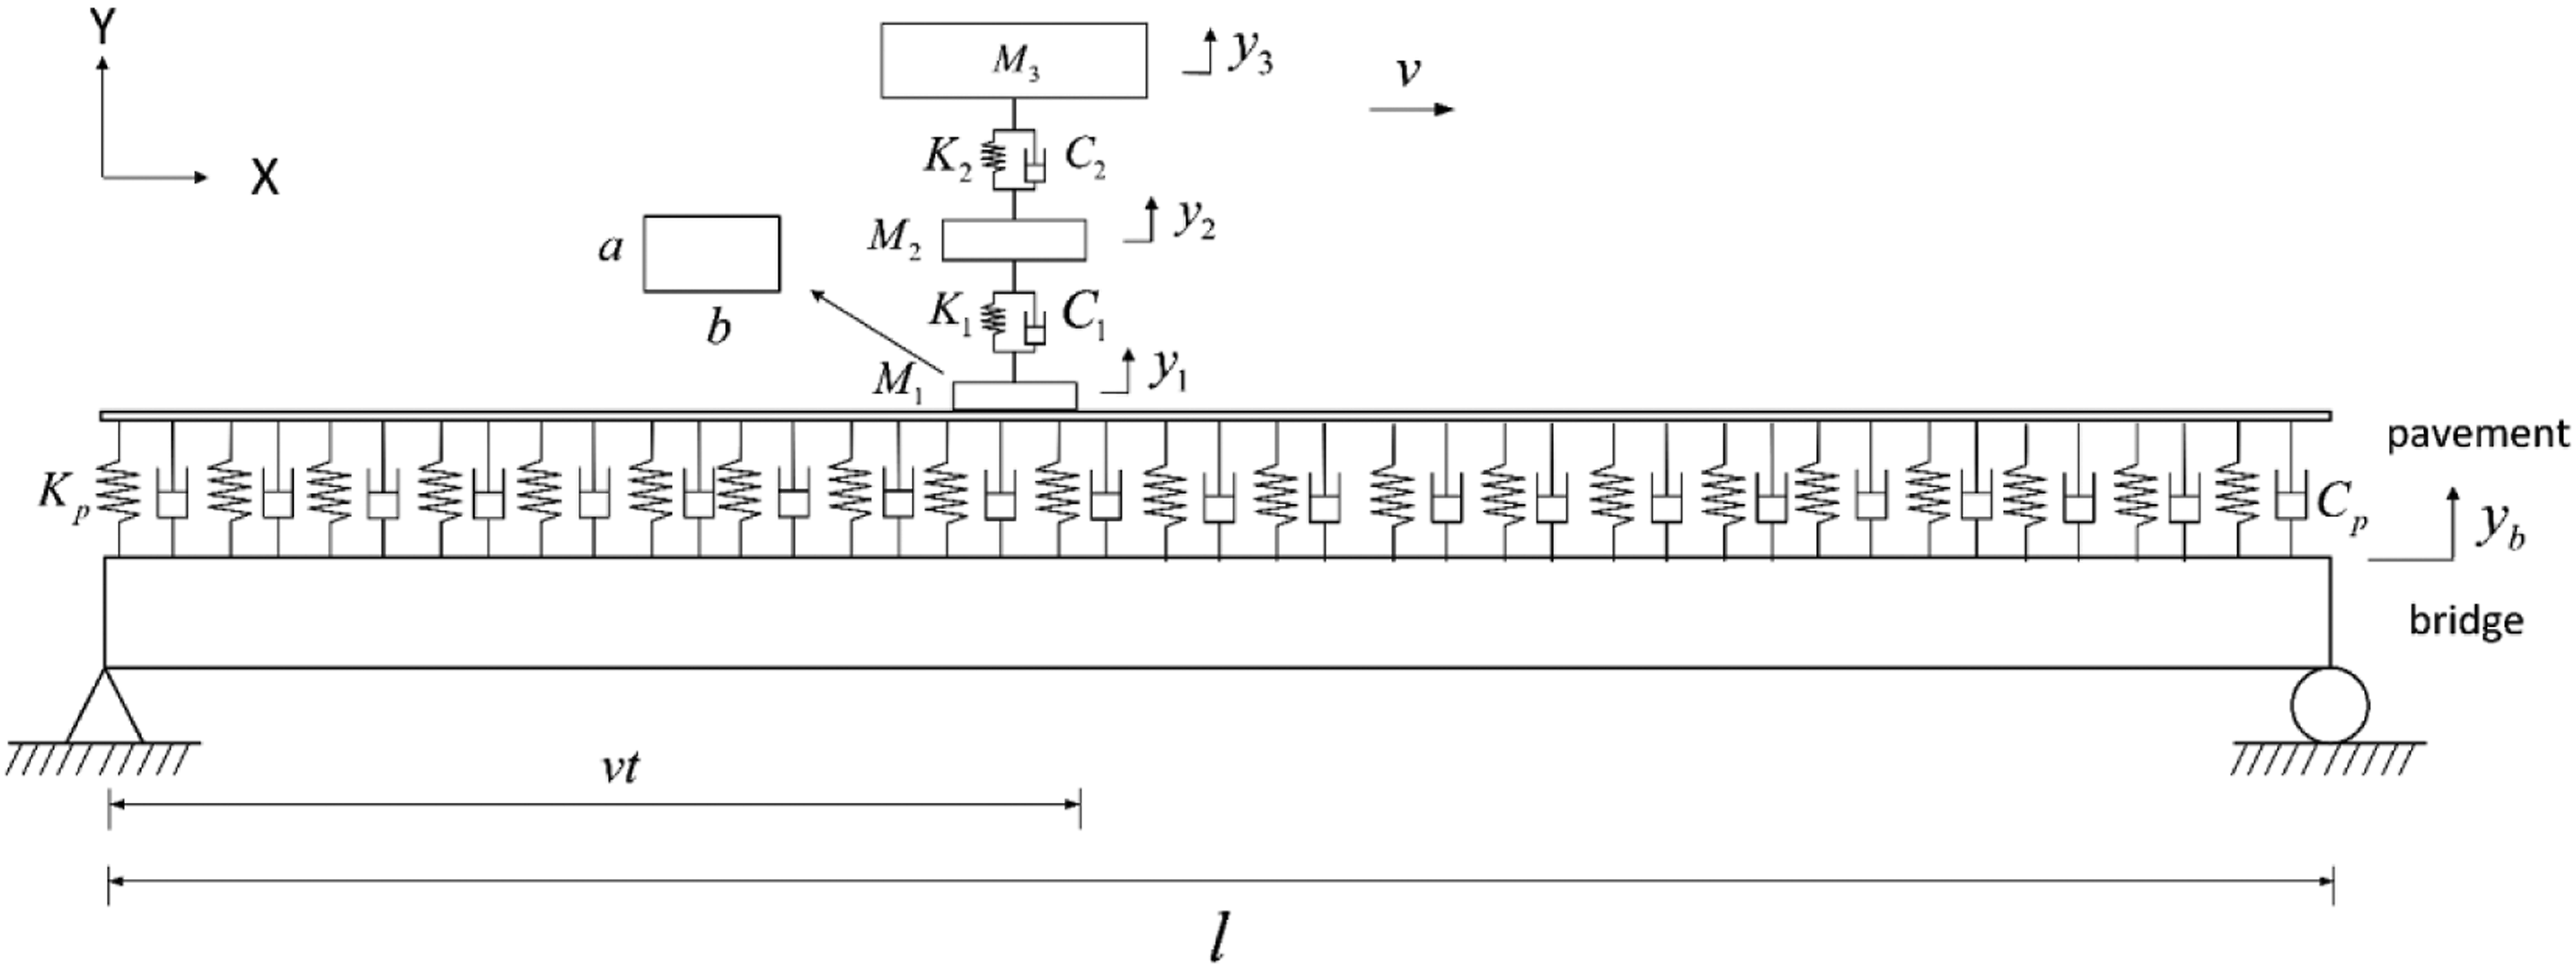
The static equilibrium position is chosen as the reference position of the vehicle motion. The kinetic energy T and the potential energy U of the vehicle are described by equations (1) and (2), respectively


The Lagrange equation is

The number of total degrees of freedom is three. Substituting equations (1)–(3) into equation (4), the vehicle motion equations can be obtained as follows


The bridge motion equations are

Here they are all constant.


According to the Modal superposition method,

For the simply supported beam, the mode functions are the sine function,
1
that is

Substituting equation (12) into equation (8), multiplying both sides of the equation by
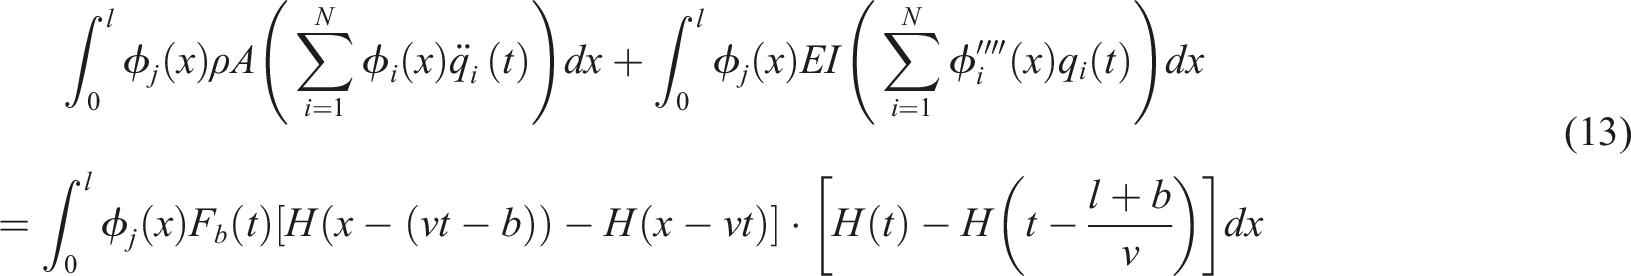
Based on the orthogonality relation for the modal function, equation (13) can be simplified as

The generalized mass


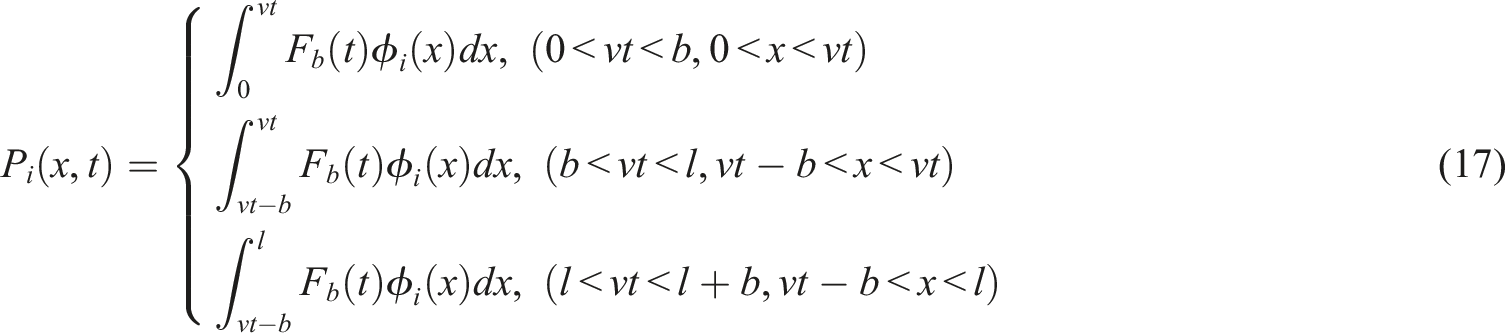
When the vehicle moving on the bridge, the moving procedure can be divided into three components: the vehicle enters to the bridge, the vehicle is on the bridge and the vehicle leaves from the bridge. These procedures shown in Figure 2, and The moving procedure of the vehicle: (a) enter to the bridge, (b) on the bridge, and (c) leave from the bridge.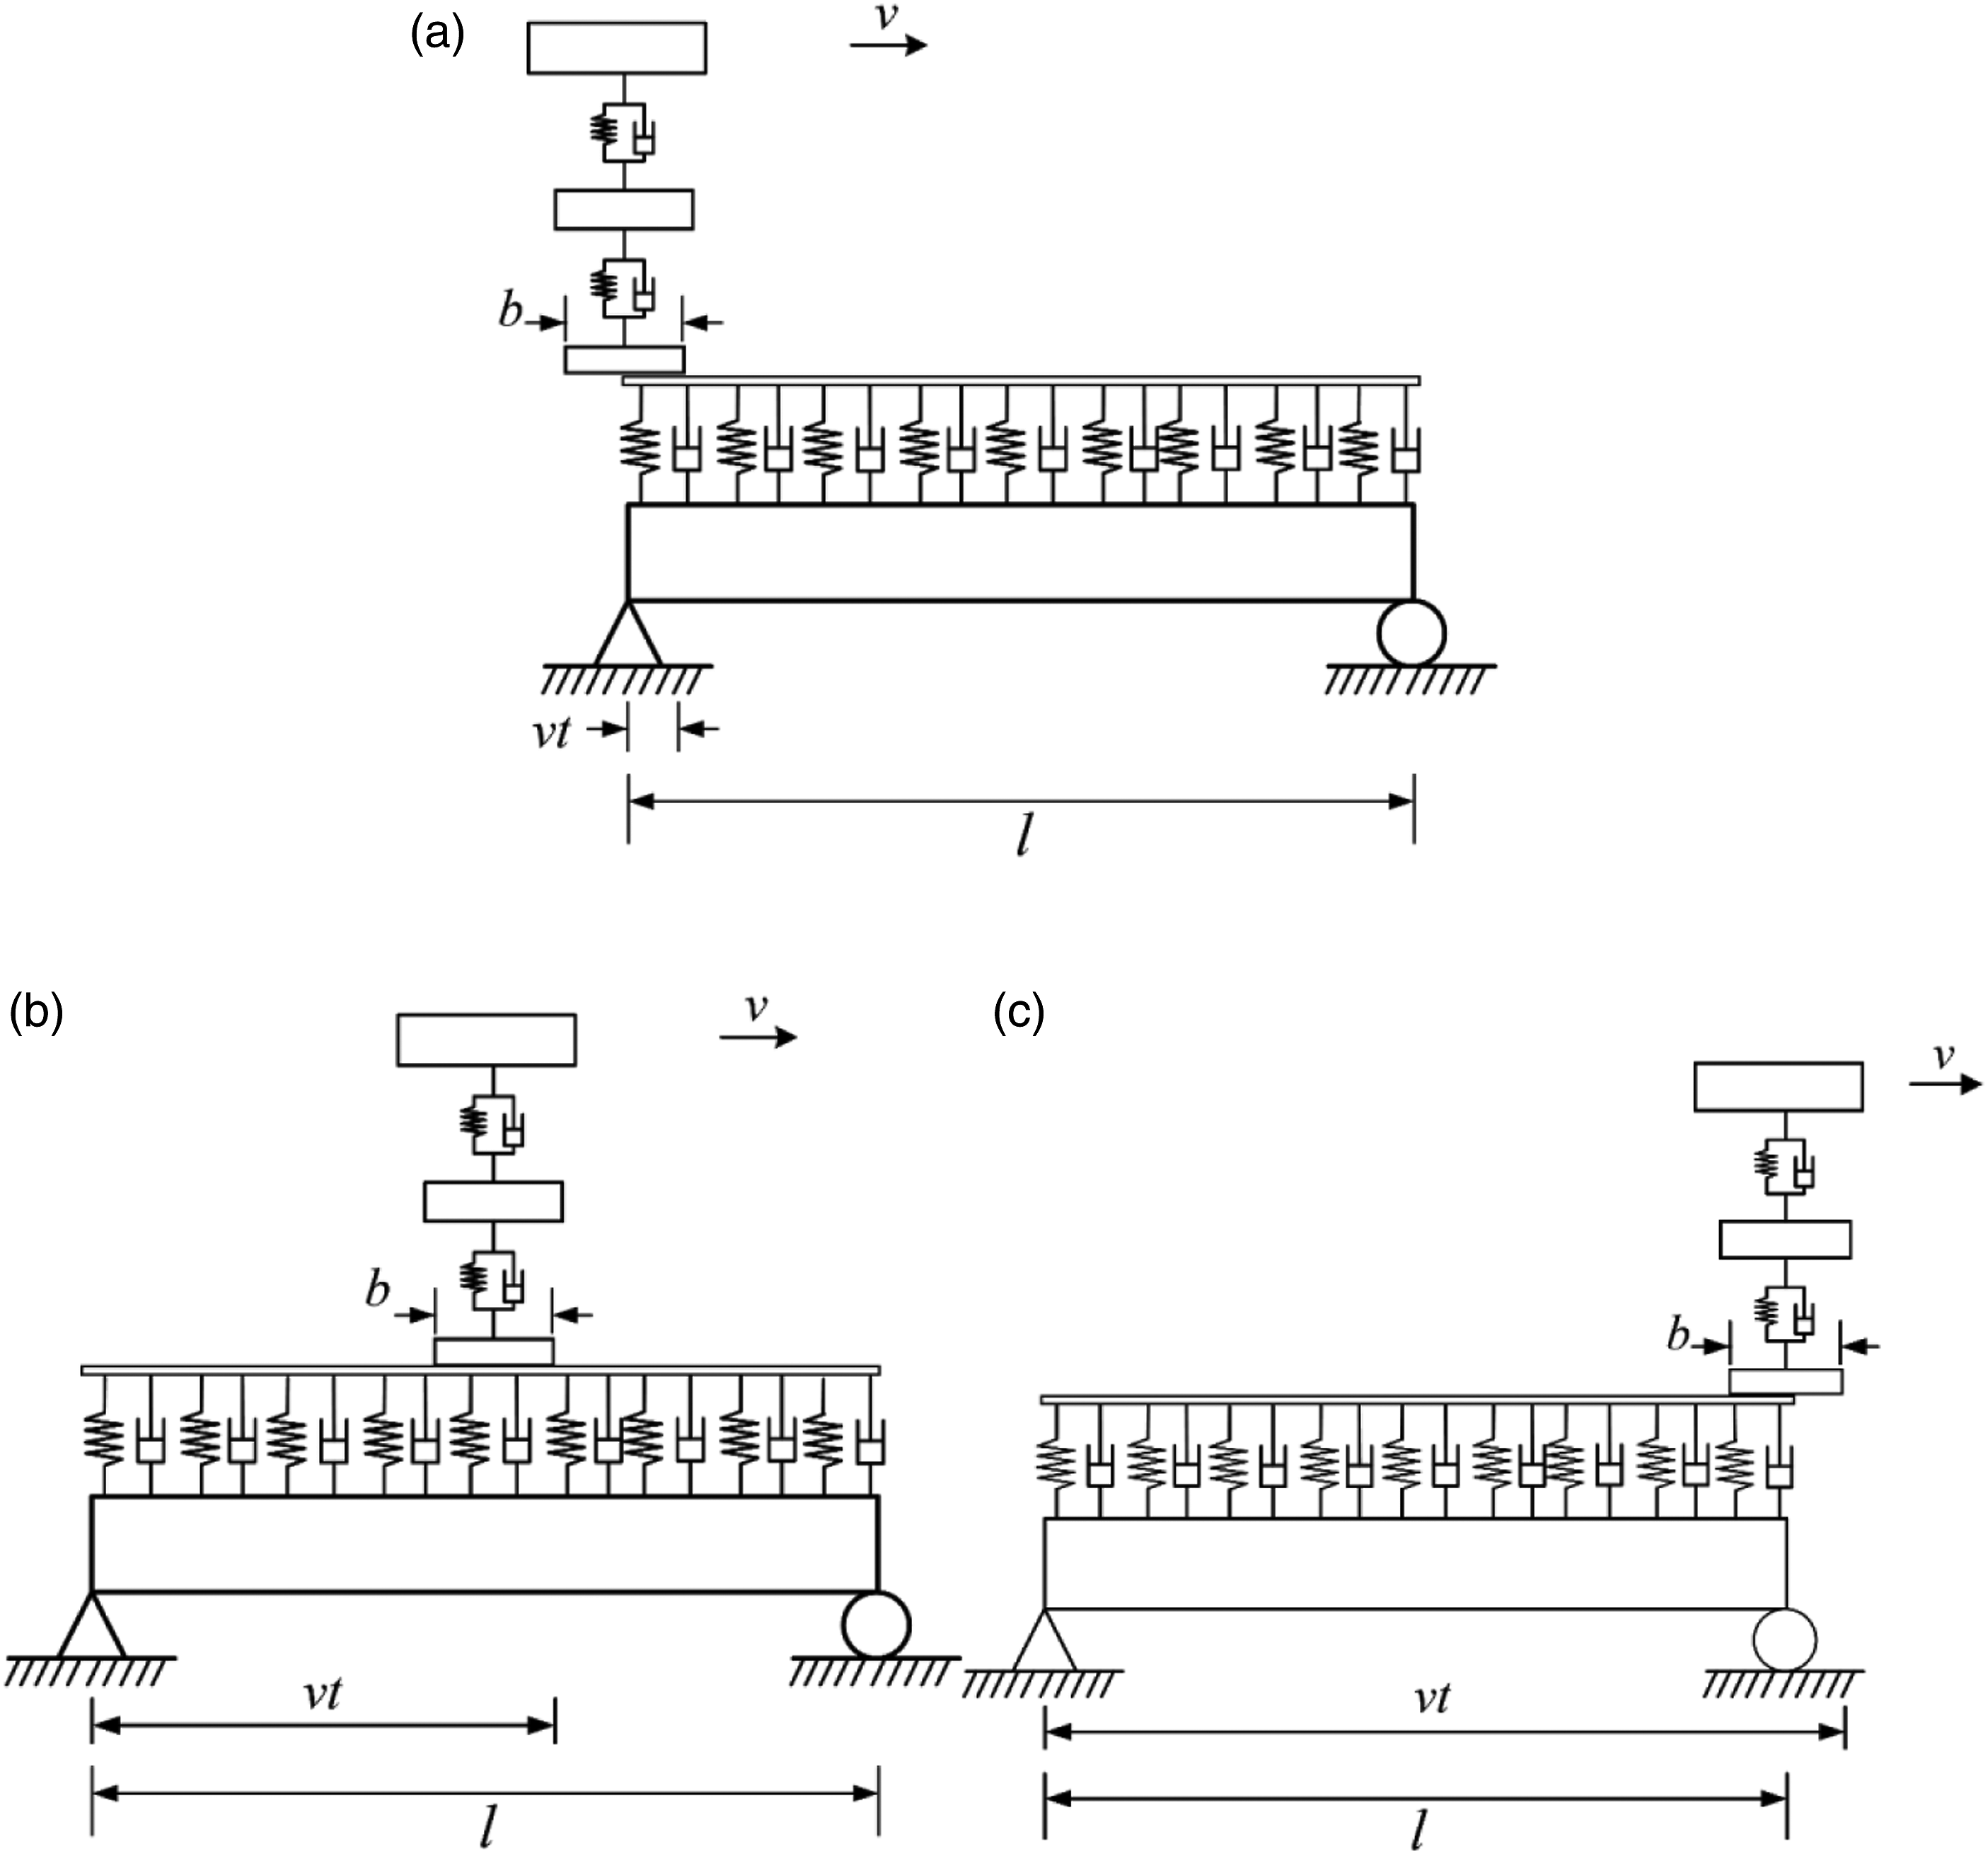
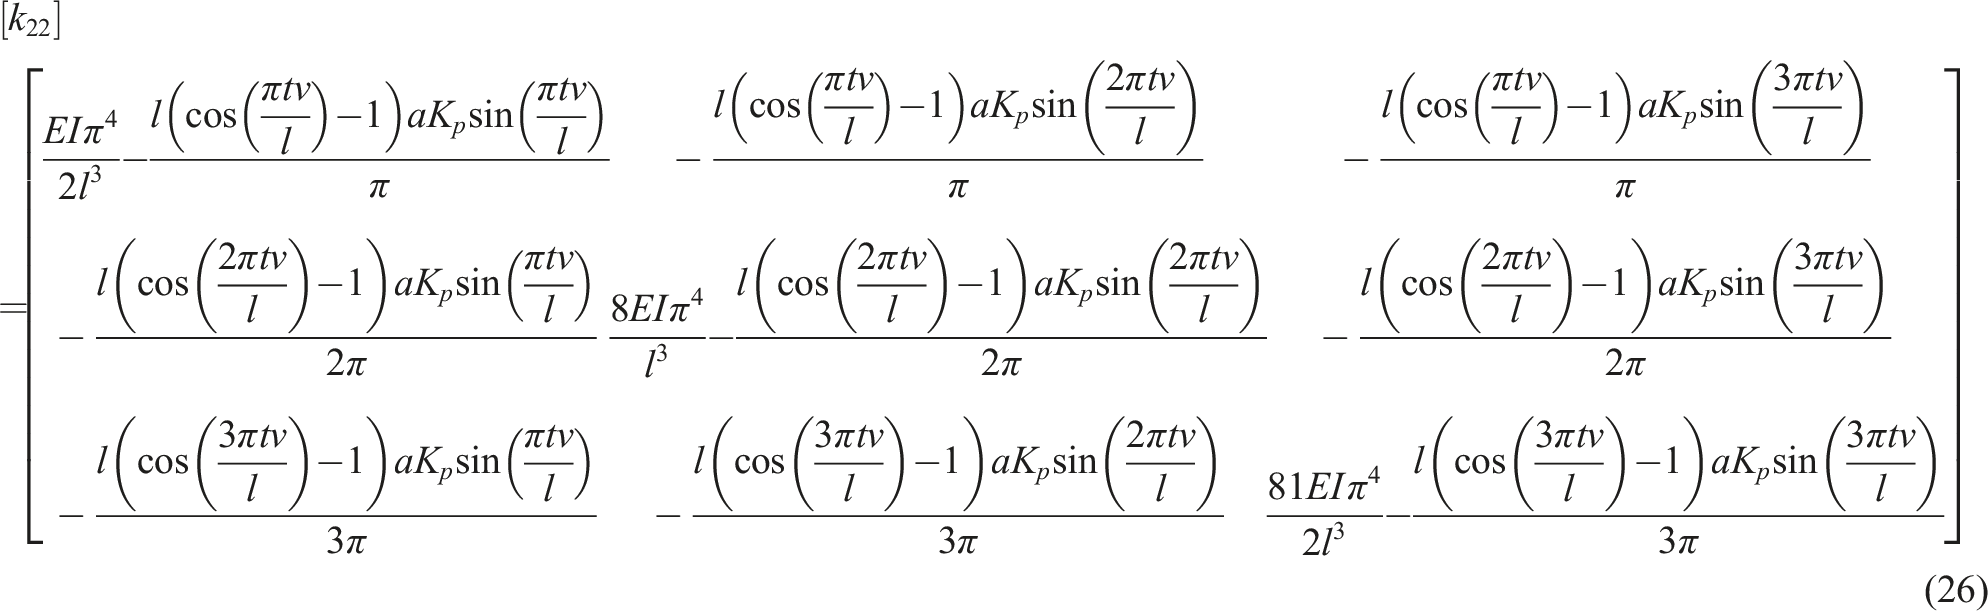
Considering the first three modes of the bridge,

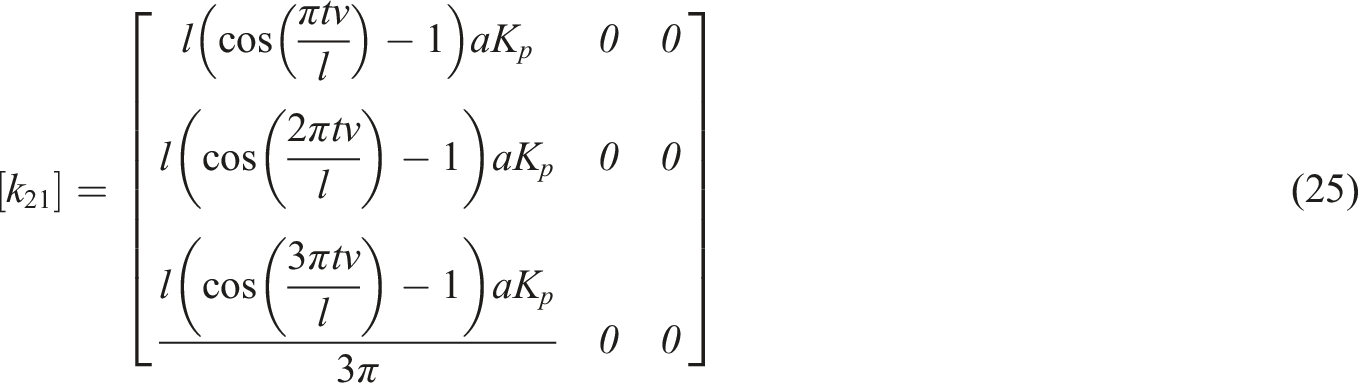
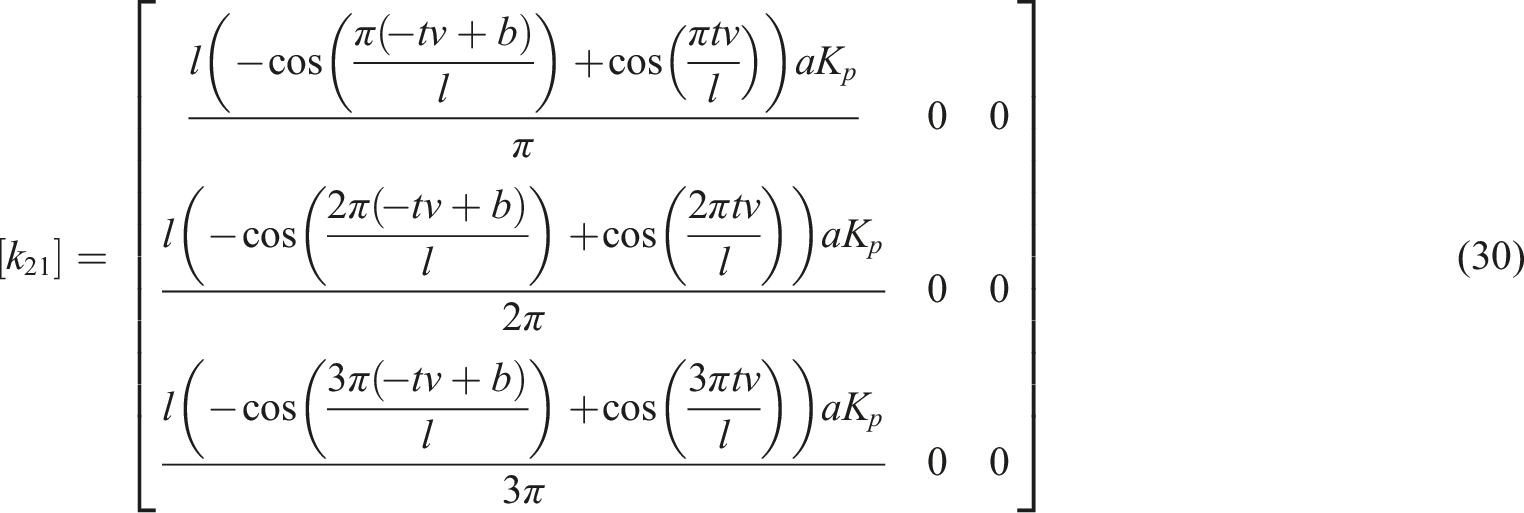
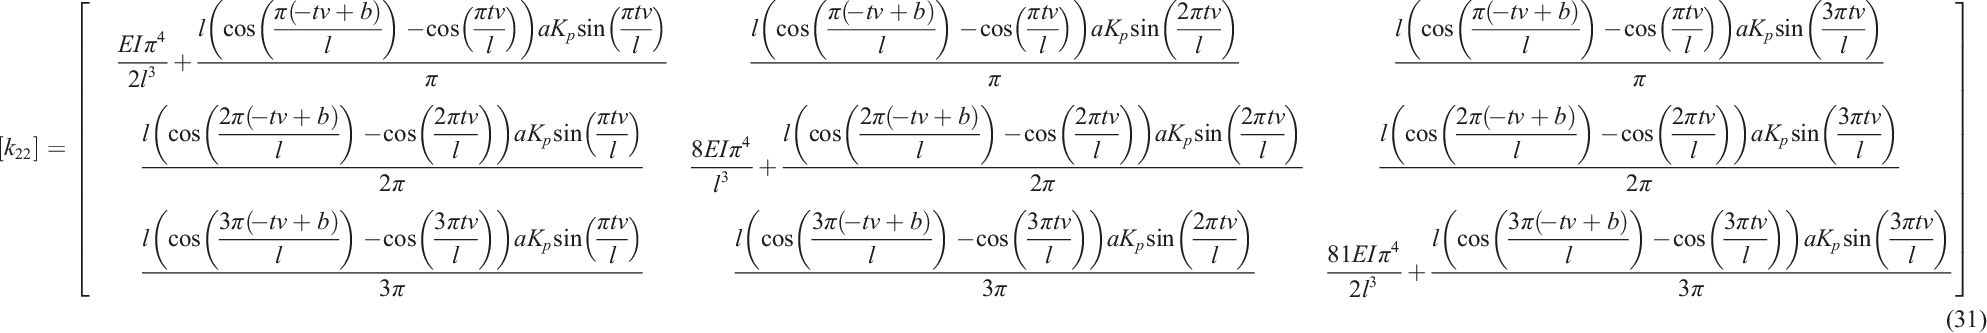
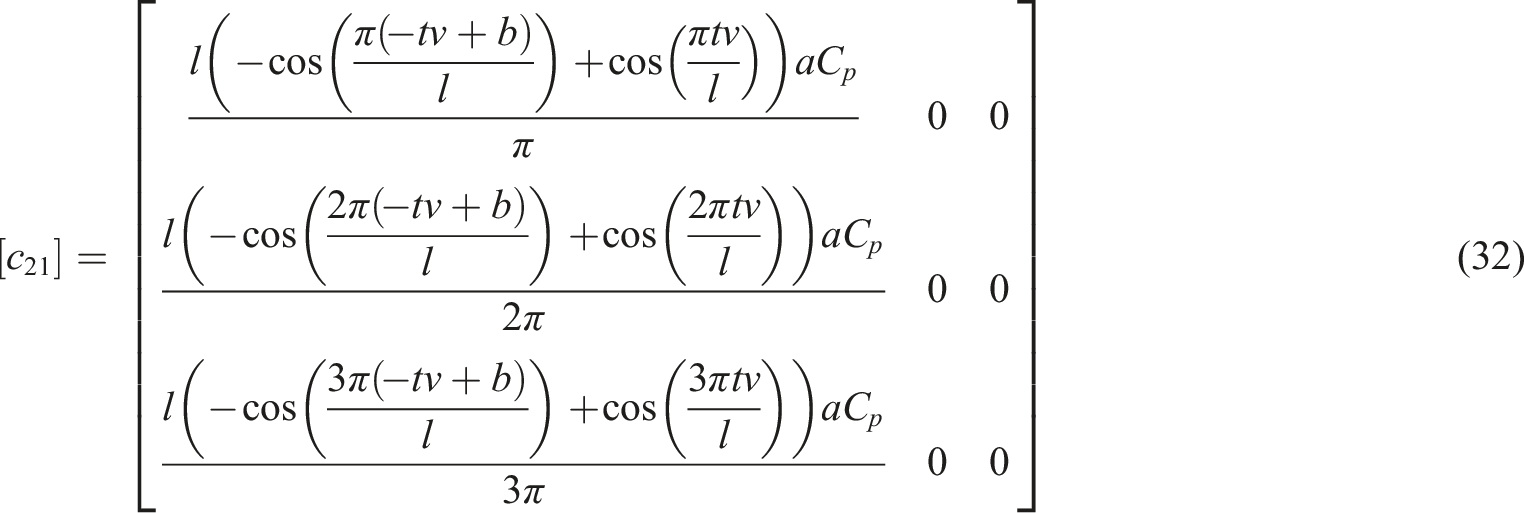
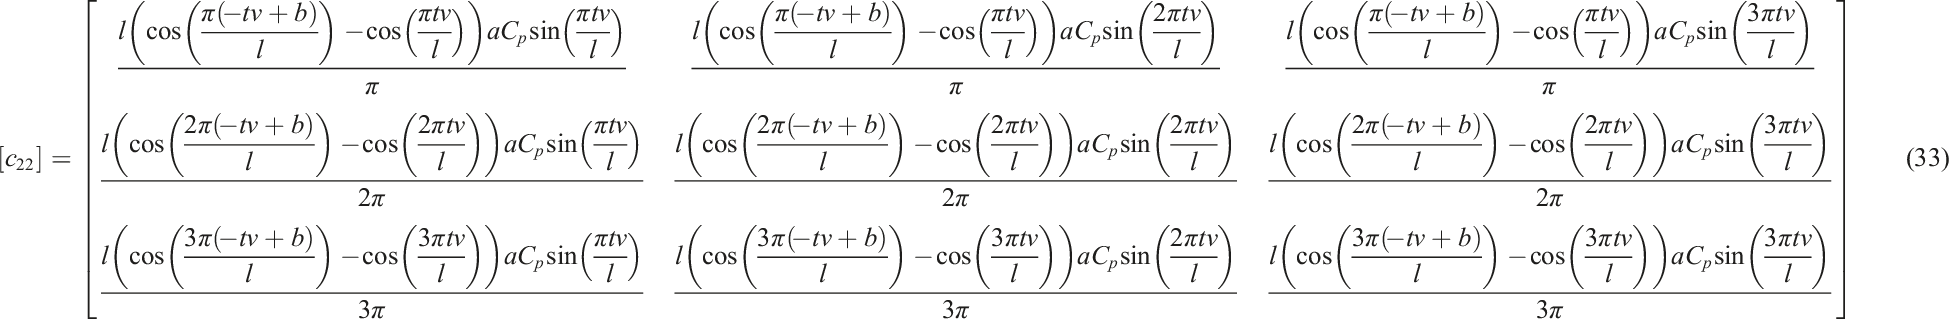
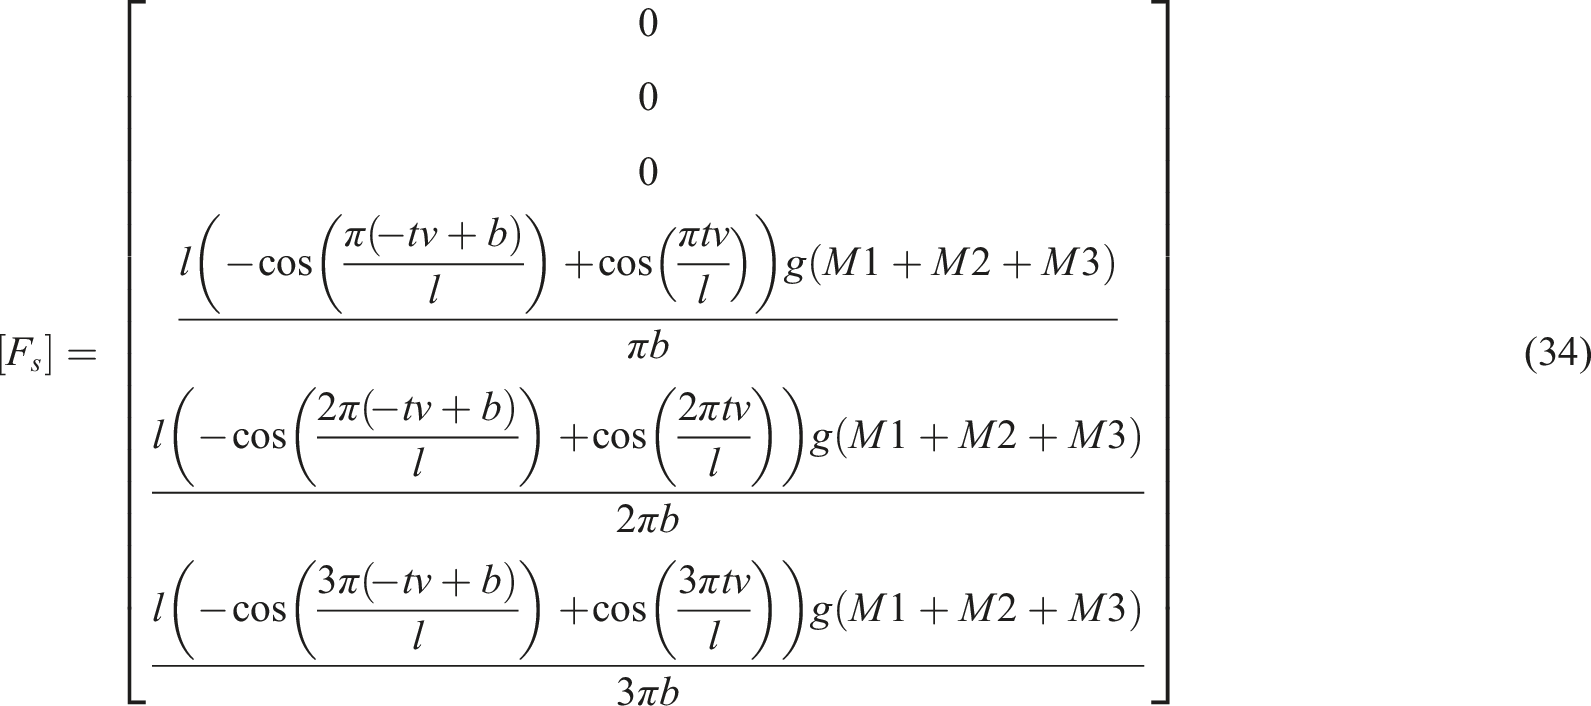
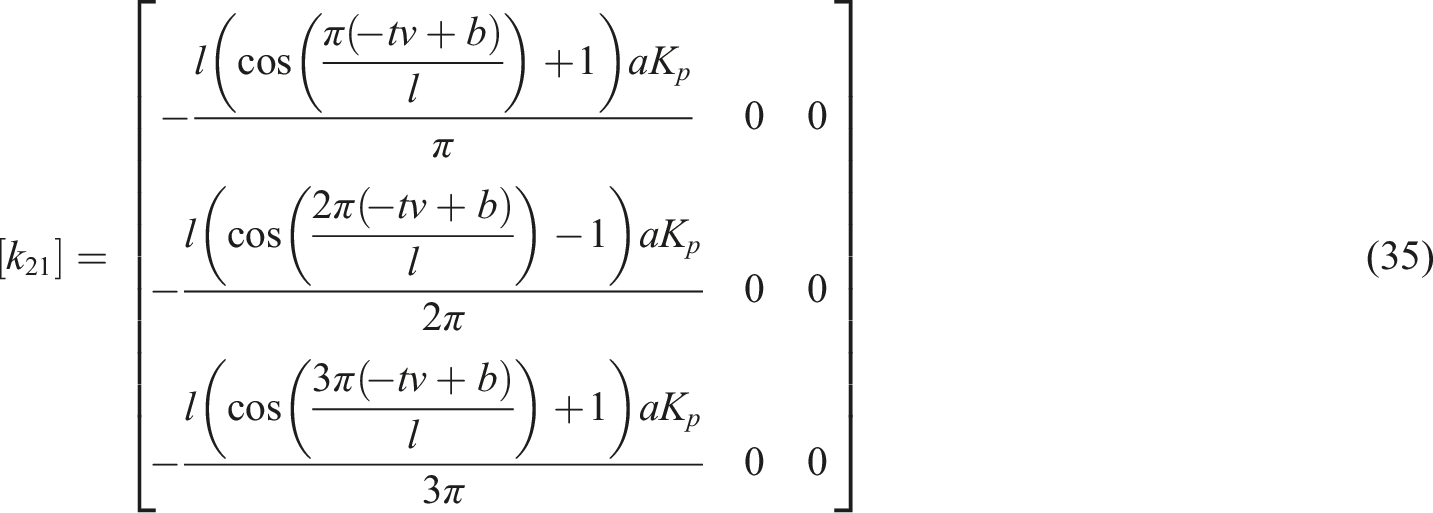
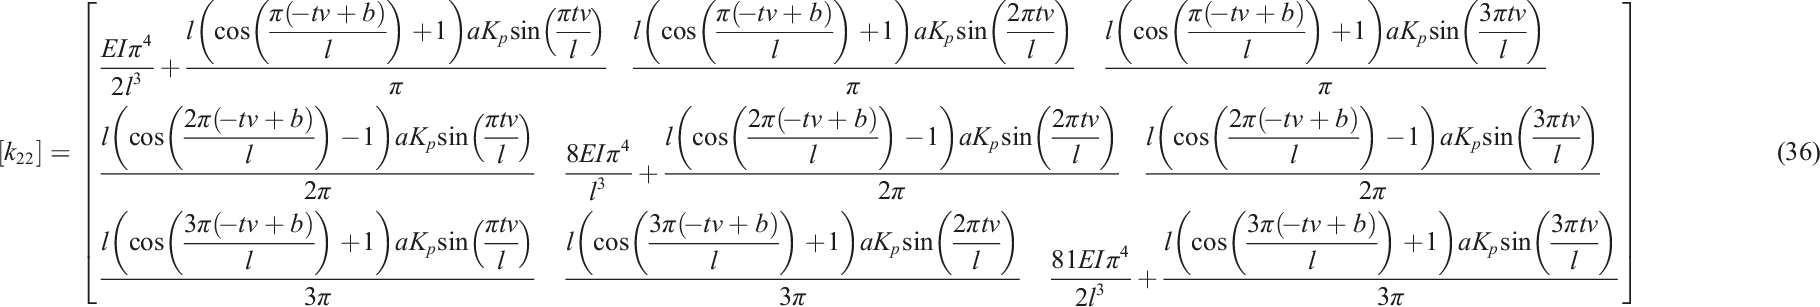
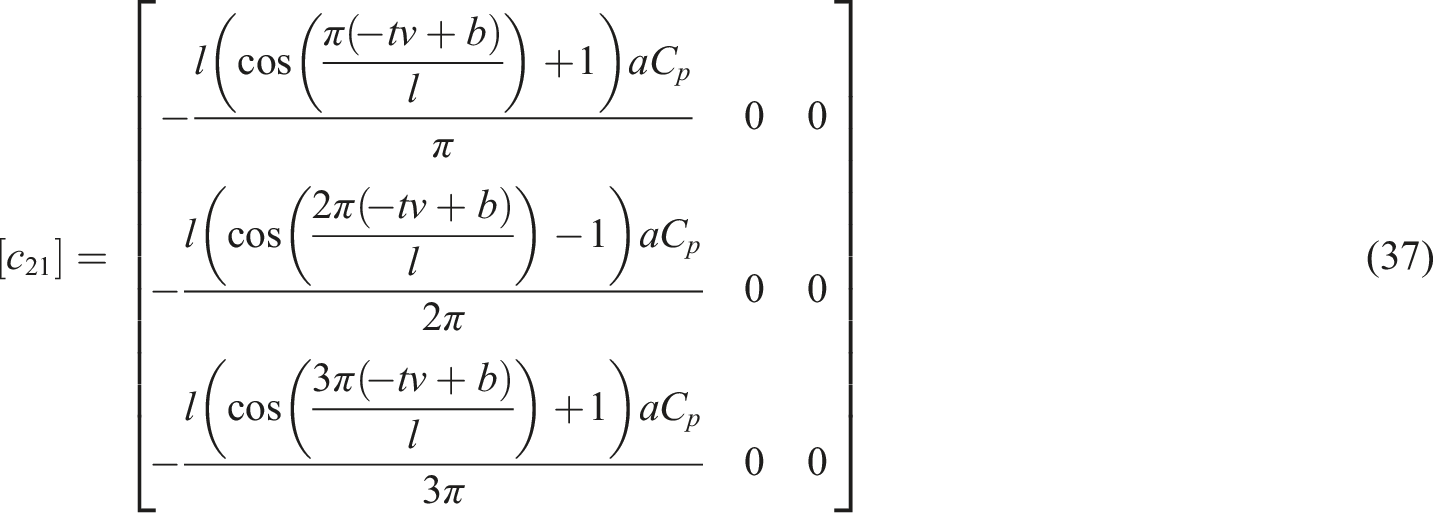
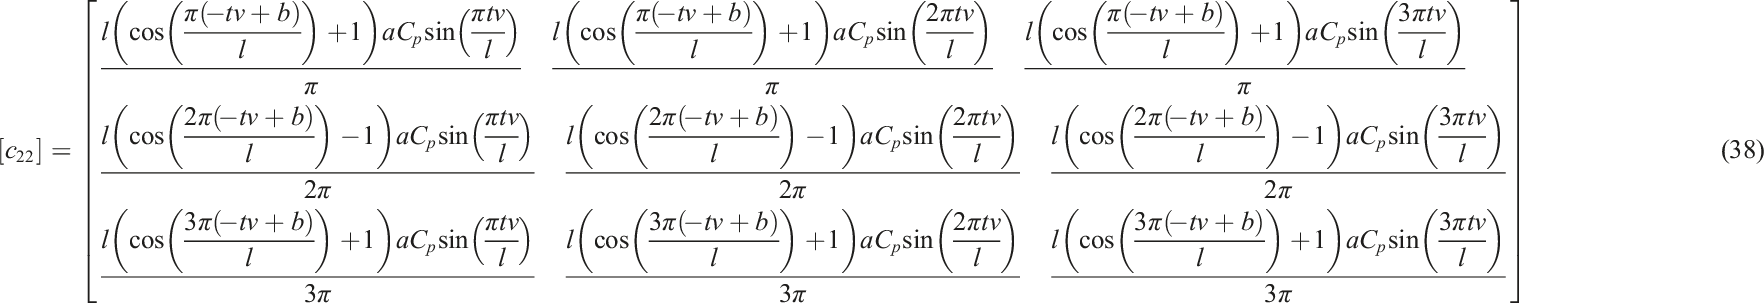
Combining the equations (5)–(7) and equation (14), the motion equation for VPBI system is derived as a matrix form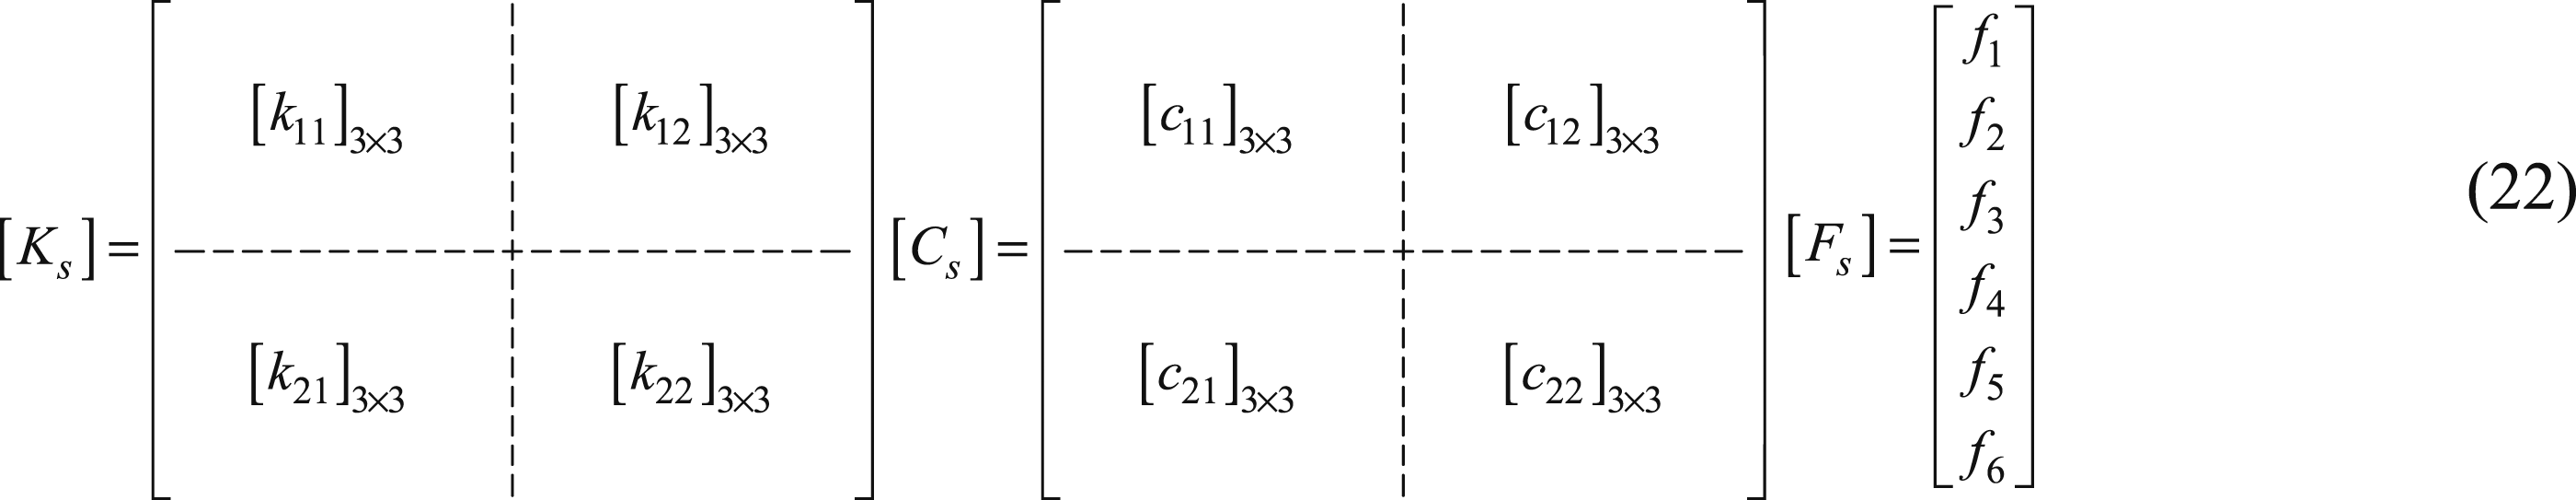
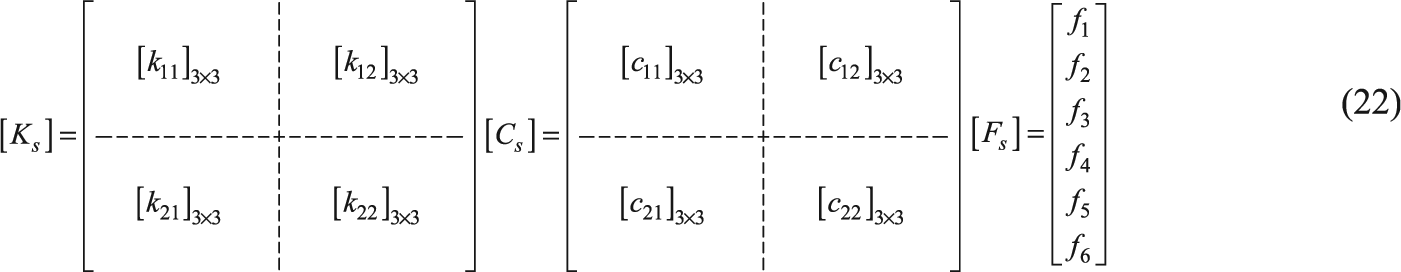


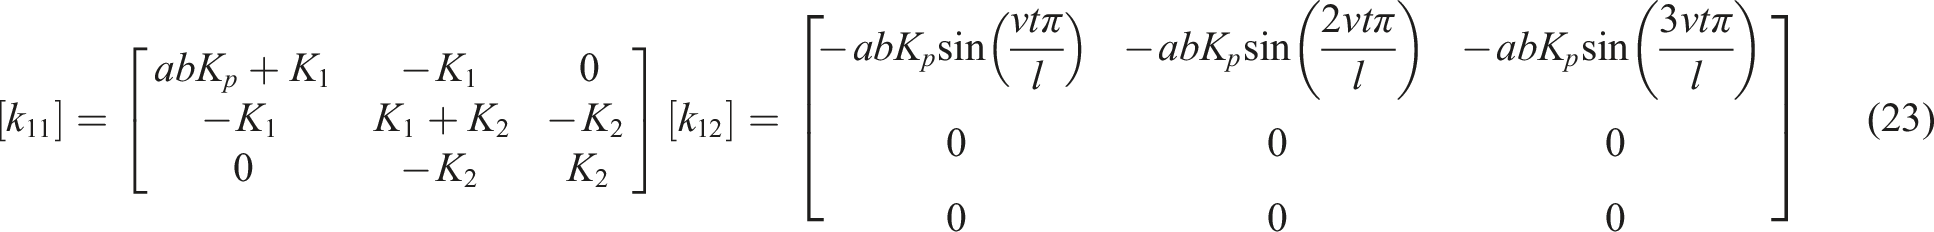
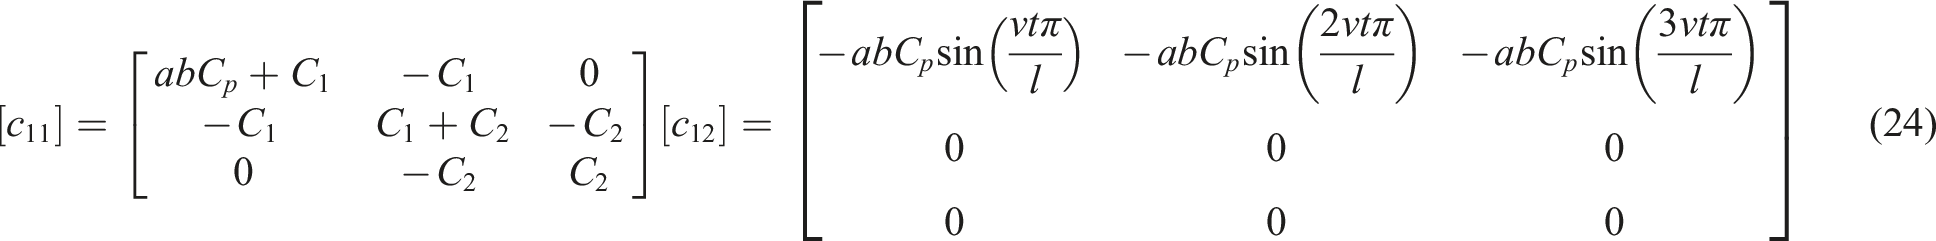
But the other submatrices vary with the location of the vehicle.
When the vehicle enters the bridge, the variable submatrices are
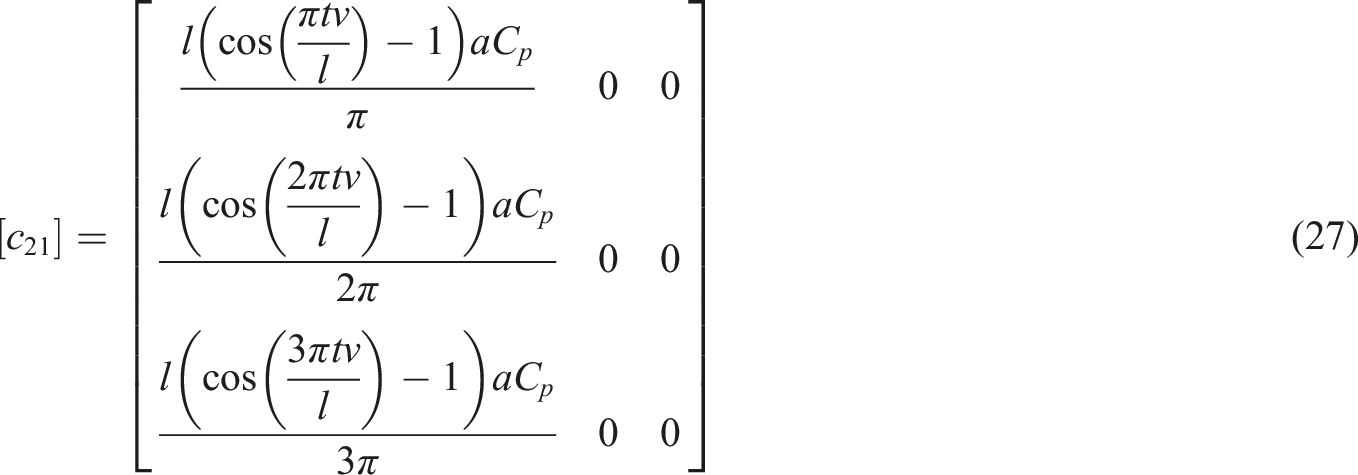
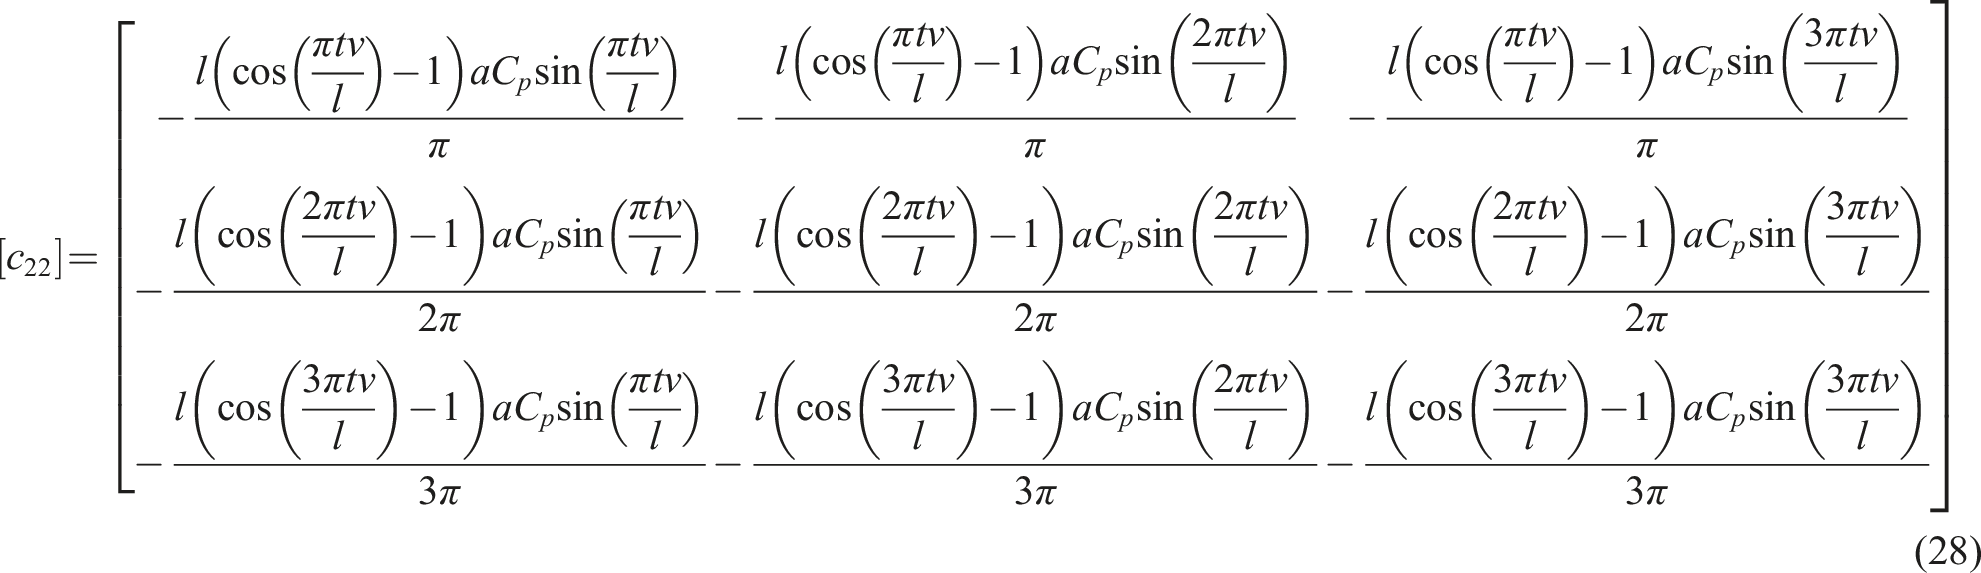
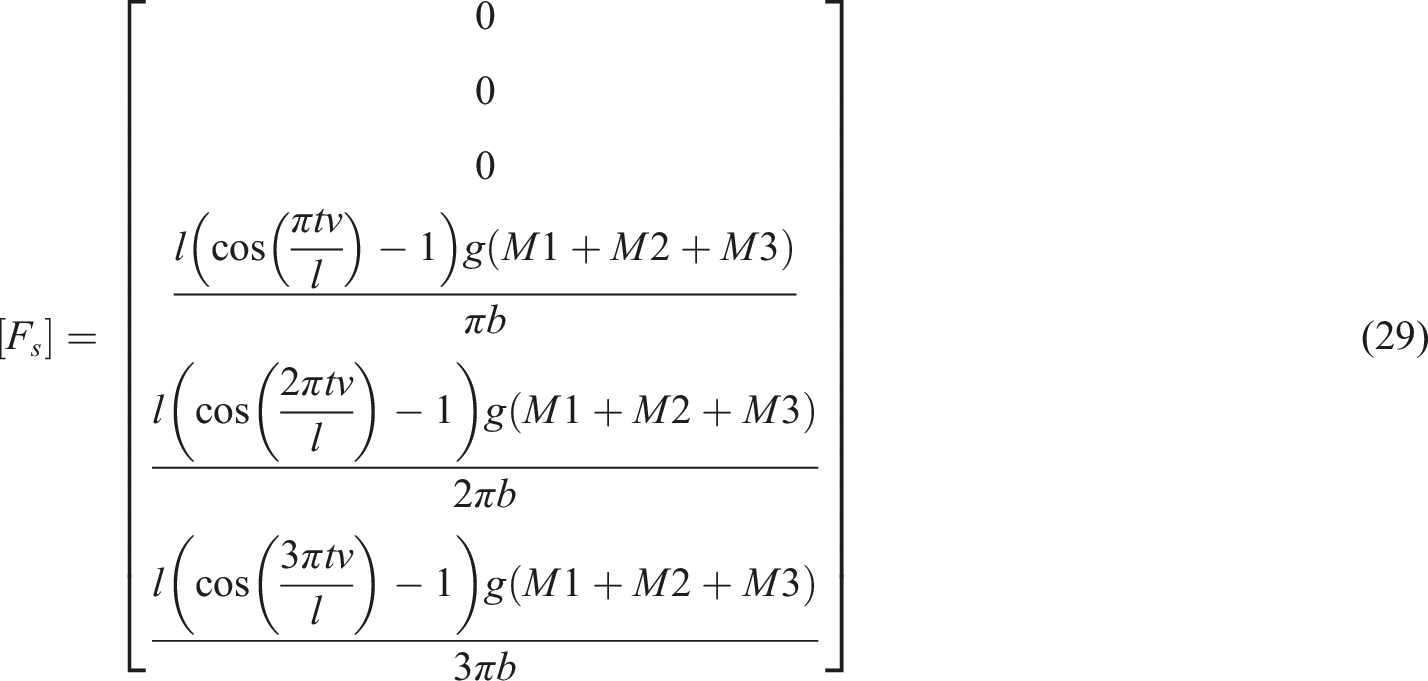
When the vehicle is on the bridge, the variable submatrices are
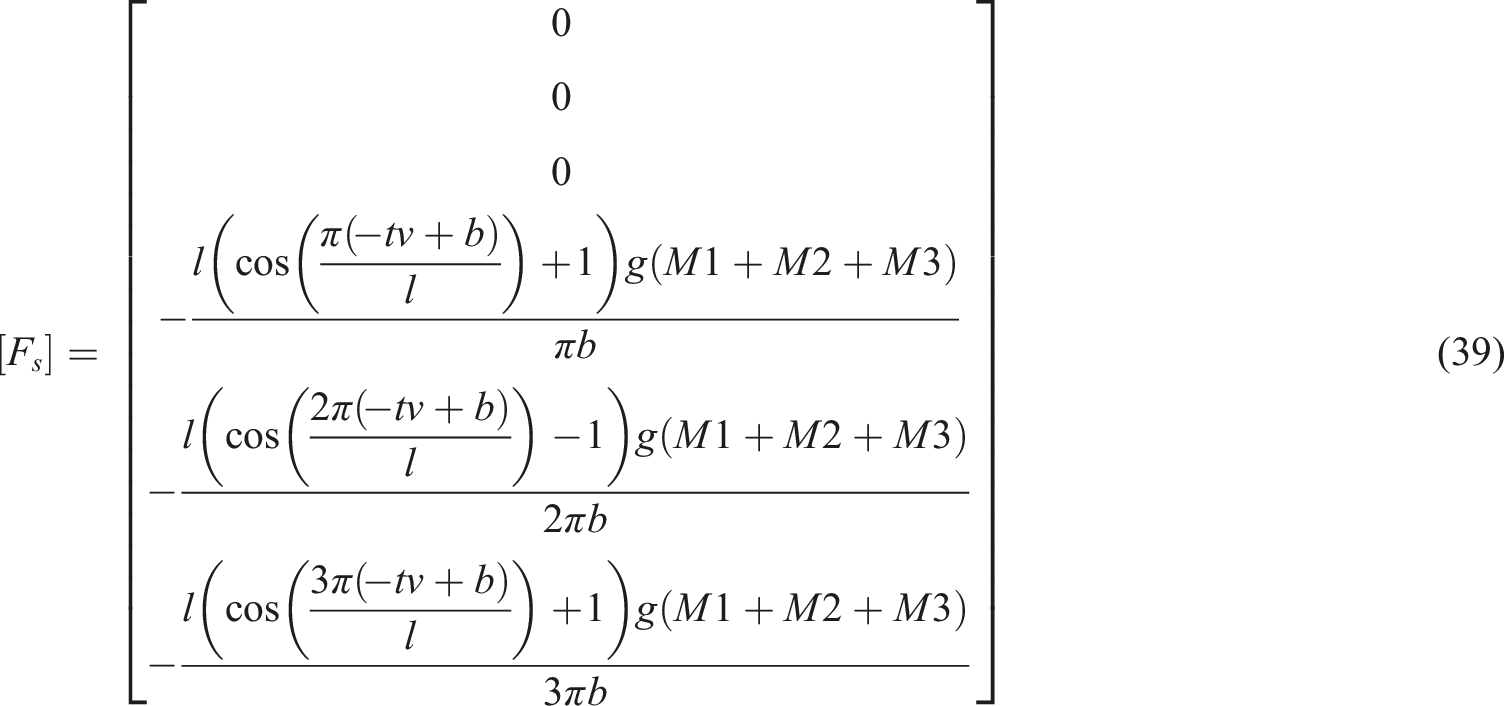
When the vehicle leaves from the bridge, the variable submatrices are
Then the VPBI system responses can be obtained by solving equation (19) with the Newmark-β method.
The equivalent stiffness coefficient and equivalent damping coefficient of the pavement
In practice, asphalt mixtures with nonlinear viscoelastic properties are usually used for the highway bridges pavement. In order to simplify the calculation, the equivalent stiffness coefficient K p and equivalent damping coefficient C p are used to replace the nonlinear viscoelastic characteristic of the asphalt mixture. In this section, K p and C p can be obtained by analytical method and FEM.
The rigid plate-asphalt mixtures pavement model
A rigid plate-asphalt mixture pavement (RPAP) model is established and shown in Figure 3. The spring-dampers which simulate the asphalt mixture pavement are uniformly distributed under the rigid plate. The rigidity of the rigid plate is much greater than that of the asphalt mixture pavement. And the rigid plate width, length, and thickness are a, b, and h, respectively. P is the concentrated excitation force acting on the center of upper surface of the rigid plate. The RPAP model.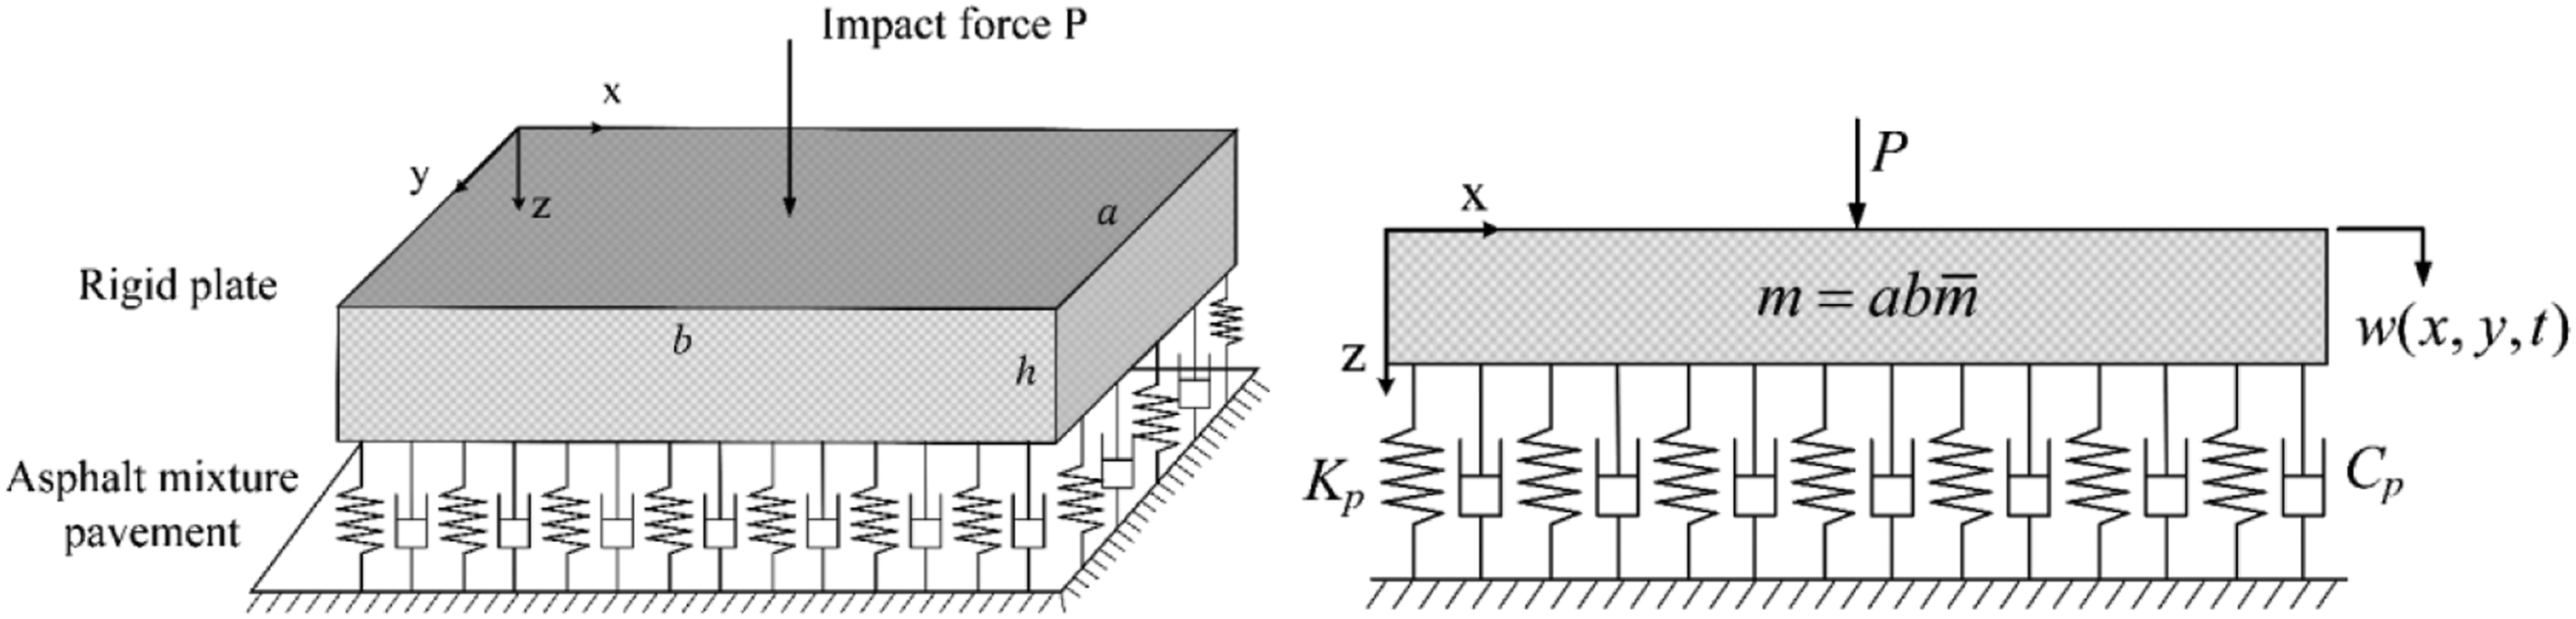
Derivation of the formulas for K p and C p
Similar to the energy-based method to identify the parameter of Pasternak foundation,
19
the Lagrange equation is applied to the RPAP model. The kinetic energy, potential energy, and the dissipation function are expressed as follows


Based on the assumption that the rigid plate cannot deform, the deflection of the rigid plate is only related to time


Substituting equations (43)–(45) into the Lagrange equation, the motion equation of RPAP model can be given as

Further, the natural frequency


When the concentrated excitation force is an impact load, the motion of the RPAP system is a damped free vibration. In underdamped case, the frequency of the RPAP model is

In theory of vibration, the logarithmic decrement δ is expressed as

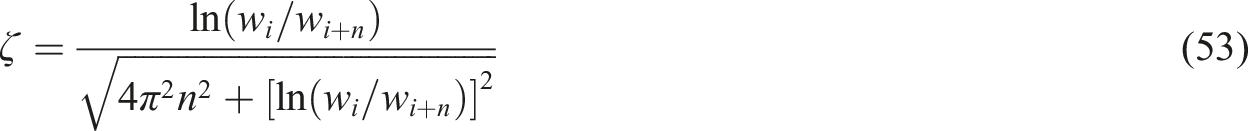
Considering equations (50) and (51), the natural frequency ωn and the damping ratio ζ can be written as follows

From equations (48) and (49) and equations (52) and (53), the equivalent stiffness coefficient Kp and the equivalent damping coefficient Cp can be obtained


Simulation for the RPAP model
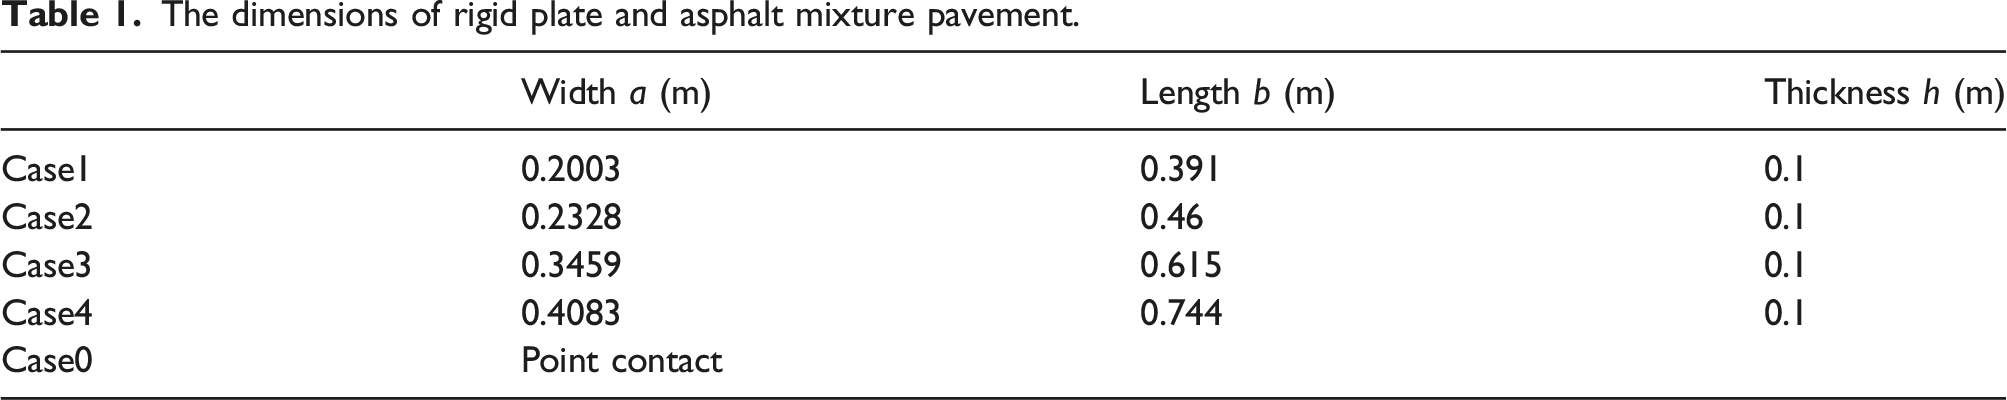
In this section, the FEM of RPAP model is established by ANSYS software, as shown in Figure 4. The rigid plate and the asphalt mixture pavement are simulated using SOLID185. Lateral displacement of the asphalt mixture pavement is constrained and only vertical displacement is considered. The RPAP model dimensions13,20 are shown in Table 1. The four cases from one to four correspond to four type of contact area of tires
20
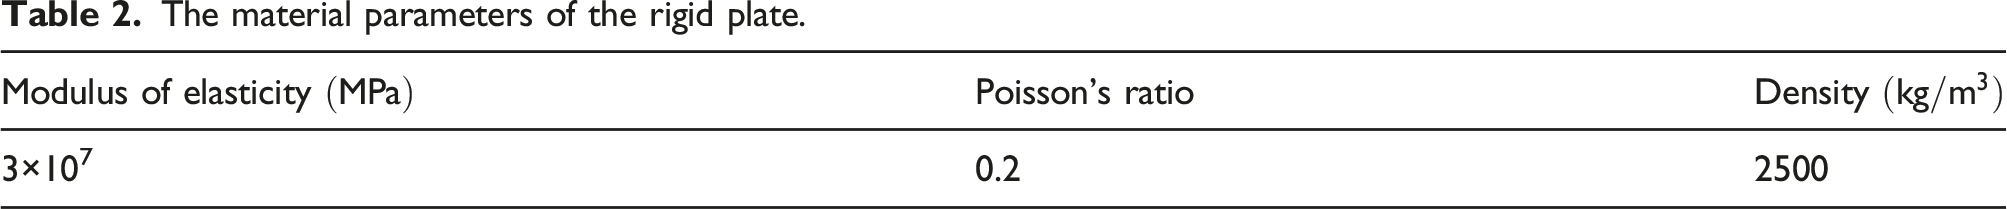
and Case0 is point contact acted as a control. The material parameters of the rigid plate
19
are shown in Table 2. The finite element model of the RPAP model. The dimensions of rigid plate and asphalt mixture pavement. The material parameters of the rigid plate.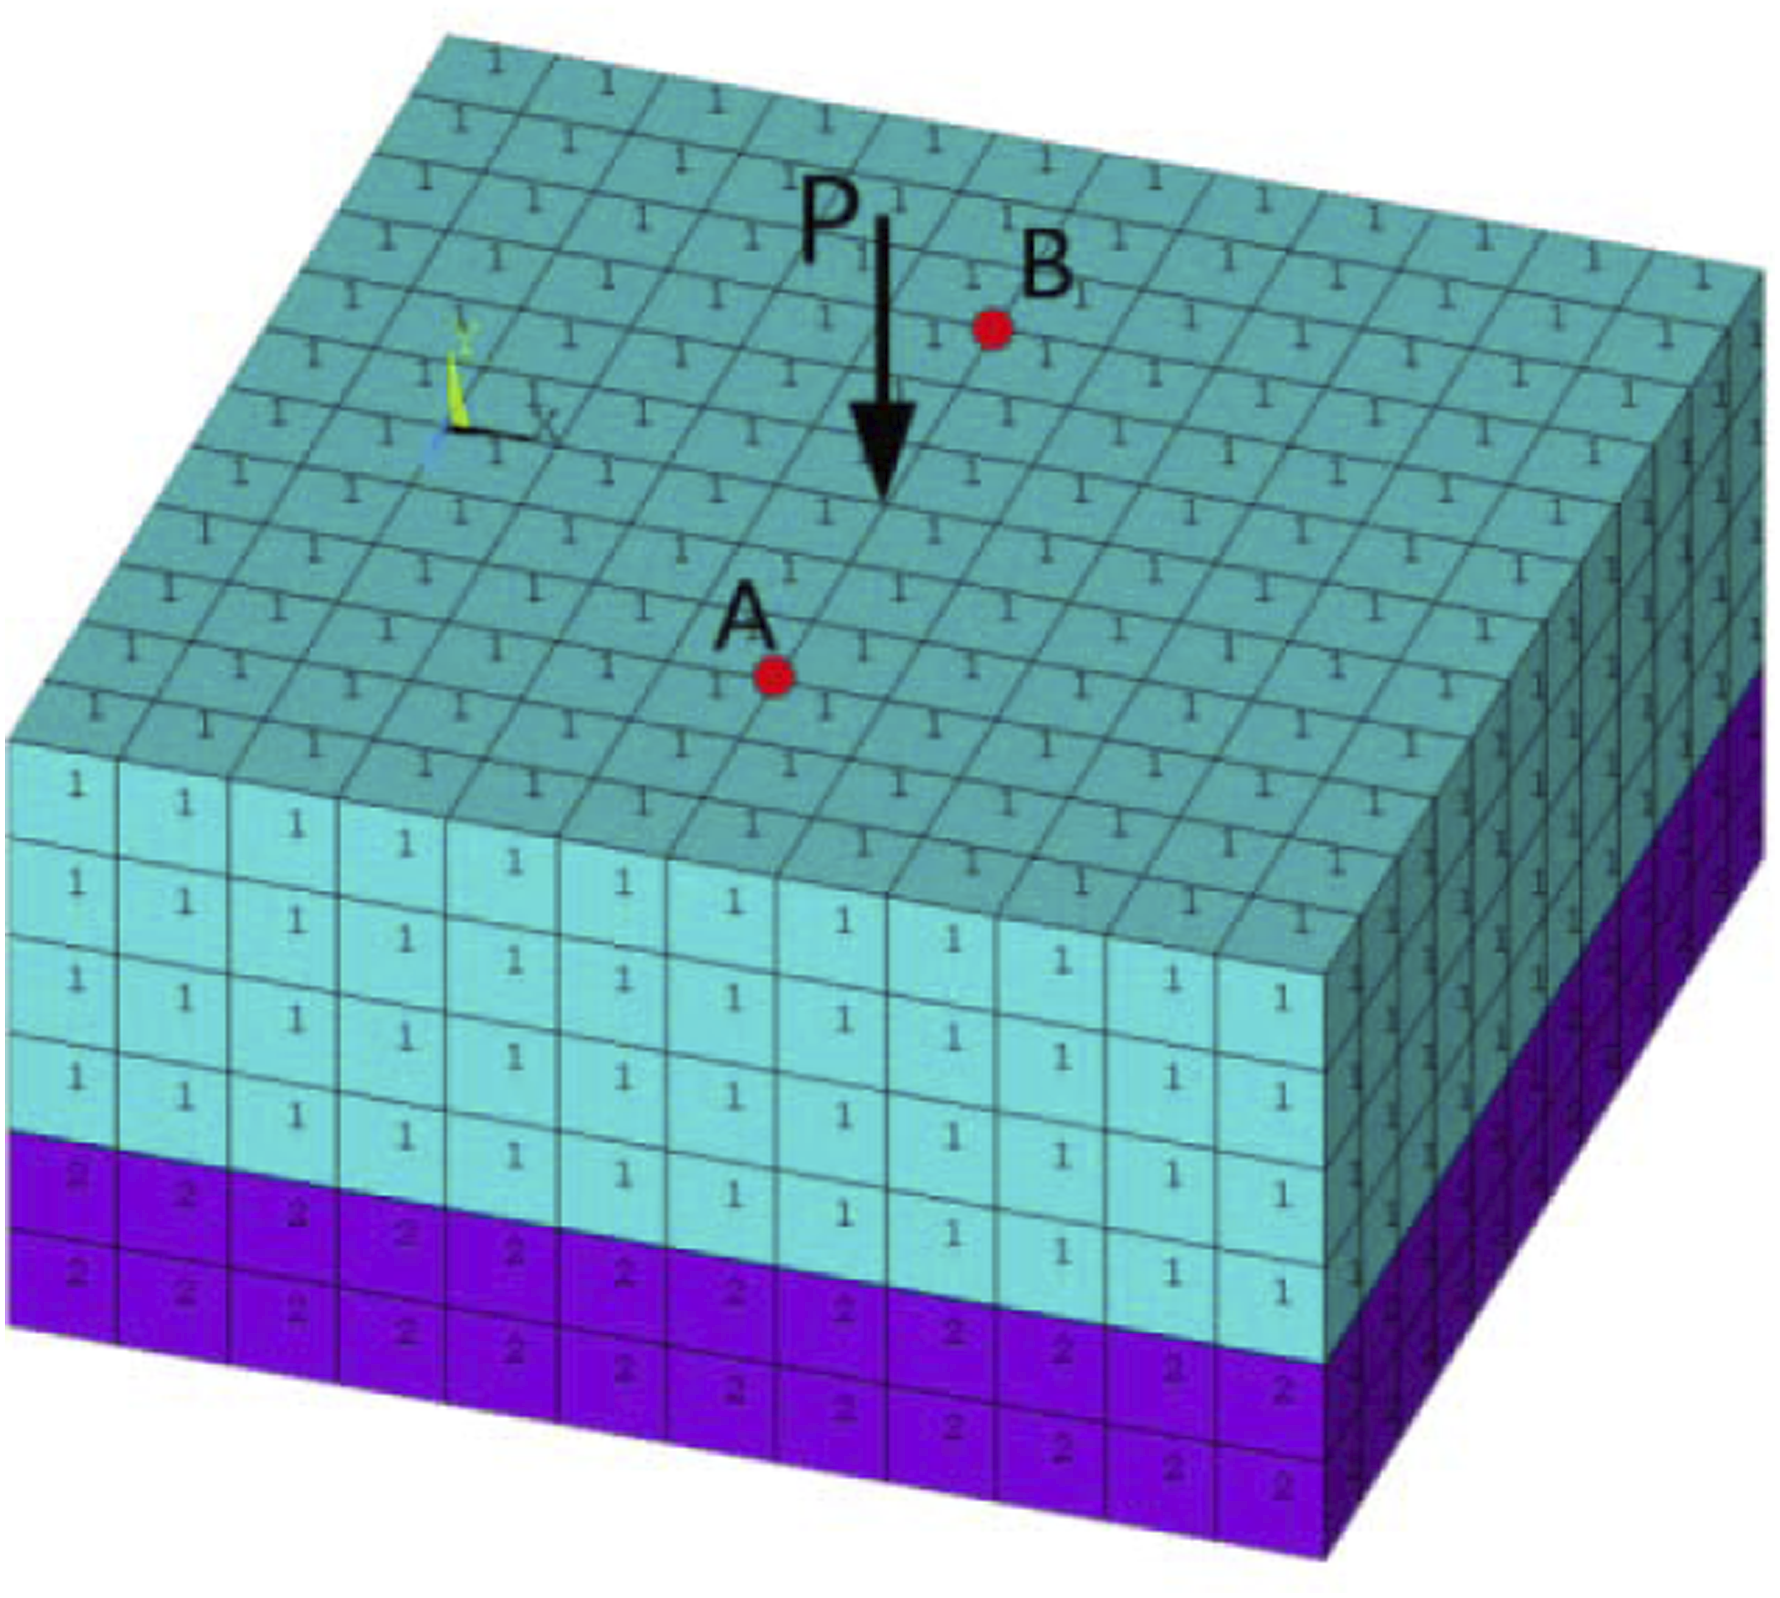
Based on the small strain theory, the constitutive equation of isotropic viscoelastic asphalt mixture pavement is
21

Prony series can be expressed by the following formula
21

α∞ can be calculated when t is zero. equation (57) can be written as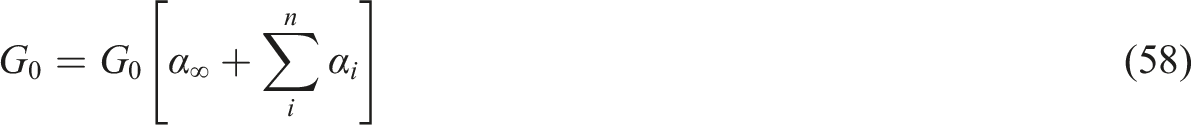
Then

Therefore, the equation (57) for Prony series can be determined if the parameters G∞, Gi and
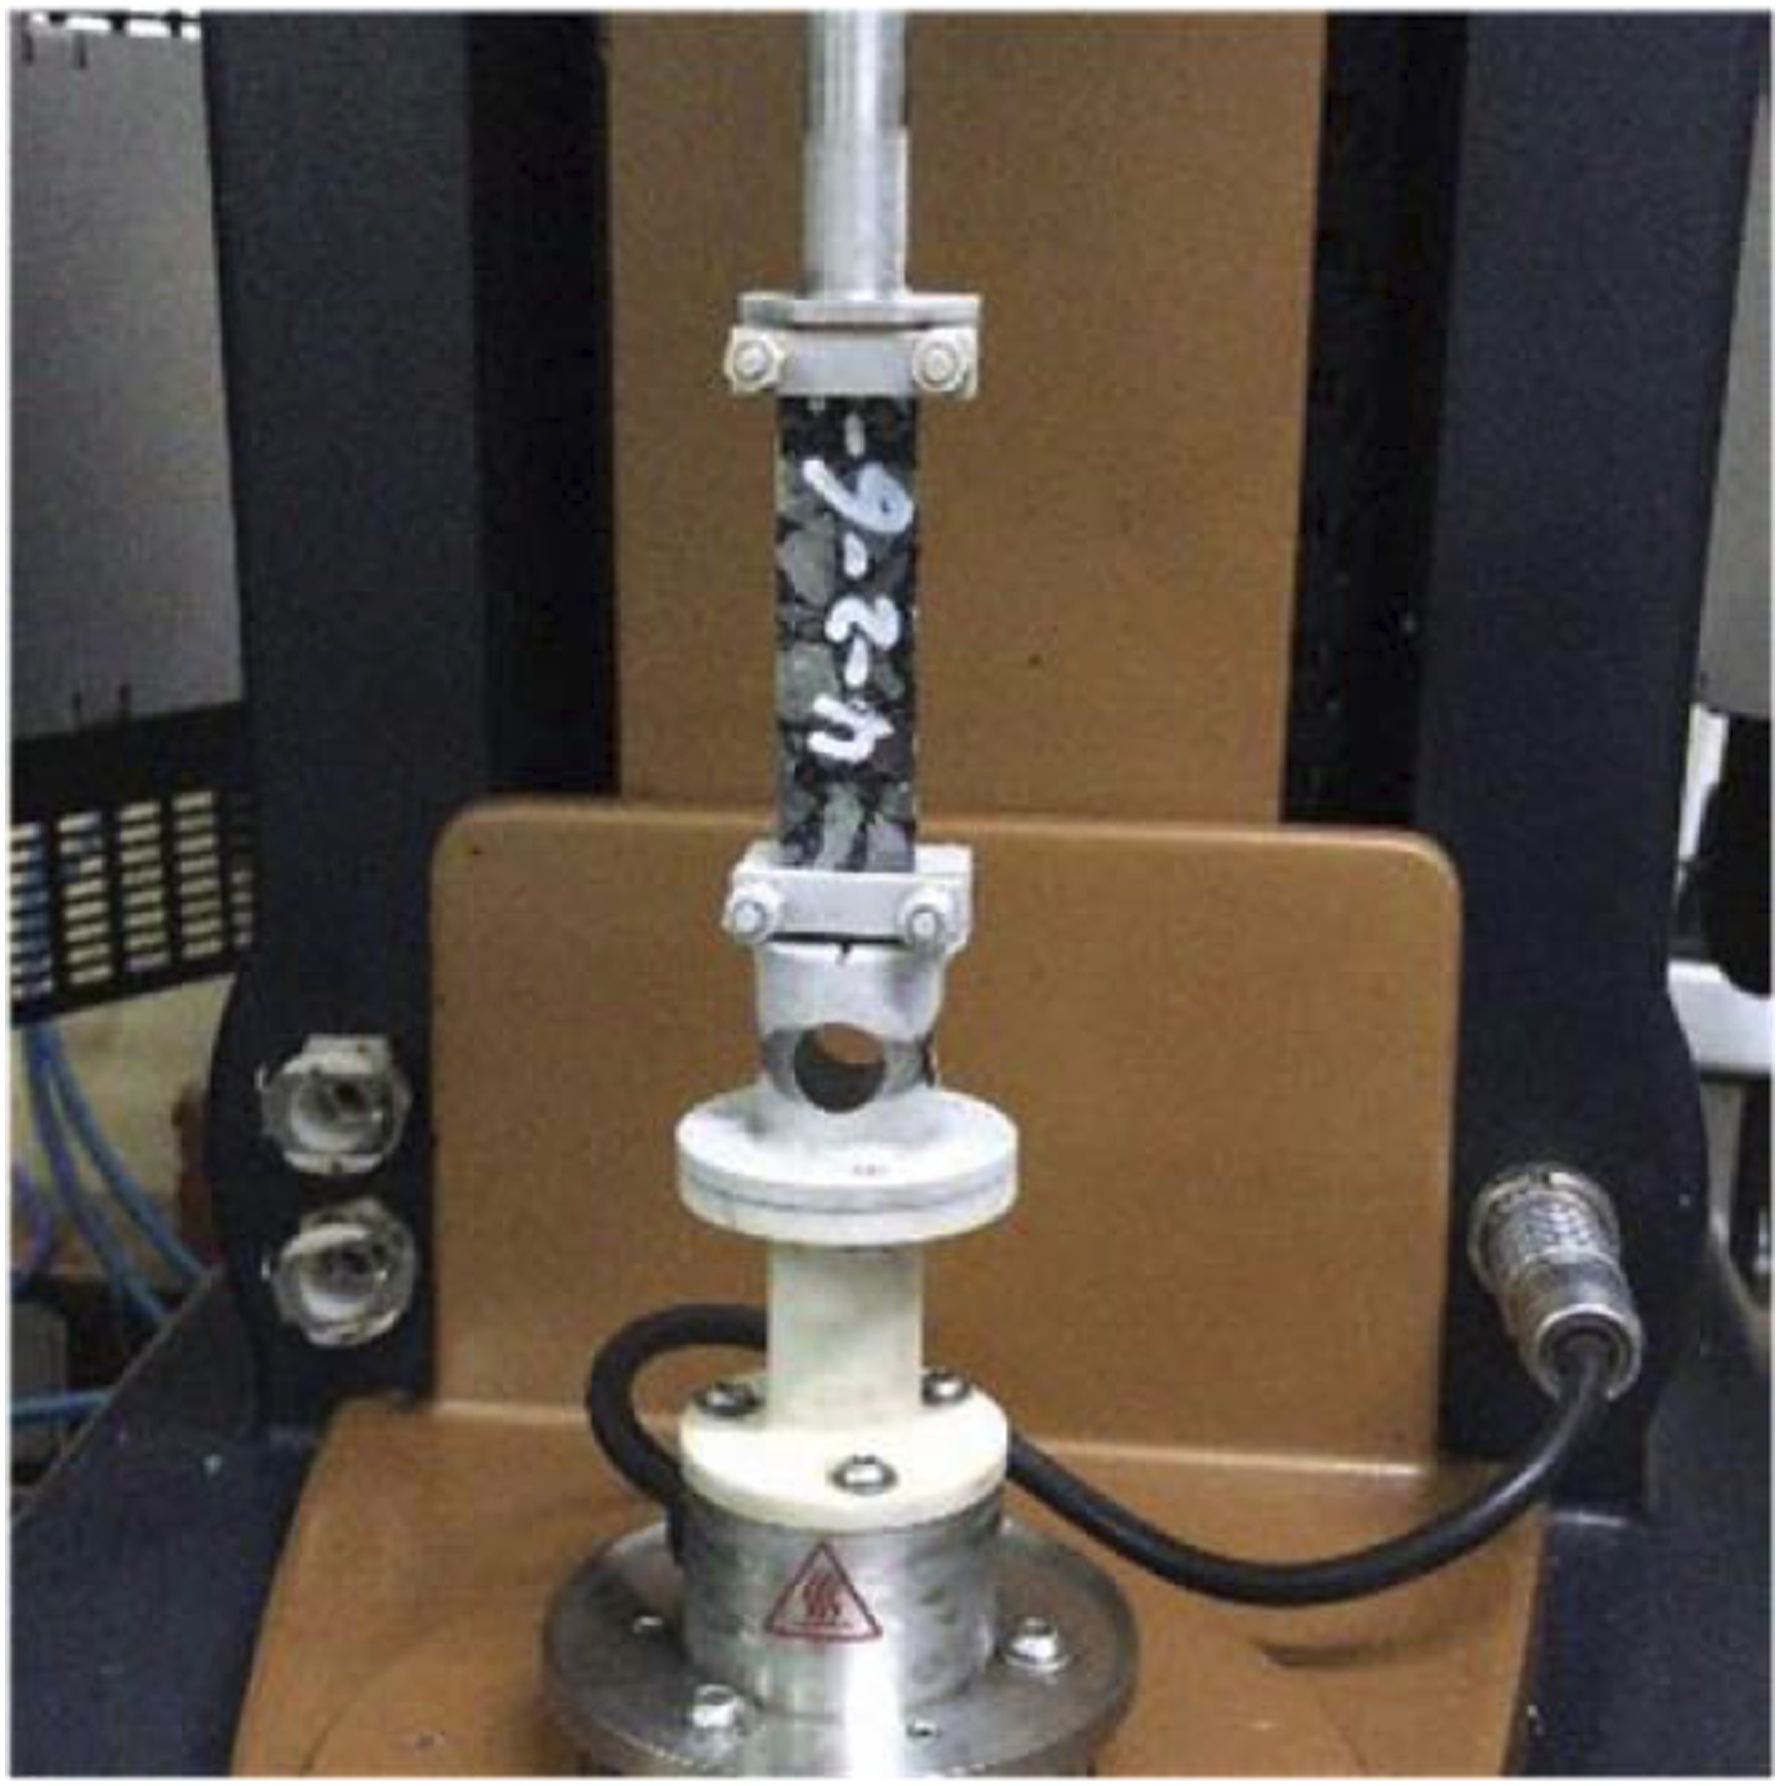
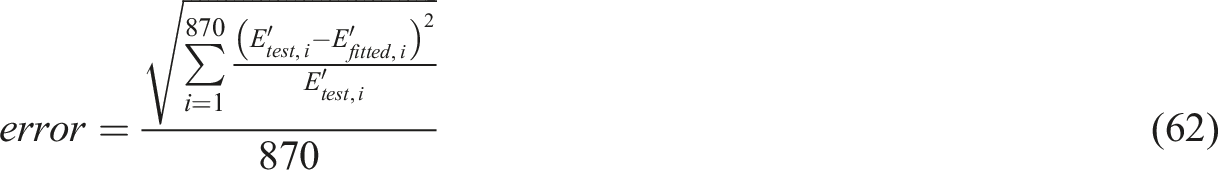
In this paper, the DMA test is implemented to determine material property of the asphalt mixture as shown in Figure 5. Under the reference temperature 20°C, the storage modulus is obtained at each frequency. And the tested data of storage modulus can be fitted by the formula as follows
22
The DMA test.
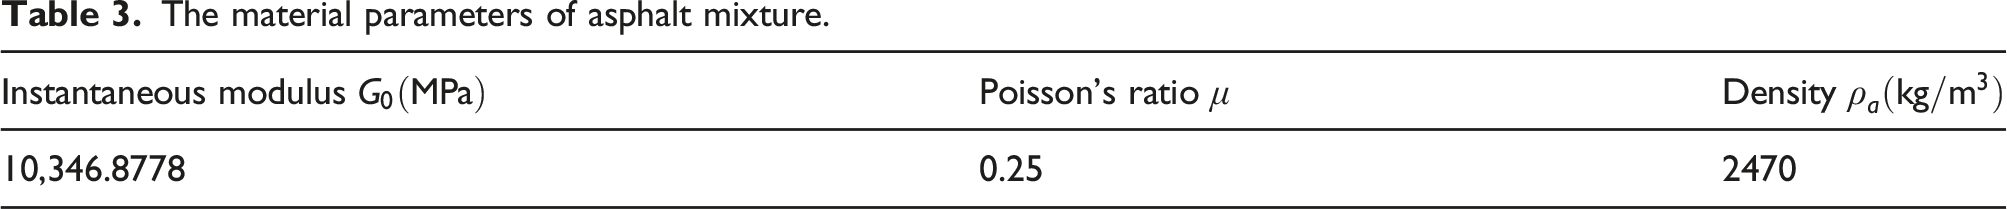
The material parameters of asphalt mixture.
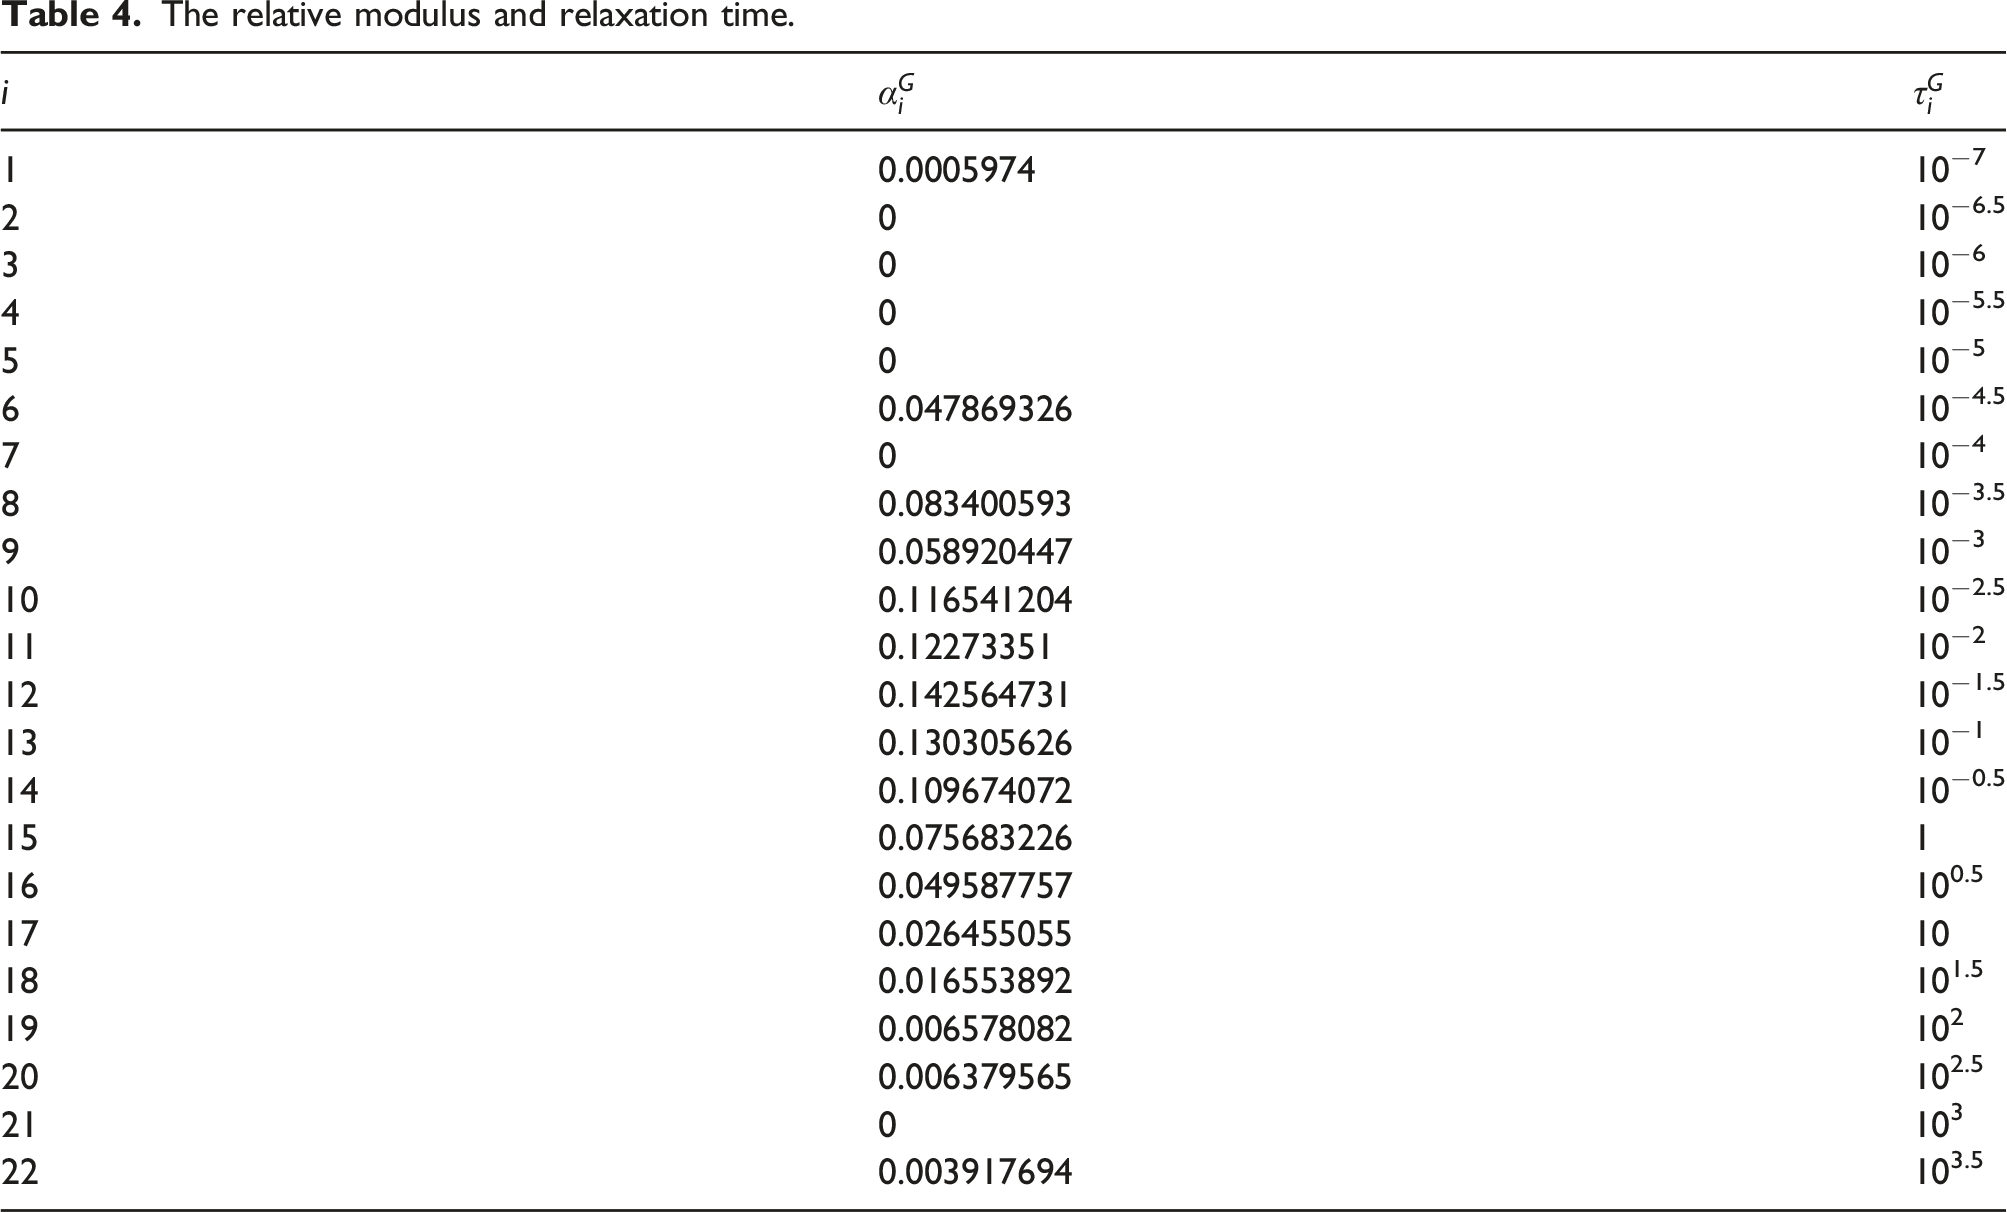
The relative modulus and relaxation time.
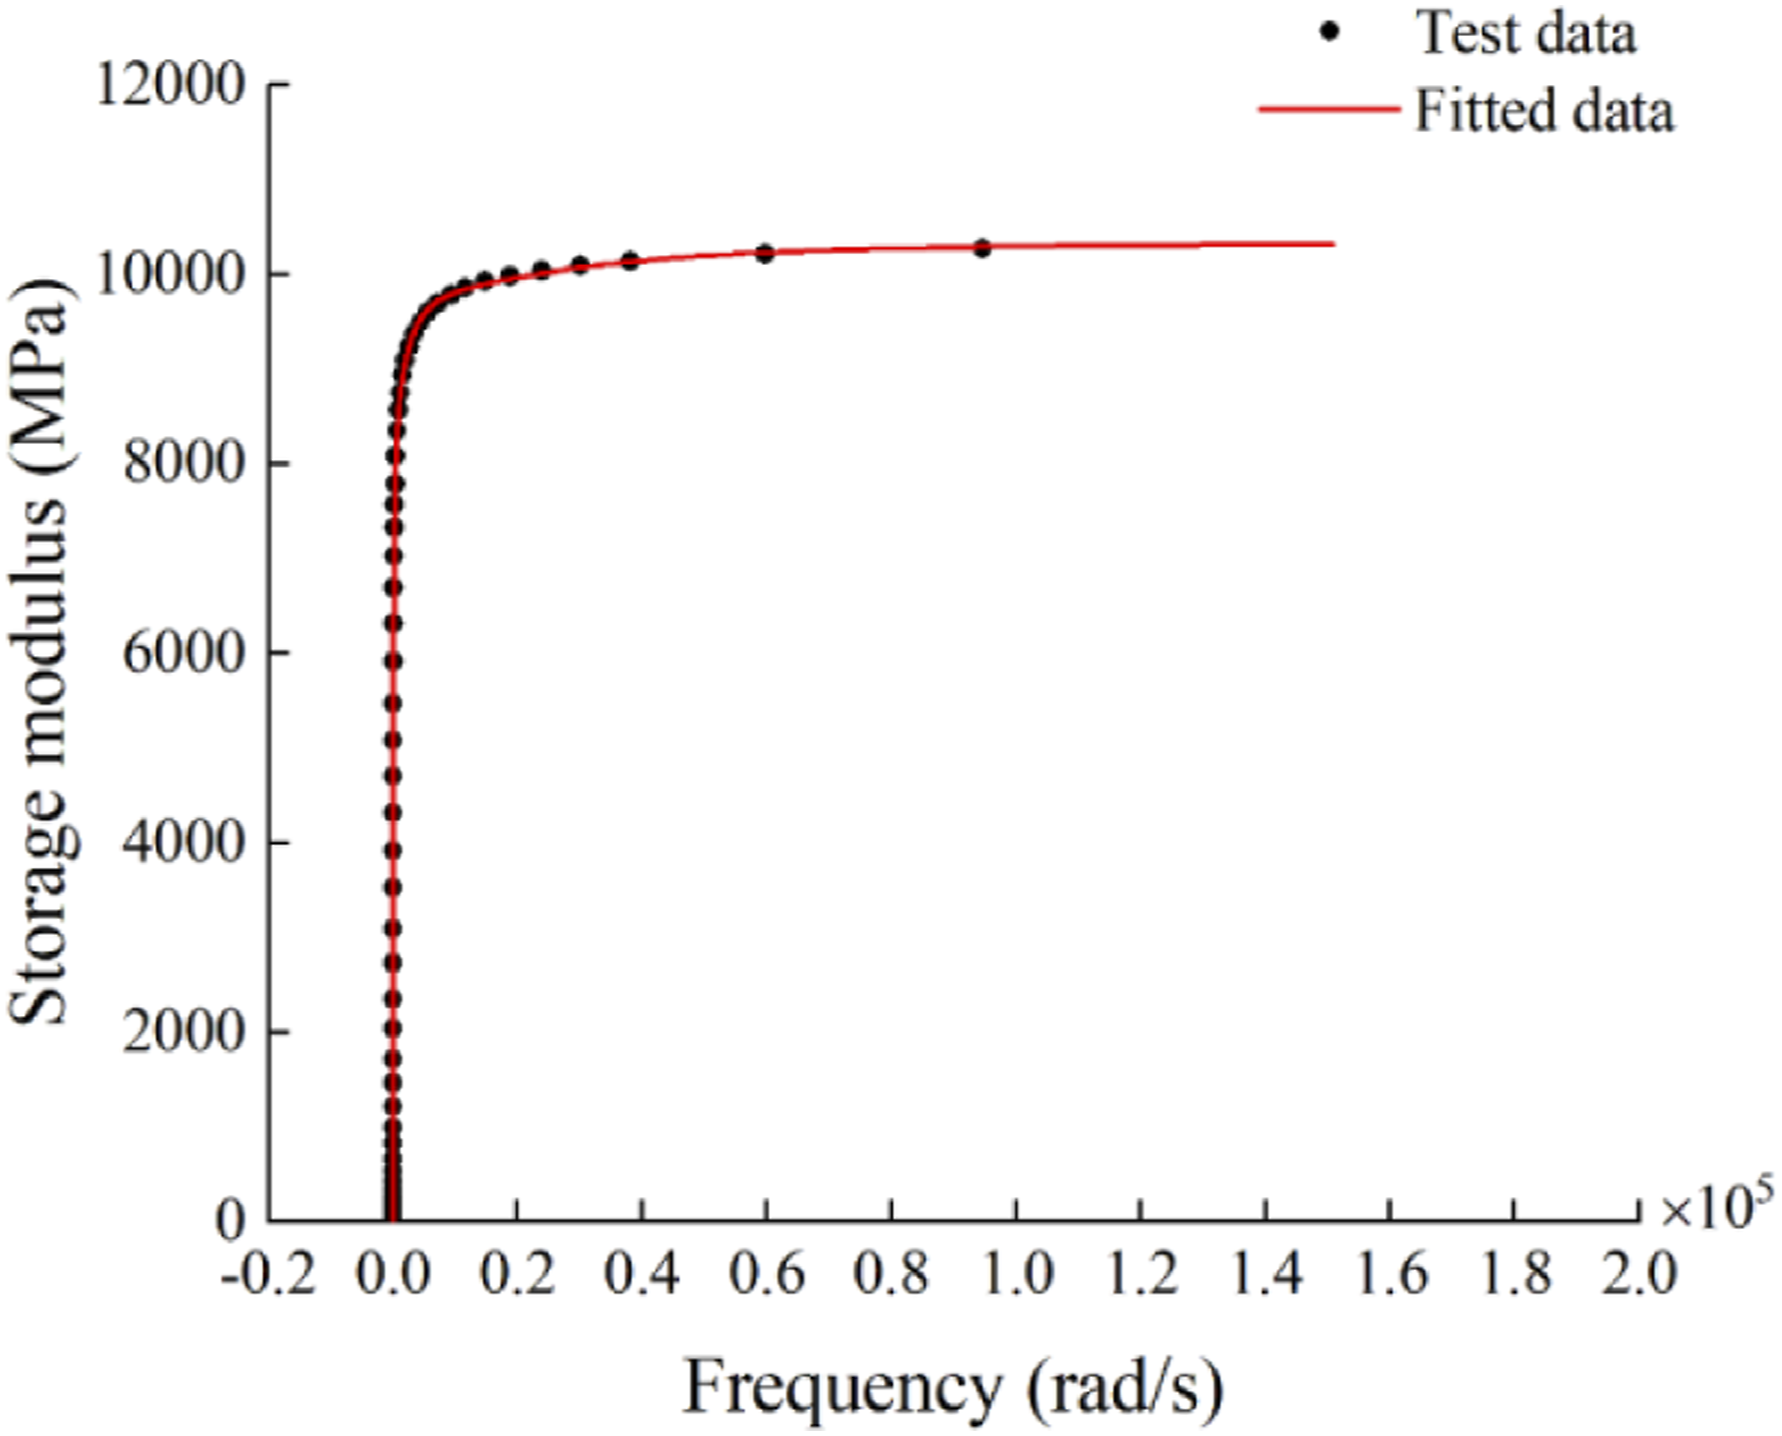
Storage modulus comparison of testing and fitting.
The material parameters of asphalt mixture and the relative modulus and relaxation time (listed in Table 3 and Table 4) are input into RPAP model by APDL command in Appendix A, then viscoelastic property can be assigned to those elements of the asphalt mixture pavement. For excitation, a load P is acted on the RPAP model and lasts 0.01 s to simulate the impact load, as shown in Figure 7. Then the RPAP model does damping free vibration. Because the rigid plate model is not ideal rigid plate, the average vertical displacements of node A and node B (shown in Figure 4) of the rigid plate are used to describe dynamic response of the RPAP model, shown in Figure 8. The load-time curve of load P Dynamic response of the RPAP model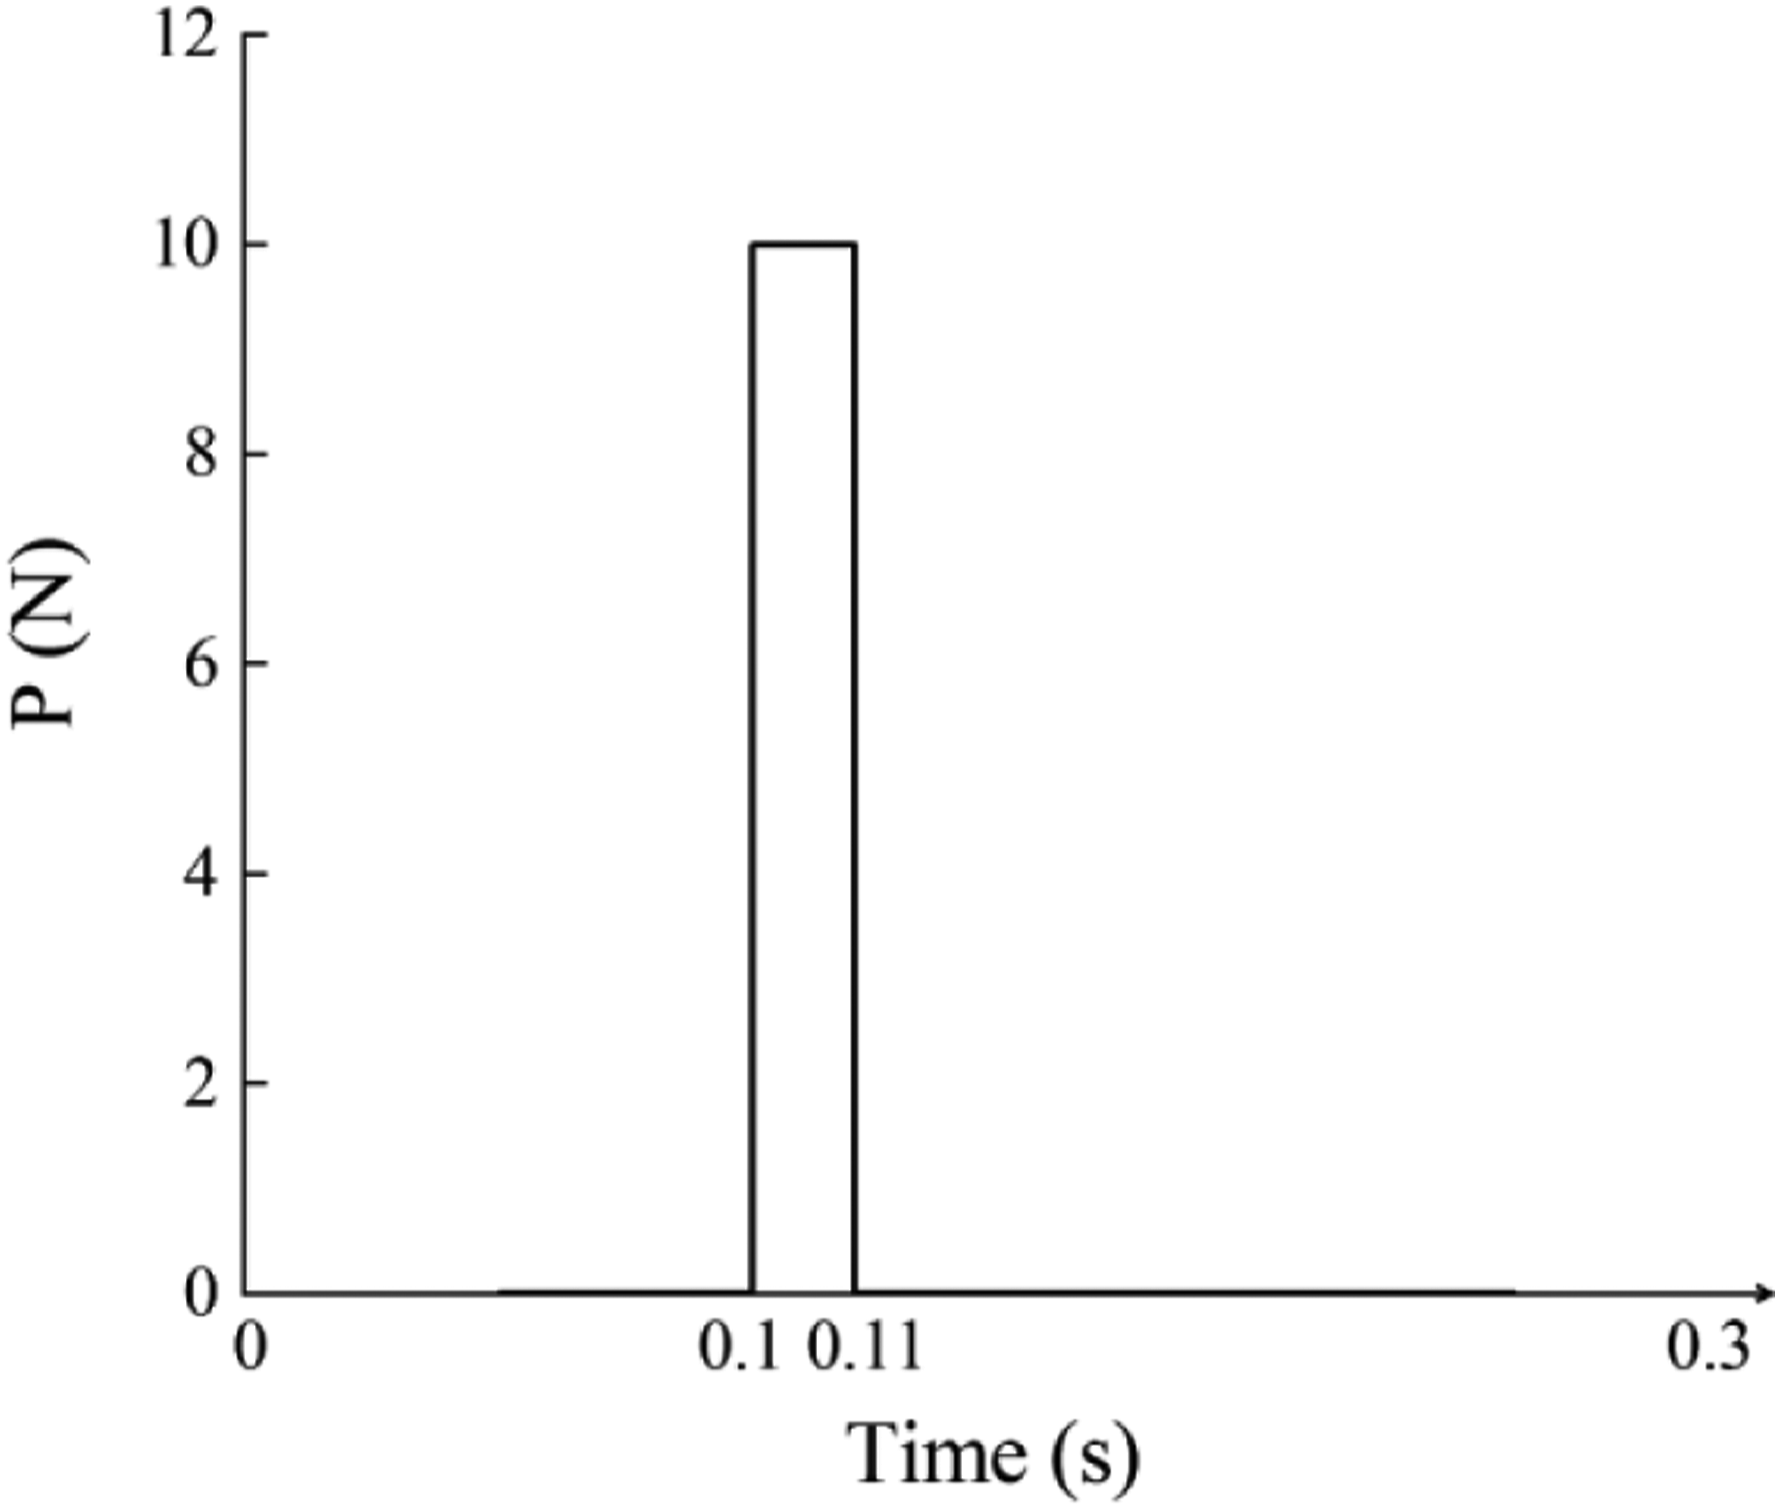
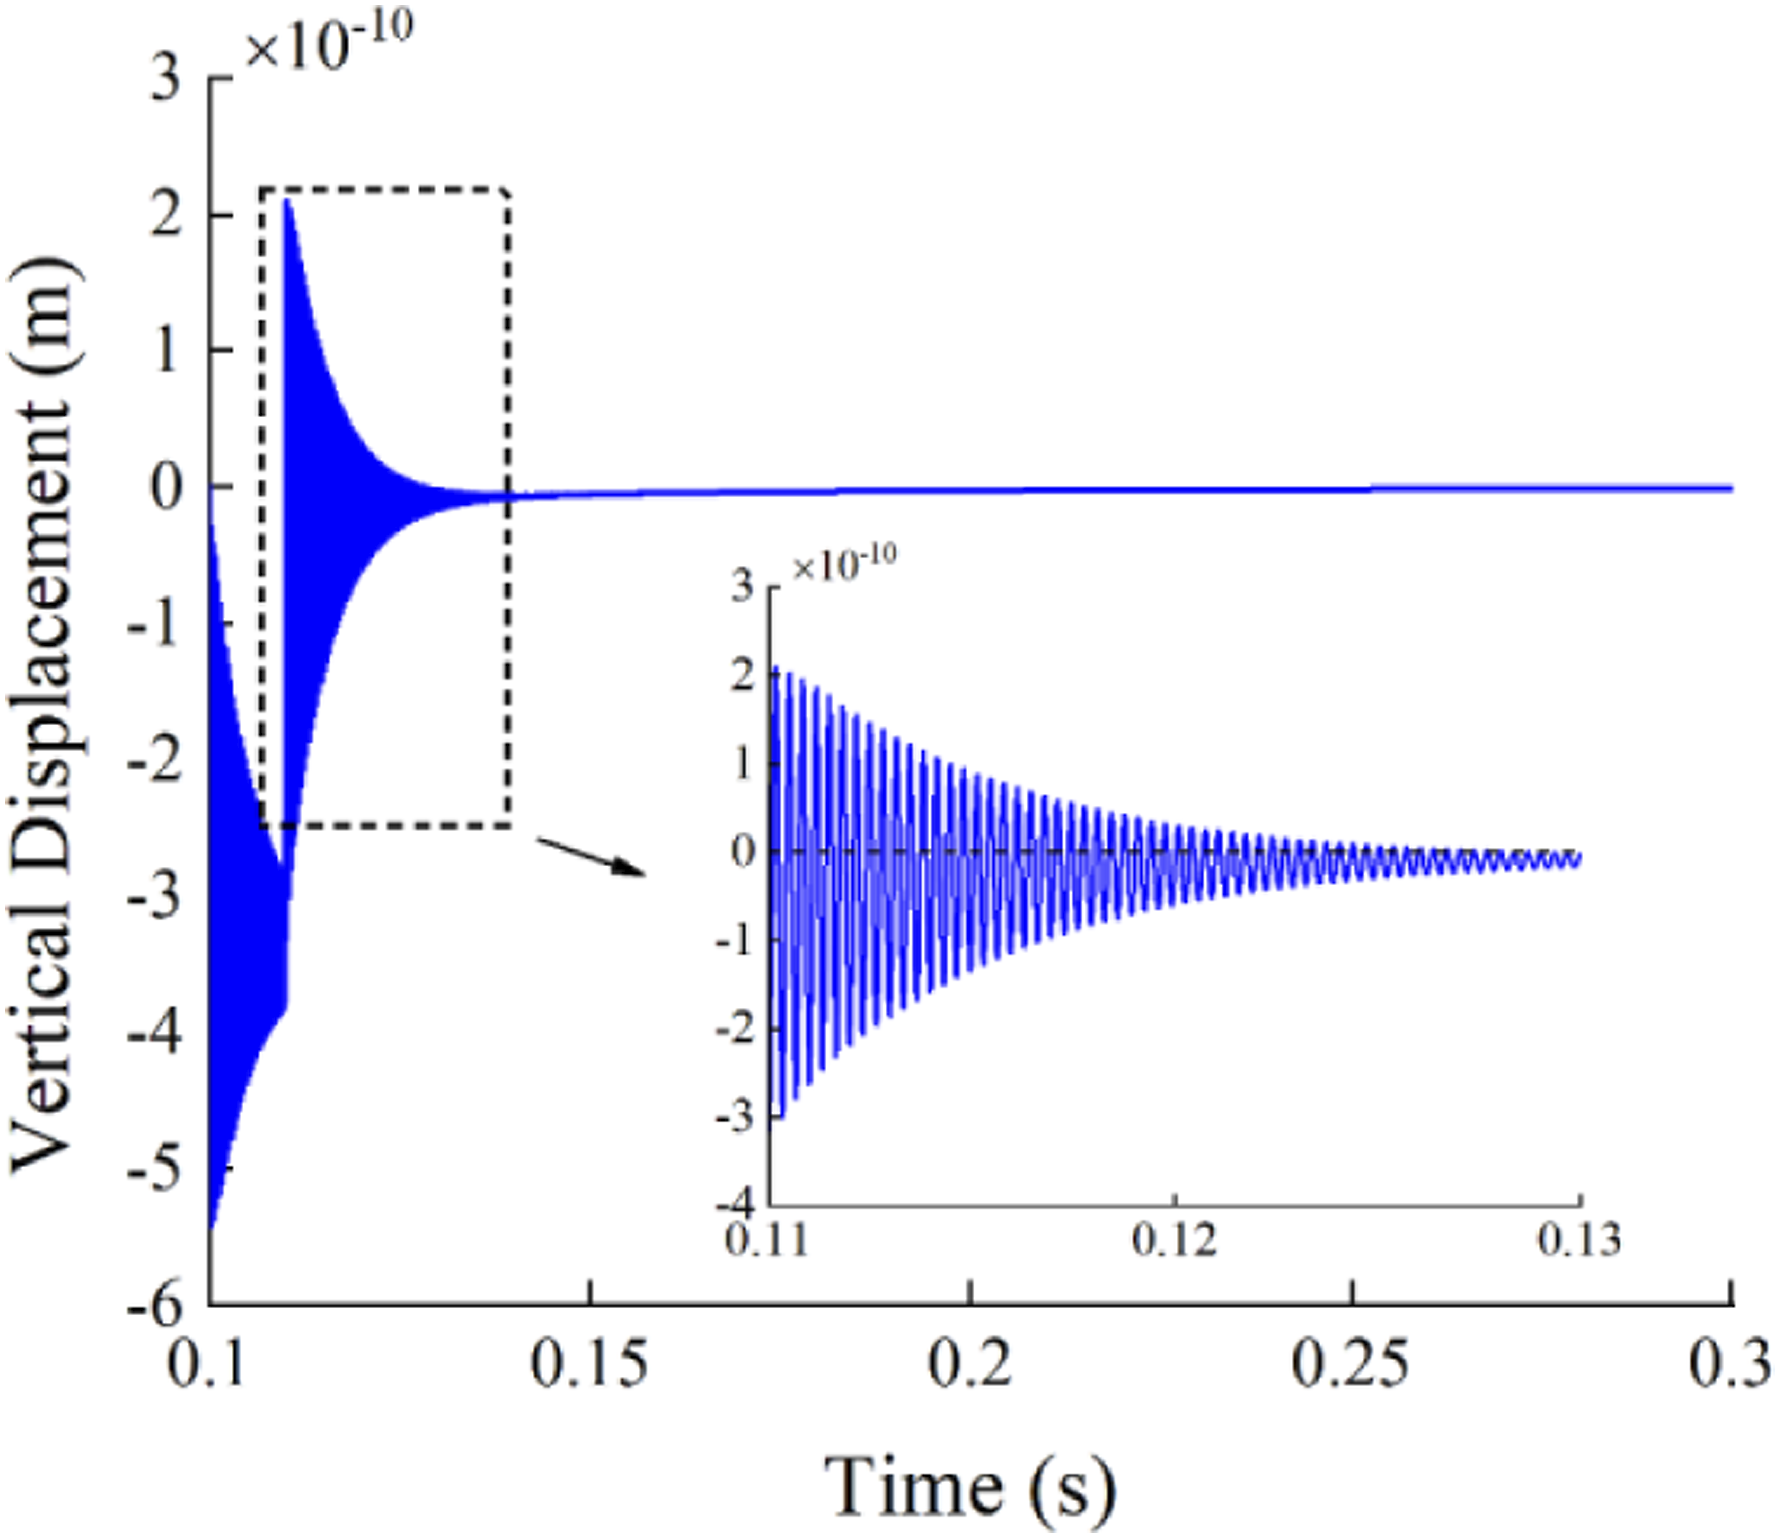
From Figure 8, it is illustrated that the vibration of the RPAP model decays over the time due to the asphalt mixture viscoelasticity. After 0.11s, the RPAP model vibrates freely with damping. The parameters τd, wi, and wi+n is obtained in this stage and they are substituted into equation (54) and (55) to calculate Kp and Cp. For case 1 to case 4, four groups of Kp and Cp are shown in Figure 9. Kp and Cp under different cases.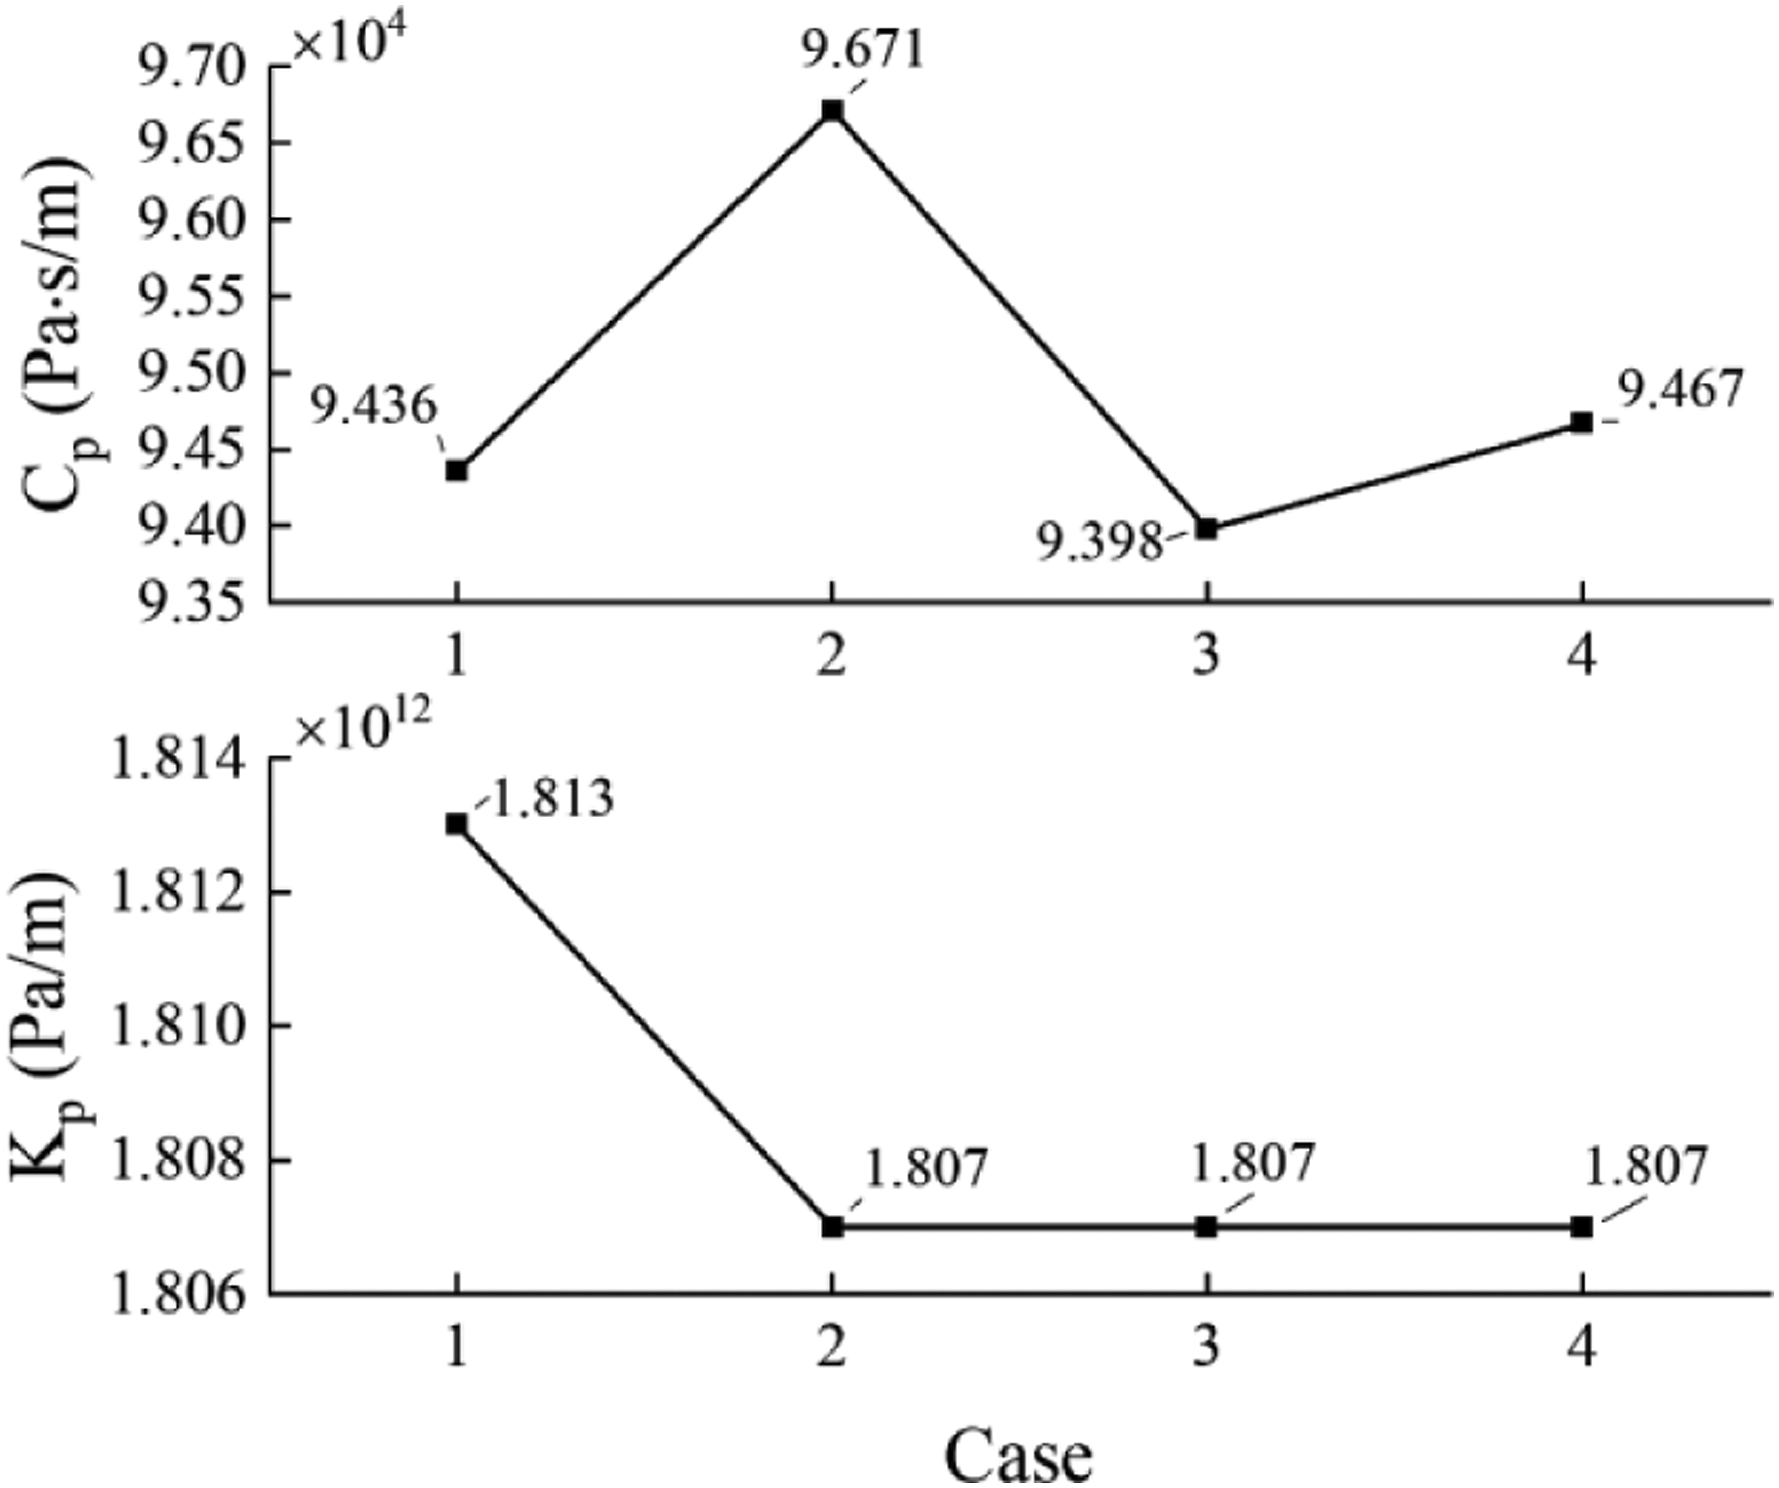
It shows that there are some differences for Kp and Cp due to the dimensional difference of rigid plate (i.e., dimensional difference of tire contact surface). Therefore, Kp and Cp are calculated considering the practical dimension of tire contact surface when Kp and Cp are used to calculate responses of VPBI system.
Model validation
Dynamic responses of the VPBI system are compared with the results of VBI system calculated by M. F. GREEN
23
to verify the validity of model in this paper. The VBI system is shown in Figure 10, which is a quarter vehicle model with 2-DOF and the vehicle model moves on a simply supported bridge at a constant velocity. From Figure 1 and Figure 10, there are some differences between the VPBI system and the VBI system. Such as the pavement and the tire contact area are considered in the VPBI system, but not considered in the VBI system. In addition, the modal damping ratio of bridge is 0.02 in VBI system although it has no effect on model validity.
1
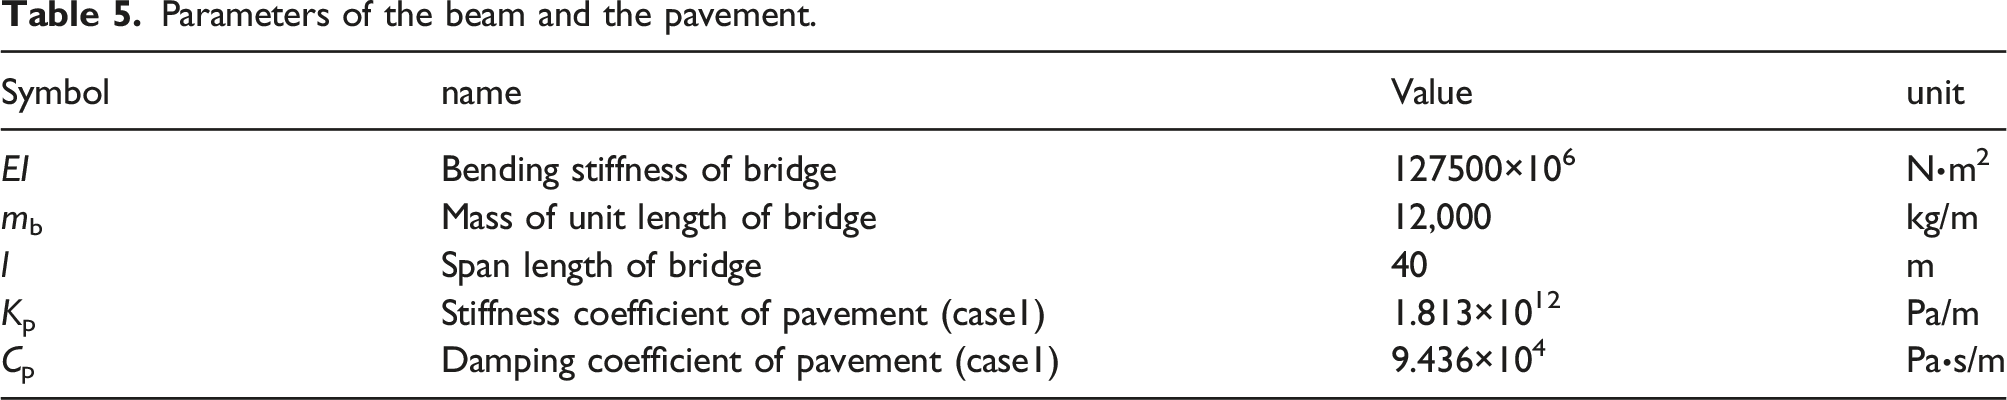
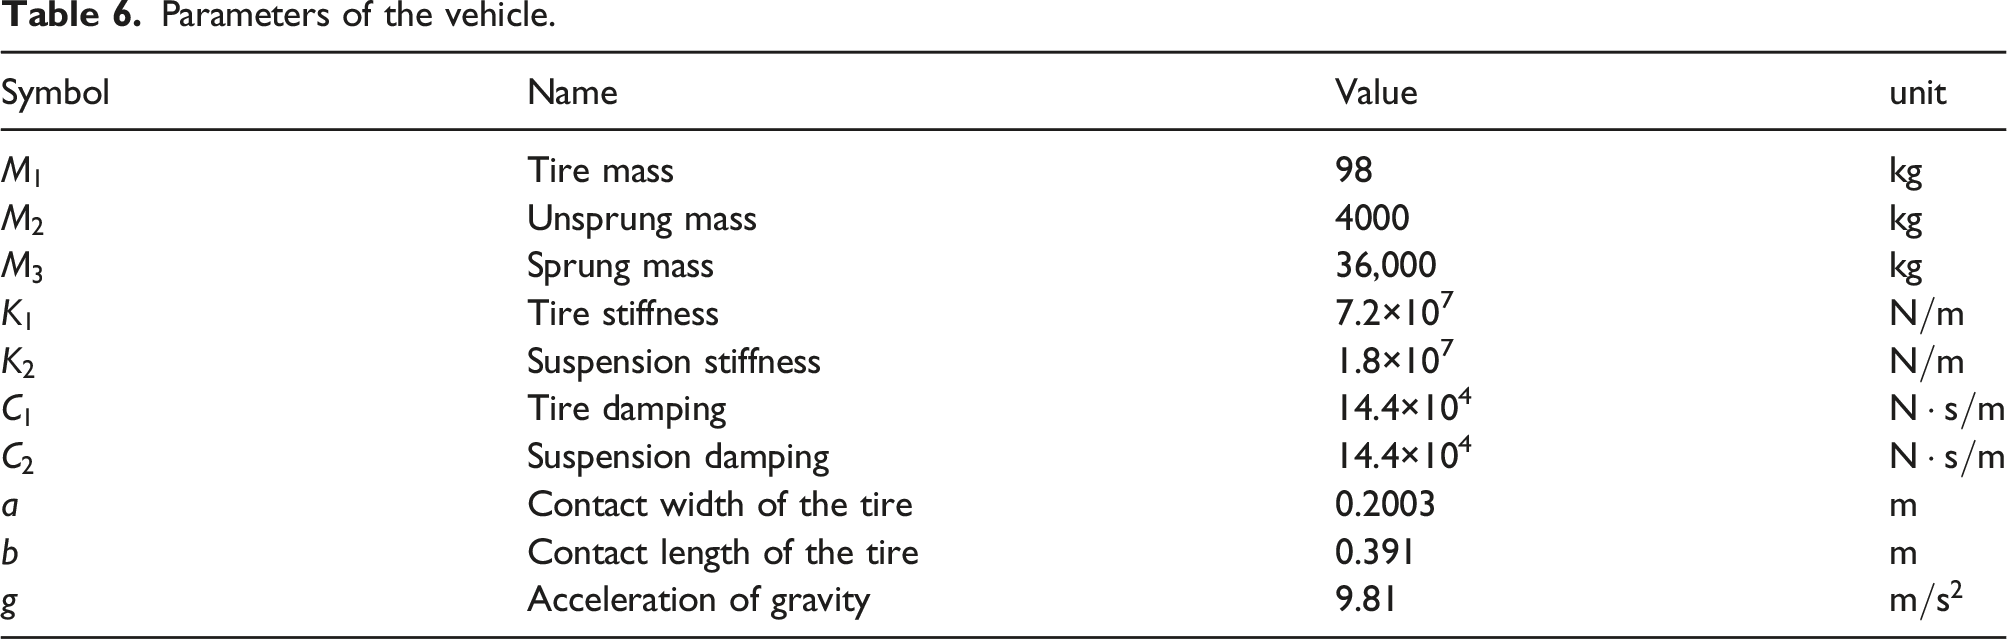
Except these differences, other components of these two systems are same. The parameters of the bridge, the vehicle20,23,24 and the pavement are given in Table 5 and Table 6. When the velocity is 25m/s, substituting the vehicle, bridge and pavement parameters into equation (19), the VPBI system responses can be obtained. The vertical displacement responses at the bridge mid-span of VBI and VPBI are shown in Figure 11. The VBI system of M. F. GREEN
23
. Parameters of the beam and the pavement. Parameters of the vehicle.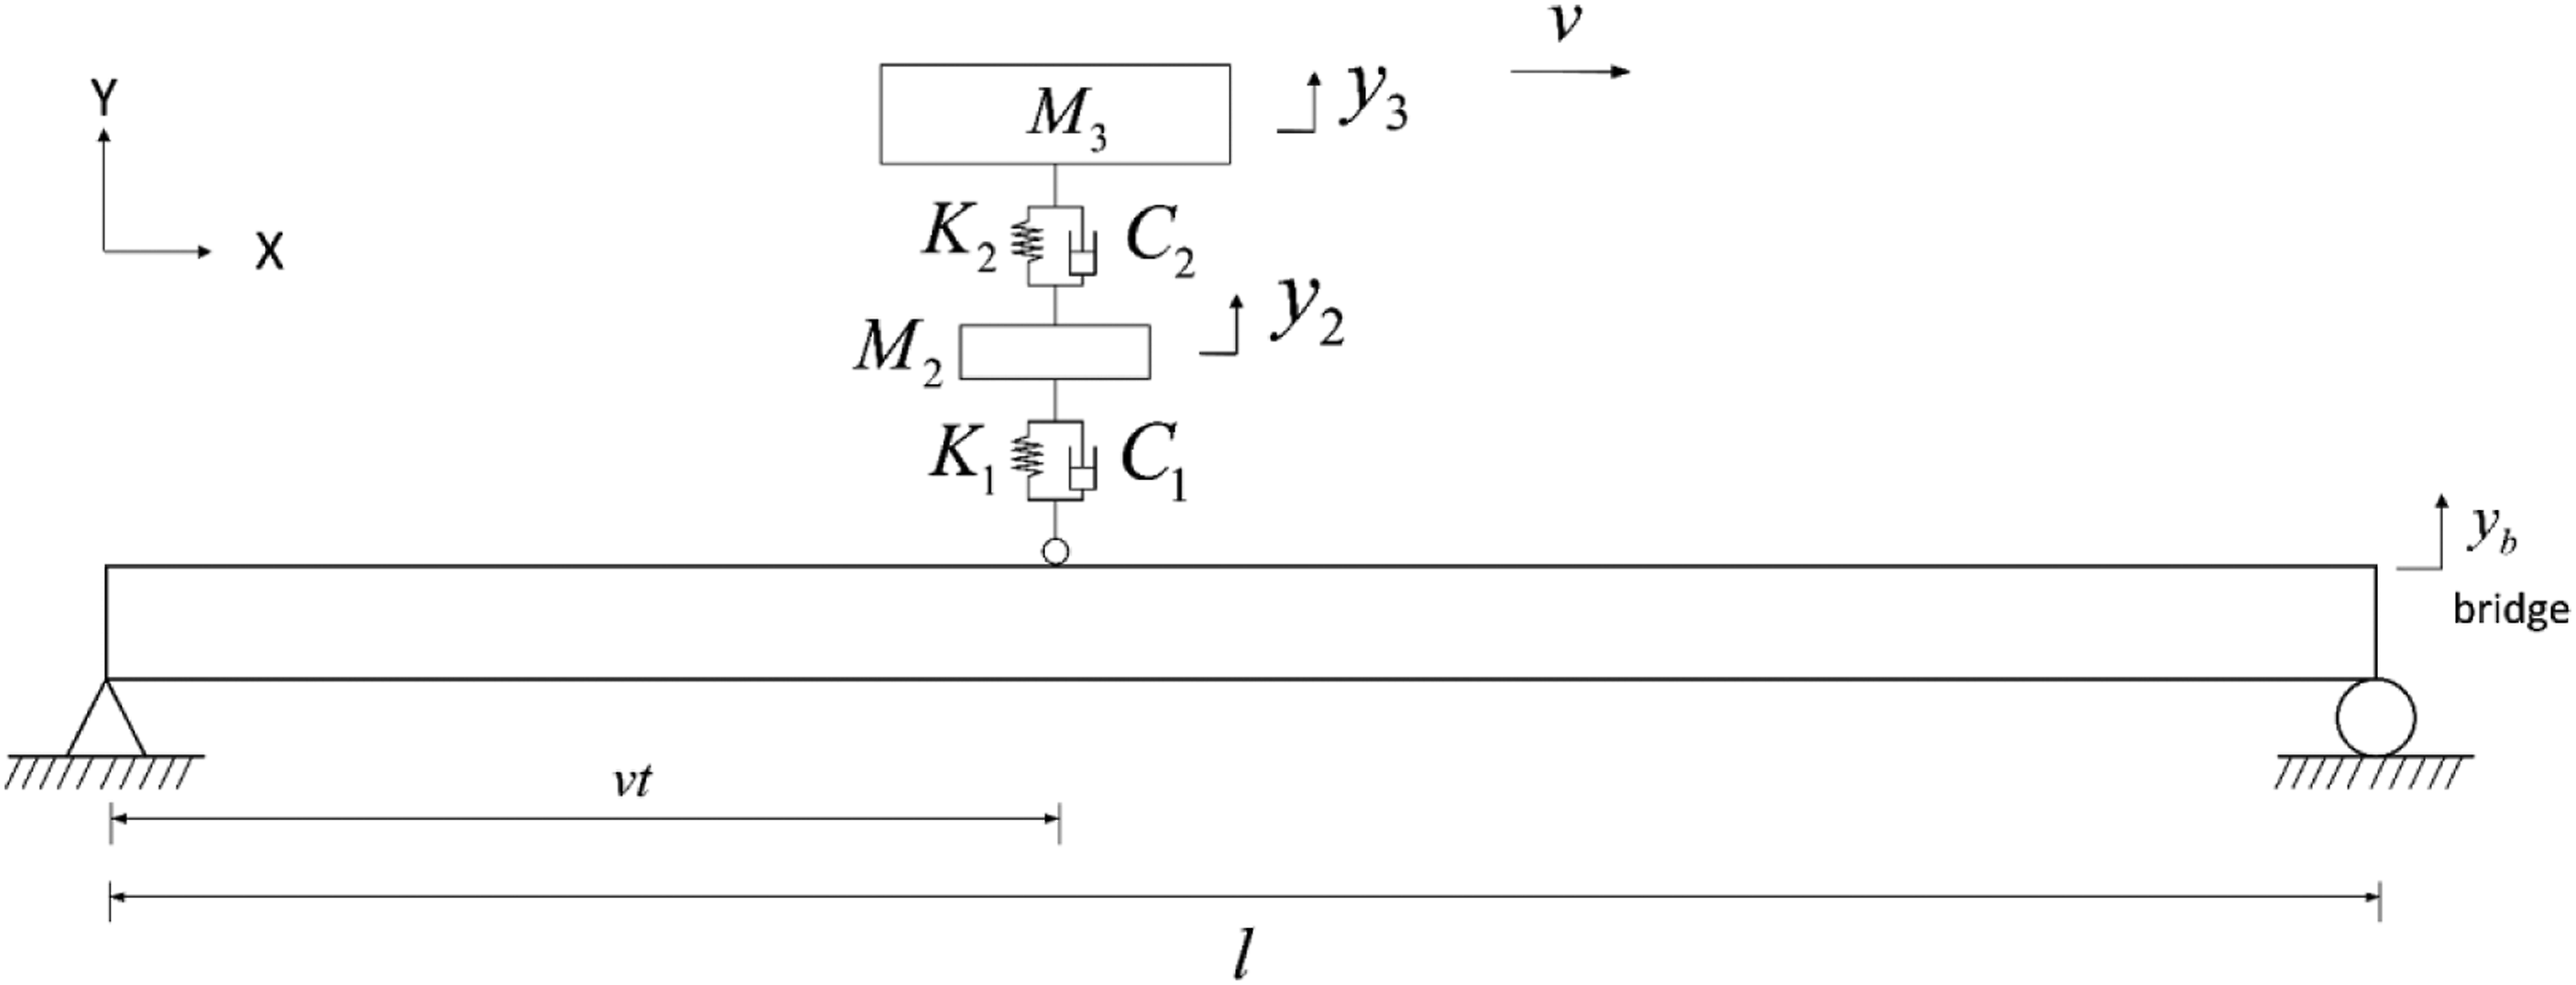
From Figure 11, two lines are very close and have similar variation trend. The vertical displacement of the VPBI system is little smaller than those in Reference [23]. From the enlarged partial view, it can be seen that the maximum two lines are about 0.0041 m and 0.0042 m, respectively. Therefore, VPBI system model is correct. Vertical displacement at the bridge mid-span calculated by VPBI and VBI.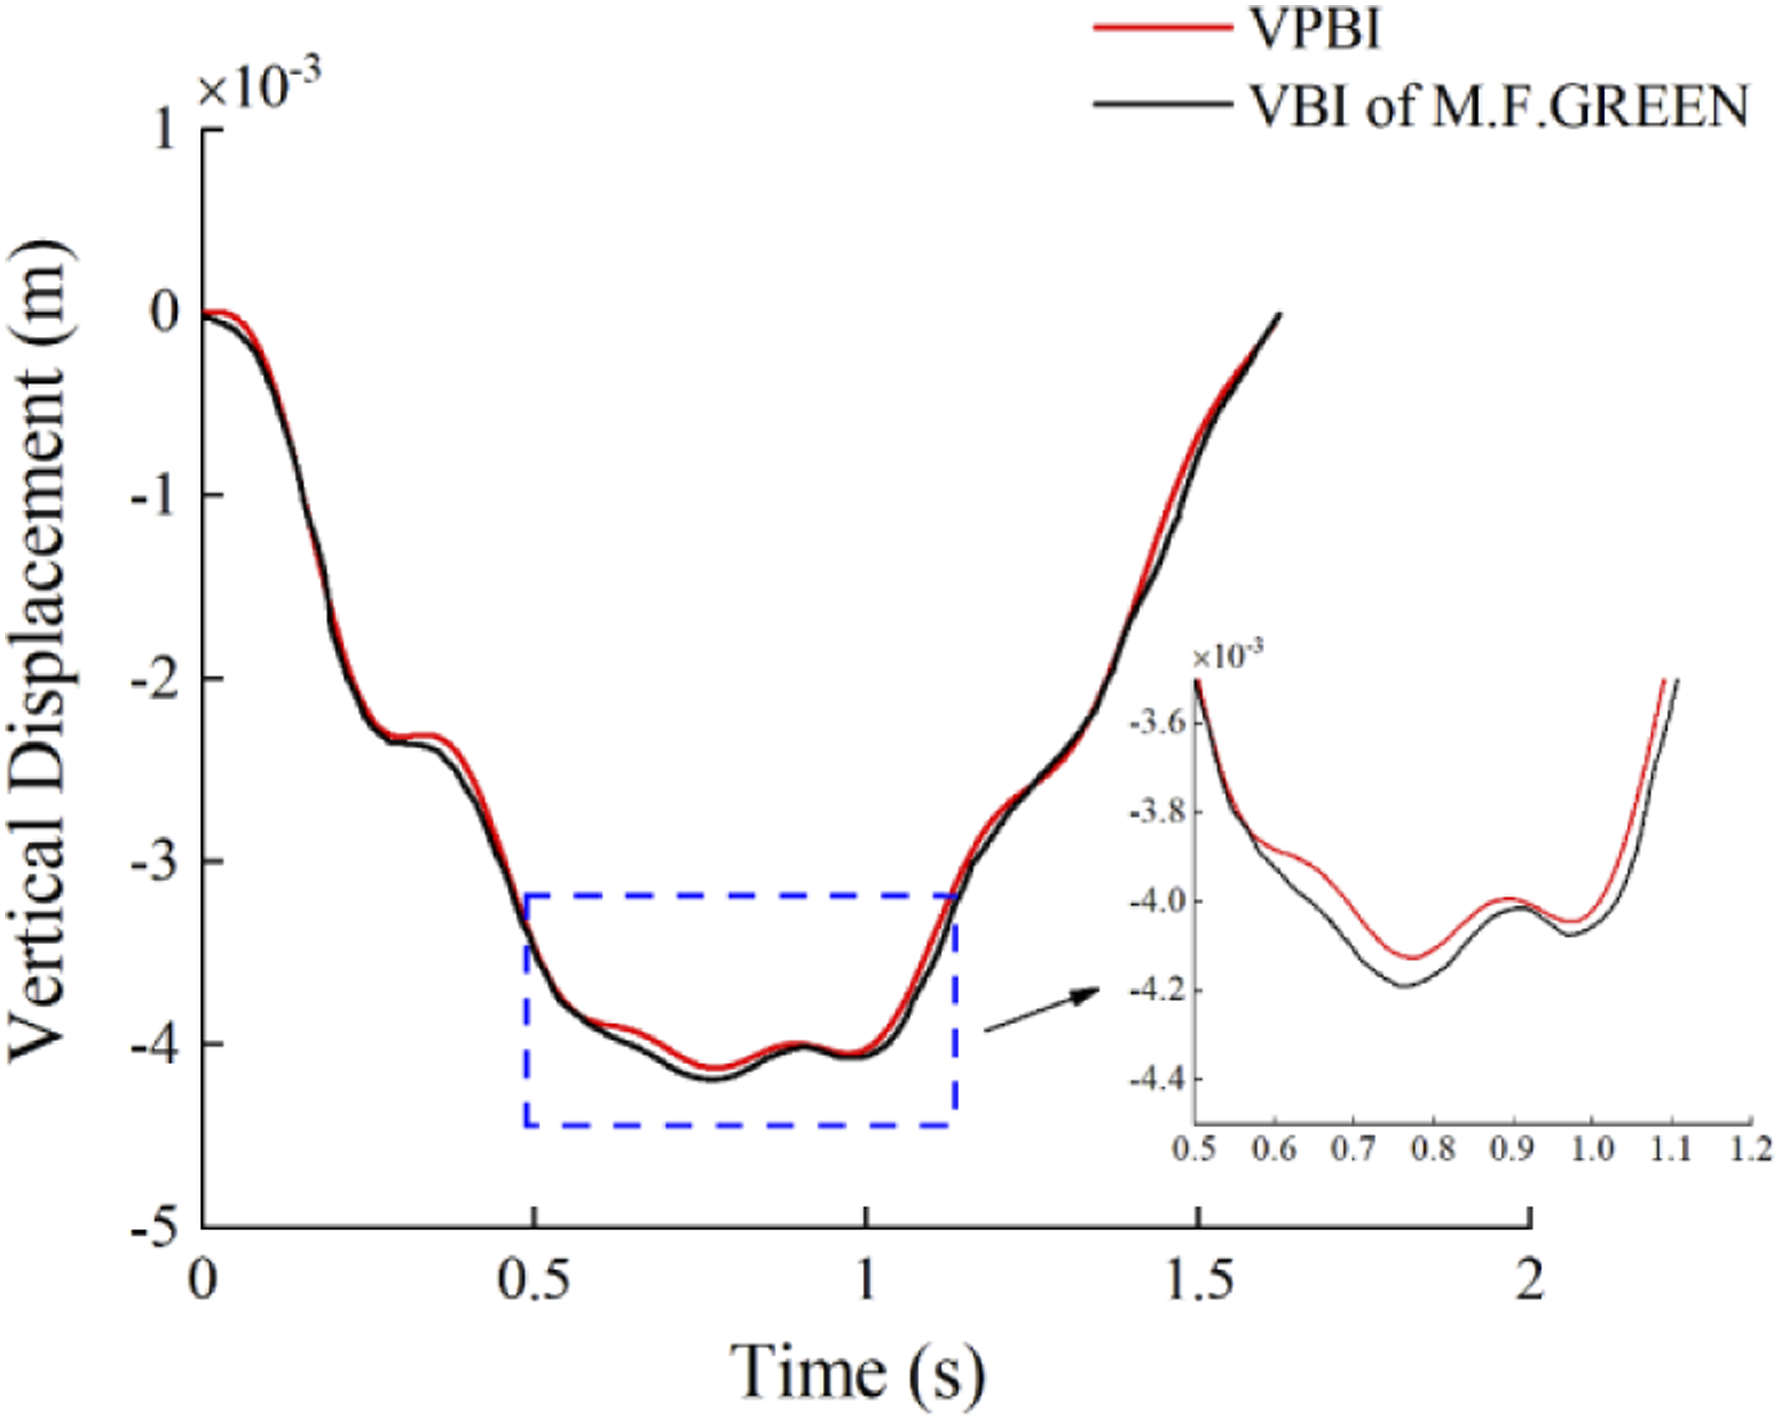
Further, the VPBI system is compared with the VBI system under the case without tire contact area, shown in Figure 12. The parameters of these two systems are listed in Table 5 and Table 6. And the dynamic responses of them are shown in Figure 13. The VPBI (a) and VBI (b) with point contact. Dynamic responses comparison of VPBI and VBI: (a) displacement at mid-span of bridge, (b) acceleration at mid‐span of bridge, (c) displacement of vehicle body, (d) acceleration of vehicle body.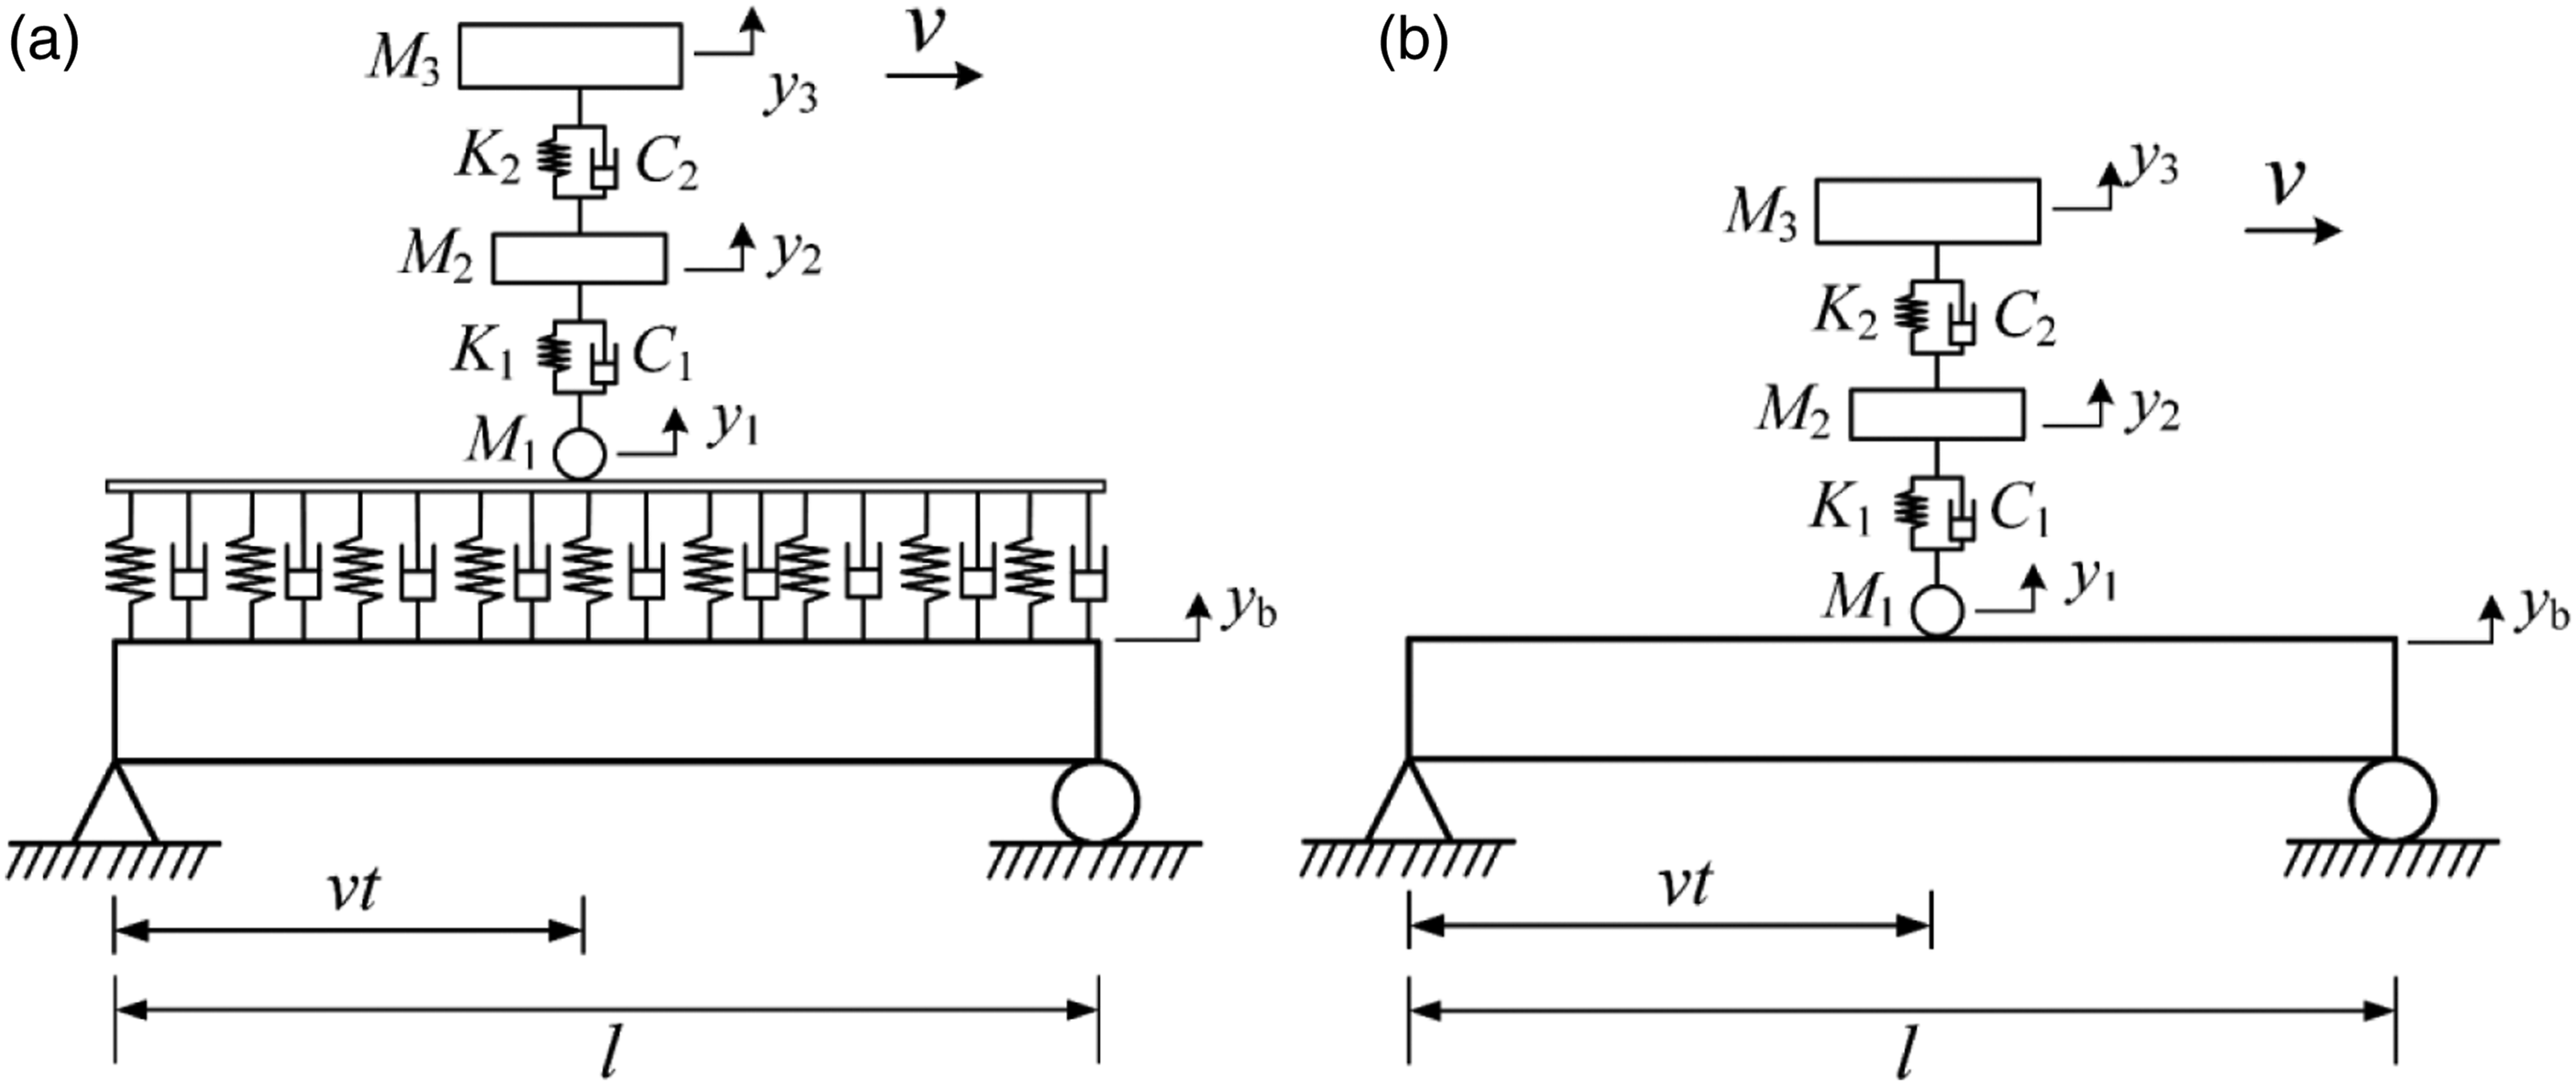
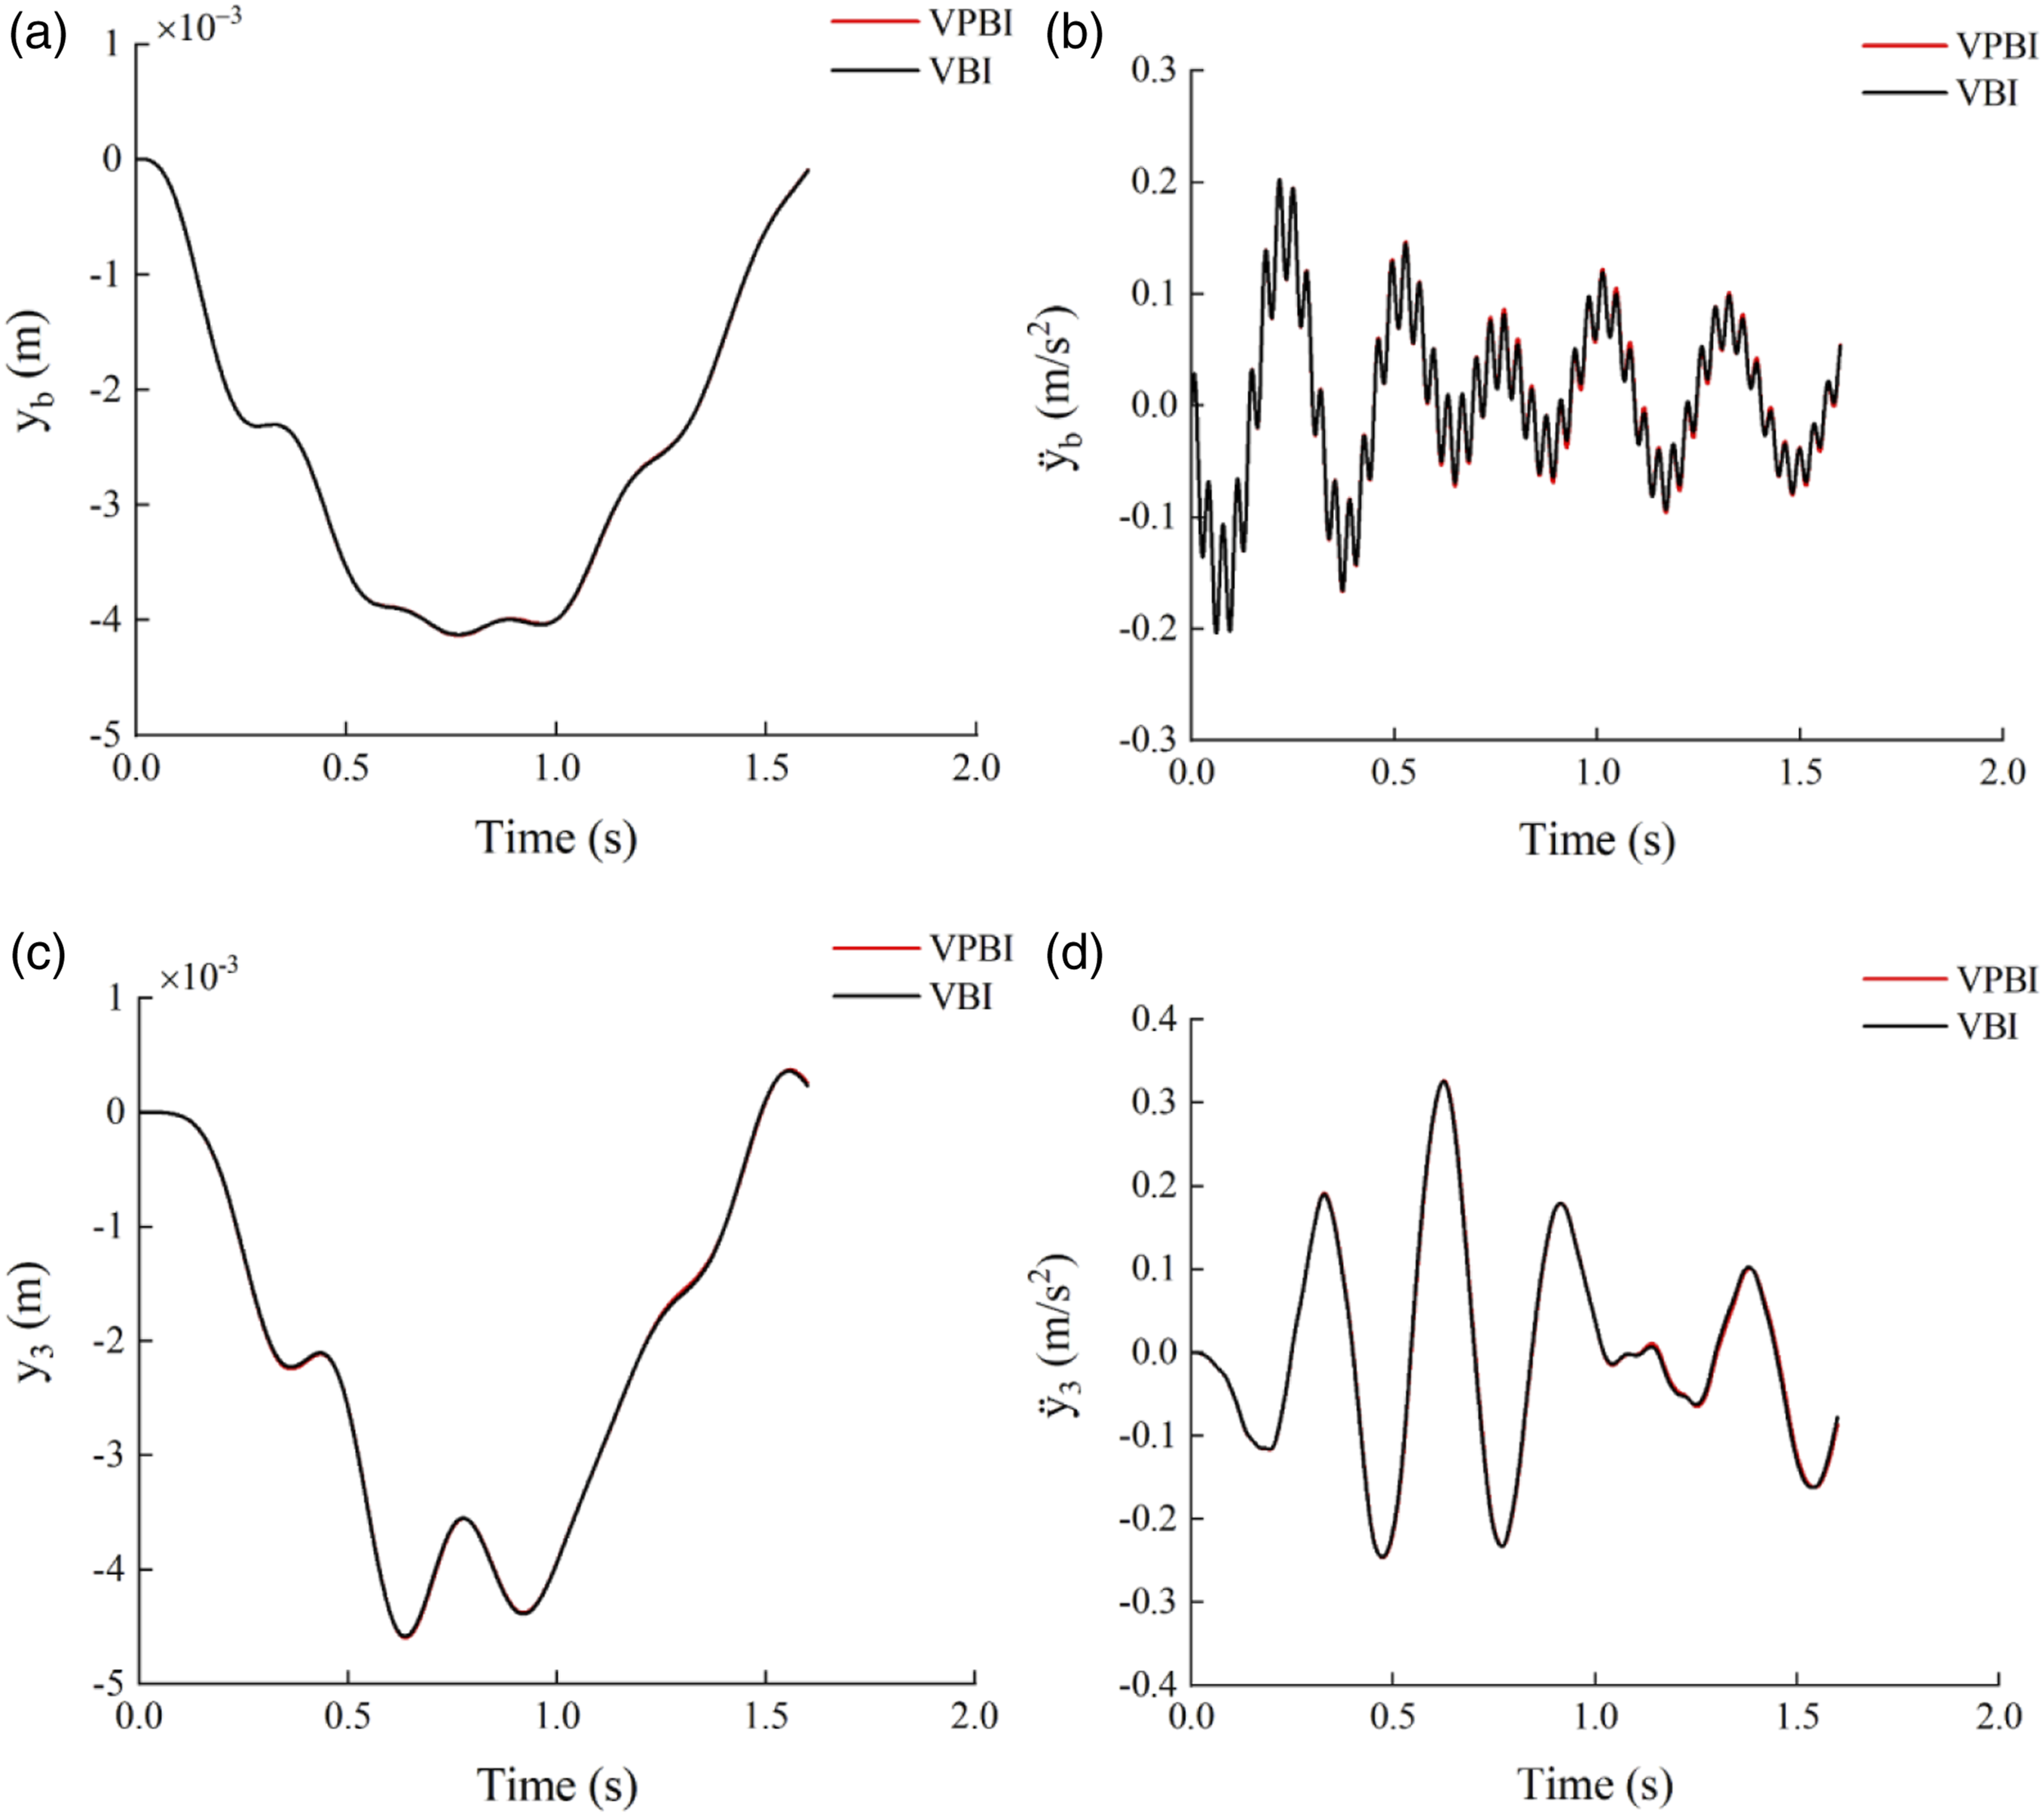
From Figure 13, it illustrates that dynamic response curves of the VPBI system and VBI system are very similar. Use a L-2 norm of the dynamic response difference value between VPBI system and VBI system to describe the effect of the pavement. And then the L-2 norm is 0.0005, 0.2193, 0.0012, and 0.3806 corresponding to Figure 13 (a) to (d) in turn. It indicates that the pavement has more effect on acceleration than displacement, especially on the acceleration of vehicle body.
Analysis of the dynamic responses
In this section, the dynamic responses of VPBI system (shown in Figure 1) are analyzed. The dynamic responses include displacement at bridge mid-span, acceleration of vehicle body, tire contact force, and pavement deformation under the tire. The tire contact force is determined by
The deformation of pavement yp is defined by the following expression, that is
Effect of vehicle velocity
When the vehicle velocity is 40 km/h, 80 km/h, 120 km/h, respectively, and other parameters are the same as Table 5 and Table 6, the dynamic response curves of VPBI system are given in Figure 14. The variation trends of the maximum dynamic responses are also shown in Figure 14, as the vehicle velocity increasing from 10 km/h to 120 km/h with an interval of 10 km/h. Effect of vehicle velocity: (a) displacement at mid‐span of bridge, (b) variation trend of the maximum displacement, (c) acceleration of vehicle body, (d) variation trend of the maximum acceleration, (e) tire contact force, (f) variation trend of the maximum tire contact force, (g) deformation of pavement, (h) variation trend of the maximum pavement deformation.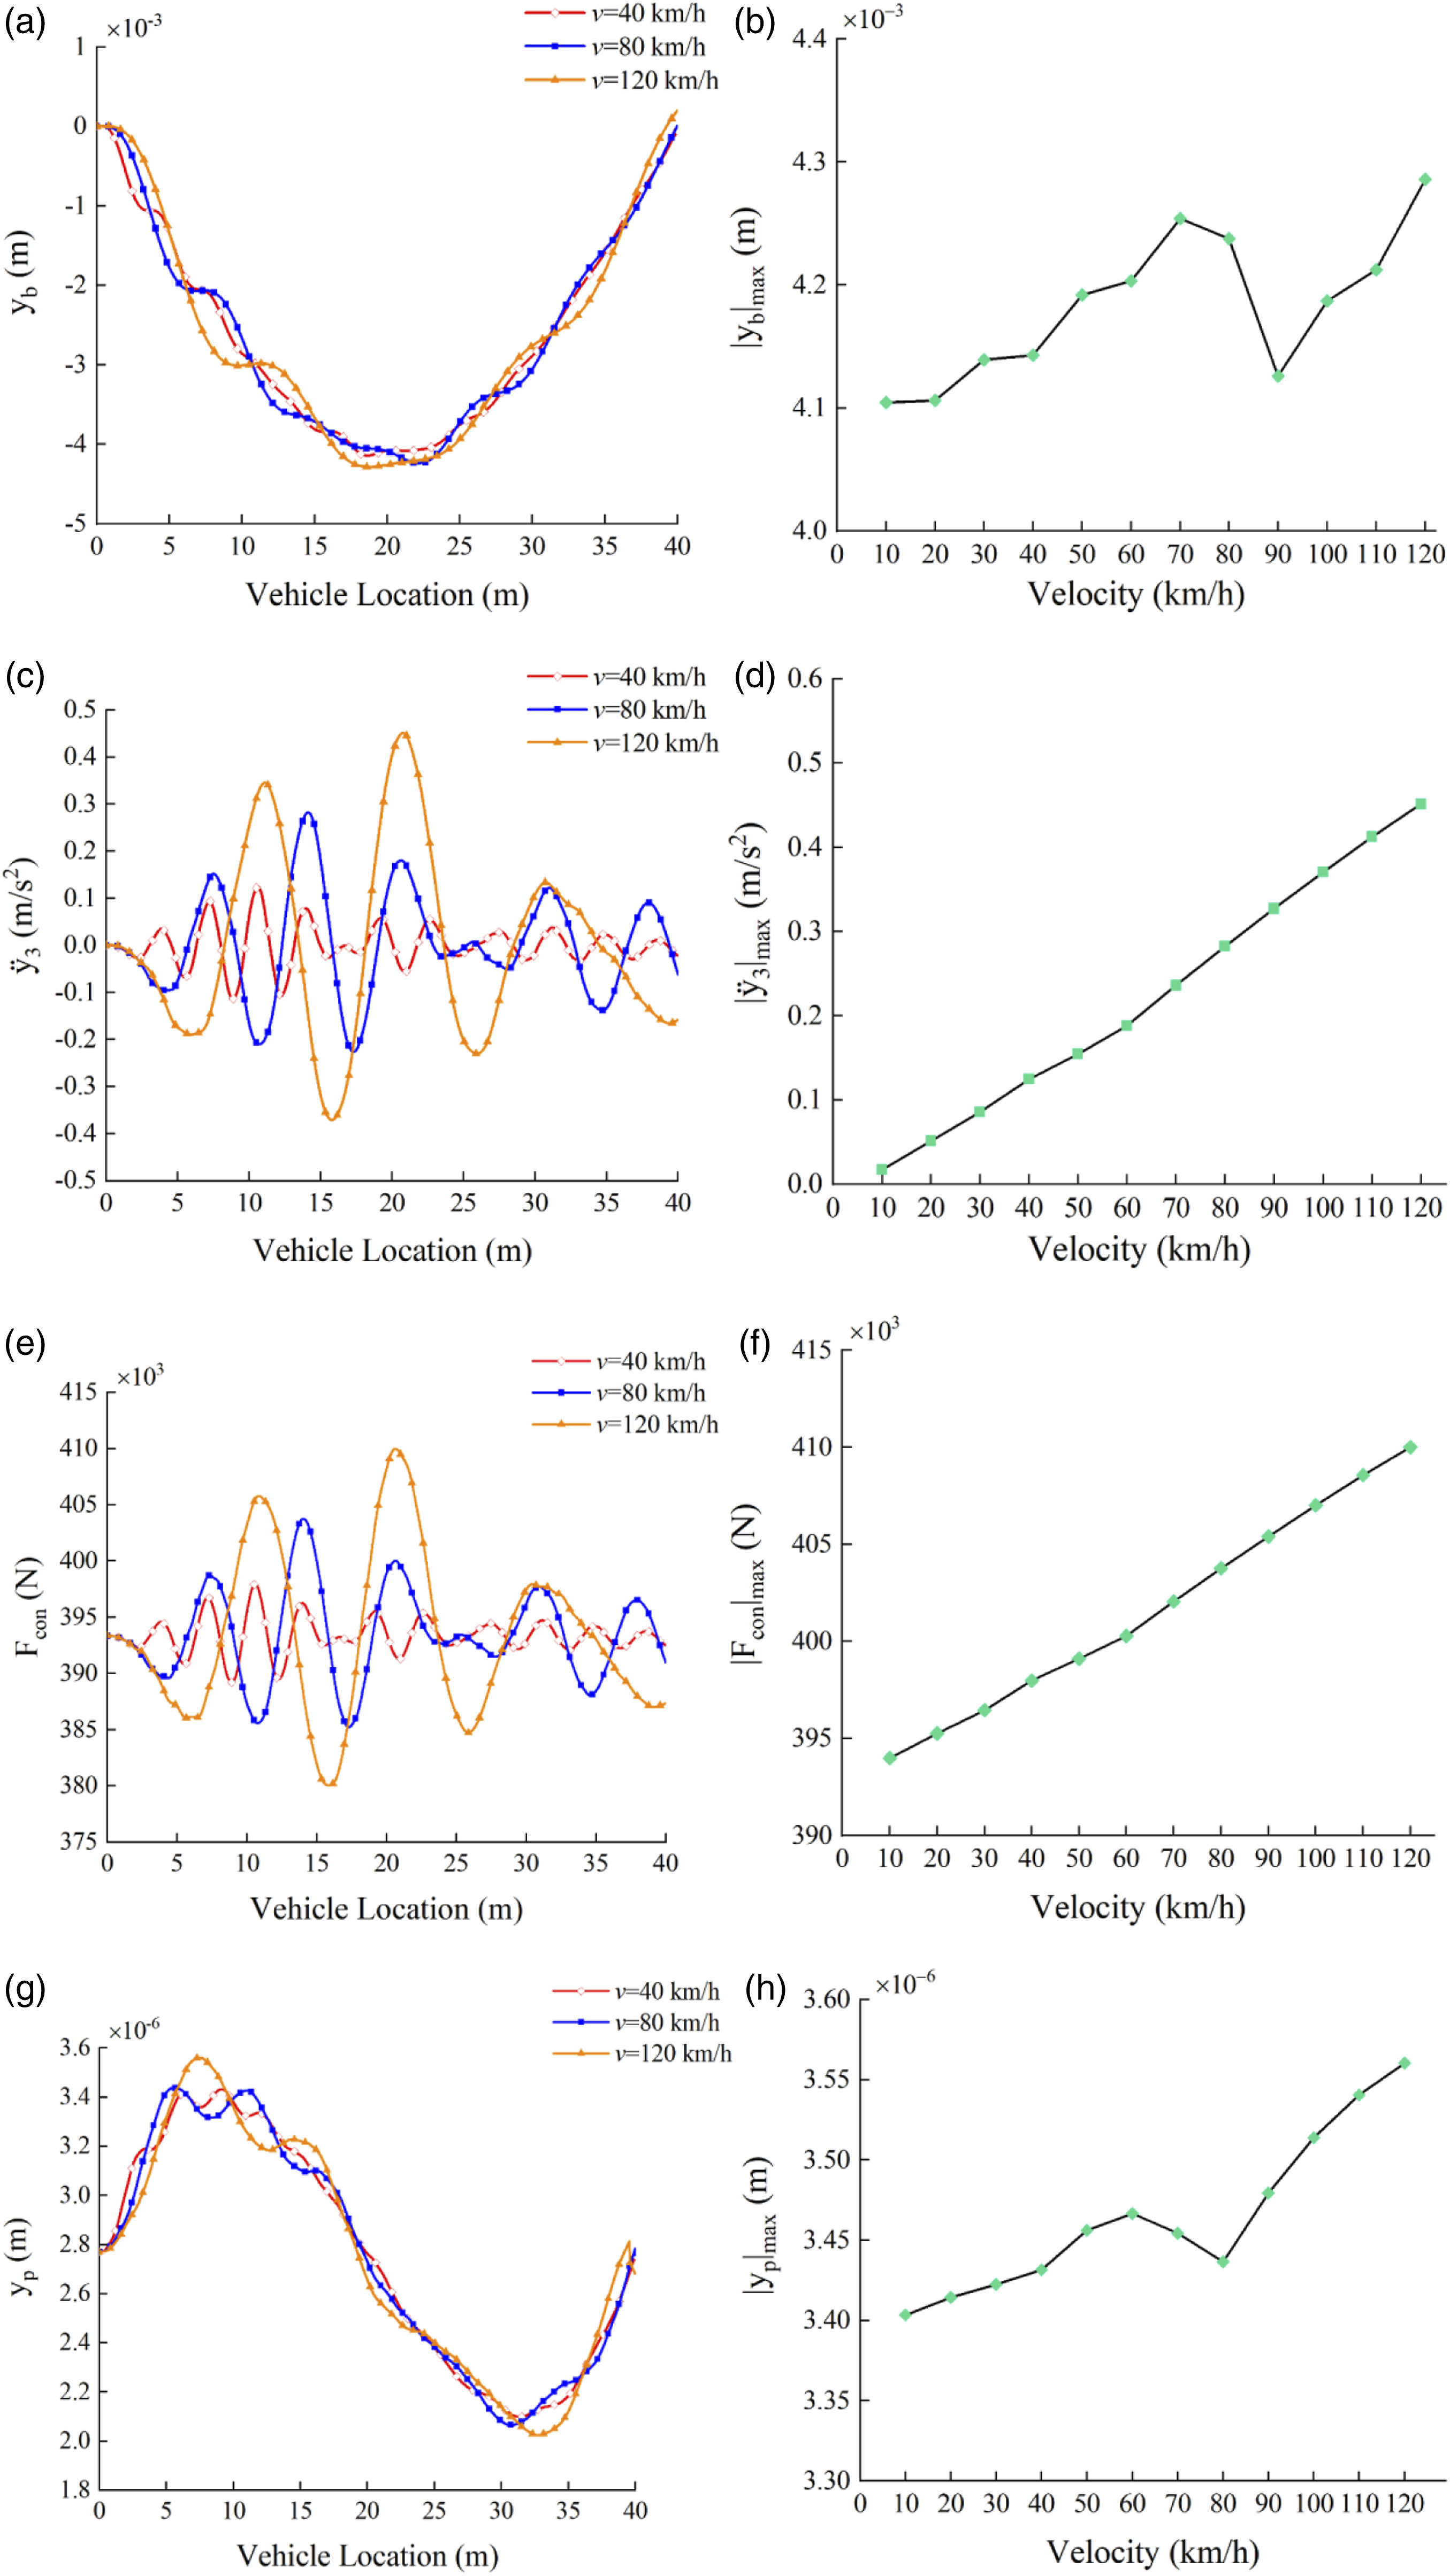
From Figure 14, as the velocity increases, the VPBI responses have similar variation pattern, except that the fluctuation amplitude increases and the number of the fluctuation peaks decreases. The curves of
Effect of bridge span
Only the bridge span is changed while other parameters of vehicle, pavement, and bridge are the same as Table 5 and Table 6. When the vehicle velocity is 90 km/h, dynamic responses of VPBI are shown in Figure 15 within the span range in 20 m–40 m. Effect of bridge span: (a) displacement at mid‐span of bridge, (b) variation trend of the maximum displacement, (c) acceleration of vehicle body, (d) variation trend of the maximum acceleration, (e) tire contact force, (f) variation trend of the maximum tire contact force, (g) deformation of pavement, (h) variation trend of the maximum pavement deformation.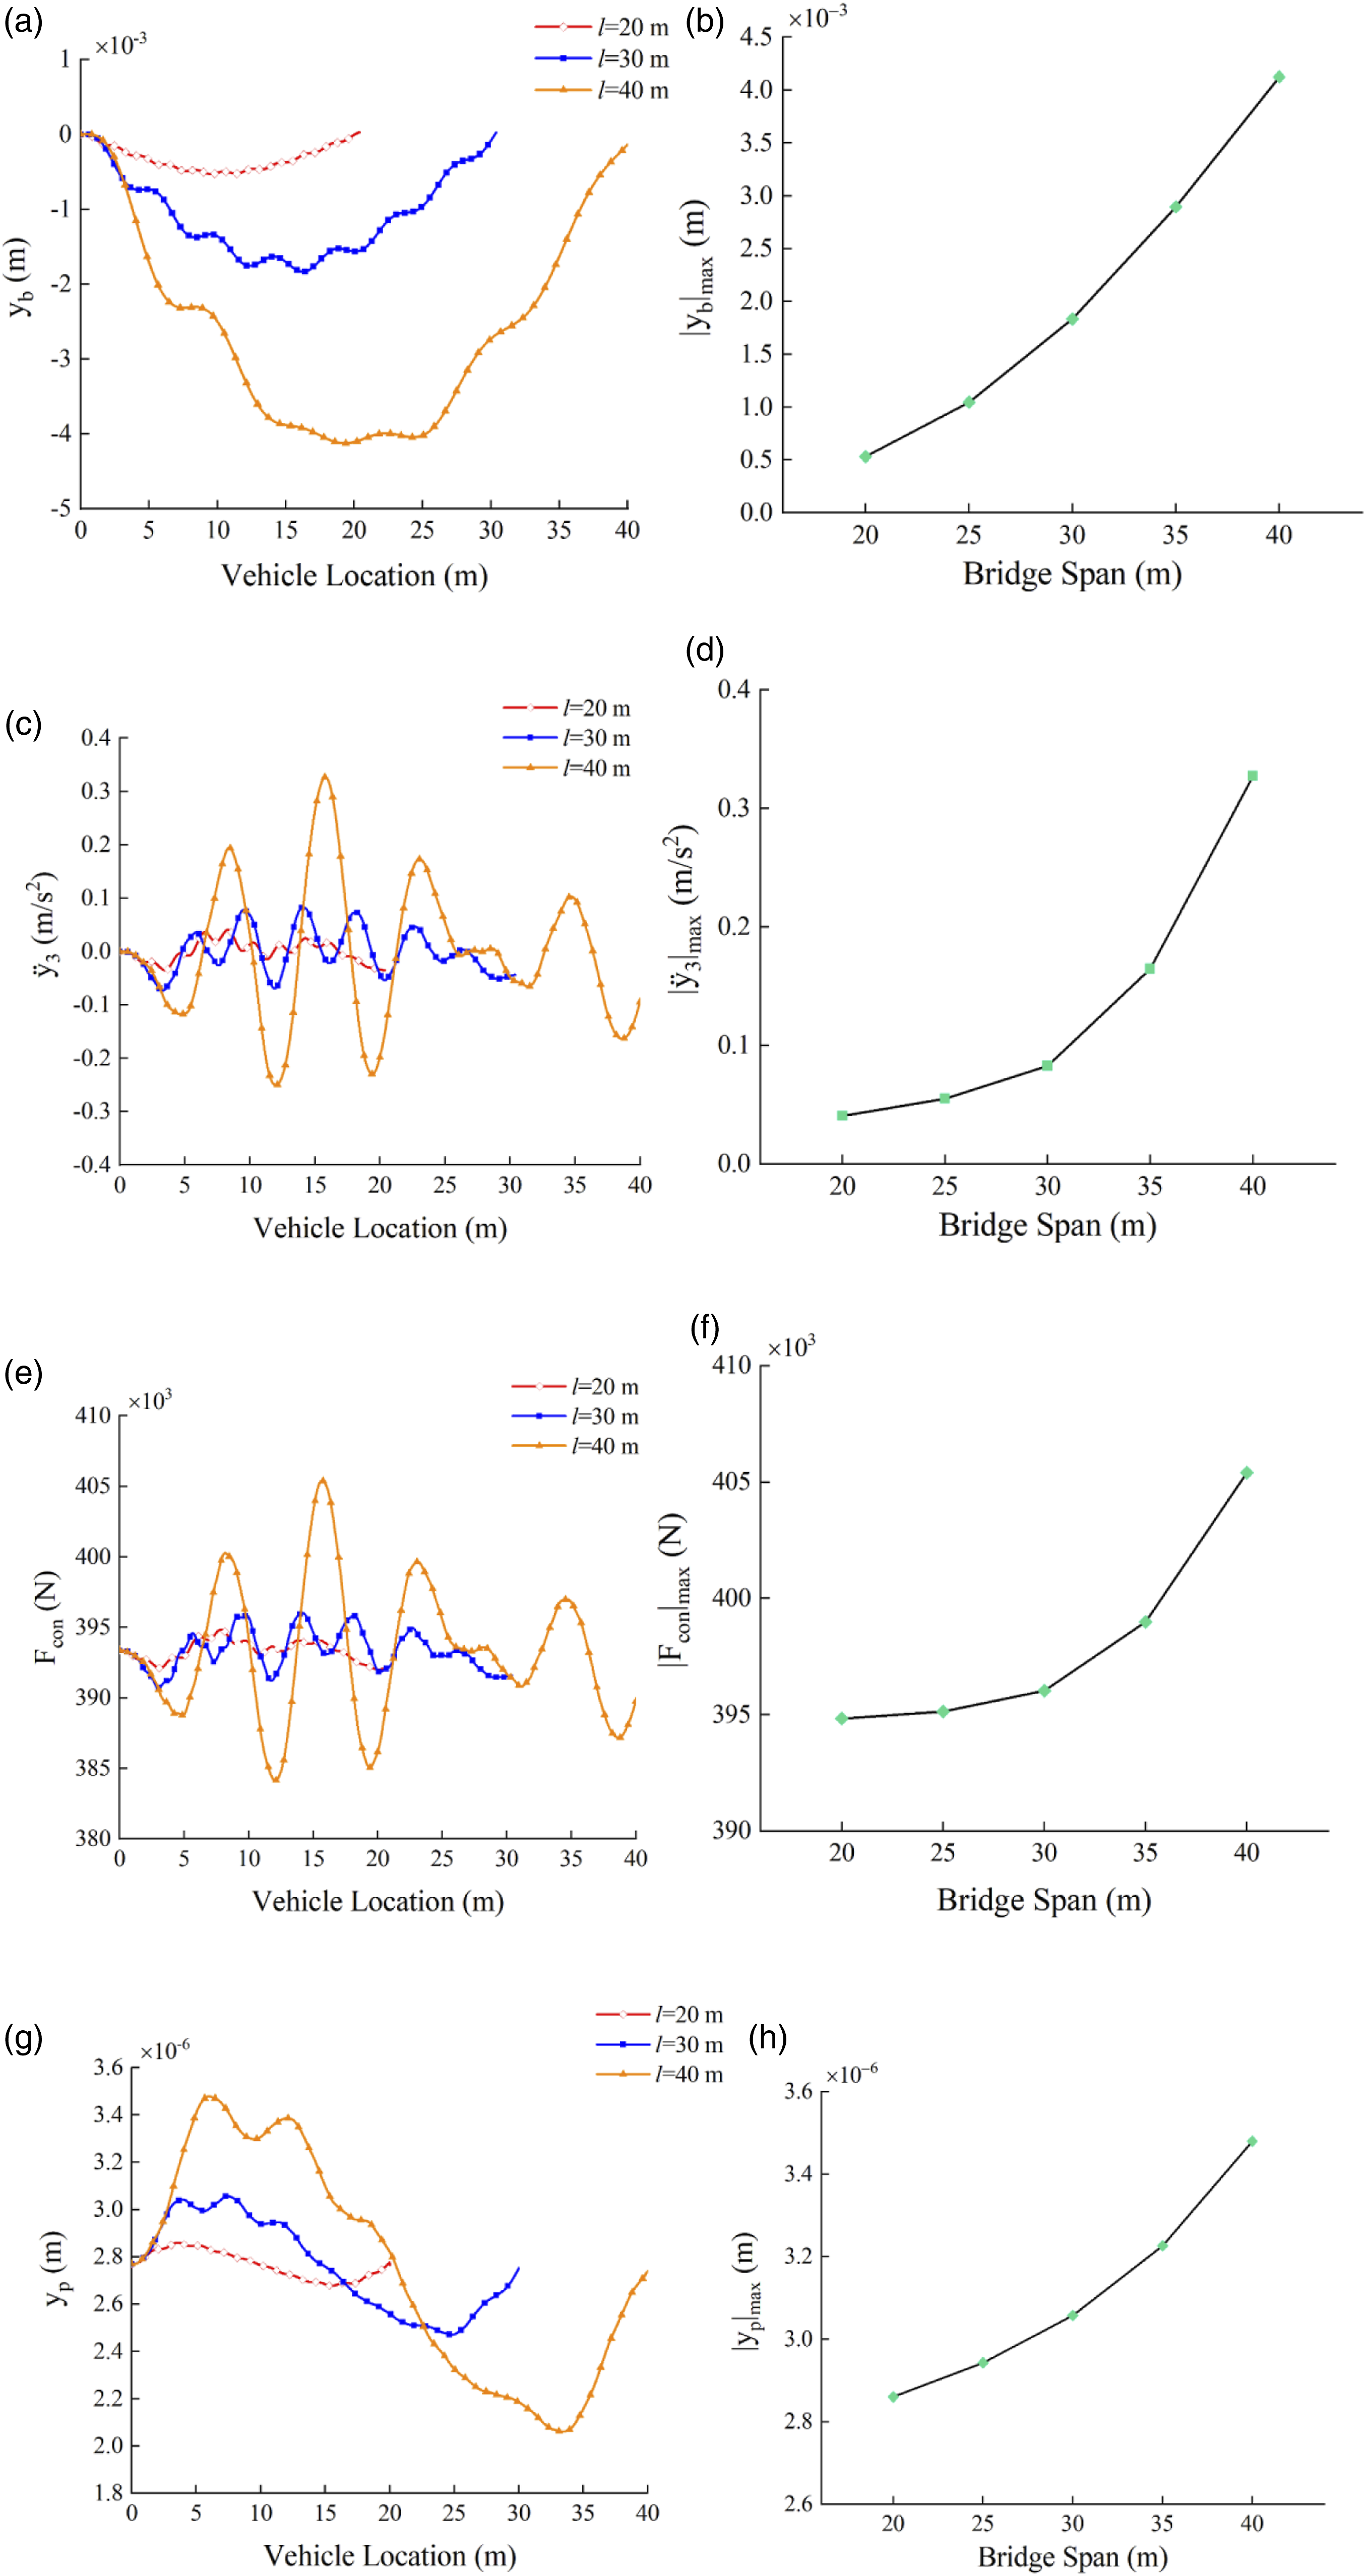
It can be seen that the bridge span has a great influence on the dynamic responses of the VPBI system. From Figure 15 (a) and (b), with the increase of the bridge span, the vertical displacement at mid-span of the bridge increases significantly. The maximum displacement when the span is 40m is about 8 times of the maximum displacement when the bridge span is 20m. From Figure 15 (c), (e), and (g), the fluctuation of the curves increases greatly with the increase of the bridge span. Figure 15 (b), (d), (f), and (h) show that the maximum of these responses varies exponentially as the bridge span increases. These exponential expressions can be given by fitting as follows


These equations can be used in studies to estimate the maximum responses of a VPBI system when the bridge span is known.
Effect of tire contact area
Considering five contact cases in Table 1 and parameters of the vehicle, pavement, and bridge in Table 5 and Table 6, dynamic responses of VPBI are shown in Figure 16 when the vehicle velocity is 90 km/h. The tire contact area from case 1 to case 4 is increased. Effect of tire contact area: (a) displacement at mid‐span of bridge, (b) variation trend of the maximum displacement, (c) acceleration of vehicle body, (d) variation trend of the maximum acceleration, (e) tire contact force, (f) variation trend of the maximum tire contact force, (g) deformation of pavement, (h) variation trend of the maximum pavement deformation.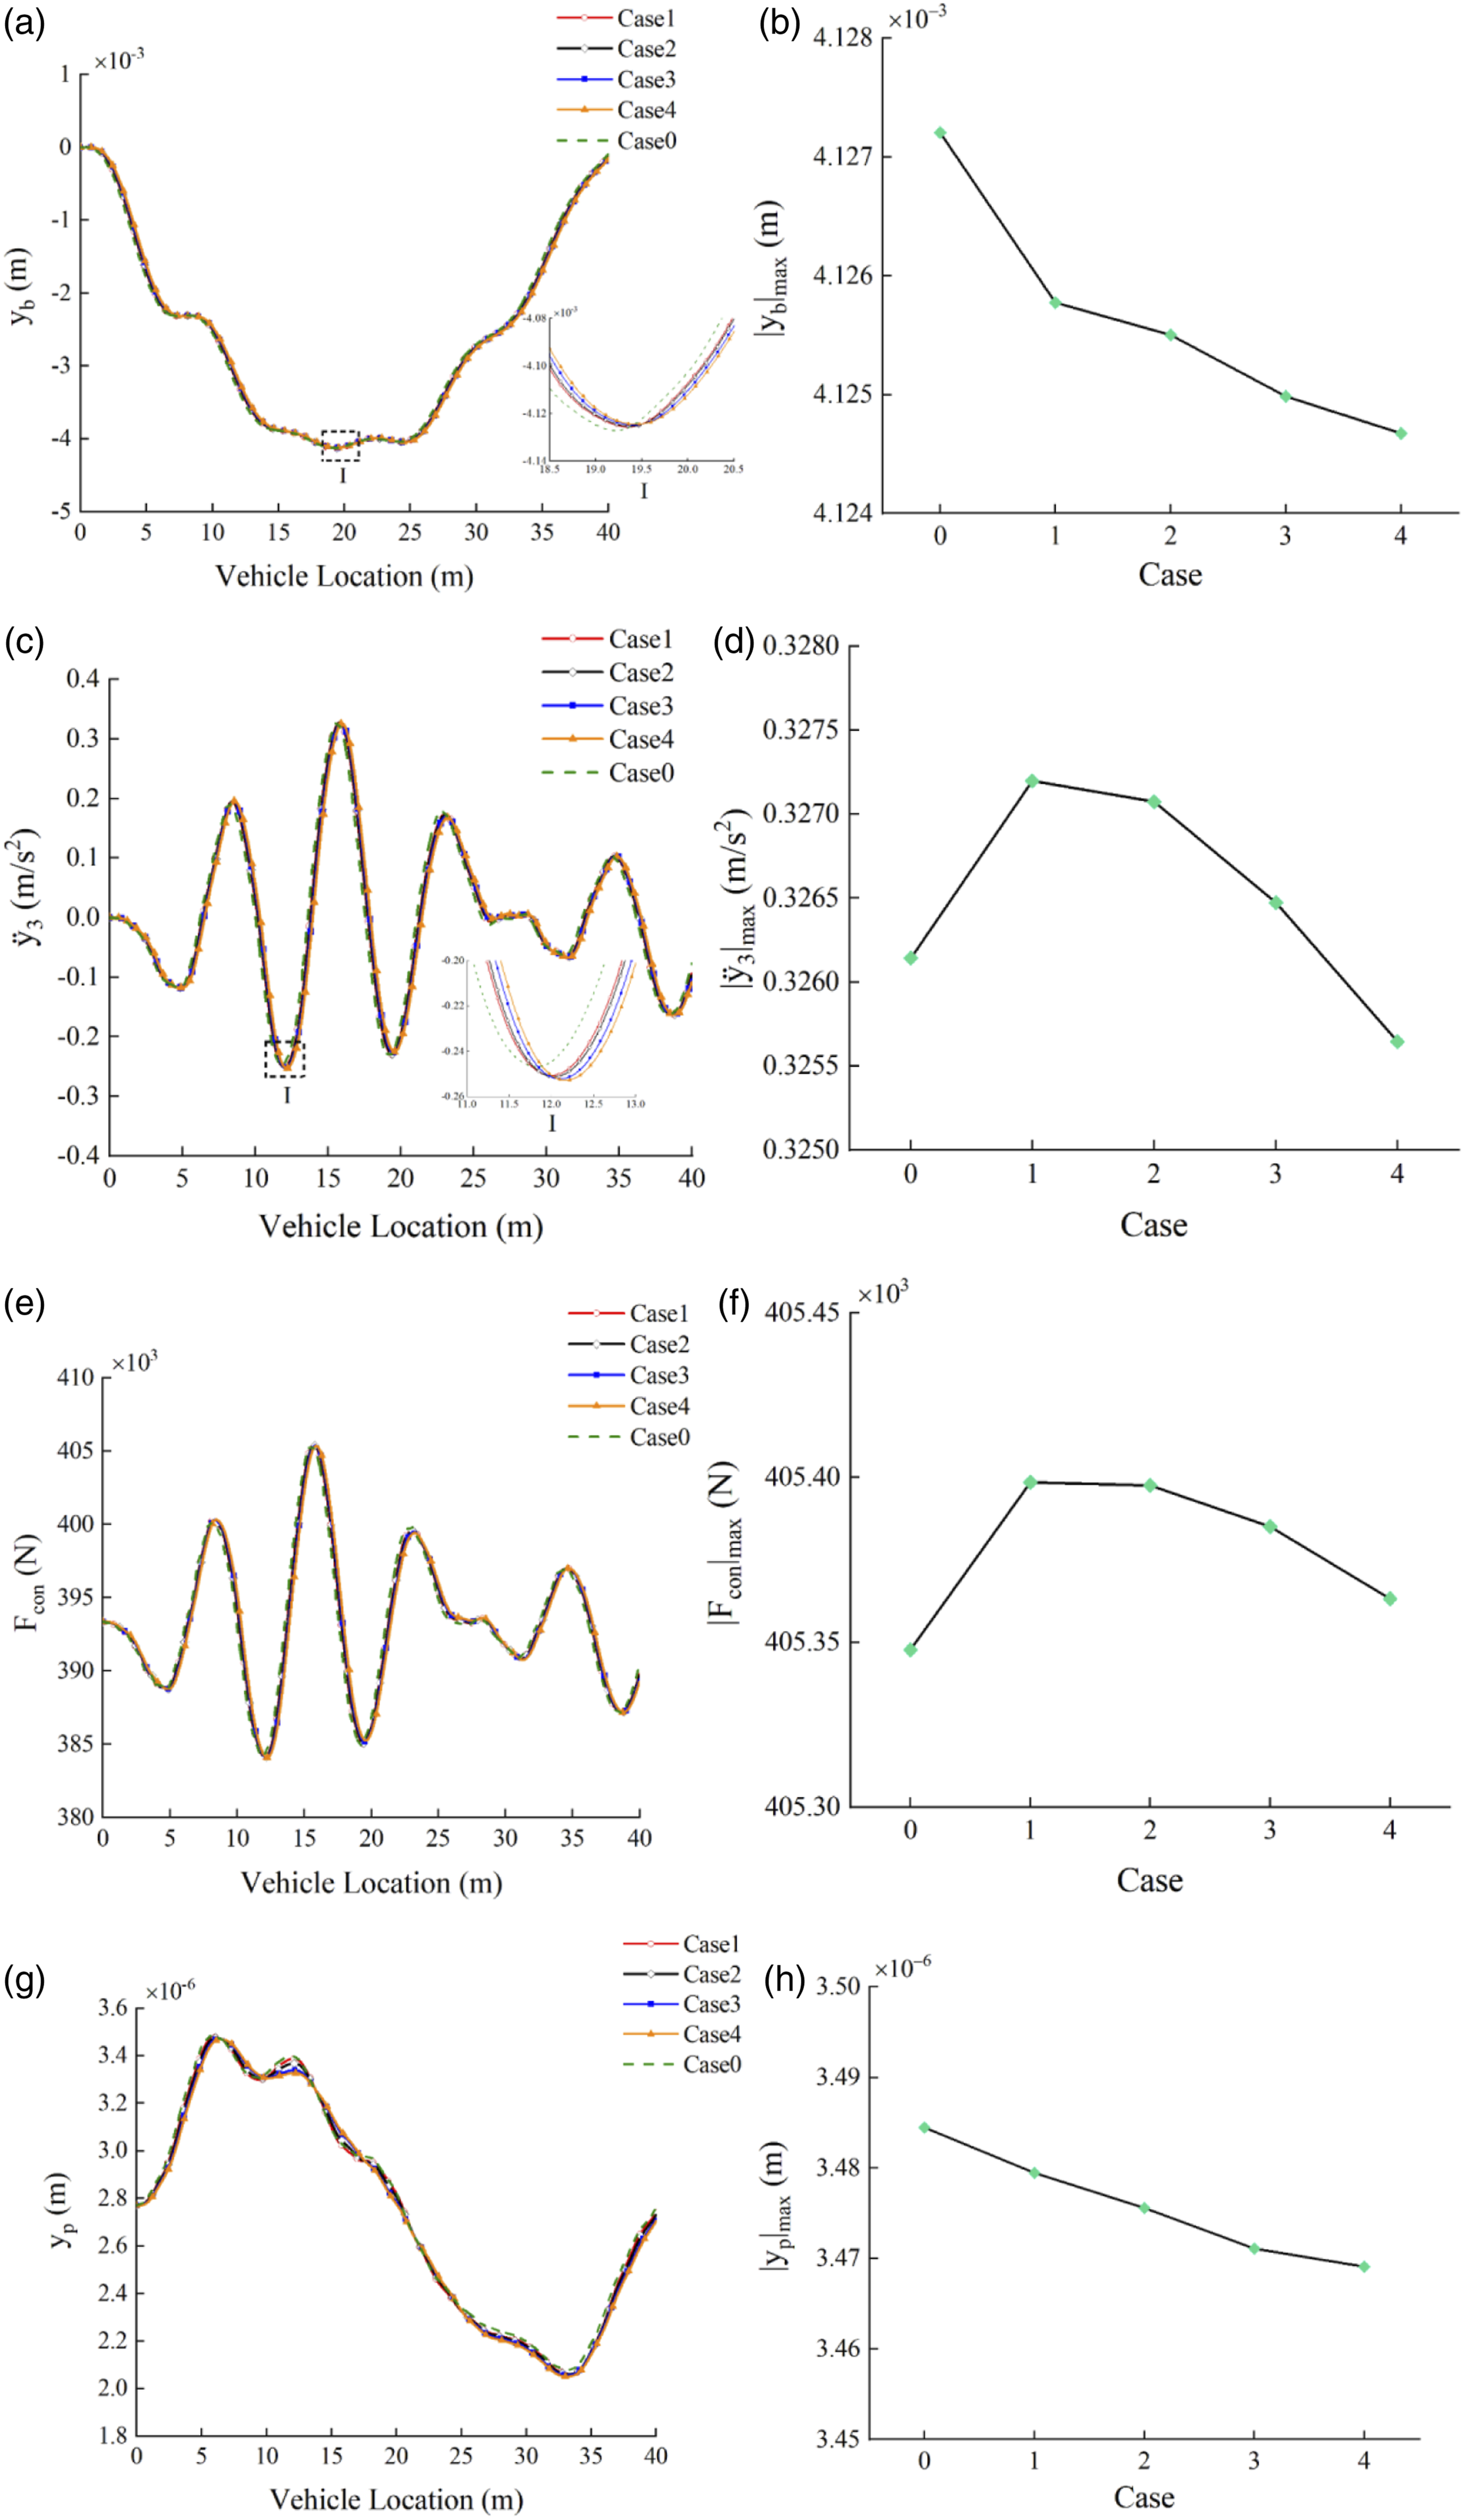
From Figure 16, the tire contact area has little effect on VPBI responses. In Figure 16 (b) and (h),
Effect of stiffness coefficient of pavement
The stiffness coefficient Kp=1.813×10¹² Effect of stiffness coefficient: (a) displacement at mid‐span of bridge, (b) variation trend of the maximum displacement, (c) acceleration of vehicle body, (d) variation trend of the maximum acceleration, (e) tire contact force, (f) variation trend of the maximum tire contact force, (g) deformation of pavement, (h) variation trend of the maximum pavement deformation.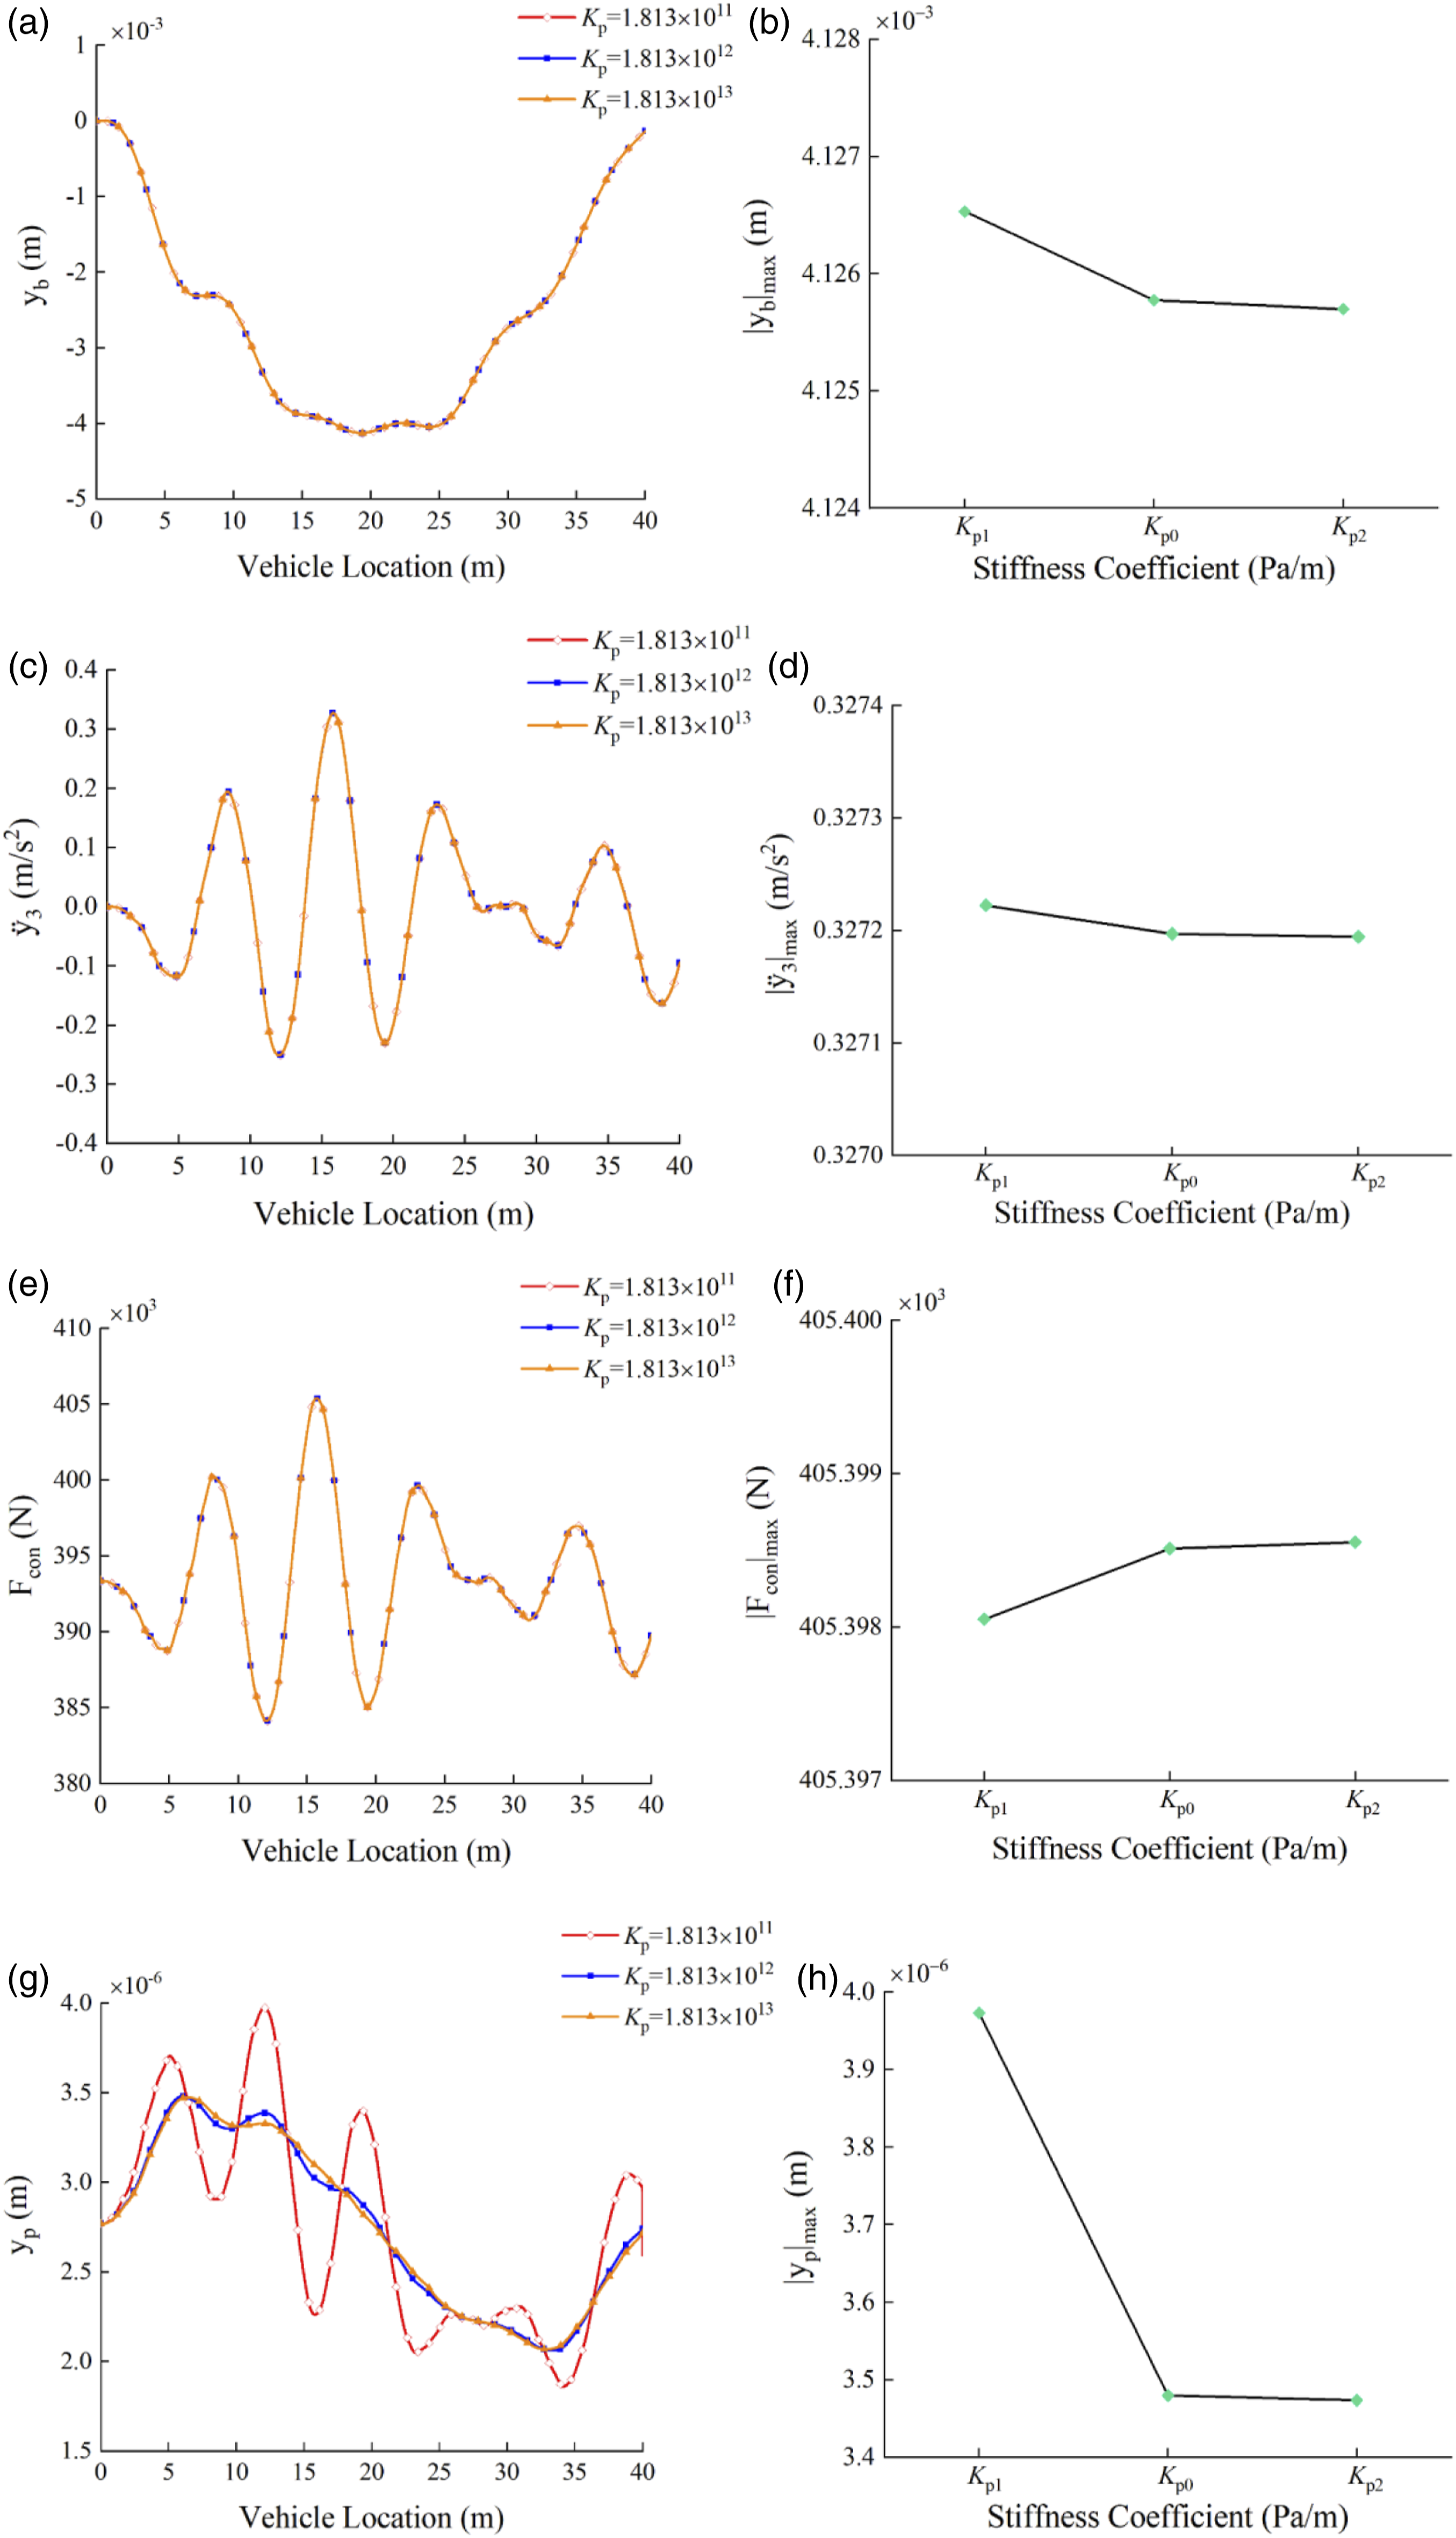

The relative differences of VPBI maximum responses (K p =K p1 , K p2 ).
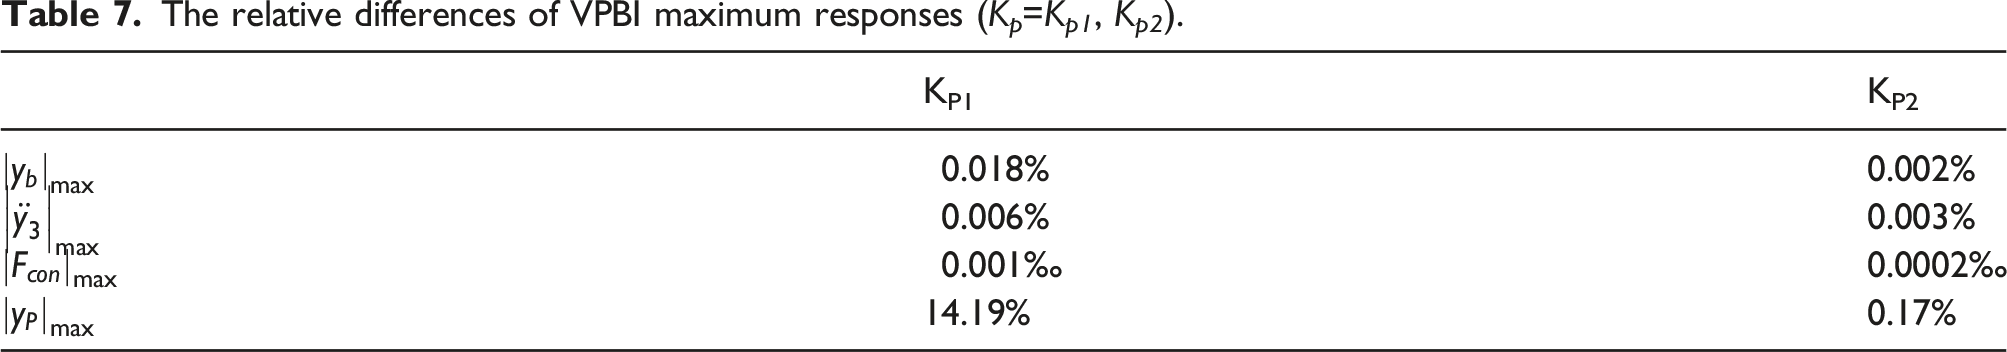
From Table 7, it indicates that the increase of stiffness coefficient can decrease pavement deformation, but the variation tends to be stable as increasing stiffness coefficient.
Effect of damping coefficient of pavement
Like the analysis about stiffness coefficient, the damping coefficient Cp=9.436×10⁴ Effect of damping coefficient: (a) displacement at mid‐span of bridge, (b) variation trend of the maximum displacement, (c) acceleration of vehicle body, (d) variation trend of the maximum acceleration, (e) tire contact force, (f) variation trend of the maximum tire contact force, (g) deformation of pavement, (h) variation trend of the maximum pavement deformation.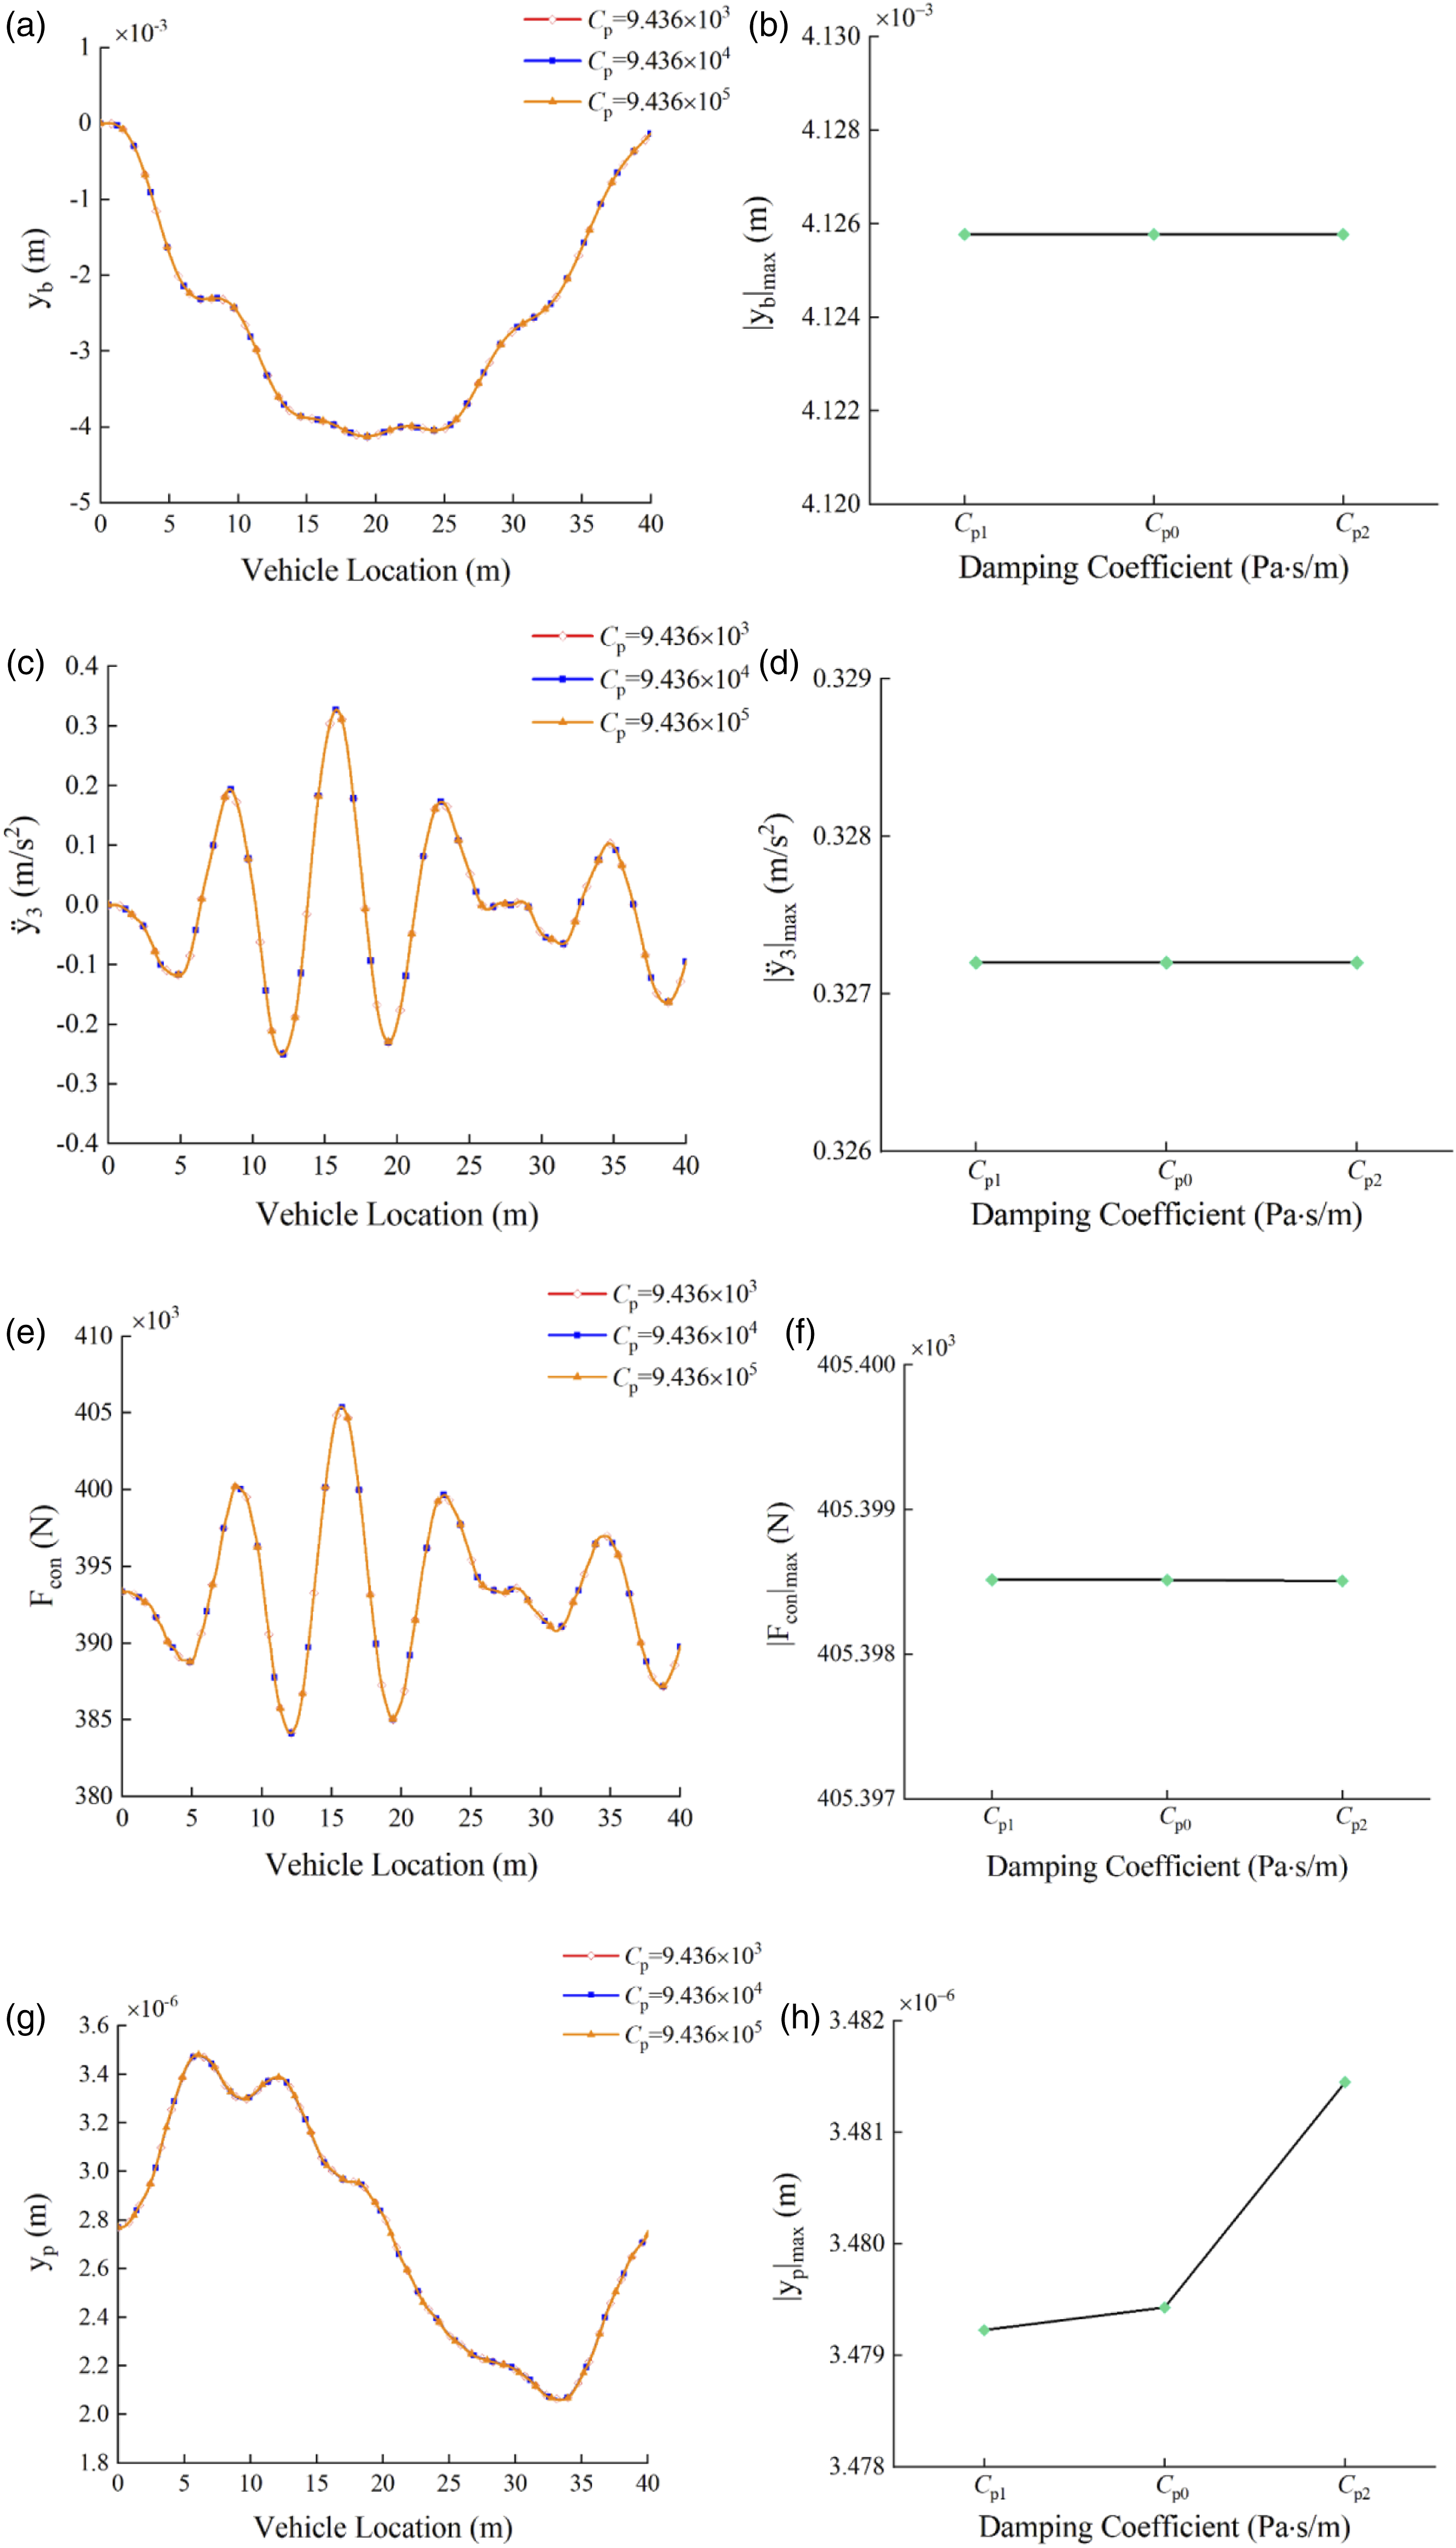
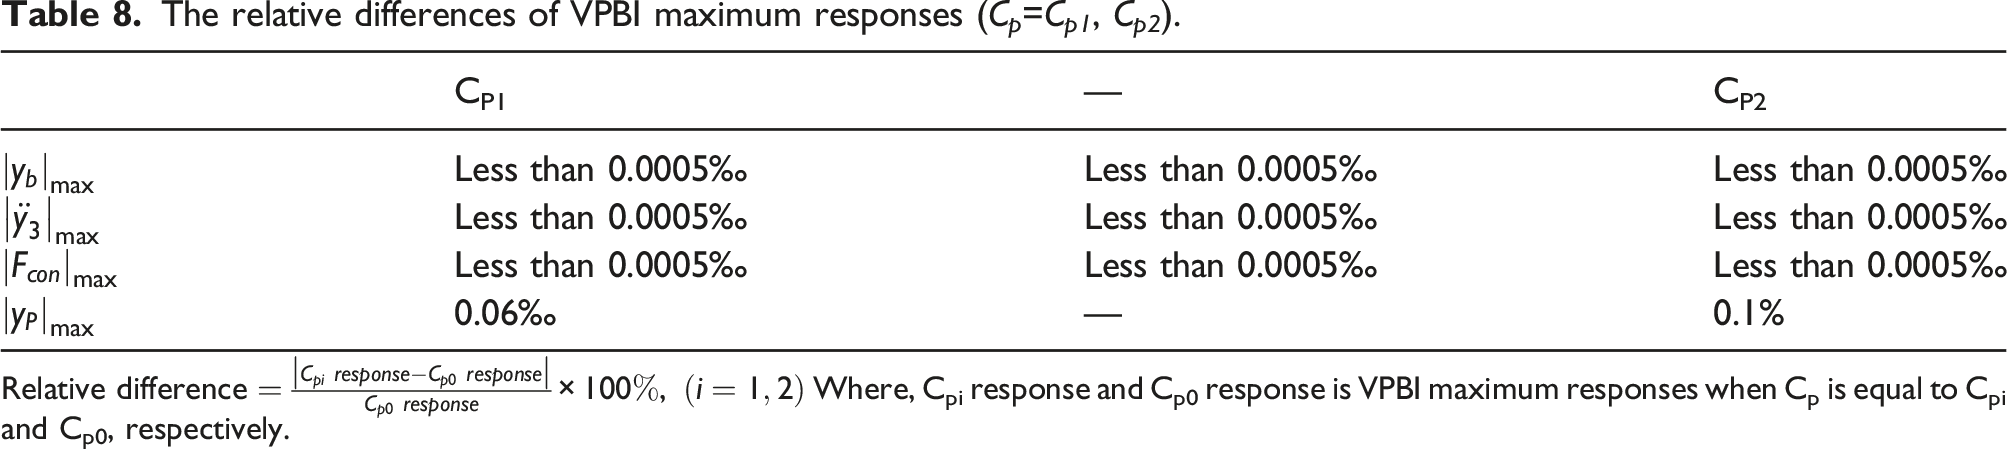
The relative differences of VPBI maximum responses (C p =C p1 , C p2 ).
Conclusions
In this study, a novel VPBI system model and its motion equations were proposed. Particularly, the pavement was modeled by continuously and uniformly distributed spring-dampers. The equivalent stiffness coefficient and damping coefficient of pavement are determined by DMA test and FEM based on a RPAP model. And the responses of VPBI system and VBI system were also compared. Furthermore, the effect of vehicle velocity, bridge span, tire contact area, pavement stiffness coefficient, and pavement damping coefficient on the VPBI system was analyzed. The major conclusions are listed as follows: (1) The pavement has slight effect on the responses of vehicle and bridge in VBI system. (2) During the vehicle passing through the bridge, pavement is compressive and its deformation first increases, then decreases, and finally increases again. The deformation fluctuates around the initially static deformation of pavement in the form of a sine wave. (3) Responses of VPBI system increase with the increment of vehicle velocity. The maximum acceleration of vehicle body and the maximum tire contact force increase linearly. The maximum displacement of the bridge and the maximum deformation of the pavement tend to decrease first and then increase within higher vehicle velocity. (4) Bridge span has significant effect on dynamic responses of VPBI system. The maximum response increases exponentially with the increment of bridge span. (5) The increase of tire contact area can reduce dynamic responses of VPBI system. Moreover, the effect of tire contact area on pavement deformation is the most obvious. (6) The pavement stiffness coefficient has slight effect on bridge displacement, acceleration of vehicle body and tire contact force. However, it has significant effect on pavement deformation. The increase of stiffness coefficient can reduce pavement deformation to a certain extent. (7) The pavement damping coefficient has almost no effect on bridge displacement, acceleration of vehicle body, and tire contact force. However, a larger damping coefficient can slightly increase the pavement deformation.
All the findings above can serve as a practical guide for bridge health monitoring. In the future, the VPBI system in this study can be expanded to three-dimension system or vehicle-continuous bridge interaction system. However, in practical engineering, asphalt mixtures, the vehicle parameters, the number of the vehicles, the bridge types, etc., all have great uncertainty. In the future, perhaps it is possible to use probabilistic approach to deal with the VPBI model uncertainty to find the rules and improve the robustness of the proposed model. In addition, in-lab model experiments and real bridge experiments will be carried out to verify and optimize the VPBI model in the future work.
Footnotes
Declaration of conflicting interests
The author(s) declared no potential conflicts of interest with respect to the research, authorship, and/or publication of this article.
Funding
The author(s) disclosed receipt of the following financial support for the research, authorship, and/or publication of this article: This work was supported by the National Natural Science Foundation of China (NSFC) (11972238, 11902206, 11872255), Natural Science Foundation of Hebei Province, China (A2022210007, E2022210029, A2021210009) and 2022 Hebei Provincial Department of Education Project of China (ZD2022019). The financial aid is gratefully acknowledged.