
Abstract
Through the combination of two approaches to evaluating structure change, a structural model and an unstructured model, a constructed model has been proposed in this article that evaluates structural change through the expansion of a linear model following the Hooke’s Law principle. The study has relied on the pure compression model of a structure’s concrete beam with elastic modulus (E) and has added the coefficient of viscosity resistance (C) to suggest a new evaluation method. By defining the aggregation of values of both coefficients C and E through the experimental model, the input parameters are the amplitude values of the vibration spectra and the values of frequencies based on machine learning, through which Z EC values are generated. The Z EC values determine a regression plane accumulated from the aggregation of values for both C and E. The article has introduced the Z EC concept as a useful parameter for the assessment of the quality of concrete structures by the nonlinear model with the appearance of the coefficient C. The results show that the Z EC values have expressed the distribution validity according to the structure’s differing degrees of change. Depending on the texture type and the structure status, these Z EC values will form different shapes. By implementing the actual surveys from many bridges with two types of beam structures, prestressed concrete and conjugated concrete, the Z EC values show the same development trend. On the contrary, in the case of a change in mechanical structure, the Z EC values tend to increase. This evidence proves, in regard to the process of structural change, that the larger the changes in the structure, the more pronounced the distribution of Z EC values, and the wider the distribution range. This shows that the ratio of the damping coefficient C to the elastic modulus E will become increasingly unstable as the structure becomes weaker and weaker. In the future, the results from this study can be applied in the assessment of many types of actual structures.
Keywords
Introduction
At present, in determining the changes in a structure’s mechanical properties, not only the quick acquisition of results but also the achievement of accuracy is desired. In accordance with the methods of evaluation proposed, the structure’s very small changes must be detected. In regard to research in material structure changes,1-2 in many publications, the structure of concrete materials in particular has gained much attention.3-5 Many different factors are required to evaluate the quality of concrete structures and many plans must be implemented in establishing the relationship between the changes in a concrete structure and the evaluation parameters. Studies are often divided into two main types: one is an evaluation model with structure 6-9 and the other is a model of non-structured evaluation.10-11 Each of these current research approaches include resolvable problems, but unresolved issues still exist in each.
In the structural assessment approach, the study is oriented toward the modeling of mechanical materials in order to build a theoretical model between structural characteristics and the model’s changes over time.12-13 In particular, in this type of study, the model’s tensile-compressive status of the concrete materials is the main basis during the process for evaluating their quality. The advantage of studies following this approach is that they can give relatively accurate results in determining the relationship between the system’s mechanical behavior and each cause of failure. The disadvantage of this method is that various factors causing damage to new material structures have not yet been studied for correct evaluation. These factors are often modeled to build a theoretical basis for a new structure only. The difficulty arises when using this method to model real material structures over time, in which deviation from the model may occur during the evaluation procedure.
These studies will follow the nonstructural approach,14-18 which is a point of view opposite to that of the structural assessment approach. For this method, the studies conduct an experimental analysis with the parameters of the isolated status of each mechanical system. The model following this approach is not much affected by the process of pulling-compression of the concrete material, and instead the parameters of the new experiment are utilized. Because of this, the nonlinear model can be used to evaluate the structural condition without using the mathematical model as defined in the theory. Apart from that, we are entirely able to determine the structure’s changing characteristics through measurement data. The unstructured method has the advantage of avoiding subjective mistakes during the modeling process as well as deviations in calculations. The disadvantage of the unstructured method is that it presents difficulty in locating failures and errors in the structure itself as well as in assessing the degree of failure.
As inherent in the design and operation of a structure, the weakening of a structure, especially concrete structures, always occurs in unsecured conditions. Thus, the changes that occur in a concrete structure will be dependent on time through many unforeseen factors, such as sudden changes in external forces, weather impacting the structure, and natural calamities. In the mathematical problem of determining the structure change, the model of spectrum analysis in representing the non-model structural method 19-21 and the finite element method 22-23 in representing the model structural method are widely used. Furthermore, according to developments in modern science, many methods applying wavelet algorithms,24-28 the algorithms of neural networks,29-34 and the Bayes algorithm35-36 have added value to the computational evaluation of structures. These methods can be used to accurately model the static properties and visual representations of concrete structures. However, the results of the above studies show that current research methods are focusing too much attention on the components of structural mechanics without much mention of the composition and mechanical properties of the materials. In addition to the quantitative characteristic of the hardness of the material element, the elastic modulus E is significant, 37 and an equally important quantity is the viscosity resistance as like damping coefficient C.38-41 Both components, E and C, in terms of the material mechanics, have equally significant effects on the behavior of the bearing structure. They both can change under the time period of structure exploitation and the mutual interactions with forces while the structures are bearing loads.
This manuscript combines the two approaches based on previous studies that used either the structured model or the structured non-model approach to build a new evaluation model, which is called the combined model. This new method combines the tensile-compression model and the measurements of experimental vibration signals in various types of concrete structures under the conditions of actual load operation. The study has suggested a new parameter in order to evaluate the change in a material’s mechanical properties with the following criteria: ease of data collection, reliability, and high parameter sensitivity compared to other parameters used previously for obtaining the same types of measurements. The study has relied on the structure of the concrete beam with elastic modulus E and has supplemented the coefficient of viscosity resistance C to propose this new evaluation method. A regression plane Z EC has been formed based on machine learning by determining the aggregation of coefficients C and E through the input value of the vibration amplitude and the frequency value. With the training model of the aggregation of coefficient values for both C and E, the article results can be used to estimate the mechanical change of concrete structures through a multitude of Z EC regression plane images. The proposed method promises to build a model for evaluation of the quality of concrete structures through experimentation. This easy-to-implement model aims to establish a standard of good measure for structural performance.
Theoretical basis
Model of pulling-compression concrete
The stress-strain relationship of a concrete structure is illustrated in Figure 1, as in the research,
42
and according to,
43
in which a model of the material is used to show the linear stress–strain relationship of the structure of a reinforced concrete beam with two necessary parameters: the elastic modulus of steel E
s
and the yield strength of steel f
y
. The simple stress–strain relation curve of this concrete structure has the polylinear isotropic form suggested by Kachlakev et al.,
44
with the two necessary parameters of the modulus of elasticity of concrete E
c
and the compressive strength f’
c
. This material model has used the Von Mises criterion to determine the stress threshold beyond which the concrete’s linear behavior shifts to nonlinear behavior, as shown in Figure 2, in which ε
0
is the stress in the material of the structure that corresponds to the peak of the curve and β is a material parameter that will depend on the shape of the stress-strain diagram. The relationship between stress and strain is given by equation (1a). In the case,
42
the relationship between stress and strain is given by equation (1b) Stress–strain relationship of steel reinforcement and concrete of the concrete beam
42
.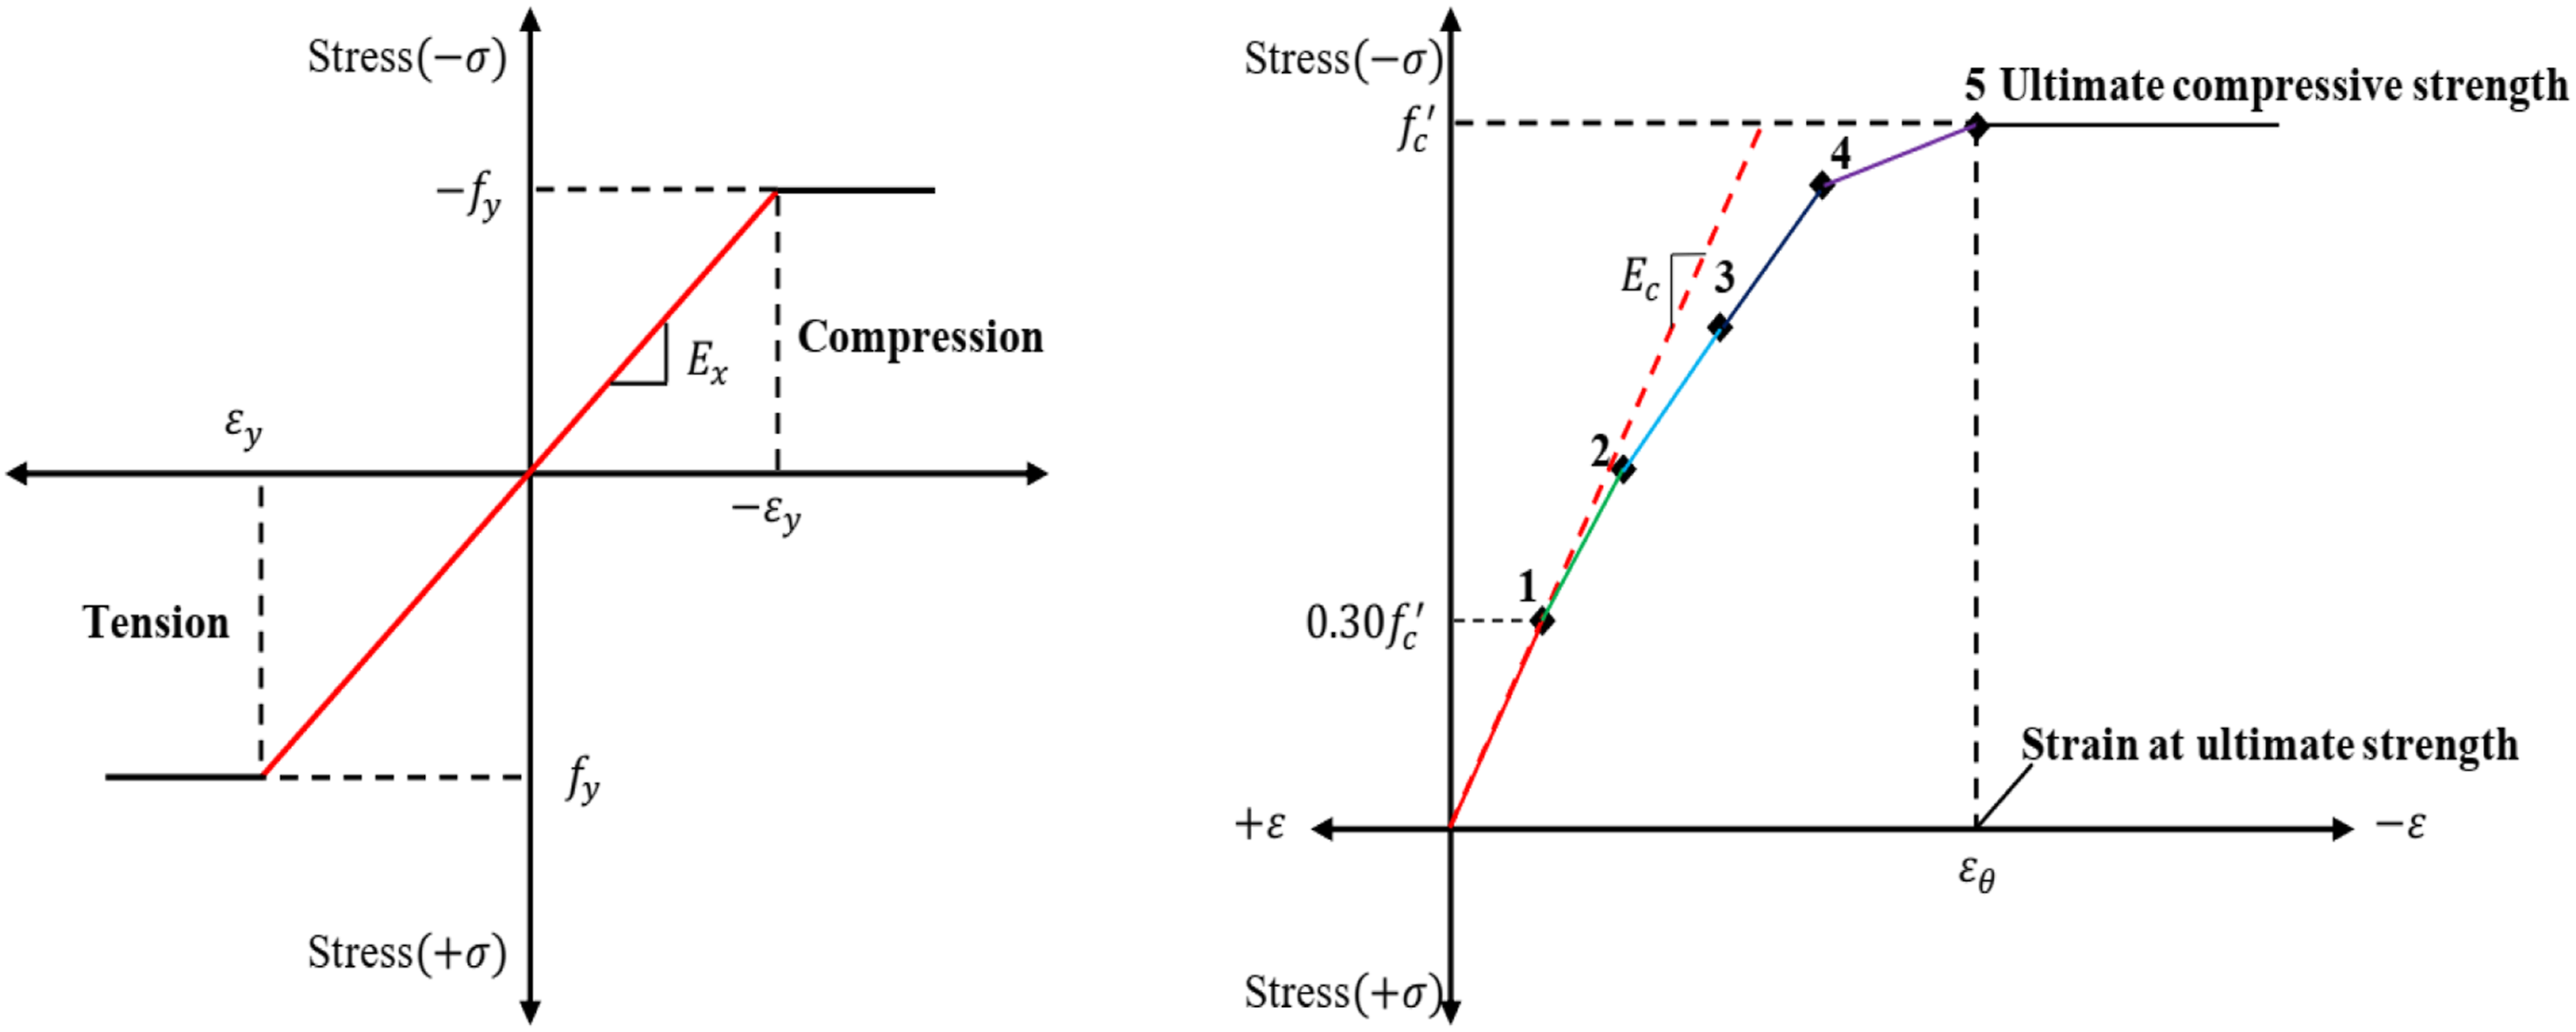
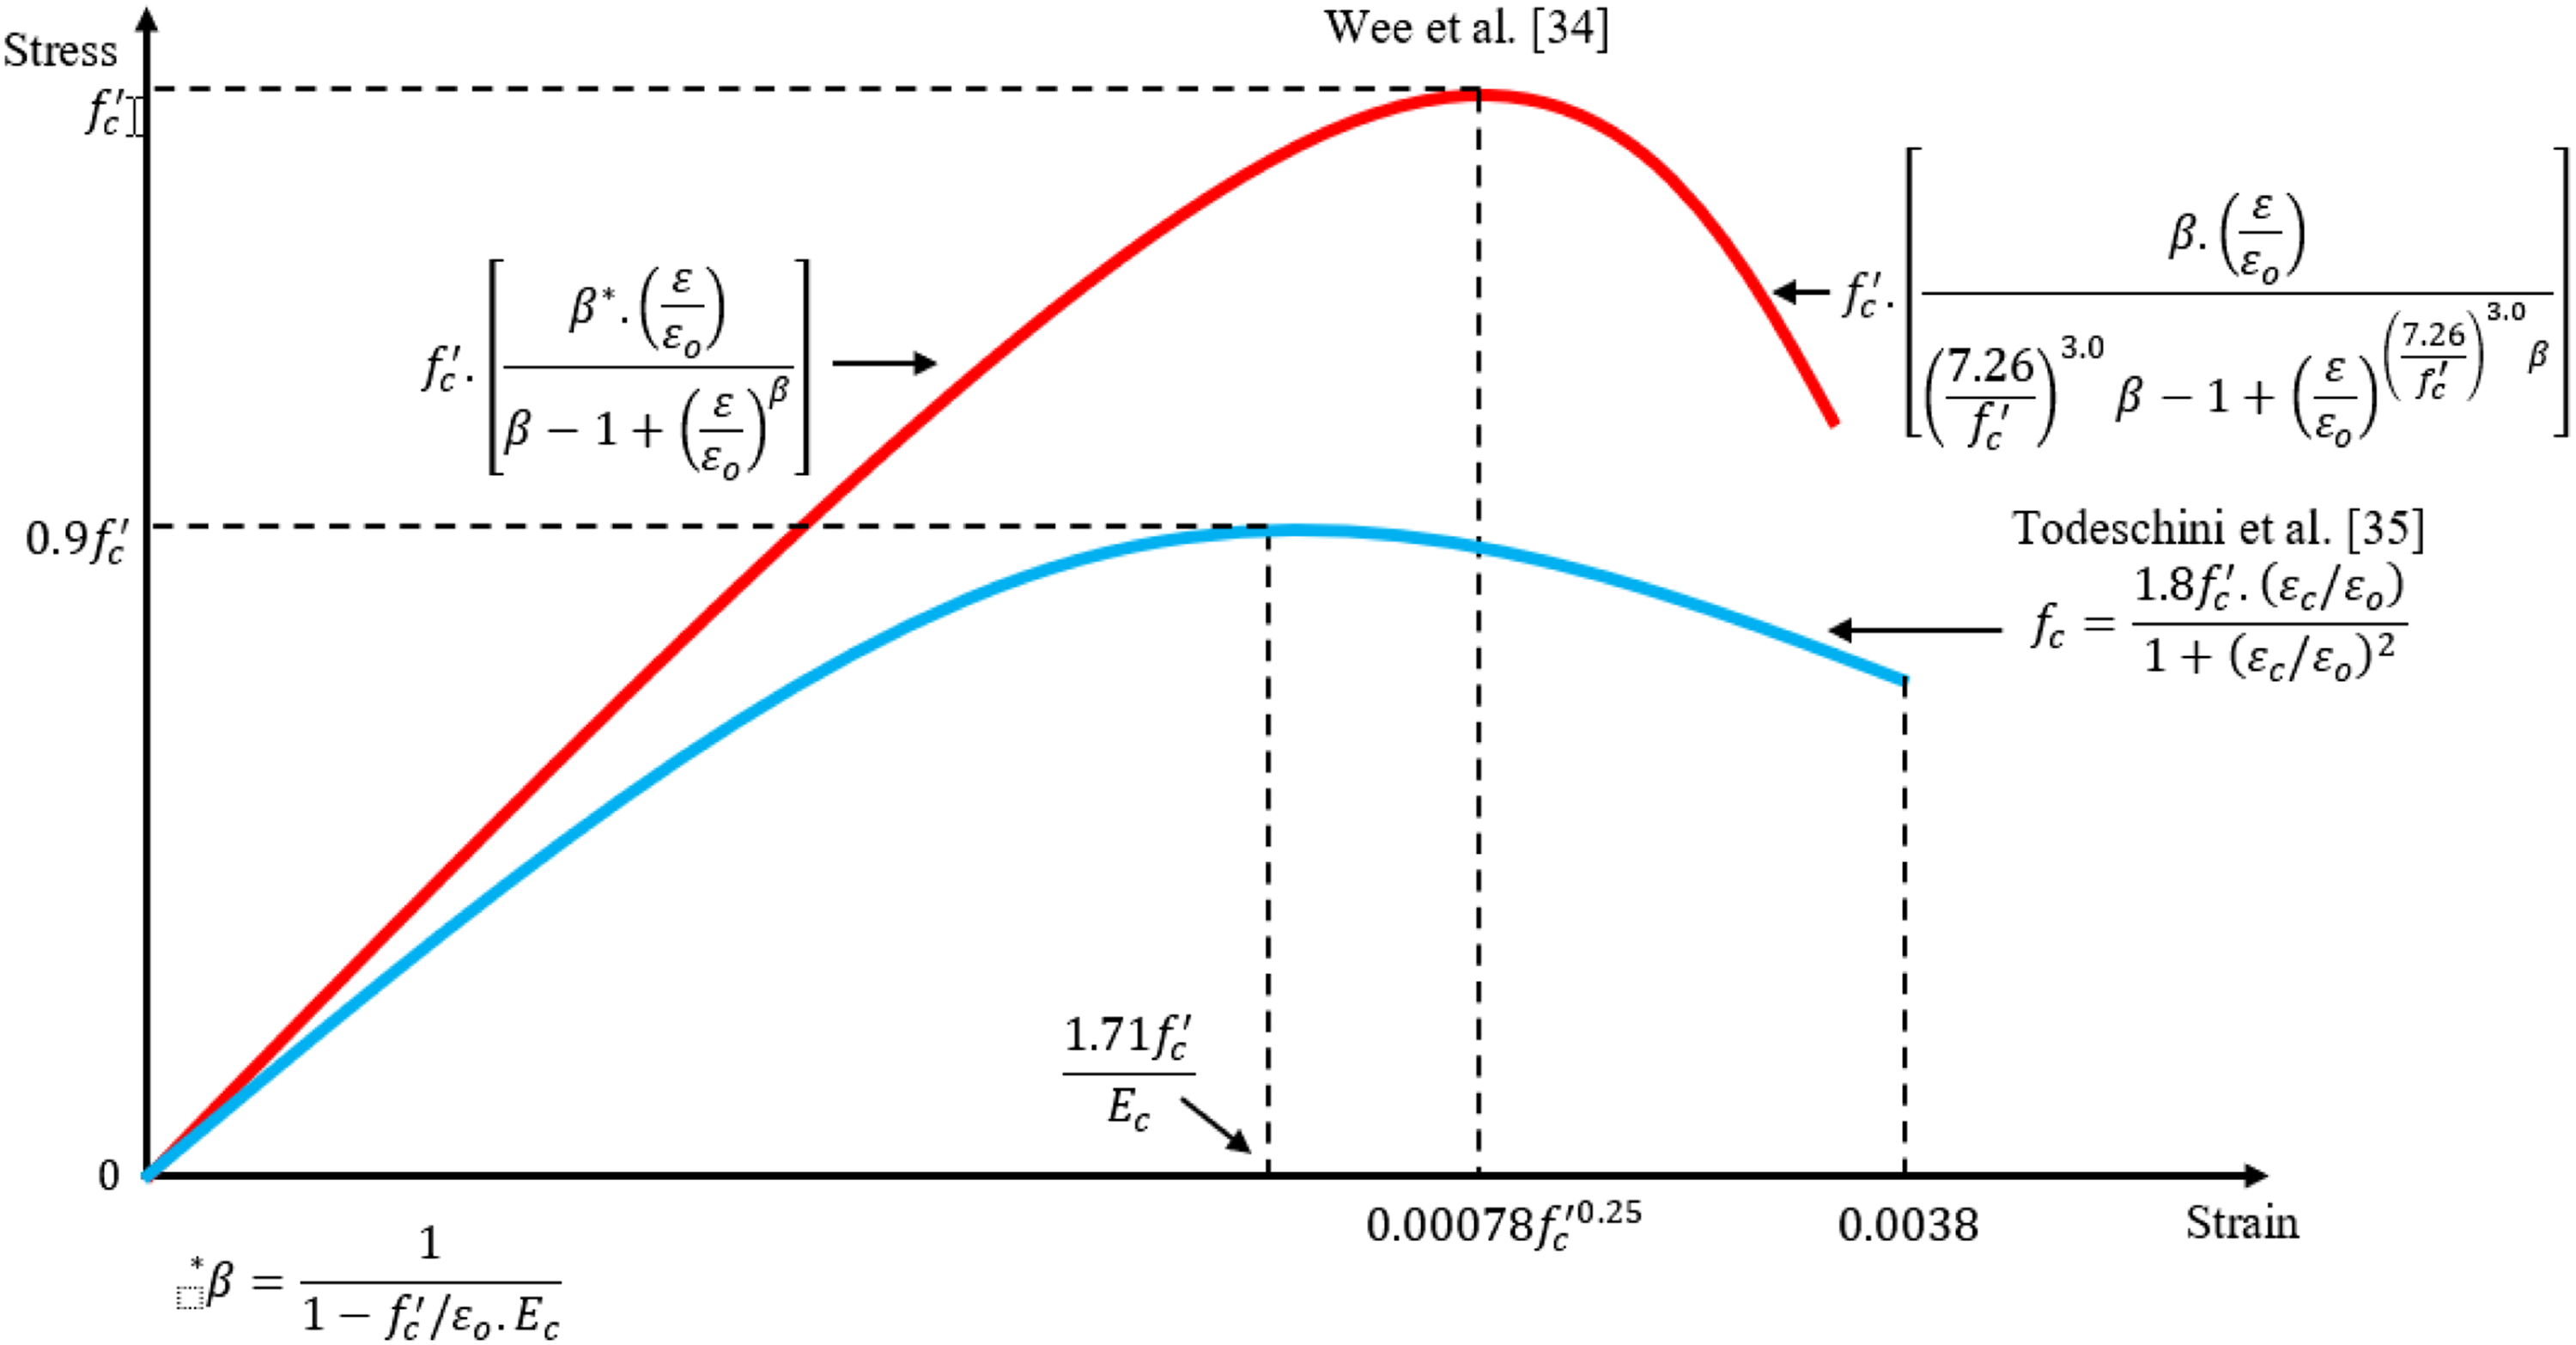


From the models,42-45 the results have shown that the relationship between stress and strain is always either a linear function during a process45,46 or is a series of linear segments whereby each line segment corresponds to a defined interval.42-43 An evaluation model can demonstrate the effects of both the elastic modulus E based on structural characteristics and the viscosity coefficient C characterizing the material properties, a model which has not yet been built.
Proposing a mechanical model
From the models mentioned above, we can see that structural changes depend on not only the mechanical properties of hardness and elastic modulus E, but also the material property of viscosity resistance C. Considering the shortcomings of previous studies,42-45 we need to add a component representing the change over time in the material property C that recognizes the corresponding change in the mechanical property E. This study has supplemented the Hooke’s Law relationship between stress σ and strain ε with the damping coefficient C to show the material’s viscous elasticity as in equation (2), in which E is the elastic modulus and C is the coefficient of viscous resistance.

Equation (2) can be considered as a method to extend the Hooke’s Law principal of equation (1).
The model investigated in this study is the concrete bridge span structure. The circulating load is mainly an applied force perpendicular to the structure. Therefore, the manuscript has modeled the structure of a bridge span into a concrete beam of a given section having length l with the boundary conditions of two single restraints with equivalent mass M
eq
, equivalent spring stiffness K
eq
, equivalent damping coefficient C
eq
, and speed v of the vibrating medium. Considering the case of a constant circulation load across the bridge, the connection model (of two interacting elastic supports) and the force on the beam are shown in Figure 3. Connection model and force on the beam.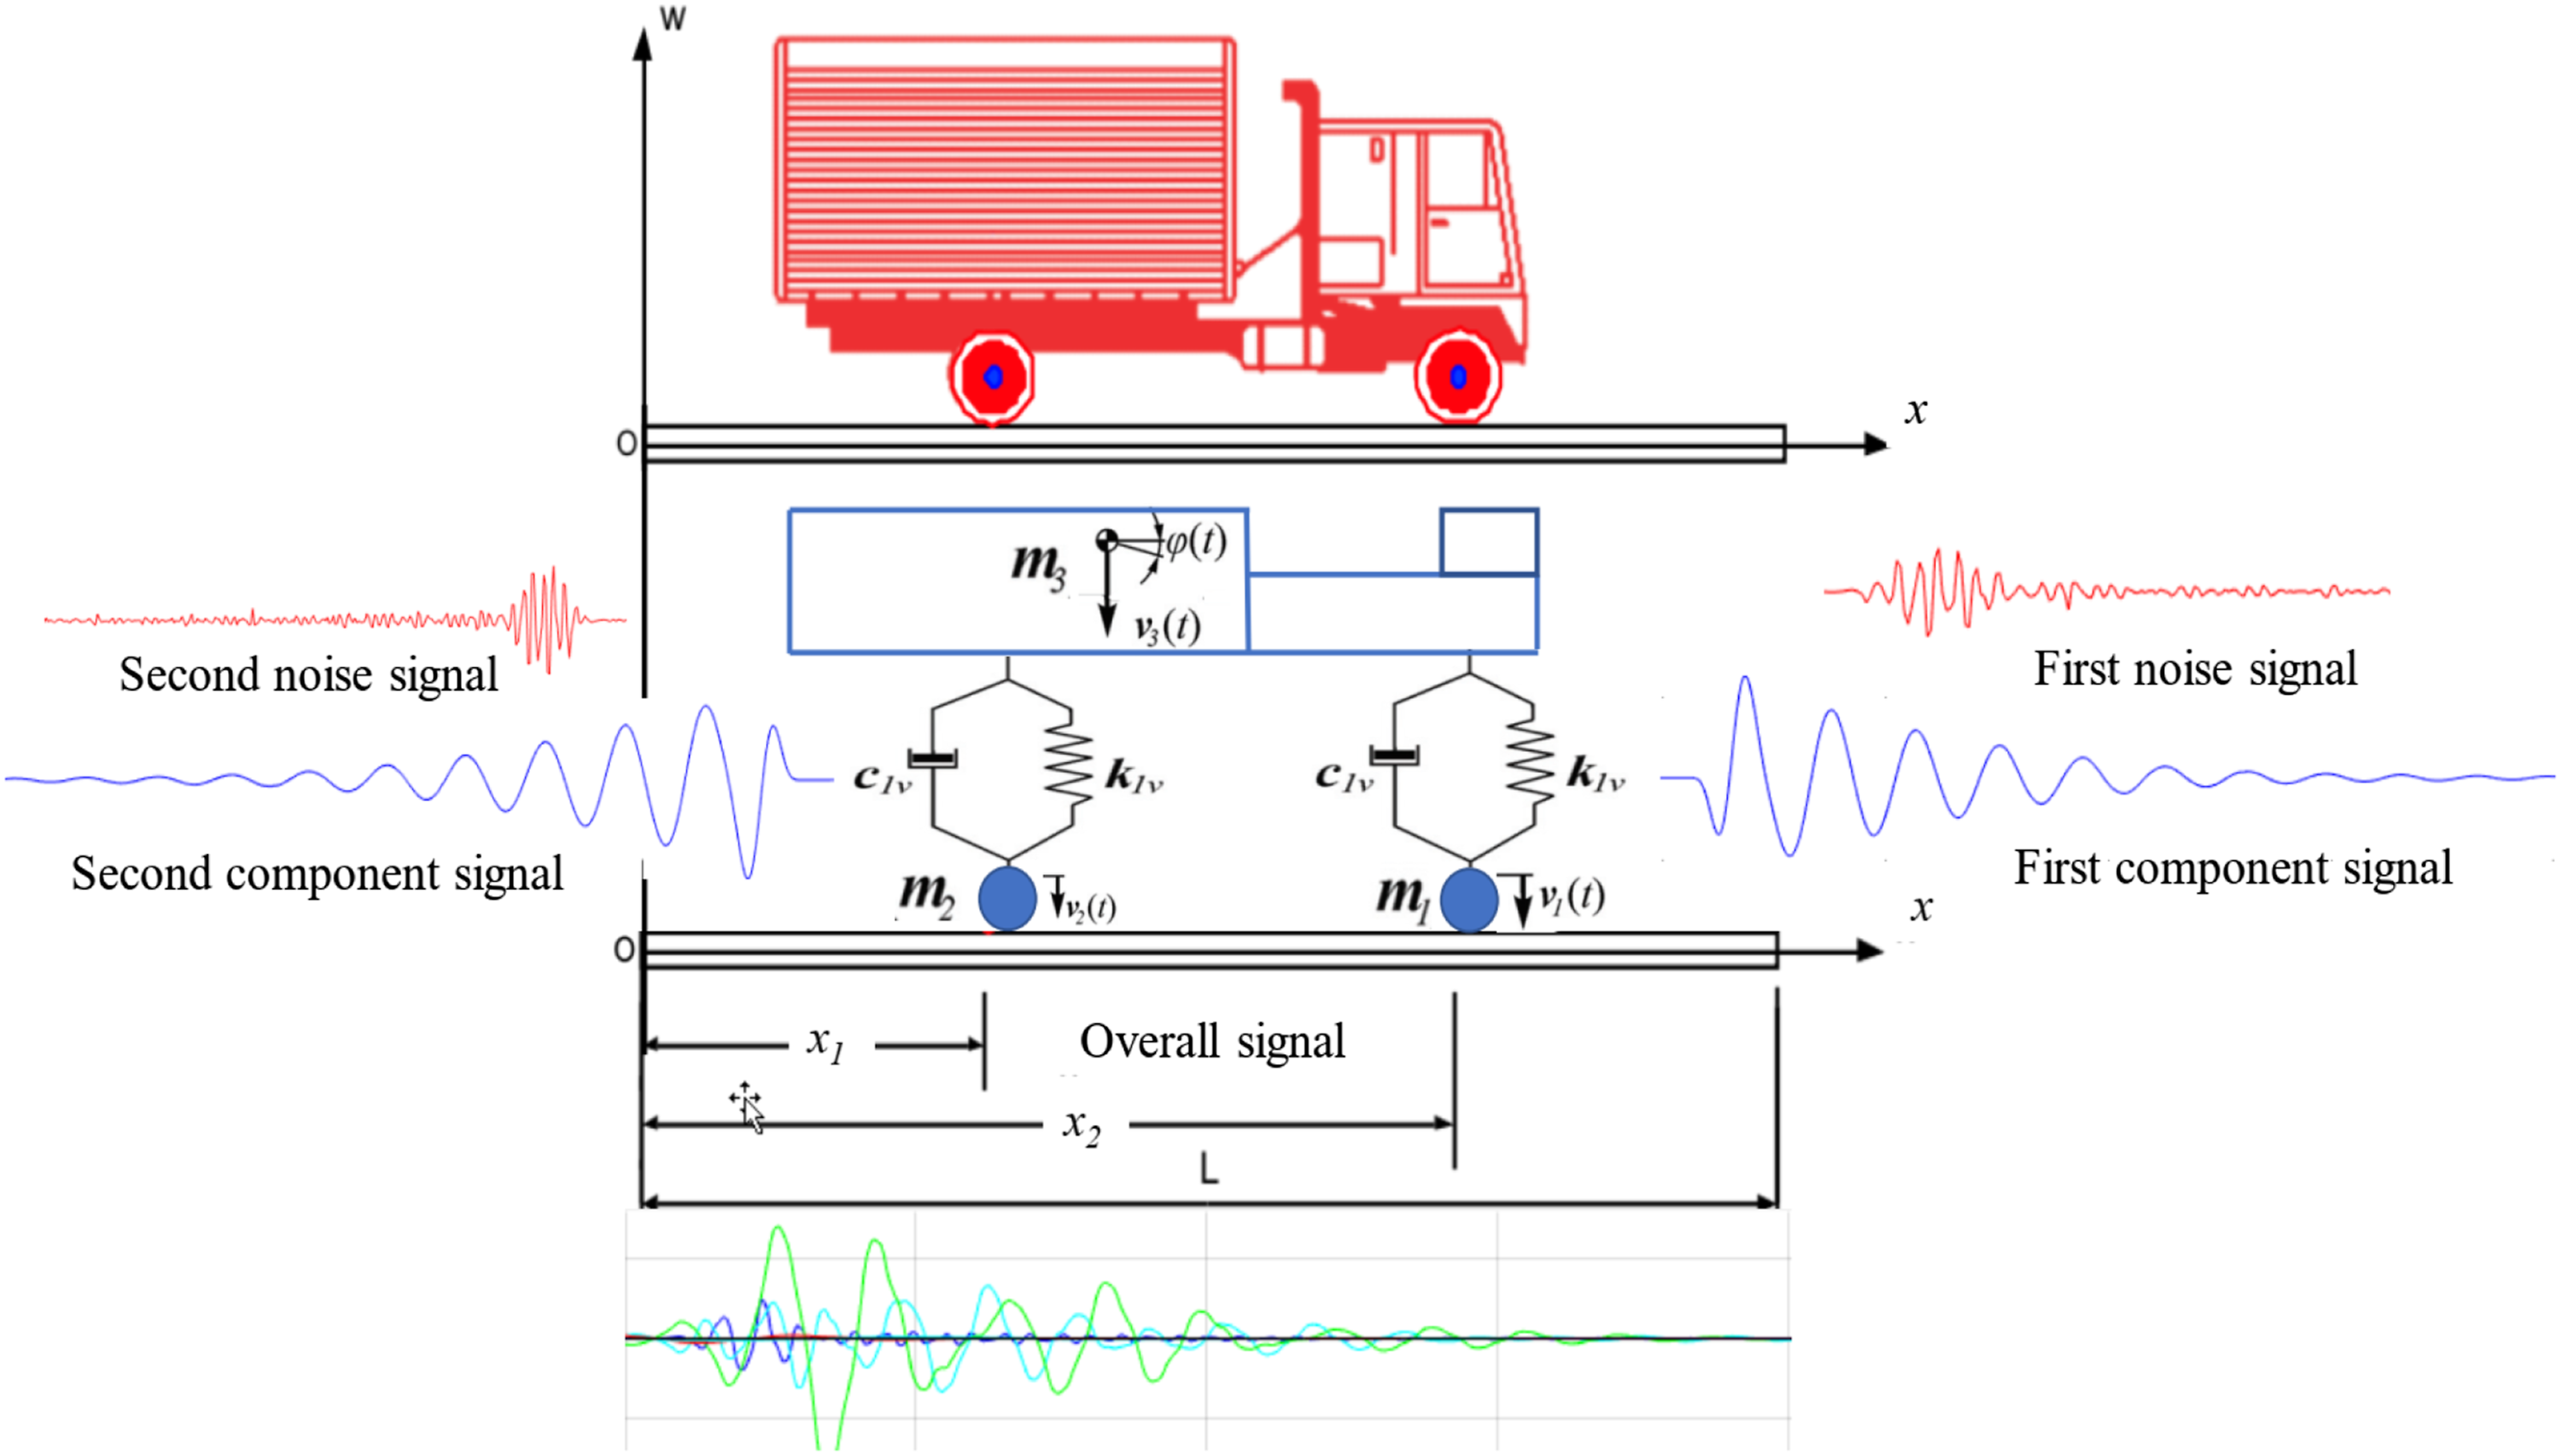
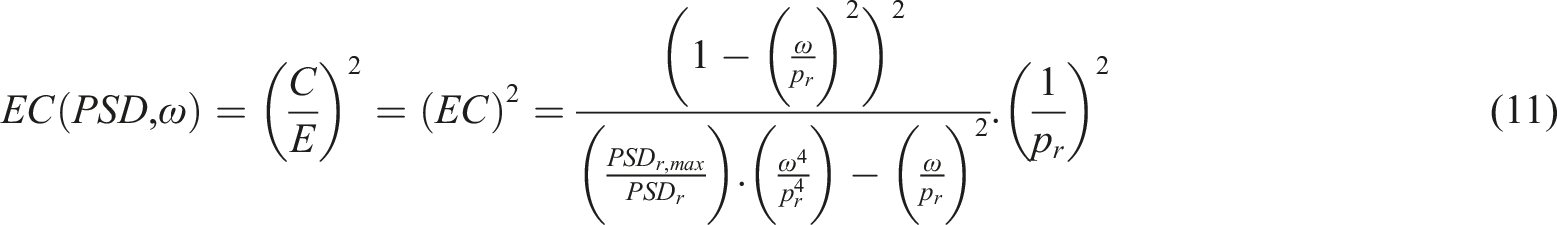
The section’s dynamic equilibrium equation at position x on the beam axis is given by the following differential equation, equation (3) Power spectra from actual vibration data for a concrete beam at different locations.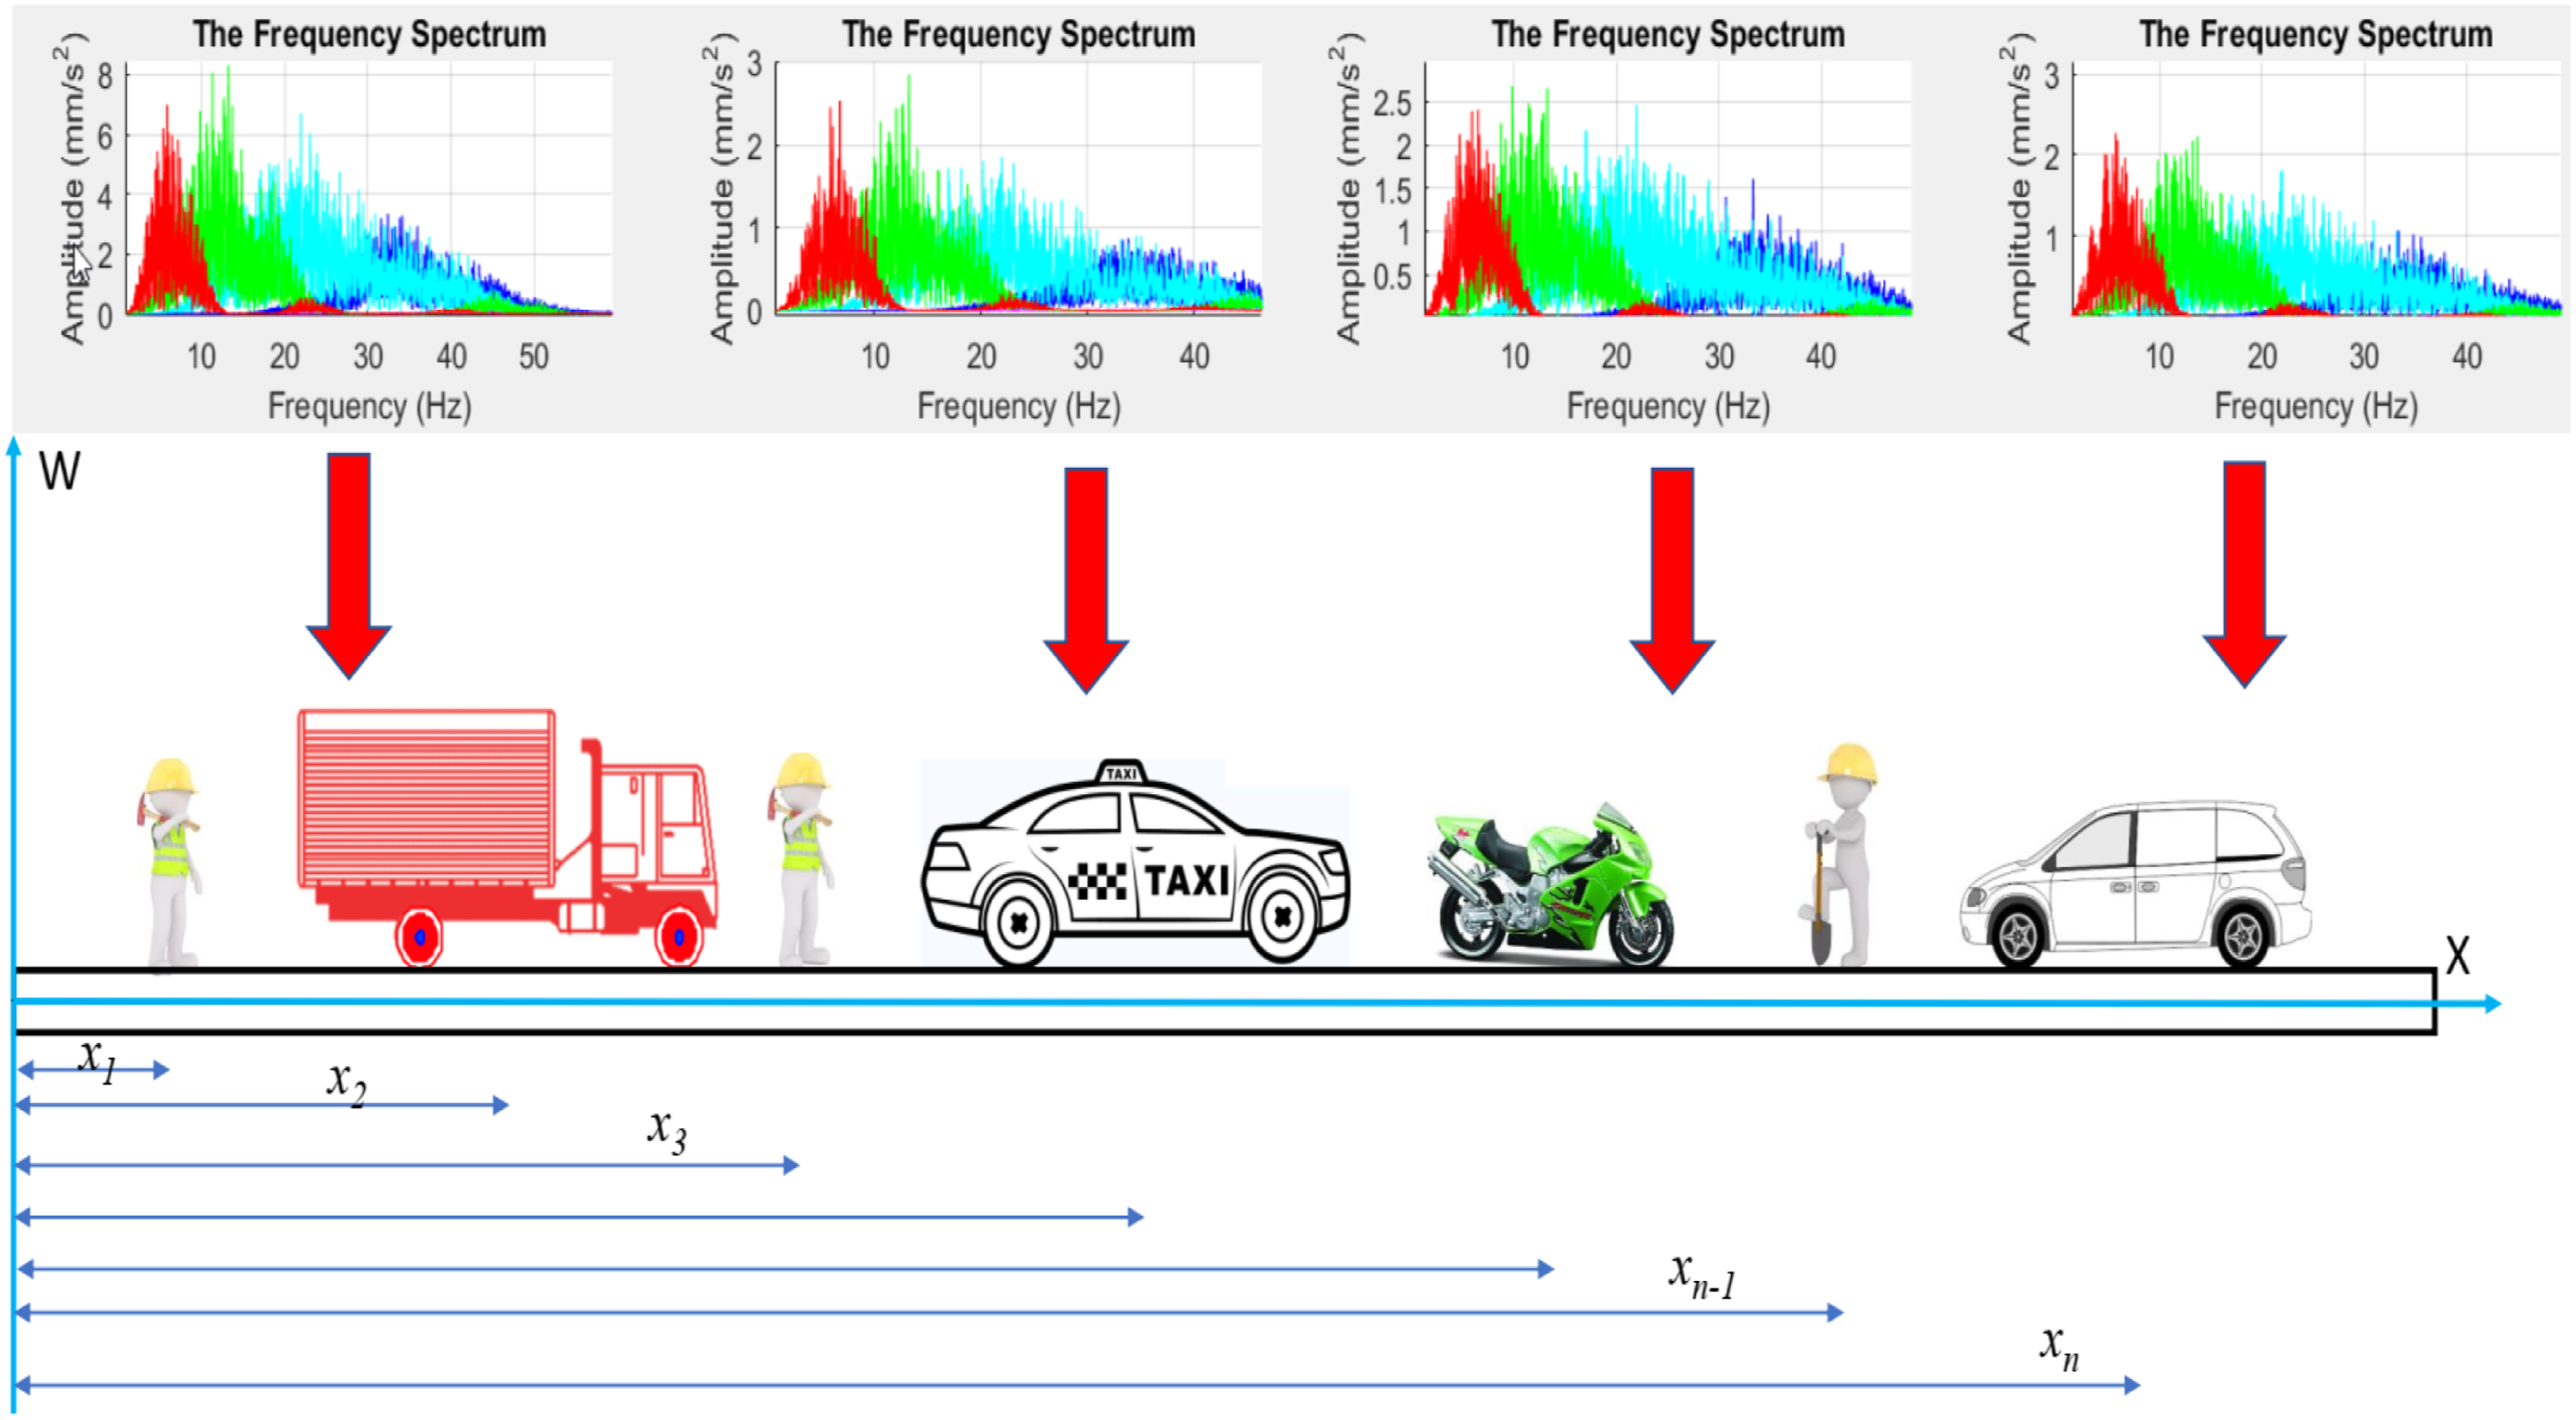

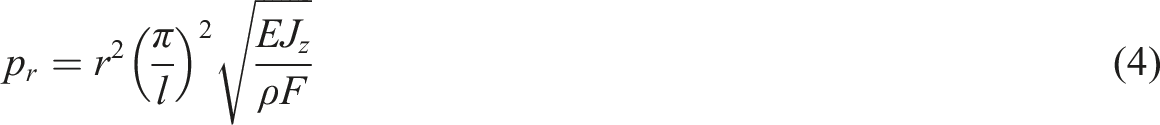
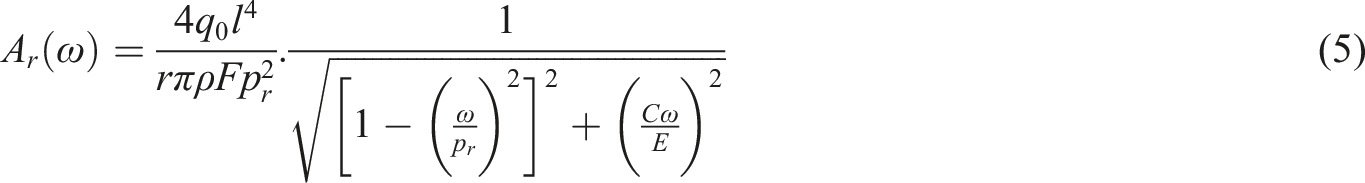

The quantity we aim to establish will show a relationship between amplitude and frequency. This quantity is related to the elastic modulus E and damping coefficient C. This article chose the coefficient EC to derive the ratio C/E, along with utilizing the parameters extracted from the vibration power spectra (
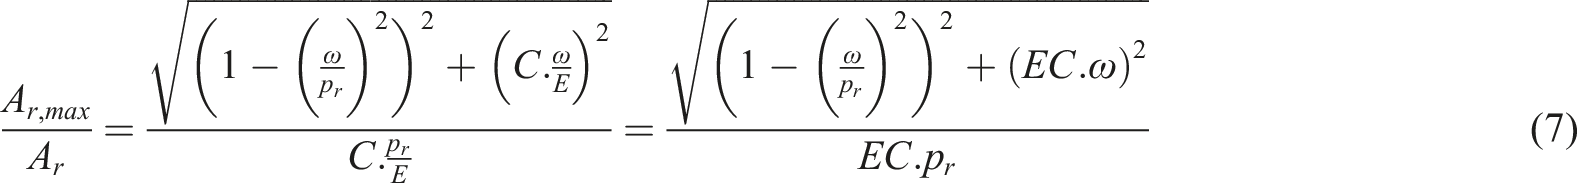
Squaring both sides of equation (7) will give
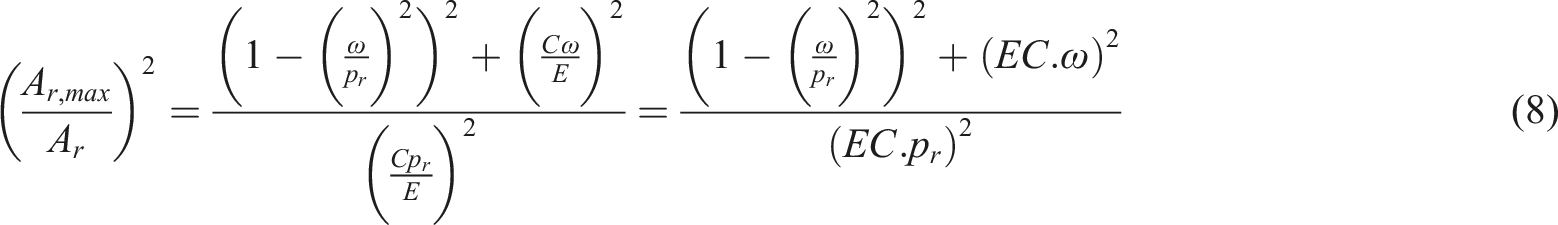
In order that equation (8) be suitable for the process of gathering and handling the signal, we need to recast equation (8) into a form containing the variables associated with the acceleration power spectrum, according to equation (9), which is an expression that serves as the basis for applying machine learning for the process of training the value of C.

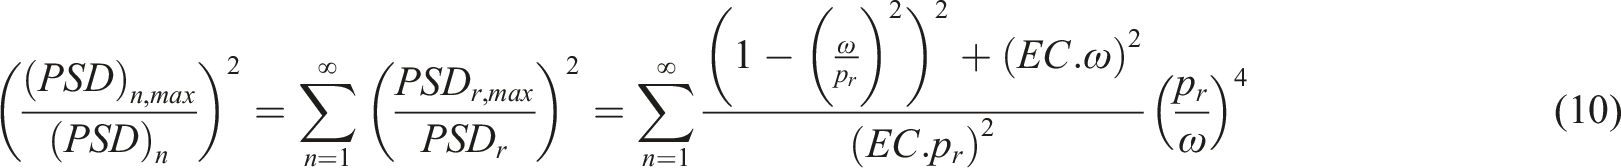
Equation (10) fully covers the parameters extracted from the power spectra of vibration. From there, we transform equation (10) into equation (11), in which EC indicates the change in the working quality of the concrete structure. The coefficient EC will be a quantity that satisfies the need to apprehend the process of the changing characteristic values of the vibrating structure.
Basis of machine learning in training
Input: frequency f, PSD, created by equation (11) and Figure 5 Input of machine learning.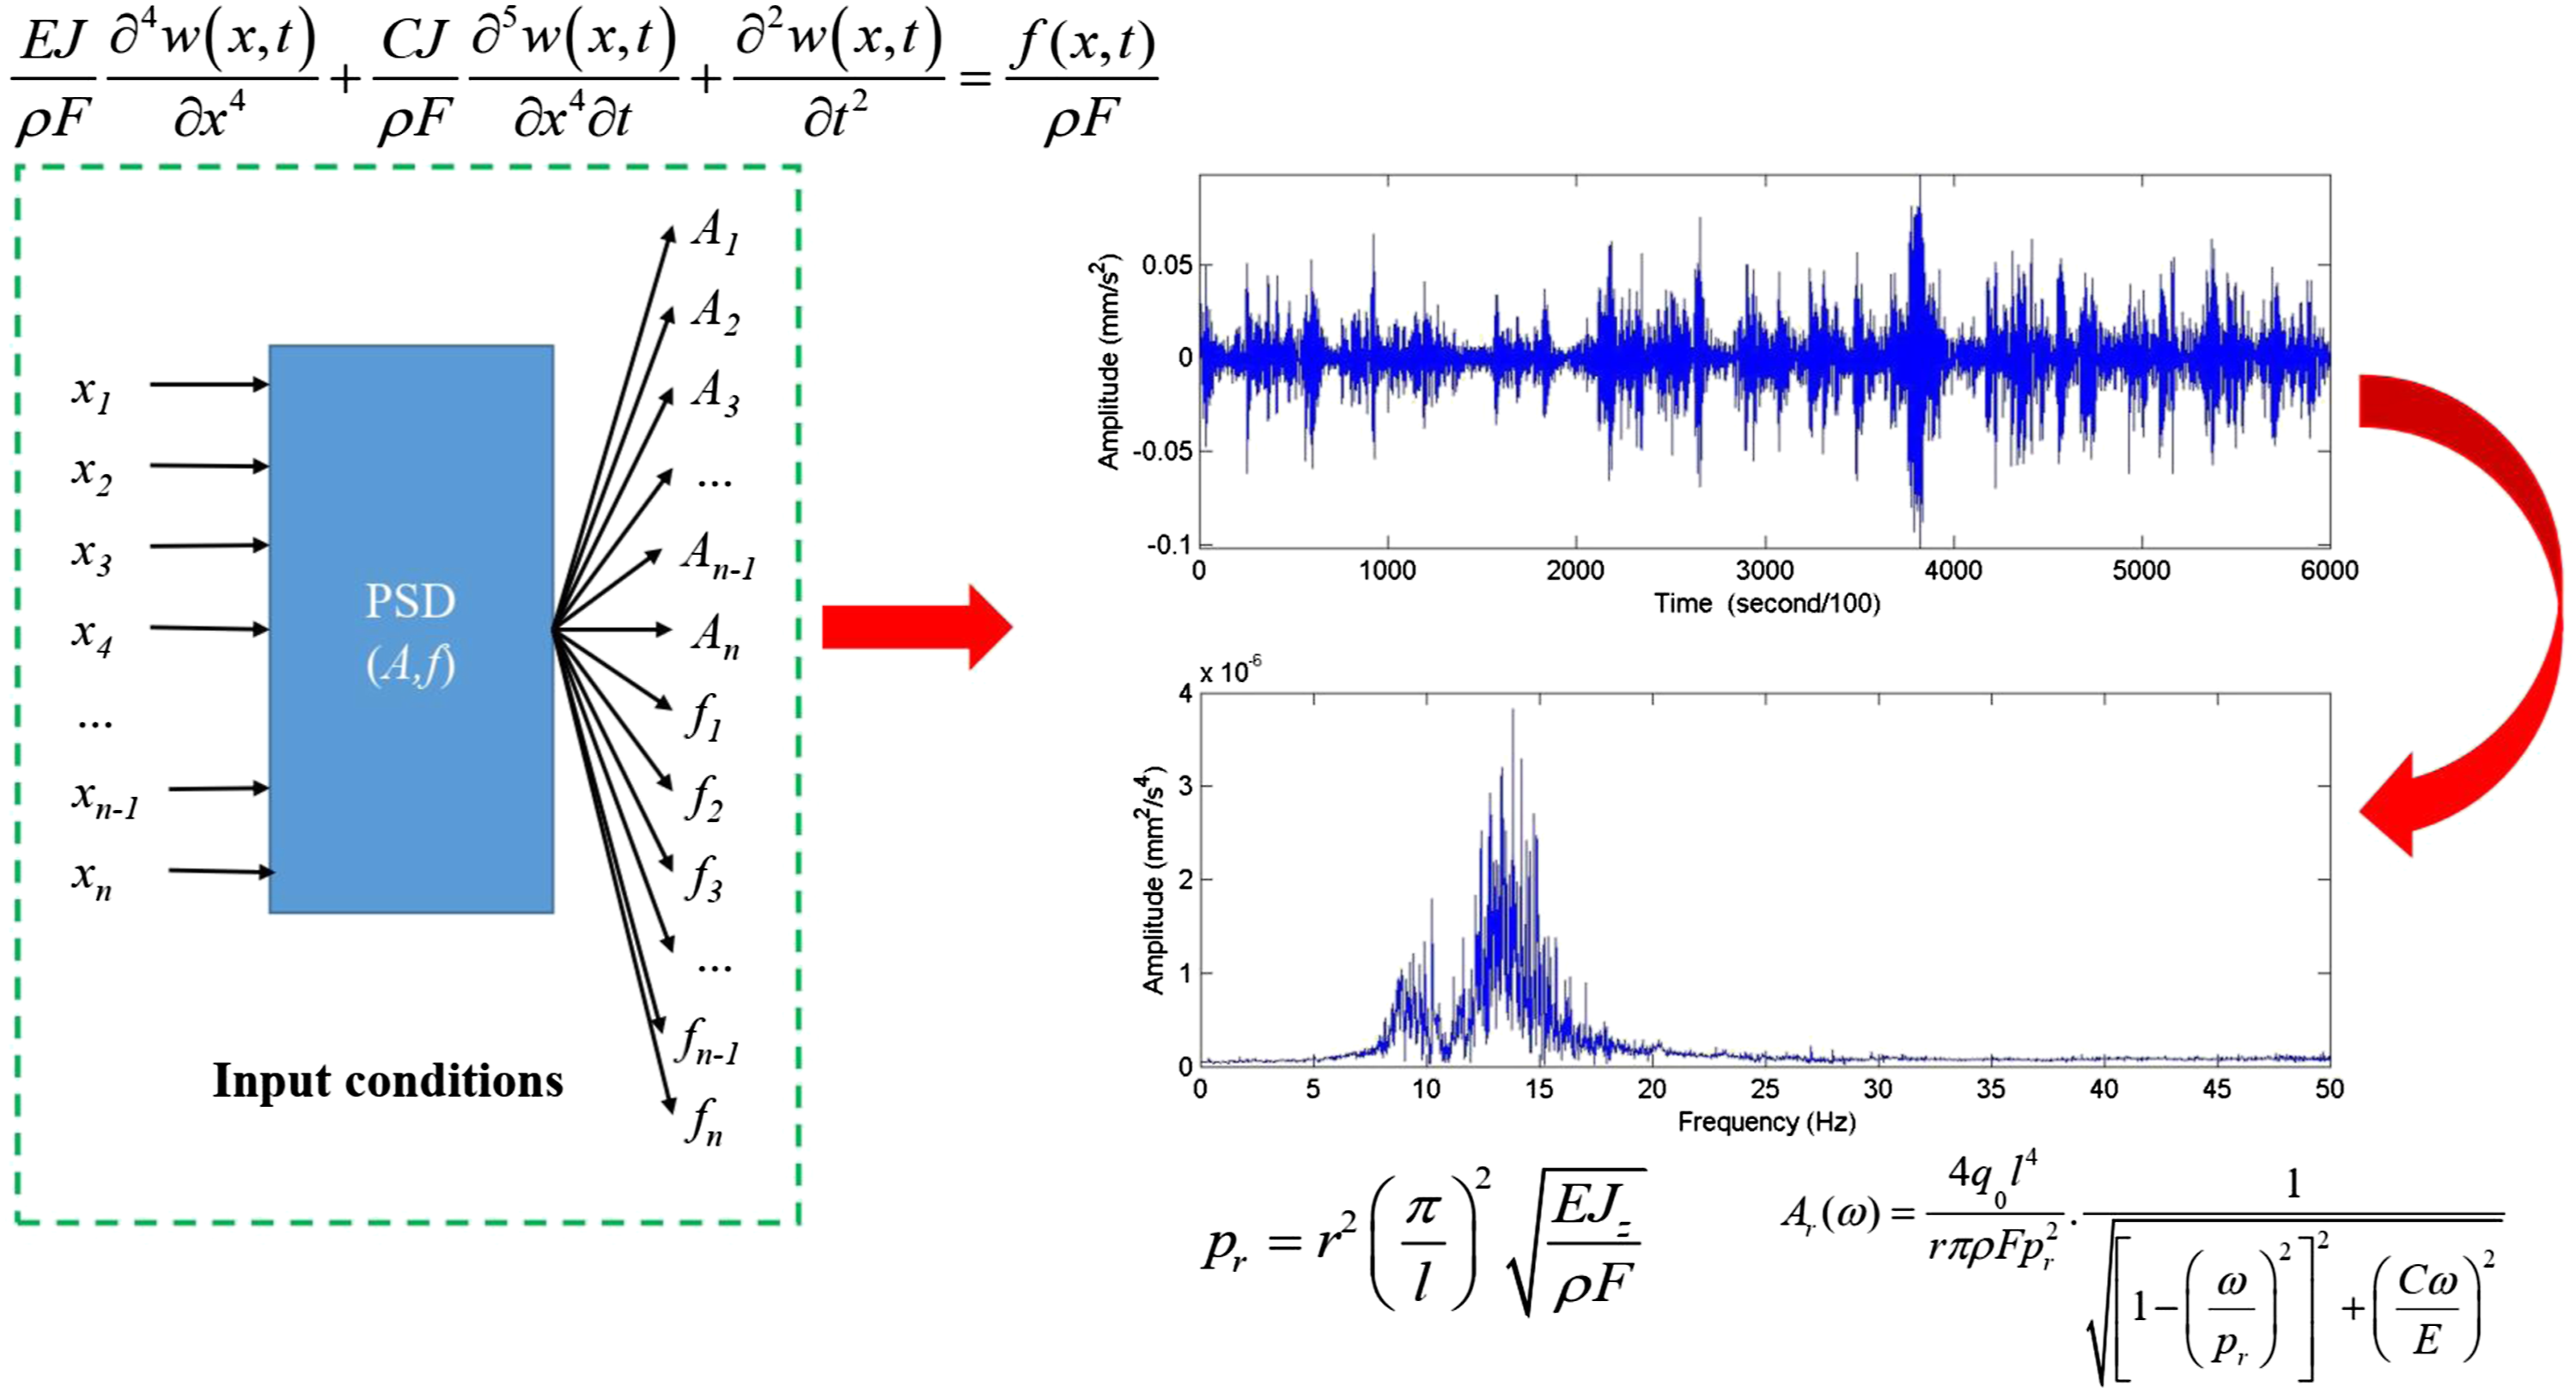
Hidden class: created by Function, Robust regression, Goodness of fit, shown by the formulas (12-22), and illustrated in Figure 6 Model of EC indicator training.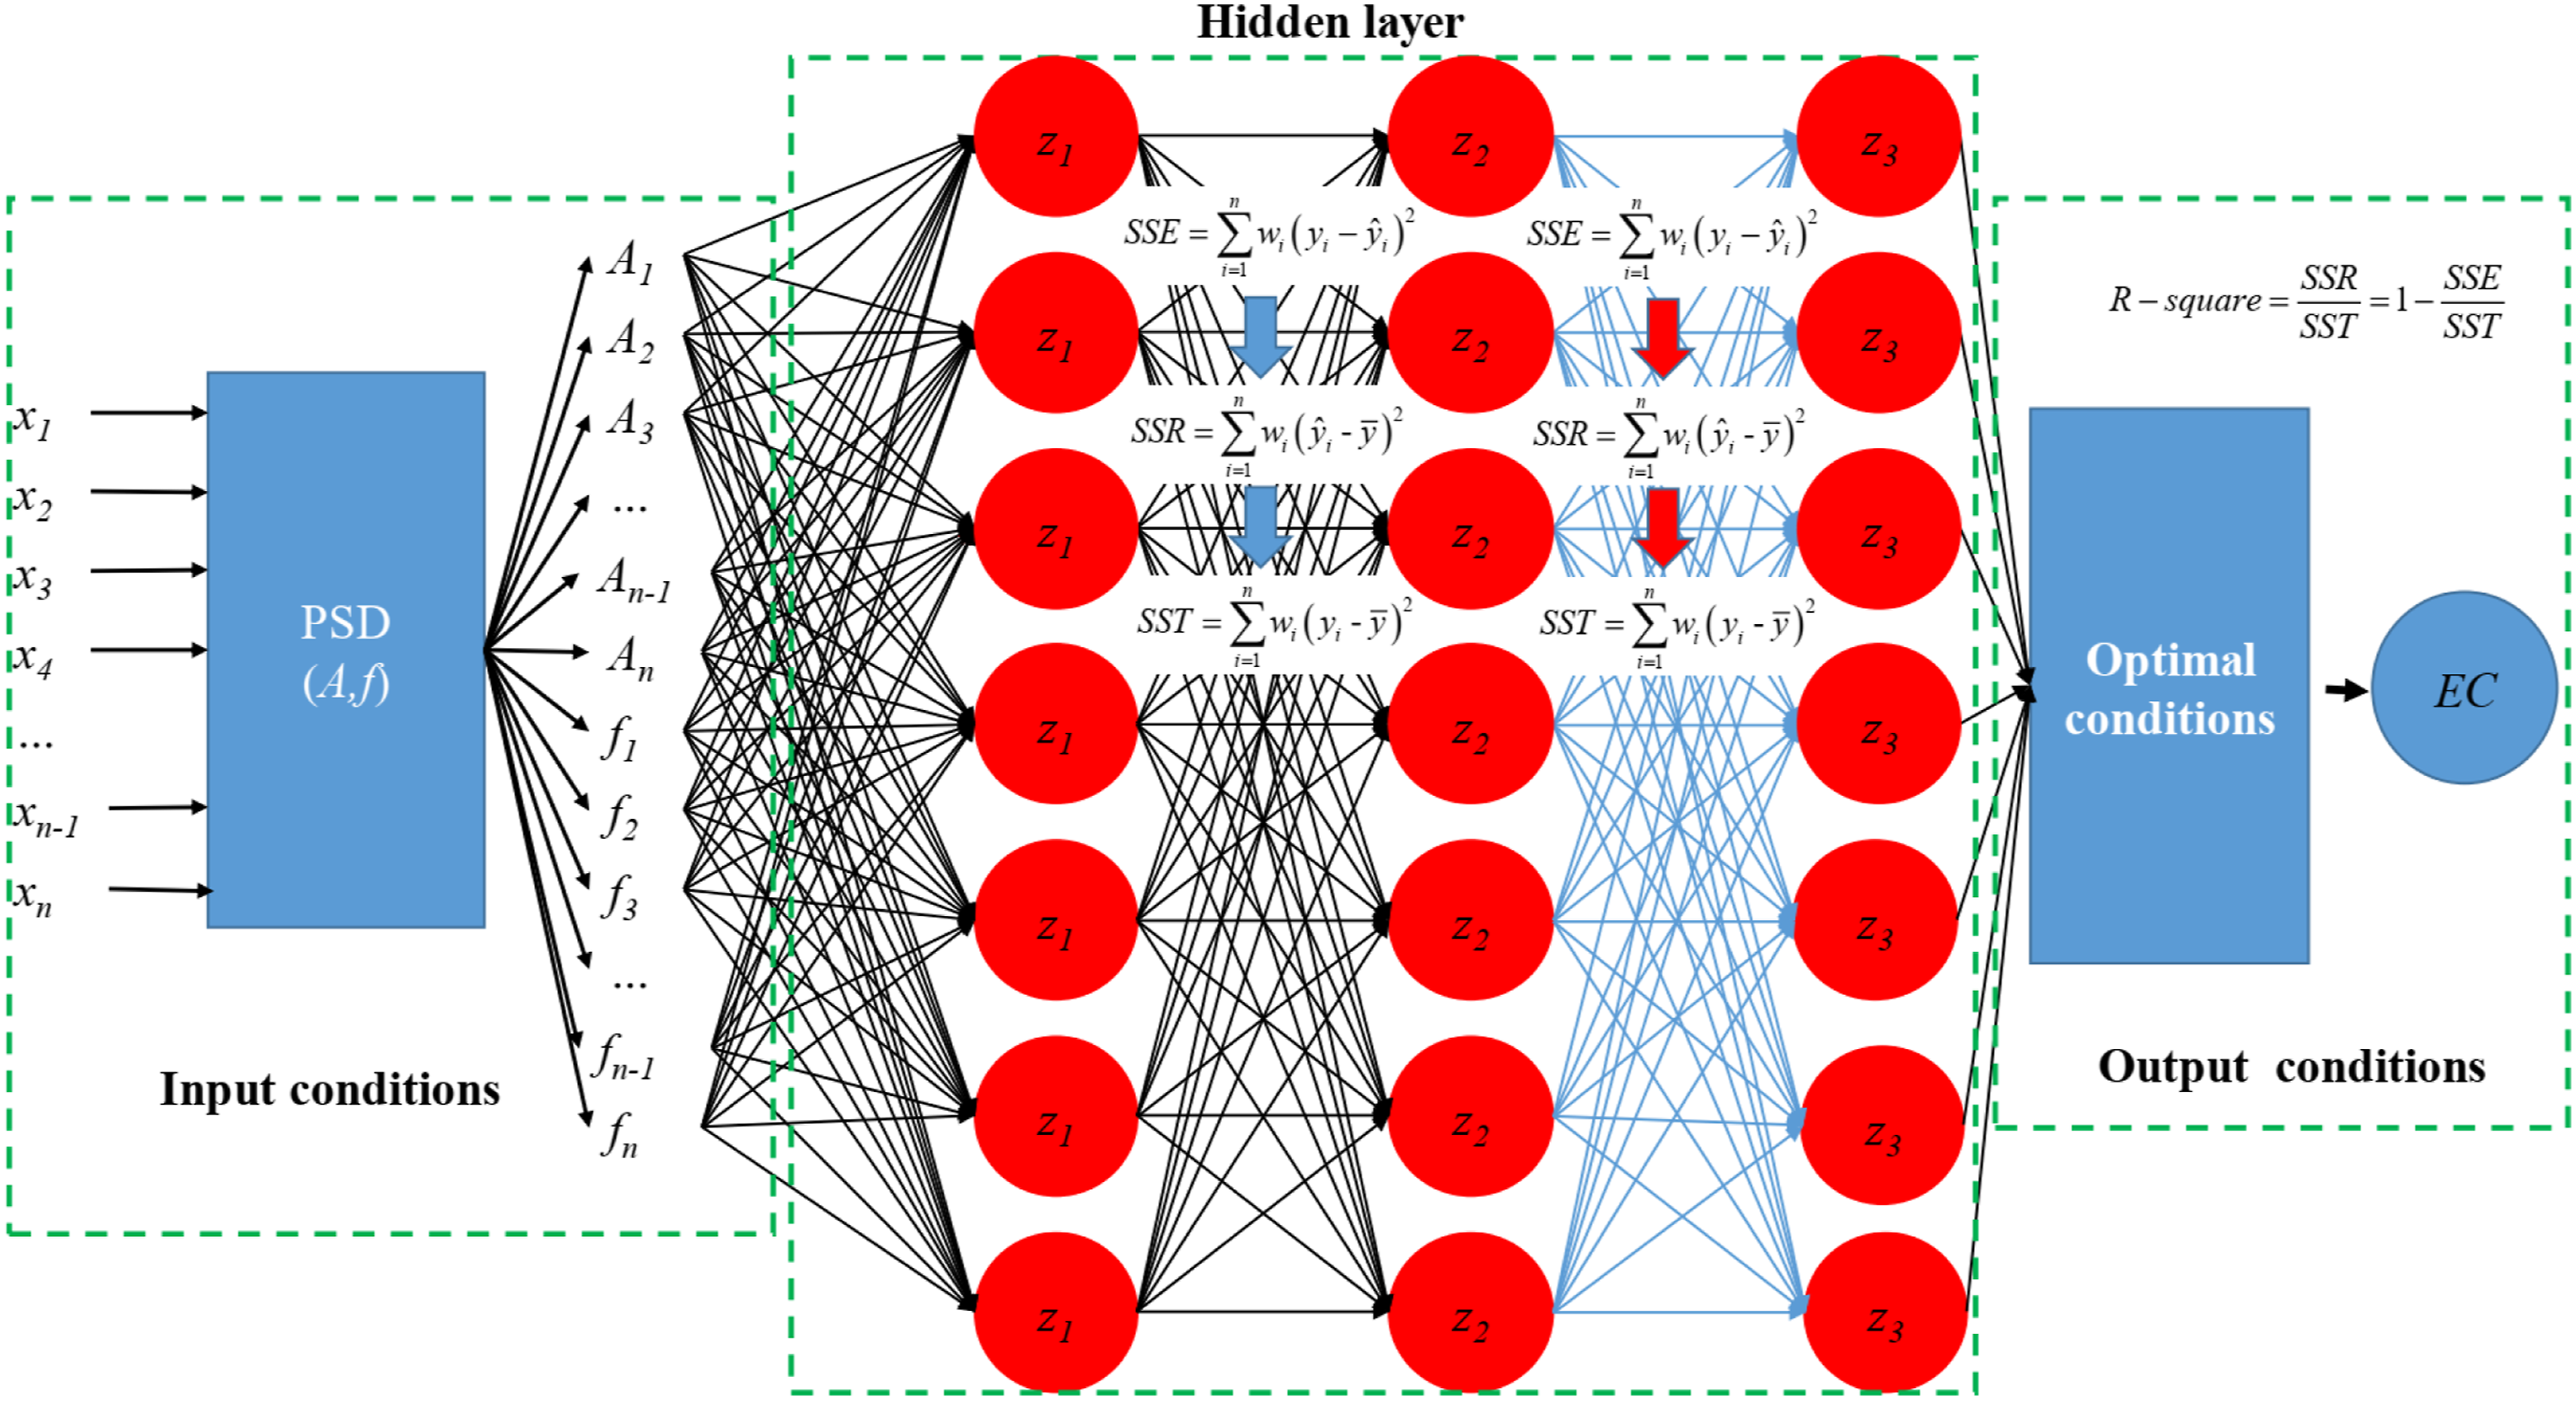
Function
Poly (1): A function used to regress a plane by poly fit shown in equation (12)

Poly (2): Linear model in equation (13)

Custom equation: A function given by us with the linear model in equation (14)

Robust regression
- Least absolute residuals (LAR): The LAR method finds a curve that minimizes the absolute difference of the residuals rather than the squared differences. Therefore, extreme values have a lesser influence on the fit. - Suppose that the data set consists of the points (x
i
, y
i
) with i = 1, 2 ,…, n. To attain this goal, we suppose that the function f(x) is of a particular form containing some parameters that need to be determined. For instance, the simplest form would be linear: f(x) = bx + c, where b and c are parameters, whose values are not known, but that we would like to estimate. Less simply, suppose that f(x) is quadratic, meaning that f(x) = ax2 + bx + c, where a, b and c are yet to be determined. More generally, there could be not just one explanator x, but rather multiple explanators, all appearing as arguments of the function f(x). We now seek estimated values of the unknown parameters that minimize the sum of the absolute values of the residuals - Bisque weights: This method minimizes a weighted sum of squares, where the weight given to each data point depends on how far the point is from the fitted line. Points near the line get full weight. Points farther from the line get reduced weight. Points that are farther from the line than would be expected by random chance get zero weight. For most cases, the bisque weight method is preferred over LAR because it simultaneously seeks to find a curve that fits the bulk of the data using the usual least-squares approach, and it minimizes the effect of outliers.

Goodness of fit
- The sum of squares due to error (SSE) as in equation (16).

A value closer to zero indicates that the model has a smaller random error component, and that the fit will be more useful for prediction. - R-square is defined as the ratio of the sum of the squares of the regression (SSR) and the total sum of squares (SST). SSR is defined as equation (17)

SST is also called the sum of squares about the mean, and is defined as equation (18)


R-square can take on any value between 0 and 1, with a value closer to 1 indicating that a greater proportion of variance is accounted for by the model. - Degrees of Freedom Adjusted R-Square are defined as the number of response values n minus the number of fitted coefficients m estimated from the response values, as shown in equation (20). - Root Mean Squared Error (RMSE) is defined as equation (21)


Output: value of the C/E ratio or the EC value shown in Figure 6 and Figure 7 Output of the model.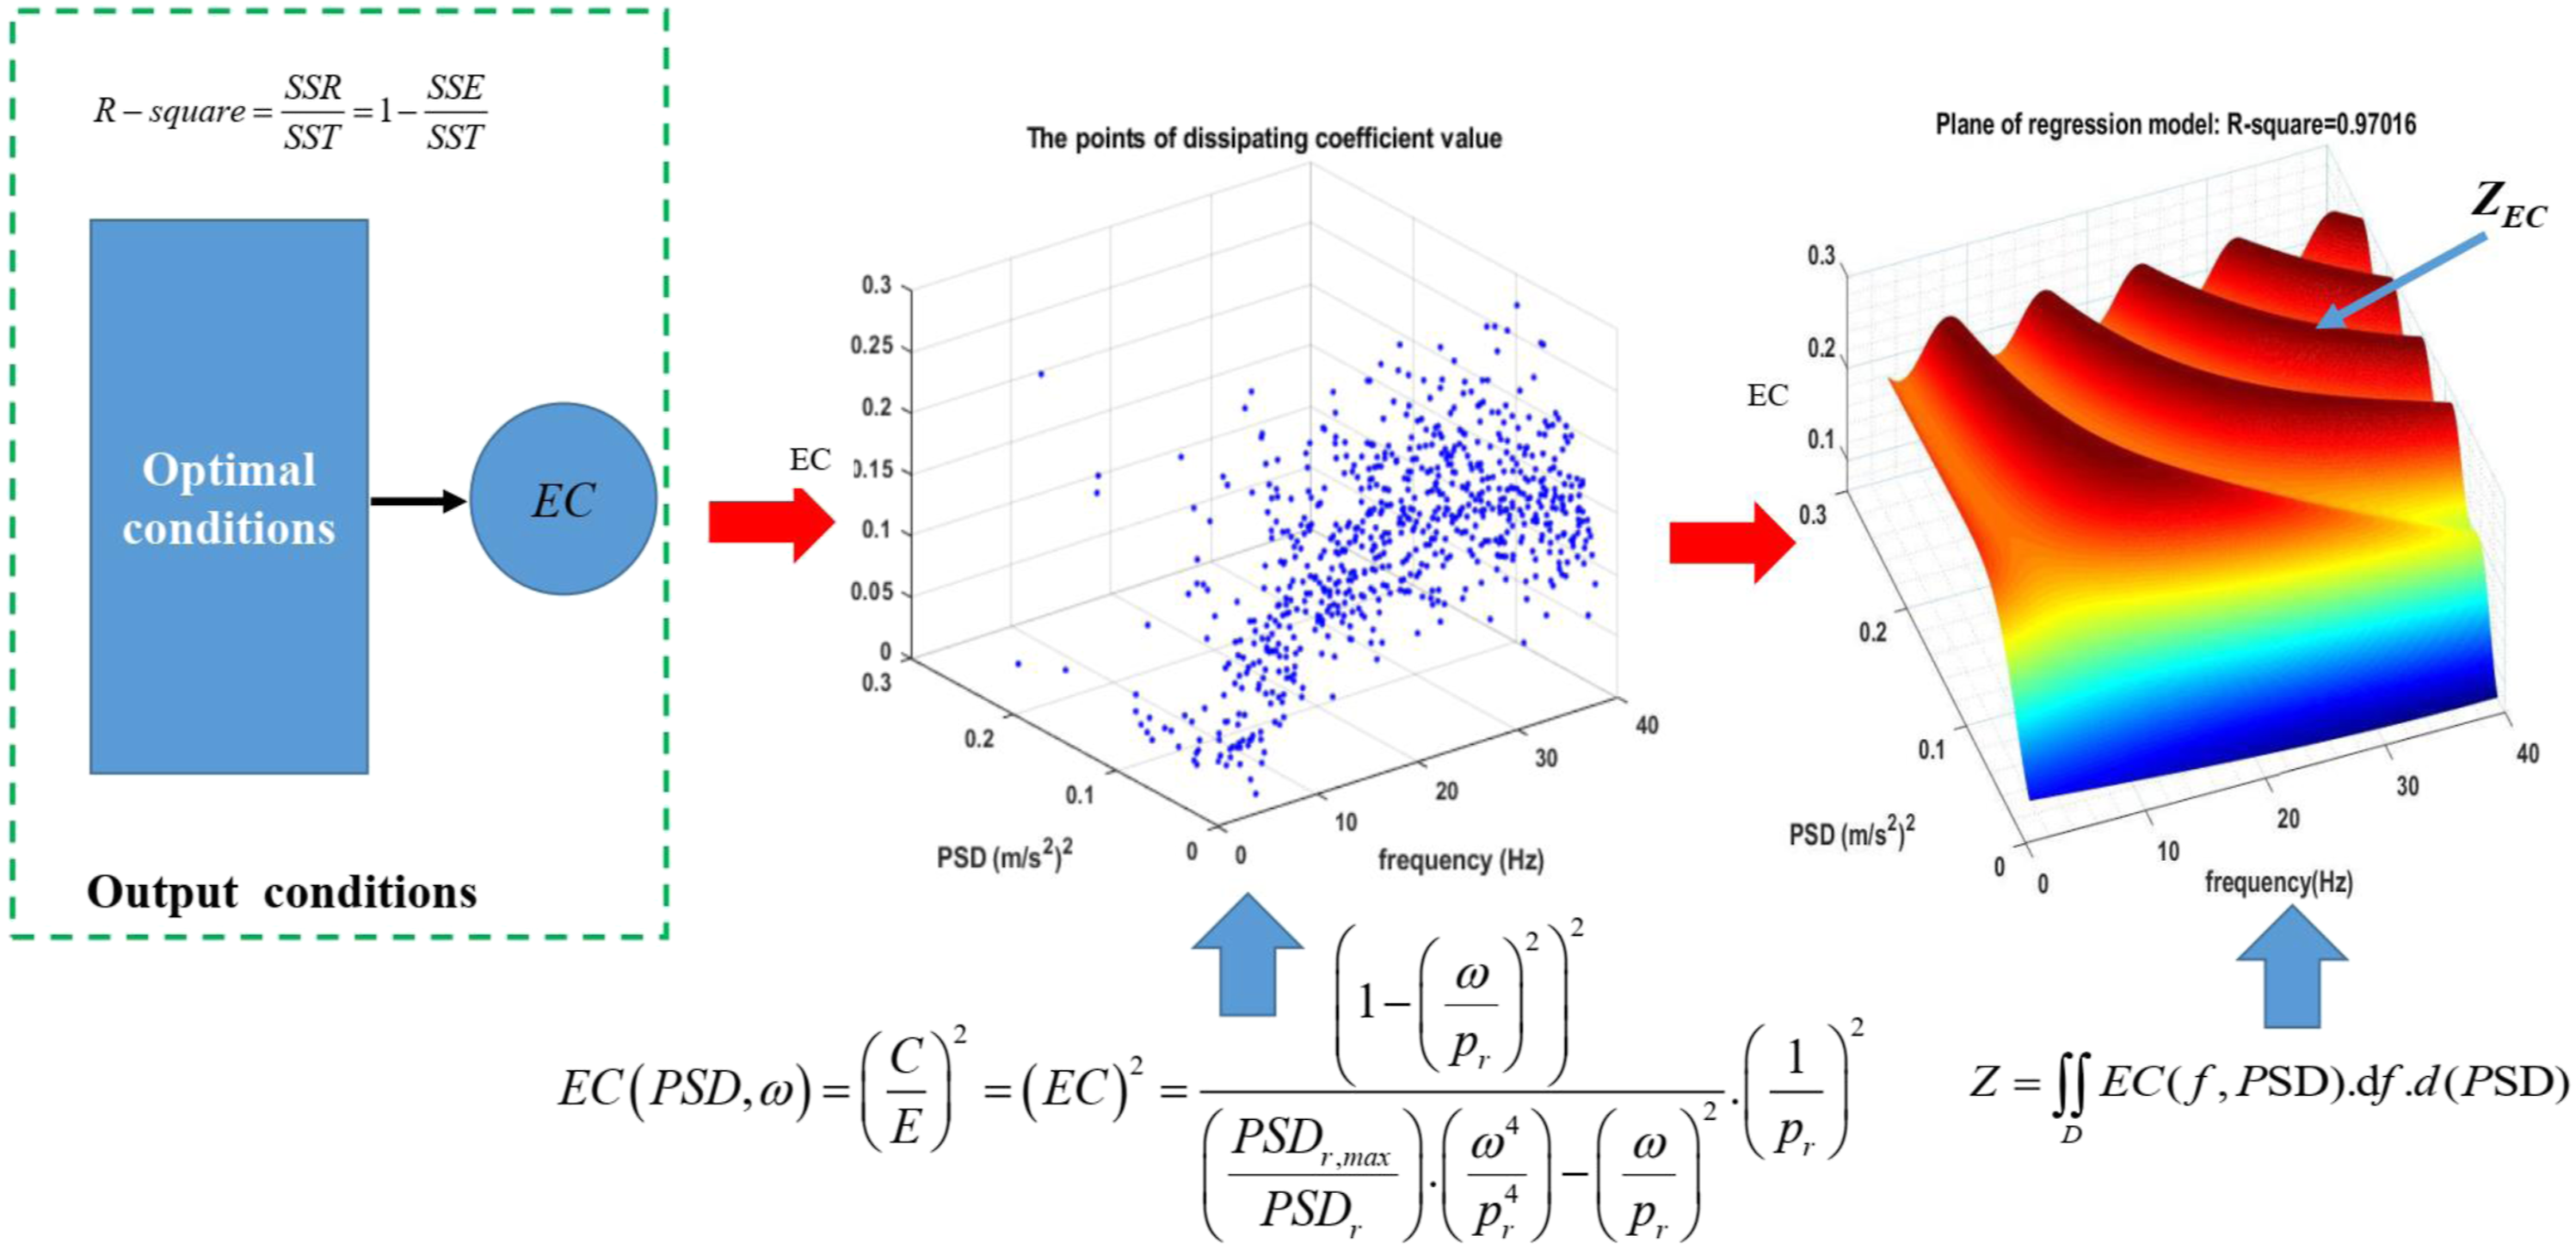
Content and discussion
Evaluating quality of the actual beam concrete
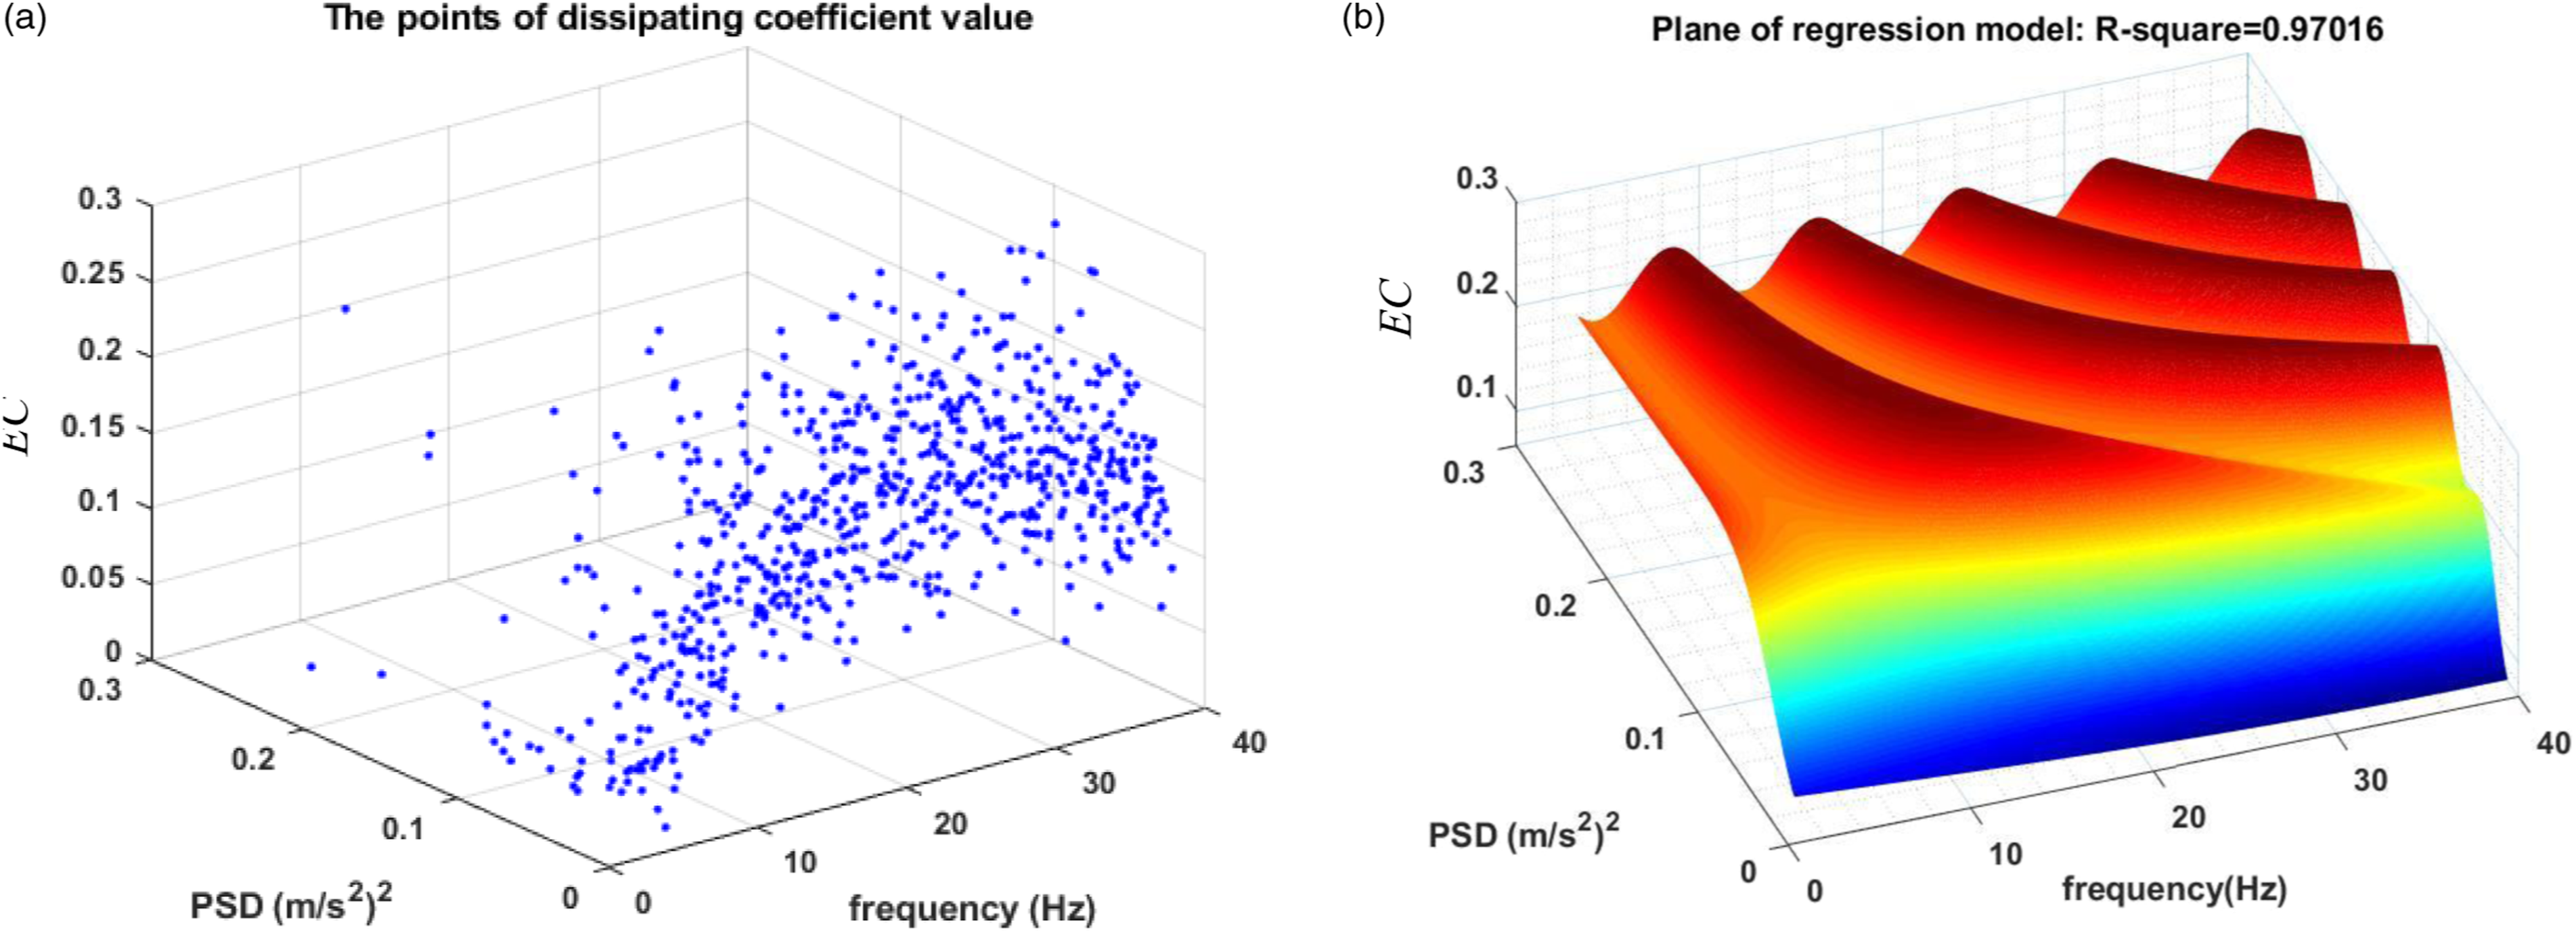
According to equation (11), the value of EC is a function of spectral amplitude and frequency. The study has used vibration signals obtained from two different groups of concrete beam spans, prestressed concrete and an adjunctive concrete bridge, to provide a law of variation of the EC value aggregation. If the bearing states of concrete structures and the working conditions are the same, the principle of EC value aggregation variation based on this study will be a new parameter to determine the degree of change in the concrete structure according to exploitation time. The study will gather these values for each specific structure for comparison before determining the principle of EC system values. From equation (11), the aggregation of EC values will correspond to the collection of values in certain frequency ranges (PSD
r,max
, ω). Thus, corresponding to each frequency region, there will be an aggregation of EC coefficients characterized for the frequency region. The study selects only the first frequency range of the power spectrum to process and determine the principle of time variation of EC values for concrete beams in order to make a comparison with the theoretical model of the concrete beams’ structural features. The survey procedure has gathered the collection of EC values, as shown in Figure 8, with the power spectra of the vibration signals obtained for different concrete beam samples. Through the model of machine learning, the EC values are formed and trained as in Figure 9 (a) and (b). The results of the regression process correspond to the correlation value R-square > 0.8234, therefore, the R-square value has shown a convergent regression process. Then the aggregation of EC values will show that the collection formed is a plane distribution, as shown in Figure 9 (a). With this collection of EC values, it is difficult to assess the differences between concrete samples. Therefore, the article has chosen to survey through the area of the Z
EC
regression surface in order to accurately survey the relationship between the distribution of these EC values and the structure change. This area is a partial area limited by Z: the boundaries are the fixed and pre-selected frequency distribution range of f, and the PSD boundary is from 0 to the maximum value of the first bending mode according to equation (23). Thus, equation (23) is the researched parameter used to standardize the comparison between different types of concrete beam structures. Power spectrum received from acceleration measurement results. (a) EC values received from vibration characteristics, (b) Regression plane of the EC parameter (ZEC).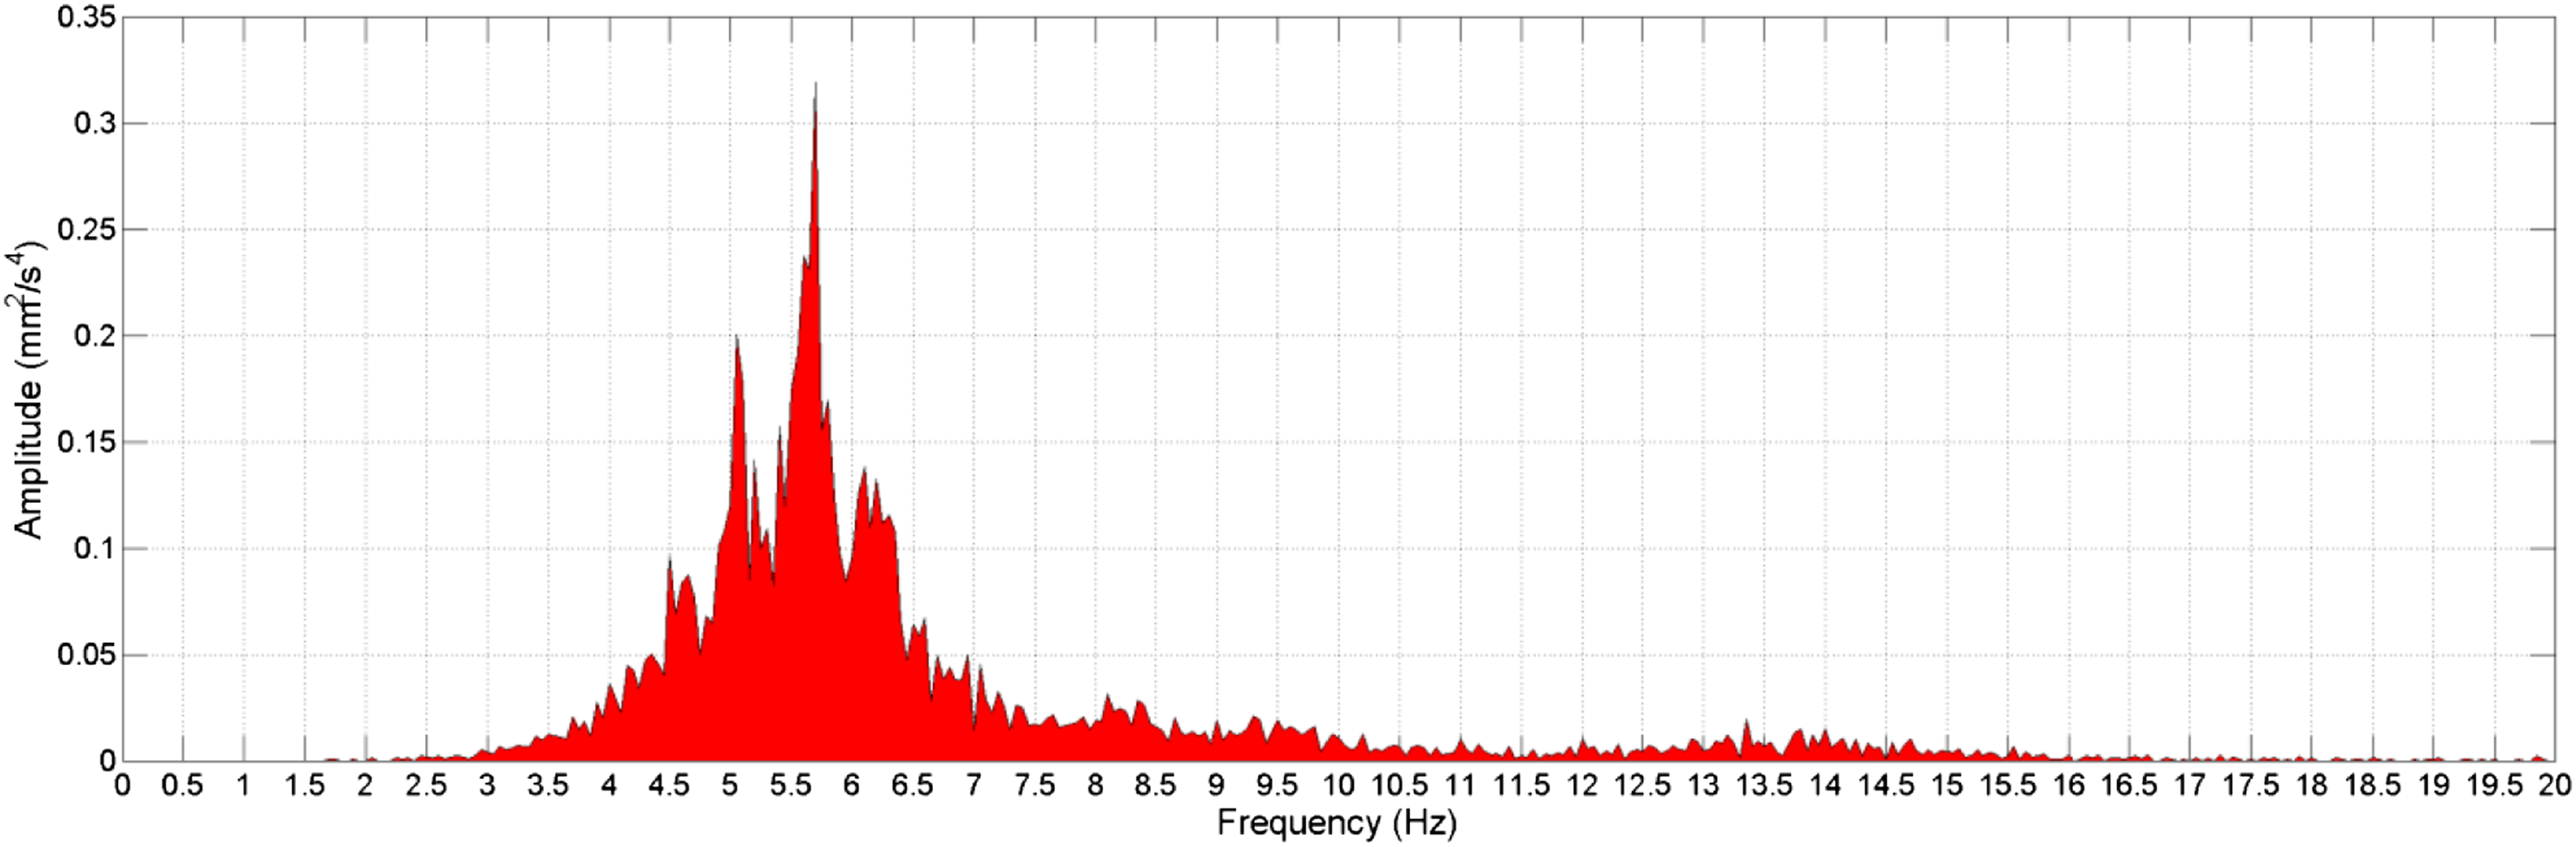

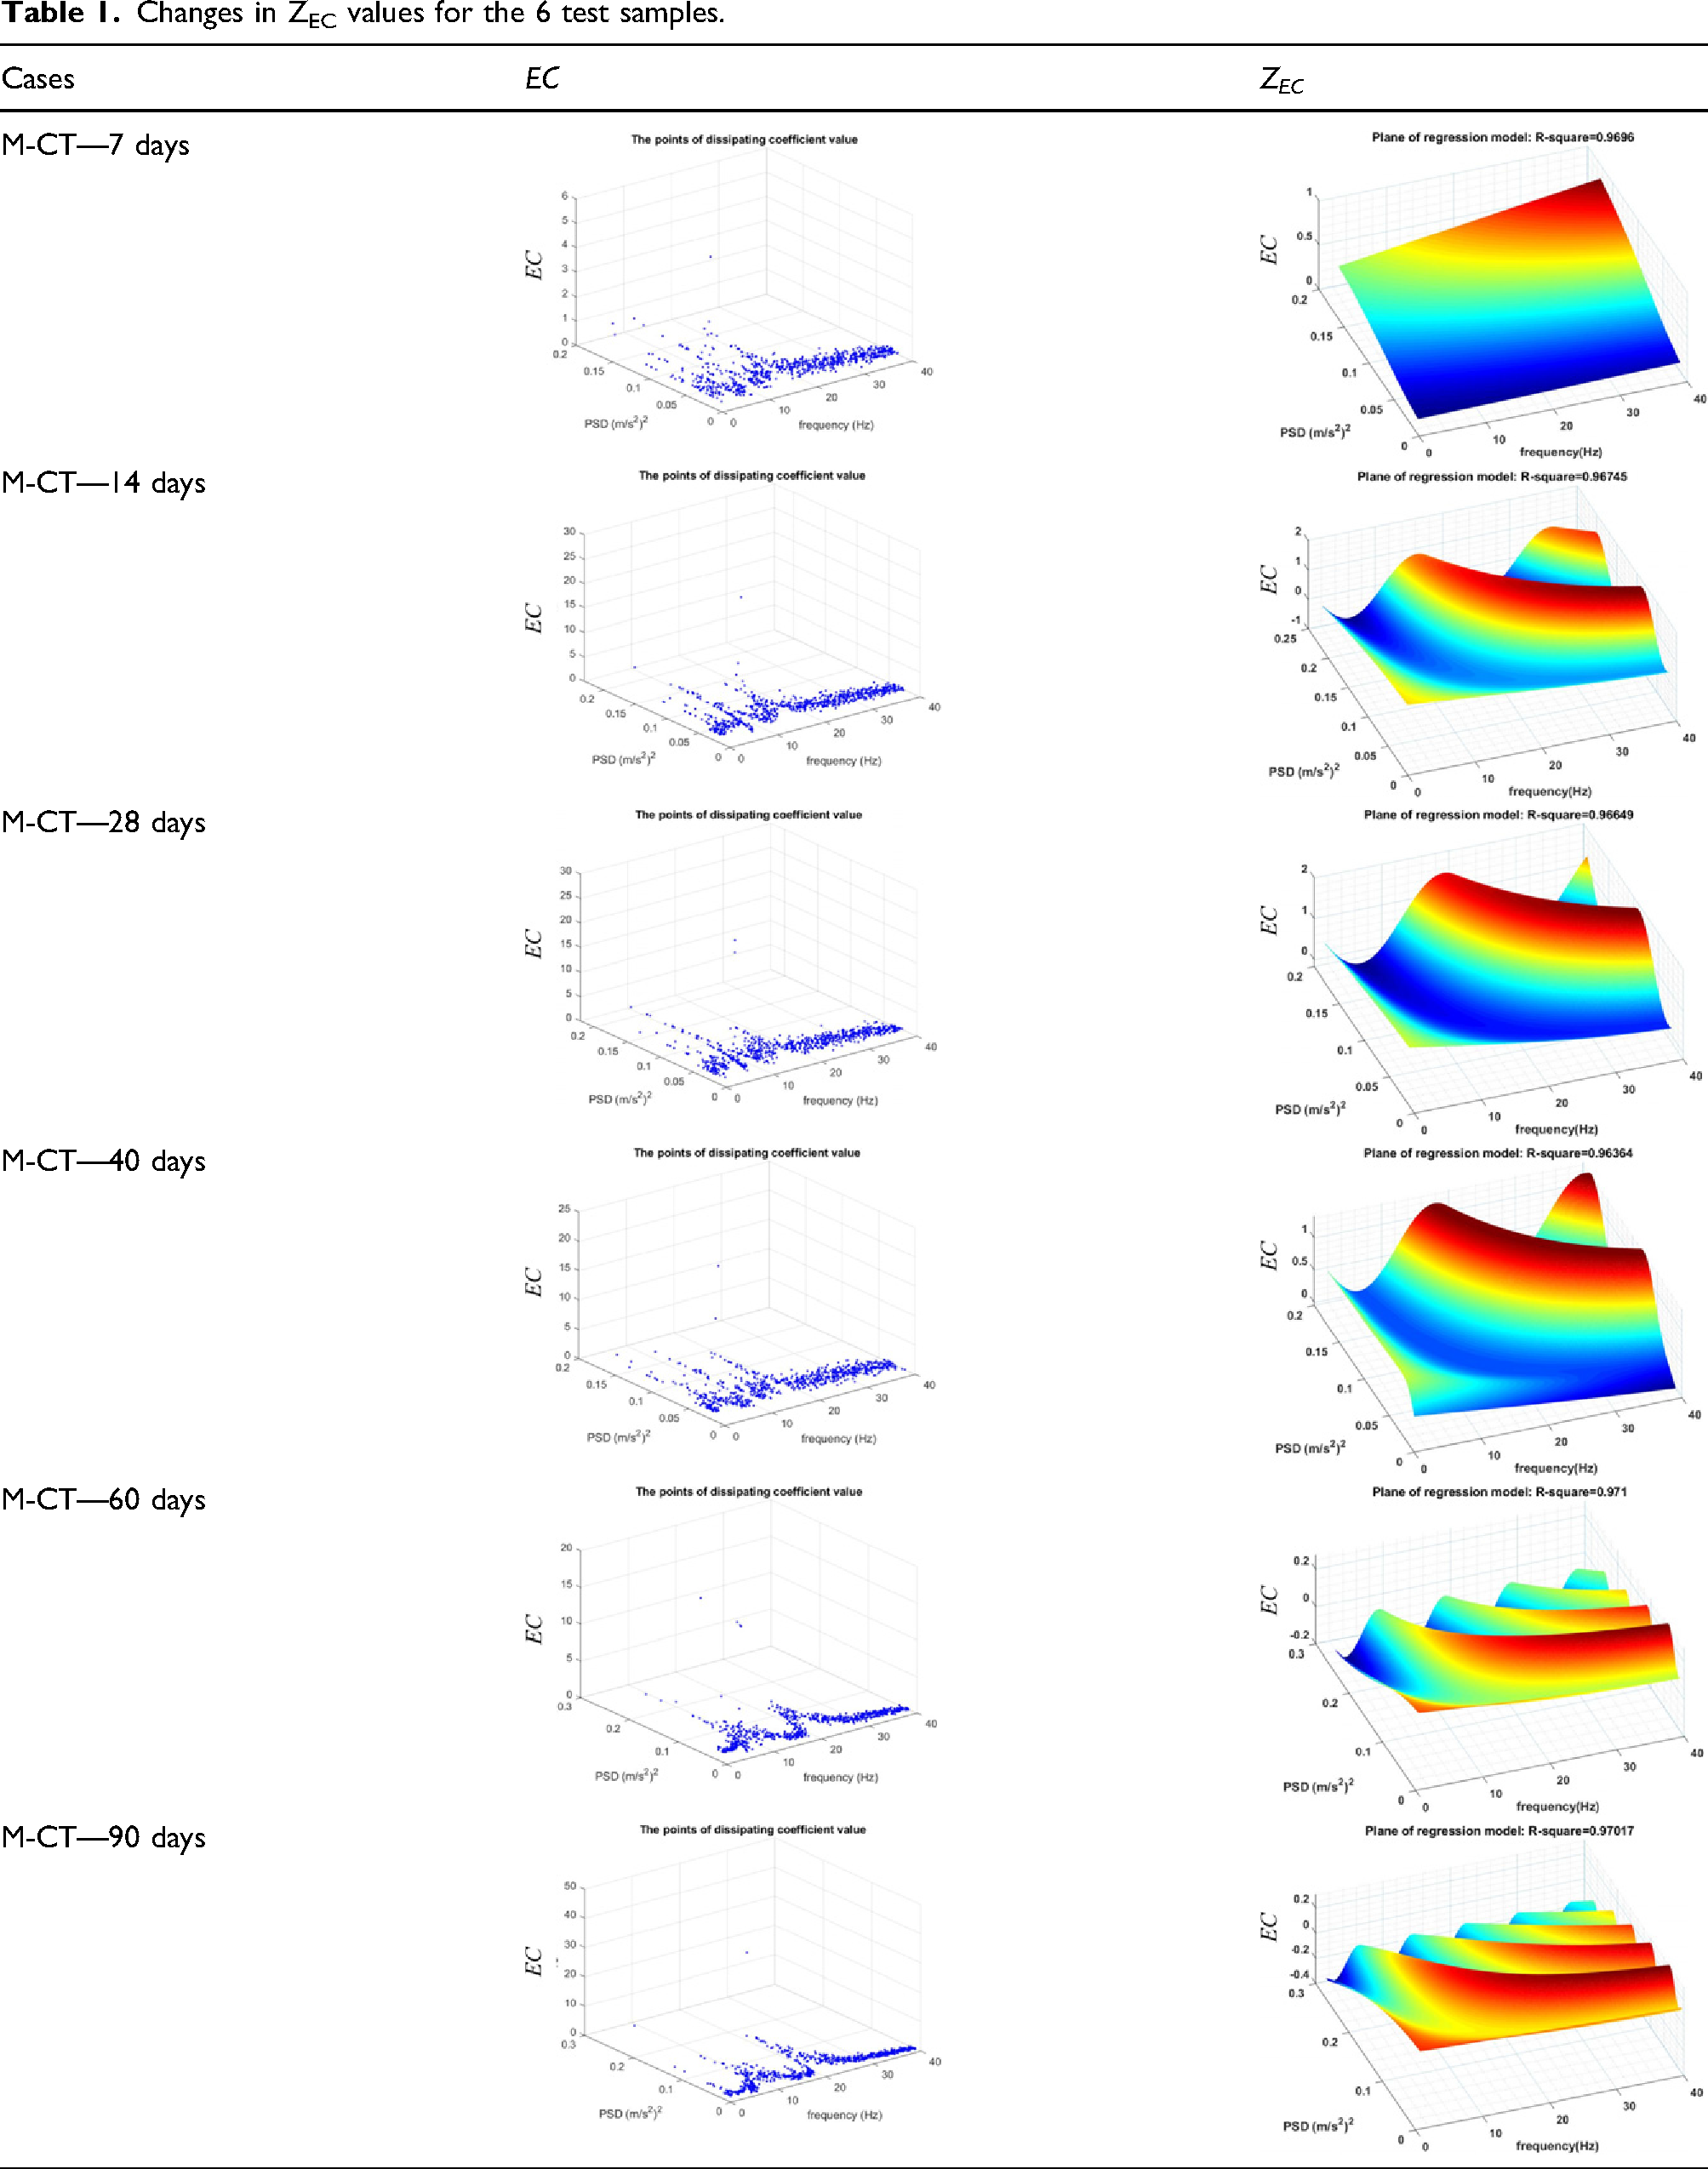
Thus, the manuscript has conducted the experiments on 6 test samples corresponding to the time of concrete pouring in sequence: 7 days, 14 days, 28 days, 40 days, 60 days, and 90 days. The quality of the groups of concrete beams checked by the method proposed in the manuscript is demonstrated in the following ways: stimulating the working process of the concrete beam samples by the vibration method, as shown in Figure 10; the evaluation of the sample quality through the PSD spectra, as shown in Figure 11; and the evaluation through the aggregation of EC values and the regression plane according to the proposed method in Figure 12. The results are shown in Table 1. Vibration signals for 6 test samples. PSD spectra received from the 6 test samples of Figure 10 Parameters between bridges of Sai Gon 1 and 2 Changes in ZEC values for the 6 test samples.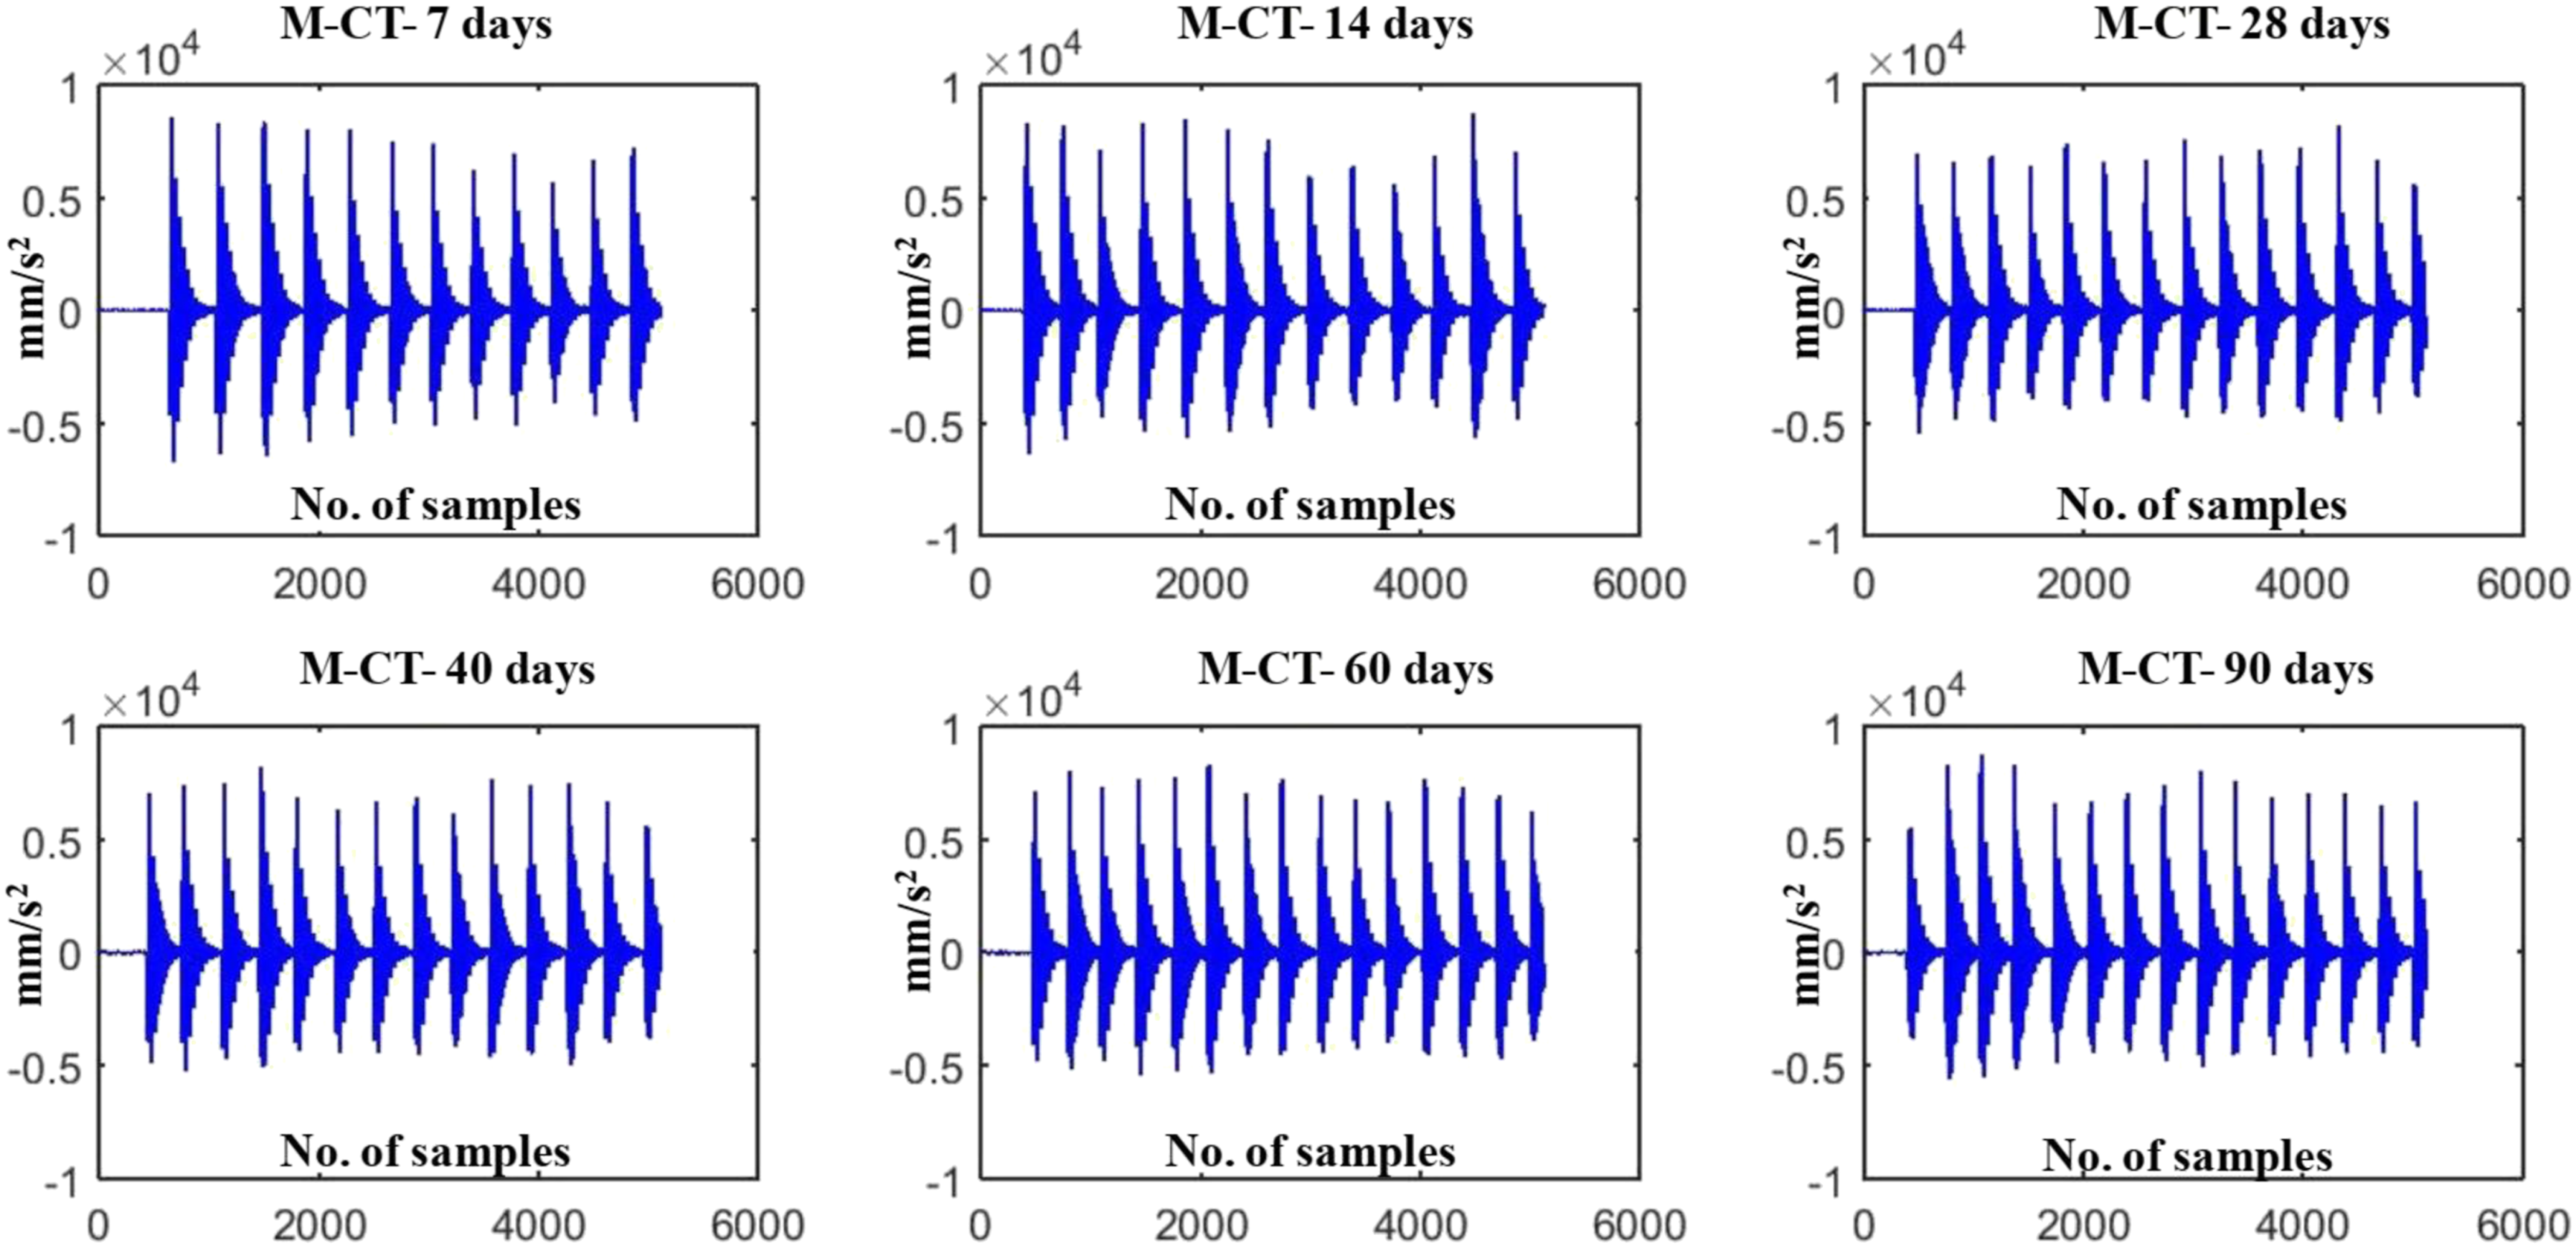
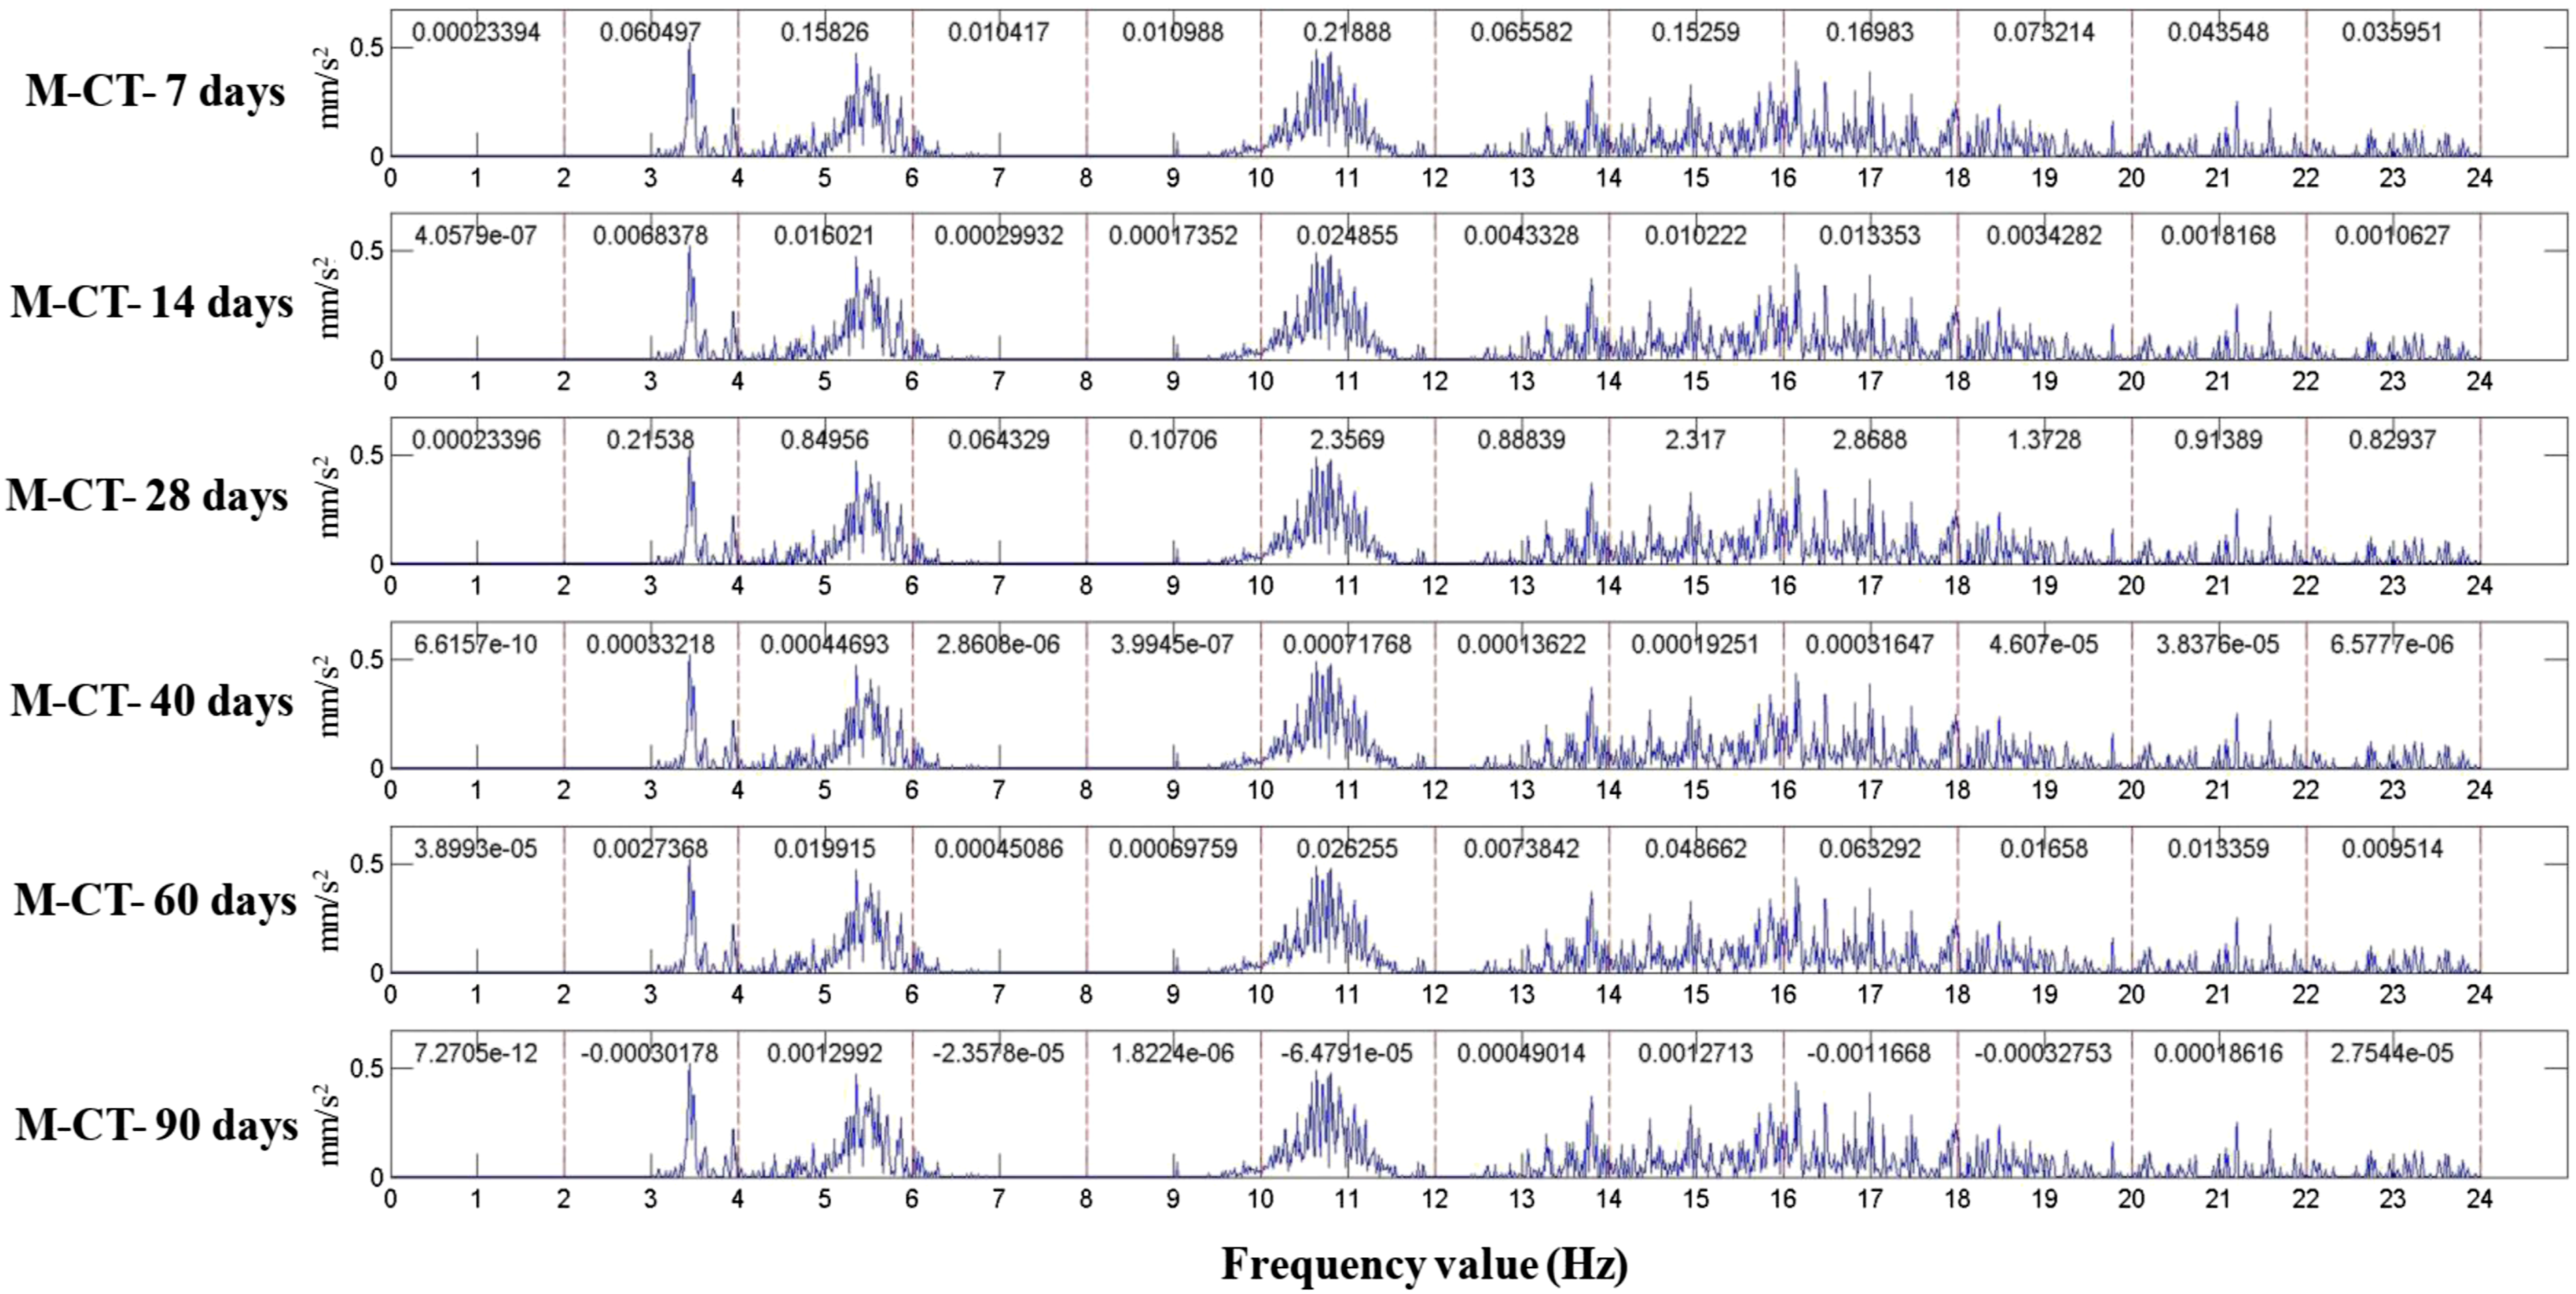
Under the impact of the constraining force, and by the method of periodic vibration that utilized a frequency exciter, the continuous impact on the samples of concrete beams caused them to vibrate, as shown in Figure 10. Figure 10 shows the vibration signal of concrete beams under the load impact within 12 cycles. The shape of the amplitude signal distribution among the test samples is fairly similar. This study has analyzed the signals to form the vibration spectra in order to evaluate the changes in the data, as shown in Figure 11. Through deep learning, we have transferred signals from the time domain to the frequency domain to quantify parameters, as shown in Table 1.
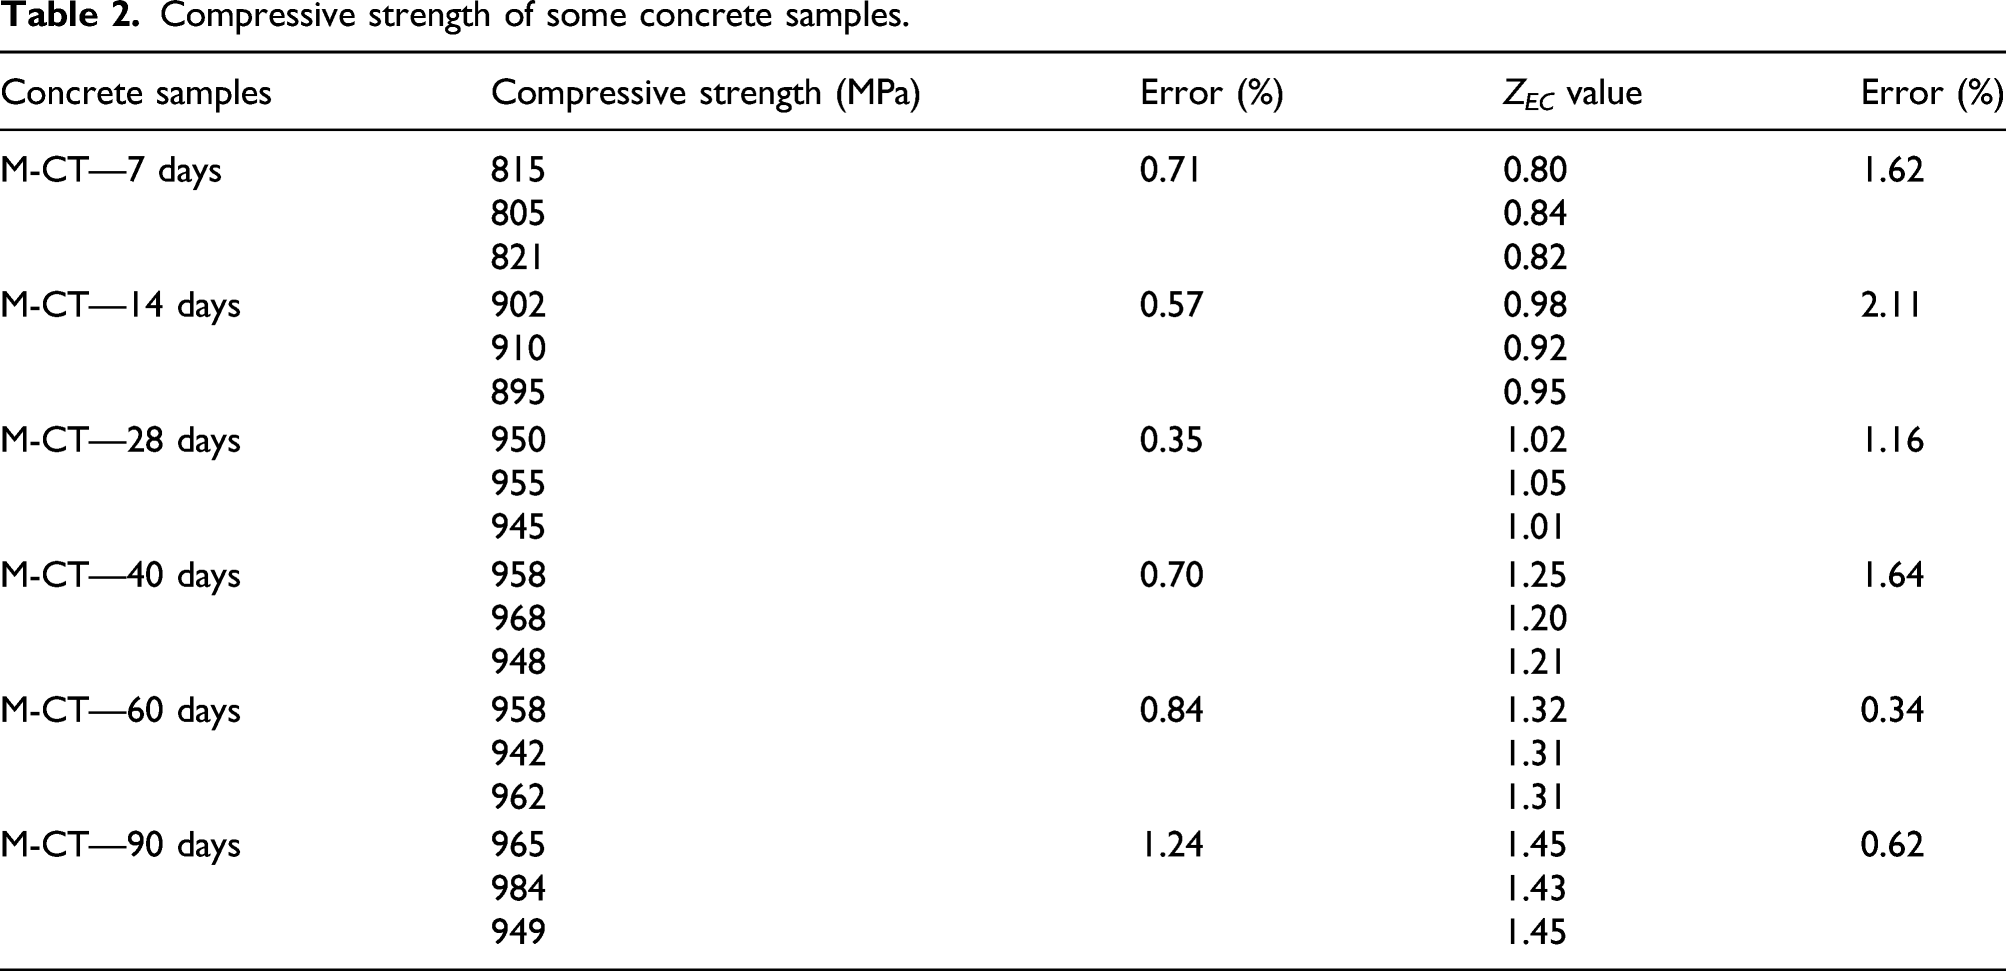
The spectral variation is negligible for the test samples. The small variations can be explained by the blowing of the concrete beam structure, and these small variations become negligible after a short period of time. Thus, it is very difficult to find any differences between these samples because the variations are too small to detect easily. The results in Table 2 show the values of compressive strength for the 6 test samples determined by experimental methods. - We can evaluate the mechanical change of the test samples over time and through working conditions to evaluate the change in the structure of the concrete beams, and the results in Table 1 show the values of the EC coefficient. This measure can serve as the basis for assessing the variations in the concrete samples. Compressive strength of some concrete samples.
Evaluating the quality of several different concrete beam structures
Evaluating the structure of prestressed concrete beams
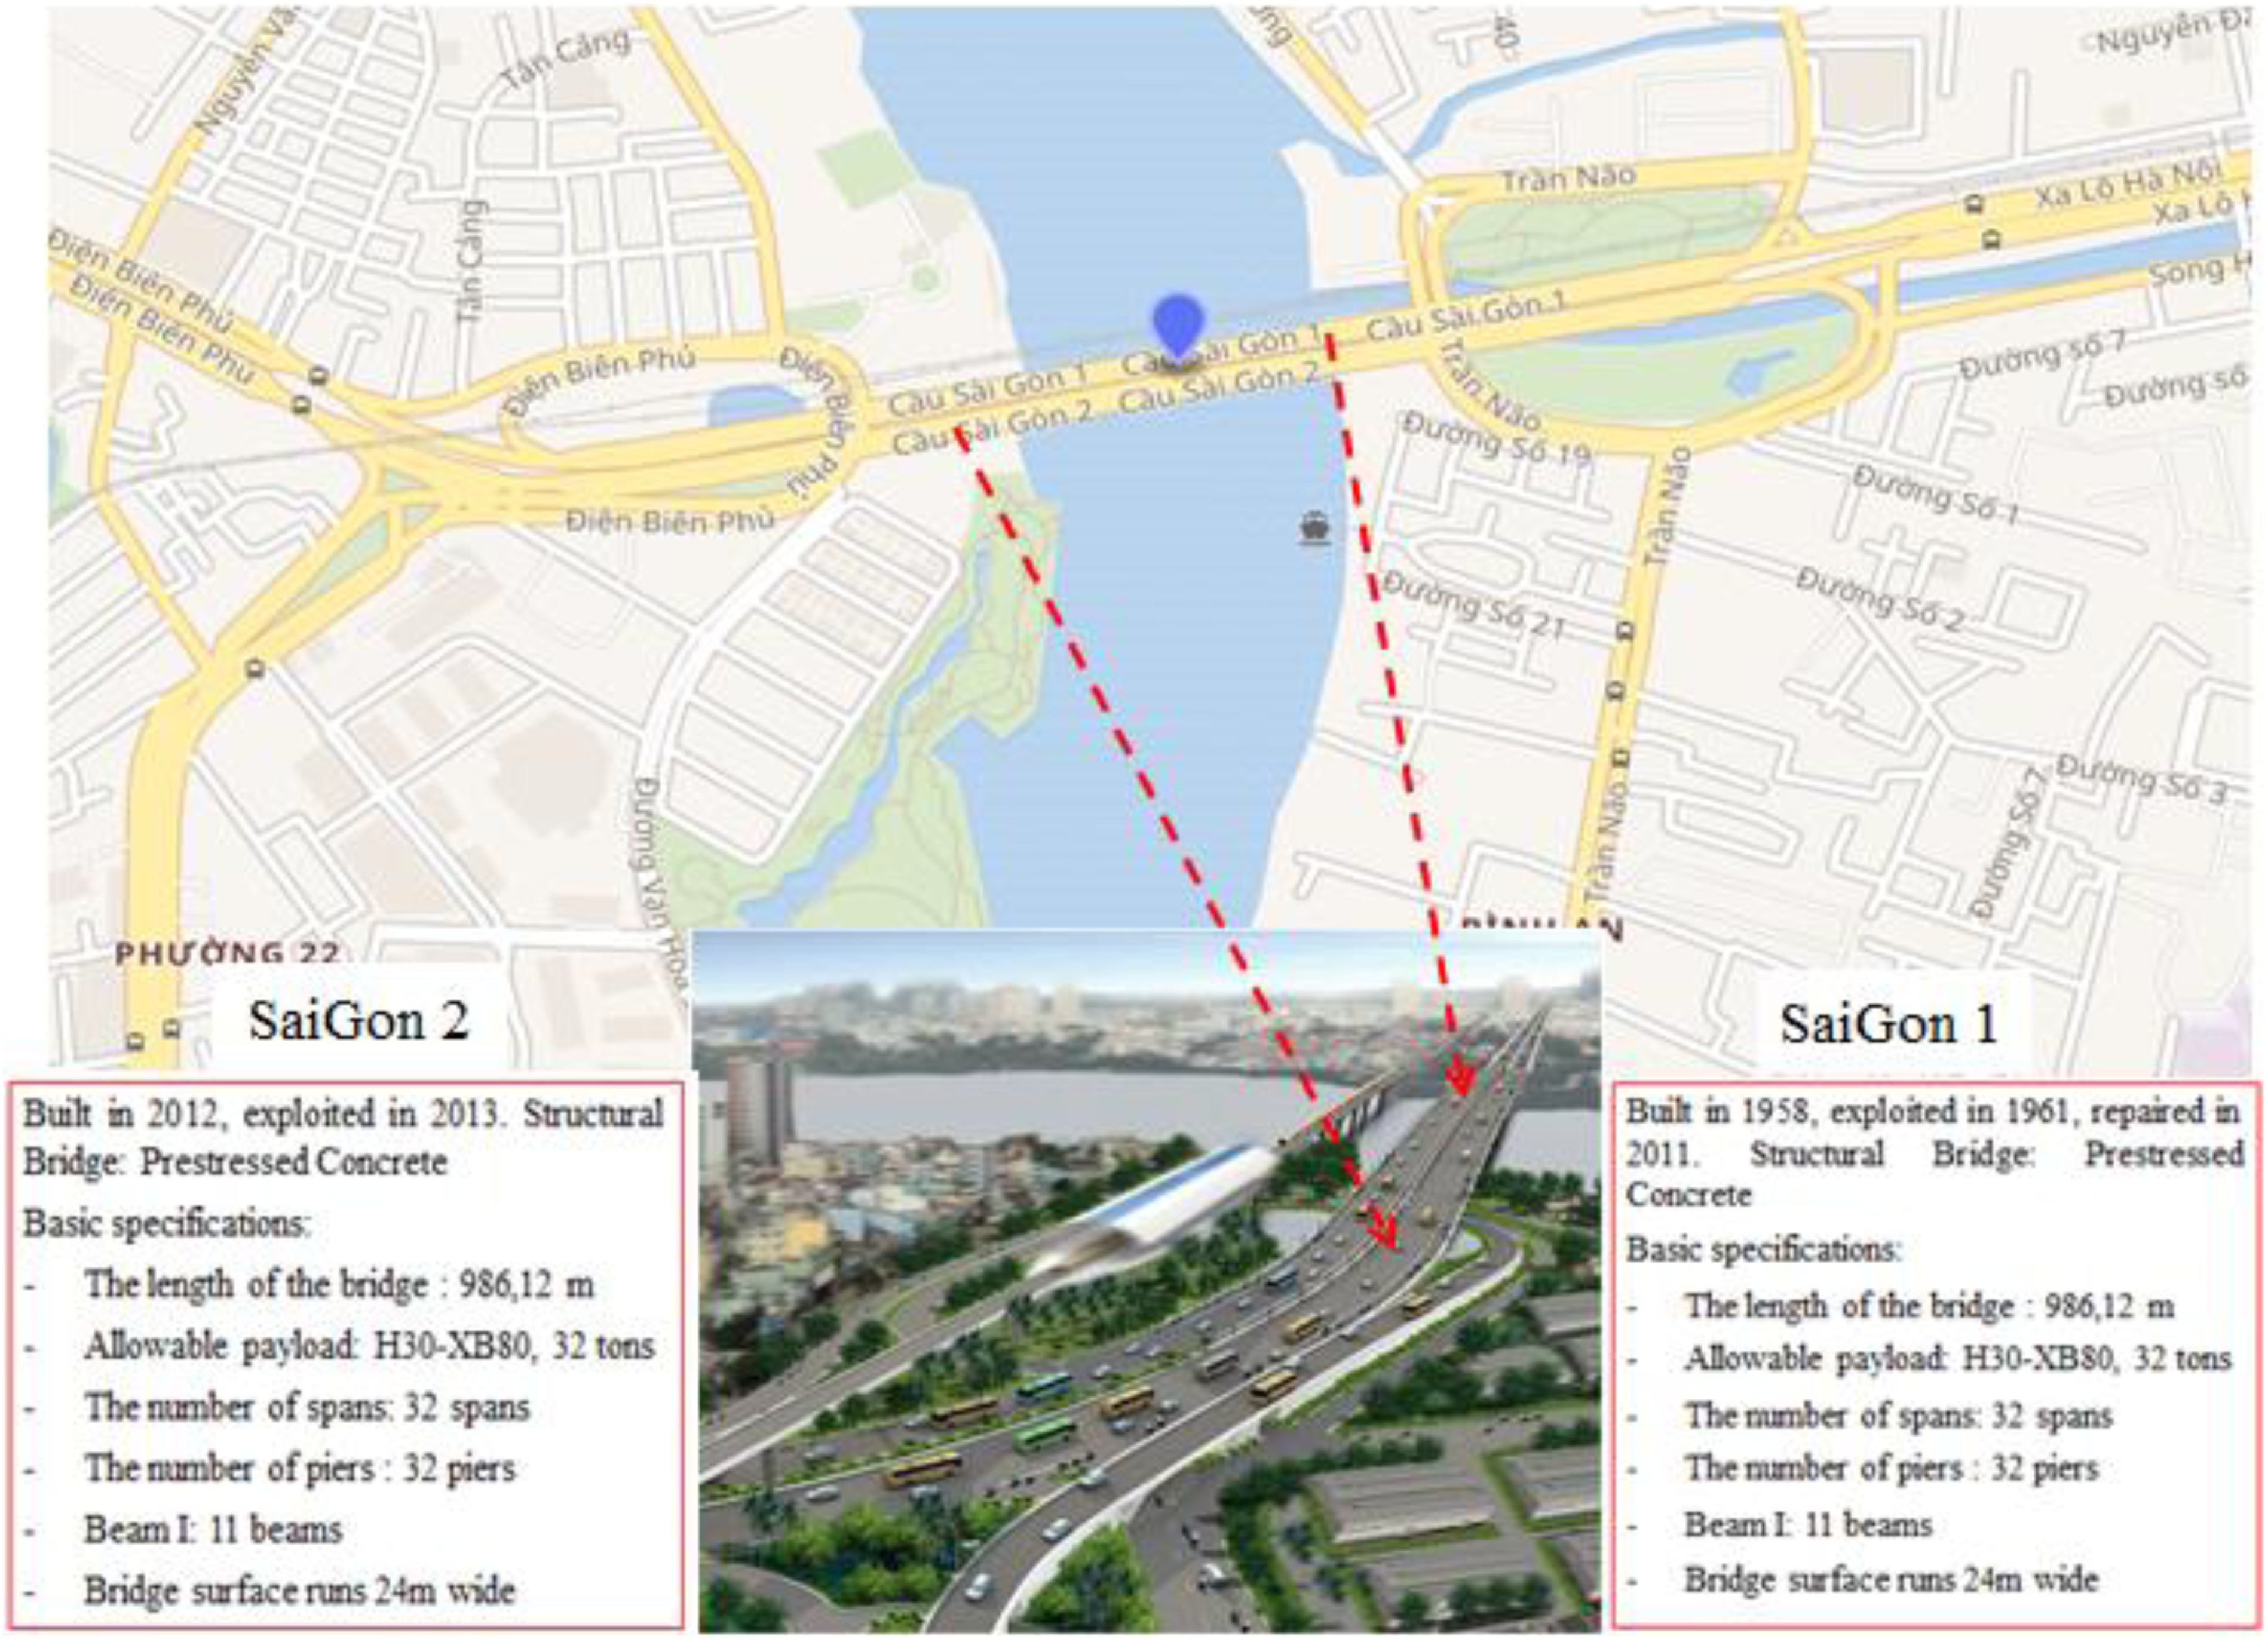
Comparison of ZEC coefficients of some spans at Sai Gon Bridge 1 and Sai Gon Bridge 2
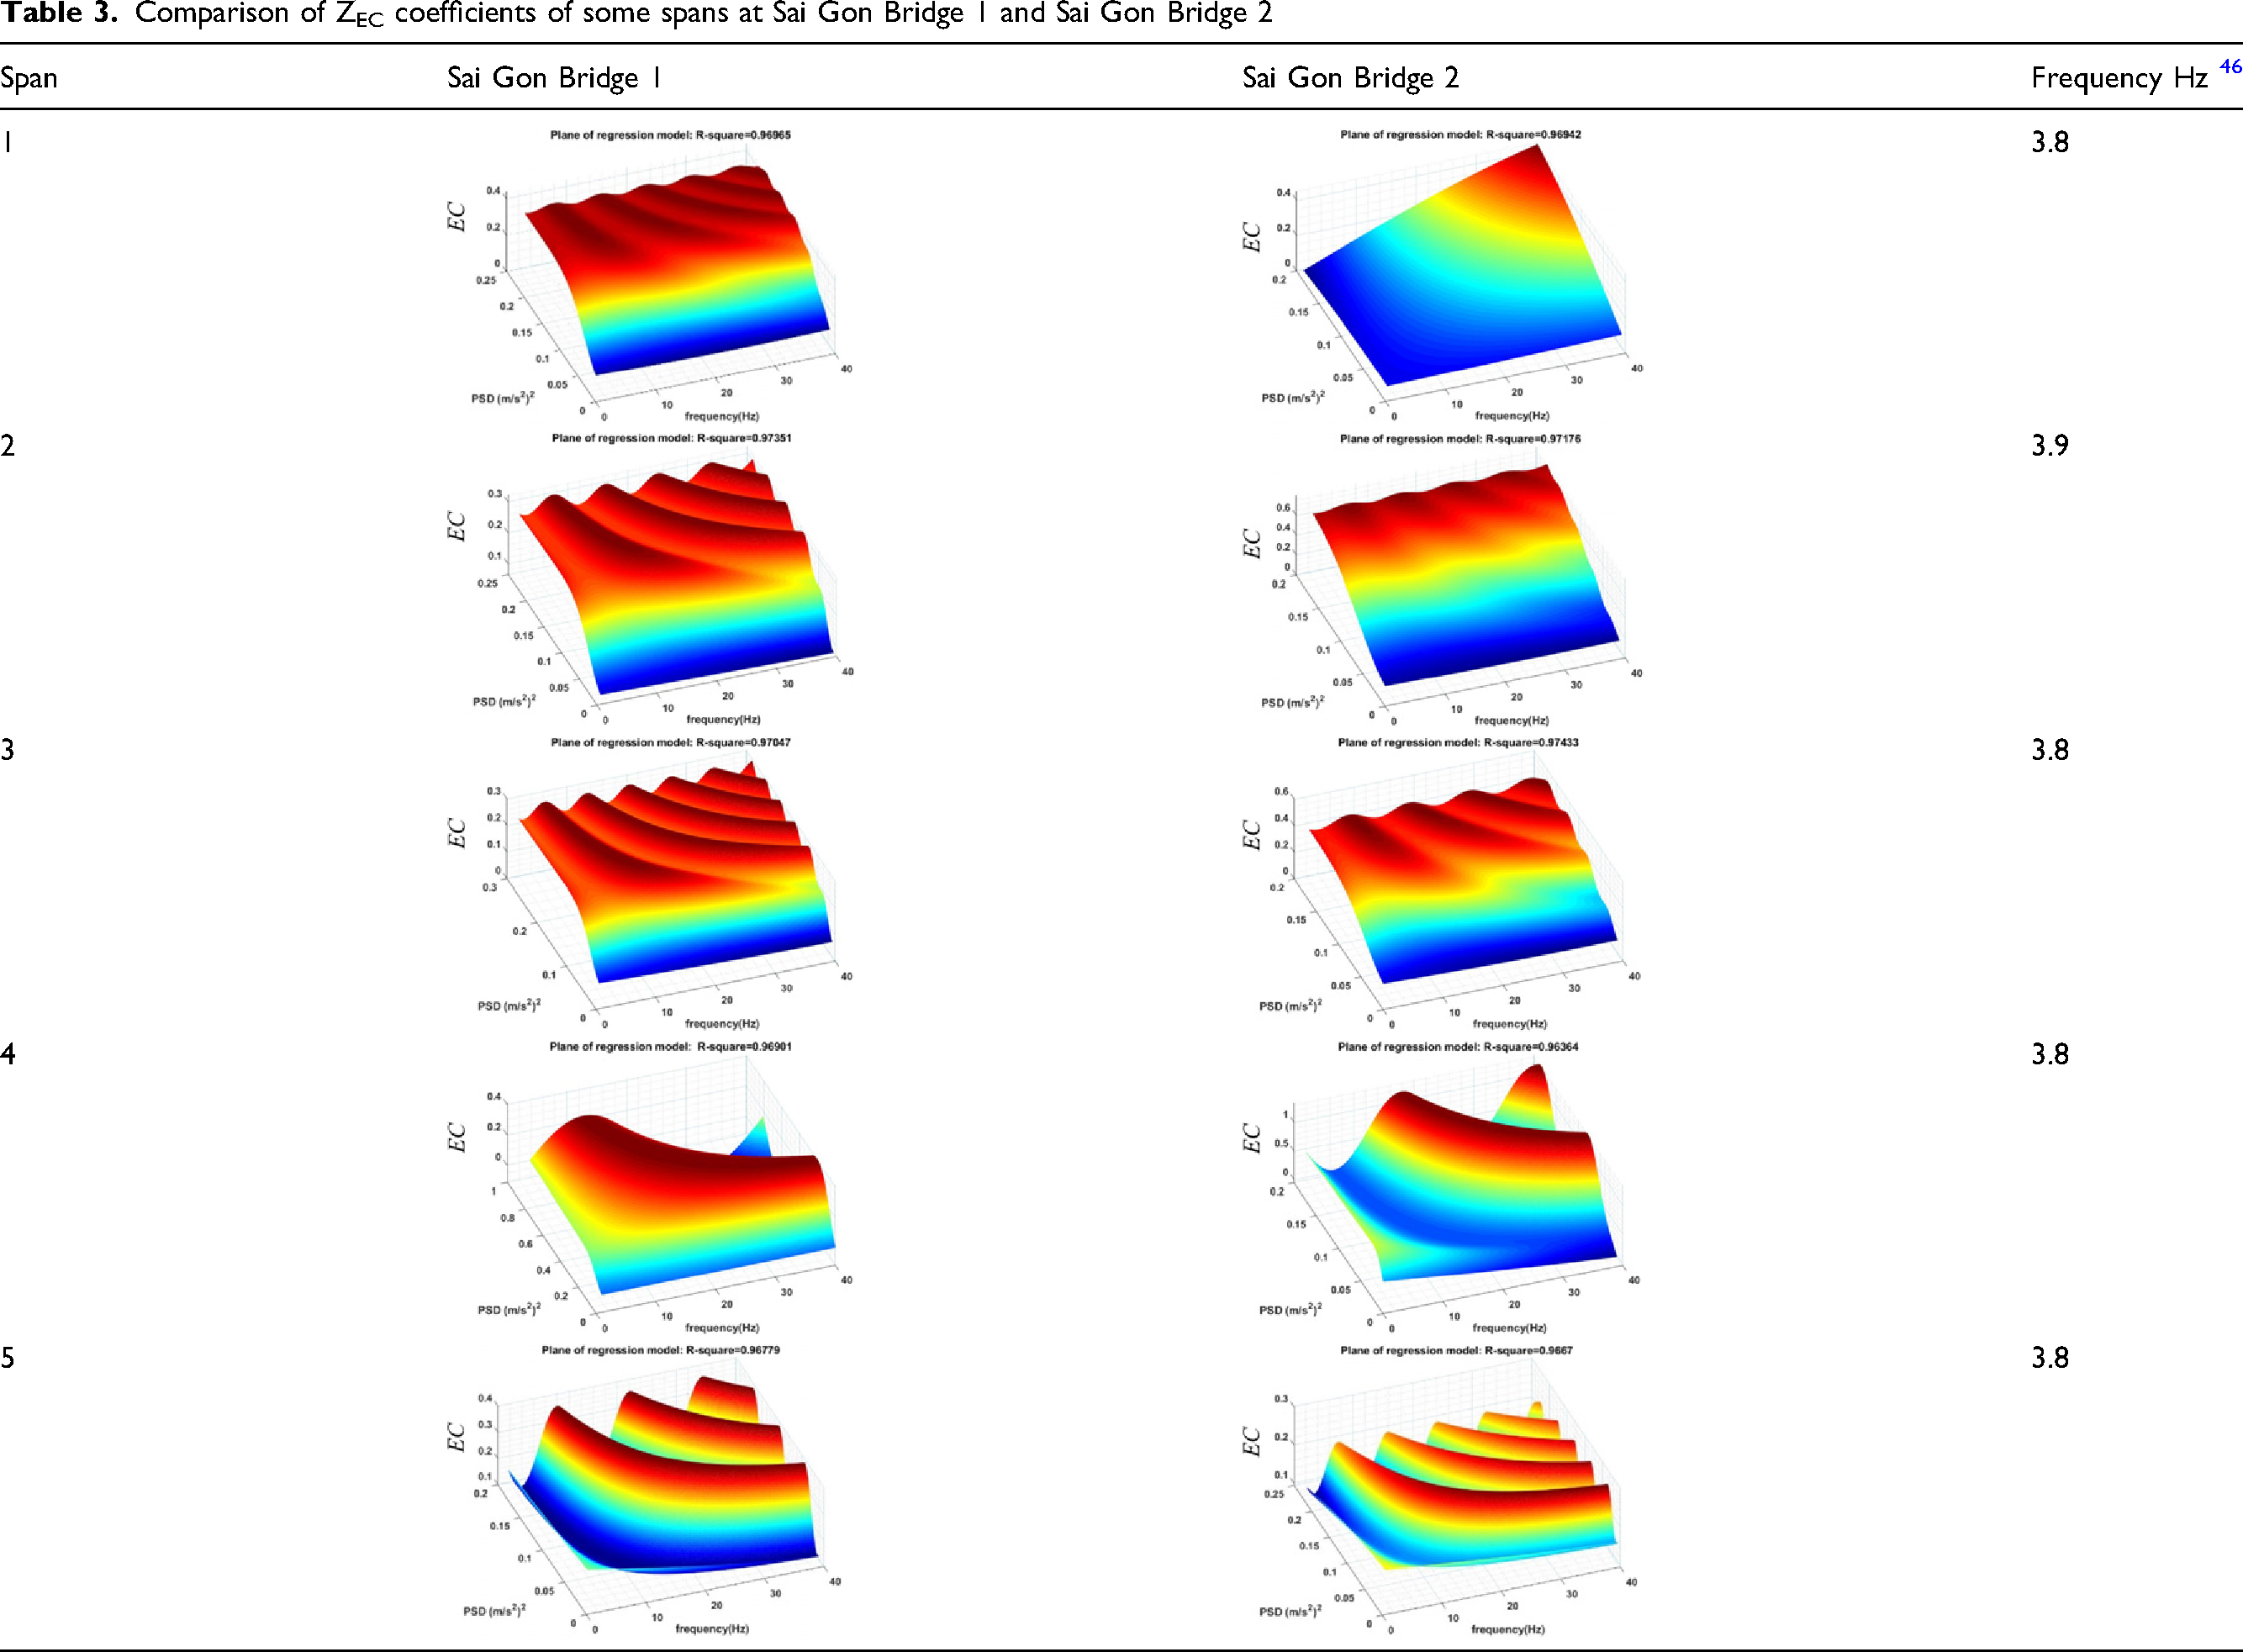
Although the results show that the values of the specific frequency received from these concrete beams are the same, the spans’ ZEC values greatly vary, in which Sai Gon Bridge 2 has ZEC values in the range of 1–3 (unit area) and the differences between its spans are small. In comparison to Sai Gon Bridge 2, the ZEC values for Sai Gon Bridge 1 in general tend to be much larger. A comparison of the ZEC values of the two bridges is shown in Figure 13. Comparison of ZEC values for Sai Gon Bridge 1 and Sai Gon Bridge 2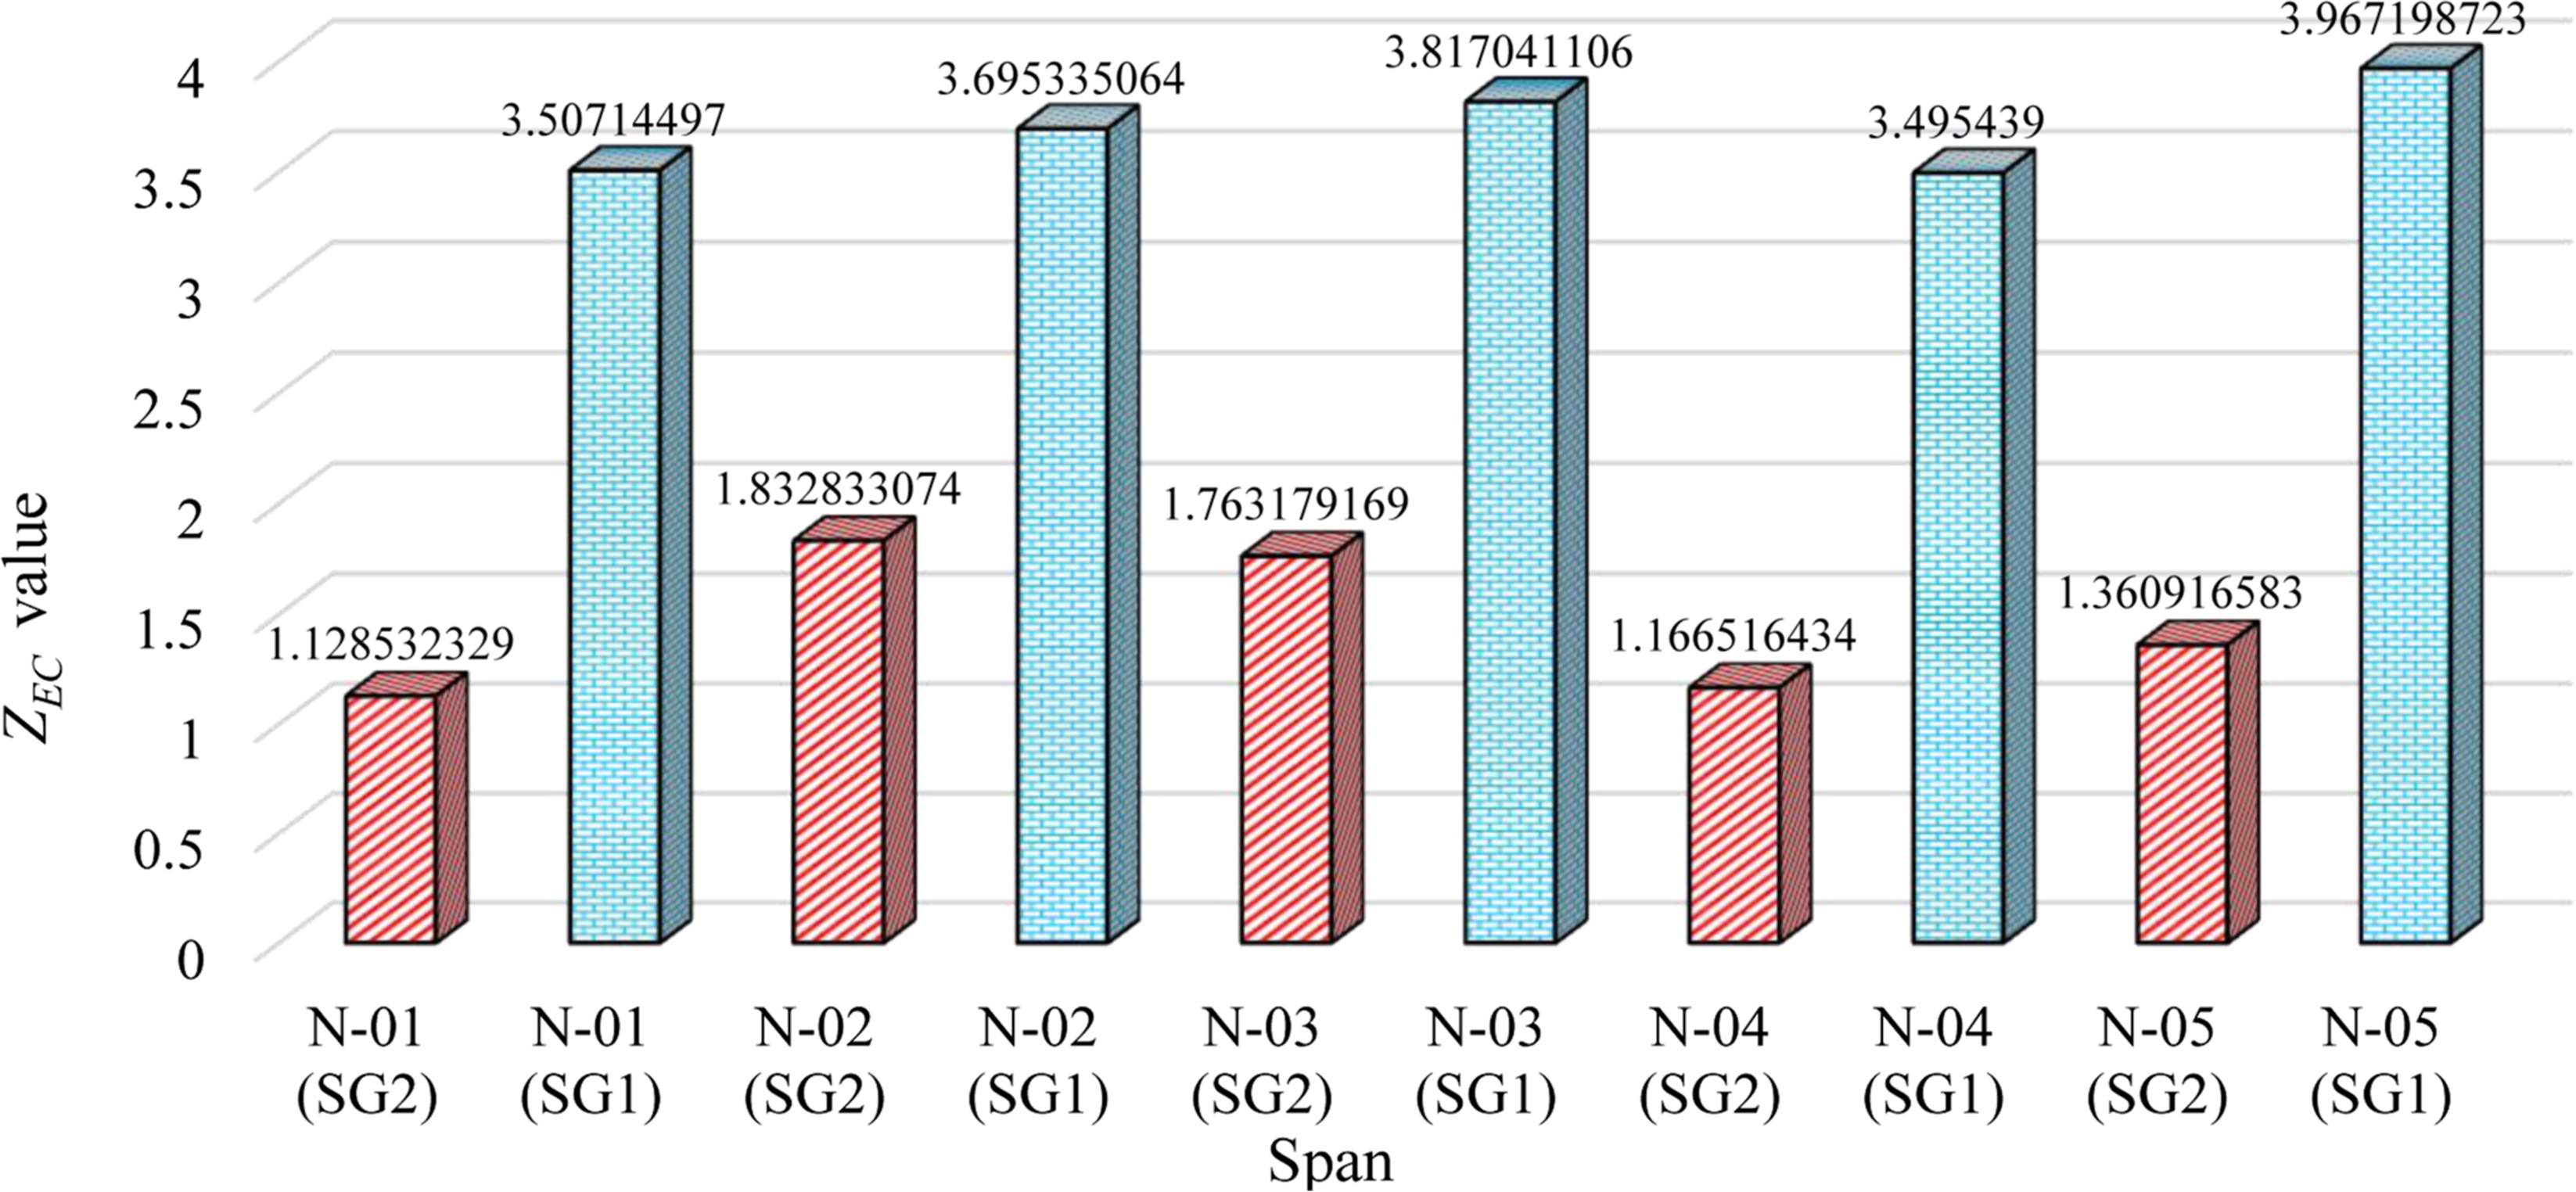
Thus, the Z EC parameters are realized from the analysis results of this manuscript, and they tend to increase when the structure of the concrete beam is weaker. The Z EC value shown in equation. (11) and equation. (23) increases when the amplitude of the PSD spectrum increases, or, in other words, the structure stiffness gradually decreases. This is a sufficiently sensitive parameter to identify structural changes despite the very small degree of change.
Structure of conjugated concrete
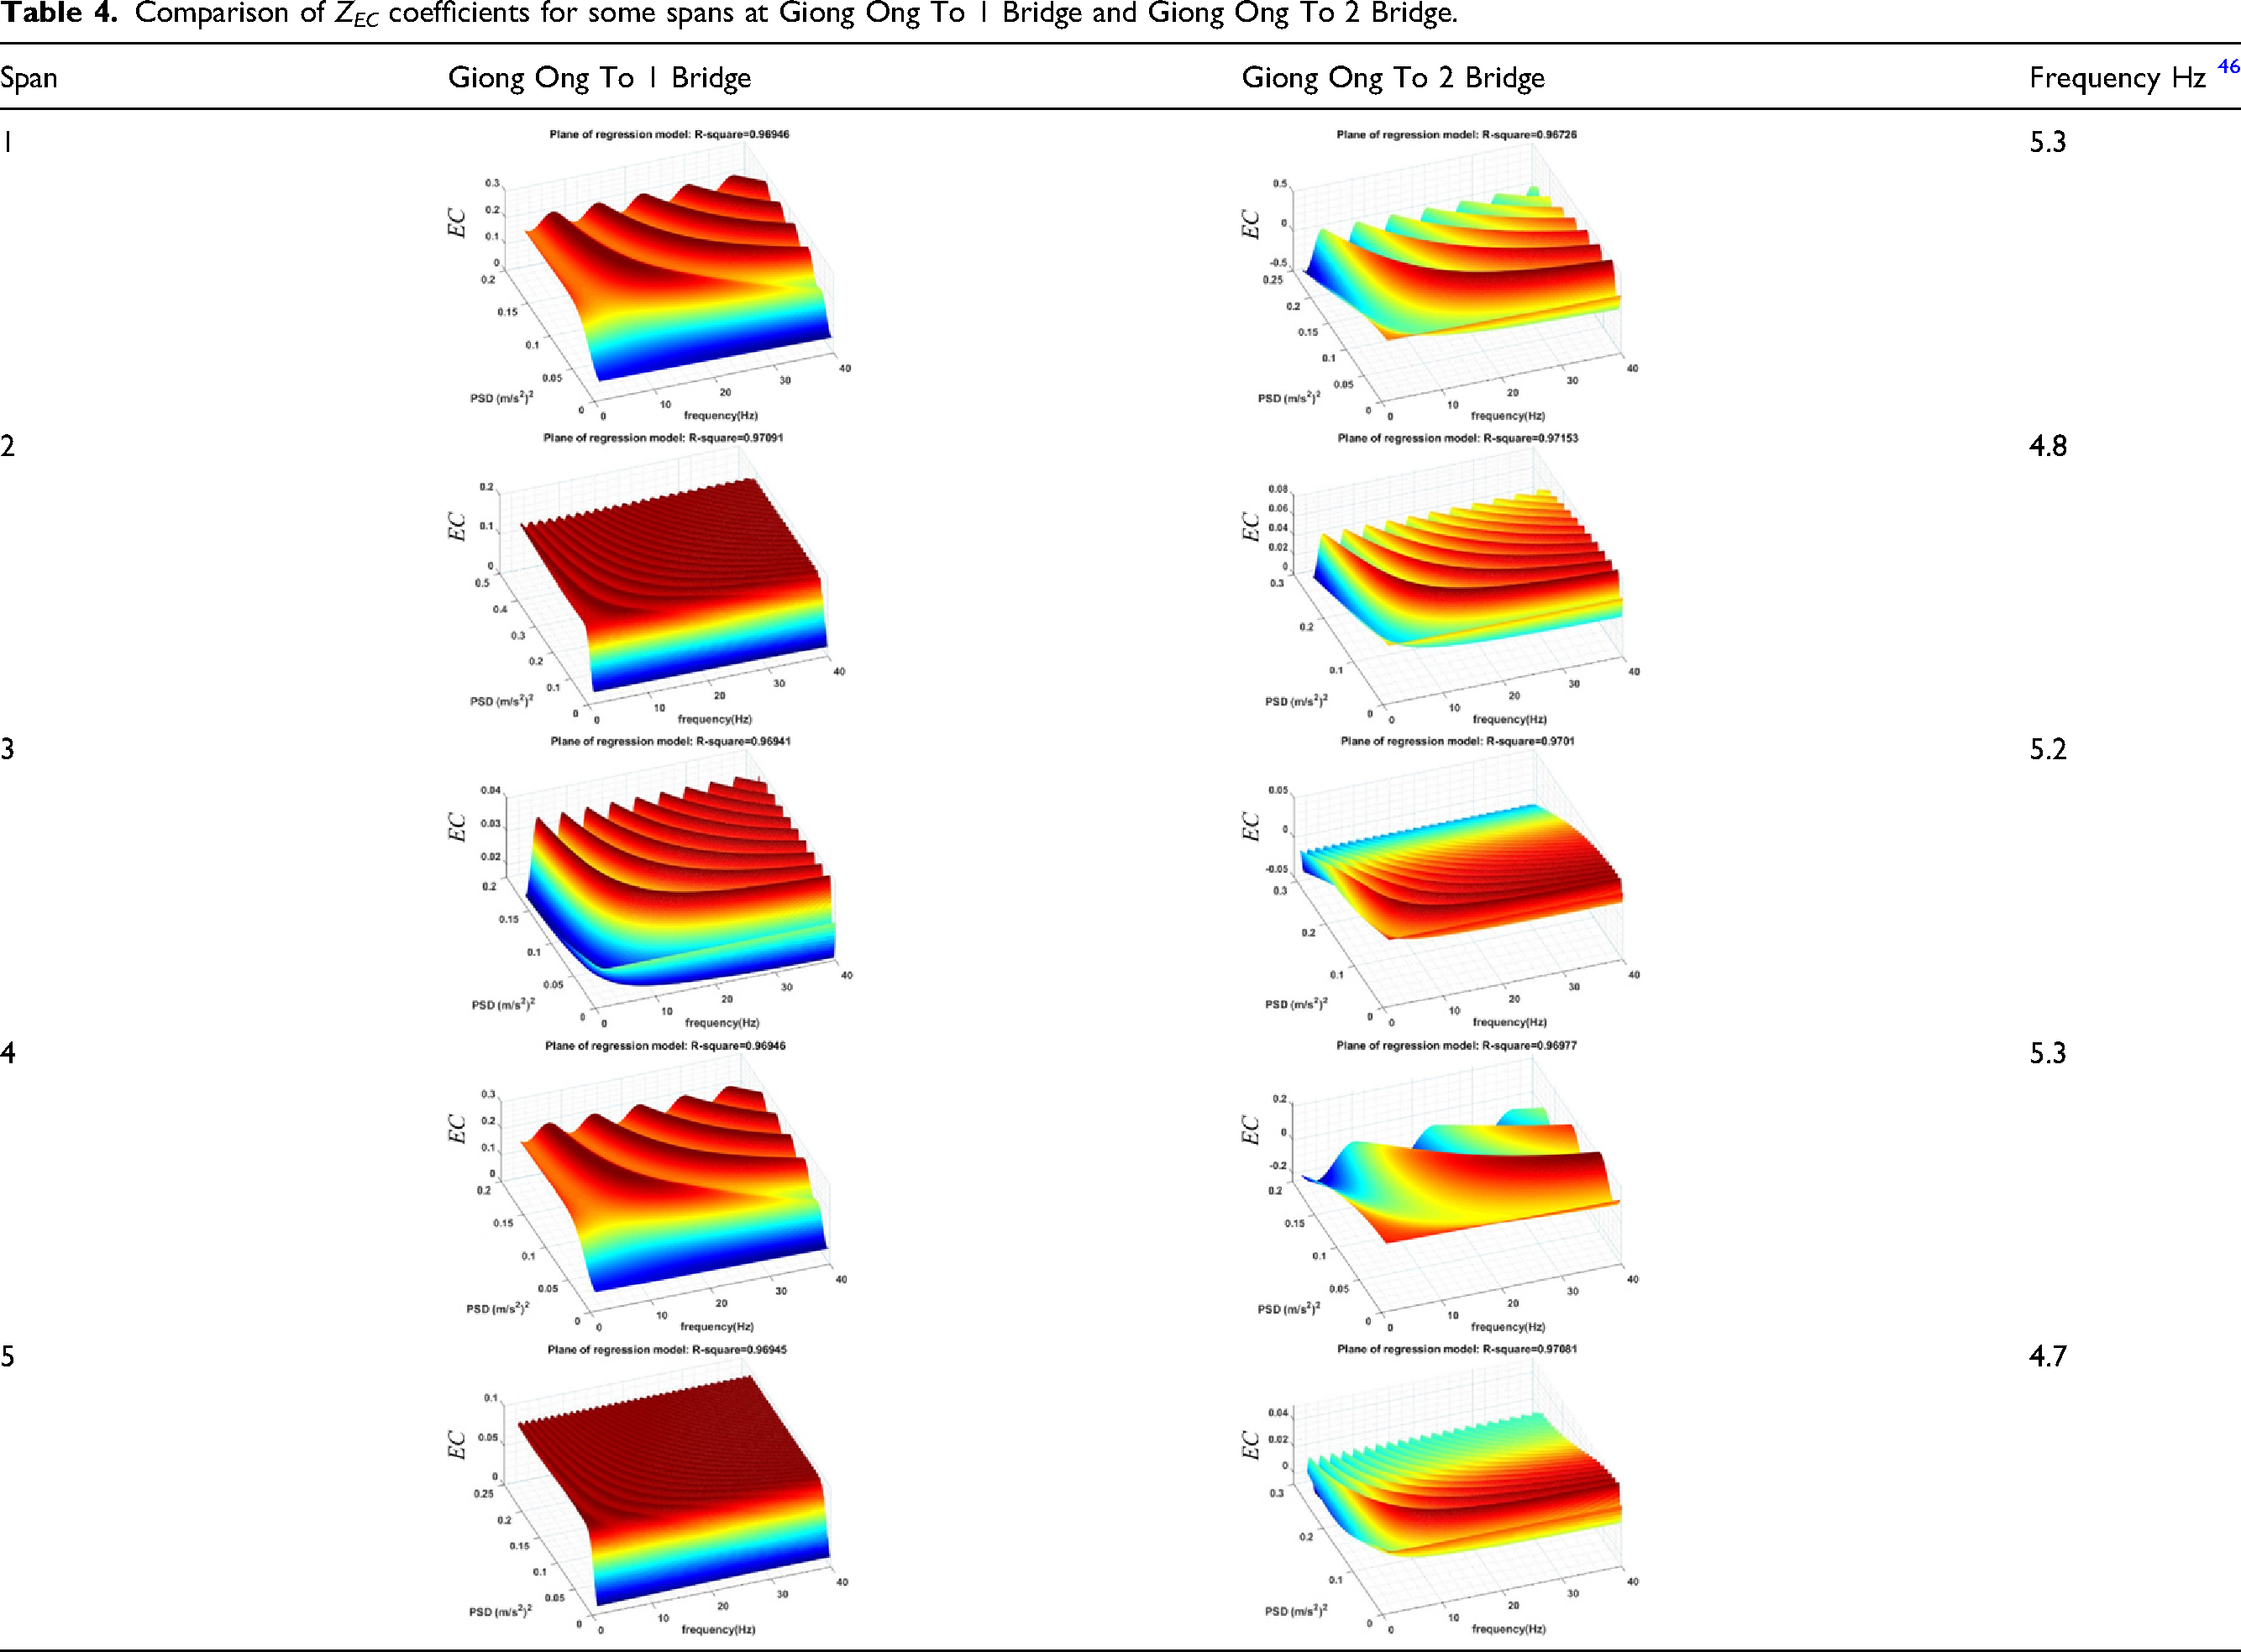
This study also surveyed two bridges with structures of conjugated concrete, which is similar to prestressed concrete structures. These two bridges, Giong Ong To Bridge 1 and Giong Ong To Bridge 2 also have similar structures but were built 15 years apart, as shown in Figure 14. The article has given the survey results of five corresponding spans in each bridge, and these spans had the same payload status during the operation. The results of the Z
EC
parameter corresponding to the actual vibration response are shown in Table 4. Parameters of Giong Ong To 1 and 2 Bridges. Comparison of Z
EC
coefficients for some spans at Giong Ong To 1 Bridge and Giong Ong To 2 Bridge.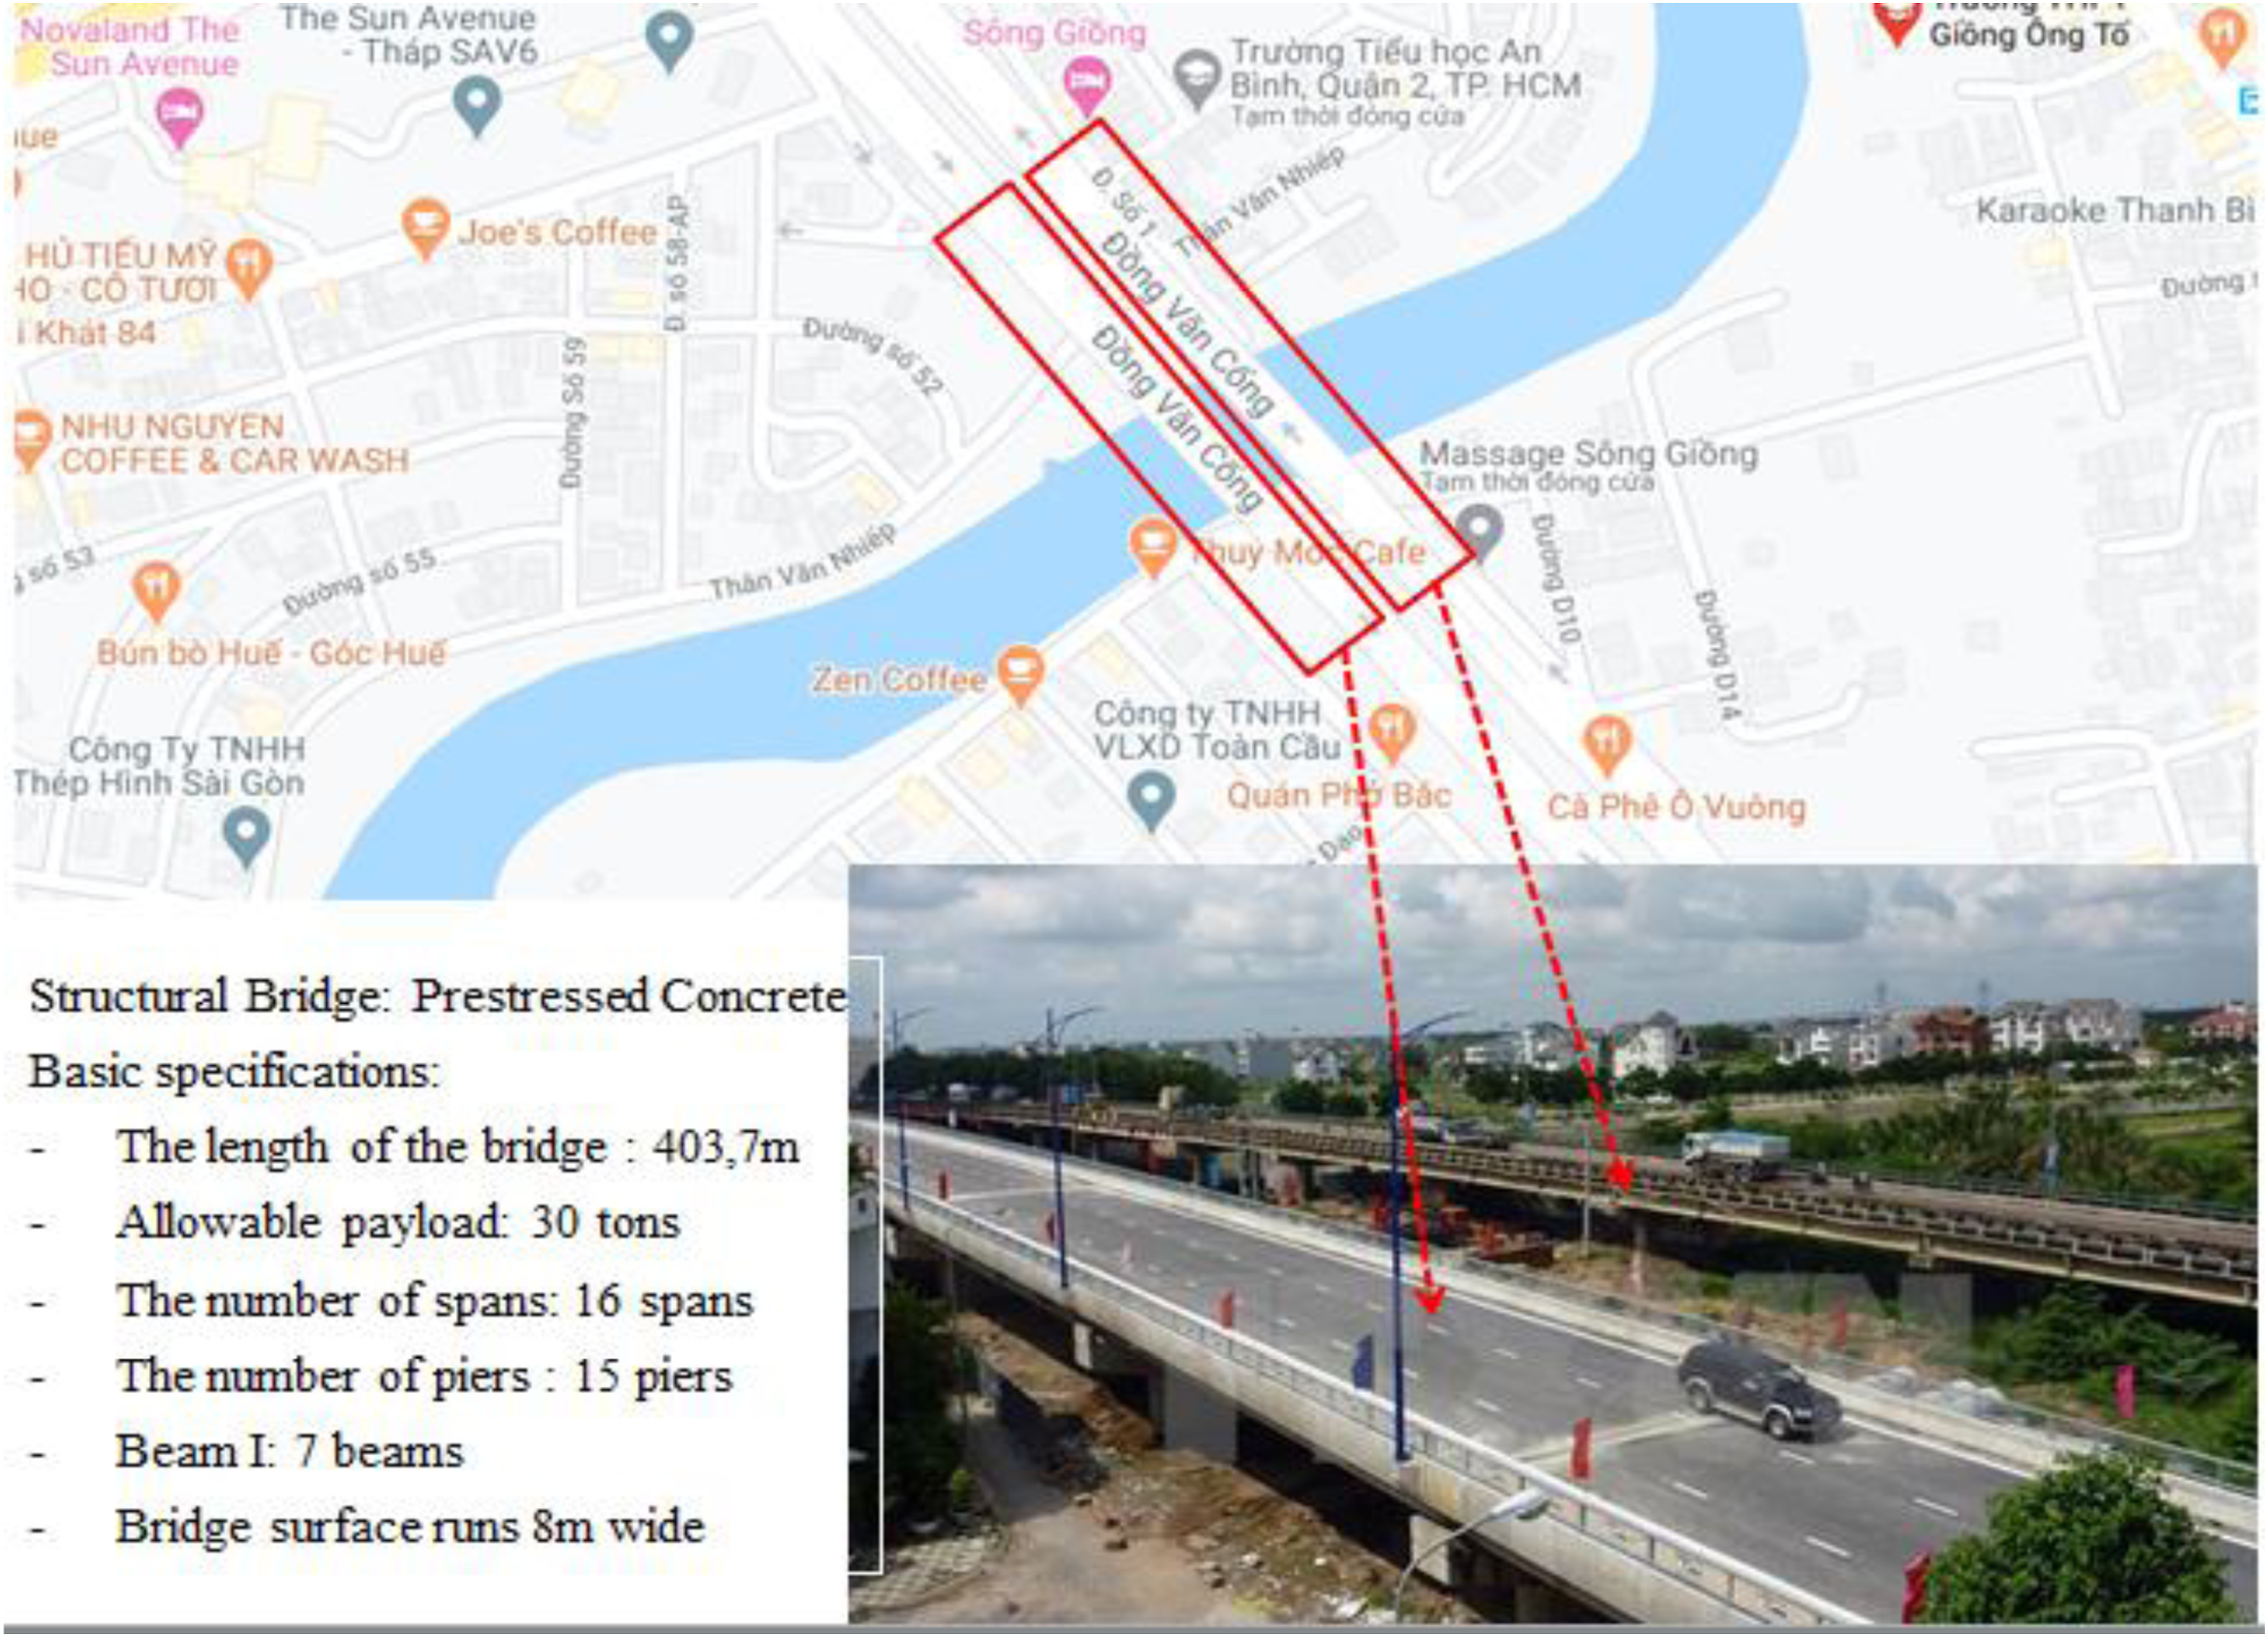
A comparison of the Z
EC
values of the two bridges for the first five spans is shown in Figure 15. The results from this article have shown the structure of conjugated concrete, and the beams’ mechanical behavior will be similar to structures made of prestressed concrete. When the girder structure is weakened due to day-to-day operation, the area relevant to the Z
EC
values increases daily. Thus, the groups of surveyed structures have similar results according to the development trend. However, the structure of conjugated concrete at the two Giong Ong To bridges shows a larger difference, as the changes in the Z
EC
value usually occur more rapidly. Comparison of ZEC values of Giong Ong To 1 and Giong Ong To 2 bridges.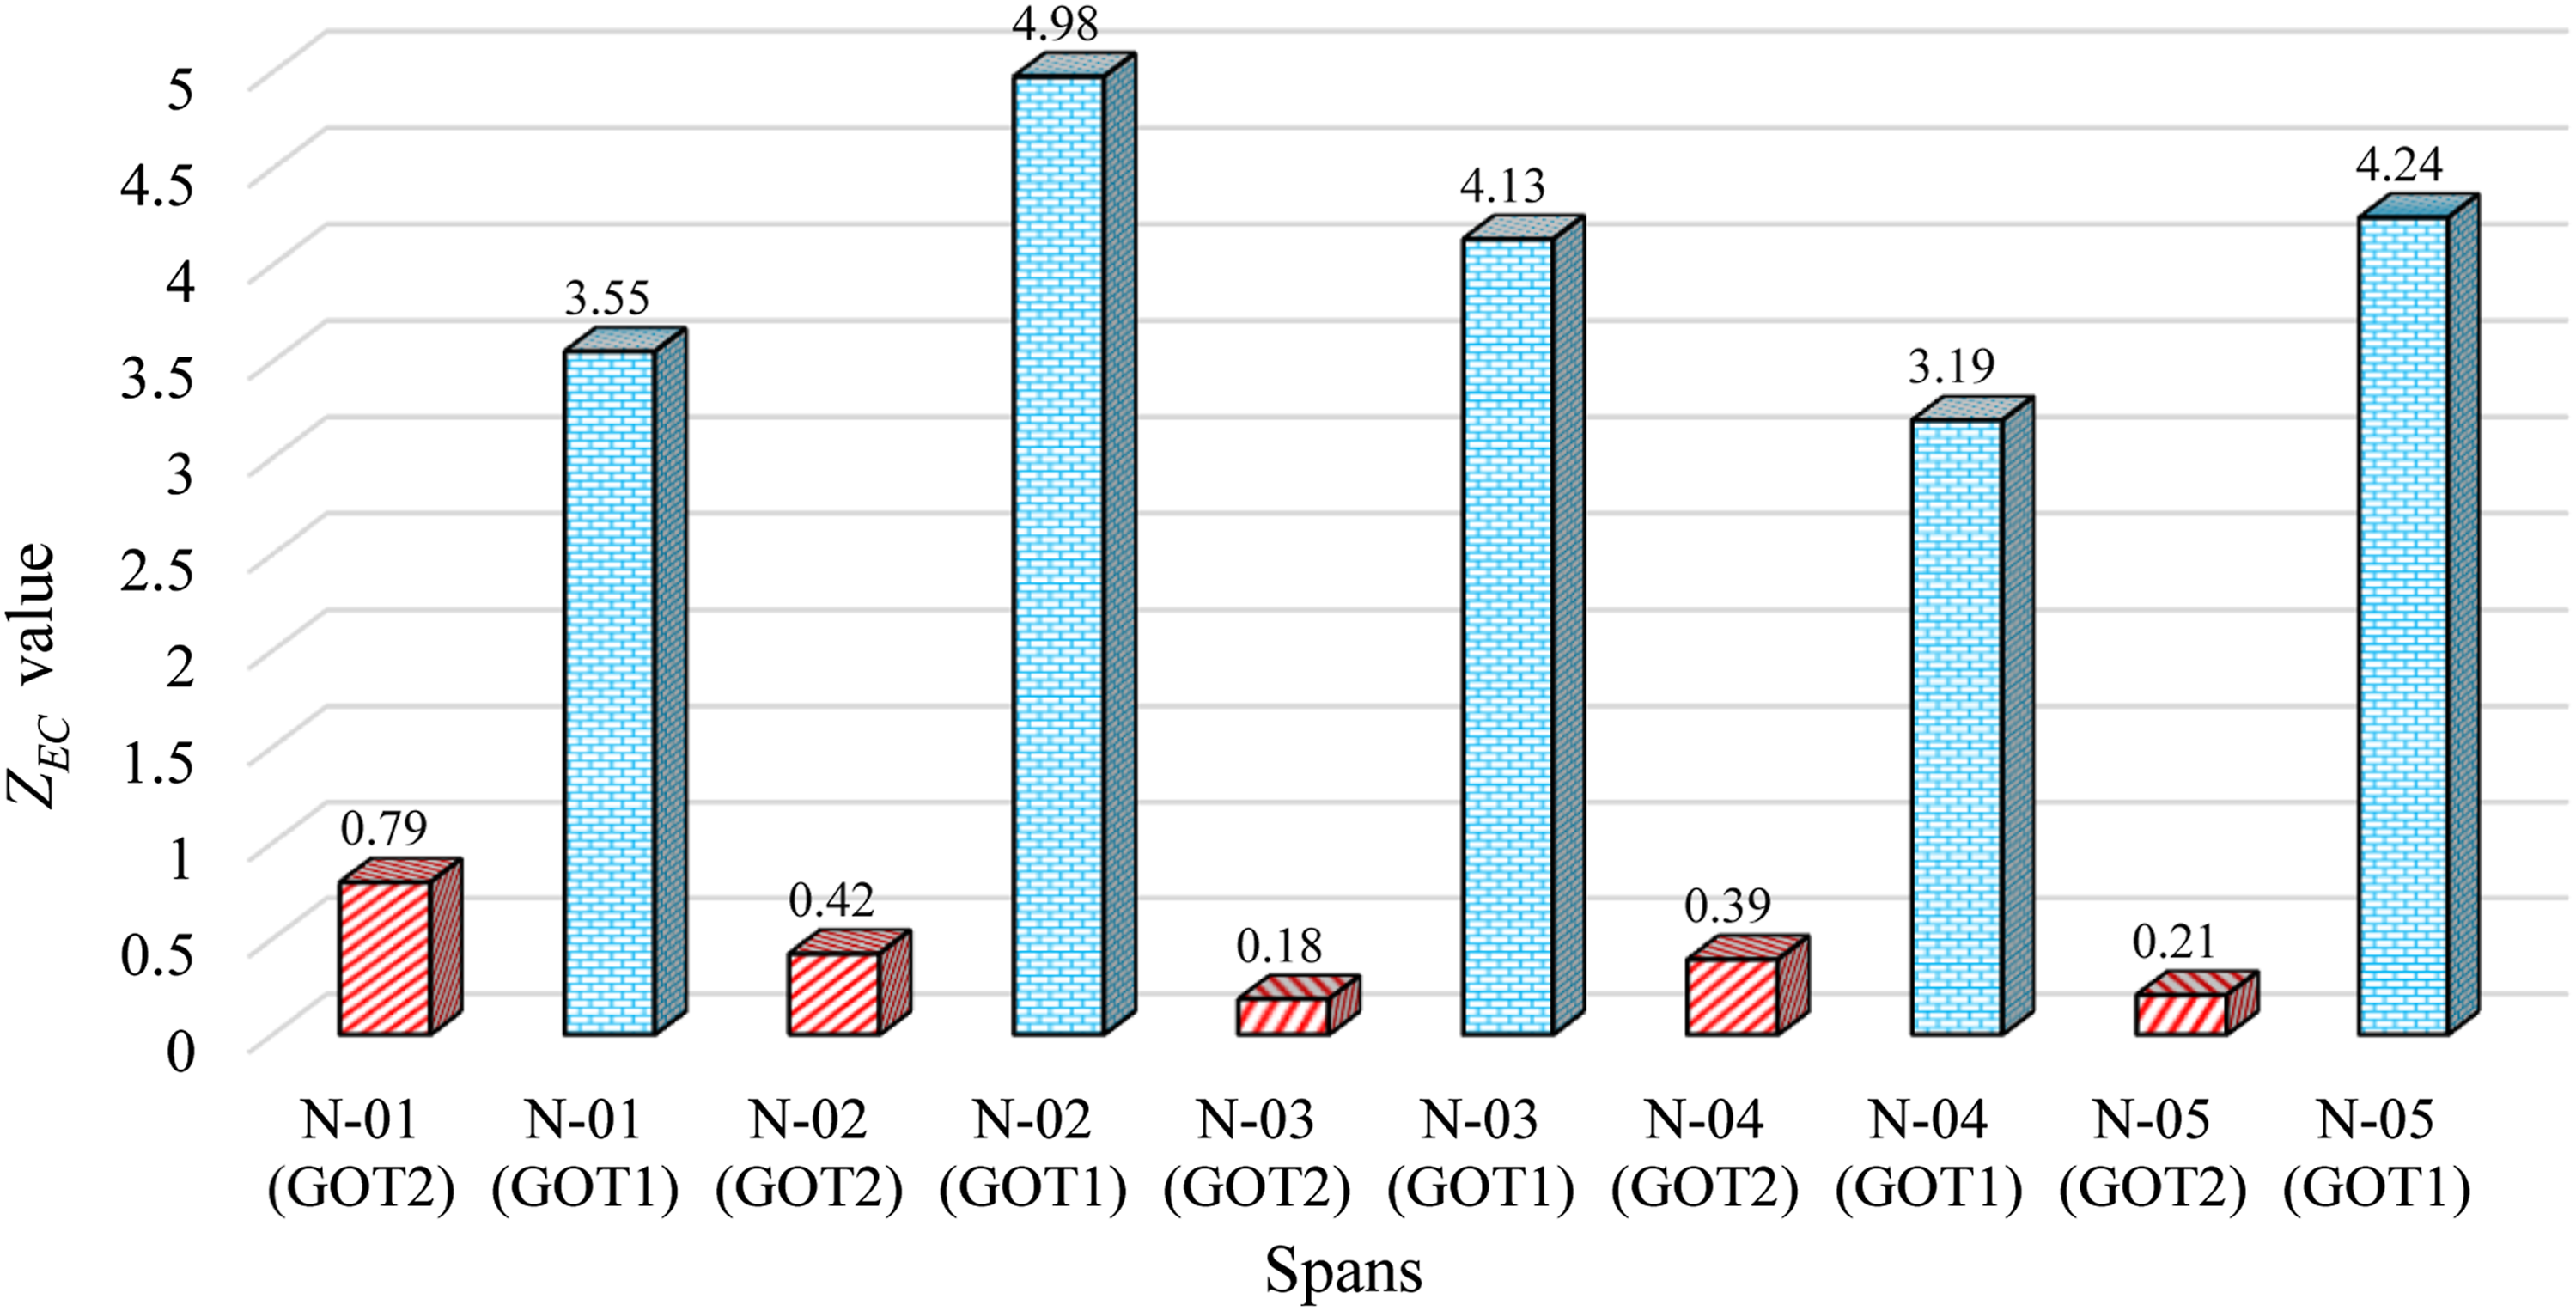
Conclusion
Evaluating the changes in the mechanical properties of some concrete structures by the regression method with Z EC values based on deep learning is suggested in this manuscript. The study has proposed the Z EC concept as a useful parameter for the quality assessment of concrete structures by expanding the Hooke’s Law principle using a nonlinear model. Through this method, the results have shown the Z EC values distributed with the structure’s various levels of changes. These values are distributed with different shapes depending on the structural type and the structural status. Through the field survey, the prestressed and conjugated concrete structures have the same development trend, accordingly, in that the more a structure exhibits mechanical changes, the more the Z EC values tend to increase. This trend has proved one thing, according to the structure’s aging process: the more pronounced the distribution of Z EC values, the greater the distribution level, and the wider the distribution range. This means that the ratio of damping coefficient C and elastic modulus E will become increasingly unstable when the structure weakens. The results of this study promise to offer a new direction in the evaluation of concrete structure quality. In the future, we will carry out the qualitative research with the main purpose of perfectly implementing this new testing method.
Footnotes
Declaration of conflicting interests
Authors confirm that the intellectual content of this paper is the original product of our work and all the assistance or funds from other sources have been acknowledged. The authors declare that they have no conflict of interest.
Funding
This research is funded by Thu Dau Mot University, Binh Duong Province, Vietnam under grant number DT.21.2.068
Declaration of interest statement
This is to certify that to the best of authors’ knowledge, the content of this manuscript is original. The paper has not been submitted elsewhere nor has been published anywhere. Authors confirm that the intellectual content of this paper is the original product of our work and all the assistance or funds from other sources have been acknowledged.
Data availability statement
All data generated or analyzed during this study are included in this published article (and its supplementary information files).