
Abstract
The level of annoyance is an important basis to determine the acceptable degree of noise and develop noise standards. Psychoacoustic annoyance (PA) calculated by Zwicker’s model and perceived annoyance (such as mean annoyance, MA and the percentage of highly annoyed population, %HA) obtained through individual self-reports are widely used. PA and MA (or %HA) cannot be directly compared because the ranges of their values are different. Thus, the conversion relationship of PA and MA (or %HA) needs to be developed. As a case study, the model between PA and MA (or %HA) of substations noise was established and the rationality of model was verified. Results showed that the maximum value of the difference of MA (or %HA) between the calculation result of model and experimental result was less than 0.89 (or 15%). In this way, the perceived annoyance of substation noise samples can be determined by calculation without experiments.
Keywords
Introduction
Including a series of negative emotions such as dissatisfaction, bother, and disturbance, annoyance is the direct perception of human body to noise.1,2 The level of annoyance is an important basis to determine the acceptable degree of noise and develop noise standards.
3
Psychoacoustic annoyance (PA) calculated by Zwicker’s model
4
and perceived annoyance obtained through individual self-reports are widely used. As the mainstream evaluation indices of noise annoyance obtained through listening experiments or socio-acoustics surveys,
5
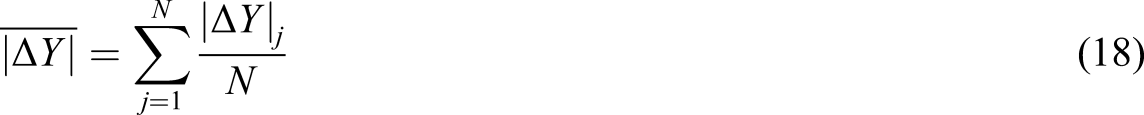
mean annoyance (MA) and the percentage of highly annoyed population (%HA) can characterize the level of perceived annoyance very well. MA is the mean of perceived annoyance of all subjects (or interviewees) (see equation (1)).
6
%HA is the percentage of highly annoyed people in all subjects (or interviewees), which was put forward by Schultz in 1978. Schultz
7
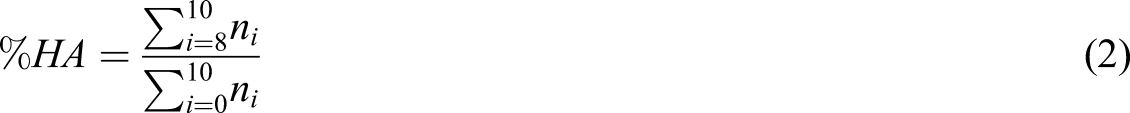
suggested to regard subjects (or interviewees) responding on the upper 27%–29% of the annoyance scale as highly annoyed people. When the 11-point numerical scale specified by ISO 15666-2003 is used to evaluate the perceived annoyance of noise, %HA will be the proportion of people choosing the annoyance rating of 8, 9, or 10 (see equation (2))
8

MA and %HA can be obtained through listening experiments or socio-acoustics surveys in which the number of subjects (or interviewees) should meet statistical requirements and a large number of volunteers need to be recruited. In the process of experiments or surveys, the cost of manpower, equipment, and time is large. The method calculating MA or %HA of noise by the prediction model can save the cost above. Previous studies have developed many prediction models of MA or %HA for different types of traffic noise, industrial noise, community noise, etc.,9,10 while these models used different acoustic parameters. Based on loudness (N), sharpness (S), fluctuation strength (F), and roughness (R), Zwicker 4 established a psychoacoustic annoyance (PA) model suiting for different types of noise.11,12 However, Zwicker’s model did not consider the influence of tonality and to some extent underestimated the annoyance of tonal noise. 13 Therefore, Di et al. 14 improved Zwicker’s model through introducing tonality into PA model. Chen 12 and Novaković 15 applied the improved Zwicker’s model to the annoyance evaluation of high-speed rail noise and vacuum cleaner noise, respectively, which indicated that PA calculated by improved Zwicker’s model had a high correlation with MA obtained through listening experiments.
PA and MA (or %HA) cannot be directly compared because the ranges of their values are different. If the conversion relationships of PA and MA (or %HA) of different types of noise are established, MA (or %HA) will be quickly determined according to PA of noise. It can save the cost of listening experiments or socio-acoustic surveys and facilitate comparing the annoyance of different noises.
In order to study the conversion relationship of PA and MA (or %HA), MA and %HA of substation noise were obtained through listening experiments, and PA was calculated by the improved Zwicker’s model. The model between PA and MA (or %HA) of substation noise was established through the logistic function, 16 and the rationality of model was verified.
Methods
Noise samples used in experiments
Previous studies showed that low-frequency and tonal noise caused annoyance easily. Substation noise is a typical low-frequency and tonal noise.
17
The spectrums of typical noise samples are shown in Figure 1. According to Figure 1, substation noise has an obvious peak value at the frequency of 100 Hz and its harmonic frequencies and the sound energy at the frequency of 100 Hz is dominant. The spectrums of noise samples in the substations of 500 kV, 750 kV, and 1000 kV.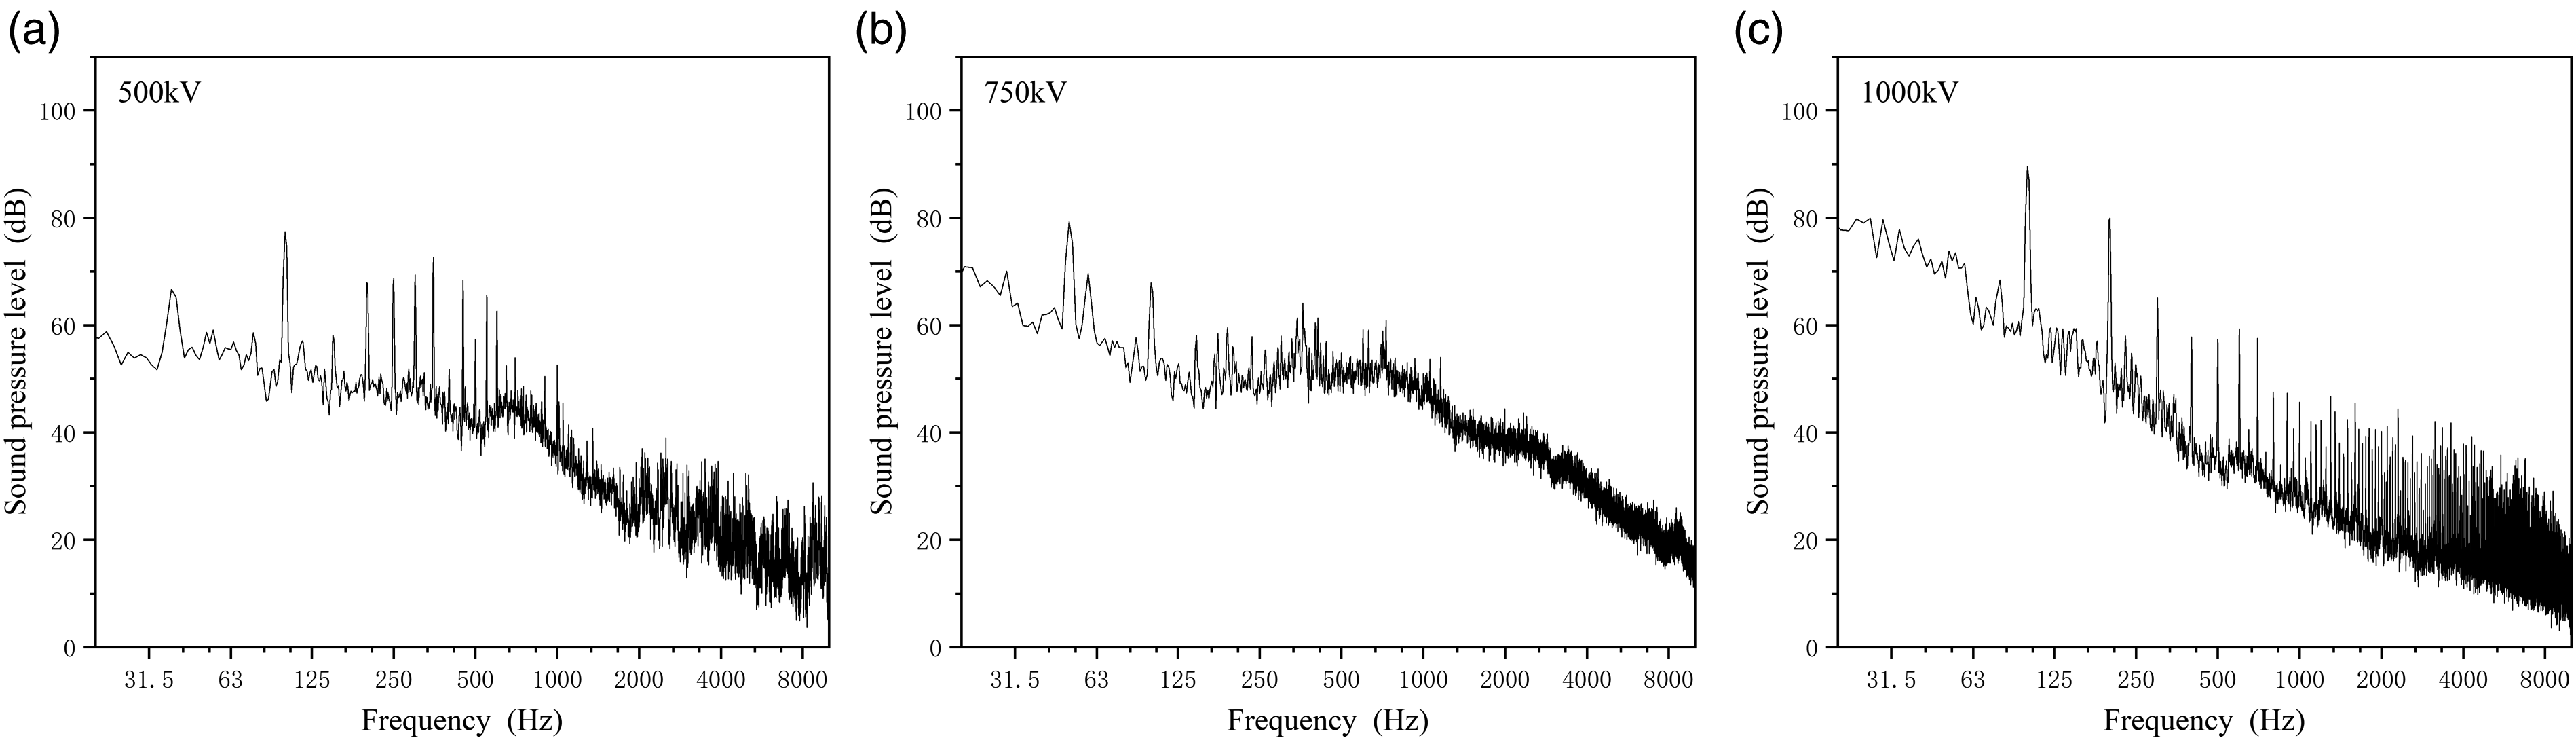
In the substations of 500 kV, 750 kV, and 1000 kV, the sizes of single phase of the main transformer are 11 m (L) × 11 m (W) × 5 m (H), 13 m (L) × 13 m (W) × 6 m (H), and 19m (L) × 19 m (W) × 8 m (H), respectively. As shown in Figure 2, noise sampling points were located at two sampling lines perpendicular to the main transformer. The distances between sampling point and transformer were 0.5 m, 1 m, 1.5 m, 2 m, 2.5 m, 3 m, 3.5 m, 4 m, 4.5 m, 5 m, 6 m, 7 m, 8 m, 9 m, 10 m, 15 m, 25 m, 30 m, 40 m, 50 m, 60 m, 70 m, 80 m, 90 m, 100 m, 120 m, 140 m, 160 m, 180 m, and 200 m, respectively. If the difference between the noise level at a certain sampling point and background noise level was less than 0.5 dB(A), noise of sampling points at further distance would not be sampled. It means that the noise at the farthest sampling point from transformer was close to background noise. During the sampling, the transformer was in normal operation and the weather was clear and windless. Diagram of noise sampling lines.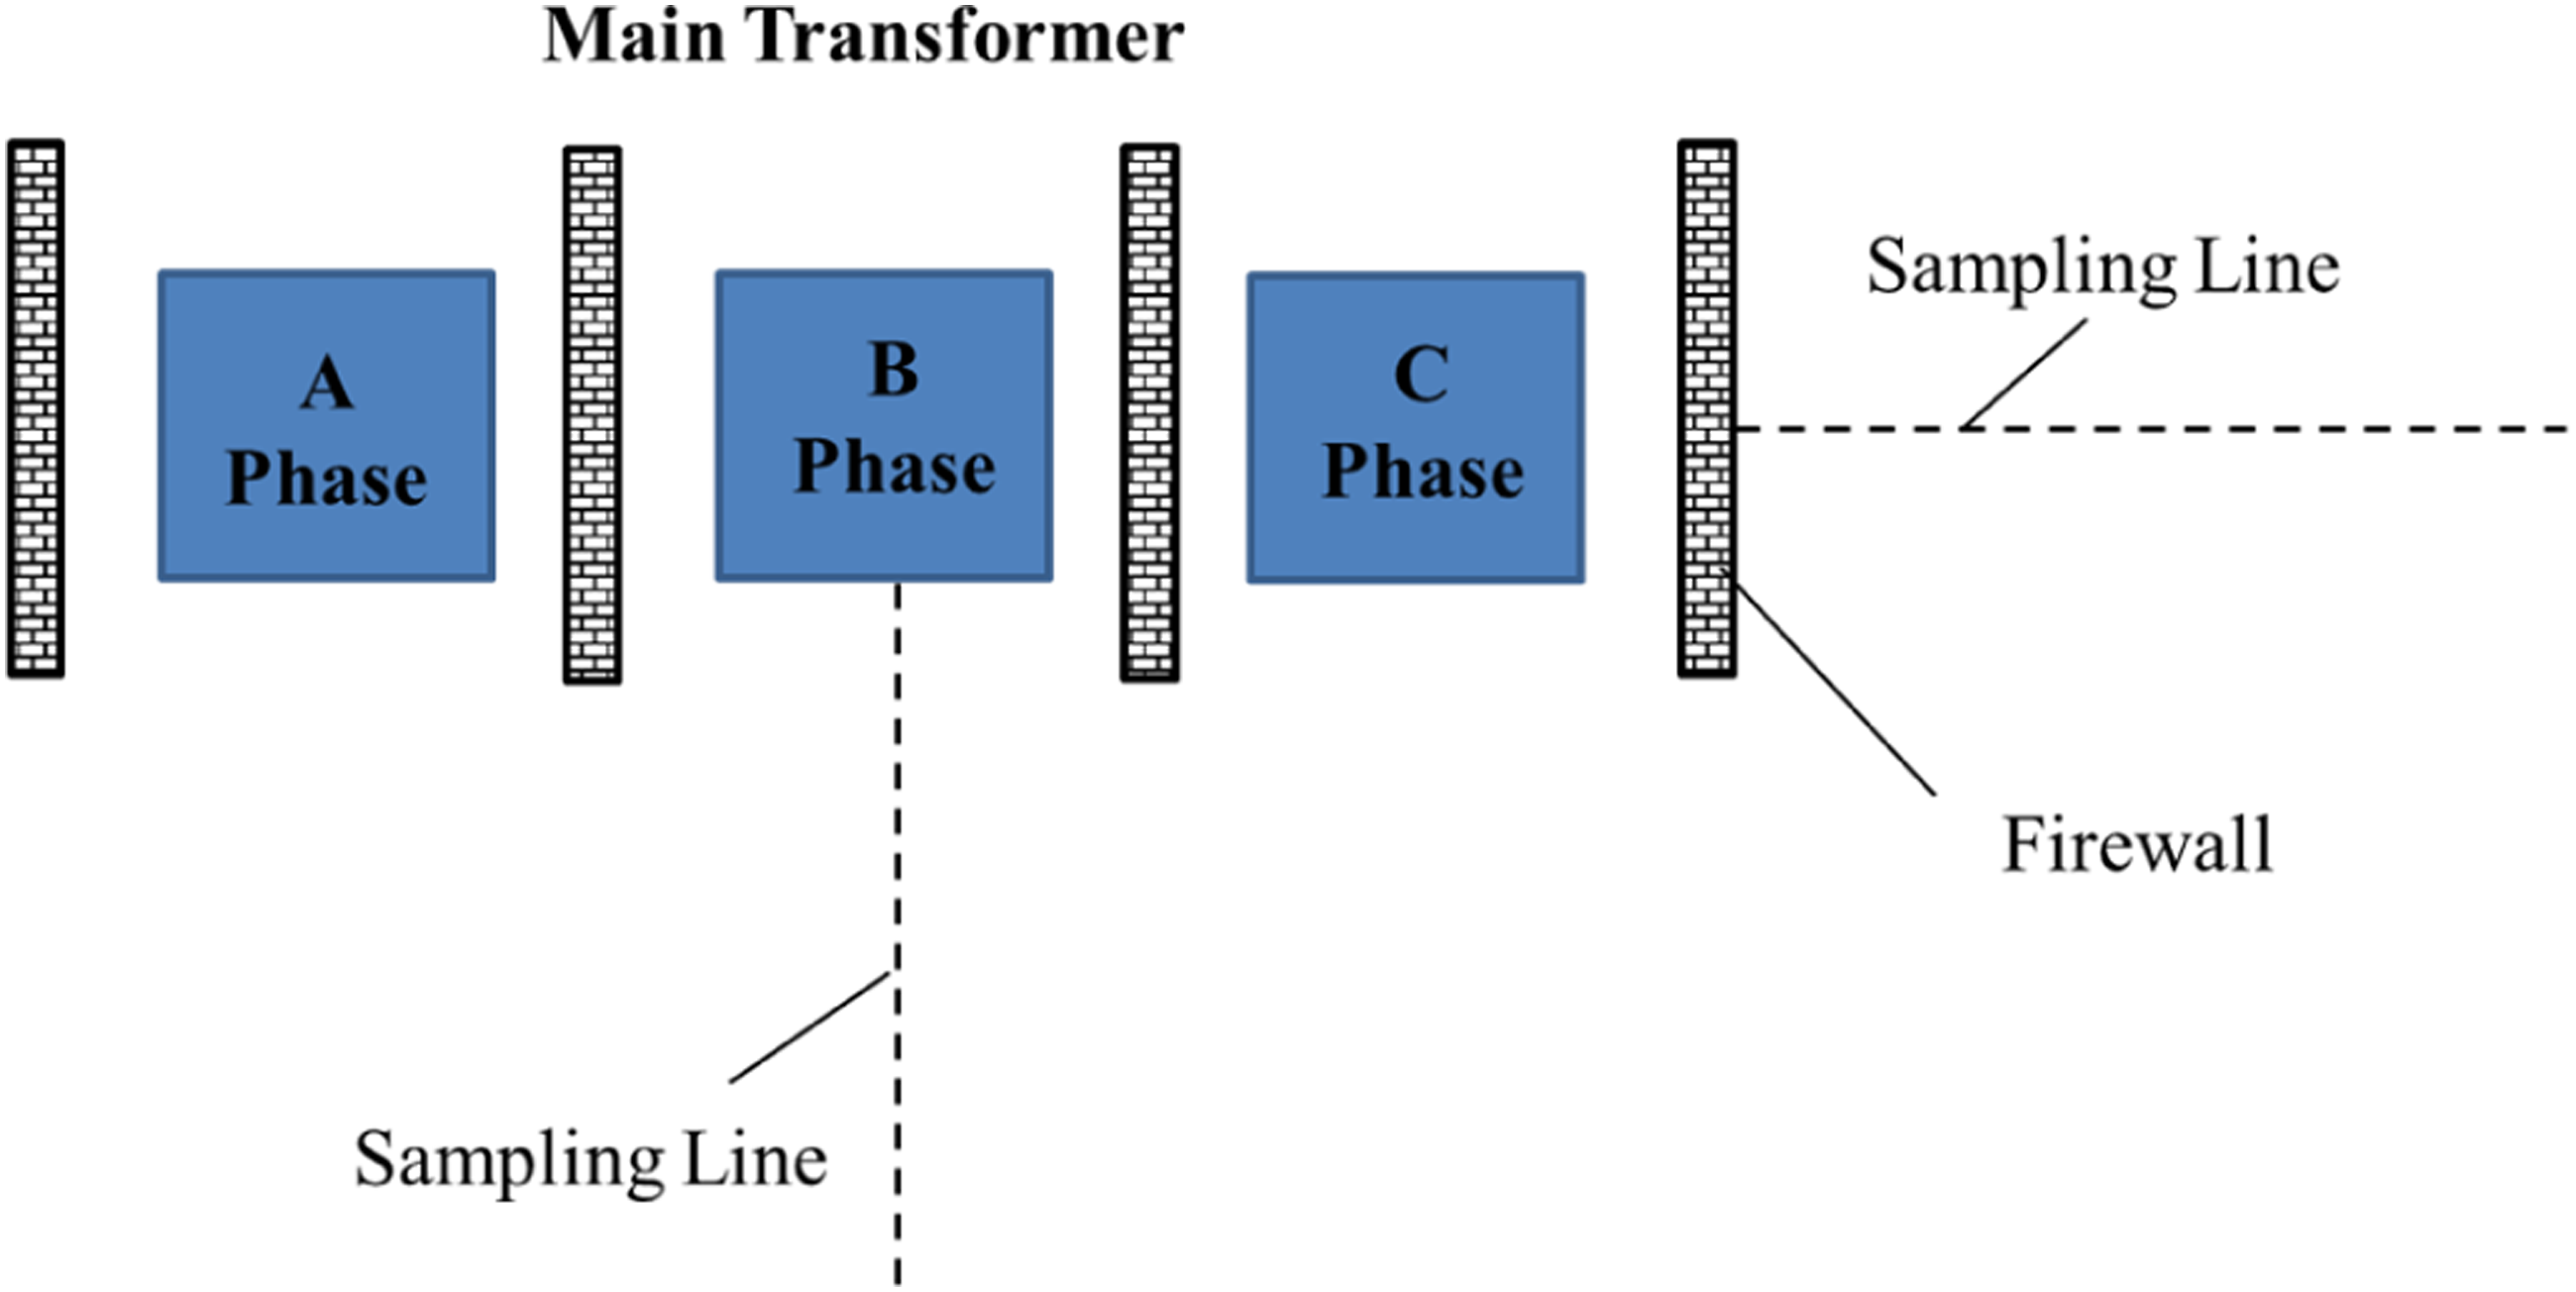
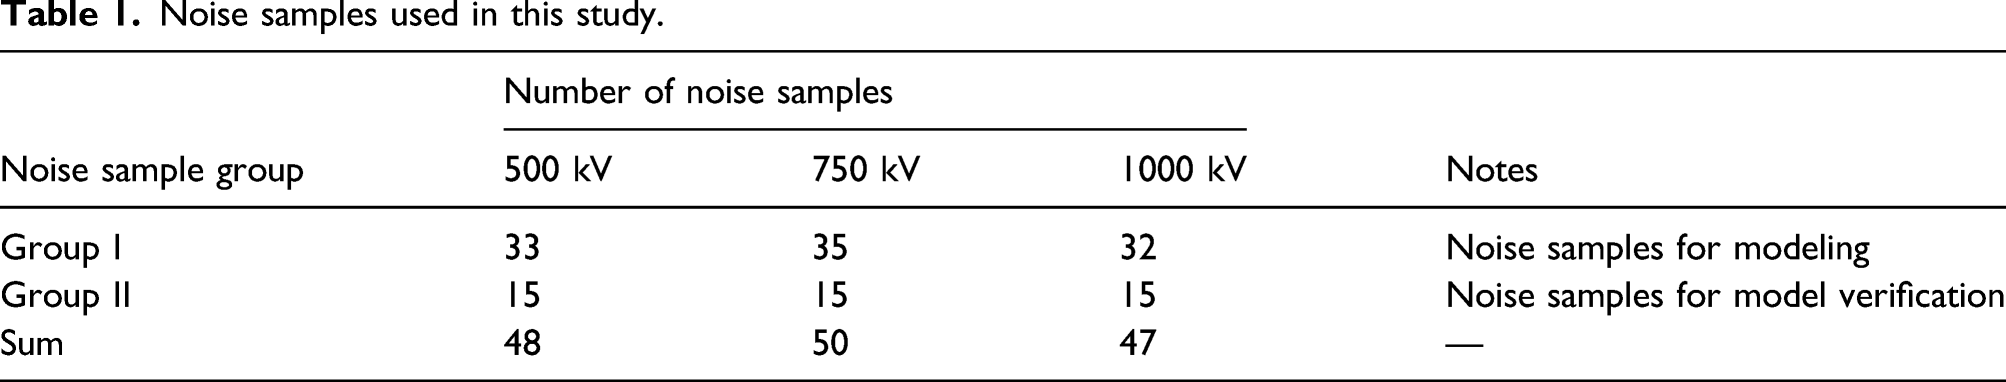
48, 50, and 47 noise samples in 500 kV, 750 kV, and 1000 kV substations were recorded by Artificial Head HMS IV.1 (Head Acoustics, Germany), respectively. A-weighted sound pressure levels of all noise samples were between 40 dB(A) and 80 dB(A). Hardly being disturbed by other noises, each sample with the duration of 5 s was extracted from original sample by ArtemiS 10.0 software.
Noise samples used in this study.
The calculation of noise psychoacoustics annoyance
The Zwicker’s model improved by Di
14
(see equations (3)–(6)) was used to calculate PA of each noise sample


Experimental site and equipment
Experiments were conducted in a soundproof room (3 m (L) × 2 m (W) × 3 m (H)) where the background noise was smaller than 25 dBA. The audio playback system used in experiments consists of a computer with ArtemiS 10.0 software, a digital equalizer (Head Acoustics PEQ V), a distribution amplifier (Head Acoustics HDA IV. 1), and four high quality headphones (Sennheiser HD 600).
Experimental procedures
290 college students aged 20 to 25 (137 males and 153 females) with normal hearing were randomly recruited as the experimental subjects. Before experiments, subjects listened to experimental instructions. After calming down, subjects accepted noise exposure through headphones after a short rest. In the 11-point numerical scale specified by ISO 15666-2003, 0 represented not annoyed at all and 10 represented extremely annoyed. After each noise sample was played, subjects chose a number to evaluate the annoyance rating of noise.
Statistical analysis
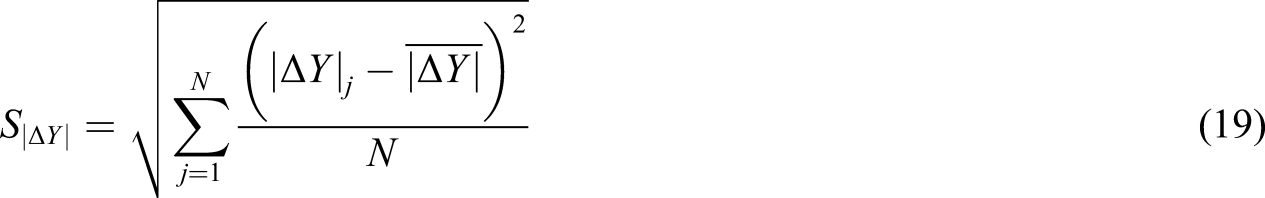
In the evaluation data of noise annoyance, misjudgment data from subjects should be eliminated through testing. In this study, if the difference between any two evaluation values of the same sample is more than 2, three evaluation values of the same sample will be regarded as invalid data and be eliminated. 18 MA and %HA of each noise sample were, respectively, calculated according to equations (1) and (2).
Theoretically, MA increases with the increase of PA. The range of MA is from 0 to 10. MA takes 0 when PA is less than a certain value, and MA takes 10 when PA is greater than another certain value. Thus, the conversion relationship of PA and MA is consistent with the logistic function. In this study, PA–MA models for substation noise were established through the logistic function shown in equation (7). Similarly, PA–%HA models were established through the logistic function shown in equation (8)

Results and discussions
PA–MA and PA–%HA model for substation noise
PAs and MAs (or %HAs) of 100 substation noise samples used to establish models of PA–MA (or PA–%HA) are shown in Figure 3 (or Figure 4). According to the logistic function shown in equation (7), three models of PA–MA suiting for substation noise of different voltage levels (500 kV, 750 kV, and 1000 kV), Model 1 (see equation (9)), Model 2 (see equation (10)), and Model 3 (see equation (11)), and one model of PA–MA without distinguishing the voltage level of substations, Model 4 (see equation (12)), were established (see Figure 3). The coefficients of determination (R2) of models of PA–MA were 0.97, 0.98, 0.95, and 0.96, respectively. Results above showed that four models of PA–MA all could well characterize the relationship between PA and MA whether or not the voltage level of substations was distinguished. The fitted curve of PA–MA model. The fitted curve of PA–%HA model.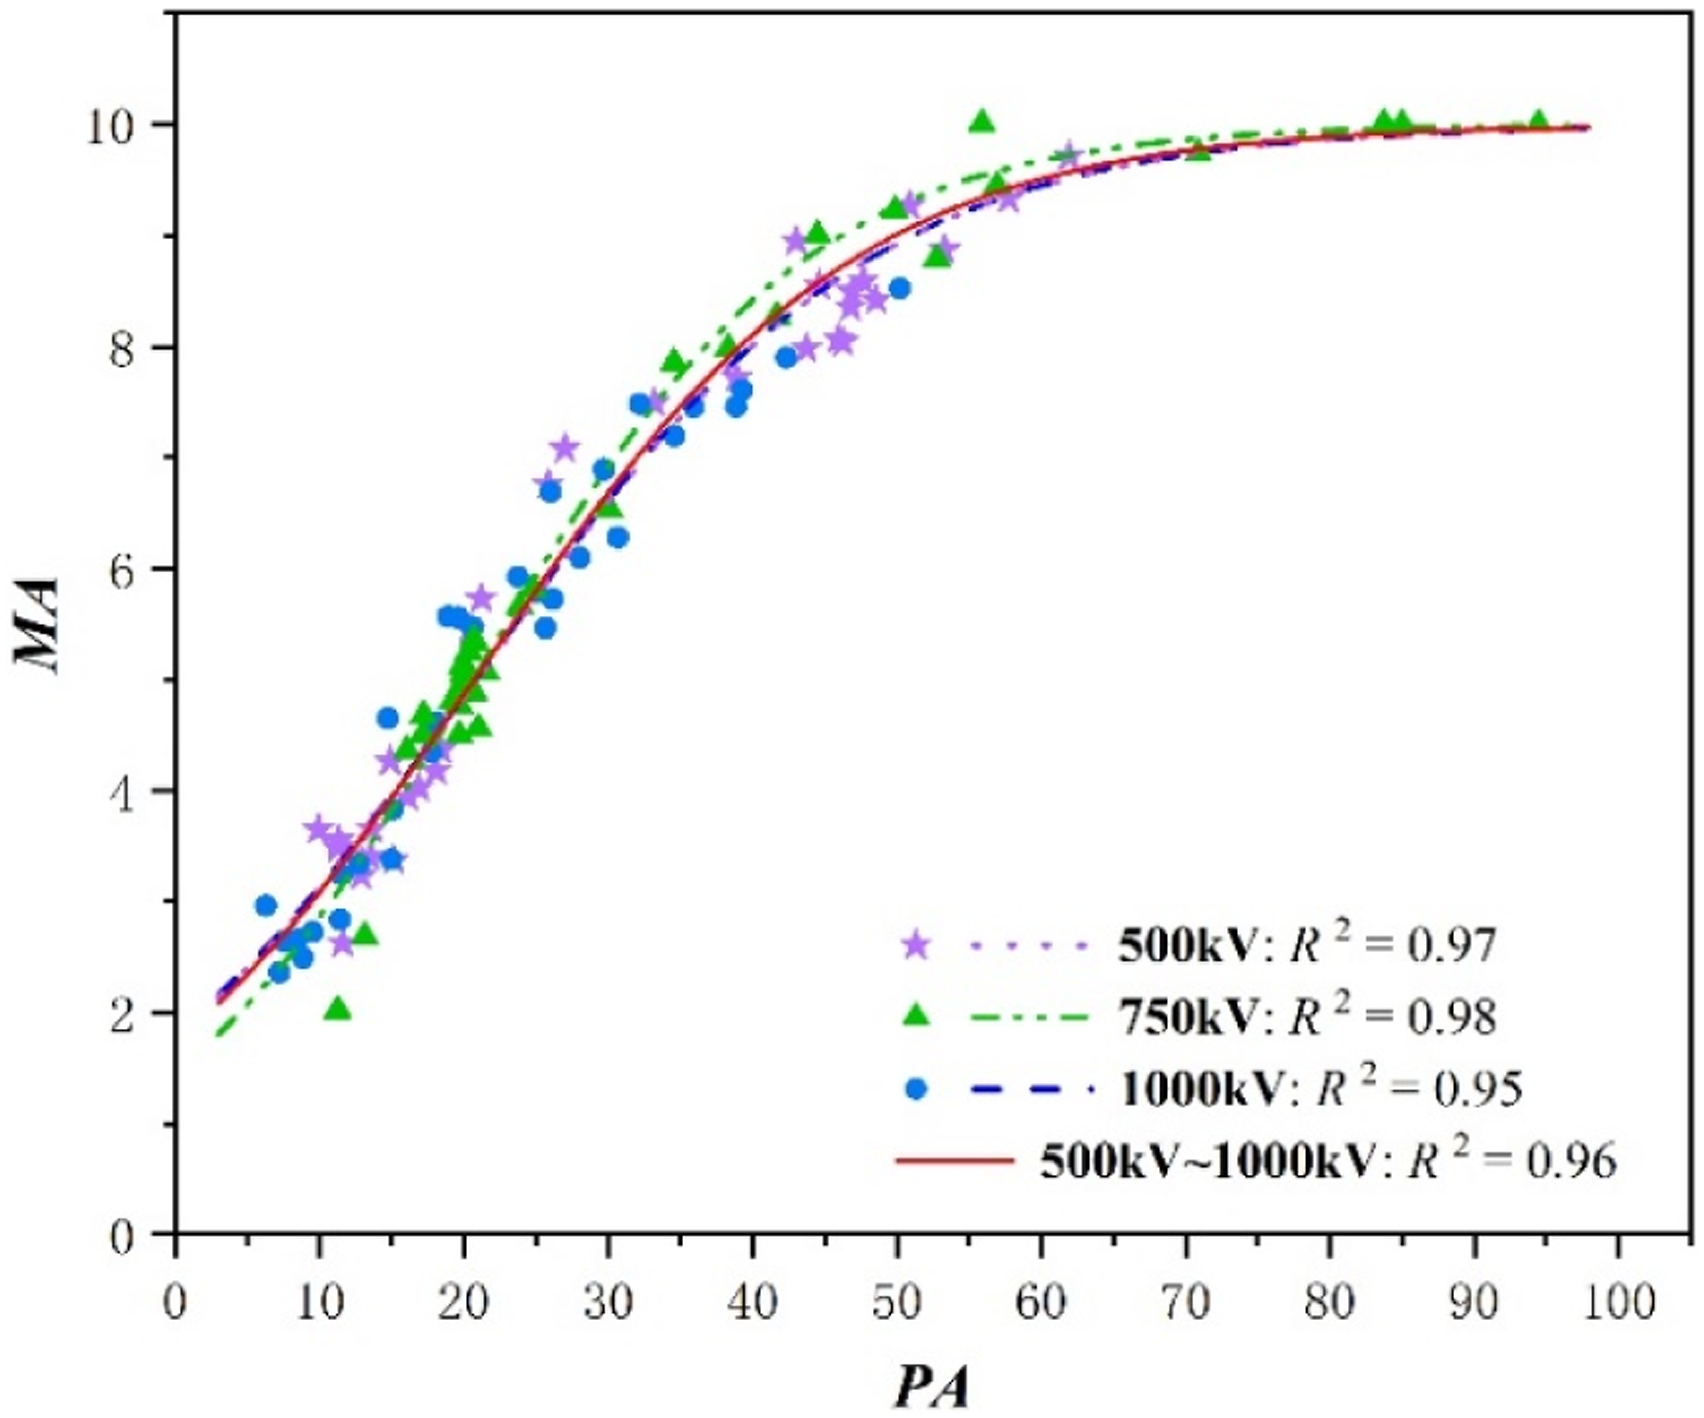
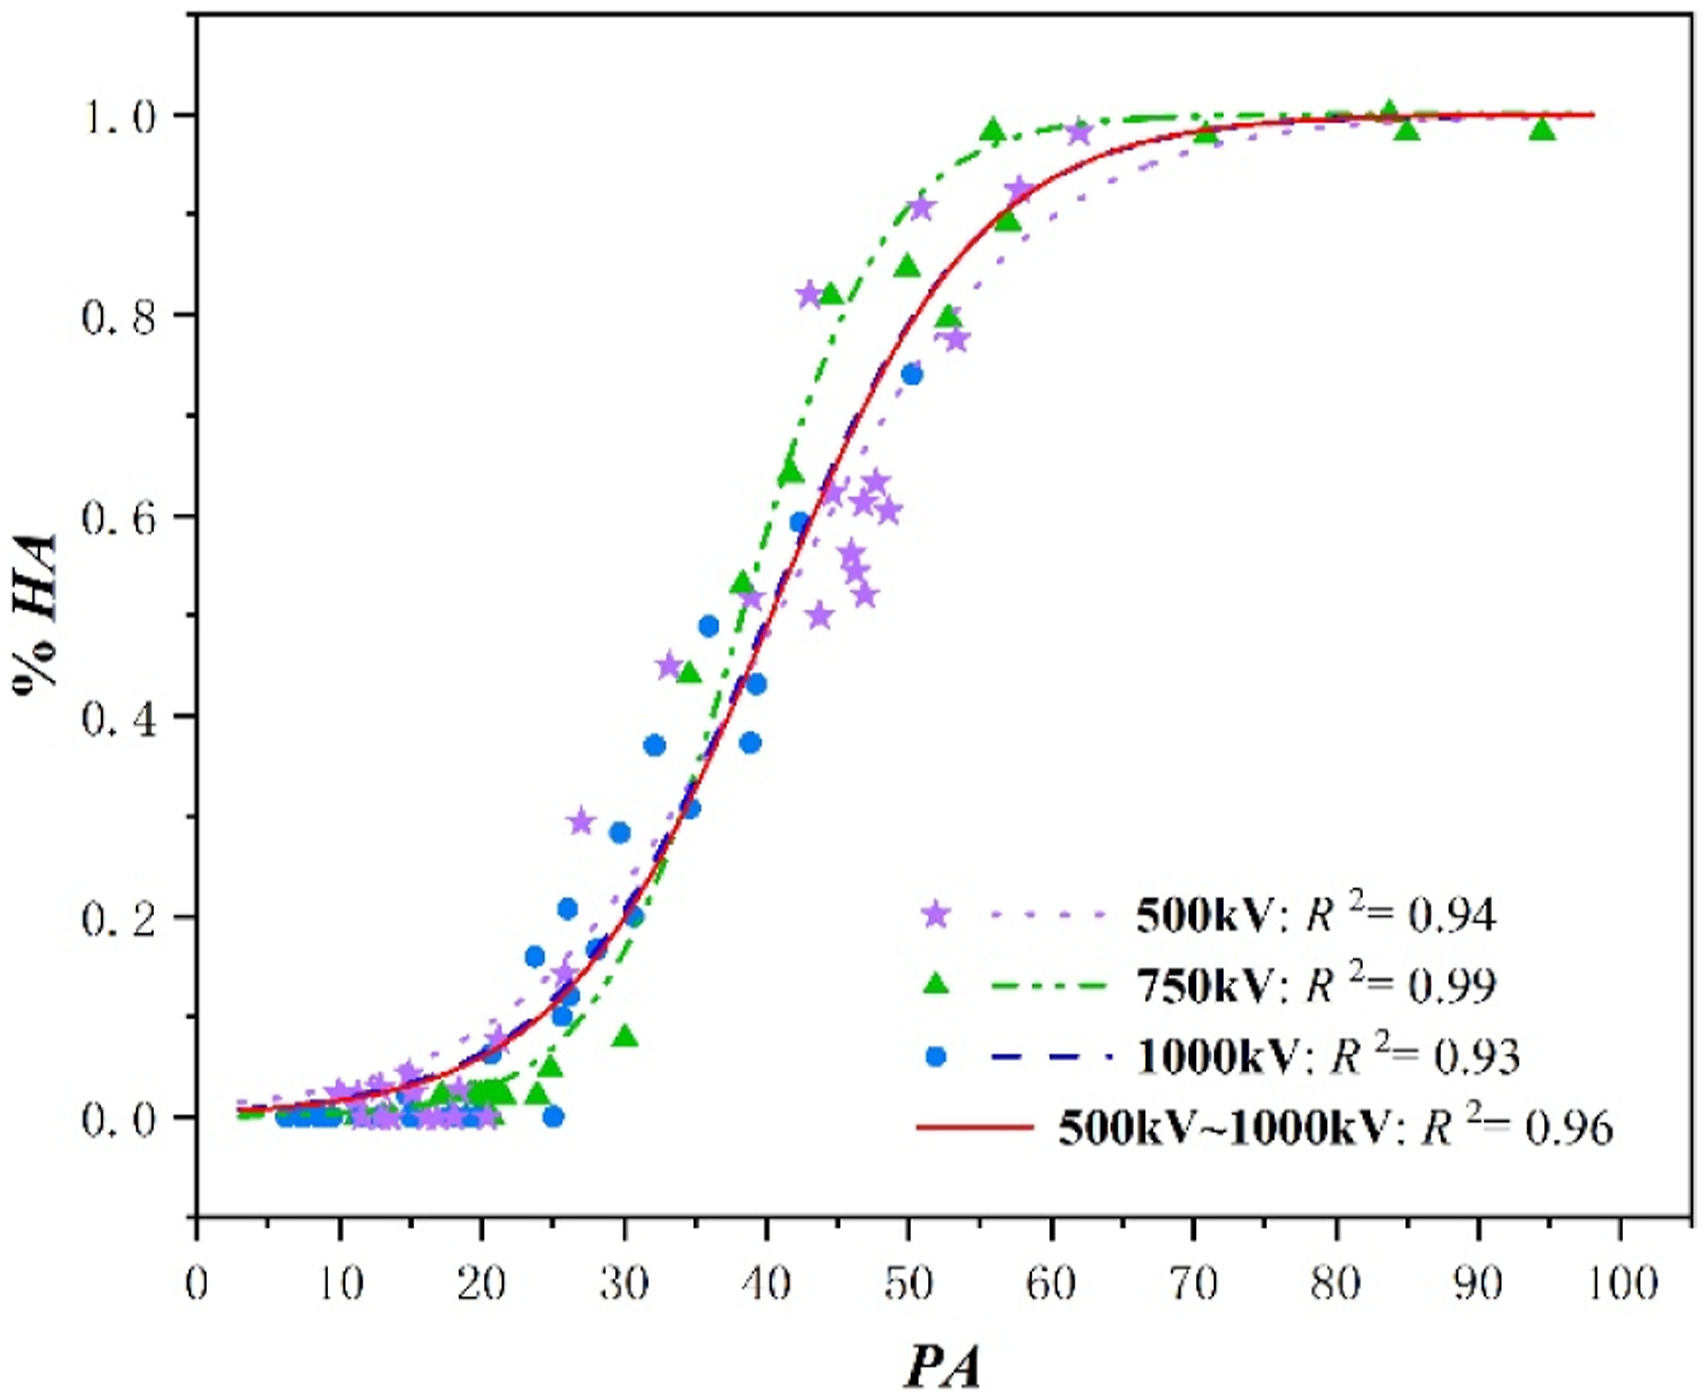
According to the logistic function shown in equation (8), three models of PA–%HA suiting for substation noise of different voltage levels (500 kV, 750 kV, and 1000 kV), Model 5 (see equation (13)), Model 6 (see equation (14)), and Model 7 (see equation (15)), and one model of PA–%HA without distinguishing the voltage level of substations, Model 8 (see equation (16)), were established (see Figure 4). The coefficients of determination (R2) of models of PA–%HA were 0.94, 0.99, 0.93, and 0.96, respectively. Results above showed that four models of PA–%HA all could well characterize the relationship between PA and %HA whether or not the voltage level of substations was distinguished


The verification of PA–MA and PA–%HA model
The rationality of models of PA–MA (or PA–%HA) was verified by 45 noise samples which were different from noise samples used to establish these models. The experimental results of 45 noise samples were shown in Figures 5 and 6.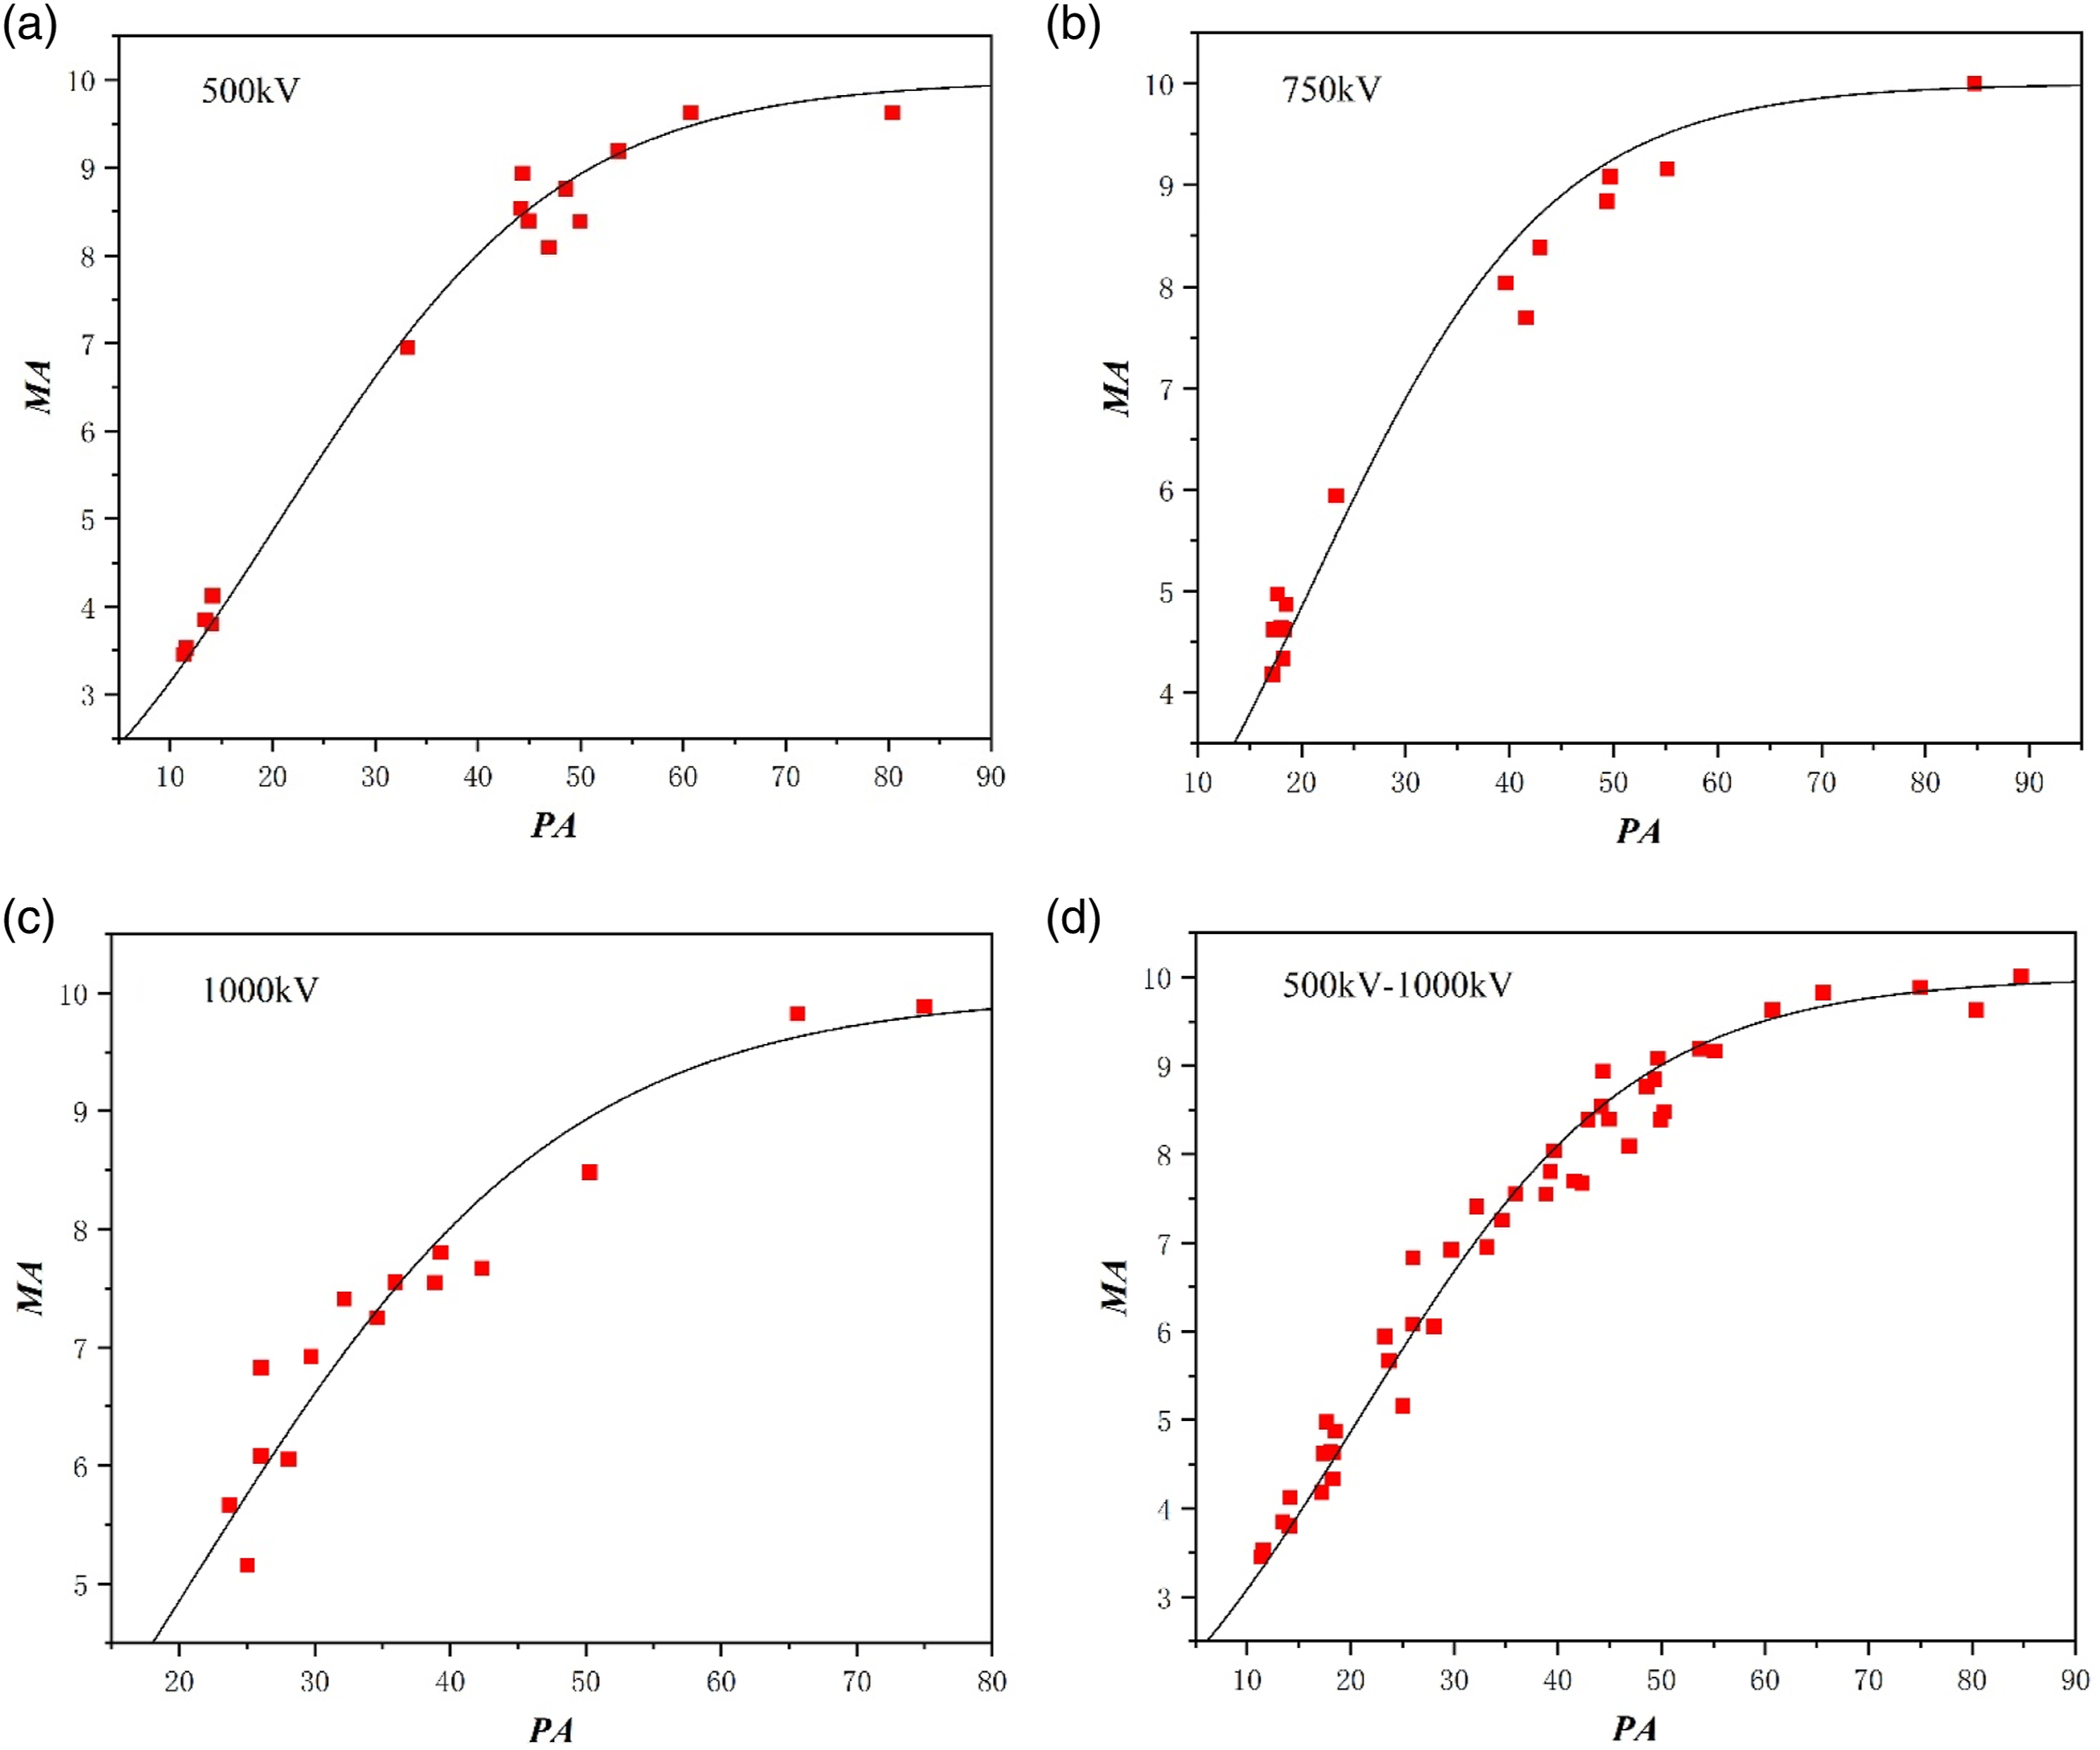
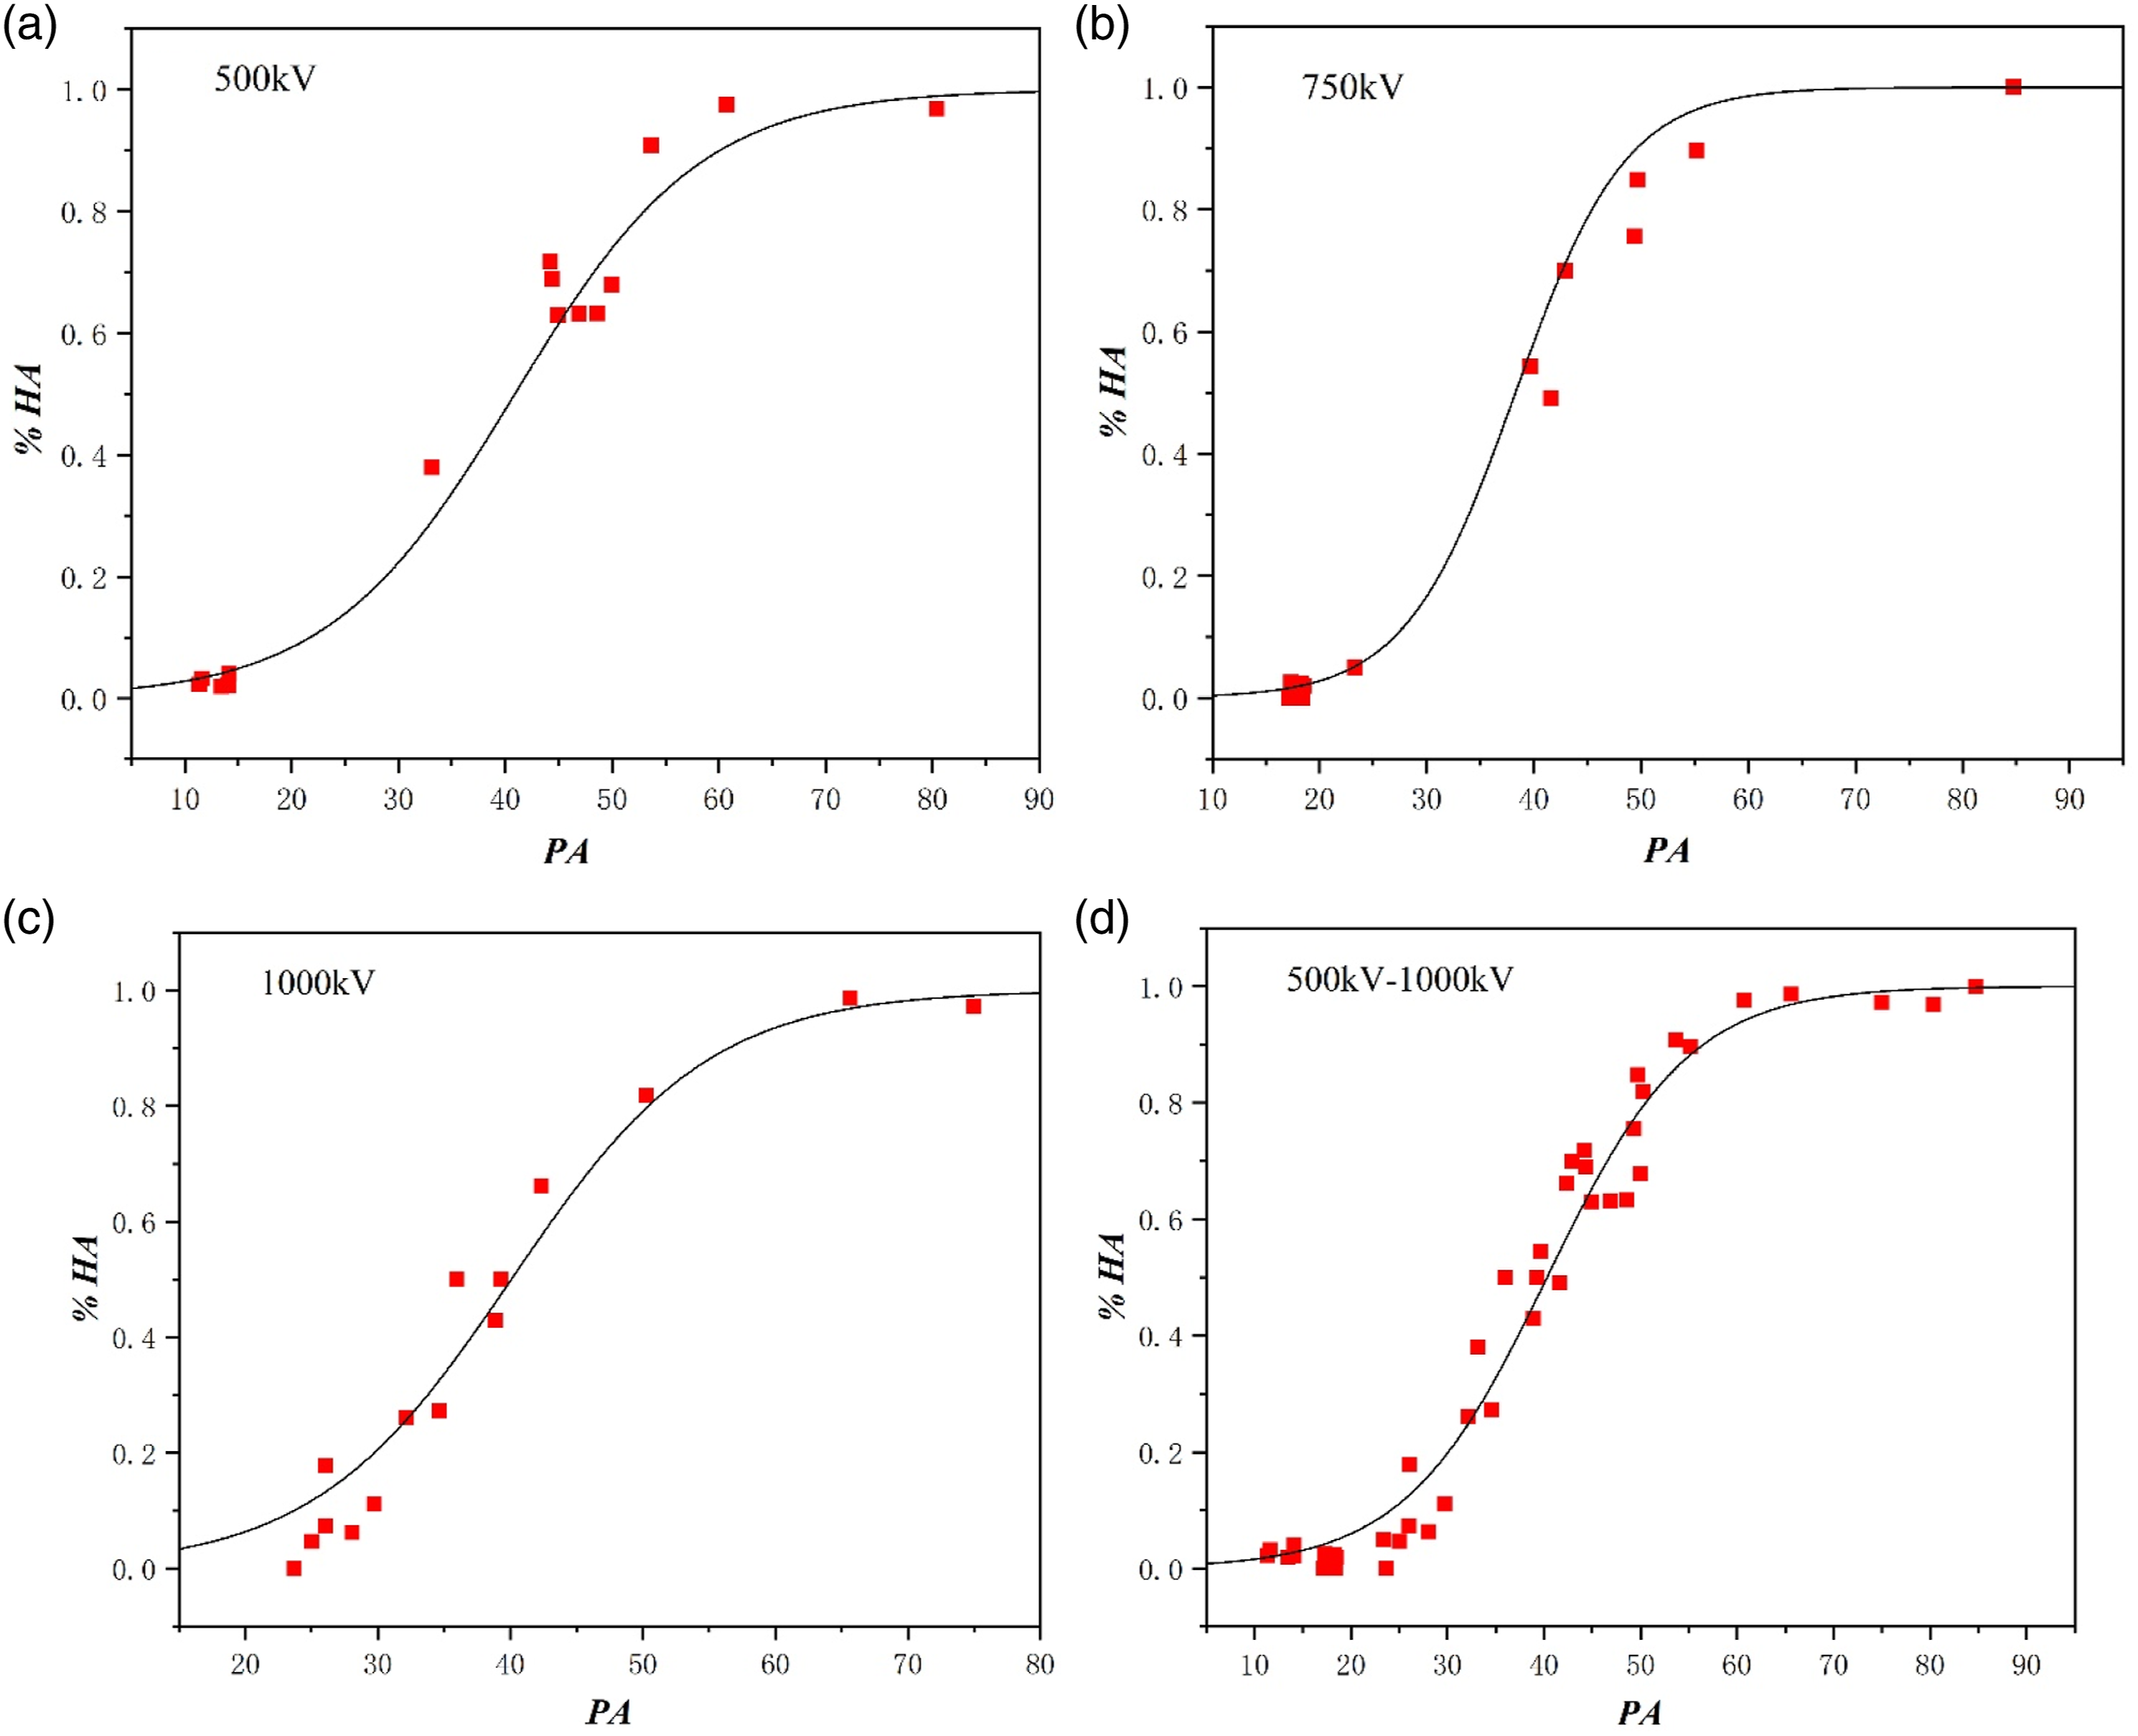

Results of model verification.
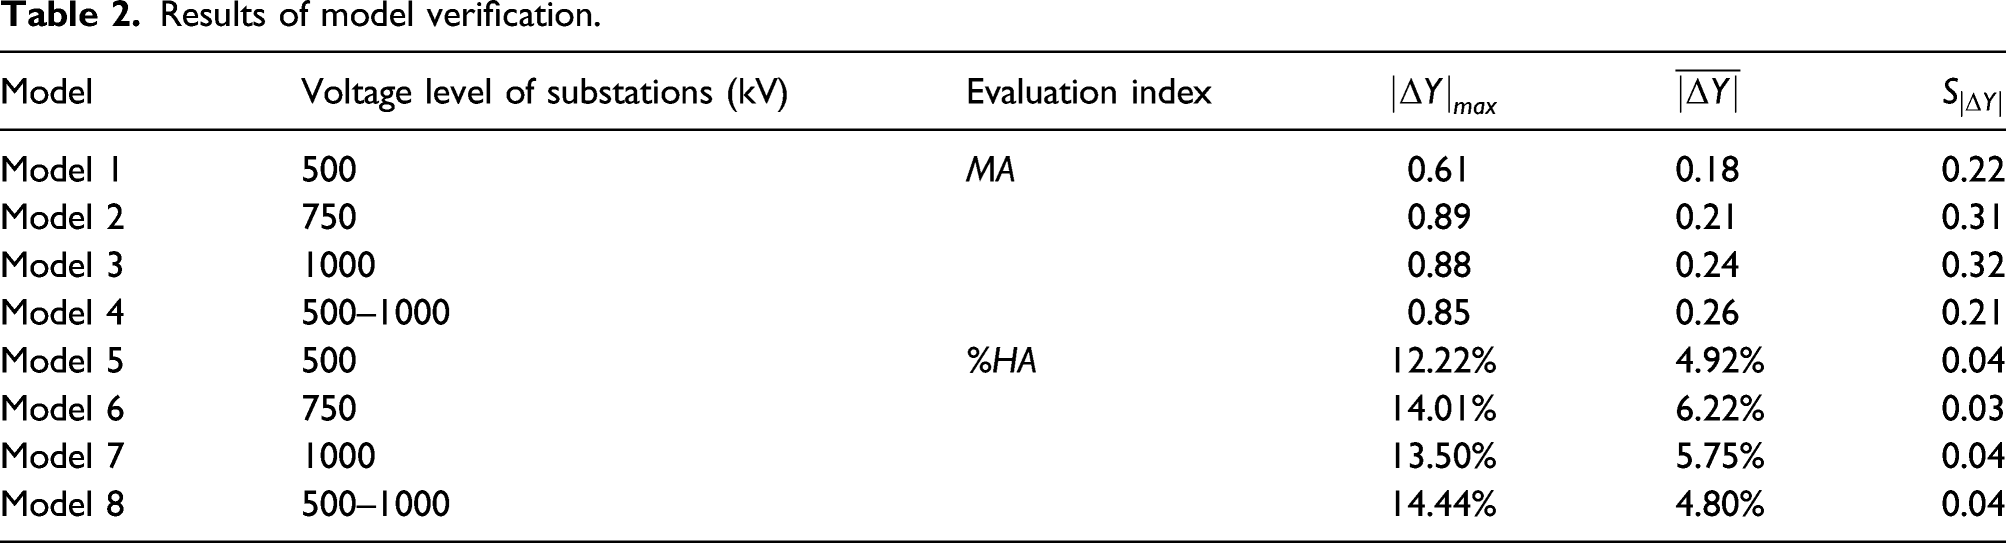
As shown in Table 2,
When the voltage level of substations was distinguished,
Conclusions
As a case study, the model between perceived annoyance (mean annoyance, MA and the percentage of highly annoyed population, %HA) and psychoacoustic annoyance (PA) of substation noise was established and the rationality of model was verified. Results showed that the maximum value of the difference of MA (or %HA) between the calculation result of model and experimental result was less than 0.89 (or 15%), and the mean value of the difference was less than 0.26 (or 7%). In view of the convenience of application, PA–MA and PA–%HA models without distinguishing the voltage level of substations can be directly used. In this way, the perceived annoyance of substation noise samples can be determined by model calculation, which can save the cost of listening experiments or socio-acoustics surveys. The results of this study can provide a basis for determining substation noise acceptability and developing substation noise standards.
PA–MA and PA–%HA models developed by this study are only suitable for substation noise. PA–MA and PA–%HA models for other types of noise can be developed through the method proposed by this study.
Footnotes
Declaration of conflicting interests
The author(s) declared no potential conflicts of interest with respect to the research, authorship, and/or publication of this article.
Funding
The author(s) disclosed receipt of the following financial support for the research, authorship, and/or publication of this article: This work was financially supported by the science and technology project of State Grid Corporation of China (the research on low-frequency audible noise control limits and control schemes of substation based on human perception, No. 5226SX20002T).