
Abstract
Low-frequency noise may create specific perceptions, which might cause various health effects. The present study aimed to identify exposure–response relationships between low-frequency noise and perceptions by re-analysing an experimental study. We investigated the predominant perceptions of ‘feeling bothered’ and ‘feeling of pressure and/or vibration’ using multivariate logistic regression analysis. A significant interaction between 1/3 octave-band sound pressure level and frequency was indicated for ‘feeling bothered’ but not ‘feeling of pressure and/or vibration’, suggesting that the ‘feeling of pressure and/or vibration’ does not originate in cochlear. A mathematical model indicating resonance at approximately 50 Hz fitted the results well. A frequency weighting derived from the mathematical model could be applied to broad-band low-frequency noise to evaluate the perception and health effects. However, further investigations on the weighting for the perception are necessary because the results were obtained only from the existing study.
Keywords
Introduction
The health effects of environmental noise containing predominant low-frequency components (low-frequency noise) are of great importance in public health. 1 An increasing number of sound sources such as wind turbines, fans, and compressors that emit low-frequency noise have been introduced in recent years to effectively utilise energy, because of which, more and more residents around the noise sources complain of health problems characterised as sleep disturbance, headache, dizziness, vertigo, tinnitus and nausea.
The leading health effect caused by the low-frequency noise is sleep disturbance, which is quite different from awakening reactions led by intermittent and loud noise events often from transportation sources.2,3 Low-frequency noise in a bedroom is, in most cases, much less loud than transportation noises, 1 and the chief complaint about low-frequency noise is not being noisy or loud during sleep but bothering when initiating sleep. Studies on the effects of wind turbine noise on sleep using objective outcomes have suggested that it is less severe for subjects who have already slept,4,5 while a meta-analysis on subjective sleep disturbance identified a significant relationship between noise exposure and sleep disturbance. 6 Additionally, studies on relationships between wind turbine noise, annoyance and sleep disturbance have suggested that sleep disturbance caused by the noise is mediated by annoyance. 7 Sleep disturbance, which can lead to mild environmental sleep disorder,8,9 should be separated from mere psychological effects such as annoyance; however, subjective outcomes investigated in epidemiological studies might represent both annoyance and sleep disturbance because the noise affecting sleep initiation can also be perceived as a bothering sound. It should be noted that low-frequency noise is not the only cause of feeling bothered, but high-frequency noise may create this perception 10 and should be examined if it results in difficulty initiating sleep.
It is also worth noting that there are specific health effects observed around sources of low-frequency noise, such as headache, dizziness, vertigo, nausea and tinnitus. These symptoms are not observed with ordinary environmental noise but frequently reported in the vicinity of wind turbines.1,11 The physiological mechanisms for these health effects remain unclear, 1 and several studies have suggested that psychological anxiety for the sound sources significantly contributes to these health effects. 12 However, numerous case studies 13 have reported similar symptoms in the vicinity of wind turbines which is considerably alleviated when leaving the wind turbines, indicating that wind turbines cause these symptoms. Low-frequency noise is one of the most important causes of these health effects, although other properties of wind turbines may contribute to the identified health effects. 12 Several studies have suggested that these symptoms originate in the effects on the vestibular system and circular canals regulating equilibrium functions, given that these effects are quite similar to the dysfunction of equilibrium. 14 Little is known about the response of the vestibular system to sound, but a recent study suggested that it occurs at a very high sound level (e.g. 110 dB at 40 Hz). 15 Similarly, animal studies have indicated that prolonged exposure to relatively low sound levels at low frequencies (e.g. 70 dB at 100 Hz for a month) causes damage to hair cells in the vestibular system.16,17
Therefore, investigating how the effects of low-frequency noise are characterised by frequency is critical. In most epidemiological studies, environmental noise containing various frequency components is evaluated using frequency weightings (e.g. A, G); however, clarifying the relationship between frequency and perception should be prioritised to accurately evaluate the effects of low-frequency noise. Perceptions caused by low-frequency noise would be a direct indicator for sleep disturbance, may represent the sensing mechanism for low-frequency noise, and might be a premonitory reaction indicating specific health effects. 1 Experimental studies have been conducted to identify the sound pressure level of low-frequency noises causing people to feel ‘bothered’ or ‘annoyed’ when exposed to it in their bedroom.18,19 In addition, studies on various kinds of perceptions due to low-frequency noise have indicated that a high-level low-frequency noise may create perceptions of the feeling of pressure and/or vibration,20–22 with a peak sensitivity of perception being approximately 50 Hz.23,24 However, studies on the threshold of the feelings of vibration have not demonstrated any sensitivity peaks. 25
The results of early research on these perceptions20–22 are currently available; however, the research was conducted 40 years ago and did not employ modern statistical methods, such as multivariate analysis. Thus, re-analysing these data to investigate the relationship between the sound pressure level and the perceptions would be beneficial. The present study aimed to identify exposure-response relationships between the low-frequency noise and perceptions by re-analysing the existing data. By including interaction terms in the multivariate statistical model, we examined the relationship among the perception, sound pressure level and frequency.
Methods
We re-analysed the experimental results on the perceptions caused by narrow-band low-frequency sounds.20–22 Twenty-eight subjects who had normal hearing thresholds participated in the experiment. The subjects consisted of 14 male students in their twenties, a female student in her twenties, 10 female homemakers who were primarily in their forties and three acoustic researchers whose sex and age were unknown. They were exposed to 1/3 octave-band noise of seven different centre frequencies (10, 20, 40, 80, 160, 315 and 630 Hz), with a duration of 20 s. For each sound exposure, the subjects were instructed to select their perception from eight choices: not perceived, perceived, feeling bothered, feeling that it is noisy, feeling of pressure, feeling of vibration, feeling of an ache and feeling of a dull sound.
Even if the subjects felt multiple perceptions, they were instructed to select the choice that best fits their perception. Thus, the outcome investigated in this experiment was ‘predominant perception’ but not overall perception per se, meaning that perceptions could have been masked by other perceptions. Since subjects may not have selected the perceptions that were marginally felt, the threshold of the perceptions cannot be investigated. However, if we assumed the inclusion relationship among the perceptions (e.g. all subjects feeling an ache perceive the sound), we could estimate the total number of the subjects feeling certain perceptions.
We first focused on the perception of ‘feeling bothered’ because it was the first perception aroused after ‘perceived’ for low and relatively high-frequency noises, and could be related to sleep disturbance. Similarly, we focused on the ‘feeling of pressure’ and the ‘feeling of vibration’ because they were specific to low-frequency sound and could be related to the specific health effects due to low-frequency noise. Another experiment on the overall perceptions due to low-frequency sound 20 identified very small differences in the response rates between ‘feeling of pressure’ and ‘feeling of vibration’, indicating that subjects could not distinguish these perceptions and that these perceptions could not be separately investigated.
We considered the inclusion relationships among the perceptions, then defined binomial variables for ‘feeling bothered’ and ‘feeling of pressure and/or vibration’. These variables were included in a multivariate logistic regression model to identify the exposure–response relationships. The 1/3 octave-band sound pressure level, centre frequency and interactions between them were included in the model. Although the experiment was conducted in a range of 10–630 Hz, we excluded the data of centre frequency at 630 Hz as we were investigating the perception of low-frequency sounds.
Moreover, according to the exposure–response relationship between 1/3 octave-band sound pressure level and the probability of the perception for each frequency band, we calculated the sound levels which represents a certain probability (e.g. 50%). The frequency characteristics of the perception were derived from the levels. We then examined a method to evaluate these perceptions.
All statistical analyses were conducted using R ver. 4.0.3. 26
Results
Figure 1 presents the summary of the experimental results re-analysed in the present study.21–23 The 1/3 octave-band sound pressure level employed in the experiment was relatively high, and most of the subjects could perceive the exposure. ‘Feeling bothered’ was selected for relatively lower sound levels. With increased sound levels, ‘feeling of pressure’ and ‘feeling of vibration’ were selected in the low-frequency region, while ‘feeling that it is noisy’ was selected in the high-frequency region. The ‘feeling of an ache’ was caused by high-level sounds. The perception of ‘feeling of a dull sound’ was not associated with the other perceptions, and as the meaning of the term could be unclear, we did not use it in further analyses. Summary of the results of the existing experiment on the predominant perception caused by low-frequency noise.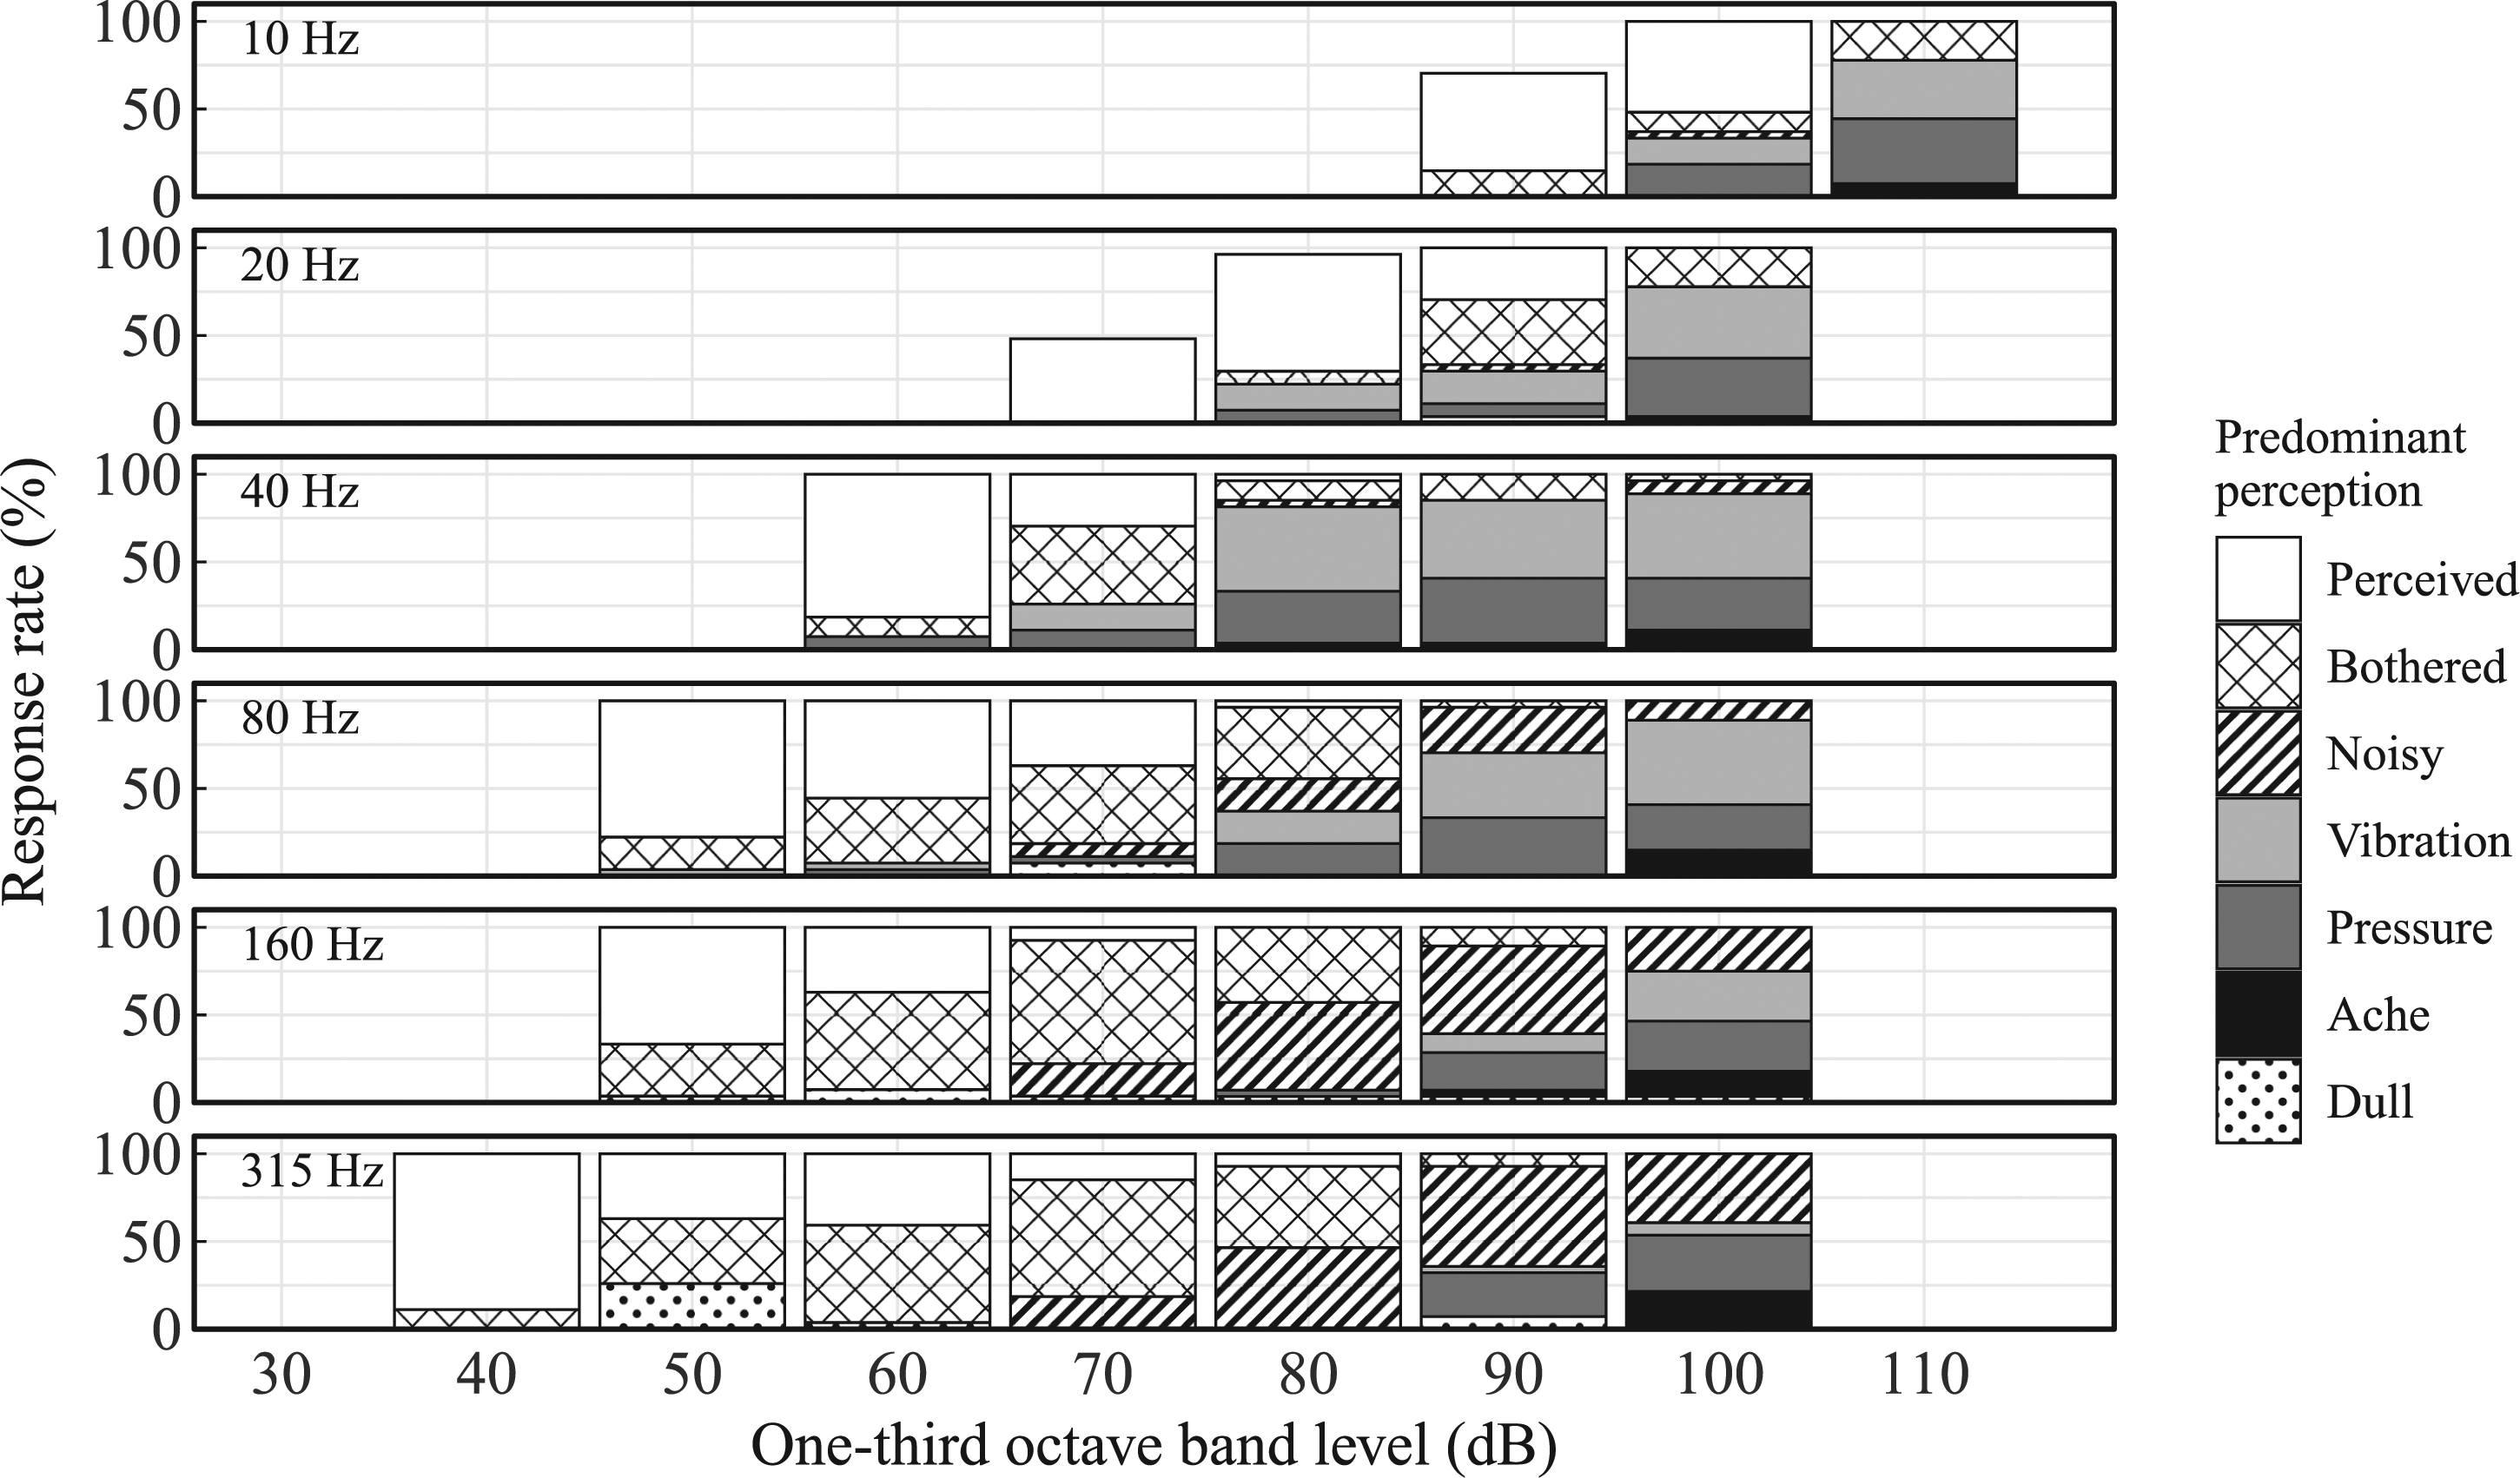
According to Figure 1, we assumed that ‘feeling bothered’ was created before ‘feeling that it is noisy’, ‘feeling of pressure’, ‘feeling of vibration’ and ‘feeling of an ache’ and that all subjects answering these perceptions also feel bothered. Similarly, we assumed that the sum of the ‘feeling of pressure’, ‘feeling of vibration’ and ‘feeling of an ache’ perceptions represented the ‘feeling of pressure and/or vibration’. Following that, we defined the binomial variables for the multivariate logistic regression analysis. This assumption might have created errors in the evaluation of the perceptions. Specifically, ‘an ache’ created at high frequencies might be caused by ‘feeling that it is noisy’.
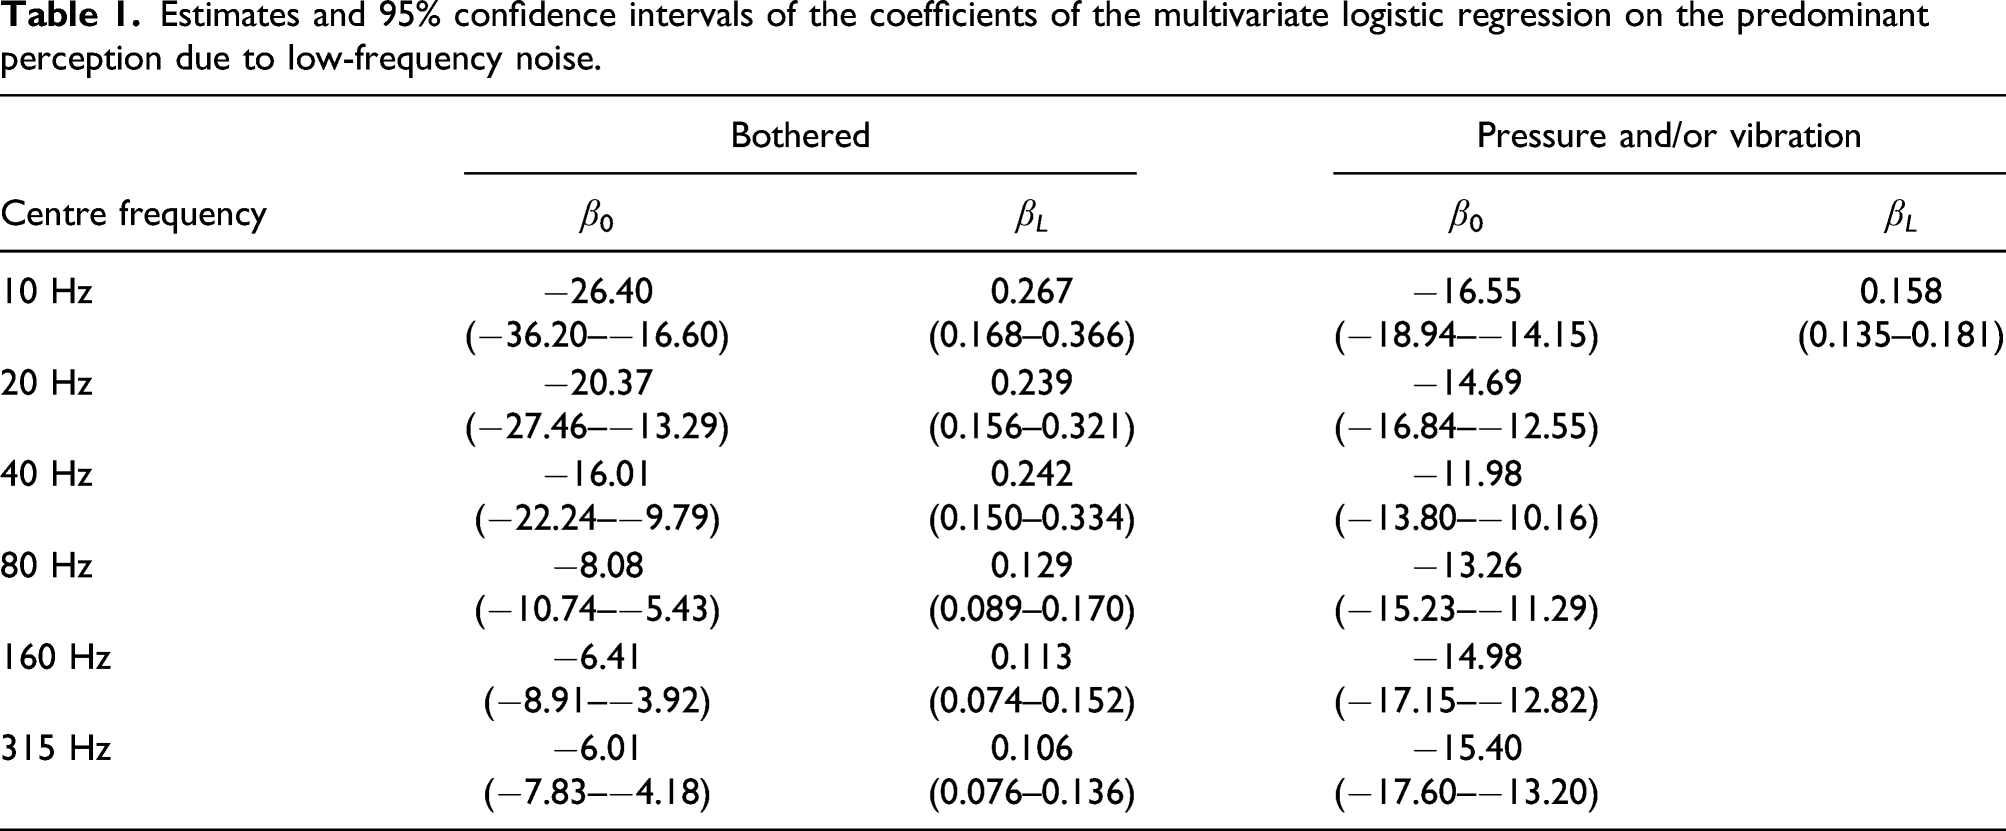
The exposure–response relationship between the 1/3 octave-band sound pressure level (

Estimates and 95% confidence intervals of the coefficients of the multivariate logistic regression on the predominant perception due to low-frequency noise.
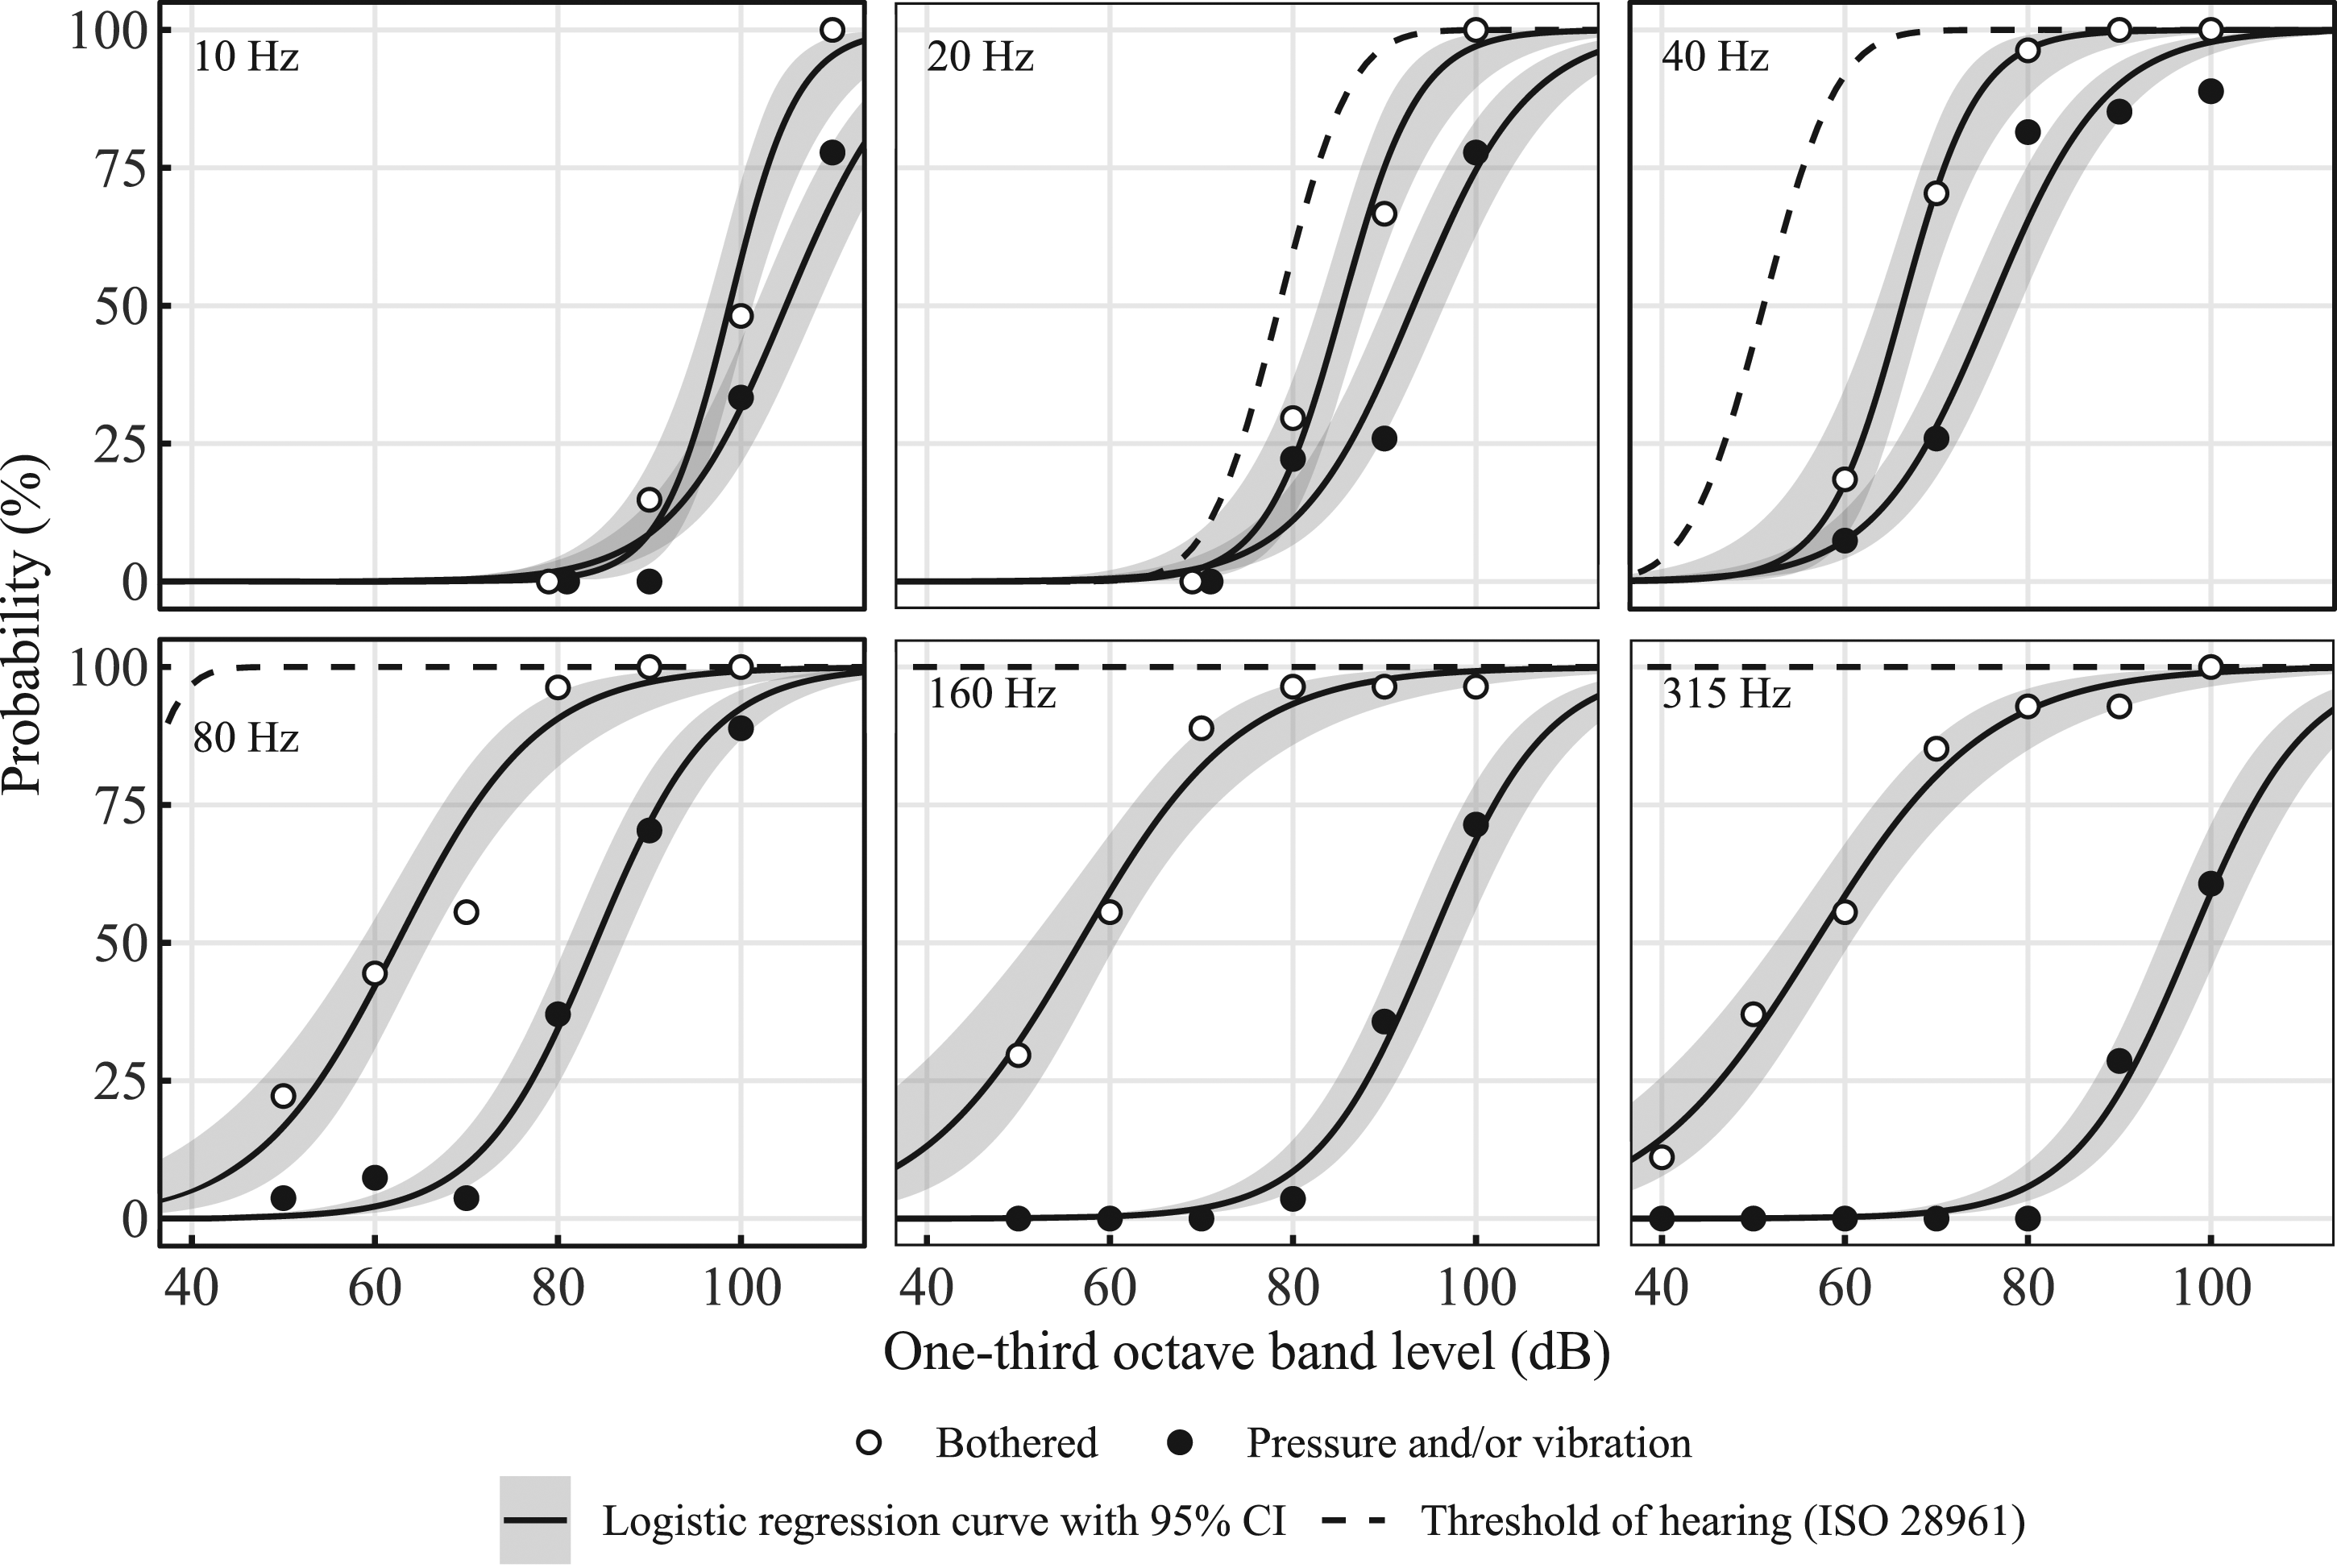
Fitting results of the multivariate logistic regression to the predominant perceptions of ‘feeling bothered’ and the ‘feeling of pressure and/or vibration’ caused by 1/3 octave-band noise. Curves of the hearing threshold for pure tones (ISO 28961) were also shown.
Figure 3 illustrates the equal-probability contour lines for ‘feeling bothered’ and the ‘feeling of pressure and/or vibration’. For the former, the contour lines are greatly dependent on the probability but uniformly decreased with the frequencies. We also illustrated ‘reference values’ provided by the Ministry of Environment of Japan (MOE),
28
derived from experimental results
20
and representing the 1/3 octave-band sound pressure level that caused 10% of subjects to feel ‘bothered in the bedroom’. The 10% contour line derived from the exposure–response relationship of ‘feeling bothered’ demonstrated a good fit to the ‘reference values’, suggesting that the exposure–response relationship could help evaluate the risk of difficulty in initiating sleep due to low-frequency noise if the noise has a single frequency component. Equal-probability contour lines on the predominant perceptions caused by 1/3 octave-band noise. Mean hearing thresholds for pure tones (ISO 389-7) and ‘Reference values’ by the Ministry of Environment of Japan (MOE) were also shown.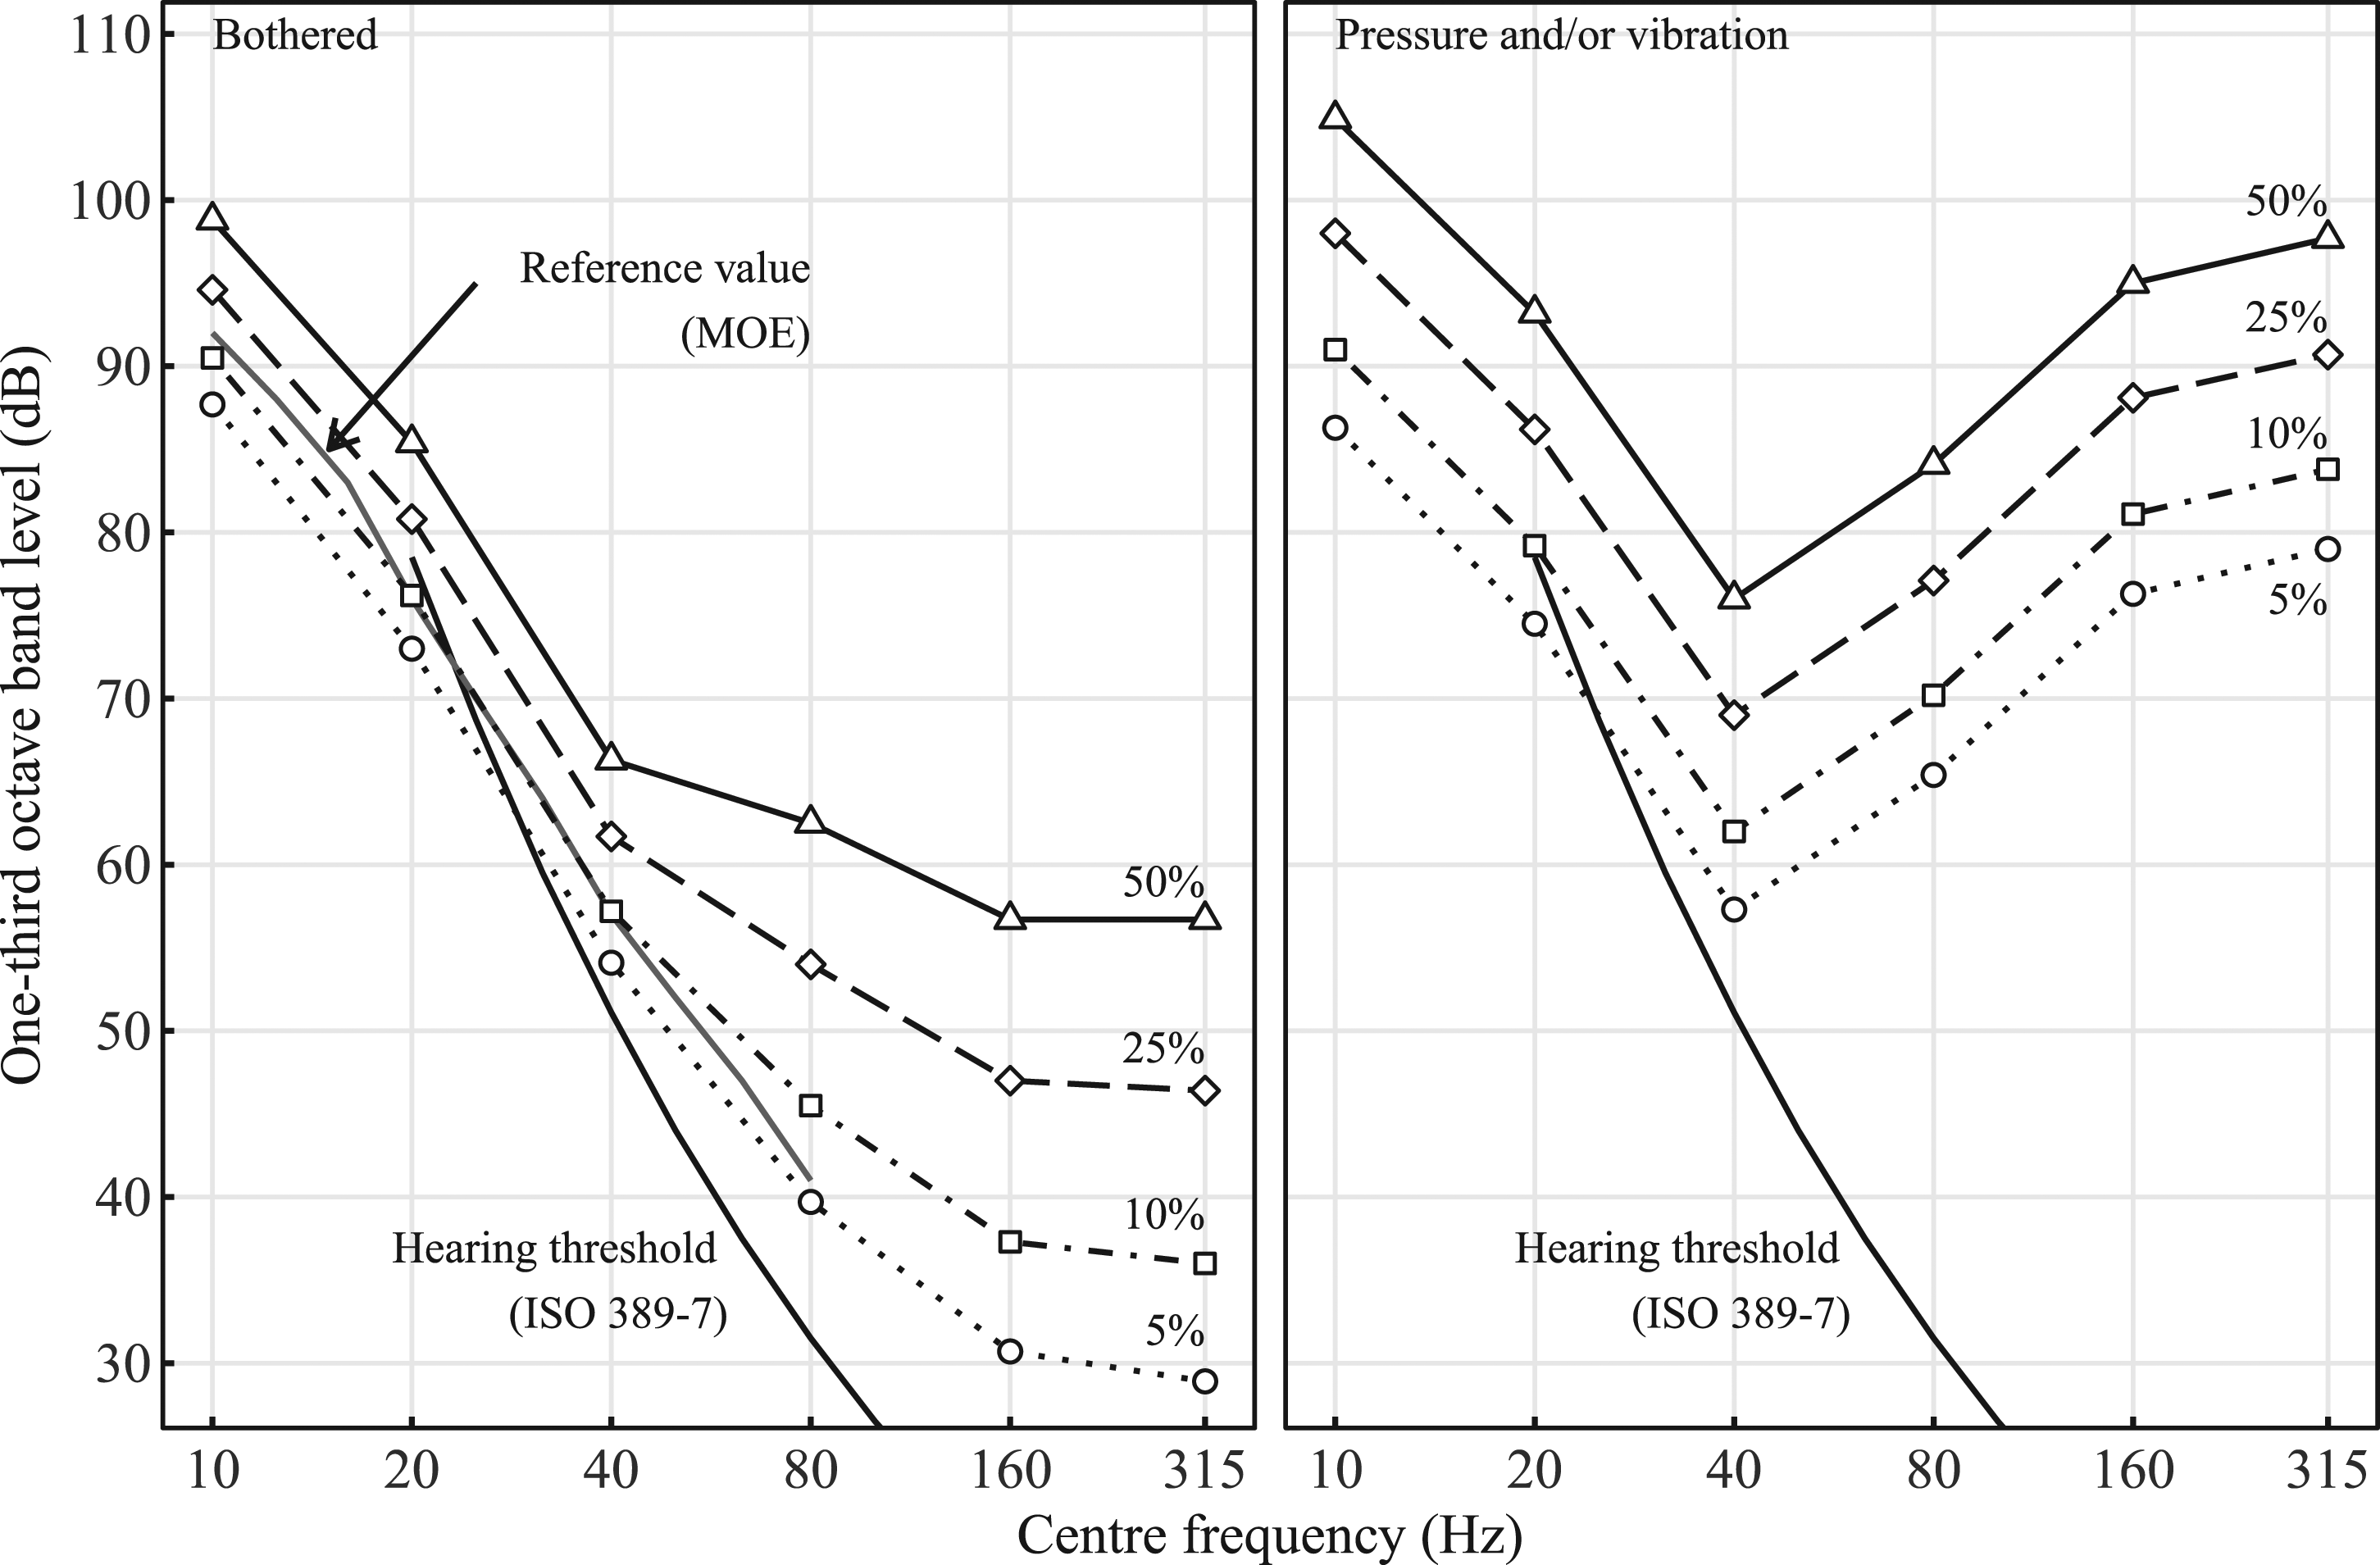
Regarding the ‘feeling of pressure and/or vibration’, the shapes of the contour lines were the same and had a minimum value at 40 Hz, which was quite different from existing weightings, such as A- and G-weighting that have a peak at 2.5 kHz and 20 Hz, respectively. Large differences in the sound level (e.g. the difference is more than 10 dB between 20 and 40 Hz) also suggested that it is caused by resonance.
Since the ‘feeling of pressure and/or vibration’ may have been caused by resonance, we constructed a mathematical model describing resonance. Although the physiological mechanisms remained unclear, we supposed that the perception originated in a certain sensory organ, the dynamics of the sensory organ was represented as a second-order lag system, the output of the sensory organ is a power function of the displacement, and the perception is logarithmic of the output. We, thus, theoretically obtained the gain characteristics 
Figure 4 illustrates the fitting of the equation to the inverse of the frequency characteristics for ‘feeling of pressure and/or vibration’ where the level at 40 Hz was set to 0 dB. The results of this mathematical model indicated a frequency weighting to evaluate the perception. An existing ‘LSL’ frequency weighting,
22
derived from the same experimental results, is also displayed. The differences between the mathematical model and LSL weighting were small at lower frequencies but relatively large at higher frequencies. The frequency weighting derived from the mathematical model is expressed as follows The weighting of the ‘feeling of pressure and/or vibration’. The mathematical model was theoretically derived on the assumption that the response is caused by resonance. LSL weighting is also indicated.
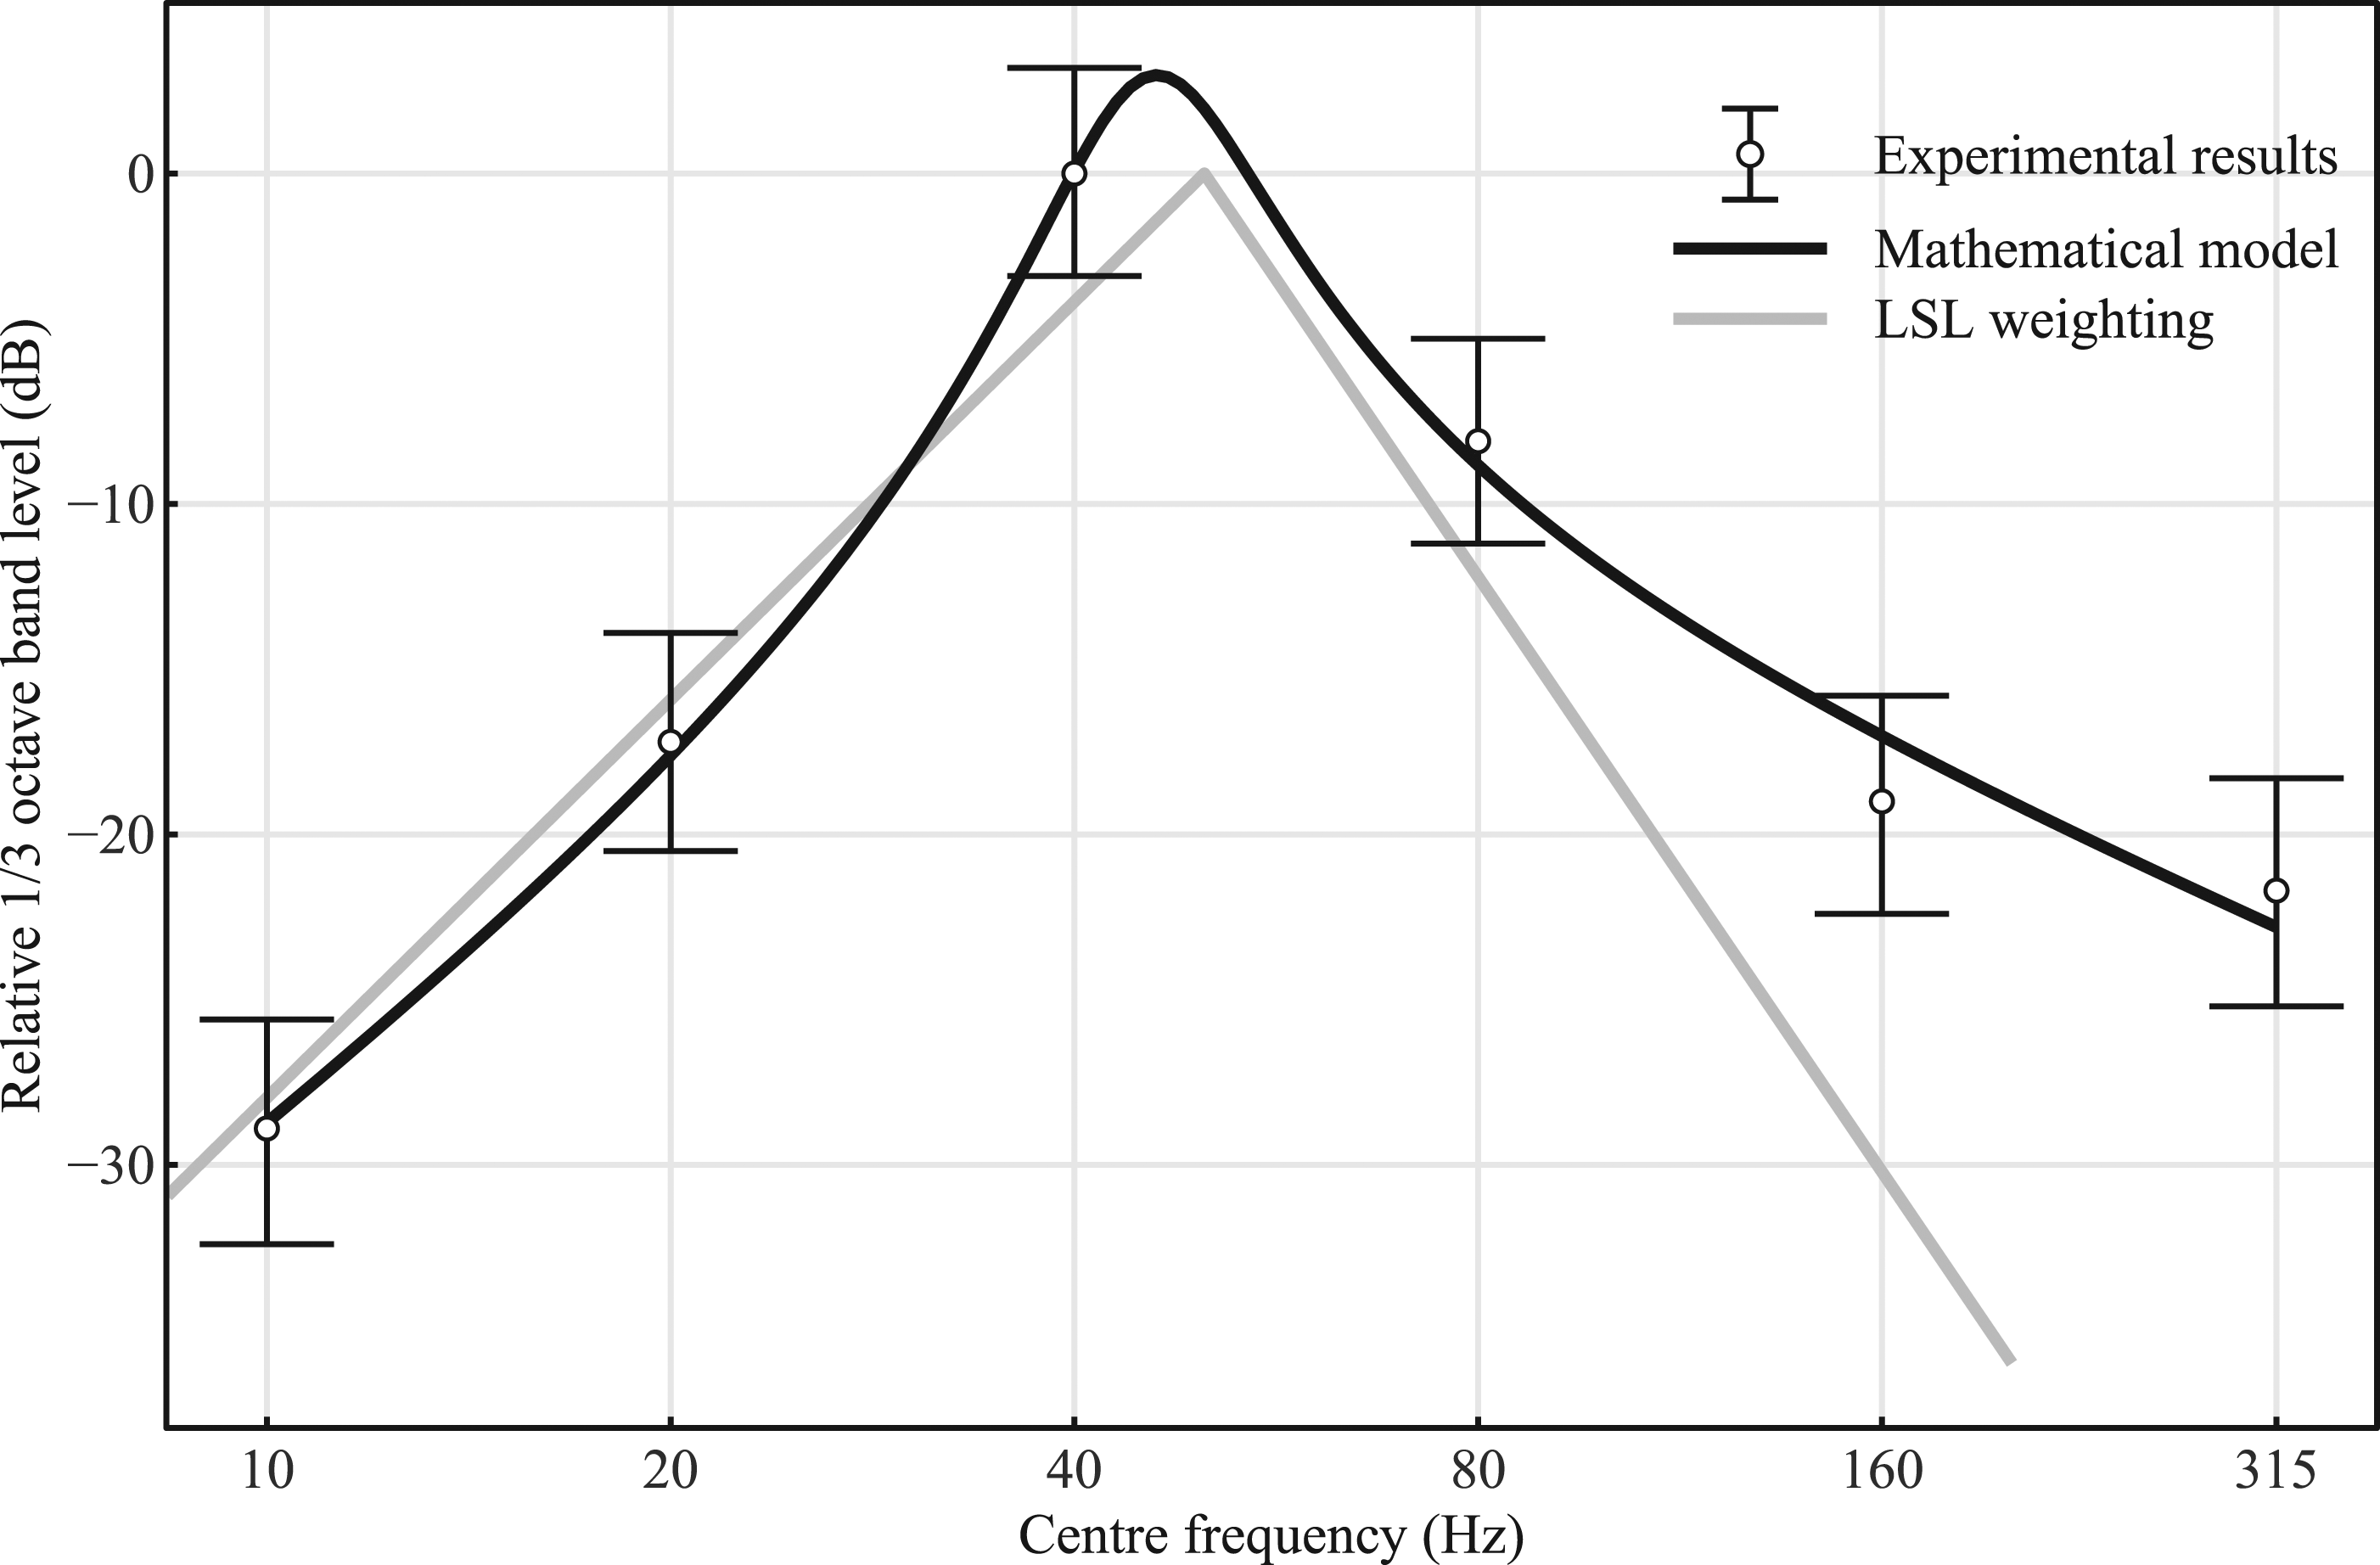
The natural circular frequency and damping ratio were estimated to be 45.68 Hz and 0.173, respectively.
Discussion
In the present study, we re-analysed the results of existing experimental research to identify exposure–response relationships between low-frequency noise and the predominant perceptions of ‘feeling bothered’ and ‘feeling of pressure and/or vibration’. The results were well-fitted by the multivariate logistic regression model.
The predominant perception may be different from overall perception per se and biased; however, the perception of ‘feeling bothered’ had good agreement with other experimental results for ‘feeling bothered in the subject’s bedroom’ (Figure 3). This suggests that this outcome represents the difficulty in falling asleep, and the exposure–response relationship with the sound level could help evaluate sleep disturbance resulting from low-frequency noises when the noise in the bedroom has a single eminent frequency component.
The predominant perception of ‘feeling of pressure and/or vibration’ appears to be an important reaction since this perception was only created for low-frequency sounds, while higher-frequency sounds may cause subjects ‘feeling that it is noisy’ instead. Thus, this perception might be a premonitory reaction to specific health effects reported in the vicinity of low-frequency noise sources, including sleep disturbance. 1 However, we should note that issues remain to determine a key perception for the specific health effects and establish a reliable method of evaluation. Investigations on the physiological mechanisms of the specific health effects are needed.
The probability of this perception was much lower than ‘feeling bothered’ and hearing; however, the exposure–response relationships indicated that a small portion of subjects felt this perception even at a relatively low sound level. Particularly, the gaps between this perception and that of ‘feeling bothered’ and hearing were quite small in the range of ≤40 Hz. Given that the results of the present study are based on the predominant perception being stronger than the overall perception per se, the ‘feeling of pressure and/or vibration’ may be created by a relatively low sound level that causes a marginal perception of the sound in the low-frequency region. Thus, this perception should not be left unaddressed when evaluating the effects of noise.
Furthermore, the interaction term between the 1/3 octave-band sound pressure level and frequency could be omitted, and the exposure–response curves of the ‘feeling of pressure and/or vibration’ exhibited a constant form even for different frequencies. The exposure–response relationship results suggest that this perception is not non-linearly amplified and does not originate in the cochlear. This perception may be caused by somatic sensation, as the chest resonances were estimated to be at 50 Hz 29 and a high correlation between the vibration at the chest and the perception of vibration was indicated in existing studies. 30 In addition, the vestibular system might play an important role since the health effects reported around low-frequency noise sources are quite similar to the equilibrium dysfunction; however, only a few studies15–17 have examined the vestibular system.
The perception of ‘feeling of pressure and/or vibration’ could be attributed to resonance, as the frequency response had a certain shape and was strong at certain frequencies. The frequency characteristics of this perception can, therefore, be explained by the mathematical model based on resonance. The mathematical model was well fitted to the results and indicated a new frequency weighting that has a peak at approximately 50 Hz. The peak frequency corresponds to recent research conducted in a similar manner on predominant perception.23,24 Several studies have also revealed a minor peak in the sensitivity of otoacoustic emissions and loudness in the range of 40–100 Hz,31,32 implying the existence of a heterogeneous perception such as the ‘feeling of pressure and/or vibration’ although it was not distinguished from ordinary hearing perception. However, further investigations are required to validate this resonance curve for the ‘feeling of pressure and/or vibration’ as limited data were employed to derive the equation. Moreover, determining the threshold remains an issue. A peak of the sensitivity was not demonstrated in other experiments on the threshold for the feeling of vibration caused by low-frequency sounds.23,24
The health effects of low-frequency noise have been evaluated with the sound pressure level for each frequency band and/or frequency weighted levels (e.g. A, G); however, this could lead to inaccurate evaluations because they were not based on perceptions caused by broad-band low-frequency noise. Therefore, it is worth using the new frequency weighting for the ‘feeling of pressure and/or vibration’ based on physical resonance, which can be applied to broad-band low-frequency noise. Further, this weighting could accurately evaluate the perceptions related to sleep disturbances and specific health effects caused by low-frequency noise; however, future research on the relationship between perceptions and health effects is needed. Additionally, further investigation on how broad-band noise causes ‘feeling bothered’ is required.
There are several limitations to the present study. Firstly, the relationship between the subjective perceptions analysed in the study and the health effects remains unclear. Secondly, the predominant perception is different from perception per se and may be biased. Thirdly, the existing results employed in the present study were on perceptions caused by 1/3 octave-band noise rather than pure tones or broad-band noises. Good agreement with experiments employing pure tones19,23,24 has been demonstrated; however, further studies on the effects of broad-band noises are desirable.
Conclusions
By employing multivariate logistic regression for existing experimental results, we demonstrated relationships among the 1/3 octave-band sound pressure level, frequency and the predominant perceptions of ‘feeling bothered’ and ‘feeling of pressure and/or vibration’ due to low-frequency noise. The frequency characteristics of the perceptions were largely different. For the ‘feeling of pressure and/or vibration’, the results suggest that the perception is caused by resonance. Therefore, we applied the mathematical model describing resonance and obtained a frequency weighting that had a peak at approximately 50 Hz. The frequency weighting could be applied to broad-band low-frequency noise to evaluate the perception; however, further investigations are required because we only investigated the results of the existing study. Moreover, the weighting might help evaluate health effects due to low-frequency noise, while more experimental and epidemiological studies are necessary to examine the efficacy.
Footnotes
Declaration of conflicting interests
The author(s) declared no potential conflicts of interest with respect to the research, authorship, and/or publication of this article.
Funding
The author(s) received no financial support for the research, authorship, and/or publication of this article.