
Abstract
Existing approaches to reducing the low-frequency noise exposure of dwellings are not always sufficient. This study investigated the significance of dwelling layout design for low-frequency noise control. The sound distribution in six typical Chinese dwelling layouts was analysed using in-situ measurements under steady-state noise of various low frequencies. The results showed that among two-bedroom dwelling layouts, the overall average noise reduction varied considerably (6 dB). The noise reduction for room levels (number of rooms sound crosses) 1–2 and 2–3 varies by 5 and 3 dB, respectively, and the noise reduction at door openings varies by 5 dB. A model to approximate the low-frequency noise reduction of a layout was developed using the polyline distance from the noise source and the number of walls the polyline has to cross, which were clearly shown to influence low-frequency noise reduction and seem to be the strongest investigated factors.
Introduction
The adverse impact of low-frequency noise has caused considerable concern due to its pervasive sources in residential areas,1–4 the fact that it masks higher frequencies more than vice versa, 5 and the fact that it is more difficult to reduce than mid and high frequencies. Low-frequency noise can dominate residents’ perception of noise when the atmosphere, ground and building envelopes predominately attenuate higher frequencies 6 or when sound masking is reduced at night, leading to health risks7–9 and bringing more annoyance than the normal frequency range. 10 Broadband noise at 6 dB over the background noise level (10 dB for tonal noise) were evaluated as annoying in previous studies’ indoor low-frequency noise assessments, which were followed by Caniato’s systematical assessment criterion.11,12 Low-frequency noise reduction and control are difficult, because outdoor to indoor noise reduction by walls and other structures, as well as hearing protectors, generally decreases with frequency.13–16 Also, low-frequency noise suffers less attenuation due to distance and transmission loss by the environment. 17 These factors make it more difficult to reduce low-frequency noise, as its natural attenuation is only 20 dB over a distance of 500 m. 18 Access to a quiet side of a dwelling, on the other hand, might have the potential to efficiently reduce residents’ subjective experiences of low-frequency noise levels.19,20 Öhrström et al.’s research on the quiet side effect showed that having access to a quiet side of one’s dwelling, defined as at least a 10 dB level difference between the most and least exposed façade, reduces self-reported annoyance by about 30%–50%. 21 Required safe distances between dwellings and noise sources could therefore be reduced, benefiting land resource conservation.
Most of the research on low-frequency sound fields has only studied a single room or two coupled rooms. For a single room, Maluski and Gibbs indicated that the room’s dimensions, rather than its furniture or deviation from a simple rectangular shape, strongly affect sound pressure level (SPL) difference. 22 This was proved by Sousa and Gibbs’ study on impact sound transmission, and it was believed that the type of floor, edge conditions, floor and room dimensions, and room absorption had effects as well. 23 For two coupled rooms, the geometry and dimensions of the room–wall–room system contribute to airborne sound transmission through a partition. 24 The sound level difference between two rooms with the doors between them closed was 10–16 dB when unoccupied and over 10 dB when occupied, which could also be affected by ventilation management. 25 In addition, the presence of a partition between two rooms was found to affect the acoustical benefit of acoustic windows at low frequencies. 26 However, in practice, most dwellings consist of more than two rooms connected through door openings, and there remains a lack of research on multi-room sound fields at low frequency.
Although some research exists on multi-room sound fields, it has mostly focused on speech-related topics, which fall in mid- and high-frequency bands. One example is open-plan offices, flat spaces where multiple workstations are divided by partitions, which have been studied extensively. Kurze and Moreland devised a model applied in a diffuse field to calculate the sound transmission loss caused by such partitions, including the effect of ceiling absorption, based on Maekawa’s research.27–29 This was followed by Kotarbińska’s prediction model, which used the image source method, 30 and Wang and Bradley’s mathematical model of a single partition panel, which identified the influence of ceiling reflection, partition insulation and workstation opening. They believed that high levels of speech privacy can only be achieved with high partitions and ceiling absorption.31,32 Later, Virjonen et al. investigated more detailed measures. 33 However, these two models were based on geometrical acoustics theory, and their accuracy declines at low frequencies when the wavelength approximates or is larger than the workstation dimensions. The interference effect in the shadow zone of workstation partitions in the model was then modified by Han and Mak, based on the works above. 34 Chigot and Sarwono et al. included group activities in offices, indicating that workstation layout modification could achieve acoustical condition improvement to suit different working patterns.35,36 Similarly, modifying dwelling layouts could possibly reduce perceived and/or actual low-frequency noise without additional acoustic treatment.
Some mathematical formulae have been developed to describe sound fields in rooms; however, they are not directly applicable to multi-room dwellings since the acoustic characteristics in dwelling layouts are more complicated than the formulae hypotheses. A formal solution for a steady-state sound field in a single rectangular room and sound attenuation decay in coupled rooms have been indicated in previous works.37–40 However, the effects of layout acoustic factors, such as room geometry, absorption material distribution and the position and scale of door openings could not be considered in these formulae. Moreover, formulae based on statistical or geometrical acoustics may have defects in accuracy since they neglect volatility, and the wavelength of a low frequency is too long to neglect the volatility in relation to room dimensions in dwellings. More work is needed to predict SPL distributions in dwelling layouts at low frequency.
The aim of this research is to study the significance of layout design for interior low-frequency noise reduction in typical dwellings in certain parts of and across the layouts and to predict the value of ΔLP (low-frequency noise reduction) within dwelling layouts, given the lack of studies on low-frequency acoustics in multi-room systems. We analysed six typical Chinese dwelling layouts in detail under steady-state noise, as well as SPL reduction variation across the layouts, by room level (where the first room that sound crosses is called the first room level, and so on), and at a door opening between different layouts. In addition, a mathematical formula has been developed for calculating ΔLP using a given polyline distance and the number of door openings that the sound crosses.
Methodology
Concept definition
For SPL, shown in Figure 1, the difference in SPL values between the calibration point, which is 1 m from the middle of the window, and any one receiver position in the layout is called SPL reduction and marked as ΔLP. The SPL reduction at a door opening refers to the difference in the average SPLs of two to four points between the two sides of a door opening. Low frequency in this study was defined as 1 /3 octave bands below 200 Hz and down to 100 Hz, since the frequency is common for traffic noise (especially heavy vehicles).
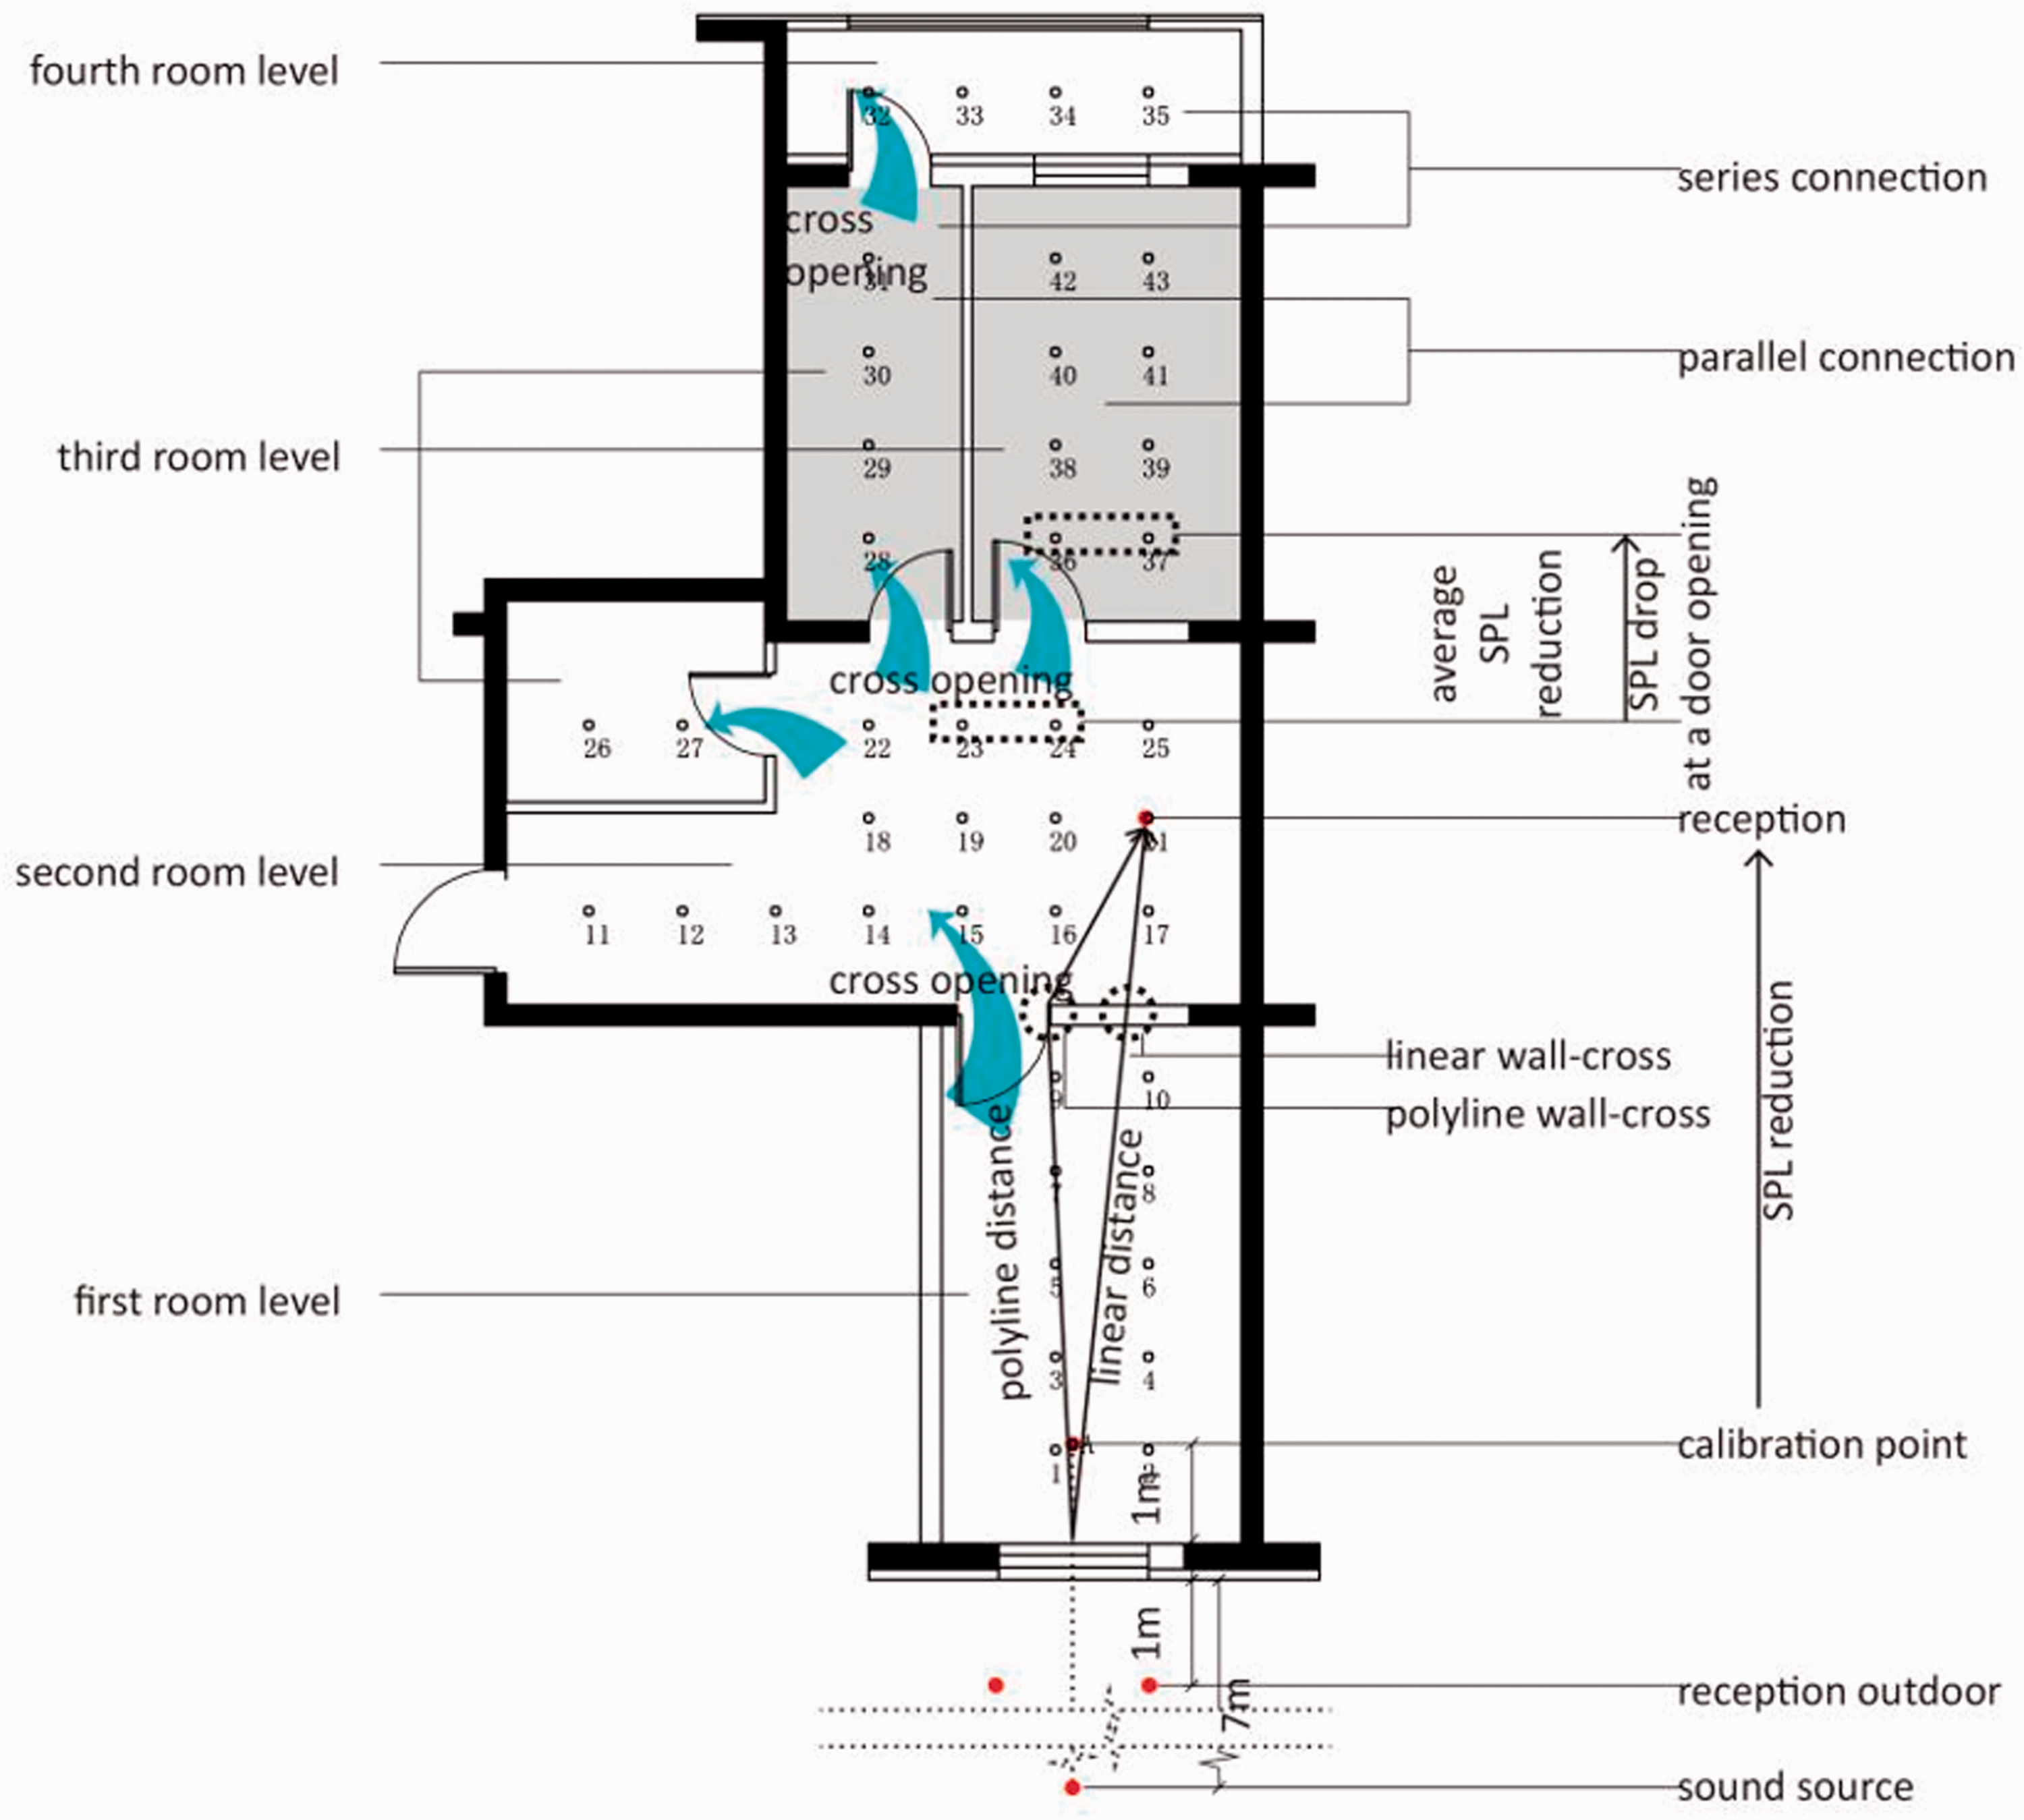
Concept definition and measuring methods.
For sound transmission, the linear distance is defined as the straight-line distance between the midpoint of the window and any receiver position in the layout. The number of walls the straight line has to cross is called the linear wall-cross number. Similarly, the polyline distance is defined as the shortest distance between the midpoint of the window and an arbitrary point via door openings, and the number of walls the polyline crosses is called the polyline wall-cross number. The first room the sound crosses is called the first room level (RL1). The process of the sound entering the second room level (RL2) is called the first wall-cross, and so on.
For types of room connection, the terms series, parallel, and series-parallel are used, analogous to an electric circuit. If sound has to cross two rooms one after another, there is a series connection between the two rooms. If two rooms share the same source room and receiving room, they are parallelly connected. When a room pair that is connected in series is parallelly connected to another room, the third room has a series-parallel connection with each of the former two.
Dwelling layouts
This study involved six typical Chinese dwelling layouts (L1–L6) and considered sound transmission factors, such as the maximum polyline distance, linear distance and depth, room levels, number of doors in the living room, functional arrangement types, geometry arrangement types (longitudinal, transverse, blend and single-room) and floor space, as is shown in Table 1. 41 These layouts all used shear wall structures, while the main interior material the noise transmits through is ceramsite concrete hollow brick (volume-weight 700 kg/m 2 ), which accounts for 53.8%–68.8% of the walls’ total length. The proportions and positions of concrete wall length were found to be similar in these layouts, with longitudinal walls of 1.5–1.8 m externally and short transverse walls of 0.3–0.5 m between dwellings, as is indicated in black shading on the floor plans in Table 1. The tested dwellings were completely constructed, among which layouts 1, 2 and 3 were whitewashed and floored. The sound sources were located on the vertical central line of the main rooms, oriented towards the bottom of each layout plan, as in Table 1. L2 and L3 were considered to be two different layout types, since their source locations and sound propagation paths are different. L2 is a series-parallel connection layout type with two room levels, in which sound enters the living room and a bedroom first before entering the other bedroom. L3, on the other hand, is a series connection layout type with three room levels, in which sound enters a bedroom first, then the living room, and finally the other bedroom. The approach and obtained results could also be applied to similar layouts elsewhere in the world, although the layouts were selected according to Chinese dwelling development.
Dwelling layout types and characteristics.
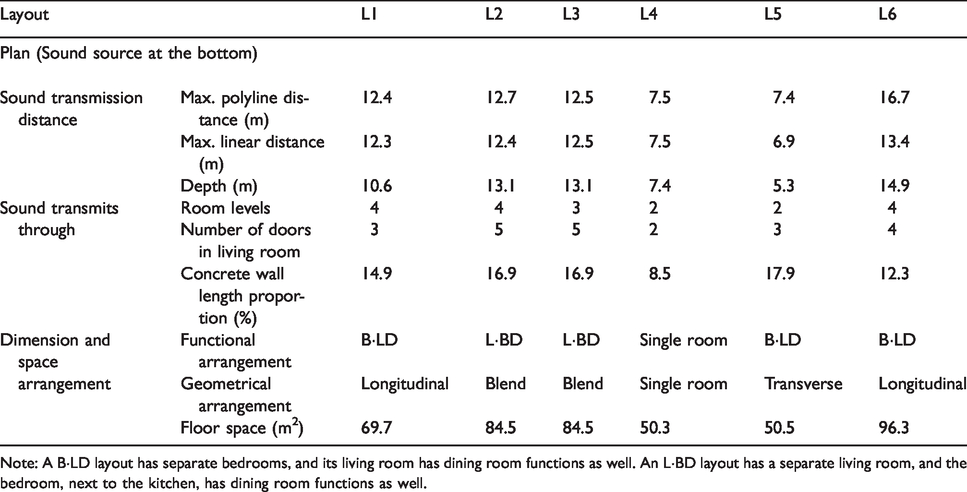
Note: A B·LD layout has separate bedrooms, and its living room has dining room functions as well. An L·BD layout has a separate living room, and the bedroom, next to the kitchen, has dining room functions as well.
Measurement method
The measurement procedure was designed to examine the sound field in detail based on ISO 10140-4:2010. 42 Only SPL in main rooms, namely the bedroom and living room, were tested and analysed, since they belong to the quiet room type, while the toilet and kitchen belong to the noise source room type. For source and receiver positions, an omnidirectional spherical sound source was placed roughly 7 m from the middle of the layout facade outside a main room window for all layouts (see Figure 1). The height of the sound source was 1.85 m. The sound levels around the open windows could vary because of different exterior wall insulation and outdoor landscape. Therefore, a reference position was set indoors, 1 m from the middle of the open window. In addition, the SPL values of the endpoints of a 1 m × 1 m square (see Figure 1) were roughly equal. For a layout, 25–48 receiver positions in a 0.9 m × 0.9 m grid from one another were considered, and the minimum distance between a room’s boundaries and any receiver position was 0.3 m.
Steady-state pink noise was played when testing the SPL values, in dB, inside the layouts. Since frequencies down to 100 Hz are common for traffic noise, especially heavy vehicles, this study considered four 1/3 octave bands at 100, 125, 160 and 200 Hz, as well as their average. Measured data calculation was done in accordance with EN ISO 717-1:2013. 43 For a higher frequency comparison, the 1/3 octave band at 800 Hz was used.
The windows facing the sound source and all doors inside the layouts were open (except for the doors of a small balcony and kitchen in L3, in which case sound from this balcony could be neglected since the measured SPL in this kitchen was approximately equal to the background noise level). The other windows were kept closed.
Results and discussion
Effect of layout design on ΔLP across the layouts
Figure 2 illustrates the SPL distribution in different layouts at 100, 125, 160, 200, 100–200 and 800 Hz. The colour maps were created using Surfer software. 44 The overall SPL variation in different layouts can be observed. It can also be seen that the SPL generally remains steady in one room with increasing distance from the source, whereas it sees a considerable decrease as sound propagates to the next room level or through specific space patterns.
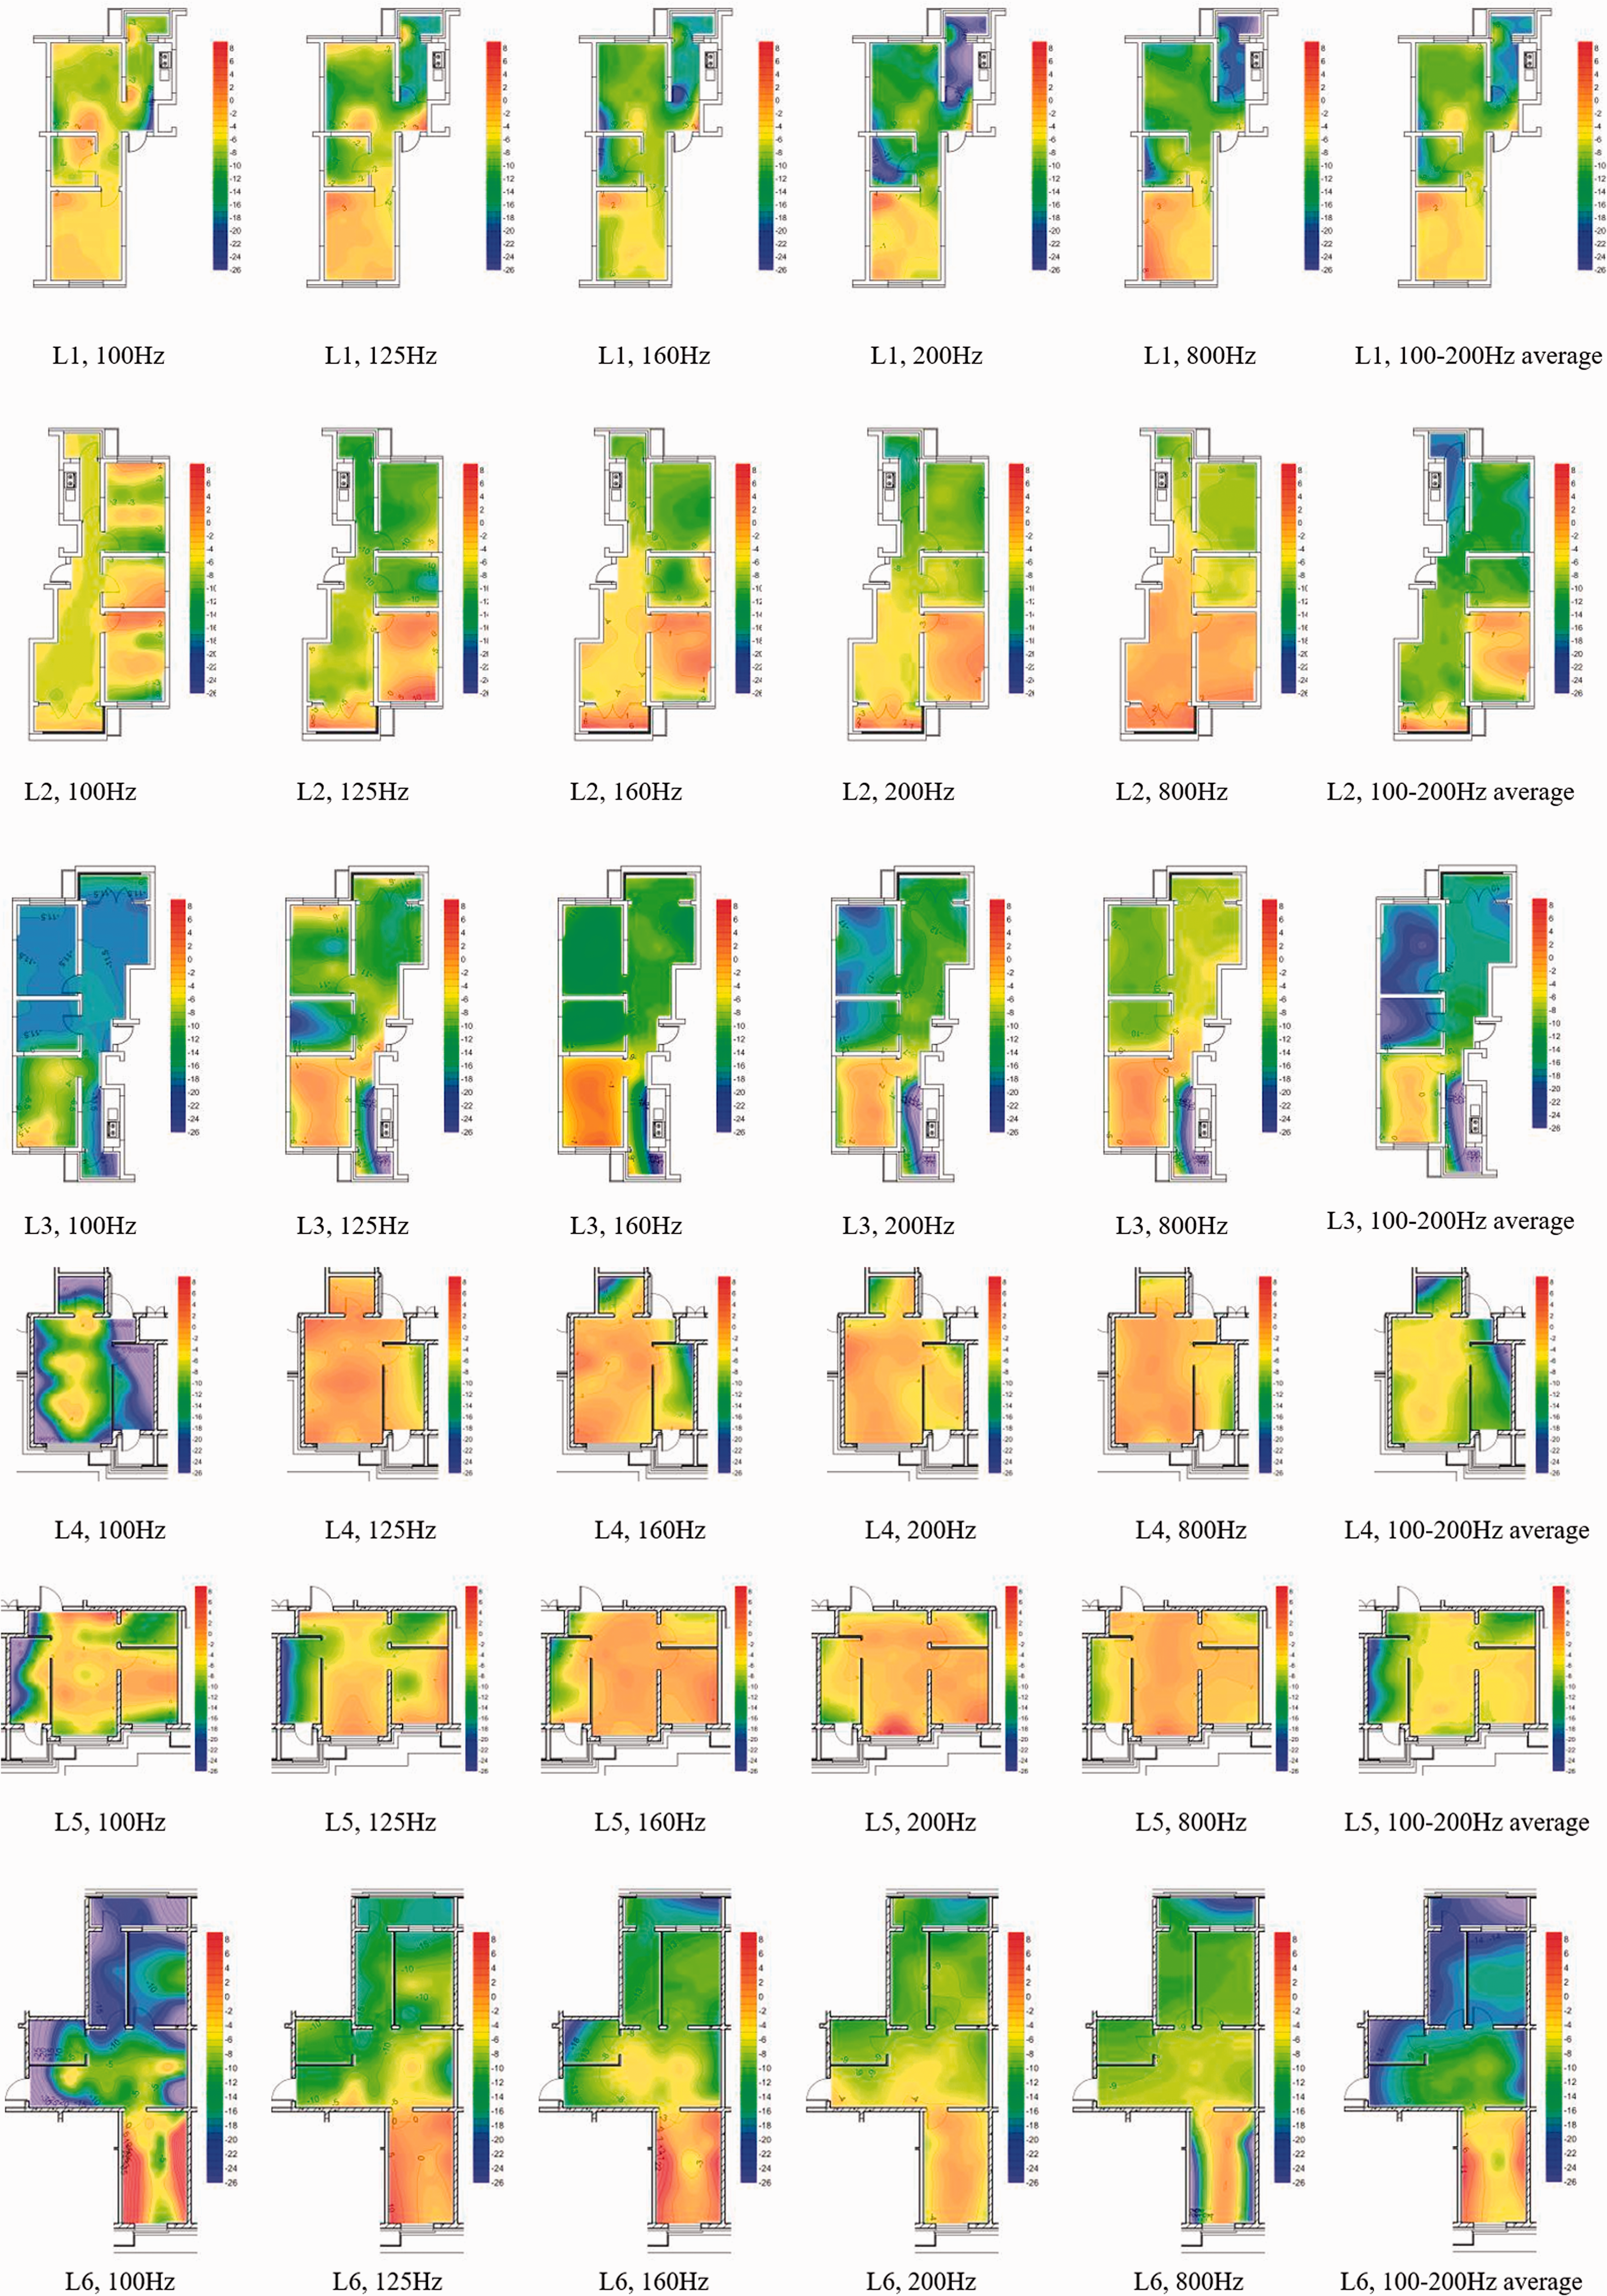
ΔLP (dB) distribution in different layouts, at typical frequencies of 100, 125, 160, 200, 800 Hz, and 100–200 Hz average.
There is a considerable variation in ΔLP across the layouts, both in layouts with two bedrooms (L2, L3, L6) and those with one bedroom (L1, L5). The variation was analysed for these two groups because layouts with the same number of bedrooms are comparable to each other. When only the main rooms are considered, the ΔLP variation in layouts with both one bedroom and two bedrooms could be up to 1.7 and 5.6 dB, respectively, at 100–200 Hz. Among the layouts with two bedrooms, L3 had the highest average ΔLP, amounting to 9.5 dB, while L2 had the lowest (only 3.9 dB). The variation in maximum ΔLP across each layout is slightly greater, amounting to 6.2 dB, with ΔLP ranging from 9.1 dB for L2 to 15.3 dB for L3. Between one-bedroom layouts, the average and maximum ΔLP vary by relatively limited ranges, 1.7 and 2.0 dB, respectively. The variation might be caused by the different dimensions of the room-wall-room system, which was suggested in Osipov’s study as one of the most critical influences on sound transmission between rooms because it affects the room modes. 45 At 800 Hz, the variation in average ΔLP is slightly smaller than that at low frequency by less than 1 dB, while the figure in maximum ΔLP among two-bedroom layouts is considerably smaller (merely 2.2 dB).
The average ΔLP across each layout sees a similar general tendency at different frequencies, although the layout best at reducing noise level differs by frequency. At 100–200 Hz, L3 attenuates the most noise among two-bedroom layouts, by 9.5 dB. At 800 Hz, however, L6 attenuates the most noise, by 6.8 dB. This variation grows at 100 Hz, with the overall average ΔLP 5.4, 2.6 and 1.9 dB higher when compared to 125, 160 and 200 Hz, respectively, in L2, which may be a result of the rooms’ eigenmodes. Between one-bedroom layouts, L1 attenuates more noise than L5 by 1.7 dB at different frequencies.
It may be reasonable to suppose that a parallel connection between rooms is a contributing factor to the relatively larger increase in ΔLP. Because the parallel connections are the only connection type that can be compared between the tested layouts, they are the only ones analysed in this article. When L1 and L3 are compared, noise transmits through a main room–narrow communal space–main room series of spaces in both layouts. At 100–200 Hz, the average SPL decreases by 5.3 dB for the living room paralleled with a kitchen (L1) and 10.8 dB for the living room paralleled with a bedroom (L3). A similar phenomenon is also observed when comparing L3 and L4. By contrast, at 800 Hz, no such difference related to a parallel connection is observed. The evidence suggests that the greater decrease in the low-frequency component may be attributed to the parallel connection between rooms of similar dimensions. This reduction may originate in the fact that the original sound energy is divided into two parts. Additionally, the propagation distance of reflection sound in the studied rooms and the times of reflection are increased by the parallel connection, adding to the transmission loss. This is also consistent with previous study results obtained by Tong, who noted that the presence of a longitudinal partition wall in the layout increases the overall sound absorption by room surfaces. 27
Narrow communal space in the layouts may also have been a factor in the fast ΔLP increase. The SPL reduction at 100–200 Hz in narrow communal spaces in the studied layouts is 2–6 dB, close to the SPL reduction at door openings, while the figure at 800 Hz is barely 1–4 dB. Although the SPL generally remains stable in one room even with increasing distance from the source, it sees a considerable decline in front of the bedroom door in L1, the kitchen door in L2, and in the foyers by the layout entrances. These spaces are narrow, possibly increasing the transmission loss due to a higher chance of reflection and interference (see Figure 2). Kang studied the sound propagation in a similar type of space, and the sound attenuation along the length was found to be notably greater. 17 The results here confirm the previous findings at low frequency.
Effect of layout design on ΔLP in each room level
Figure 3 illustrates the average and maximum ΔLP in each room level in different layouts. It seems that at 800 Hz, the ΔLP distribution is relatively more even than at 100, 125, 160 and 200 Hz. The difference between the maximum and minimum SPL in a given room level has not shown an identical change pattern in different layouts.
ΔLP (dB) variations of main rooms in different layouts (thick line, average ΔLP with standard deviation shown; dashed line, maximum ΔLP), at typical frequencies of 100, 125, 160, 200, 800 and 100–200 Hz average.
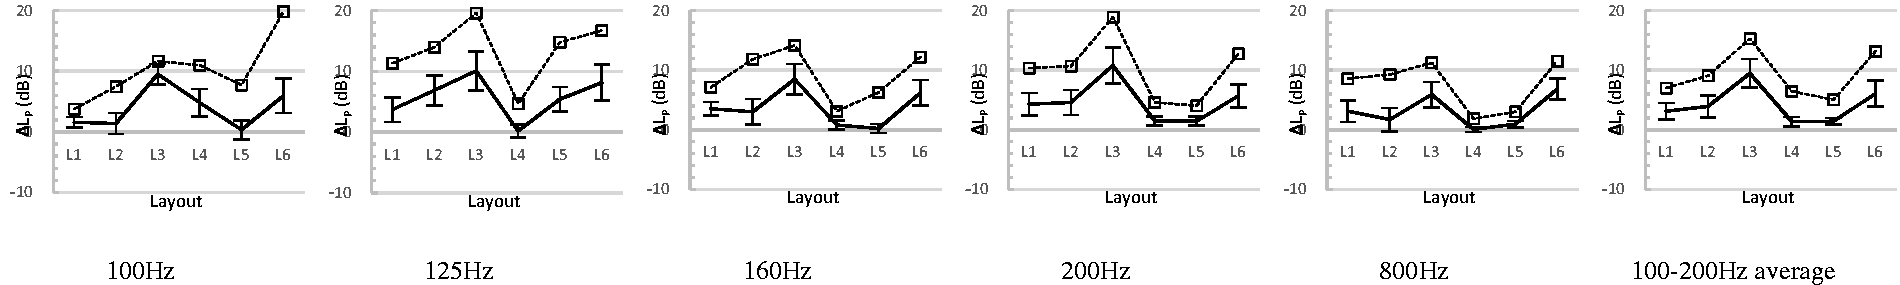
Layout design shows a significant effect on ΔLP in RL2, but its effect on ΔLP in RL1 and RL3 is less obvious. Figure 4 shows the layout design effect on ΔLP and the standard deviation. The variation of ΔLP at 100–200 Hz in RL1 is barely 1.5 dB, suggesting that the SPL is mainly determined by direct sound rather than layout design. In RL2, the larger ΔLP variation of 5.5 dB at 100–200 Hz (up to 11.1 dB at 100 Hz) may be caused by its complicated connection with other rooms. On the other hand, in RL3, the ΔLP at 100–200 Hz varies by 4.9 dB due to layout design, with a smaller variation of 3.1 dB at 160 Hz. In terms of the standard deviation in a given room level, the largest is observed in RL1 in L5; at 125 Hz, the difference between the maximum and minimum SPL is up to 10.3 dB. This may be caused by the centralised room connections at the end of the living room. A relatively even distribution of SPL has been observed in RL1 in L3.
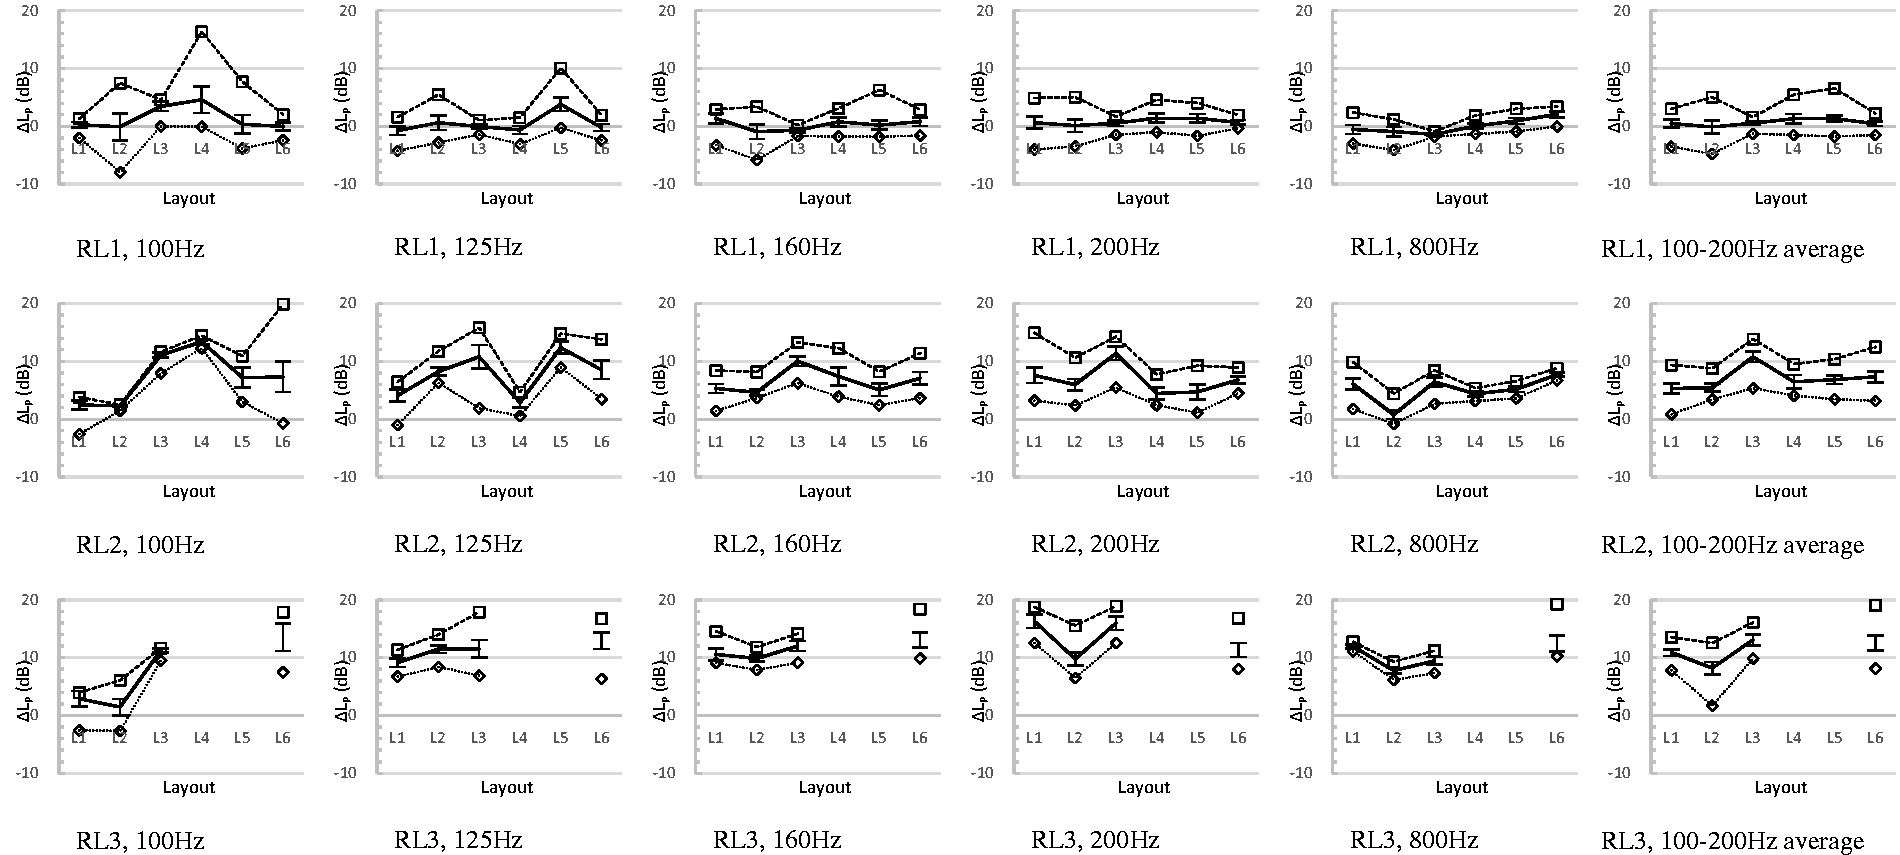
ΔLP (dB) variations of each room level in different layouts (thick line, average ΔLP with standard deviation shown; dashed line, maximum ΔLP; dotted line, minimum ΔLP), at typical frequencies of 100, 125, 160, 200, 800 Hz, and 100–200 Hz average.
Layout design shows a significant effect on the SPL difference between room levels, with the figure ranging from a mere 3.6 dB to as much as 7.3 dB, while the variation by layout is up to 3 dB (see Figure 5). The largest variation is in L3 at 100–200 Hz (3.1 dB increase) and in L2 at 800 Hz (5.3 dB decrease). The differences in SPL between RL1 and RL2 and between RL2 and RL3 are generally equal (around 3.5 dB).
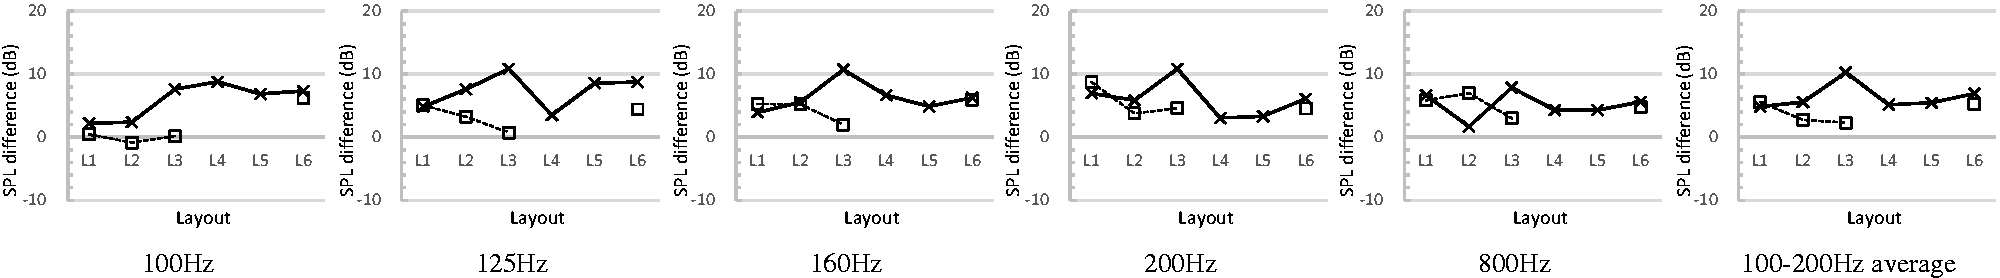
Variations of the difference of average SPL between room levels in different layouts (thick line, difference of SPL between room level 1–2; dashed line, difference of SPL between room level 2–3), at typical frequencies of 100, 125, 160, 200, 800 Hz, and 100–200 Hz average.
Effect of layout design on SPL reduction at door openings
Layout design shows considerable influence on the SPL reduction at door openings in all six typical layouts, with a variation of 3.1 dB at low frequency. Moreover, no obvious change pattern of the figure was observed as the room level increases. Although the figure for the first and second door openings (between RL1–2 and RL2–3) generally hovers around 5 dB in most cases, it varies significantly (ranging from 2.5 to 5.6 dB) in specific layouts and leads to considerable variation after a few room levels. It also greatly differs at different frequencies (see Figure 6). For example, at 100–200 Hz, the SPL reduction at the door opening between RL1–2 in L1 and RL2–3 in L6 is less than 3 dB. At 800 Hz, however, the SPL reduction for RL2–3 in L2 is nearly 8 dB. At L2’s first door opening, there is a decline in the figure as frequency increases to 800 Hz, whereas at its second door opening, it sees an opposite tendency (from 5.2 to 7.5 dB). In L3, the SPL reduction at the first door opening has similar values at 100–200 Hz and 800 Hz (around 4 dB), despite being 2–5 dB less at 125 Hz than higher frequencies. At the second door opening, the figure for 100–200 Hz is nearly 2 dB larger than the figure for 800 Hz (4.9 and 3.4 dB respectively), and even larger at 125 Hz (7.8 dB). Soundproofing doors or simply keeping the door closed should be more effective at the door openings with lower SPL reduction. Evidently, the space pattern, rather than the room level, exerts more influence on the SPL reduction at door openings among measured typical layouts. Therefore, the figure for a given space pattern among any room levels may be predictable.
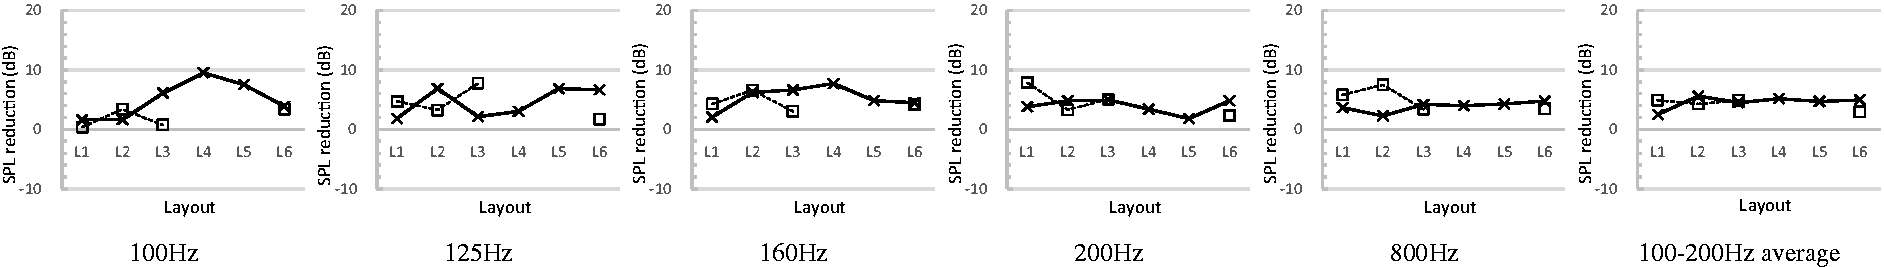
SPL reduction (dB) variations at door openings in different layouts (thick line, at the first door opening; dash line, at the second door opening), at typical frequencies of 100, 125, 160, 200, 800 Hz, and 100–200 Hz average.
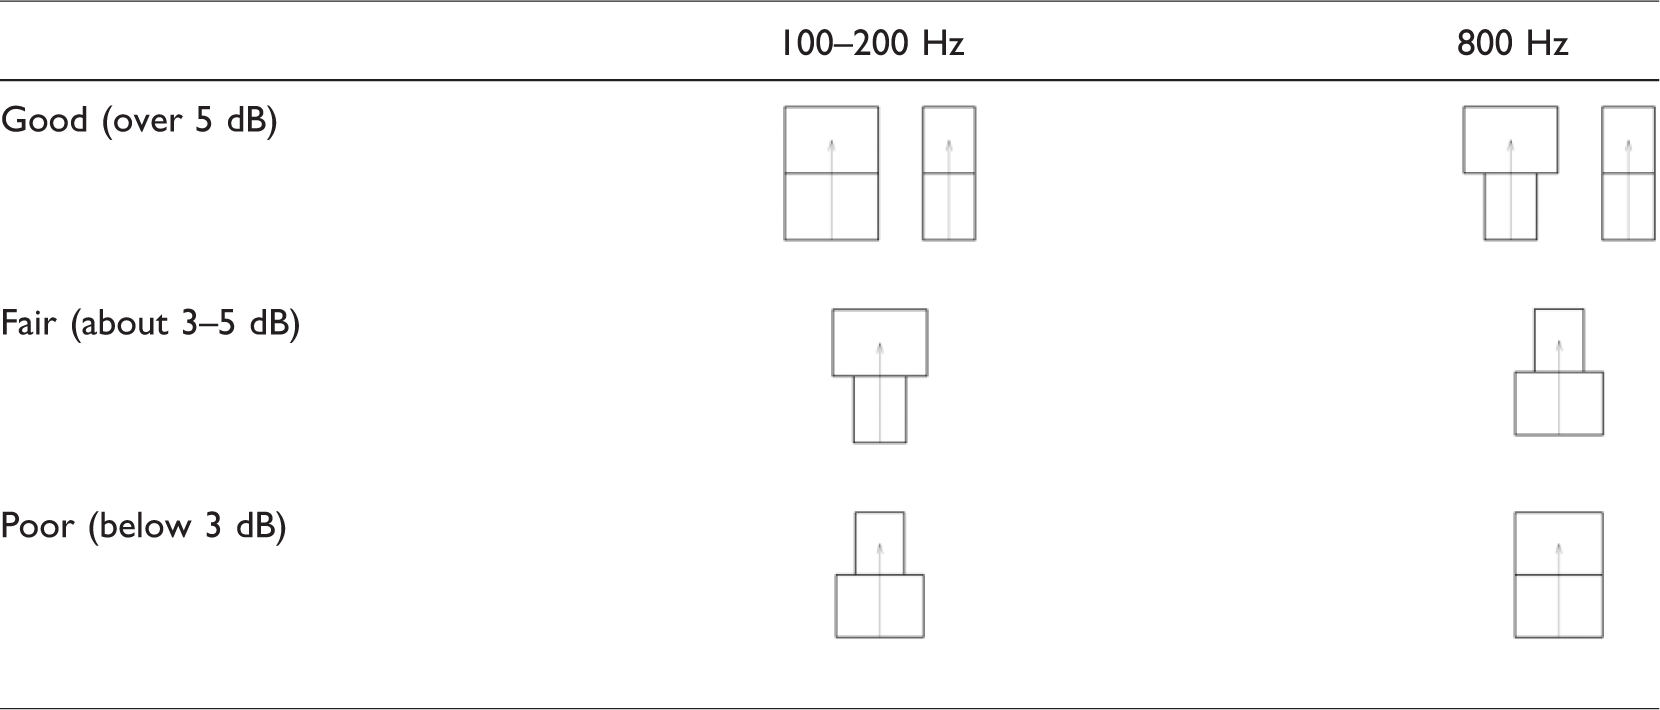
The evidence points to the likelihood that the sudden expansion or contraction of a cross-sectional size, rather than a change of room volume, could be a factor in SPL reduction variation at door openings across frequencies.46,47 This appears to be contrary to the results of a previous study showing that room volume has some effect on the acoustic performance of coupled volumes in a concert hall. 48 This may be attributed to the transmission loss resulting from the impedance mismatch at the sudden cross-sectional size discontinuity in relatively small room volumes. The SPL reduction of space patterns differs across lower and higher frequencies, as shown in Table 2. At 100–200 Hz, the largest SPL reduction is at a generally uniform cross section (over 5 dB), while the figure for sudden expansion is less, at 3–5 dB. The reduction at sudden contraction is the least, at less than 3 dB. At 800 Hz, the largest SPL reduction is also at a narrow uniform cross section, and SPL reduction at sudden expansion is greater than that at sudden contraction. The results are similar at 100–200 Hz, whereas the opposite conclusion is shown at wide uniform cross sections (less than 3 dB at 800 Hz). These results are inconsistent with previous studies on mufflers,49,50 possibly because the sound experiences not only a simple change in cross-sectional size on both sides of the door opening, but also a contraction–expansion process as it transmits through a door opening.
Resistance of noise and SPL reduction at door openings of different space section patterns, at typical frequencies of 100–200 Hz and 800 Hz.
Effect of wall-cross number and polyline distance on ΔLP
Correlation analysis showed that polyline distance has a higher correlation coefficient (0.853, p < 0.01) with ΔLP than linear distance, and univariate analysis indicated that polyline wall-cross is most associated at the same polyline distance. The factors considered included linear distance (dl), polyline distance (dp), linear wall-cross number (Nlw) and polyline wall-cross number (Npw). The change of ΔLP with the increase in dp and Npw seems to be consistent across different layouts (see Figure 7), and thus, it could be predictable. We have designed a regression model to approximate the value of ΔLP in layouts at 100–200 Hz, based on a total of 236 data points.
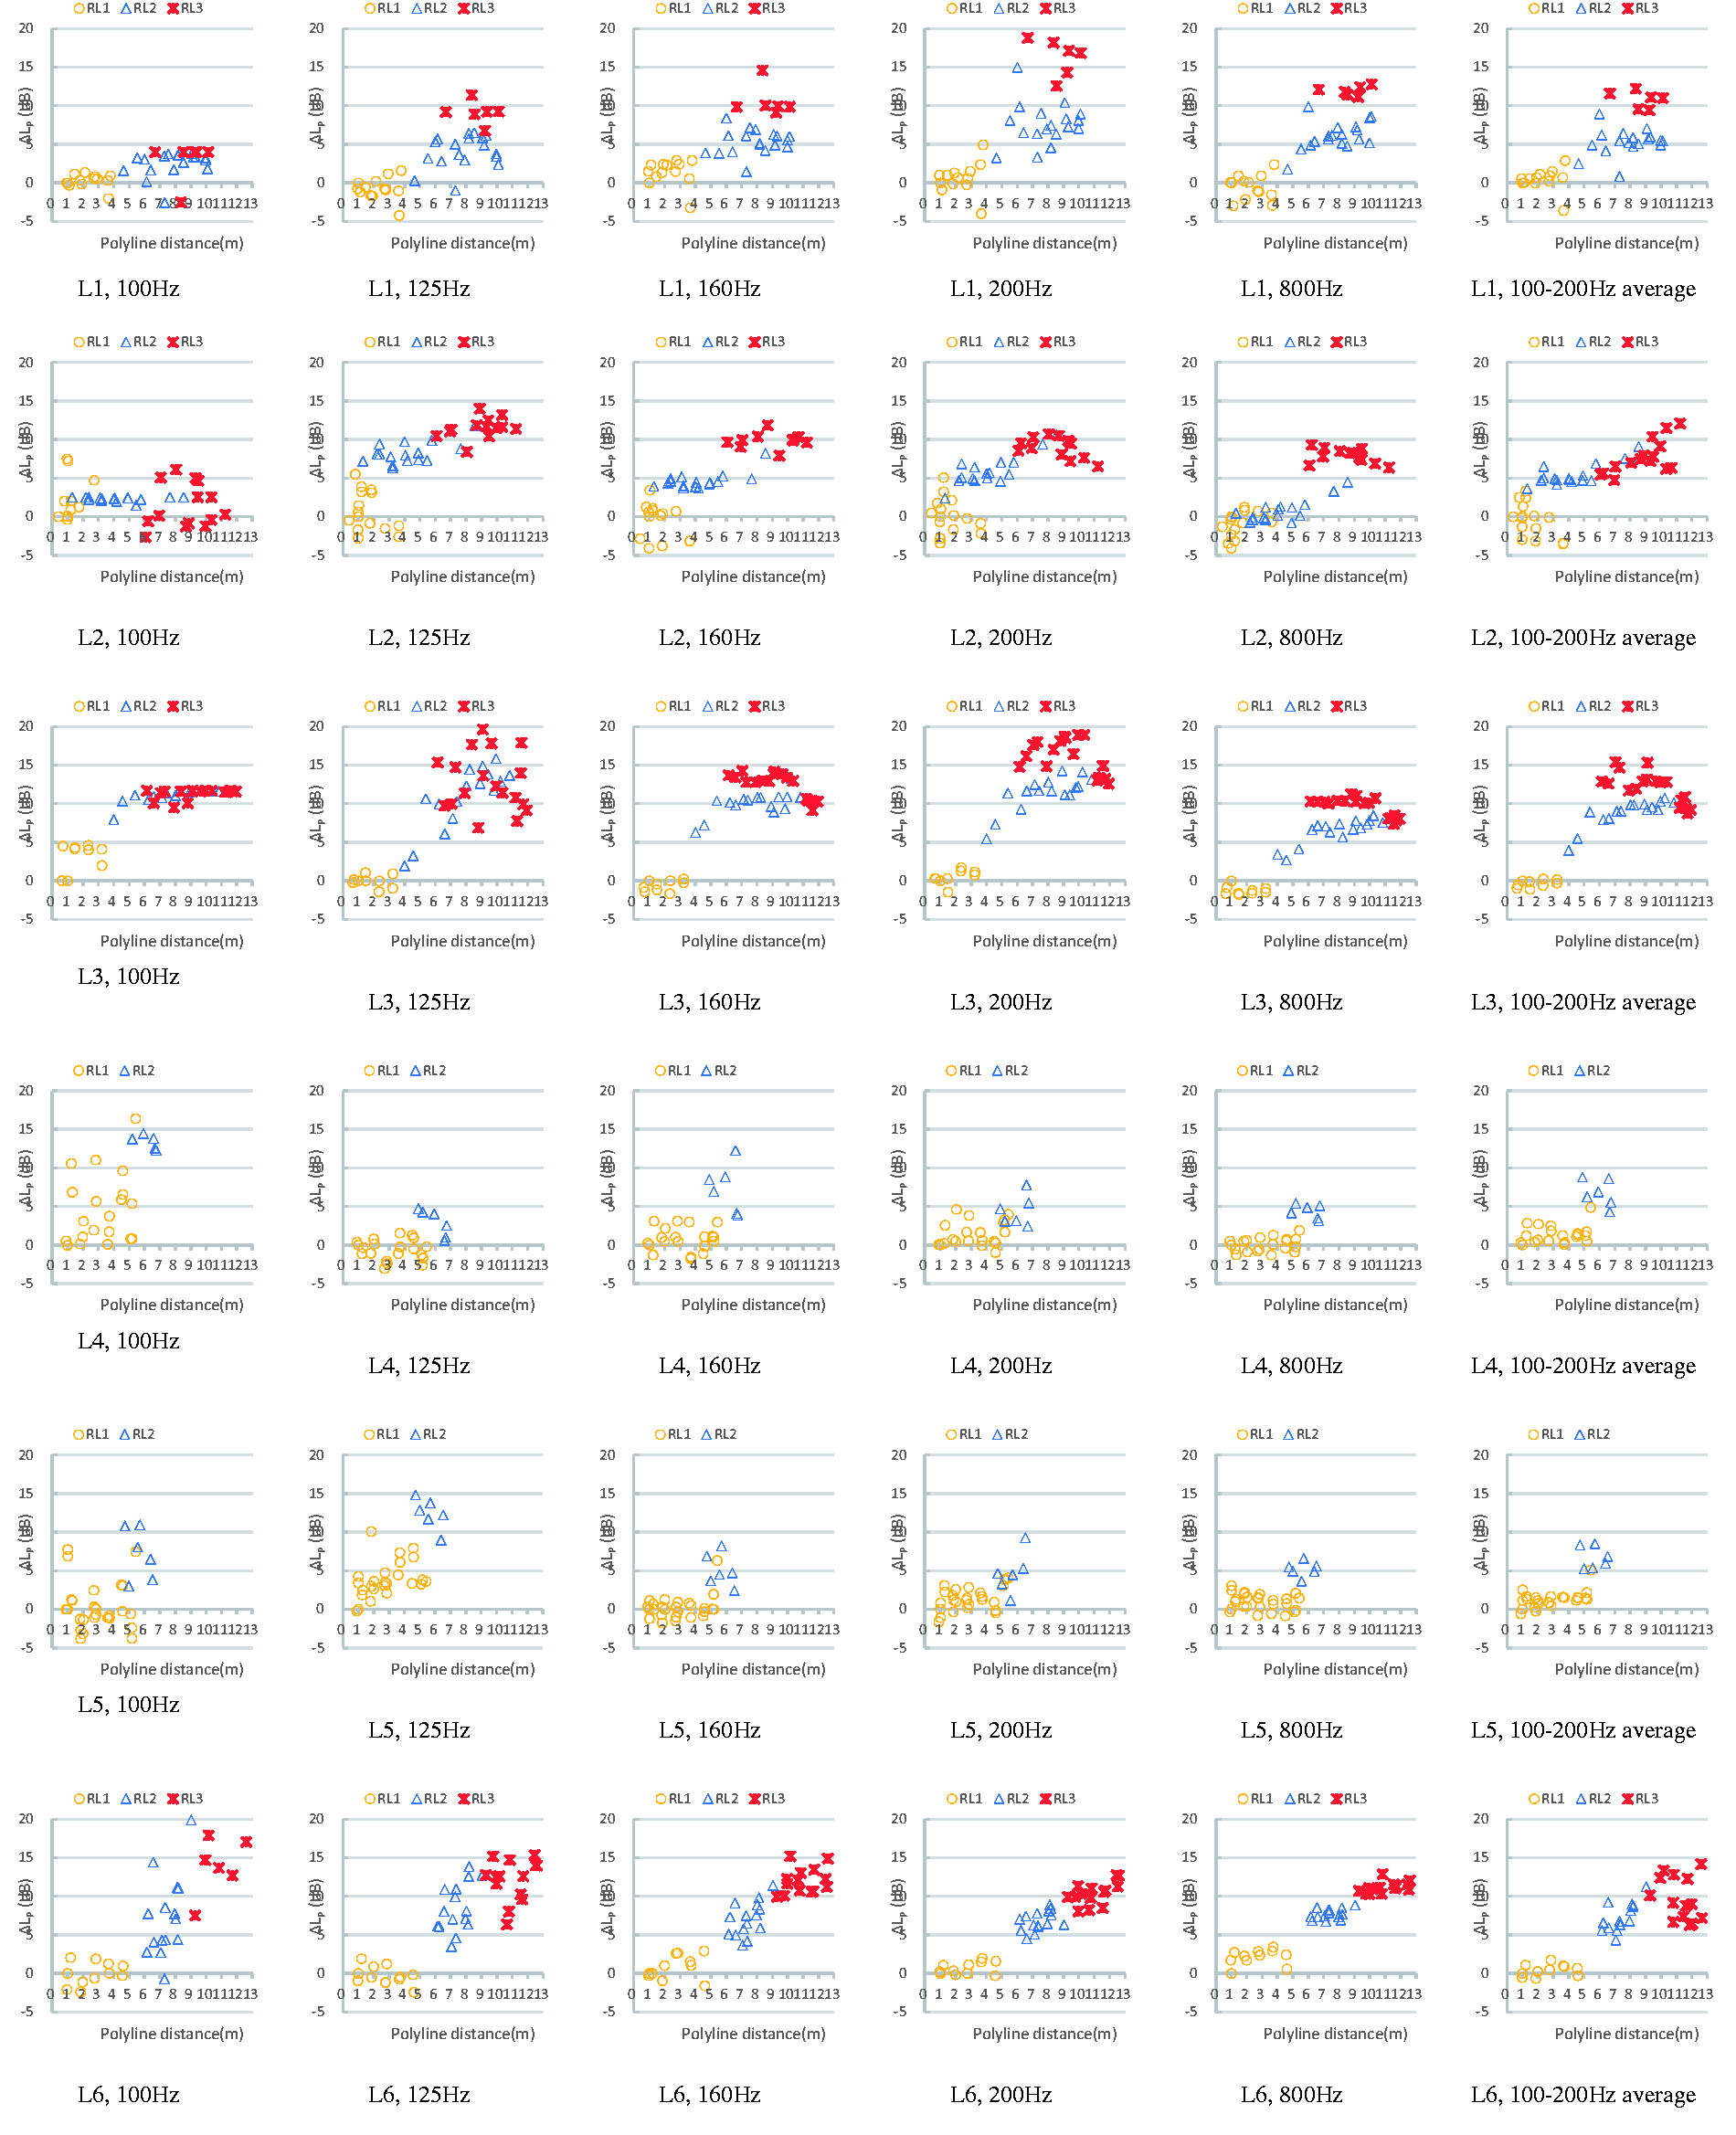
Measured ΔLP (dB) with polyline distance and room level (RL1–RL3, amount of points in other room levels was too small to show change pattern) in different layouts, at typical frequencies of 100, 125, 160, 200, 800 Hz and 100–200 Hz average.
The results of multivariate stepwise regression analyses suggested that only three models passed collinearity diagnostics (VIF < 5), in which Npw, dp and number of door openings (except entrance) in the living room were added stepwise as independent variables. According to the linear regression analysis, the number of door openings is not significantly associated with ΔLP. Additionally, the existence of the independent variable Npw leads to a higher adjusted R2 by 0.033 and lower standard deviation by 0.15. Therefore, only Npw and dp were included in the final model.
After the determination of independent variables, their possible linear or non-linear (including quadratic, compound, logarithmic, cubic, exponential and inverse) relationships with ΔLP were analysed by processing curve estimation. In terms of dp, a linear model explained ΔLP better (R2 = 0.727) than both a quadratic model and cubic model, in which R2 rose by only 0.001. Hence, the simpler linear model was chosen. In terms of Npw, both a quadratic and cubic model explained ΔLP well to generally the same degree, so the simpler quadratic model was chosen.
The regression formula obtained is
When a constant was not included in the equation, the value of error did not satisfy the normal distribution. Therefore, the constant α was included in the model. Then, because of the existence of heteroscedasticity in the results of residual analysis, this article used the weighted least squares method to modify the model. The four tested weights were chosen as


There are some general suggestions for layout design that could be made based on this model. Noise reduction in RL2 is expected to be 4 dB more than in RL1. Additionally, the reduction in RL3 is expected to be 2 dB more than in RL2 when the values of Npw (0,1,2,3) are imported into the model, with dp serving as a control variable. Hence, bedrooms placed in the second or third room level would be generally favourable, since a significant noise reduction and access to quietness could be achieved. However, designing a fourth room level is not suggested, since noise reduction in RL4 is expected to be only 1 dB more than in RL3. Narrow communal space or auxiliary rooms, such as toilets and cloakrooms, placed between main rooms could also have a favourable effect. According to the model, the dp values for some main rooms would then increase, and the noise level in these rooms would decrease.
Conclusions
Evidence from in-situ measurement in Chinese typical dwelling layouts suggests that layout design shows a significant effect on its interior low-frequency noise reduction. When layout is considered as a whole, the variation of overall average SPL reduction at 100–200 Hz (ΔLP) could be up to 6 dB in two-bedroom layouts and about 2 dB in one-bedroom layouts (only concerning the bedroom and living room). The layout’s effect on the maximum ΔLP is slightly more significant. With parts of the layout taken into consideration the second room level is most affected by layout design in most cases, varying by as much as 6 dB compared to a mere 2 dB in RL1. The variation of ΔLP with the room level increase in different layouts is also considerable, at about 3 dB, ranging from 4 to 7 dB. The reduction between RL1–2 and RL2–3 are generally equal at around 4 dB. The low-frequency SPL reduction at a door opening varies by nearly 5 dB among layouts, while there is no significant difference in the reduction among room levels. Moreover, a mathematical model has been developed to predict the value of ΔLP in layouts with a given polyline wall-cross number and polyline distance that shows good agreement with measured ΔLP. As noted earlier, the layouts tested in this research were selected in China, so further work could be done on other types of layouts worldwide using similar methods. Also, future work could focus on lower frequencies with specific measurement methods. The results are based on the measured six typical layouts, and more systematic research using simulation methods could be carried out in future work.
Footnotes
Declaration of conflicting interests
The author(s) declared no potential conflicts of interest with respect to the research, authorship, and/or publication of this article.
Funding
The author(s) received no financial support for the research, authorship, and/or publication of this article.