
Abstract
To carry out the experimental study of flow-induced vibration for roller compacted concrete dam (RCCD), the improved hydroelastic model experiment (HEME) technology that satisfying both the hydraulic and structural dynamic similarities is presented, and an improved combinatorial method is proposed to effectively and accurately calculate the dynamic characteristics of RCCD model under natural excitation and complex environment. Due to the insufficient study on the simulation technique for the interfaces between adjacent concrete layers in RCCD, the conventional HEME technology which is frequently applied is not applicable to the RCCD dynamic analysis. Therefore, the hydroelastic simulation schemes for cold joints and ordinary interfaces in RCCD are firstly presented based on experimental and theoretical researches and numerical verification. Then, the integral RCCD model is established and its dynamic displacements under flood discharge excitation are tested. Furthermore, the proposed method that combines the advantages of natural excitation technique (NExT), singular entropy (SE) method, and eigensystem realization algorithm with data correlation (ERA/DC) method is applied to calculate the dynamic characteristics of RCCD model. The dynamic characteristics of the RCCD model calculated by the proposed theoretical method are very similar to those of the actual RCCD calculated by numerical simulation, which indicate the effectiveness and accuracy for the improved HEME technology and combinatorial method.
Keywords
Introduction
Construction technology for roller compacted concrete dam (RCCD) is presented and becomes mature for application in the past 30 years. The RCCDs are made of roller compacted concrete (RCC), which consists of many roller compacted concrete layers (RCCLs) and interfaces between the adjacent RCCLs. If the interval time between the concrete pouring for the upper and lower RCCLs exceeds the allowable time, the interfaces between the adjacent RCCLs are also called cold joints. It is noted that the cohesion, shear strength, and impermeability of the cold joint effect zone (CJEZ) which consists of the cold joint and surrounding concrete are significantly lower than other part of the dam, and thus the CJEZs are more vulnerable under adverse working conditions.1,2 In recent years, Gu et al.3,4 studied the effect of CJEZs with a certain thickness on the static mechanical behavior law of RCCD and obtained some beneficial results. It is certain that the static and dynamic characteristics of the CJEZ are significantly different from those of the RCCL, but the related research is rarely reported. Therefore, the frequently used traditional hydroelastic model experiment (HEME) technology is not suitable for the dynamic simulation and analysis of RCCD, which may lead to insufficient understanding of the dynamic characteristics of RCCD and potential dynamic safety problems in practical engineering.
Actually, the various vibration hazard problems (such as the intense vibration of hydraulic gate, 5 abnormal vibration of hydro-turbine-generator, 6 and environmental vibration of surrounding ground 7 ) induced by high dam flood discharge have occurred in many hydraulic projects. Therefore, a lot of studies on flow-induced vibration for traditional arch and gravity dams and their hydraulic structures have been carried out.8–11 Many researches12–17 have shown that the HEME technique is one of the most popular and successful experimental methods to study flow-induced vibration considering the interaction among flow, dam, foundation, and reservoir. The HEME technique is presented by Cui et al. 12 in 1980s under the support from Chinese National S & T Project in Seventh Five-year Plan and National Natural Science Foundation of China. The main difference between hydroelastic model and conventional hydraulic model is that self-developed high-density rubbers instead of plexiglass (or hard plastics) are employed to simulate construction materials such as concrete. To satisfy the hydraulic and structural statics/dynamics similarity criterions between the real structure and simulated model, the density of self-developed rubber should be equal to that of concrete but the elastic modulus of rubber should be equal to the concrete elastic modulus divided by the geometric scale. 13 As shown in Figure 1, the HEME technology is firstly applied in the dynamic analysis for the flow-induced vibration of Ertan high arch dam and is then widely used in flow-induced vibration studies of Three Gorges, Xiangjiaba, Xiaowan, Goupitan, Xiluodu, Laxiwa, Wudongde, and many other water conservancy projects.14–17 Especially in the study for the reduction of ground vibration induced by flood discharge, 5 the optimal operation scheme aiming at reducing the ground vibration is presented based on HEME technology and has achieved very good results. The peak ground acceleration under same discharge volume is attenuated by more than 30% with no increase in cost. It is noted that many RCCDs over 100 m in height have been built or are currently under construction in worldwide, and the intense vibration of hydraulic structures and surrounding ground of RCCD may be induced due to the high drop height, large discharge volume, and enormous water energy. Therefore, the study on flow-induced vibration of RCCD should be paid more attention by the researchers and engineers. However, due to the static and dynamic characteristic difference among the RCCL, CJEZ, and pouring interface layer (PIL), the traditional HEME technique, which only considers the homogeneous concrete material and does not consider the cold joint and pouring interface, is not suitable for the dynamic simulation and analysis of RCCD. To simulate the RCCL, CJEZ, and PIL in hydroelastic model, we firstly investigated the dynamic properties of these structures, and then several hydroelastic simulation schemes are applied to simulate RCCL, CJEZ, and PIL. The simulation results of different simulation schemes are further analyzed and compared, and finally the HEME technique that elaborately simulates RCCL, CJEZ, and PIL is presented and applied in the research of flood discharge induced RCCD vibration.
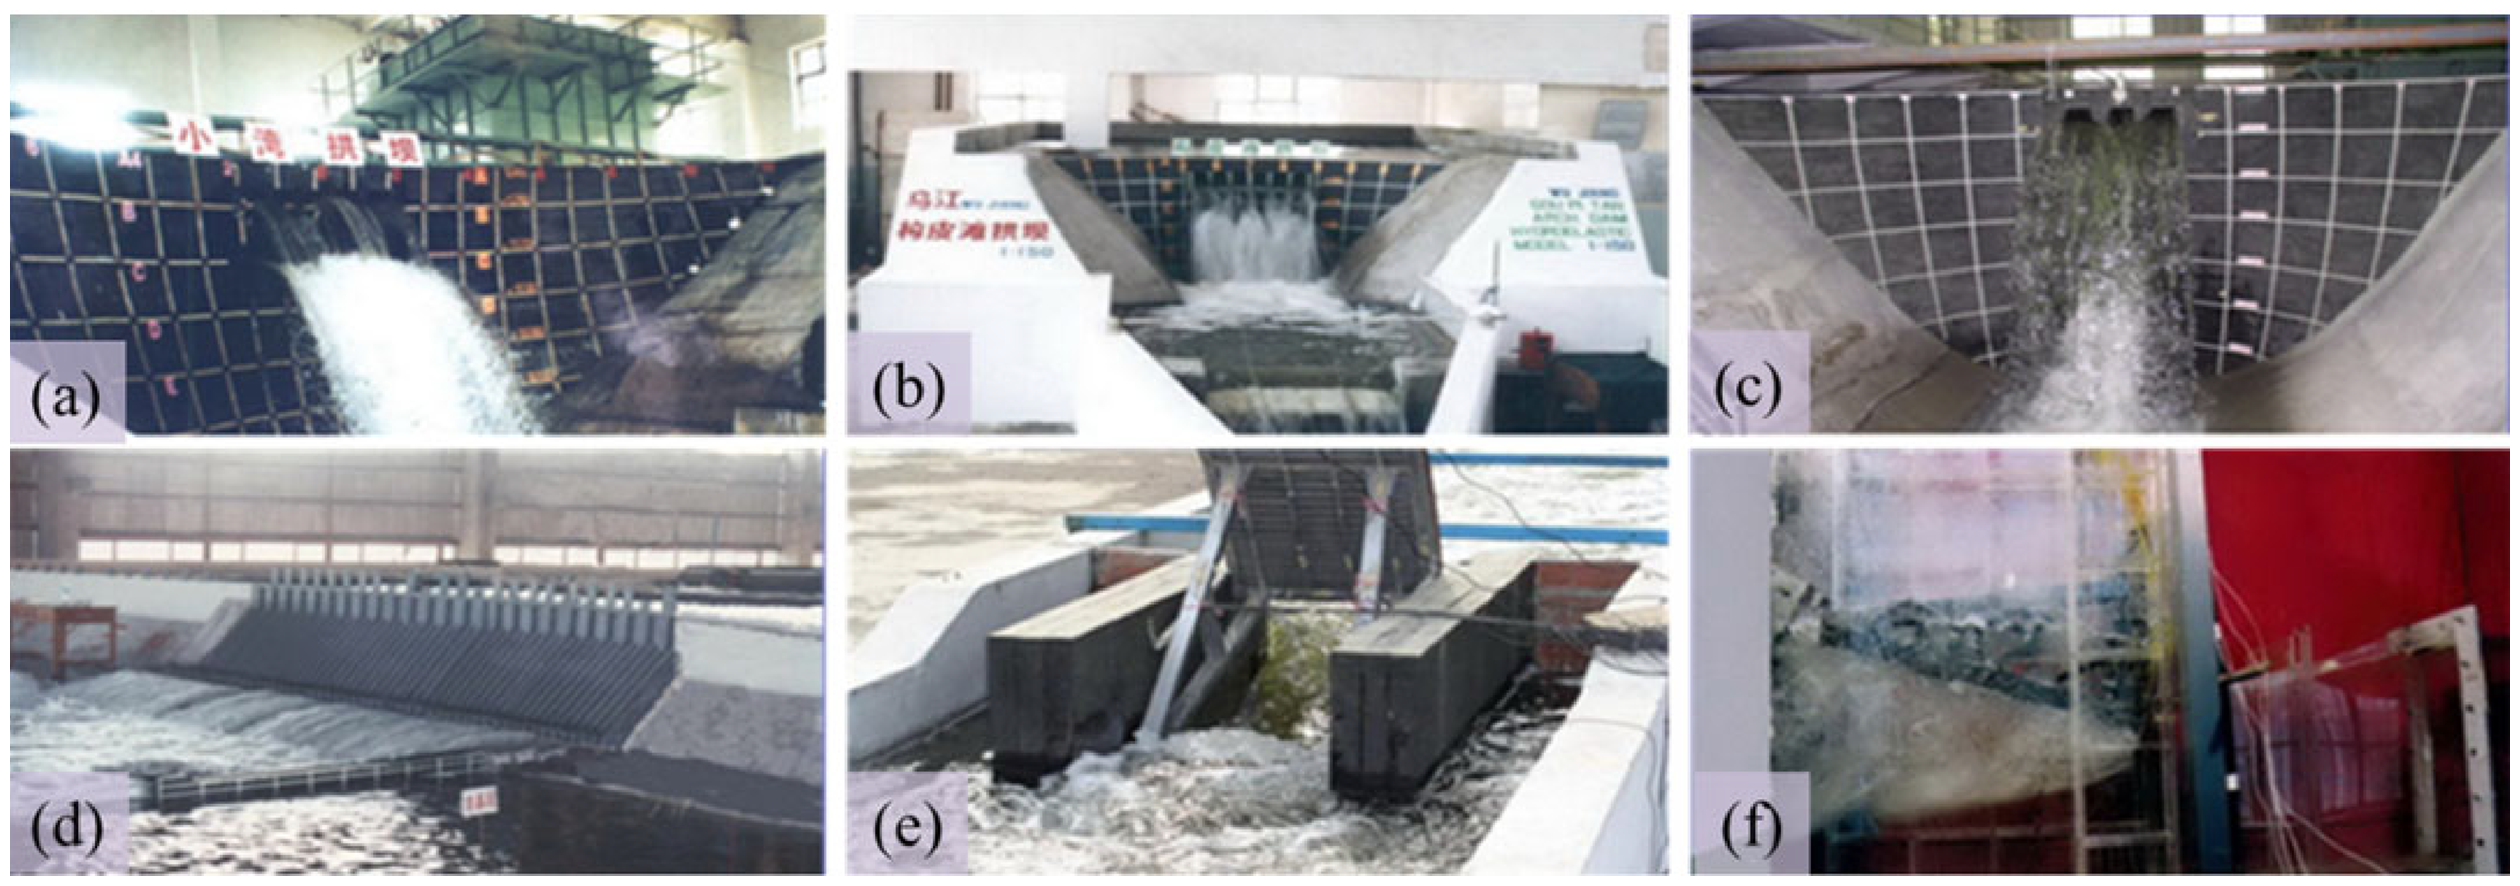
Engineering application of the HEME technology. (a) The arch dam of Xiaowan hydropower project; (b) the arch dam of Goupitan hydropower project; (c) the arch dam of Laxiwa hydropower project; (d) the guide wall of three Gorges hydropower project; (e) the hydraulic gate of Xinzheng hydropower project; and (f) the hydraulic gate of three Gorges hydropower project.
To verify whether the structural dynamic similarity criterion between the real structure and the hydroelastic model is satisfied, the modal parameters of hydroelastic model are identified and compared with those of real structure. Due to the inconvenience (even impossibility) of the artificial excitation for the large-scale hydropower project and the noises induced by human activity, machine operation, testing instrument, and environment in the vibration signals obtained by prototype and model experiments, many modal analysis methods under natural excitations are applied for the mode analysis of hydraulic structures.18–22 Because of the multi-input and multi-output property, efficient calculating, low data demand and strong identify capacity, eigensystem realization algorithm (ERA), and its modified version23,24 are frequently used in hydraulic structure mode analysis.18,22 In order to further increase the anti-noise ability and modal recognition accuracy of the algorithm, an improved combinatorial method is proposed in this article to precisely obtain the modal parameters for the hydroelastic model.
The reminder of this article is organized as follows. The upcoming section studies the physical and mechanical properties of RCC and experimental material, and the similarity conditions for hydroelastic simulation are analyzed and summarized. In a further section, the hydroelastic simulation schemes for the cold joint and ordinary interface in RCC are presented based on experimental research and numerical calculation. In the penultimate section, the integral model for RCCD is established, and its rationality is verified by comparing the calculation results of the proposed theoretical method and numerical simulation. A conclusion is given in the final section.
Similarity conditions for the simulation of RCC by MAHDR
Physical and mechanical properties for RCC
Thicknesses of RCCL and PIL
To make the concrete layer compacted evenly, the height of RCC increases gradually and every increment is less than 1 m so that the roller vibration will be transmitted to the bottom of the newly poured concrete. Moreover, the concrete formwork will be removed and reinstalled when the cumulative increment of RCC height reaches 2–3 m, and the interface will be generated due to the concrete pouring time delay induced by the removal and reinstallation of concrete formwork. Generally, one in every four to six interfaces is cold joint, which means that the thickness of RCCL ranges from 8 to 18 m.25,26
In order to reasonably identify the thickness of CJEZ in RCC, the general interface treatment in practical engineering is studied and divided into four steps: (1) rough grind the RCCL surface so that the surface roughnesses for the concrete and its aggregate both ranges from 0.5 cm to 1.0 cm; (2) 1.5–2.0 cm thick cement mortar layer with higher strength than the concrete should be paved on the aforementioned rough grinded RCCL surface; (3) rough grind and then flush the surface of the cement mortar layer; and (4) pave a 5 cm thick concrete on the surface of the aforementioned rough grinded and flushed cement mortar layer and then a concrete cushion is generated. According to the above treatment process in engineering practice, the thickness of CJEZ is approximately 10 cm.
Cohesion of RCCL and CJEZ
According to the detailed research of Sun, 27 the cohesion strength for the internal concrete of RCCL is approximately 1.6 MPa, but the cohesion strength of the untreated cold joint is only about 0.8 MPa which is reduced by 50%. Furthermore, the cohesion of the cold joint can reach 1.25 MPa if the cement mortar is used to reinforce the connection between adjacent layers. It is noted that significant adverse effects of these CJEZs on the strength of dam body can be generated when the improper handling is performed on the cold joint between adjacent RCCLs. It is approximately considered that the ordinary interfaces have no influences on the structural static and dynamic characteristics of RCC.
Elastic moduli of RCCL and CJEZ
For the concrete in RCCL, the elastic moduli as well as Poisson ratios in parallel and perpendicular directions to the interface are approximately equal to each other. Therefore, the internal concrete of RCCLs can be regarded as isotropic material. According to engineering experience, the static and dynamic elastic moduli of the fully-graded RCC with C30 strength grading are 30 GPa and 33 GPa, respectively.
For the concrete in CJEZ, Zhang
28
suggested that the elastic modulus E0 can be estimated by the following formula
Equation (1) is presented by the researchers in China Academy of Building Research based on numerous concrete prism tests using the prescribed method in standard DL/T5433-2009. 29 Therefore, the elastic modulus of CJEZ can be calculated according to equation (1), and is approximately equal to 2.60 GPa if the elastic modulus of concrete in RCCL is 30 GPa.
Interface failure of CJEZ
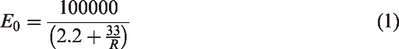
Generally, the strength of CJEZ is lower than that of internal concrete of RCCL so that the CJEZ is more vulnerable than the RCCL. It is noted that the interface failure is not the inverse process of the interface generation and the original surfaces are almost impossible to be completely restored when the interface is cracked. As shown in Figure 2, the intact CJEZ in RCC and the surfaces of cracked CJEZ are illustrated, and it can be seen that the surfaces of the cracked CJEZ are obviously different from the original surfaces of adjacent RCCLs before gluing, which should be considered in the hydroelastic simulation.
Intact CJEZ in RCC and the surfaces of cracked CJEZ. PIL: pouring interface layer; RCC: roller compacted concrete.
Physical and mechanical properties for MAHDR
In order to employ rubber material to simulate RCC, the characteristics of the adhesion between surfaces of adjacent rubber layers should be analyzed in advance. According to molecular penetration theory, 30 some long molecular chains on the rubber surface will pass through the opposite surface if the two rubber surfaces are close enough. Then, the two surfaces disappear and an interface is generated so that these adjacent rubber layers integrate into a whole. 30 It is noted that the interface between two adjacent rubber layers is not a geometric plane but a 3 D transition region, and the physical and mechanical properties in this rubber interface region (RIR) change continuously. In this situation, the interface failure for hydroelastic model is not the inverse process of the interface generation and the original surfaces are almost impossible to be completely restored when the rubber interface is cracked. Therefore, the rough failure surfaces of RIR are generated and the cracking failures for the CJEZ and RIR are similar to each other. According to experimental experience, some adhesive material may prevent the molecular diffusion between the contacting surfaces of adjacent rubber layers. In this situation, the very smooth RIR fracture surfaces are generated, which are known beforehand and almost identical to the original rubber surface before gluing. Obviously, this failure mode of RIR is not in conformity with that of actual CJEZ. Therefore, the adhesive should be appropriately selected in the construction of hydroelastic model. Moreover, removing the oxide film on rubber surface and increasing contact area of adjacent rubber layers can effectively increase the cohesive strength of interface and promote the integration between adjacent rubber layers.
Similarity conditions using MAHDR to simulate RCC
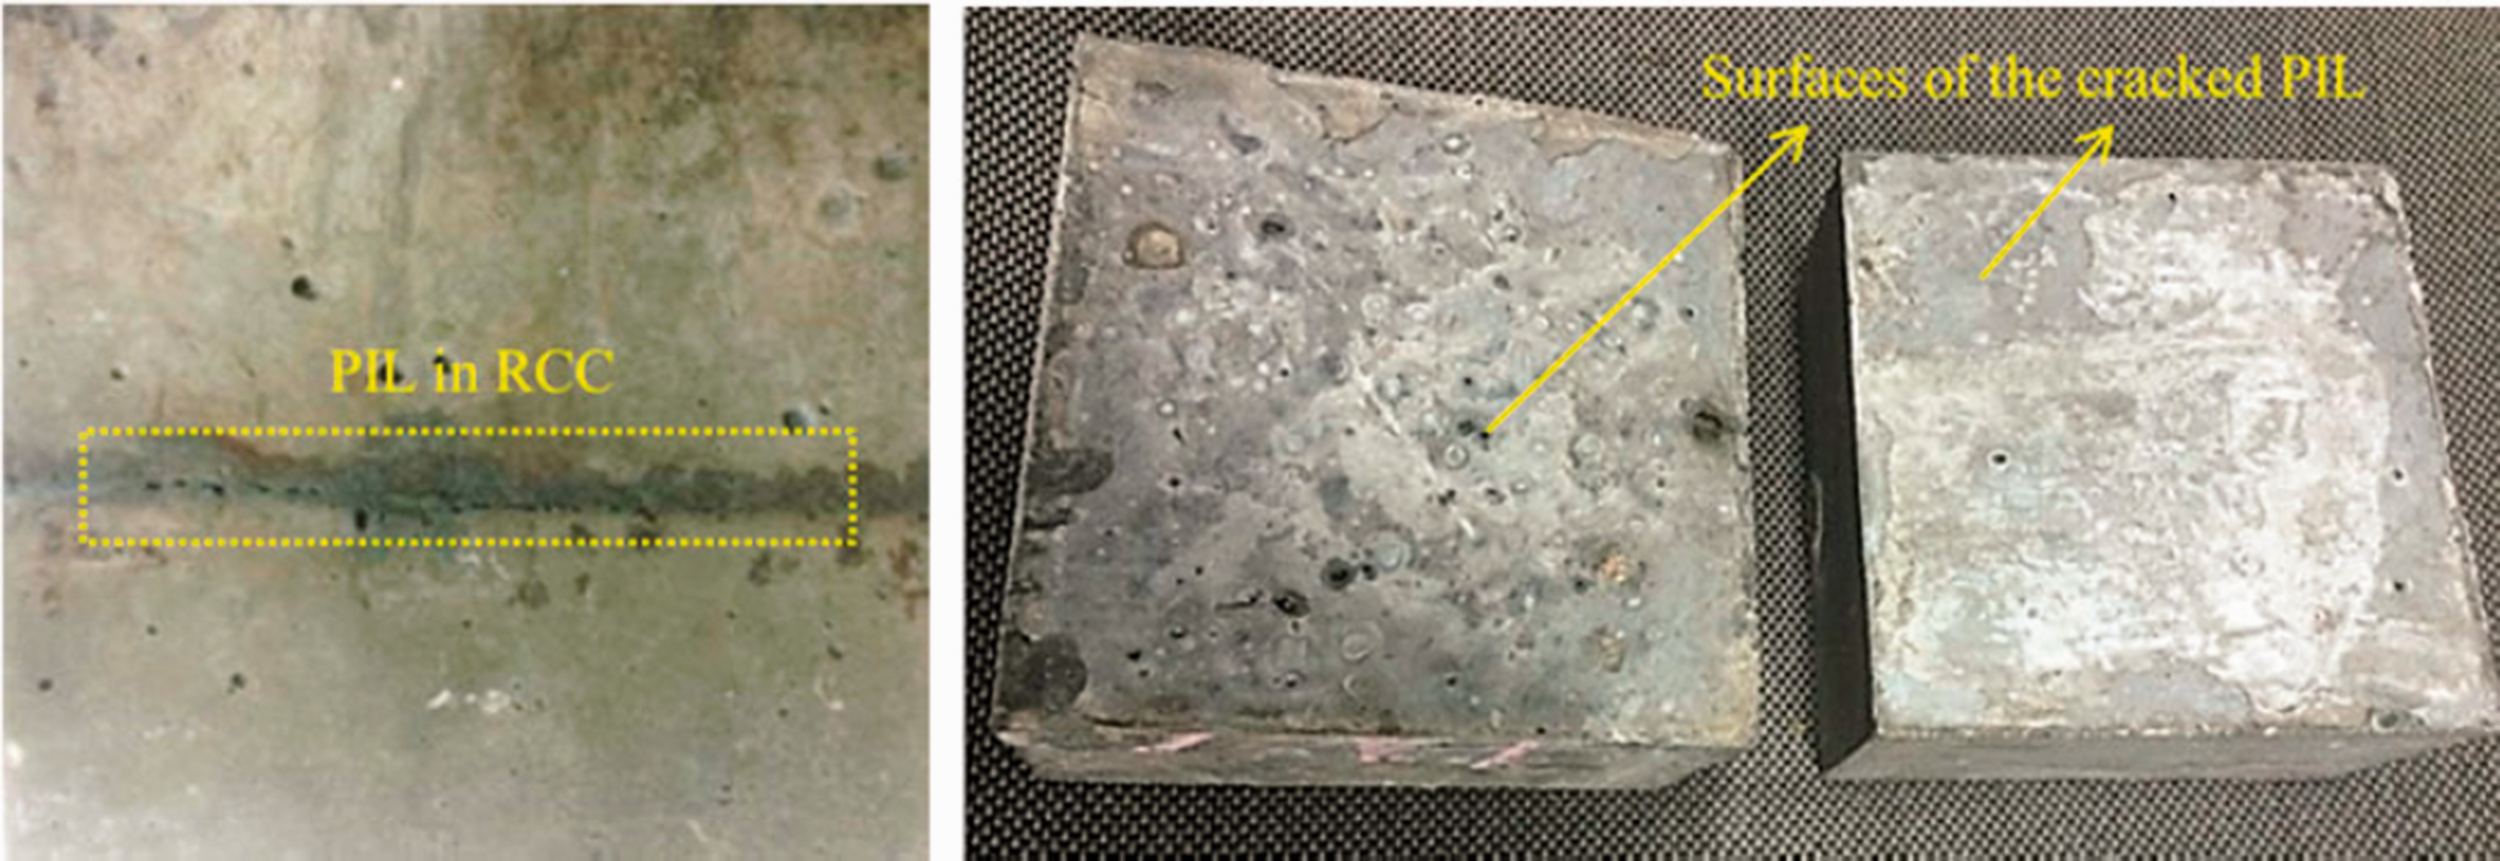
As shown in Figure 3, the comparison between RCC in prototype and multilayer agglutinated high-density rubber (MAHDR) in hydroelastic model is illustrated and some parameters are given. According to the aforementioned analysis, the simulation of RCCL and CJEZ by agglutinated rubber layer (ARL) and RIR are the two main aspects for hydroelastic simulation of RCC. The most similarity conditions can be conveniently satisfied based on the researches for conventional hydraulic model experiment and HEME techniques. The main focus of this study is to develop appropriate surface treatment methods for the ordinary interface and the interface to simulate cold joint in MAHDR. For the ordinary interface which is inevitable in the model construction due to the limited thickness of the rubber, the surface treatment aims at effectively integrating the adjacent rubber layers and making the dynamic characteristics of the ordinary rubber interface as close as possible to those of the internal rubber in rubber layer. Therefore, the effects of the ordinary rubber interface on the structural vibration mode and vibration propagation can be eliminated and the integral concrete can be reasonably simulated. For the interface to simulate cold joint, the thickness, elastic modulus and cracking failure mode of RIR should be similar to the actual CJEZ in RCC based on the aforementioned analysis.
Comparison between RCC in prototype and MAHDR in hydroelastic model. λL, C, T, and E denote the geometric scale, cohesion, layer height, and elastic modulus, respectively; subscripts 1 and 2 represent the RCCL (ARL) and CJEZ (RIR); parameters of MAHDR and RCC are represented by the character with and without superscript ‘, respectively. MAHDR: multilayer agglutinated high-density rubber; RCC: roller compacted concrete; CJEZ: cold joint effect zone; RCCL: roller compacted concrete layer; ARL: agglutinated rubber layer; RIR: rubber interface region.
Hydroelastic simulation for RCC
Preparation of test specimens
In order to investigate the effects of different rubber surface treatment processes on the dynamic characteristics of specimens, we manufactured five column specimens with square cross-section and the length, width and height of the column specimens are 30 mm, 30 mm, and 400 mm, respectively. In order to demonstrate the specimens and their preparation processes more clearly, the surface treatment process of these five column specimens are illustrated in Figure 4, and the photograph of these specimens are given in Figure 5.
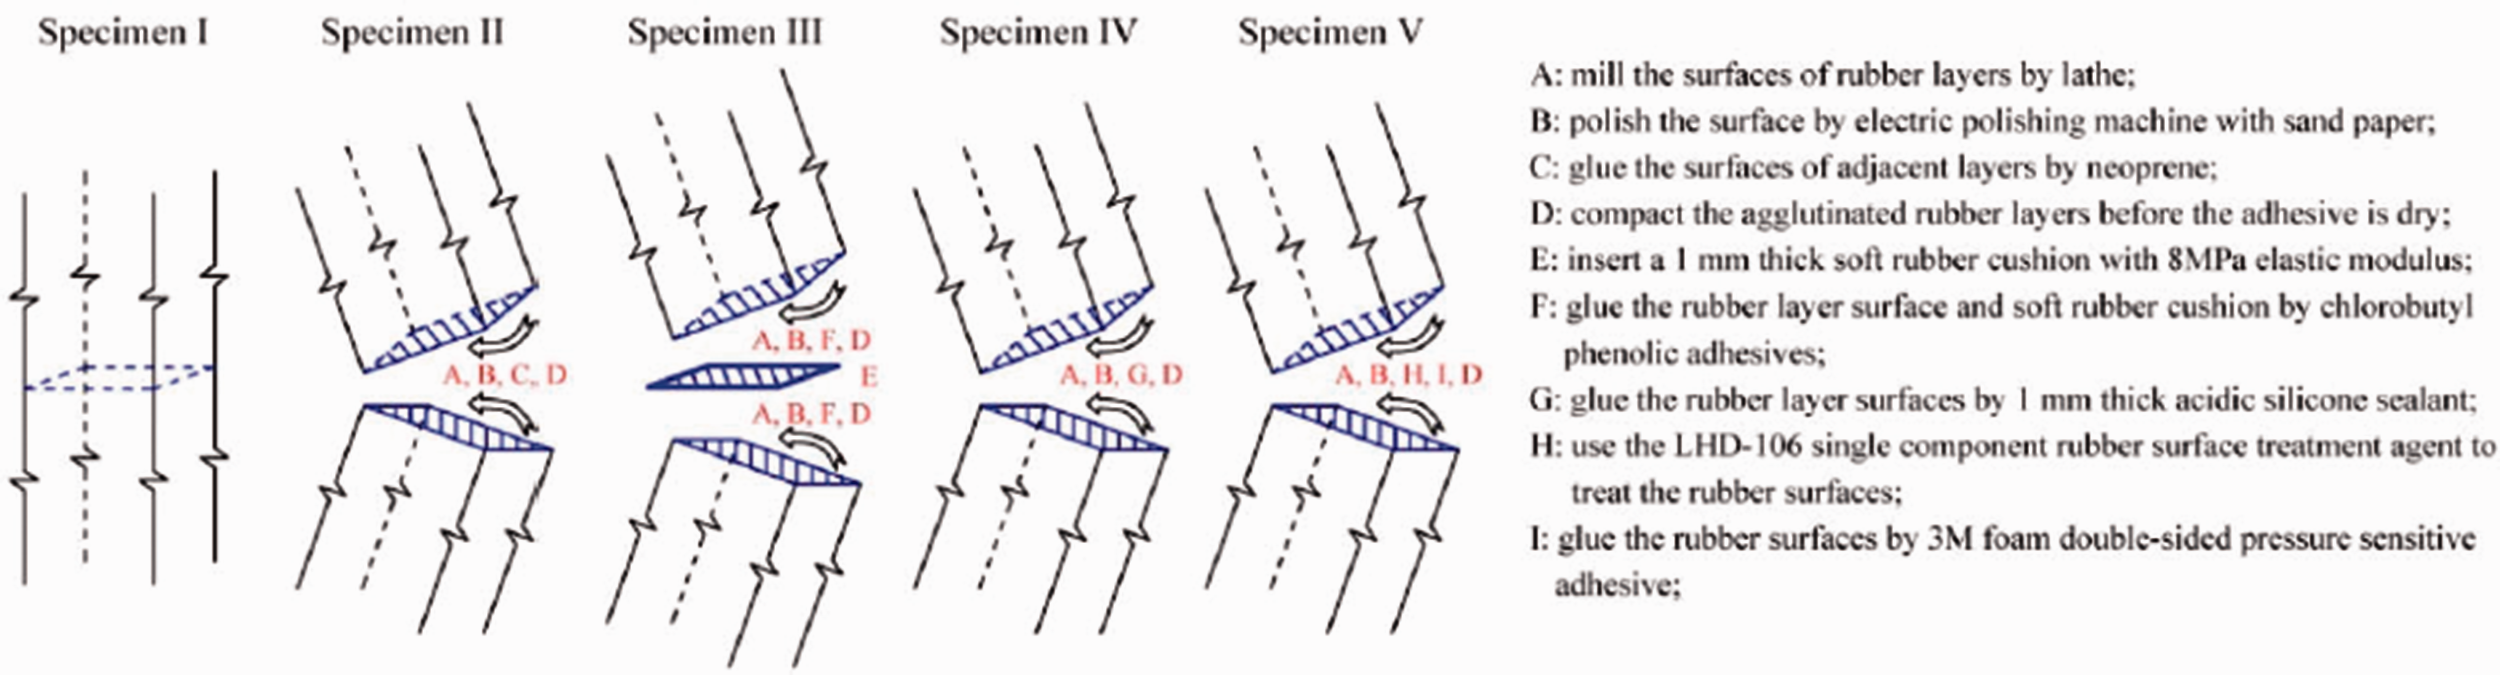
Preparation process of the test specimens.
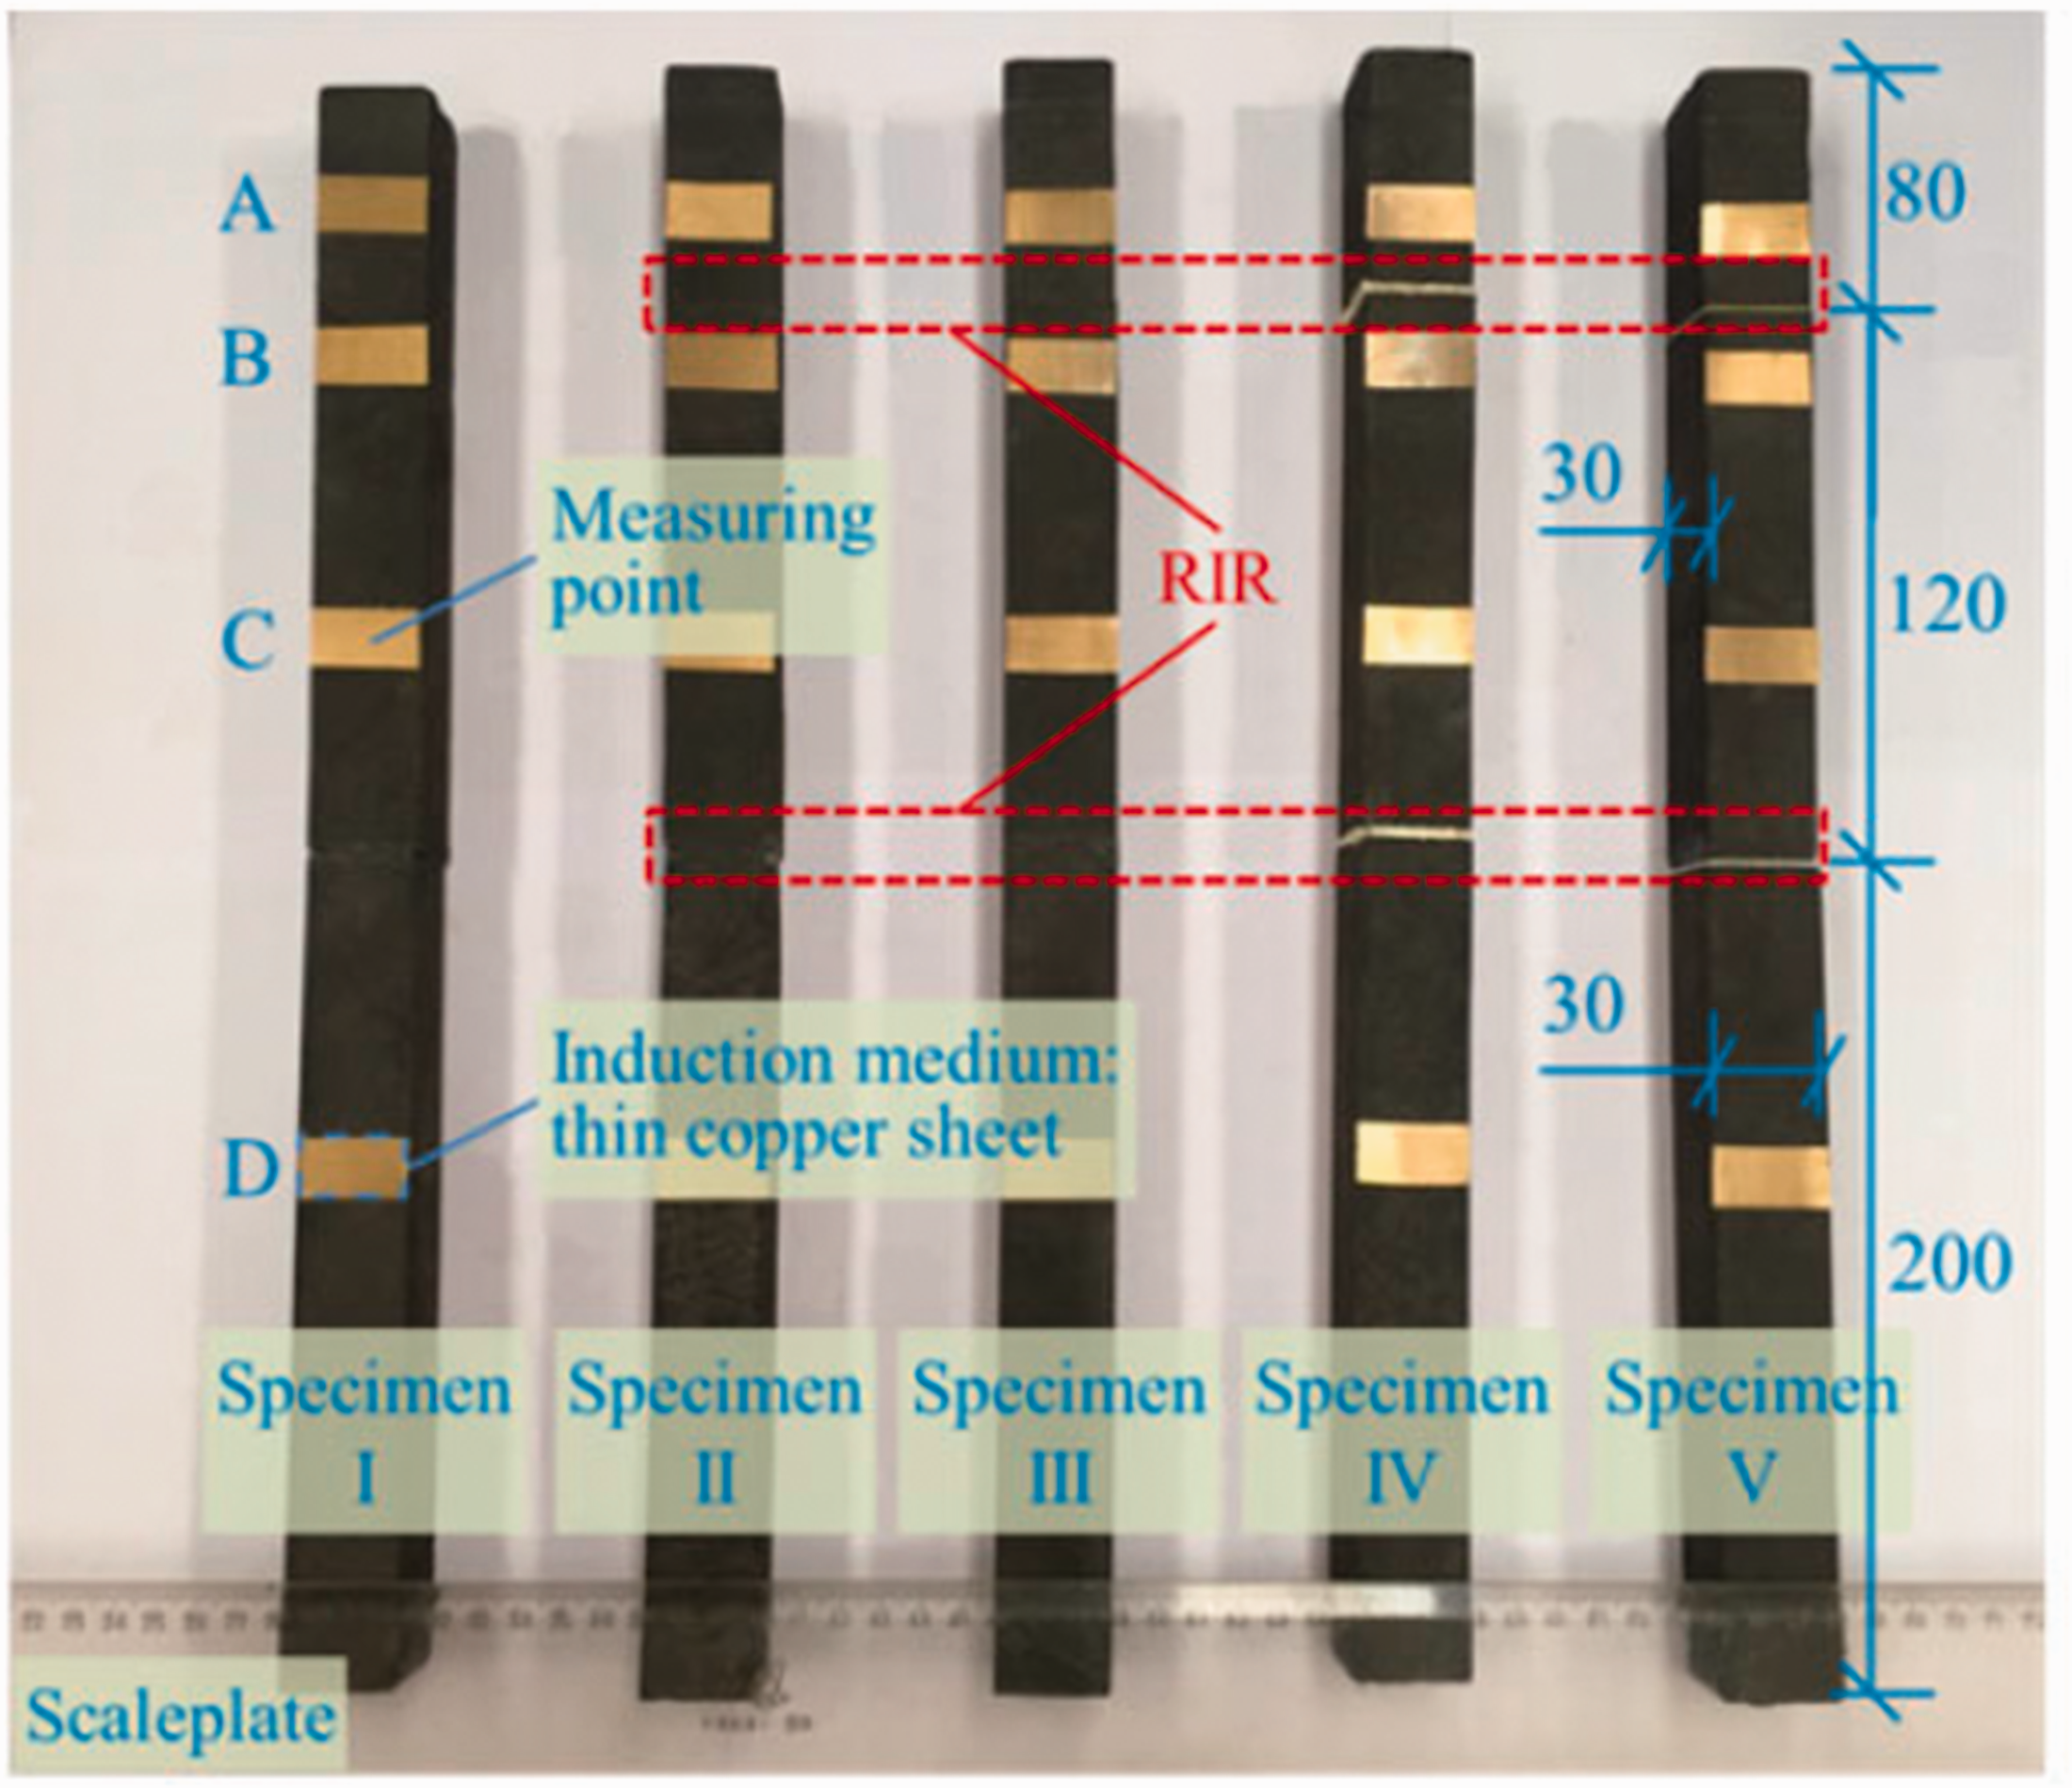
Physical dimensions and arrangement of measuring points and RIRs for Specimens I to V. RIR: rubber interface region.
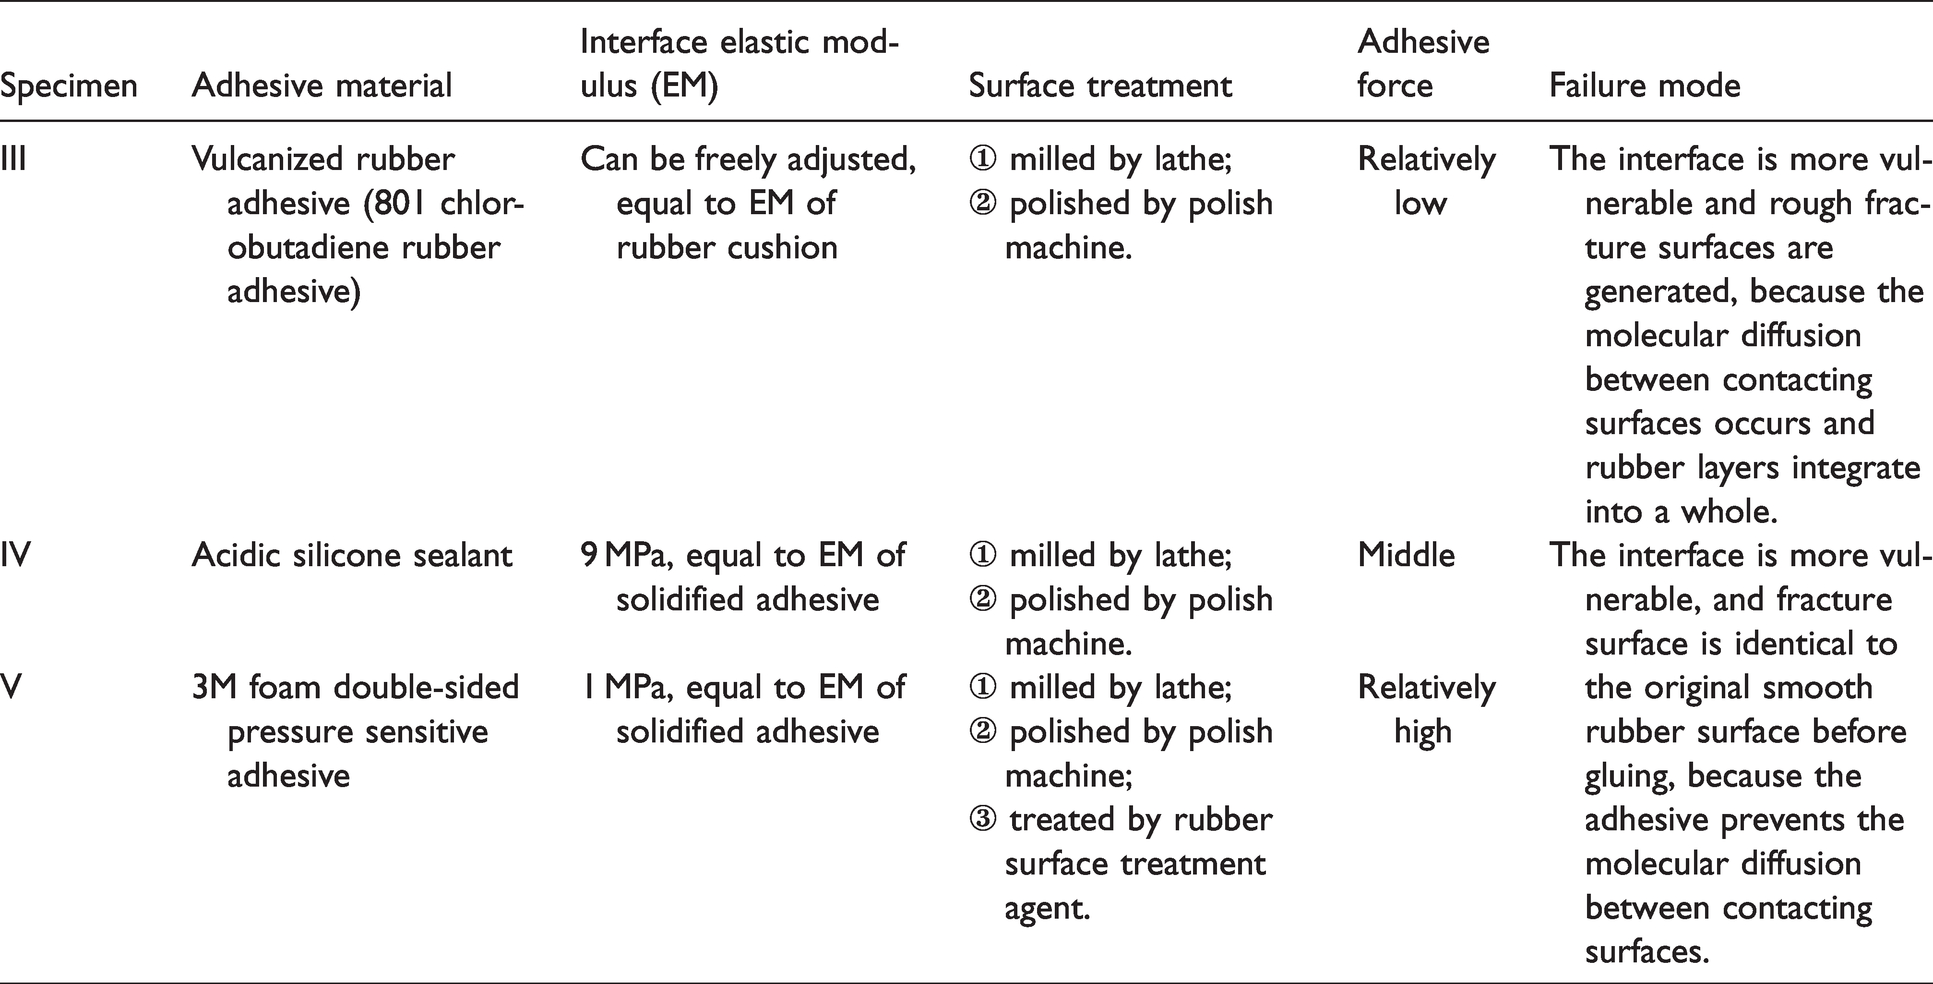
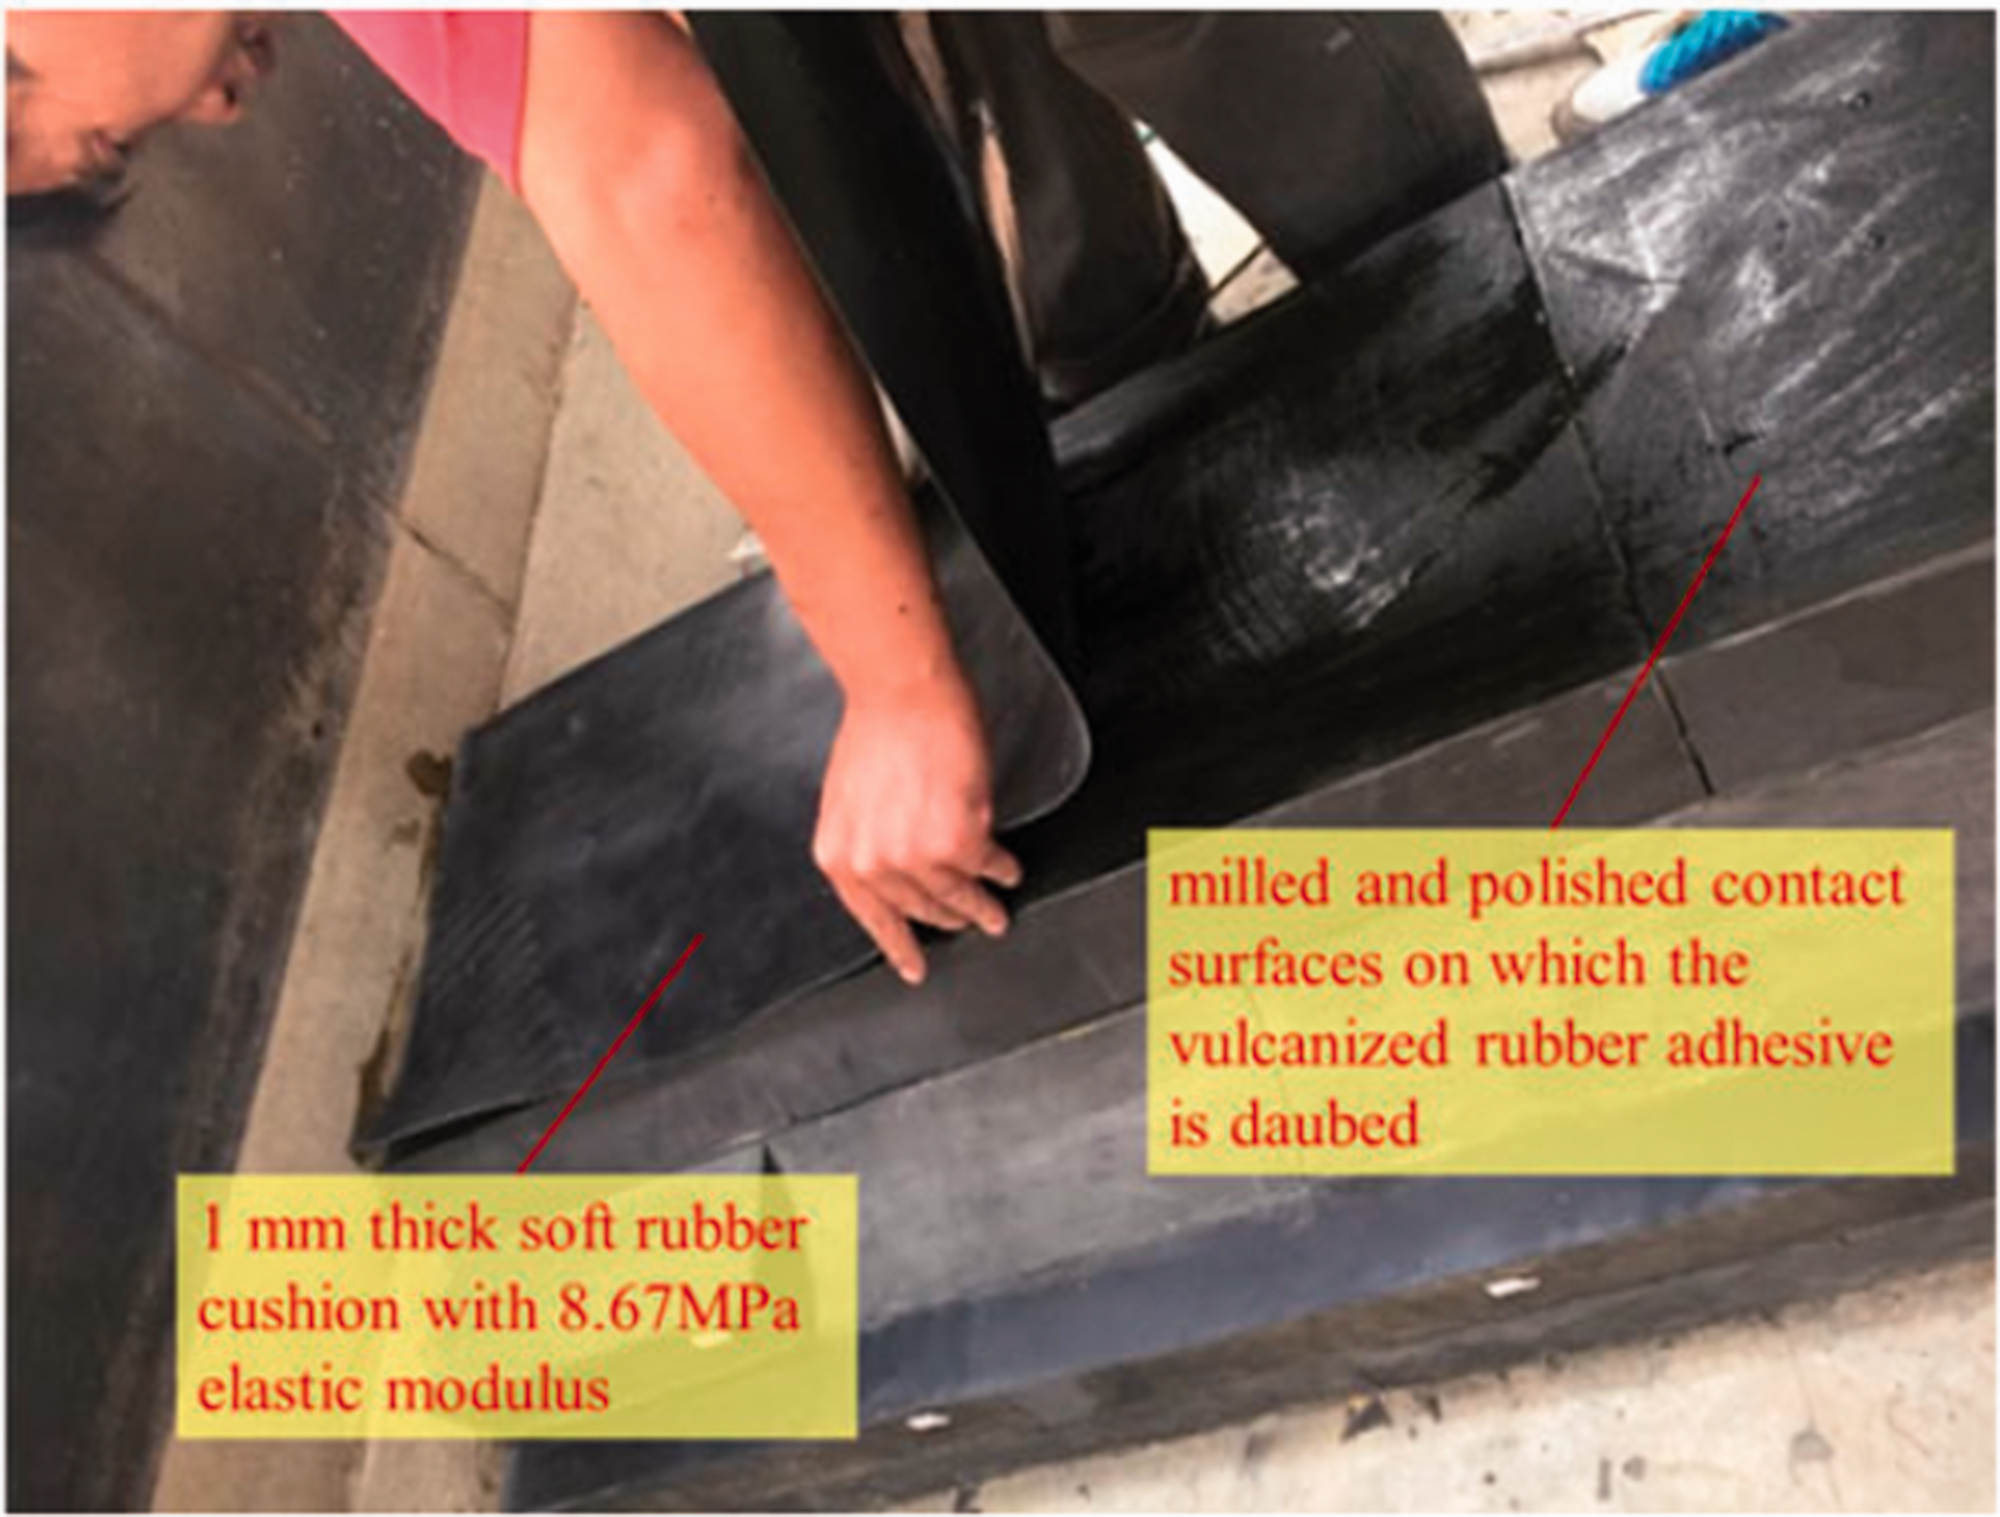
As shown in Figures 4 and 5, Specimen I is made of an integral piece of rubber without any interfaces, and two RIRs from which the distances to the ground are respectively 200 mm and 320 mm are included in other four specimens. It is known that removing the oxide film on rubber surface and increasing contact area can effectively increase the cohesive strength between the adjacent rubber layers. Therefore, the first step of construction of the specimen considering RIR is to mill the rubber and then polish the milled rubber using electric polishing machine with sand paper to generate regular and rough rubber surfaces. For Specimen II, the milled and polished contact surfaces between adjacent rubber layers are glued by neoprene. The rubber specimen should be compacted before the neoprene is dry so that the adjacent rubber layer surfaces will be tightly contacted each other and the interface cannot be identified by naked eyes. For Specimen III, a 1 mm thick soft rubber cushion with 8.67 MPa elastic modulus is inserted between the milled and polished contact surfaces of adjacent rubber layers. The vulcanized rubber adhesive (801 chlorobutadiene rubber adhesive) is used to glue the upper rubber layer, soft rubber cushion, and lower rubber layer. For Specimen IV, the milled and polished rubber surfaces are glued using 1 mm thick acidic silicone sealant. After 72 hours, the cohesion strength of the acidic silicone sealant in Specimen IV reaches its maximum which is higher than the cohesion strengths of aforementioned neoprene and chlorobutyl phenolic adhesive. For Specimen V, the milled and polished rubber surfaces are firstly treated by LHD-106 single component rubber surface treatment agent, and then glued by 3 M foam double-sided pressure sensitive adhesive. After the aforementioned treatment process, the cohesion strength between adjacent rubber layers in Specimen V is significantly increased and higher than the cohesion strengths of adhesives in Specimens II–IV.
Dynamic testing system
The specimens stand upright on the ground surface and the contact surfaces between the ground and the bottom of specimen are fixed so that these specimens can be regarded as a cantilever beam. As shown in Figure 6, the dynamic testing system is illustrated, and the photograph for the dynamic experiment is given in Figure 7.
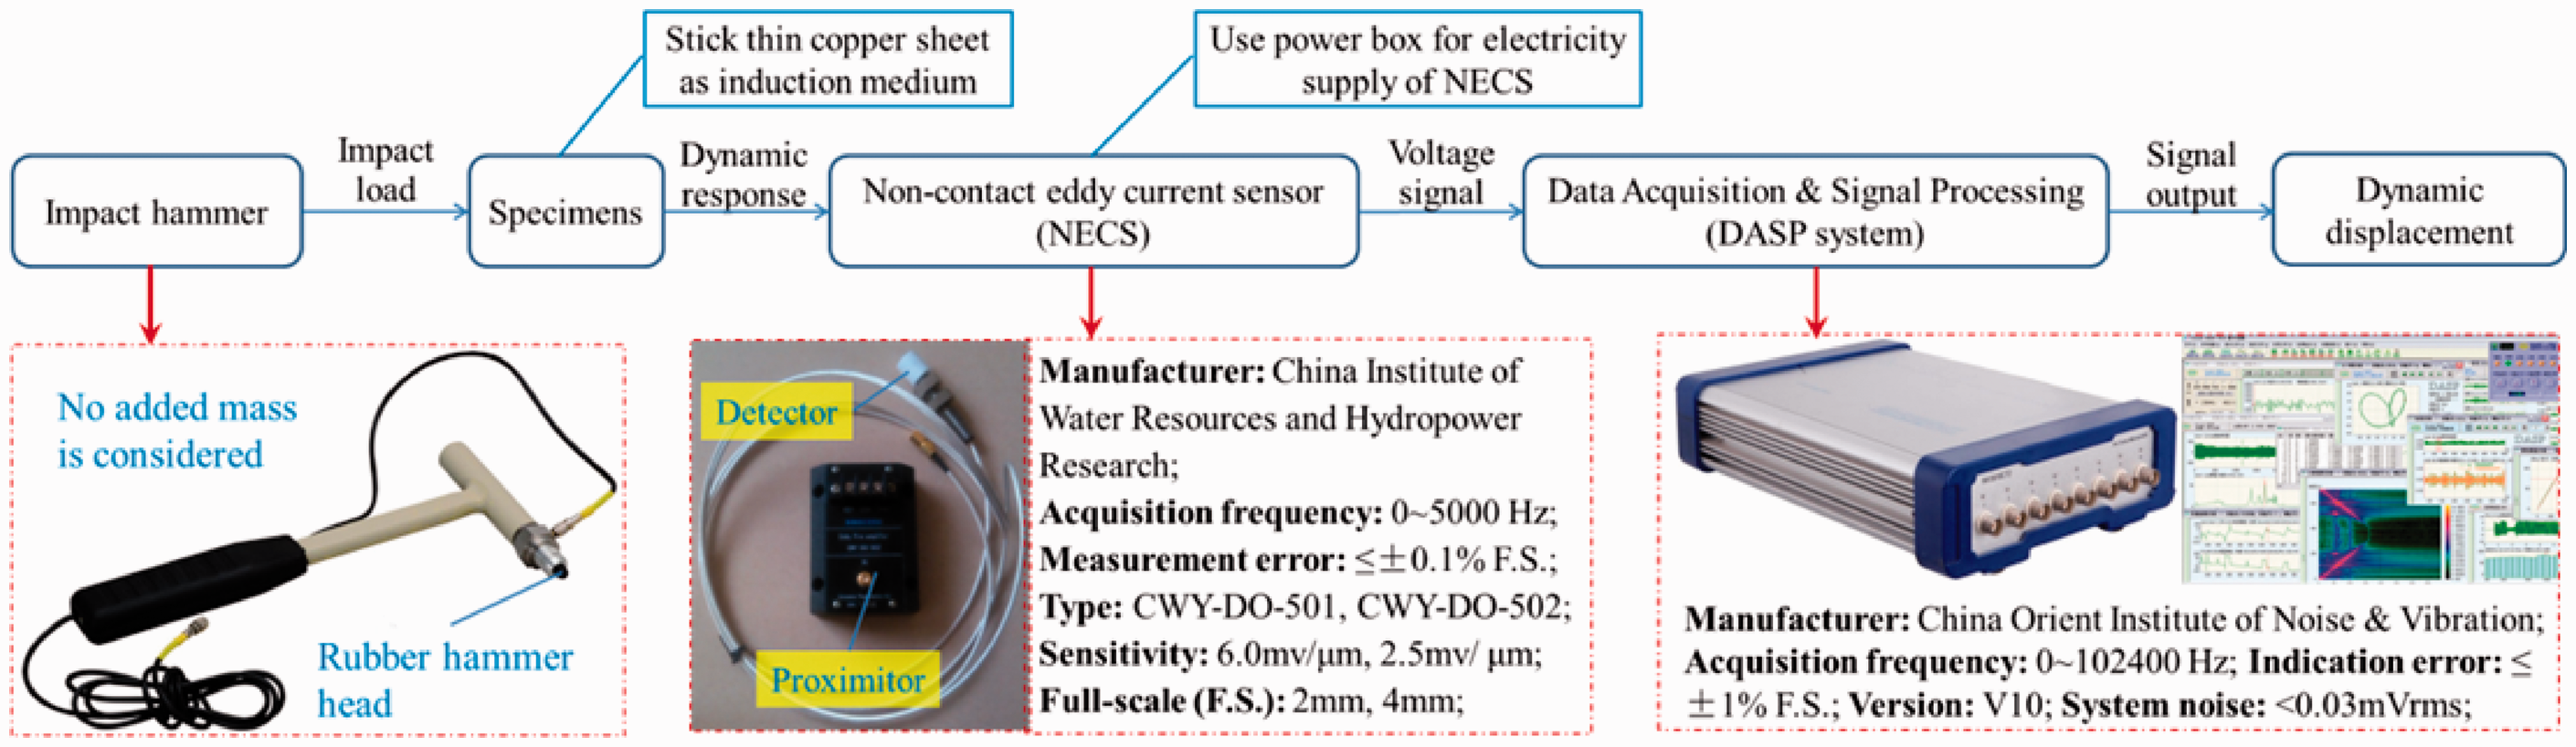
Dynamic testing system for the impulse response of specimens.
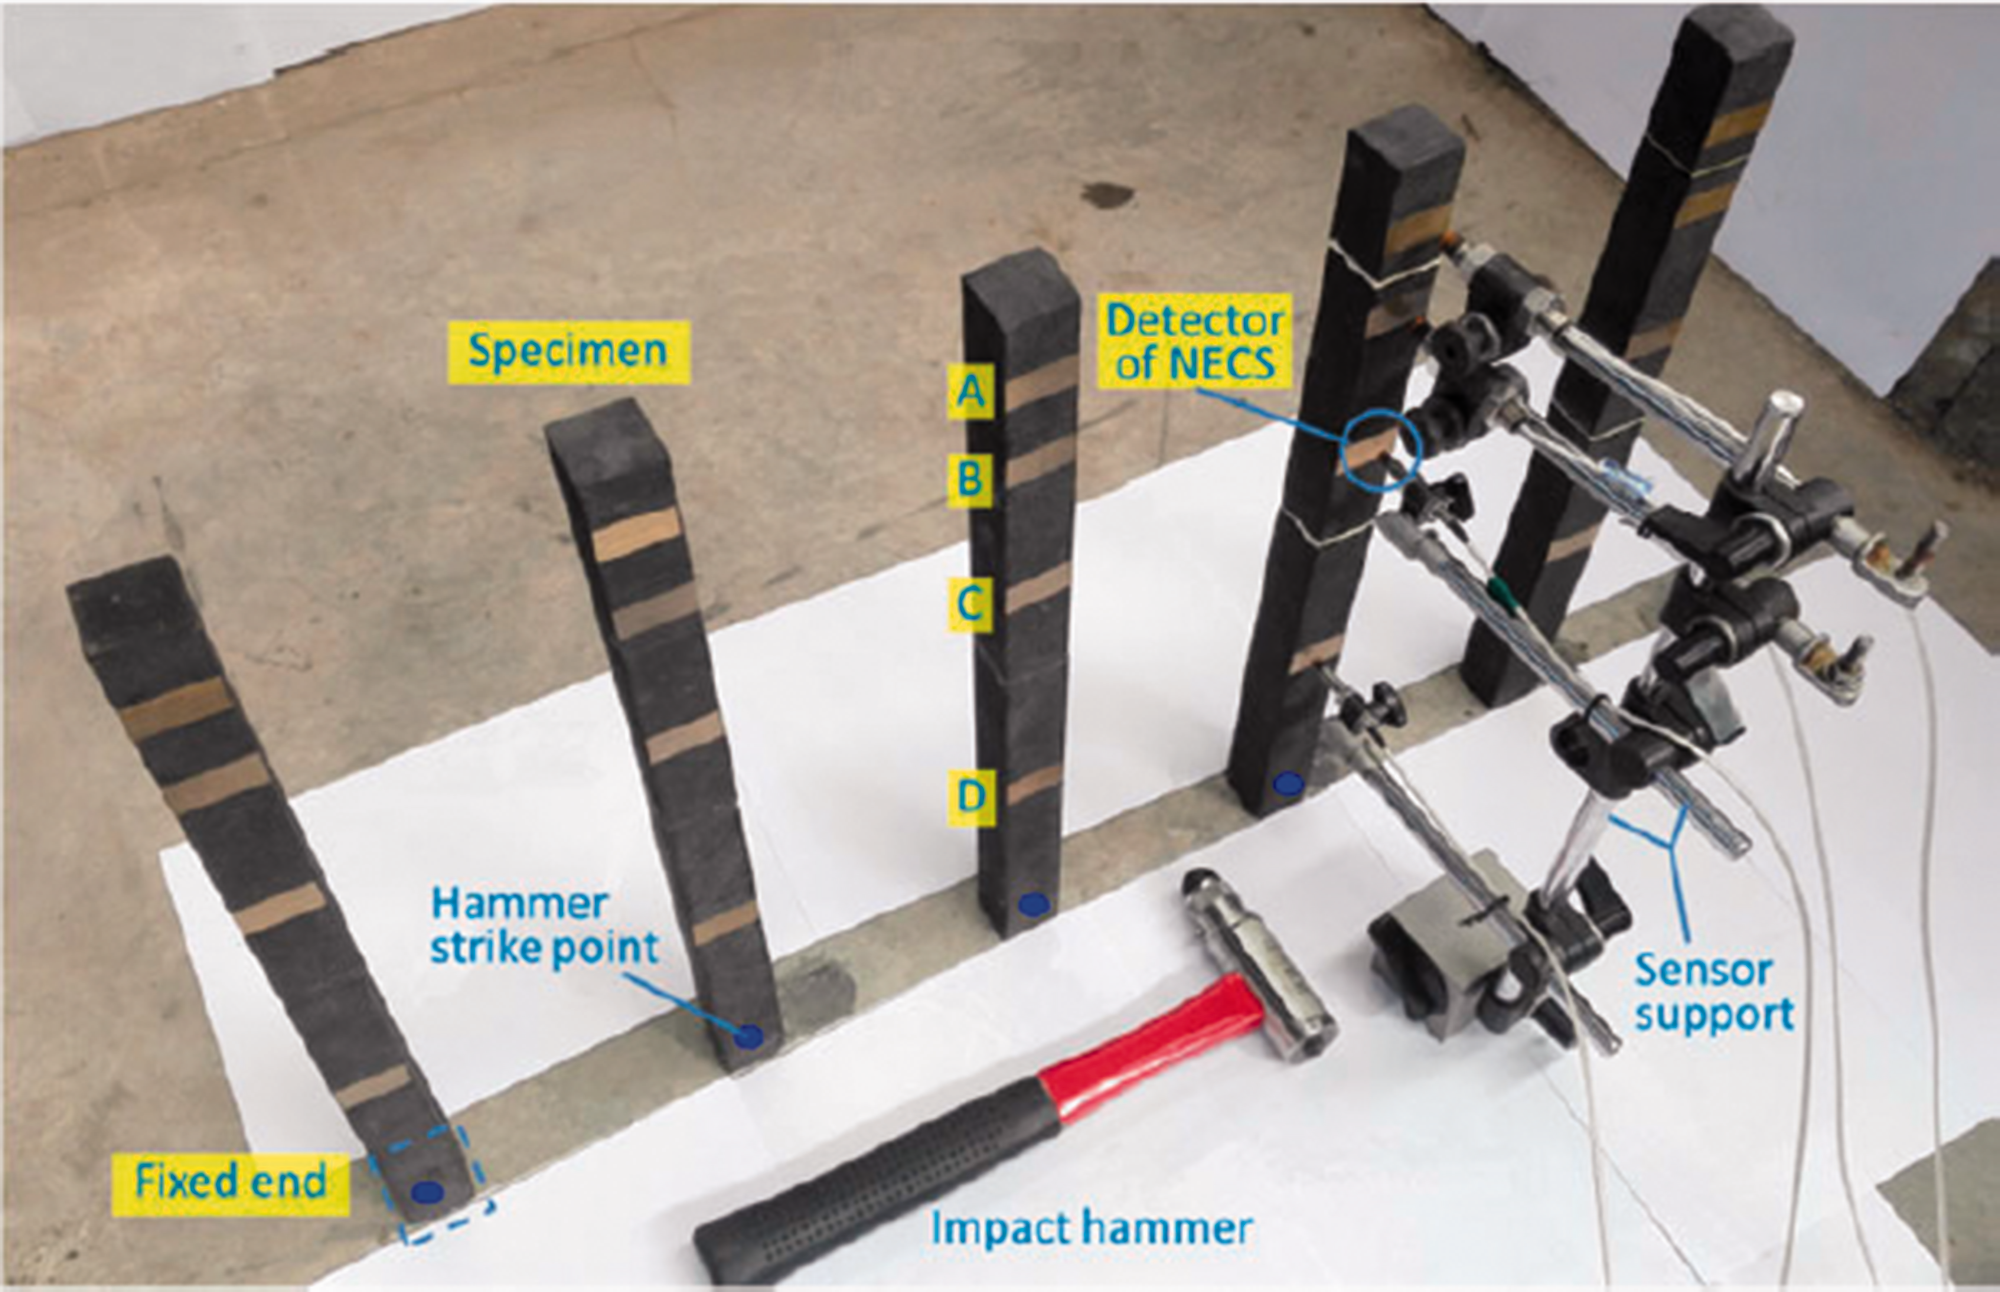
Photograph of the dynamic tests of specimens. NECS: non-contact eddy current sensor.
It is noted that non-contact eddy current sensor (NECS) is employed to obtain the dynamic displacement signals, and the sensitivity of NECS is related to the surface resistivity of test object. In the dynamic test, the thin copper sheet is employed as induction medium to insert between the rubber surface and NECS. Moreover, the sensitivity of NECSs should be calibrated using small bench vice and dial indicator.
As shown in Figure 7, measuring points A to D are arranged on the rubber specimens to investigate the effects of two RIRs on the dynamic characteristics of specimens. The manufactured specimens are fixed on the ground using cyanoacrylate glue (502 glue). According to experimental experiences, the impact hammer with rubber hammer head is chosen for the percussion in experiments. The dynamic response signals are obtained by Data Acquisition and Signal Processing (DASP), and the sampling frequency and time are 200 Hz and 10 s, respectively. Each group consisted of 10 samples.
Dynamic characteristic analysis for specimens based on FRF
In this section, the vibration propagation properties in frequency domain of the specimens subjected to external excitations is described by frequency response function (FRF), 31 which is a nonparametric estimation model for dynamic system characteristics. As measuring points A and B are arranged on the two sides of RIR, the FRFs between points A and B are given in Figure 8 to detailedly analyze the effect of RIR on the specimen dynamic characteristics. Firstly, the complex spectral density functions for the vibration displacement histories of measuring points A and B are calculated by Fourier Transform. Then, the FRF between the responses of points A and B can be obtained by dividing the dynamic displacement power spectral density function of point A by that of point B. It is noted that FRF is complex so that the amplitude and phase information can be conveniently extracted from the complex FRF. As shown in Figure 8, the amplitude-frequency and phase-frequency functions between the displacement histories of measuring points A and B for different specimens are drawn in log-log coordinates.
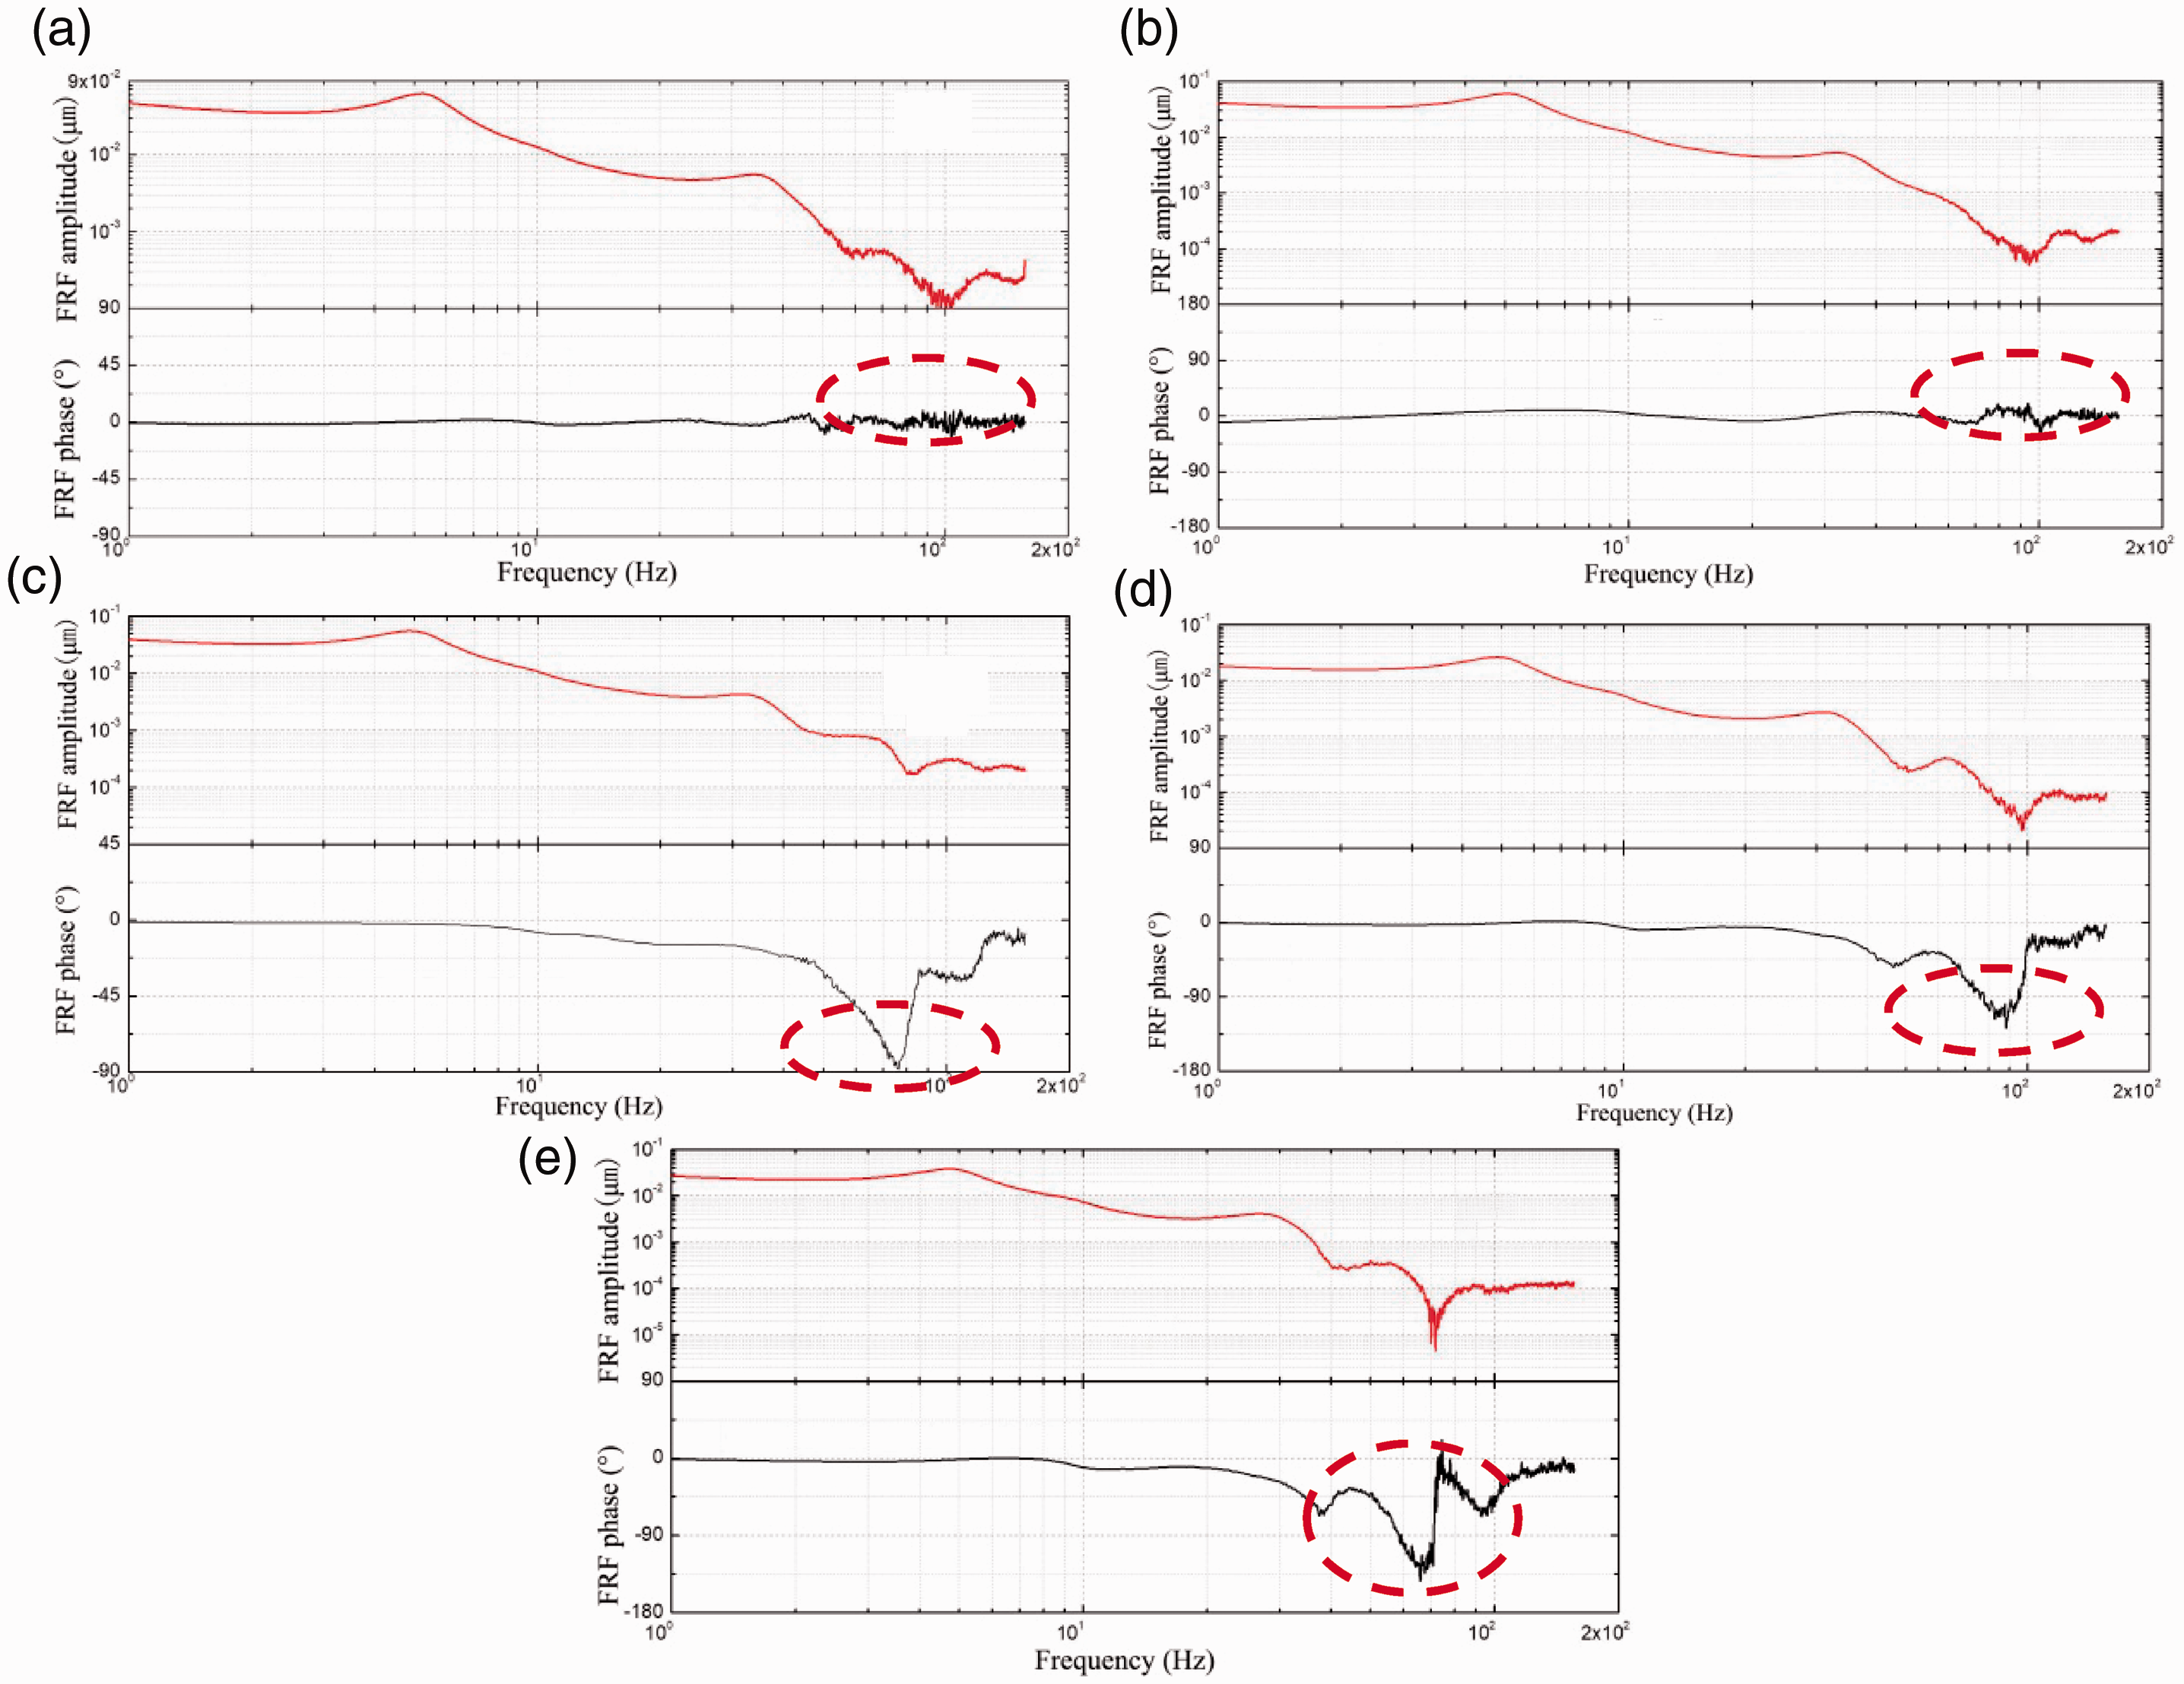
Amplitude-frequency and phase-frequency functions between the dynamic responses of measuring points A and B. (a) Specimen I; (b) Specimen II; (c) Specimen III; (d) Specimen IV; and (e) Specimen V. FRF: frequency response function.
It is obviously identified that the dynamic characteristics of Specimens I and II are very close to each other and the dynamic characteristics of Specimens III, IV, and V are similar. Moreover, a phase ripple is observed on the curves of phase-frequency functions between measuring points A and B for Specimens III, IV, and V, which is considered to be caused by the RIR. The similar conclusions can be drawn based on the amplitude-frequency and phase-frequency functions between vibration responses of other measuring points. It is implied that the interface in Specimen II can effectively integrate the adjacent rubber layers and almost has no influence on the dynamic characteristics of rubber structure. Therefore, the preliminary conclusion can be drawn that the inevitable ordinary interface in MAHDR, as shown in Figure 3, should be simulated by the rubber interface proposed in Specimen II and thus the RCCL can be rationally simulated by ARL. Furthermore, the cold joint in RCC can be approximately simulated by the rubber interfaces proposed in Specimens III, IV and V, so that the dynamic properties of CJEZ and RIR are similar.
In order to further analyze the rationality for the simulation of CJEZ in RCC by RIR in hydroelastic model, the physical and mechanical properties of the rubber interfaces in Specimens III, IV, and V are investigated. By comprehensively analyzing the properties listed in Table 1, it is considered that the RIR in Specimen III can simulate the CJEZ in RCC more reasonably and appropriately than the RIRs in Specimens IV and V.
Comparison of the physical and mechanical properties of Specimens III to V.
Numerical verification
As shown in Figure 9, two numerical models are established based on finite element technique to validate the similarity between vibration modes of the test specimens and actual RCC. Numerical model I is established to simulate the integral rubber specimen without considering RIR. The physical dimension, elastic modulus, and constraint conditions of numerical models are the same as those of test specimens, and the damping ratio of numerical model is 0.15. Numerical model II includes the RIRs of which the locations are the same as the RIR locations of Specimens III, IV, and V.
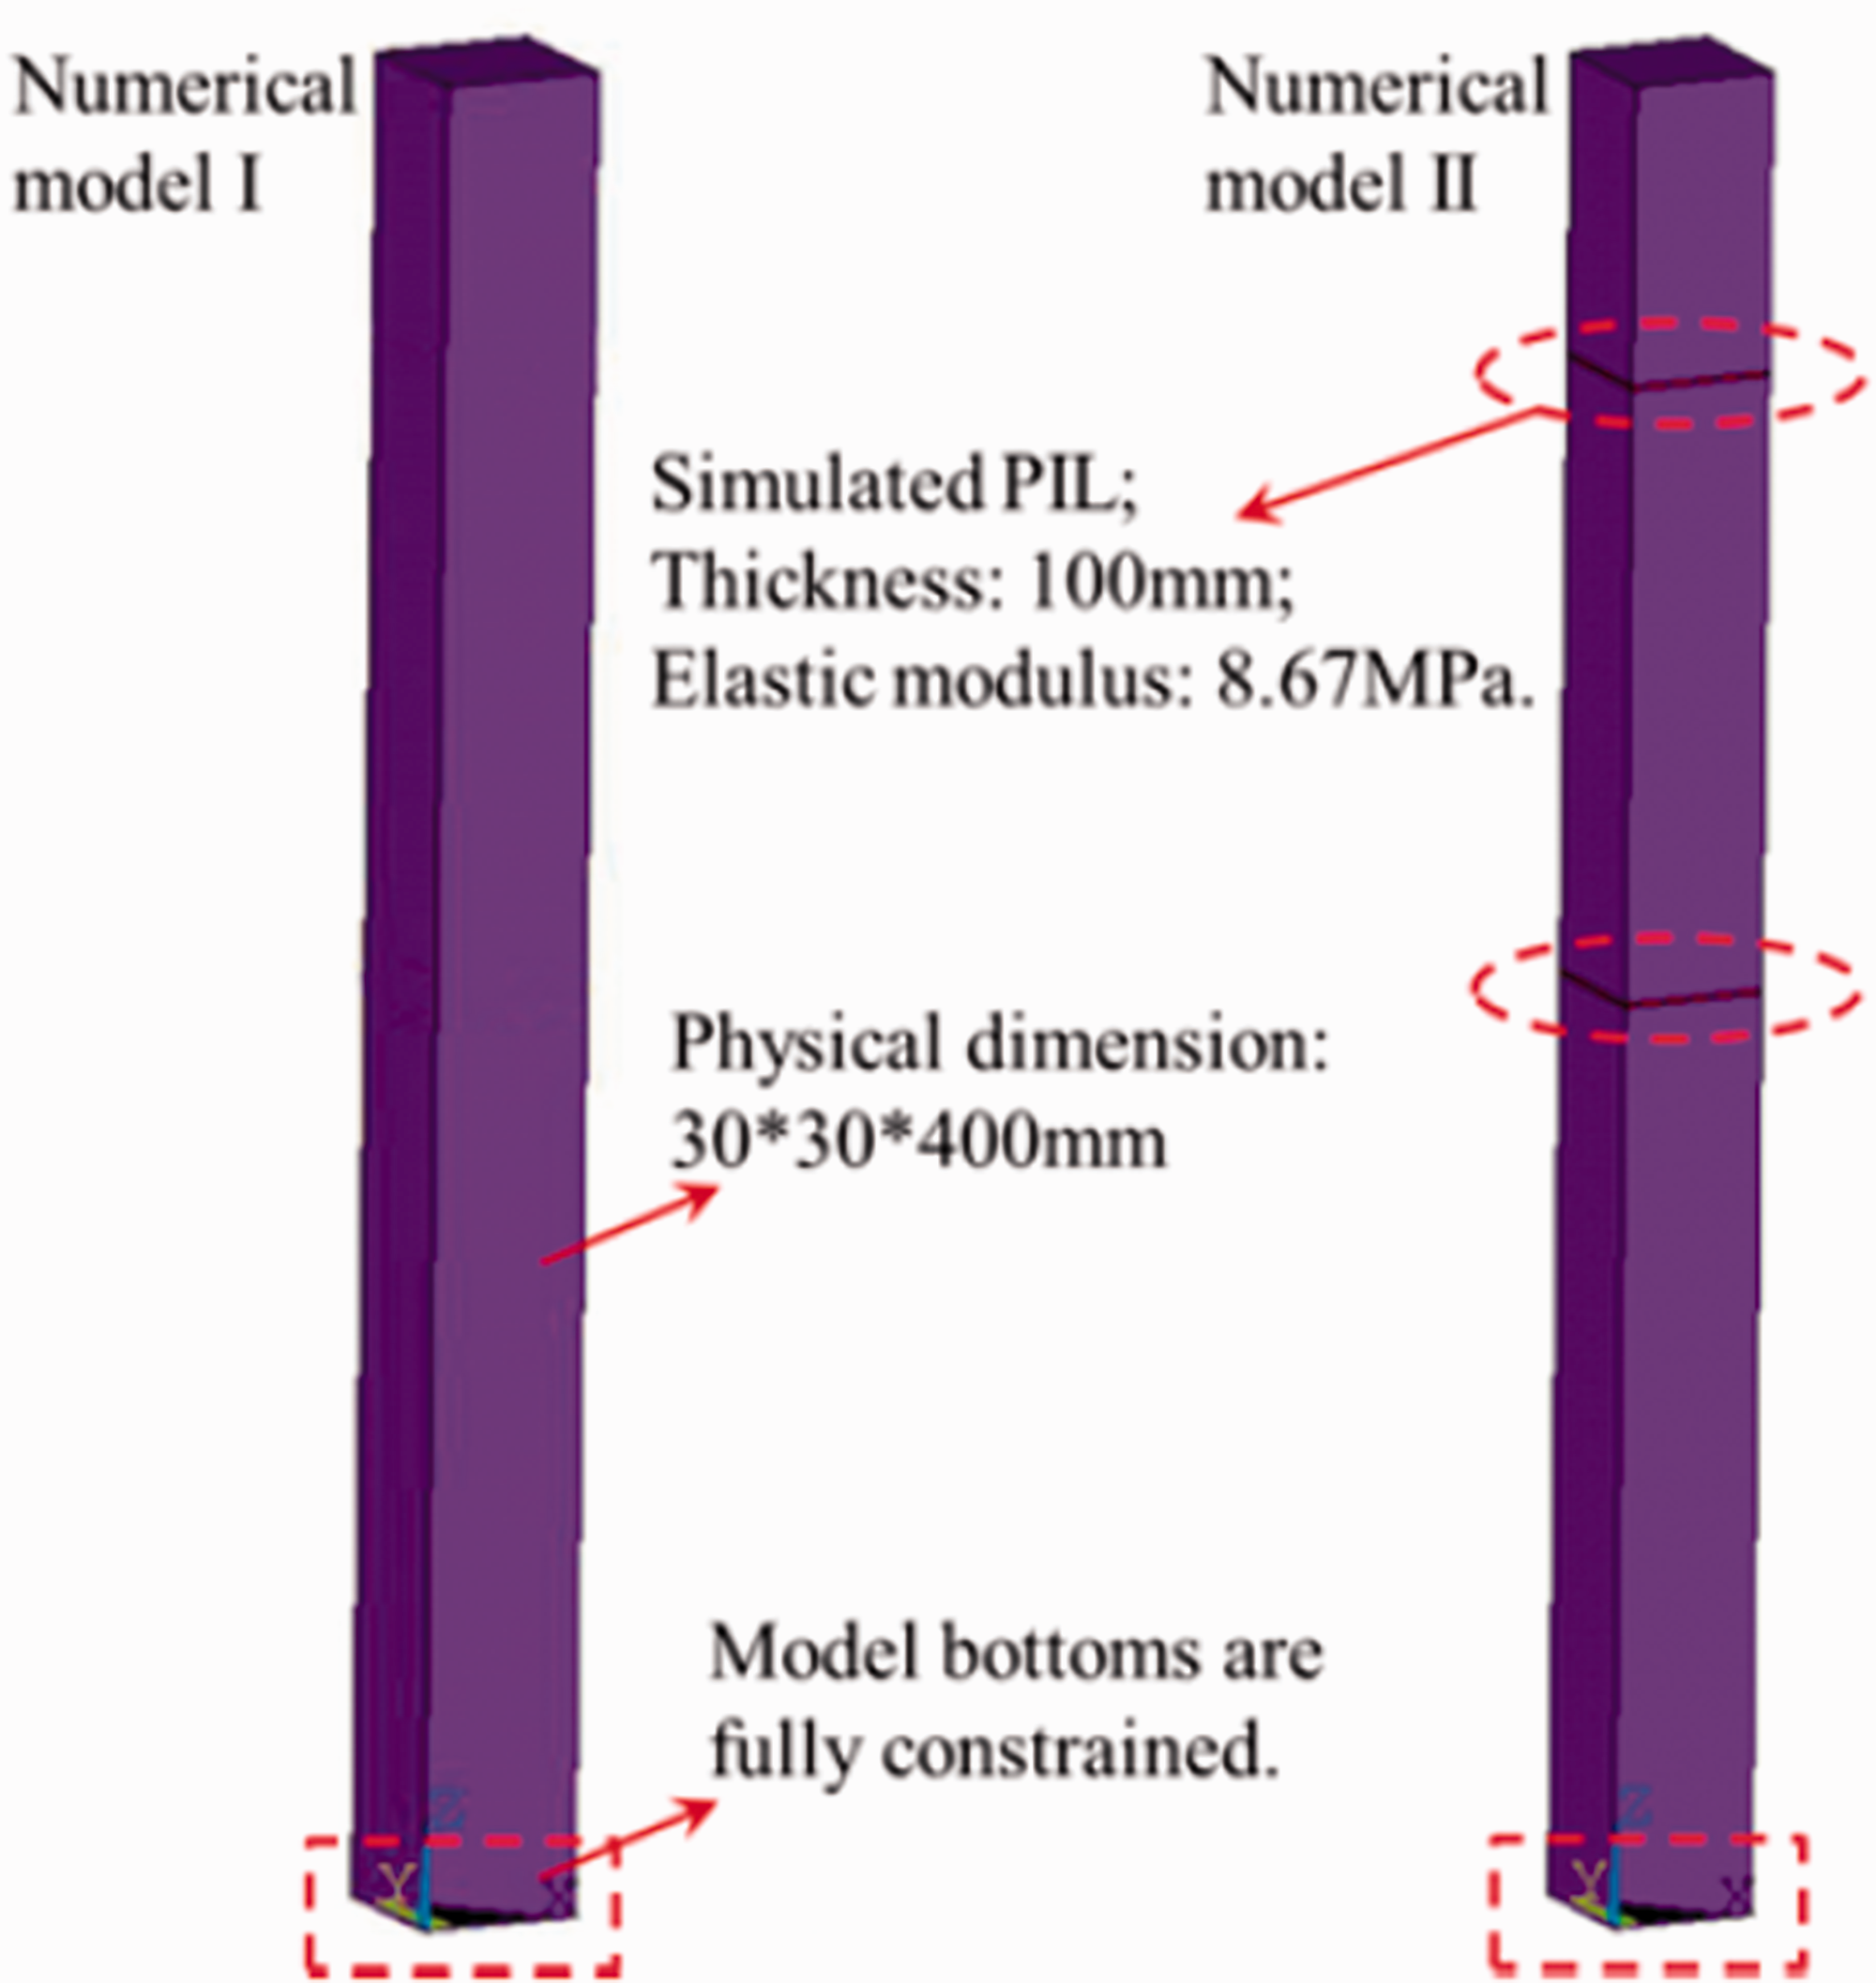
Numerical models for RCC. PIL: pouring interface layer.
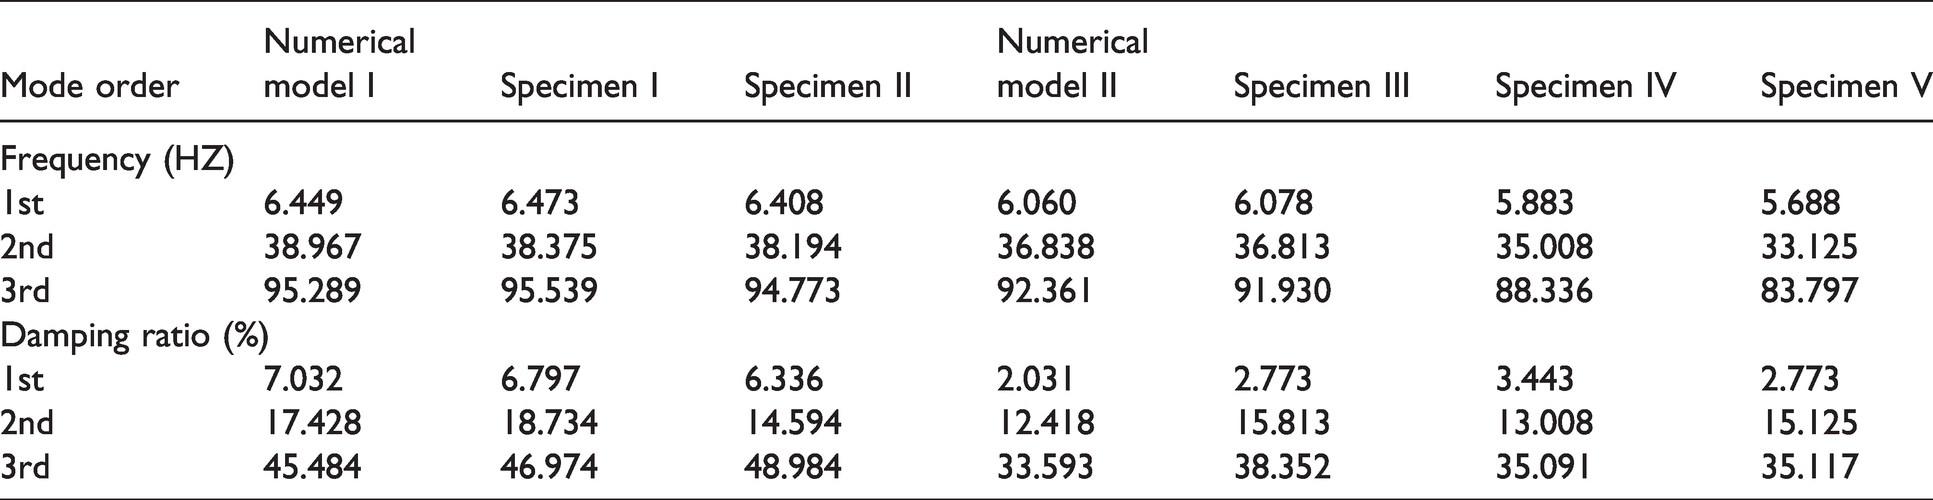
In order to investigate the similarity between the dynamic characteristics of the numerical model and test specimen, the modal analyses for the numerical models are carried out and the modal parameters of the specimens are calculated by applying the modal analysis module of the DASP system. It is noted that system-provided modal analysis module in DASP is developed on the basis of the conventional ERA method. 32 The natural frequencies and damping ratios of the test specimens and numerical models are listed in Table 2, and the normalized mode shapes of specimens and models are given in Figure 10.
Comparison of the structural mode parameters obtained by model experiments and numerical calculations.
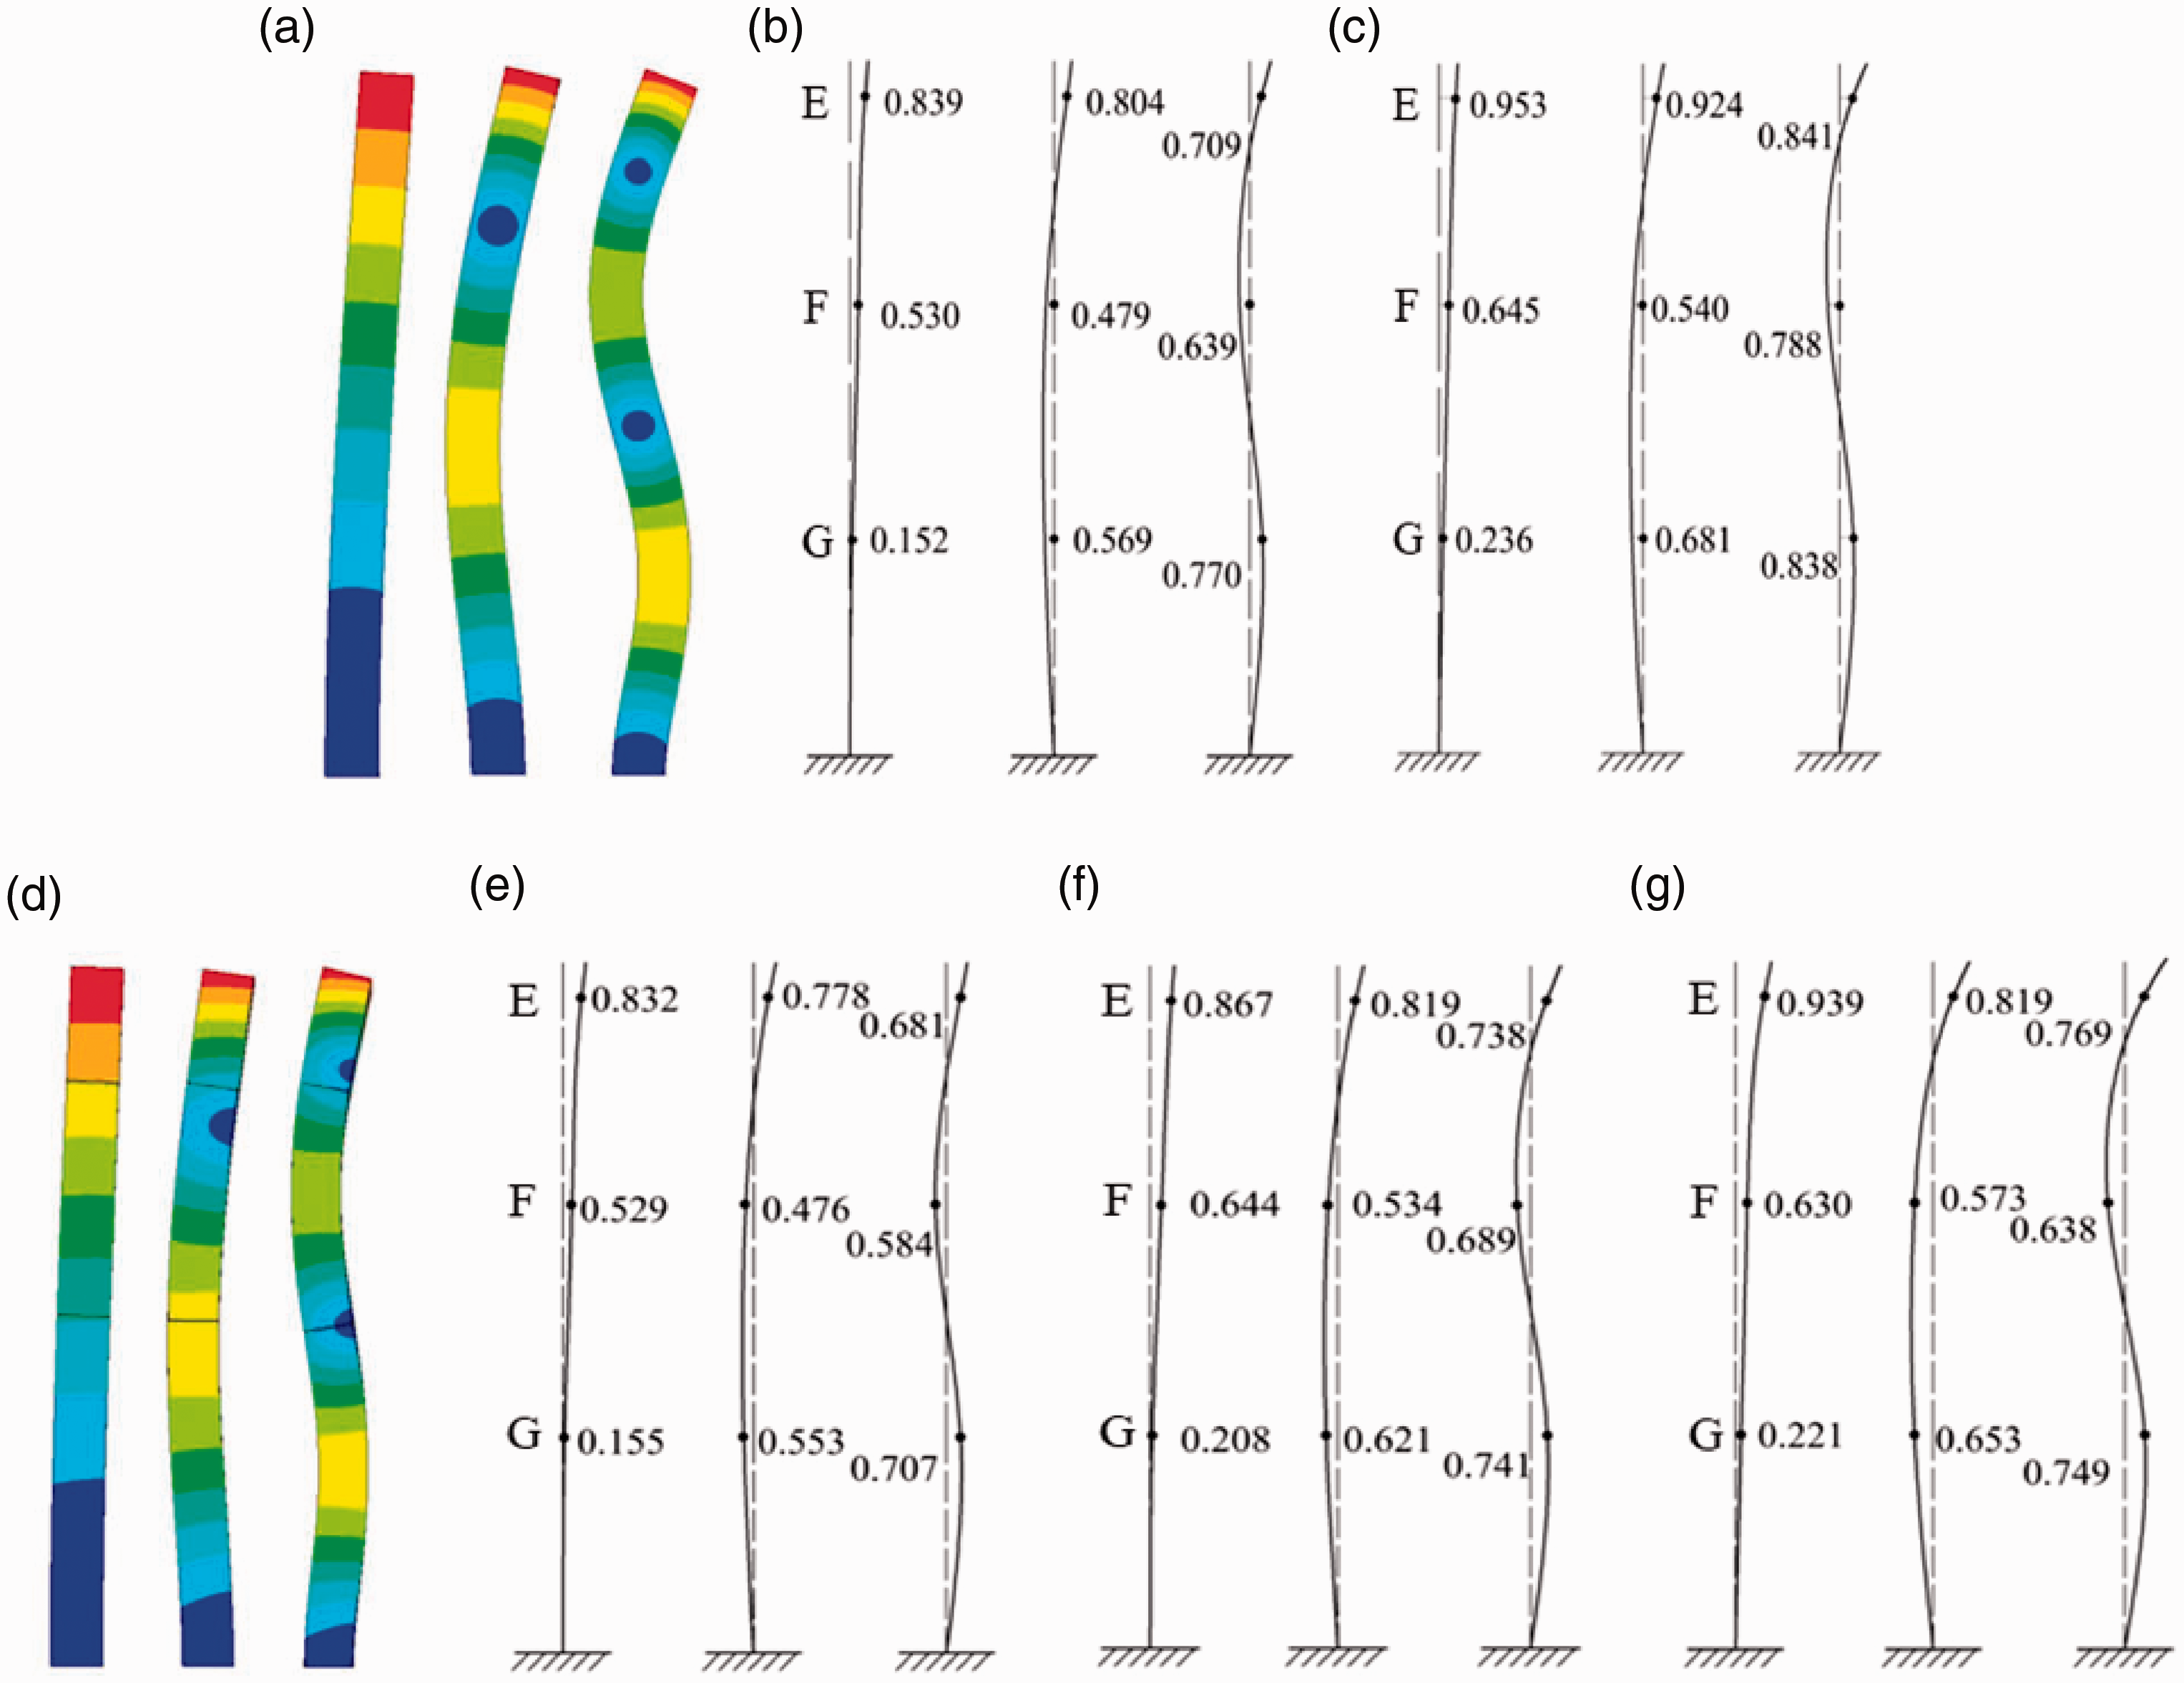
First three normalized mode shapes of the numerical models and rubber specimens. (a) Numerical model I, (b) Specimen I, (c) Specimen II, (d) Numerical model II, (e) Specimen III, (f) Specimen IV, and (g) Specimen V. Points E, F, and G are the vertical midpoints of the upper, middle, and lower rubber layers in specimens considering RIRs, respectively.
From the above analysis, it is noted that the frequencies of numerical model II are lower than those of numerical model I, because the elastic modulus reduction in RIRs induces the decrease of natural vibration frequency. The natural frequencies of numerical model I, Specimens I and II are very close to each other and the errors among the frequencies are less than 2%. Therefore, the inevitable interface in MAHDR, as shown in Figure 3, should be simulated by the rubber interface proposed in Specimen II, and thus the RCCL can be rationally simulated by ARL. Moreover, the first three natural frequencies of numerical model II are closer to those of Specimen III than to those of Specimens IV and V, which indicate that the simulation of CJEZ in actual RCC by the RIR of Specimen III is more reasonable and accurate.
Due to the limitations of knowledge in damping mechanism, the structural damping ratio is difficult to calculate accurately especially for the structures made of different materials. As shown in Table 2, the damping ratio errors between numerical models and specimens are greater than the frequency errors, and the maximum damping ratio error is 12% which is acceptable in engineering practice. It is noted that the mode shapes of numerical models and specimens are very similar, which indicates that the elastic modulus reduction of RIR has little influence on the structural mode shapes.
Hydroelastic simulation for RCCGD
Hydroelastic model preparation and dynamic testing system
According to the above analysis, it is considered that applying the simulation scheme of specimen III to simulate the RCC which consists of RCCLs and CJEZs is more reasonable. Therefore, the hydroelastic model of roller compacted concrete gravity dam (RCCGD) is established and dam vibration responses induced by flood discharge is tested in HEME. Furthermore, the vibration mode identification is performed and the rationality of this simulation scheme is further validated in the subsequent sections.
As shown in Figures 11 and 12, the hydroelastic model and sensor arrangement are illustrated. The maximum height, bottom width, and aspect ratio of the model are 740 mm, 500 mm, and 0.68, respectively, and the dam body consists of the overflow section and non-overflow section. Moreover, the height between the model bottom and the top of the WES weir is 630 mm and the widths of the surface outlets are 250 mm. It is noted that the dam body consists of 10 rubber layers and 9 RIRs are involved in the model. The geometry scale and rubber elastic modulus of this hydroelastic model are 1:300, 110 MPa (for ARL) and 8.67 MPa (for RIR), respectively. The dynamic testing system in HEME of RCCGD is given in Figure 13. It is noted that dynamic displacement sensors instead of NECSs are employed to obtain the dynamic displacement signals in HEME of RCCGD, and the waterproof fabrics should be wrapped around the dynamic displacement sensors to avoid water infiltrate into the sensors.
Manufacturing process for hydroelastic model.
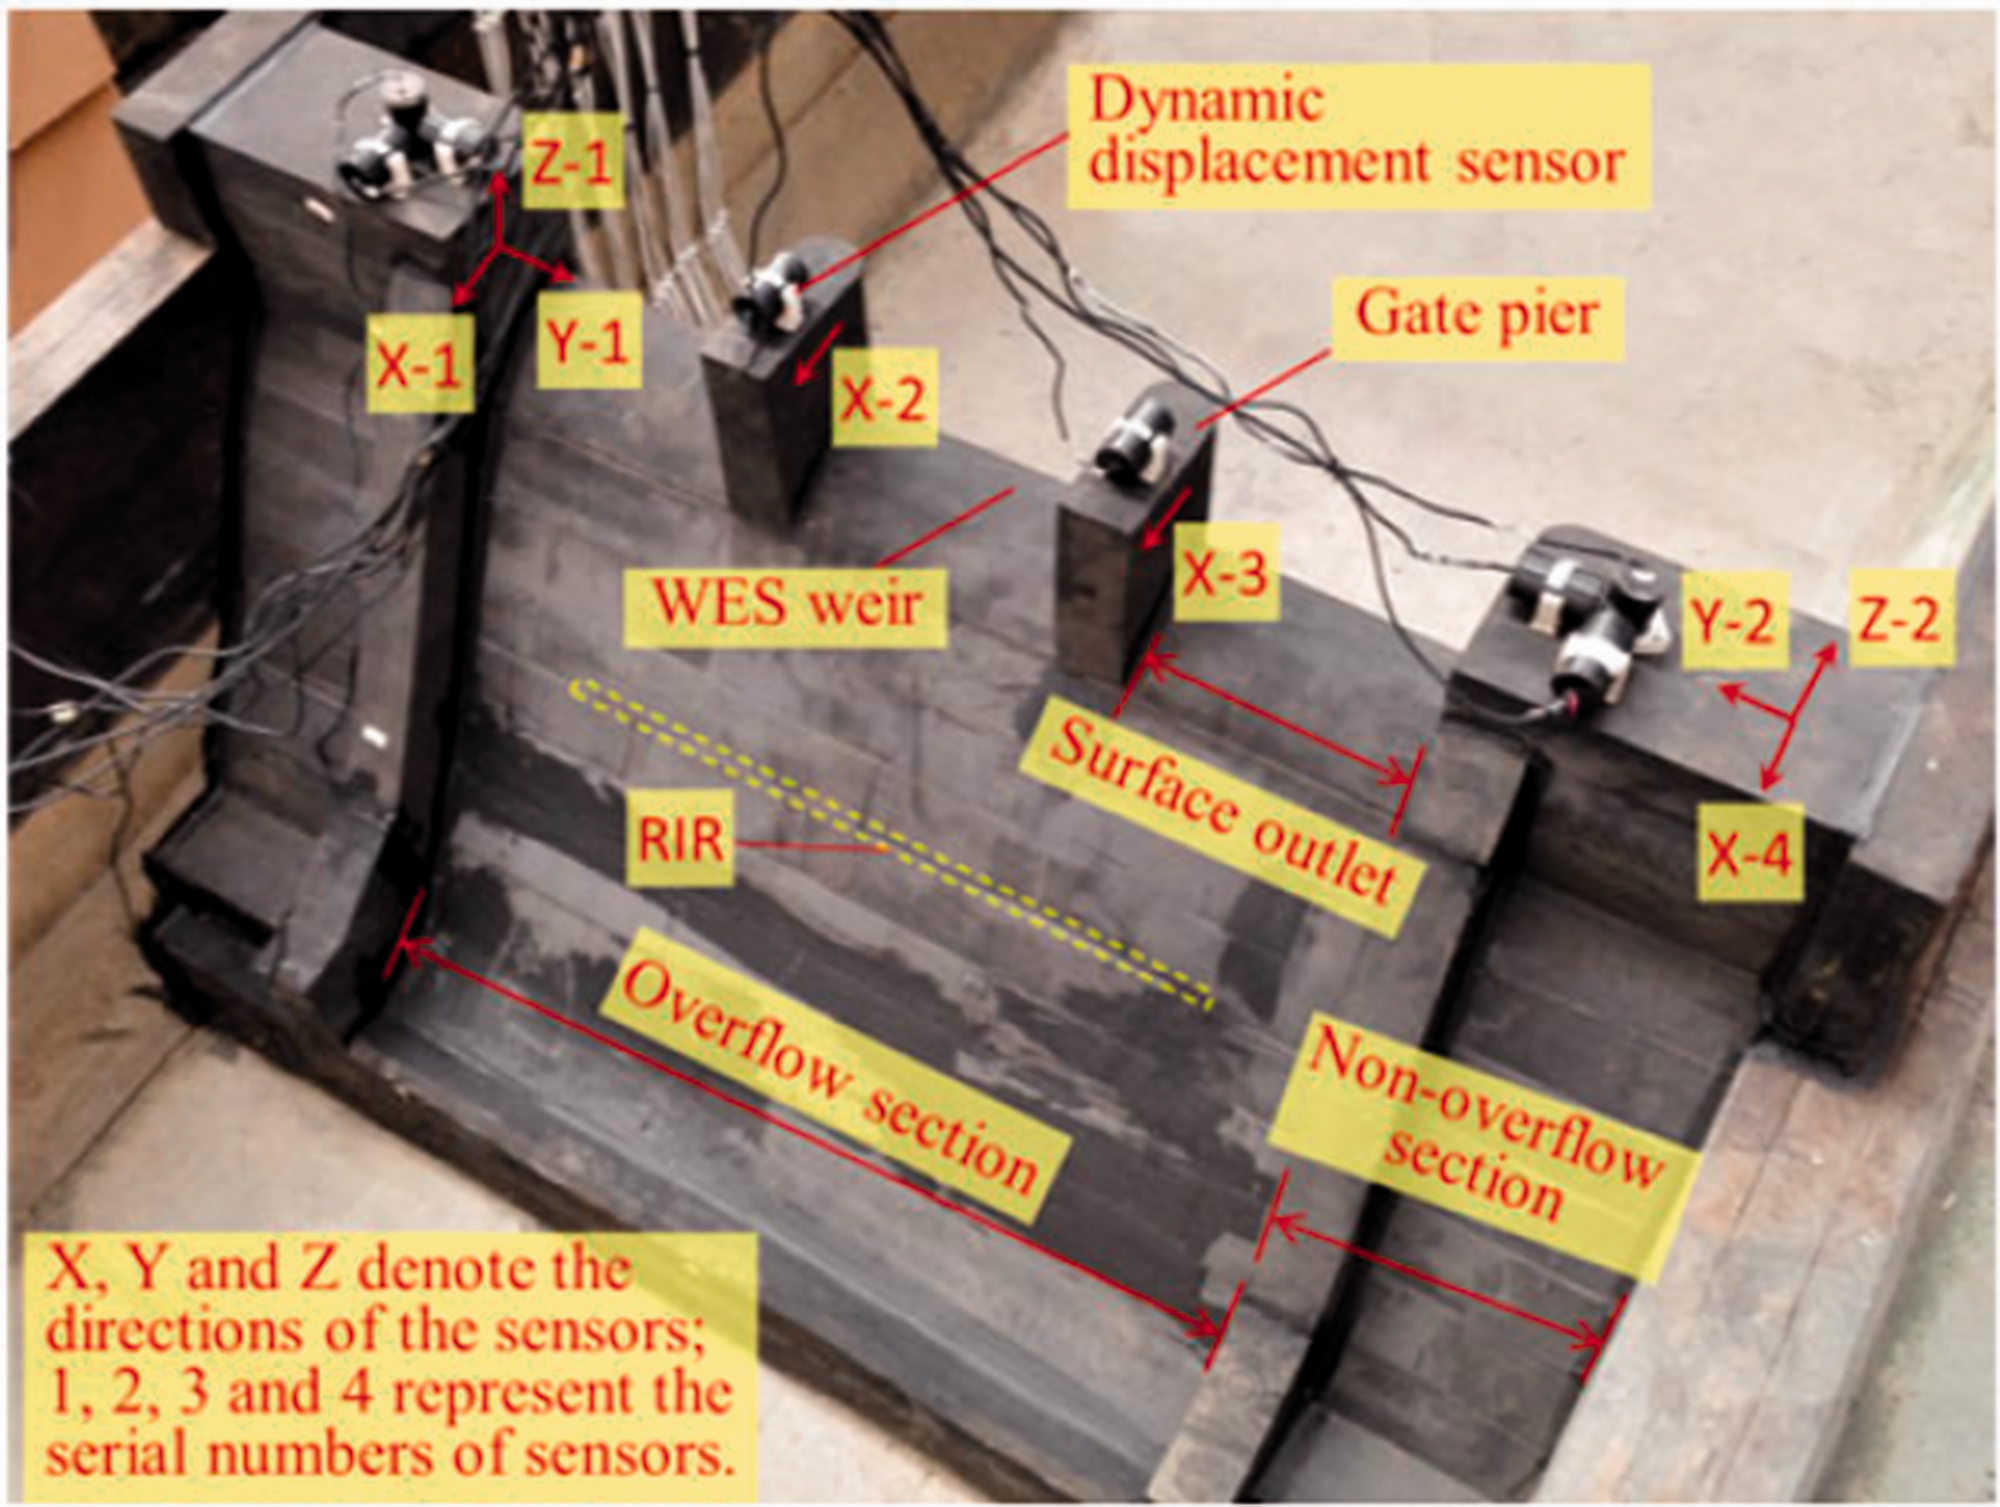
Hydroelastic model and sensor arrangement. RIR: rubber interface region.
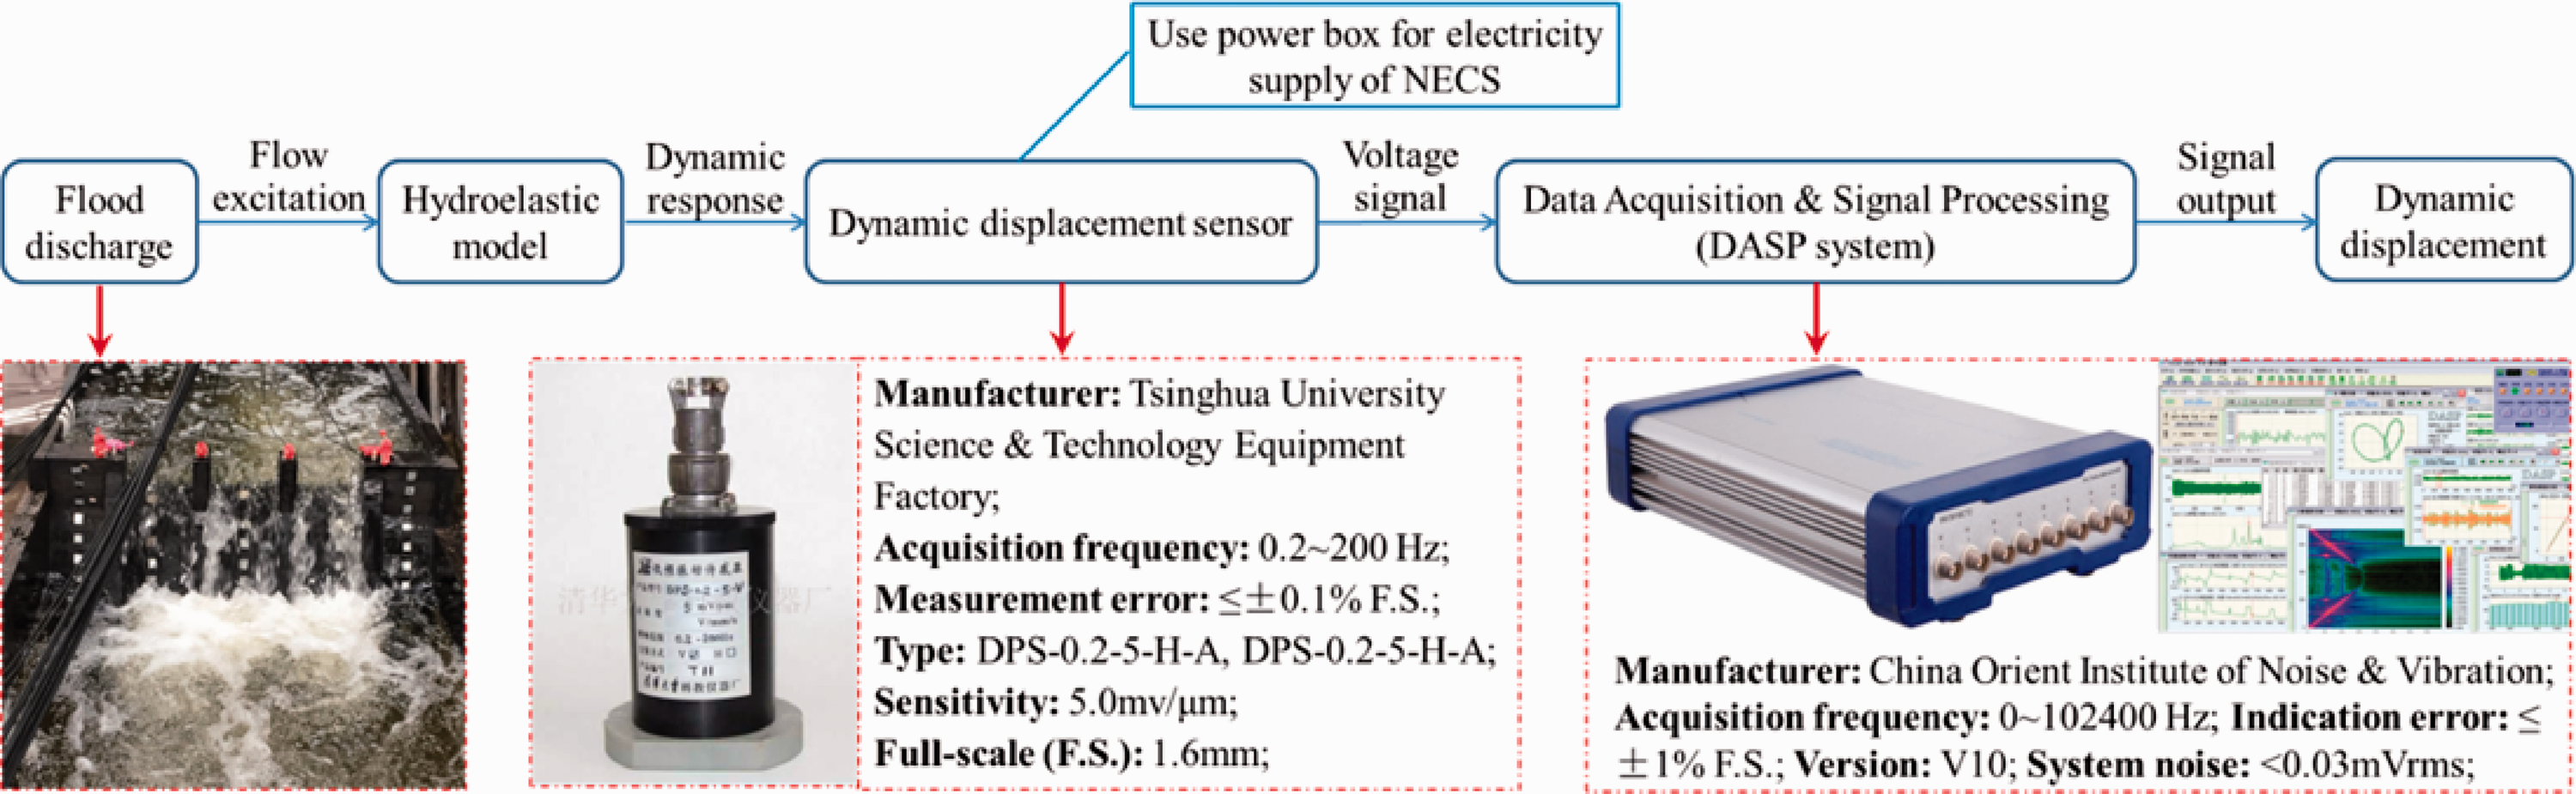
Dynamic testing system in HEME of RCCGD. NECS: non-contact eddy current sensor.
Modal analysis for hydroelastic model using a combinatorial method
Because of the multi-input and multi-output property, efficient calculating, low data demand, and strong identify capacity, ERA method and its modified version are frequently used in hydraulic structure mode analysis.18,22 However, the noises induced by human activity, machine operation, testing instrument, and environment are usually involved in the vibration signals of hydroelastic model.18–22 In order to further increase the anti-noise ability and modal recognition accuracy of the algorithm, an improved combinatorial method is proposed in this article to precisely obtain the modal parameters for the hydroelastic model. The structural impulse response is firstly calculated by NExT method based on the testing data of the structural dynamic responses. According to structural impulse response data, the Hankel matrix is constructed and the singular value decomposition is performed on the Hankel matrix. Then, SE method is applied to determine the modal order of the operating hydraulic structure and reduce the noise of the original signal. Furthermore, the ERA/DC method is employed to calculate the minimal realization of the dynamic system. The Hankel matrix is reconstructed on the basis of signal autocorrelation matrix, and singular value decomposition is performed on this Hankel matrix. Finally, the minimal realization of the dynamic system can be accurately and efficiently calculated.
NExT method for structural impulse response calculation
The NExT method is developed for constructing an impulse response function based on the dynamic responses of the system subjected to natural random excitations. Therefore, other analysis methods, such as ERA, random subspace method (RSM), and so on, can be applied to further study the dynamic characteristic of system based on the results from NExT. In order to avoid duplication, the mathematical foundation of NExT which is detailedly described by George et al. 33 is not included in the present paper, and the brief calculation formulae and procedures are given.
The dynamic equations for a discrete, N-degree-of-freedom linear structural system can be written in the following matrix form.
It is noted that the cross-correlation function between the vibration signals of points a and b (denoted as 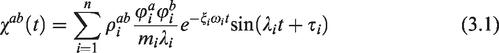
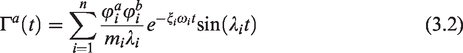
By simple transformation of equations (3.1) and (3.2), we can find that the expressions for 
SE method for order determination
The state space method can be employed to reconstruct equation (2) and the following formula can be obtained.
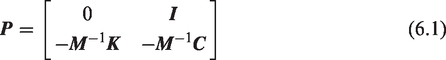
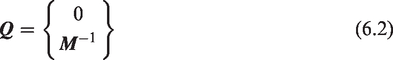
Then, the state space equations can be obtained.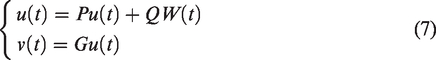
Considering the testing data for the actual vibration histories are discontinuous time series, the state space equations can be rewritten as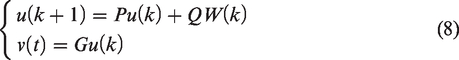
The free vibration response of the system can be expressed as
Since the structural impulse response is obtained in NExT method for structural impulse response calculation section, a more convenient and frequently used formula to calculate 
The Hankel matrix can be established as follows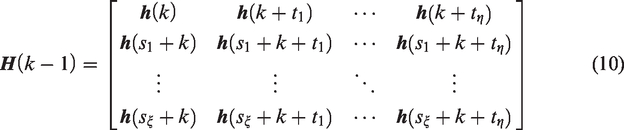
Combining equations (8) to (10) yields the following equation
The Hankel matrix can be expressed as follows when k = 1.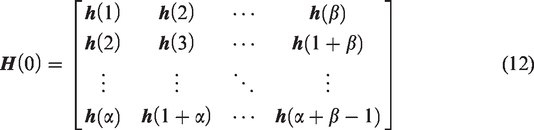
Applying singular value decomposition to equation (12) yields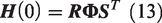
Furthermore, 


The singular entropy 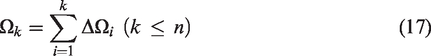
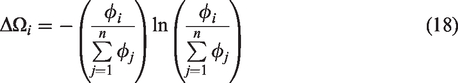
It is noted that the noise signal information quantity is averagely distributed in every singular value, while the information quantity of the useful signal is distributed in first several singular values. Therefore, the useful information quantity and the eigen-information of system are approximately complete when the SE increment tends to zero.
ERA/DC method for modal analysis
Based on equation (11), the matrix 
Constructing the Hankel matrix as follows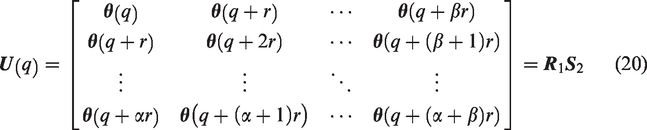
Applying singular value decomposition to equation (20) yields
The relationship between 
According to equations (19) to (22), the following equation can be deduced

The following equation can be obtained based on equations (11) and (19) to (23)
According to equation (19), 
Therefore, 


According to the calculated system matrices
Analysis results
In order to describe the theoretical method and calculation process more clearly, a calculation flowchart for the modal analysis using the aforementioned combinatorial theoretical method is illustrated in Figure 14. The hydroelasticity is mainly considered in the hydroelastic model experiment and is not included in the dynamic equations of the theoretical methods in NExT method for structural impulse response calculation section to ERA/DC method for modal analysis section. The contribution of hydroelasticity is that the vibration of the model can be conveniently extended to the prototype according to the similarity law.
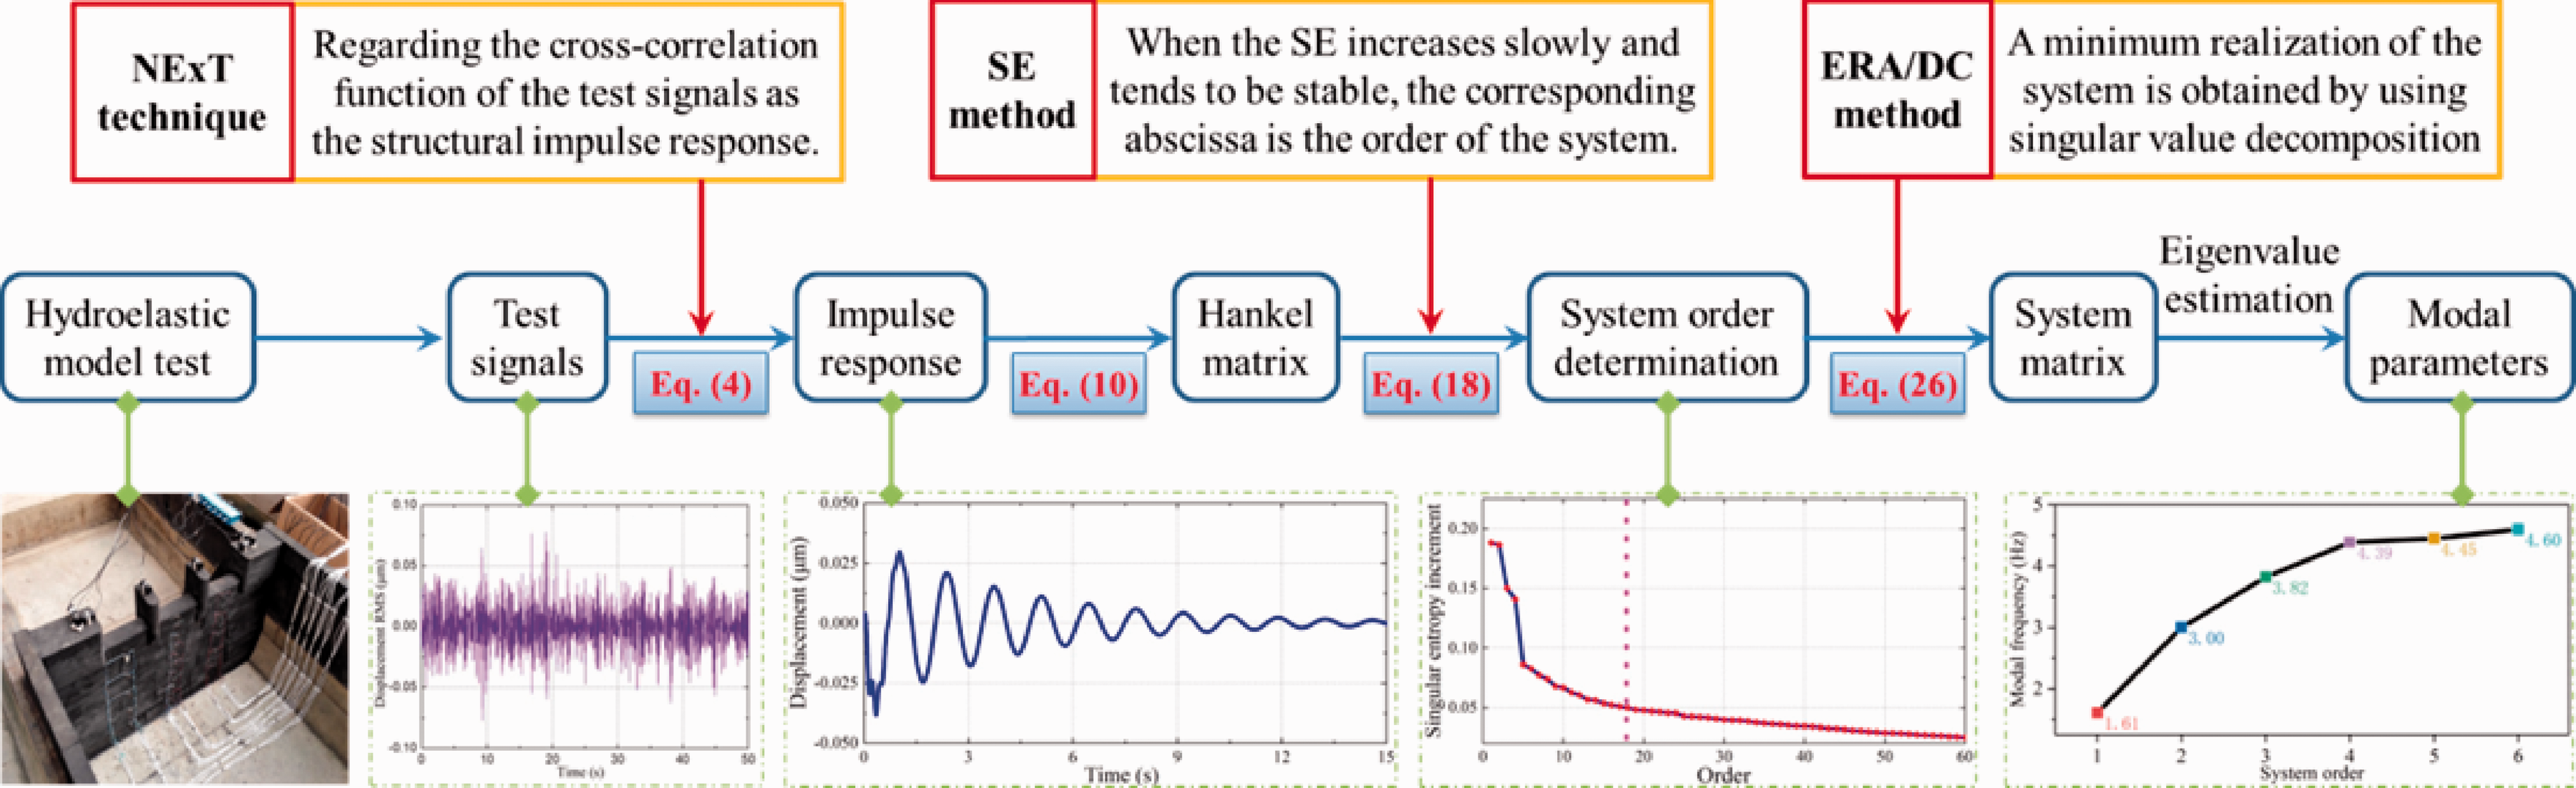
Flowchart for the modal analysis using the aforementioned combinatorial theoretical method. NExT: natural excitation technique; SE: singular entropy; ERA/DC: eigensystem realization algorithm with data correlation.
As shown in Figure 14, the vibration signals of the hydroelastic model is firstly obtained in the experiment, and the structural impulse response can be approximately calculated based on the NExT method and the model vibration data. Then, the SE method is applied to determine the order of the dynamic system, which determines the size of the matrices involved in the subsequent ERA/DC algorithm. Subsequently, according to ERA/DC algorithm, a minimum realization of the target system can be obtained and the parameter matrices of the system are calculated. Finally, the modal parameters can be easily obtained by eigen-decomposition of the system matrices.
It is noted that some parameters including mass, stiffness, and damping matrices are not involved in the calculation, although they are given in the formulae of this paper. According to the NExT theory, the approximate structural impulse response can be obtained by calculating the cross correlation function between the model vibration response histories. Then, the Hankel matrix is established based on the structural impulse responses, and the SE method is employed to calculate the SE increment on the basis of the established Hankel matrix. When the increasing rate of SE obviously slows down and tends to be stable, the corresponding abscissa represents the order of the system. After the order of system is calculated, the matrix orders in the ERA/DC algorithm are also determined. Based on the updated Hankel matrix, the minimum realization of the target system can be obtained using the singular value decomposition technique so that the system natural frequencies of different orders can be conveniently computed by the eigen-decomposition analysis. According to the aforementioned discussion, as long as the vibration response of the model is tested, the modal information of the structural system can be calculated through the above signal processing and modal analysis methods.
In HEME, the dam vibration response is obtained under the working condition of relative high water level and large discharge. The 50 Hz power-frequency component of vibration signals are removed by filtering, 34 and the vibration displacement histories of dynamic displacement sensors X-1 and X-3 are given in Figure 15. It is noted that the data shown in Figure 15 are the initial input of the subsequent calculation.
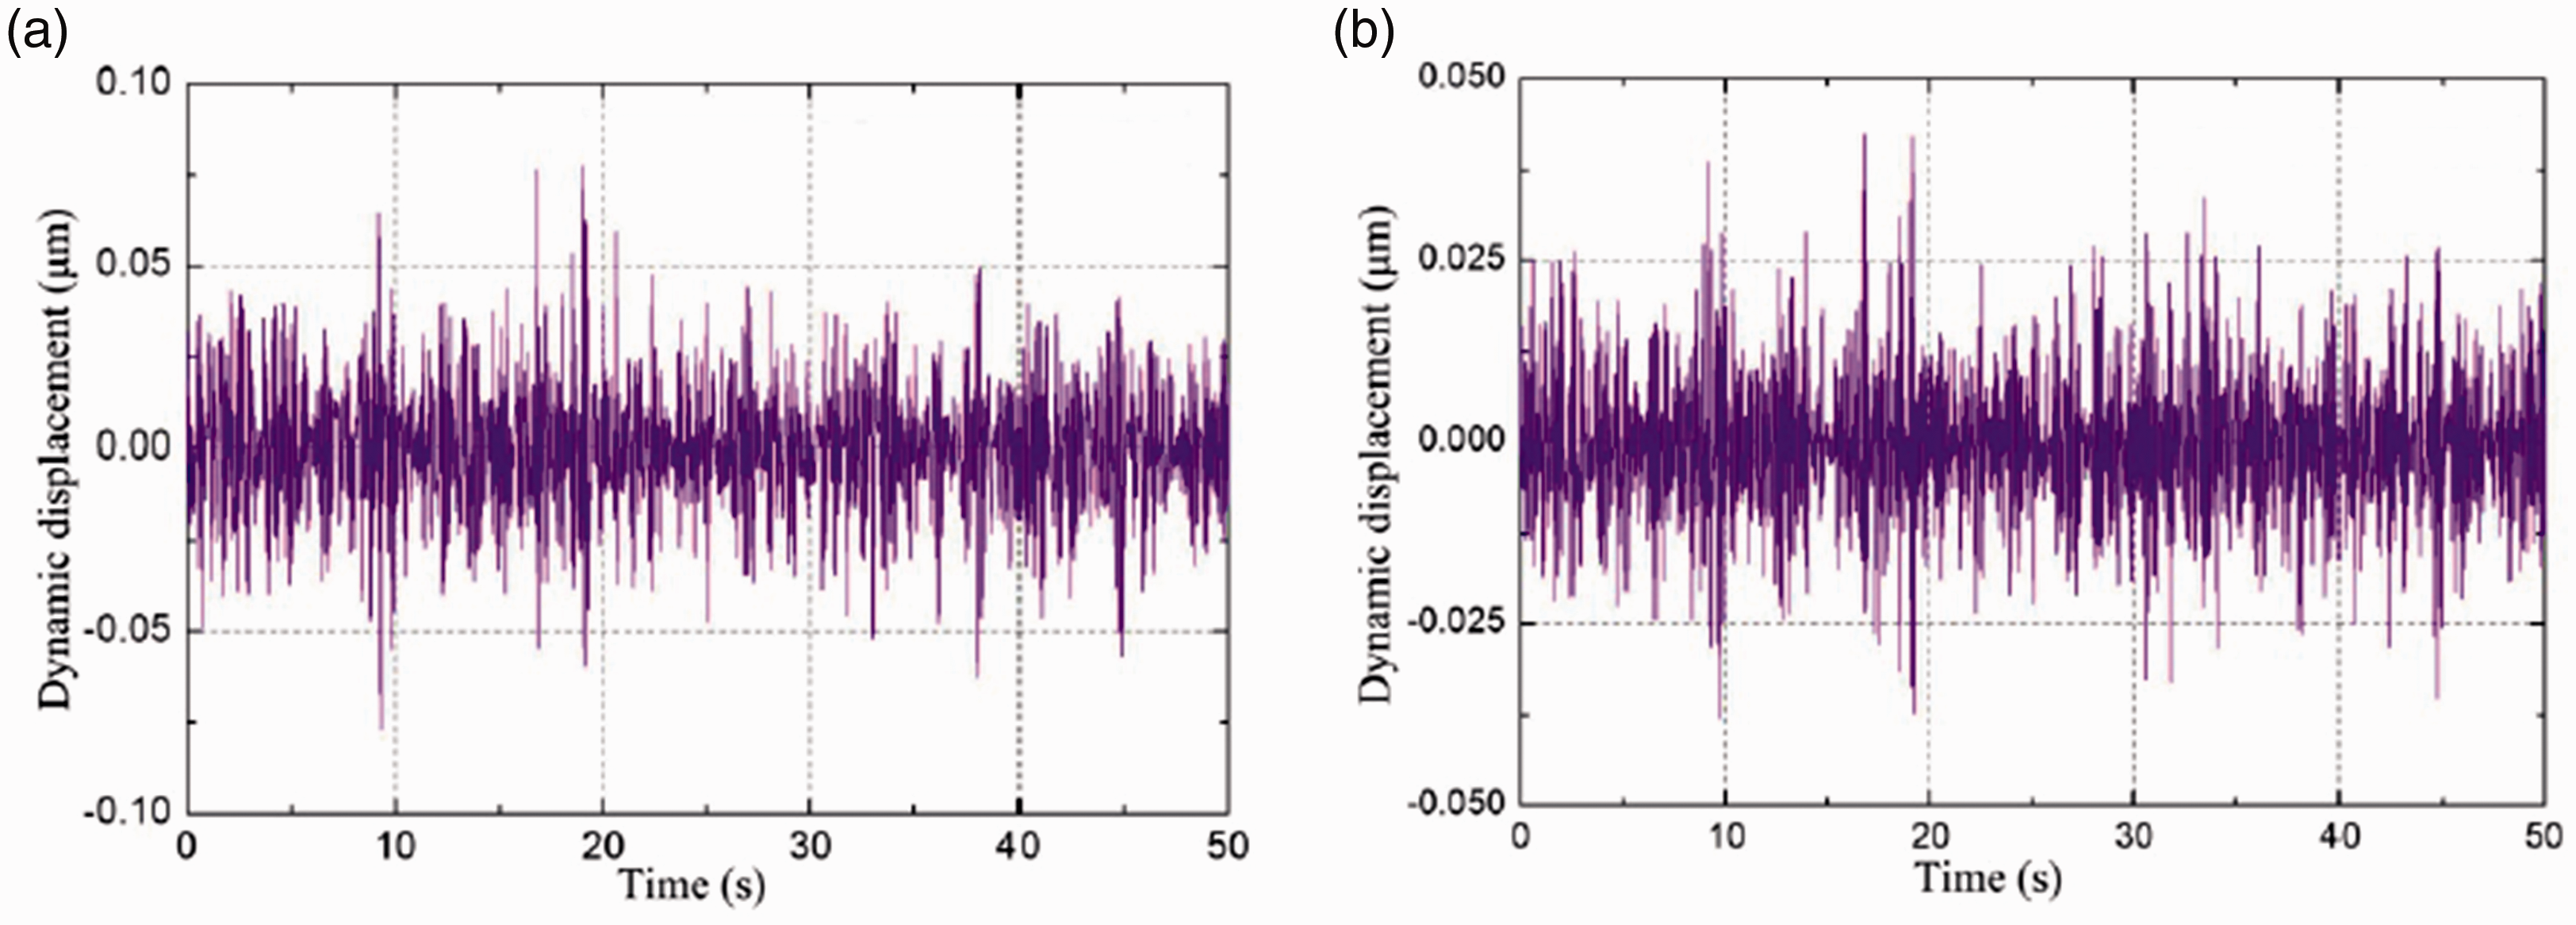
Dynamic displacement histories measured by sensors X-1 and X-3. (a) Measured by sensor X-1. (b) Measured by X-3.
As shown in Figure 16, the impulse response function between the dynamic responses of measuring points X-1 and X-3 is illustrated. The data shown in Figure 16 are the calculation results of NExT method on the basis of the initial input data. Based on this impulse response function, the increment of SEs with different orders are calculated and illustrated in Figure 17. It is known that the larger the singular entropy is, the more effective information the signal contains. Since the SE increment decreases and gradually approaches 0 when the order of SE exceeds 18, this means that the order of system is approximately 18 because the feature information included in the first 18 orders are almost complete. The singular entropy increments corresponding to higher orders are generated by the broad band noise. Therefore, after the order of system is determined, the matrix dimension in subsequent analysis is obtained and simplified, and the noise interference in high order is also eliminated. Based on ERA/DC method, the modal parameters of RCCGD hydroelastic model are identified under operating condition. Finally, the first six vibration modes of the structure are identified, and the first six prototypical vibration frequencies obtained by the aforementioned combinatorial method are 1.61 Hz, 3.00 Hz, 3.82 Hz, 4.39 Hz, 4.45 Hz and 4.60 Hz, respectively.
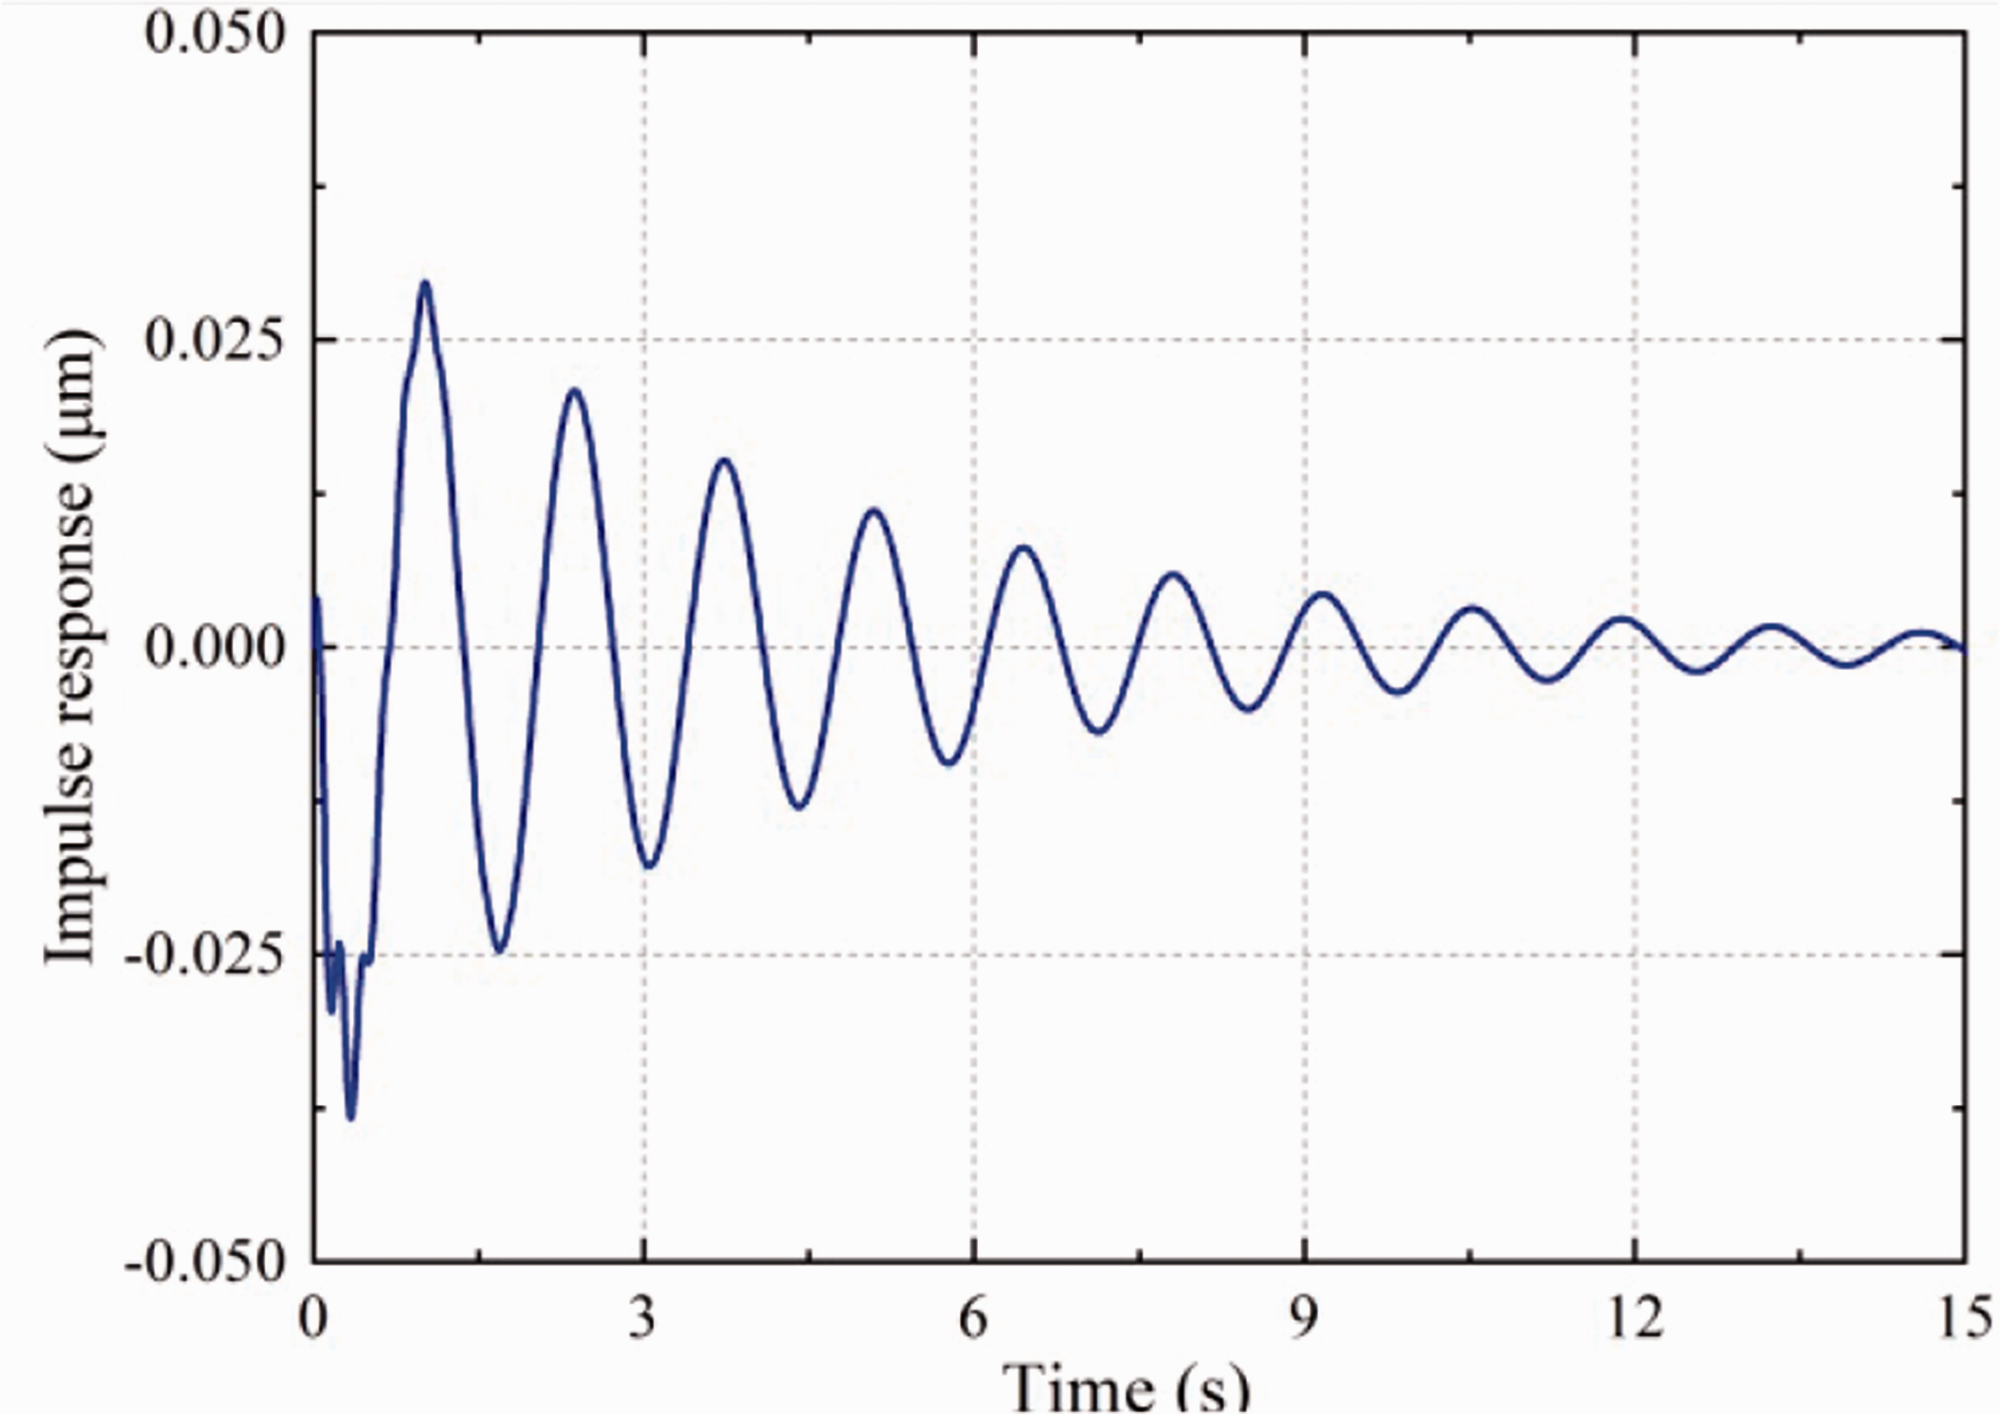
Impulse response function between the dynamic responses of measuring points X-1 and X-3.
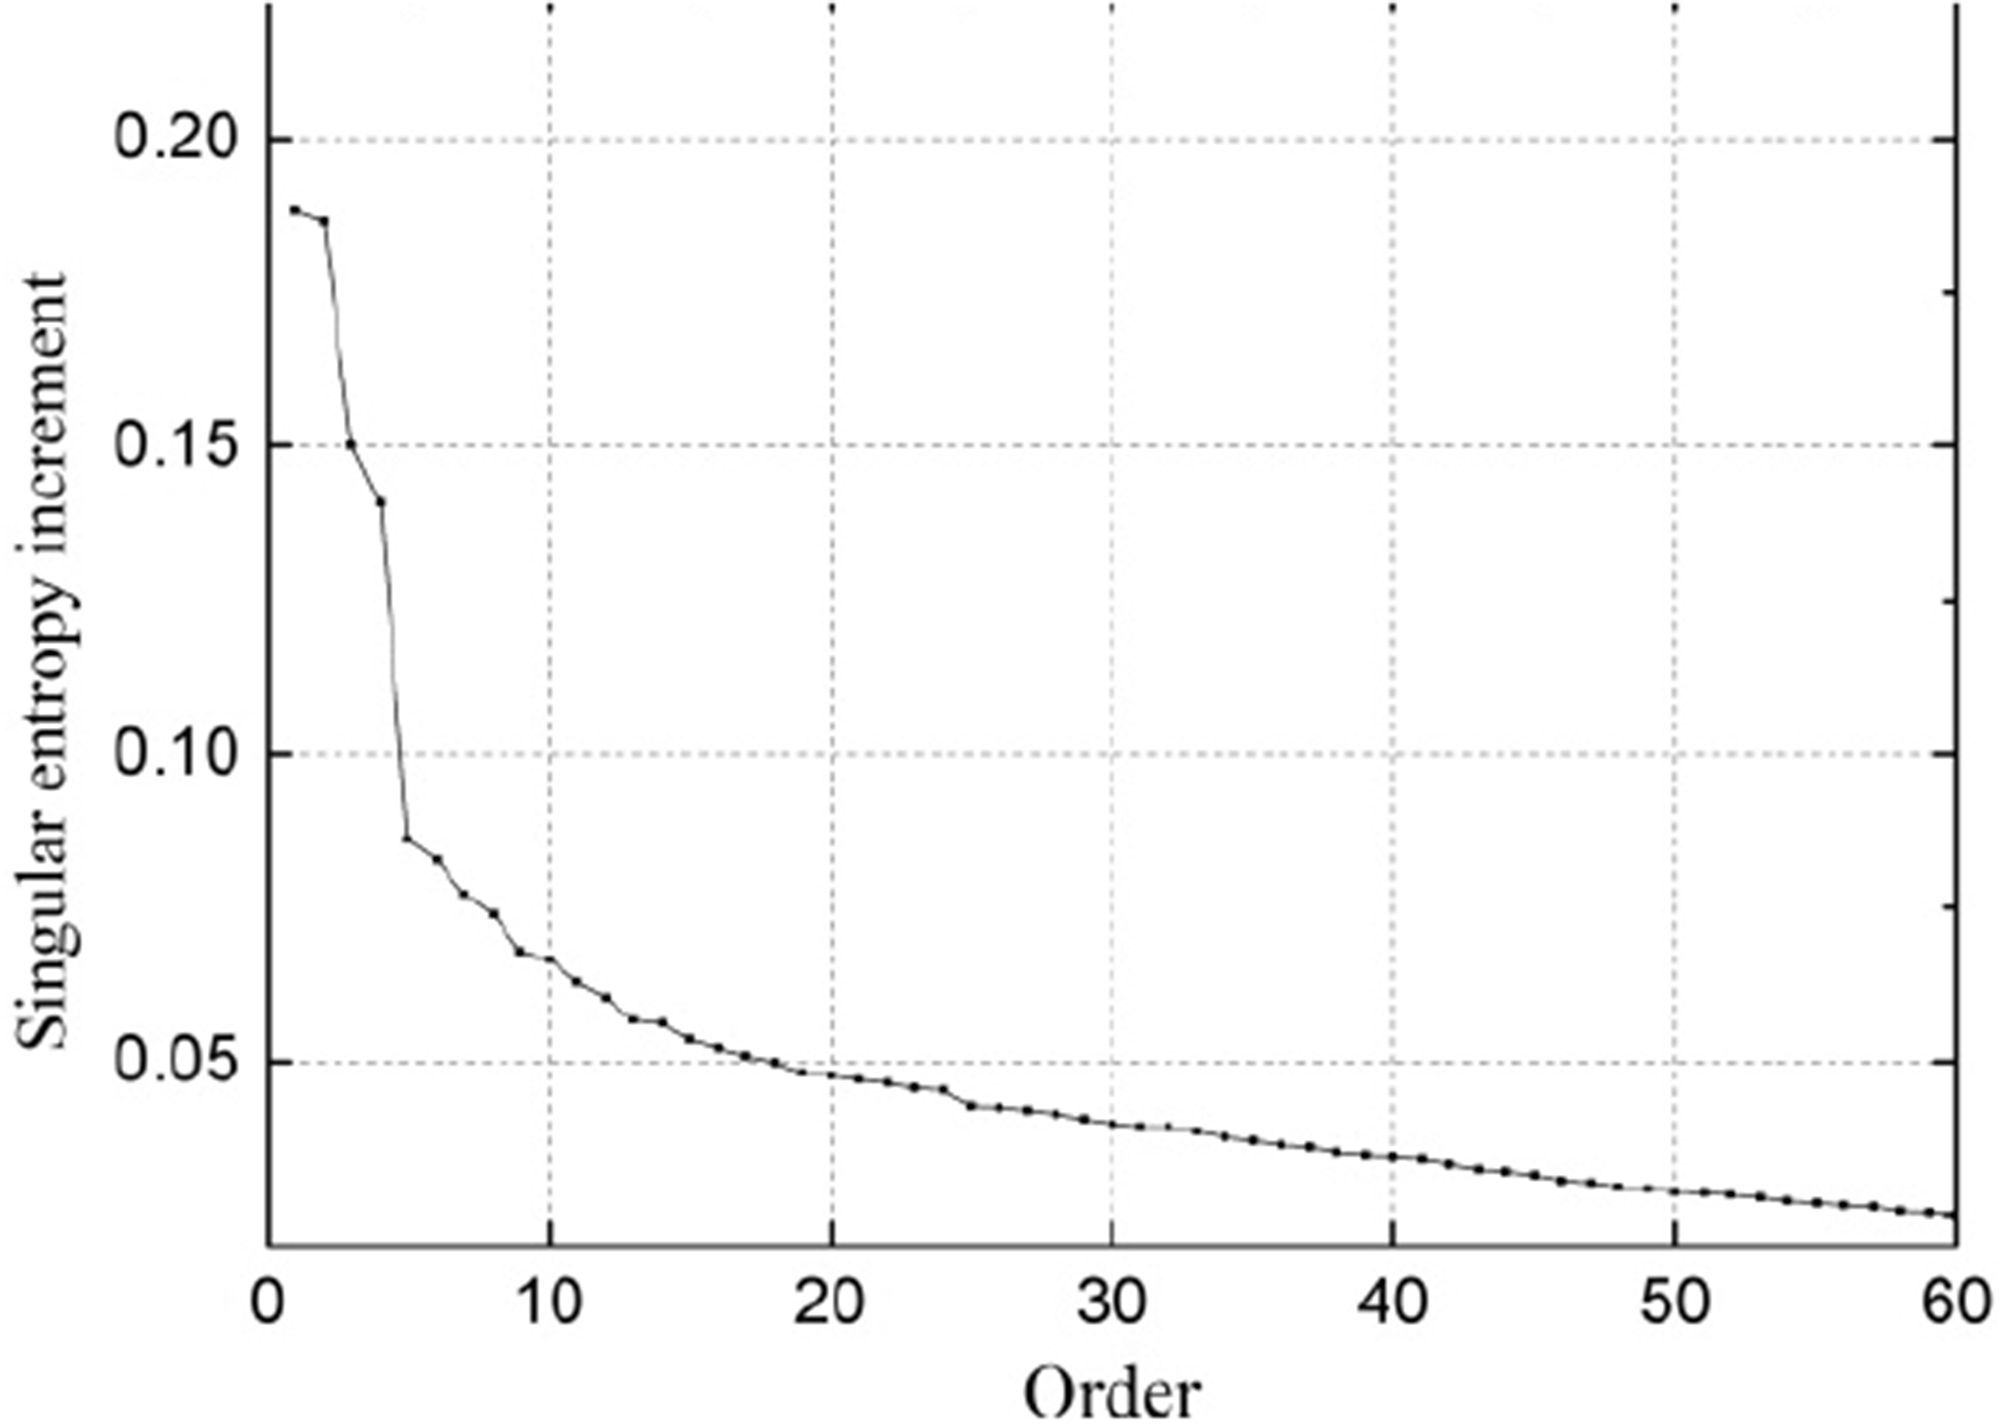
Singular entropy increments.
Numerical verification
In order to verify the rationality of aforementioned theoretical calculation results, the numerical model is established and the RCCGD mode analysis based on the finite element model is carried out. As shown in Figure 18, the fluid-solid interaction is briefly considered by creating a fluid solid interface between the water and solid structures (RCCGD and surrounding rock). The zero normal displacement constraints are applied on the left, right, front, and rear surfaces of the whole numerical model, and the zero displacement and rotation constraints are applied to the bottom surface of numerical model. Moreover, it is believed that the calculation is more efficient and accurate when the ratio between the length and depth of water body is 4.35,36
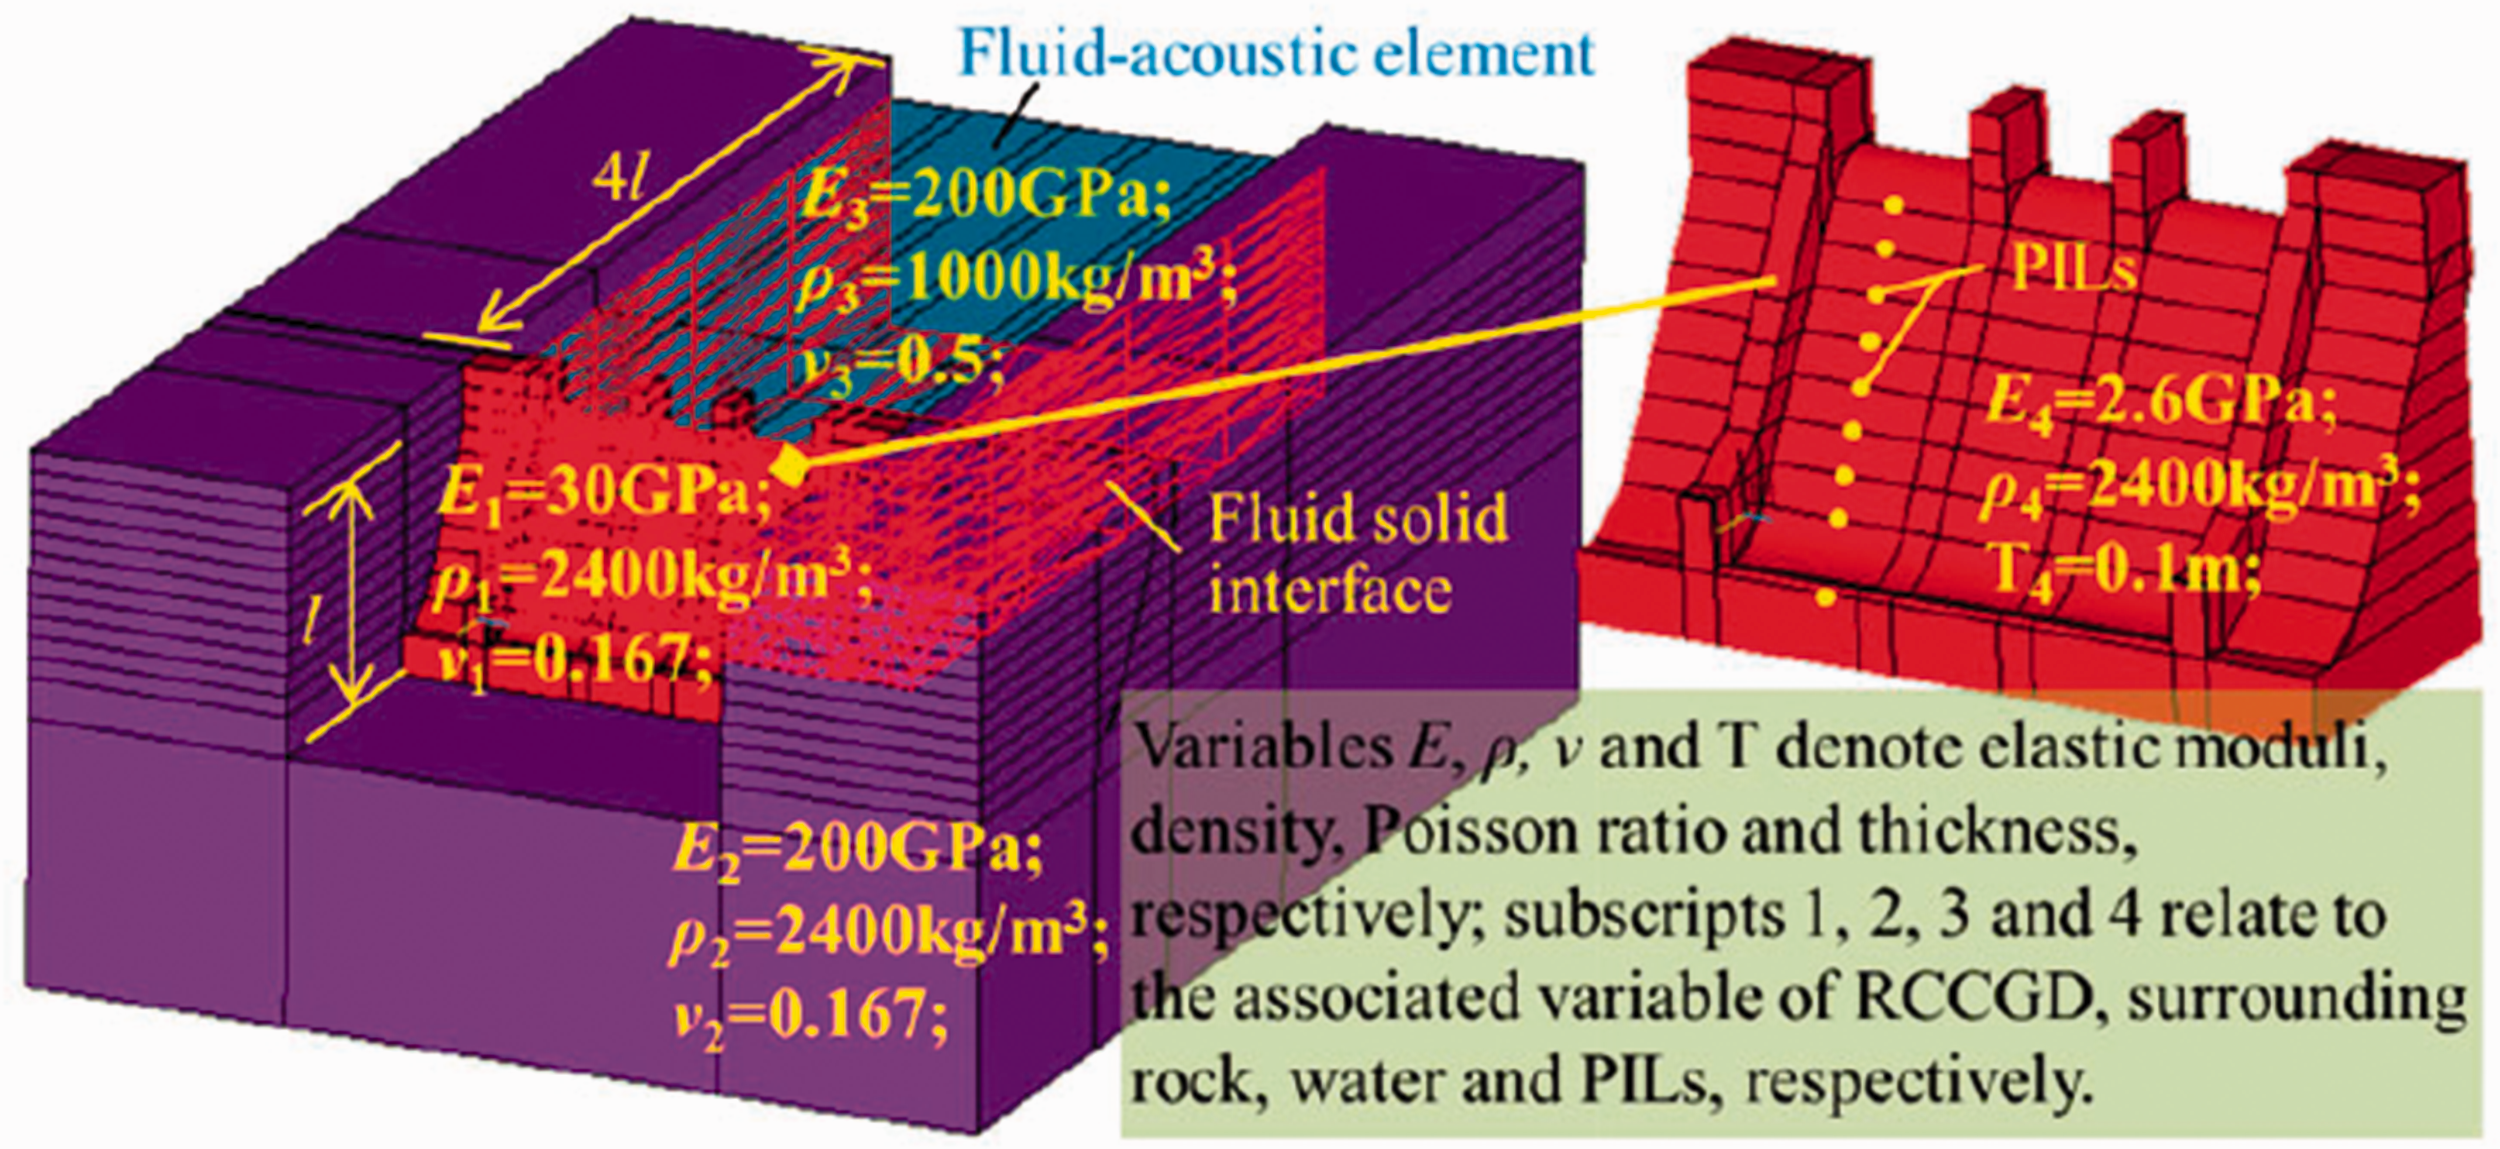
Basic information for the numerical model. RCCGD: roller compacted concrete gravity dam; PIL: pouring interface layer.
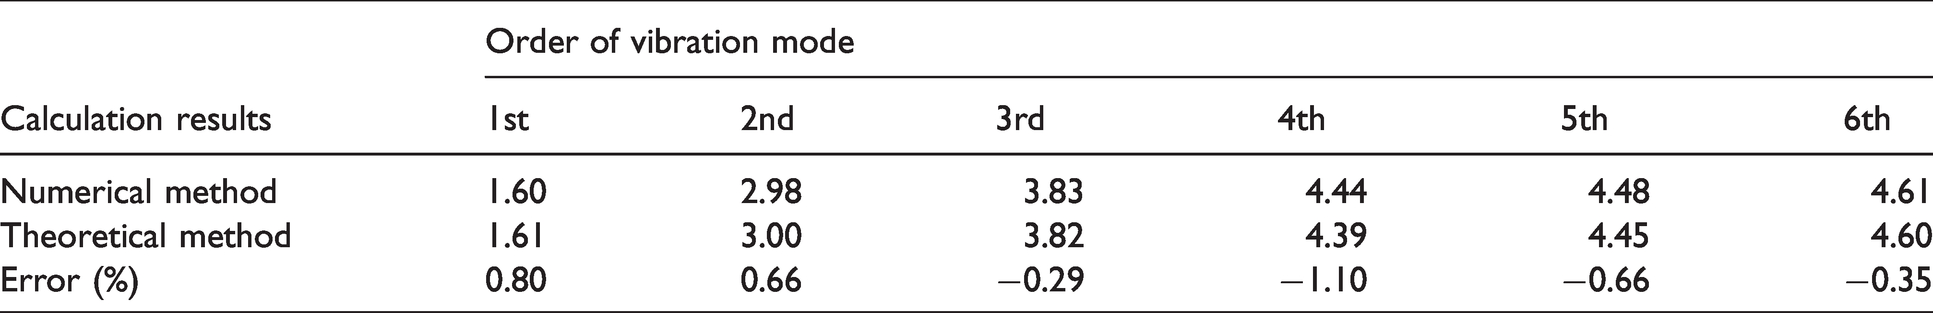
As shown in Table 3, the structural frequencies of the first six vibration modes respectively calculated by finite element method and combinatorial theoretical method are very close to each other, which indicate that the presented hydroelastic model experiment technology can rationally simulate the actual RCCD. Moreover, the proposed combinatorial theoretical method is proved to be a promising approach to effectively identify the modal parameters of the structures subjected to natural excitation in complex experimental environment.
Comparison between the calculation results of numerical and theoretical methods.
Concluding remarks
In this paper, the physical and mechanical properties of the RCC and experimental material are firstly analyzed, and then the similarity conditions for the hydroelastic simulation are summarized. Several alternative hydroelastic simulation schemes for different interfaces in RCCD are presented, and it is proved that the cold joint and ordinary interfaces in RCC can be reasonably simulated by the simulation schemes presented in Specimens II and III, respectively. Then, the integral RCCGD model is established and its dynamic displacements under flood discharge excitation are tested in noisy experimental environment. The frequencies of first six vibration modes of RCCGD obtained by the proposed combinatorial theoretical method and numerical simulation are very close to each other, which mean that the presented HEME technology can rationally simulate the actual RCCGD and the proposed combinatorial method can accurately estimate the structural dynamic characteristics.
It is important to point out that the HEME technology is an approximate approach for flow-induced vibration analysis of hydraulic structures. The time and frequency domain characteristics of the structural vibration can be estimated in advance and the precision of estimation can fully satisfy the requirement of engineering practice, which is of great significance. However, the elaborate simulation is difficult to achieve by using current technologies. Therefore, the similarities between the dampings, cohesions, and failure processes of actual structure and simulated model should be further investigated by theoretical and experimental methods. Moreover, the reasons for the differences between the vibration data from HEME and prototype test should be paid more attention, so that the modification method may be presented based on numerous model and prototype testing data of different projects.
Footnotes
Declaration of conflicting interests
The author(s) declared no potential conflicts of interest with respect to the research, authorship, and/or publication of this article.
Funding
The author(s) disclosed receipt of the following financial support for the research, authorship, and/or publication of this article: This research was funded by National Key R&D Program of China, grant number 2016YFC0401705; Science Fund for Creative Research Groups of the National Natural Science Foundation of China, grant number 51621092; National Natural Science Foundation of China, grant numbers 51809194, 51779167, and 51909185; Fund for Key Research Area Innovation Groups of China Ministry of Science and Technology, grant number 2014RA4031; Tianjin Innovation Team Foundation of Key Research Areas, grant number 2014TDA001; and Program of Introducing Talents of Discipline to Universities, grant number B14012.