
Abstract
This paper presents investigations into a comparative assessment of the effects of low- and high-frequency noise in relation to personality traits. The high- and low-frequency noises used are produced in the research laboratory using CoolEdit software. In all, 80 candidates were exposed to equivalent continuous sound pressure level of 65 dBA of low- and high-frequency noise in an acoustic room with a 2-week interval. After 1 hour of exposure to noise, participants were asked to complete noise annoyance scale, Weinstein noise sensitivity questionnaire and loudness perception. The results obtained indicate that there is a significant difference between annoyance and perception of low-frequency noise in comparison to annoyance and perception of high-frequency noise, but no significant difference is noted between sensitivity to low- and high-frequency noise. The multivariate analysis of covariance test is applied, which reveals that personality traits have a significant effect on sensitivity to low- and high-frequency noise, annoyance due to low- and high-frequency noise, loudness perception of low-frequency noise, but no interaction effects are found. It is further shown that personality traits are more effective on sensitivity, annoyance and loudness perception to high-frequency noise than those of low-frequency noise, and such effects are not only influenced by severity of noise but also by personality traits and frequency components.
Keywords
Introduction
People often evaluate noise in their own way and respond to its effects differently. 1 This is somewhat due to differences in arousal level. Belojevic et al. 2 have reported that introverts are more aroused compared to extroverts. This can lead to more perception of noise and more adverse health effects resulting from noise. It is stated that neuroticism is associated with more reaction and sensitivity to noise exposure. 3 Although most researchers agree with a relationship between reaction to noise and personality traits, some researchers do not confirm an interaction between personality traits and reaction to noise.4,5 Noise sensitivity is another individual factor that works as a moderator for the effects of noise such as annoyance, 6 and is influenced by personality traits.7,8
Noise exposure, in addition to personal factors, can cause a wide range of adverse health effects including: sleep disorder,9,10 annoyance 11 and psychological distress. 12 The intrinsic features of noise, such as frequency, are responsible for certain adverse health effects because there are various resonance frequencies associated with different organs of the human body. The characteristics of noise such as intermittent, irregular, tonal and pulse are determined by the frequency of noise, and these can change the effects of noise on the human. Pawlaczyk et al. 13 have shown that low-frequency noise can cause more annoyance compared to high-frequency noise at the same A-weighted level. In another study, Bassett et al. 14 have reported that high-frequency noise of even low level can cause noise annoyance. Given the ambiguity of available knowledge about comparing the effects of high- and low-frequency noise on human health, cognitive function and annoyance, further investigation is needed. Although it is unclear whether the effect of noise frequency is more important or the effect of personality traits, it is assumed that personality traits and frequency of noise have a synergistic effect and cause adverse effects on people exposed to noise. Thus, the aim of this study is to carry out a comparative assessment of the effects of low- and high-frequency noise on sensitivity, annoyance and loudness perception in relation to personality traits.
Materials and methods
The present study was done in 2018 with 80 BSc and MSc students of the Faculty of Health in Mazandaran University of Medical Sciences. Students’ ages were in the range of 20 to 30 years, with no history of hearing problems or hearing loss. All the participants signed a consent form and took part in the study voluntarily. The students were asked to present themselves at the acoustic lab of the Faculty of Health in Mazandaran University of Medical Sciences for the study. In the beginning of the study, personality traits of students were determined using Eysenck personality inventory. Then, in the first session, candidates were exposed to equivalent continuous sound pressure level of 65 dBA of low frequency noise in an acoustic room. After 1 hour of exposure to noise, students were asked to complete noise annoyance scale, Weinstein noise questionnaire (WNSS), loudness perception scale and demographic and background questionnaire, to gain information about their annoyance, sensitivity and perception of low frequency noise. After two weeks, students repeated this session but the difference was that a 65 dBA of high-frequency noise was used. In order to prevent bias, the order of exposure to high- and low-frequency noise was randomized. In this study the duration and level of exposure were the same for the low- and high-frequency noises. Participants were asked to sleep 8 full hours overnight before the test in each case. The process of study is shown in Figure 1.
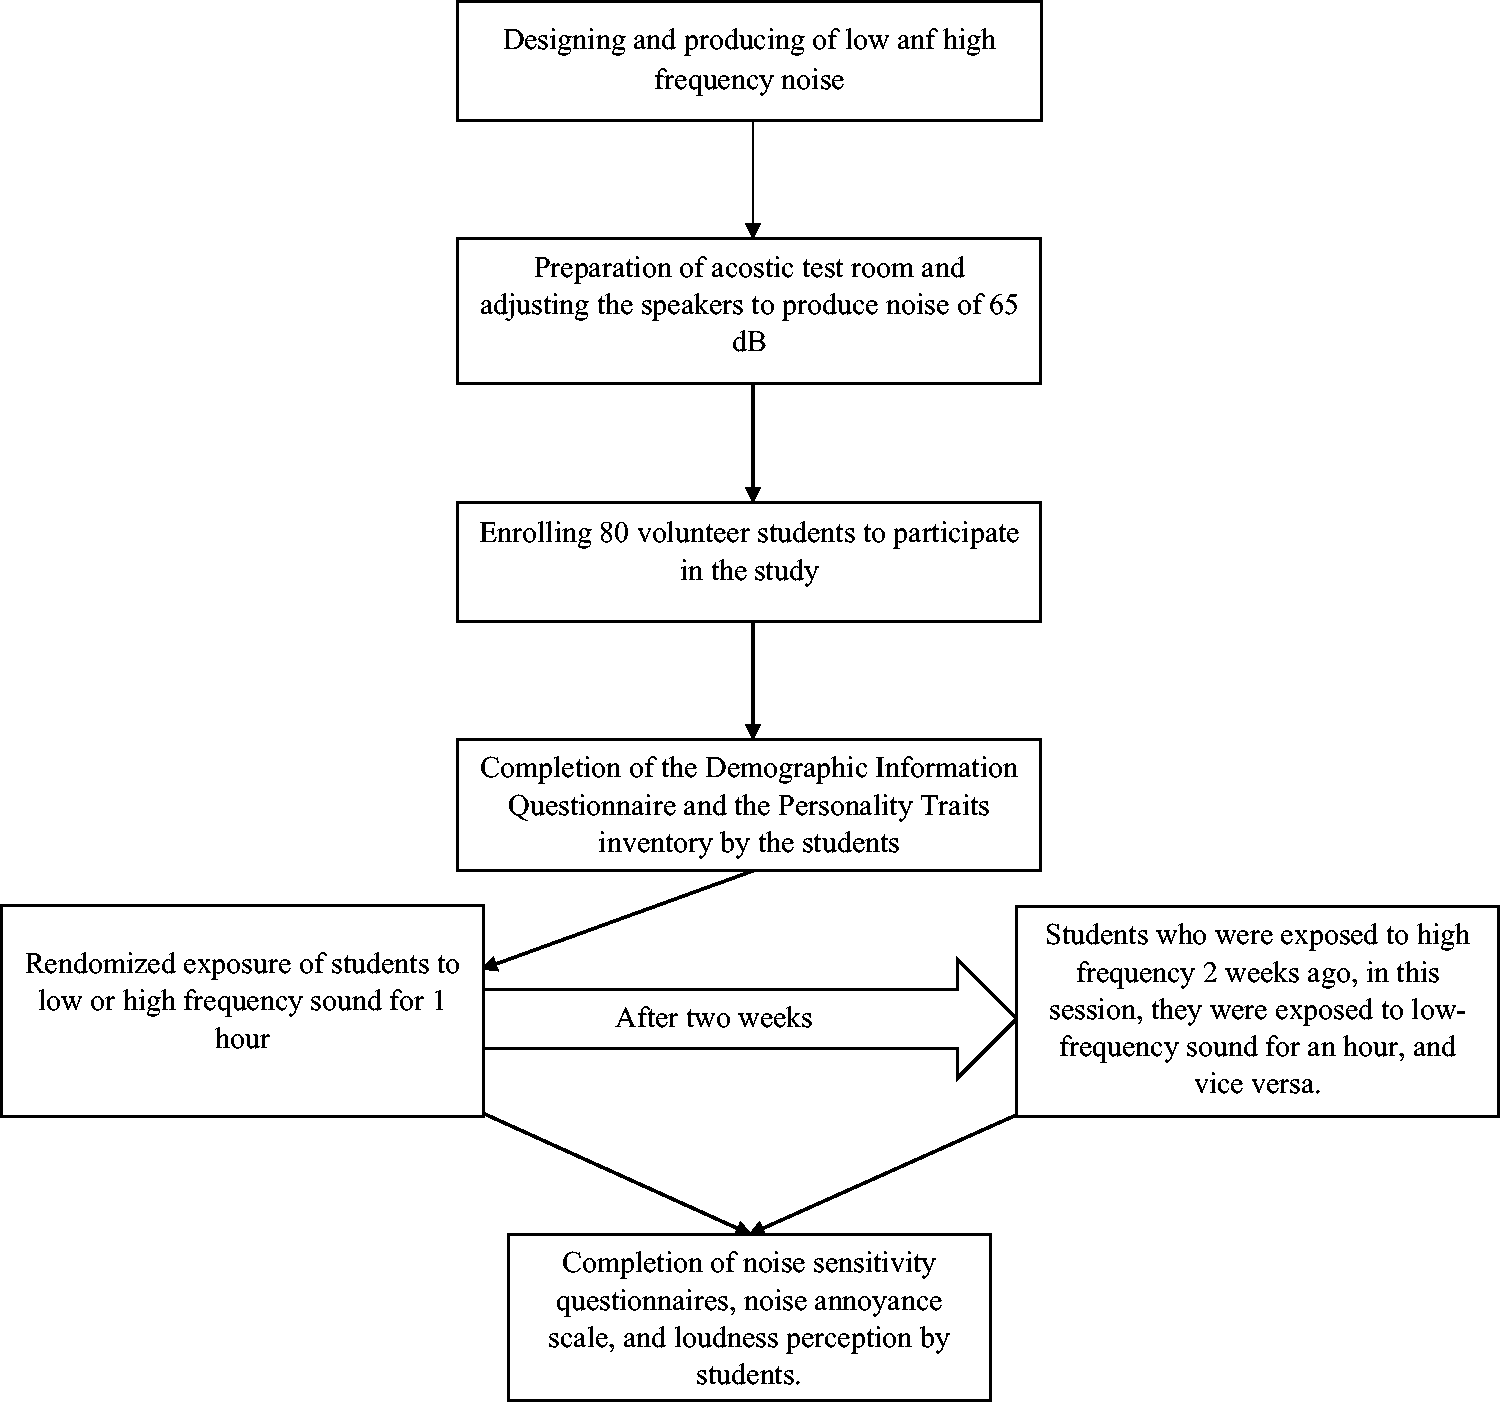
Flowchart of study design.
The high- and low-frequency noises used were produced in the research laboratory using CoolEdit software (version 2.0). 15 Before performing the tests, noises were played by loudspeaker and equivalent continuous sound pressure level was set to 65 dBA. To ensure that students are exposed to the chosen level (65 dBA), the A-weighted noise level was measured throughout the test using an analyzer and sound level meter (TES-1358). The frequency content of generated noise is presented in Figure 2. The inner dimension of acoustic chamber was 132 × 132 × 200 cm3 and noise isolation was 40 to 45 dB.
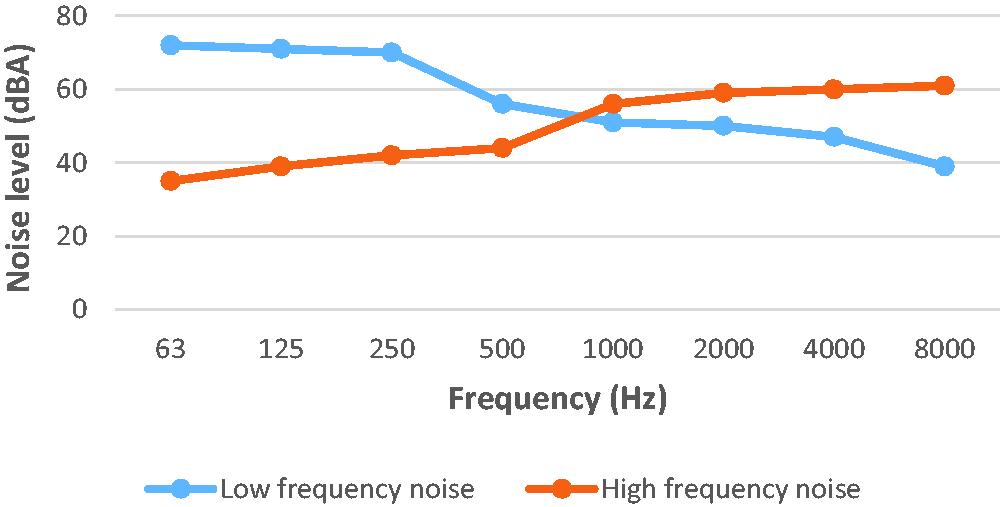
Frequency content of studied noises.
The personality traits of students were determined by the Eysenck Personality Inventory (EPI) in a validated version for Iran. 16 This questionnaire contained 57 binary (yes and no) questions. In the questionnaire, 24, 24 and 9 items were assigned to determine extraversion, neuroticism and subject’s sincerity, respectively. Based on the questionnaire scoring manual, if the matched responses with manual were higher than 12 in extraversion, the students were considered as extrovert and otherwise they were considered as introvert. In the same way, if the matched responses with manual were higher than 10 in neuroticism, the students were considered as neurotic, otherwise they were considered as stable. Regarding the lie scale, if the matched responses were more than 4, the accuracy of the responses was considered as unreliable due to the lack of accuracy and honesty.
For the determination of noise annoyance, the ISO 15666 approach was applied. In this method, participants are requested to respond to the survey and express the degree of their annoyance due to the exposure to low- and high-frequency noise in the acoustic chamber (“Throughout this experiment you were exposed to the low or high frequency noise for 1 hour, how much were you annoyed?”). Respondents reported their annoyance on a scale of 0 (not at all annoyed) to 10 (extremely annoyed). According to the ISO 15666 recommendation, the degree of annoyance was classified into five categories comprising not at all annoyed (0–2), slightly annoyed (2–4), moderately annoyed (4–6), very annoyed (6–8) and extremely annoyed (8 to 10). 17
Noise sensitivity was evaluated by WNSS. Validity and reliability of Persian version of this questionnaire has been confirmed by Alimohammadi et al. (Cronbach’s alpha was 78.0). 18 Weinstein's noise sensitivity scale consists of 21 questions, where each question has six degrees, scored on the Likert Scale from completely agree (0) to completely disagree (5). The total score of the scale is obtained by adding-up the score of all the questions so that it varies from 0 to 105, and the higher score indicates higher sensitivity to the noise. The level of student's perception of loudness was evaluated by loudness perception scale. 19 In this scale, participants are asked to respond to the survey and express their perception of loudness of noise that they were exposed to. Respondents reported their loudness perception on a scale of 0 (not heard) to 6 (too loud). The amount of loudness perception was categorized into six categories including not heard (0), very soft (1), soft (2), comfort (3), loud (4), very loud (5) and too loud (6). Loudness perception displays the degree of the loudness that an individual perceives. The degree of loudness perception varies based on the frequency of the noise and how it follows the equal-loudness contours.
Background and demographic information such as: age, gender, education level and awareness of adverse effects of exposure to noise were gathered through a sociodemographic questionnaire developed by the authors.
Statistical analyses
The data gathered in the study were entered and analyzed using SPSS Ver20. The independent samples T test 20 was applied for comparison of sensitivity, annoyance and loudness perception between stable and neurotic, and extrovert and introvert. This test compares the means of one variable in two independent groups to determine whether there is statistical evidence that the related means are significantly different. 20
The paired-samples T test 20 was used for comparison of dependent variables in terms of personality trait groups. This test compares two means that are from the same individual. Multivariate analysis of covariance (MANCOVA) test 20 was applied to investigate simultaneous effects of personality traits on the dependent variables (annoyance, sensitivity and loudness perception). This test evaluates for statistical differences of multiple continuous dependent variables by an independent grouping variable, while controlling for a third variable called the covariate. 20 Finally, multivariate regression analysis was conducted to study the effect of personality traits on the dependent variables.
Results
This study was conducted among 80 BSc and MSc students of Mazandaran University of Medical Sciences, Iran. Among the participants, 35 (43.8%) were BSc students and 45 (56.2%) were MSc students. Based on the results of the EPI, participants were categorized into four groups, namely introvert (46 students), extrovert (34 students), stable (50 students) and neurotics (30 students). Among the students, 17 (21.3%), 35 (43.7%) and 28 (35%) had low, moderate and high knowledge of adverse health effects of noise exposure, respectively. In this study, there were equal number of male and female participants, 31 (38.8%) were single and 49 (61.2%) were married.
The mean and standard deviation of the participant’s age were 25.66 ± 1.55. The mean and standard deviation of sensitivity, annoyance and loudness perception of all individuals who were exposed to low-frequency noise were 55.48 ± 4.81, 8.46 ± 0.89 and 4.32 ± 1.04, respectively. The mean and standard deviation of sensitivity, annoyance and loudness perception of all participants who were exposed to the high-frequency noise were 54.17 ± 7.68, 7.02 ± 1.52 and 2.78 ± 1.15, respectively. The paired-samples T test was used for comparison of these variables. The results indicated that there was a significant difference between annoyance and perception of low-frequency noise in comparison to annoyance and perception of high-frequency noise, but no significant difference was seen between sensitivity to low- and high-frequency noise.
Table 1 presents the mean and standard deviation of sensitivity to high-frequency noise (SHFN), annoyance due to high-frequency noise (AHFN), loudness perception of high-frequency noise (LPHFN), sensitivity to low-frequency noise (SLFN), annoyance due to low-frequency noise (ALFN) and loudness perception of low-frequency noise (LPLFN) in terms of personality traits groups. The results thus obtained reveal that all dependent variables in both groups of noise exposure were greater among the introvert compared to the extrovert and, greater among the neurotic compared to stable.
Mean ± SD of SLFN, ALFN, LPLFN, SHFN, AHFN and LPHFN in terms of personality traits groups.
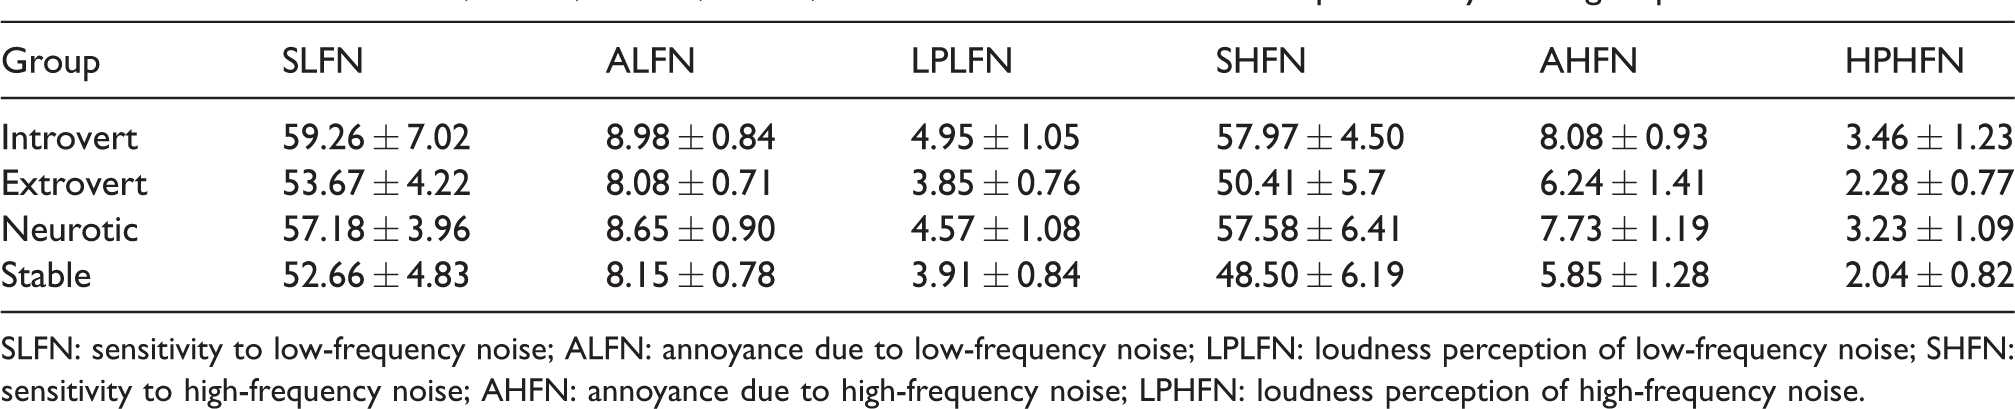
SLFN: sensitivity to low-frequency noise; ALFN: annoyance due to low-frequency noise; LPLFN: loudness perception of low-frequency noise; SHFN: sensitivity to high-frequency noise; AHFN: annoyance due to high-frequency noise; LPHFN: loudness perception of high-frequency noise.
The independent samples T test was applied for comparison of sensitivity, annoyance and loudness perception between stable and neurotic, and between extrovert and introvert. The results thus obtained are shown in Table 2. It is noted that SHFN, AHFN and LPHFN in stable individuals were statistically different from sensitivity, annoyance and loudness perception induced by exposure to high-frequency noise in neurotic individuals. Moreover, it is noted that SLFN, ALFN and LPLFN in stable individuals were statistically different from sensitivity, annoyance and loudness perception induced by exposure to low frequency noise in neurotic individuals. Moreover, these dependent variables were statistically different between the extroverts and the introverts. More details are presented in Table 2.
Comparison of sensitivity, annoyance and loudness perception among personality trait groups.
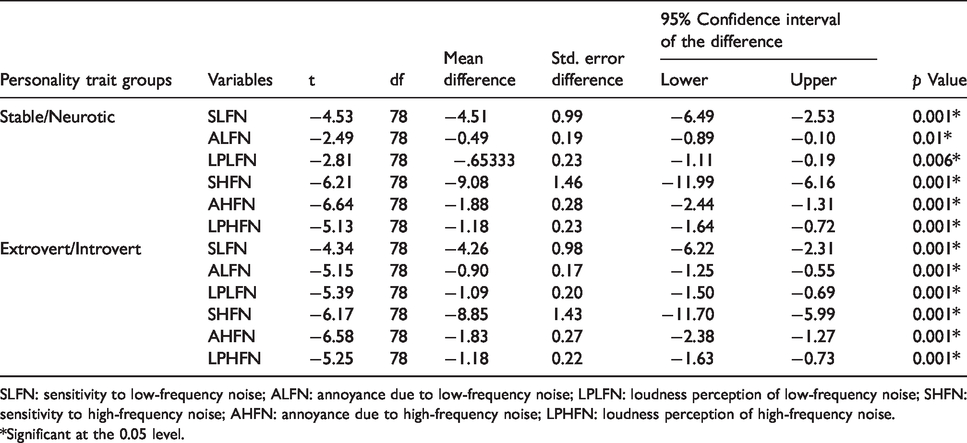
SLFN: sensitivity to low-frequency noise; ALFN: annoyance due to low-frequency noise; LPLFN: loudness perception of low-frequency noise; SHFN: sensitivity to high-frequency noise; AHFN: annoyance due to high-frequency noise; LPHFN: loudness perception of high-frequency noise.
*Significant at the 0.05 level.
The paired-samples T test was used for comparison of dependent variables in terms of personality trait groups. The results indicated that there was a significant difference between annoyances from low-frequency noise and high-frequency noise in all personality trait groups. The same results were obtained for loudness perception. Based on the results of paired-samples T test, SHFN was significantly different from SLFN in extrovert and stable participants, but no significant difference was seen in case of introvert and neurotic participants. These results are presented in |Table 3.
Paired comparison of sensitivity to high-frequency noise (SHFN) with sensitivity to low-frequency noise (SLFN), annoyance due to high-frequency noise (AHFN) with annoyance due to low-frequency noise (ALFN) and loudness perception of high-frequency noise (LPHFN) with loudness perception of low-frequency noise (LPLFN) in terms of personality trait groups.
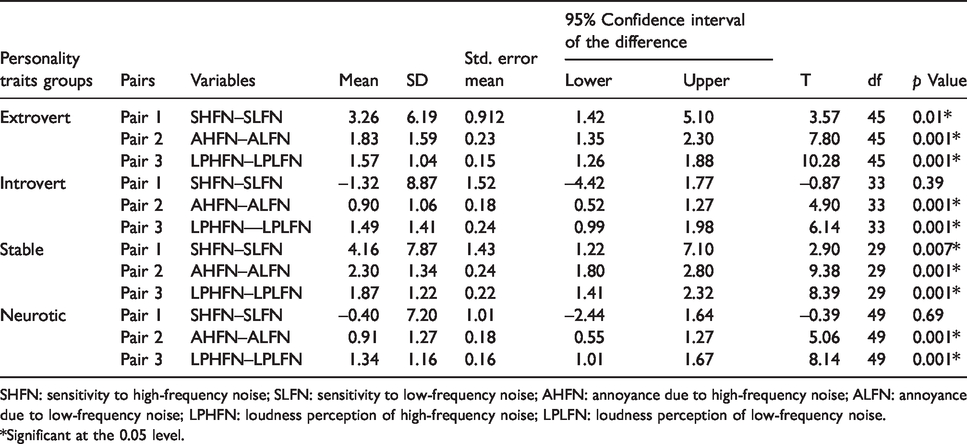
SHFN: sensitivity to high-frequency noise; SLFN: sensitivity to low-frequency noise; AHFN: annoyance due to high-frequency noise; ALFN: annoyance due to low-frequency noise; LPHFN: loudness perception of high-frequency noise; LPLFN: loudness perception of low-frequency noise.
*Significant at the 0.05 level.
The MANCOVA test was applied to investigate simultaneous effects of personality traits on the dependent variables (SLFN, ALFN and LPLFN) in relation to low-frequency noise. The hypothesis of equality of covariance matrices of SLFN, ALFN and LPLFN, across different personality trait categories, was tested by Box’s M test. 21 Box's M test is a multivariate statistical test applied to assess the equality of multiple variance-covariance matrices. The test is usually applied to test the assumption of homogeneity of variances and covariances. Based on the result of the Box’s M test, hypothesis of equality of covariance for the dependent variables was not rejected as the covariance matrices were equal through the personality trait groups. Accordingly, Pillai’s Trace test 22 was applied to investigate the effects of personality traits on SLFN, ALFN and LPLFN. Pillai’s Trace test checks equality of covariance matrices of two p‐variate normal distributions with unknown mean vectors. The results of this test, as shown in Table 4, revealed that MANCOVA test was statistically significant. That is, personality traits have a significant effect on SLFN, ALFN and LPLFN.
Simultaneous effects of personality traits on sensitivity, annoyance and loudness perception in participants exposed to low-frequency noise.
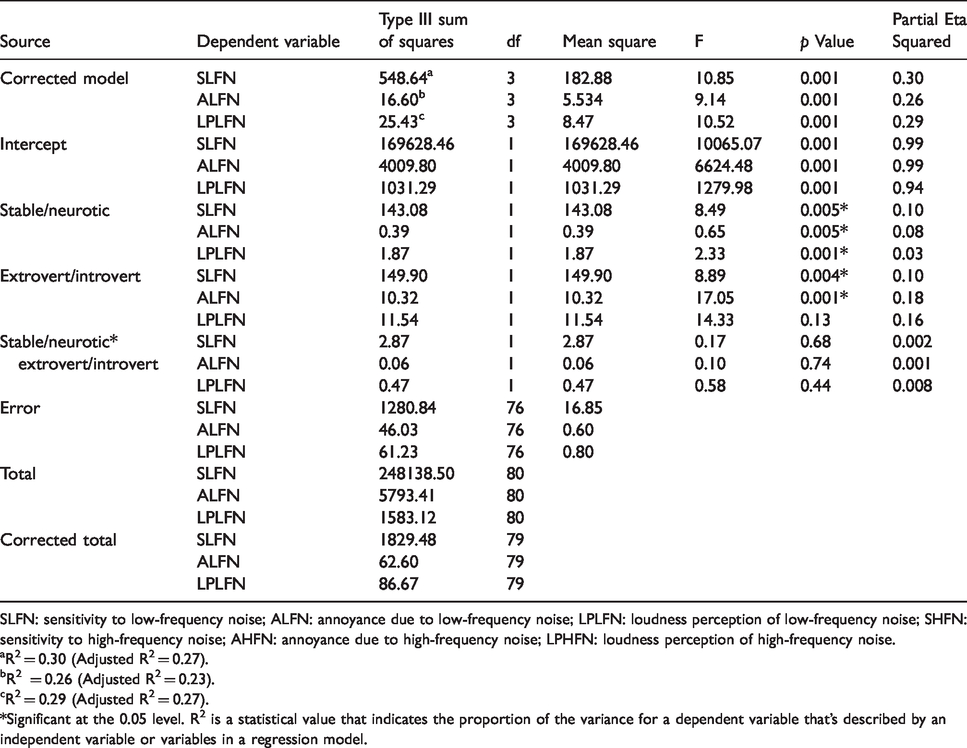
SLFN: sensitivity to low-frequency noise; ALFN: annoyance due to low-frequency noise; LPLFN: loudness perception of low-frequency noise; SHFN: sensitivity to high-frequency noise; AHFN: annoyance due to high-frequency noise; LPHFN: loudness perception of high-frequency noise.
R2 = 0.30 (Adjusted R2 = 0.27).
R2 = 0.26 (Adjusted R2 = 0.23).
R2 = 0.29 (Adjusted R2 = 0.27).
*Significant at the 0.05 level. R2 is a statistical value that indicates the proportion of the variance for a dependent variable that's described by an independent variable or variables in a regression model.
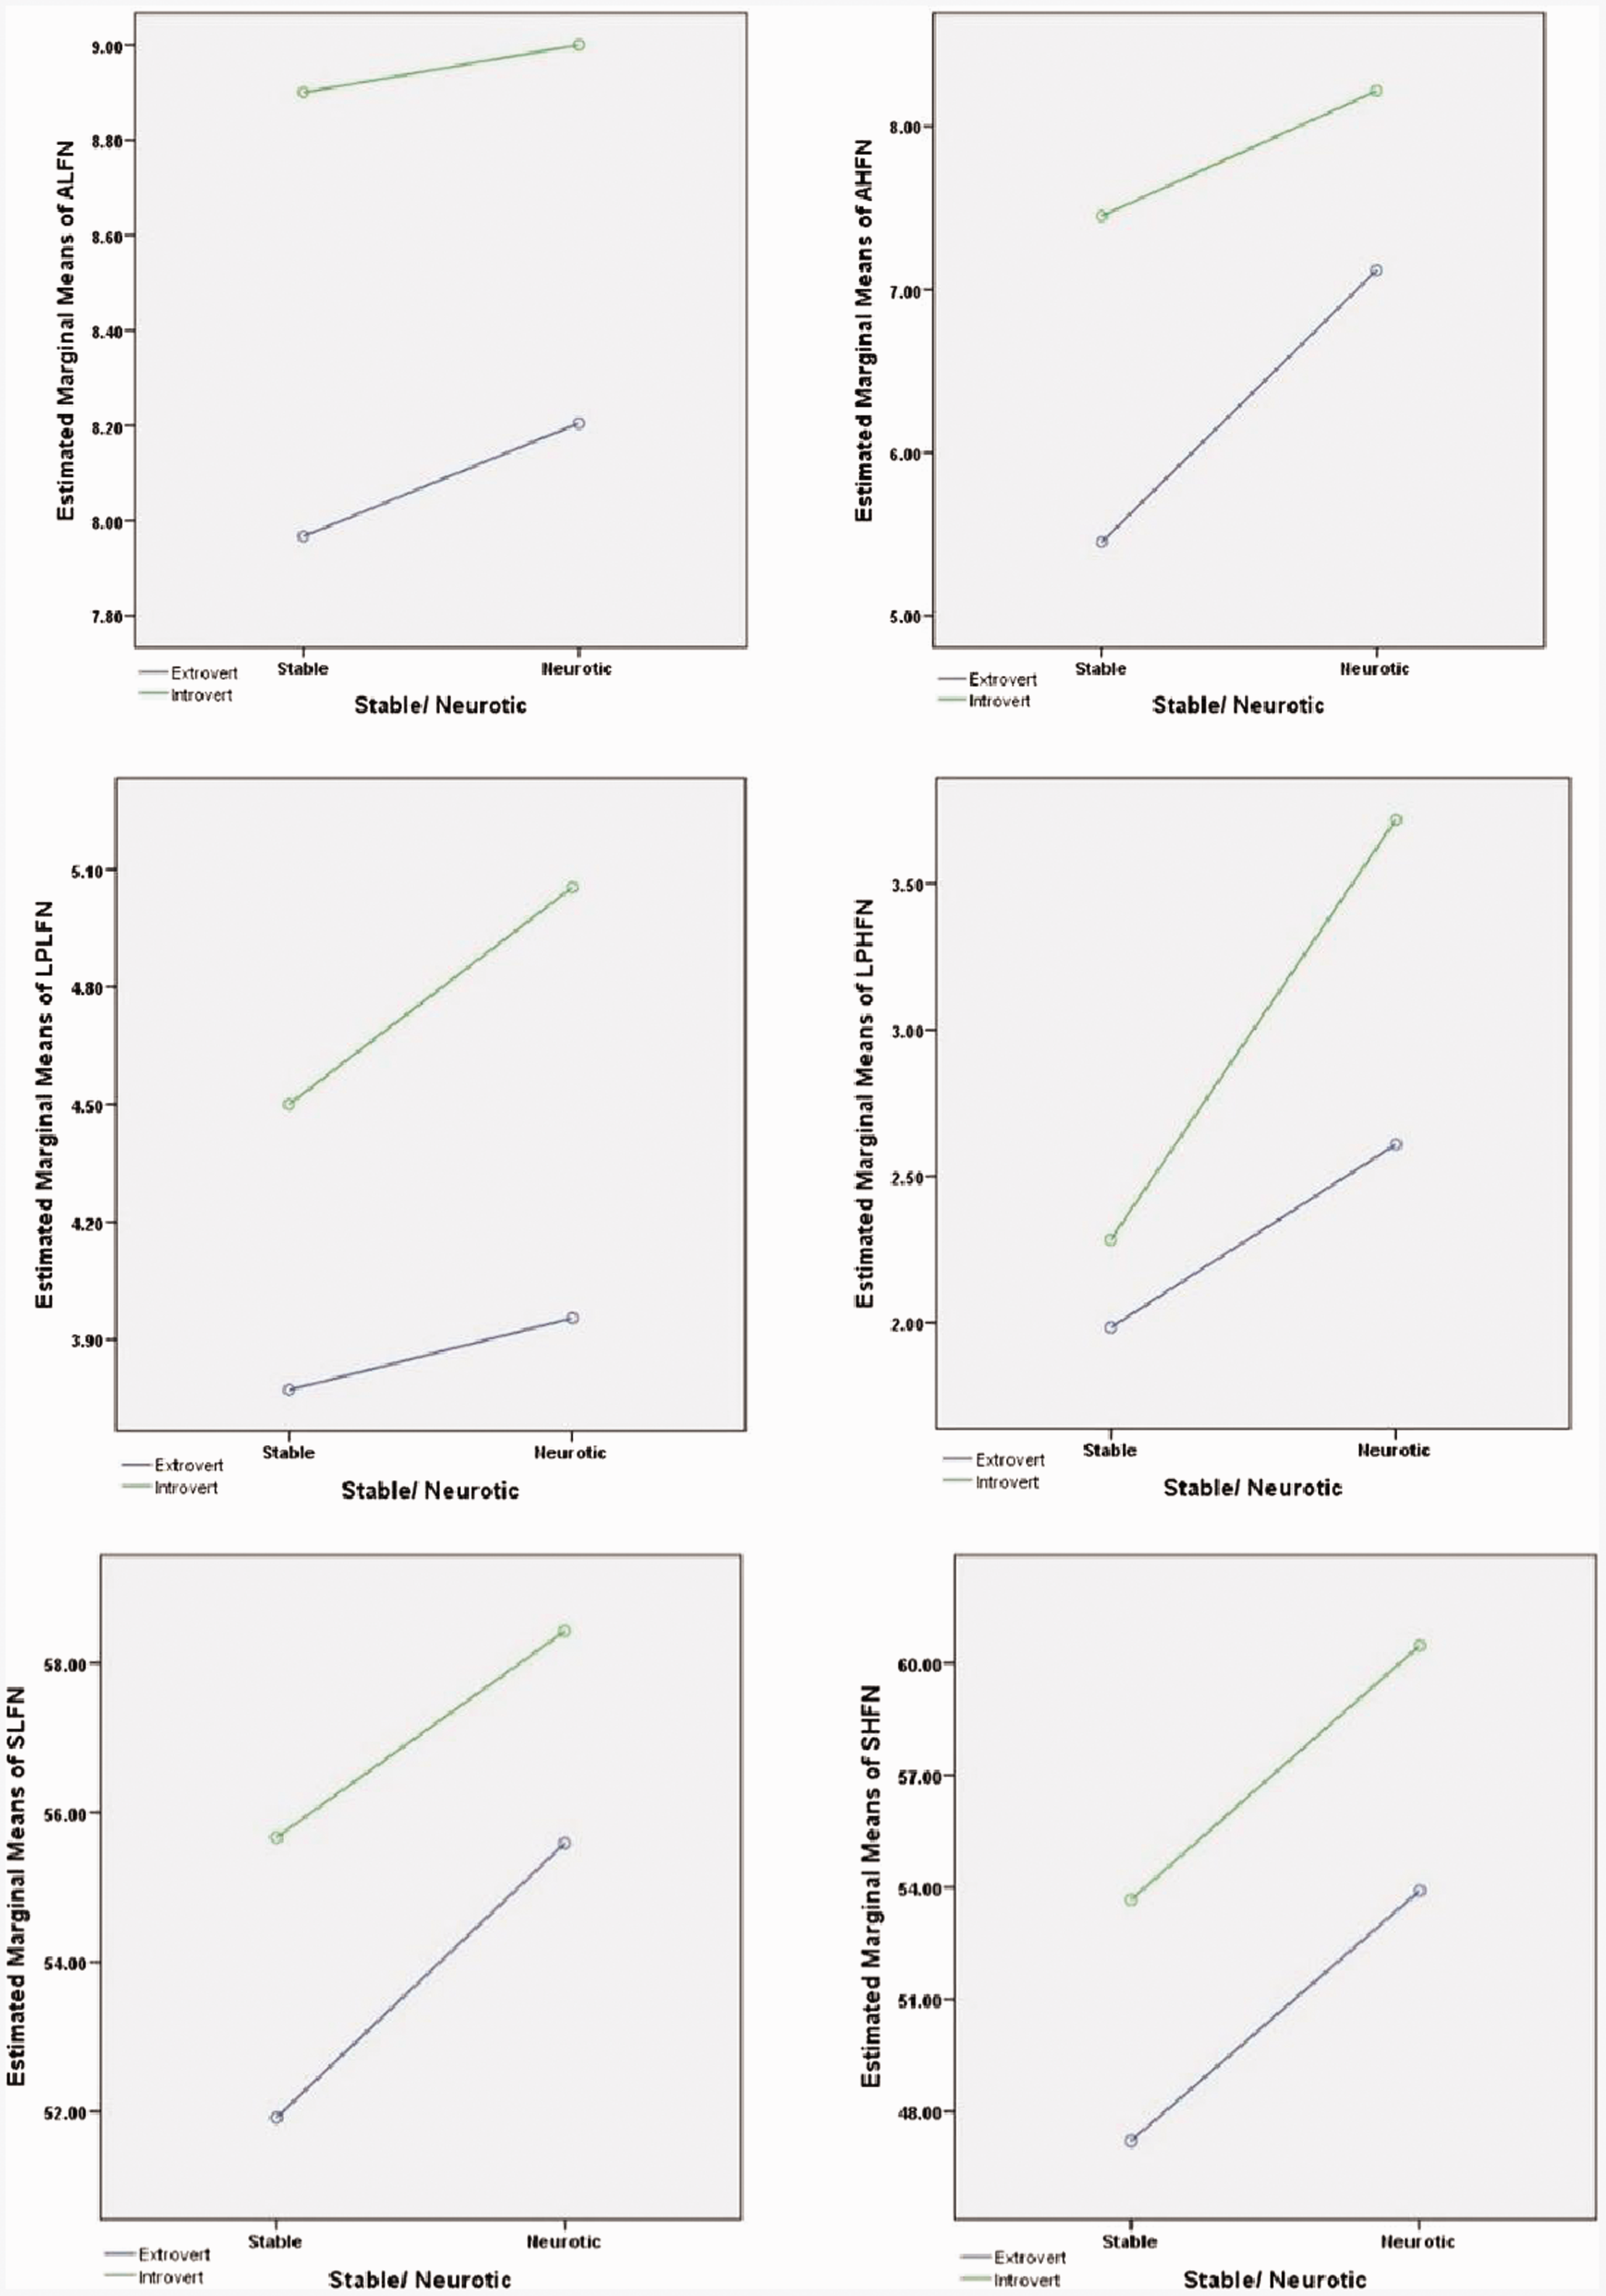
Based on the results of MANCOVA test (Table 4), SLFN, ALFN and LPLFN were influenced by stable/neurotic traits. Moreover, SLFN and ALFN were influenced by introvert/extrovert traits. The results of this test showed that variations of 30%, 26% and 29% in SLFN, ALFN and LPLFN, respectively, were justified by personality traits. Although introvert/extrovert and stable/neurotic traits have some effect on dependent variables, no interaction effects were found. Based on Partial Eta Squared (ratio of variance in an outcome variable explained by a predictor variable, after controlling for other predictors 23 ), it can be stated that SLFN (Partial Eta Squared equal to 0.10) is greatly affected by stable/neurotic compared to other two dependent variables. ALFN (Partial Eta Squared equal to 0.18) compared to SLFN and LPLFN was more affected by introvert/extrovert traits. These results also are presented in Figure 3.
Interaction of personality traits with sensitivity, annoyance and loudness perception in exposure to high-frequency noise.
The MANCOVA test was used to investigate simultaneous effects of personality traits on the dependent variables (SHFN, AHFN and LPHFN) in relation to high-frequency noise. The result of the Box’s M test showed that covariance matrices were equal across the personality trait groups thus, Pillai’s Trace test was used to investigate the effects of personality traits on SHFN, AHFN and LPHFN. The results of this test, as shown in Table 5, revealed that MANCOVA test was statistically significant. That is, personality traits have a significant effect on SHFN, AHFN and LPHFN.
Simultaneous effects of personality traits on sensitivity, annoyance and loudness perception in exposure to high-frequency noise.
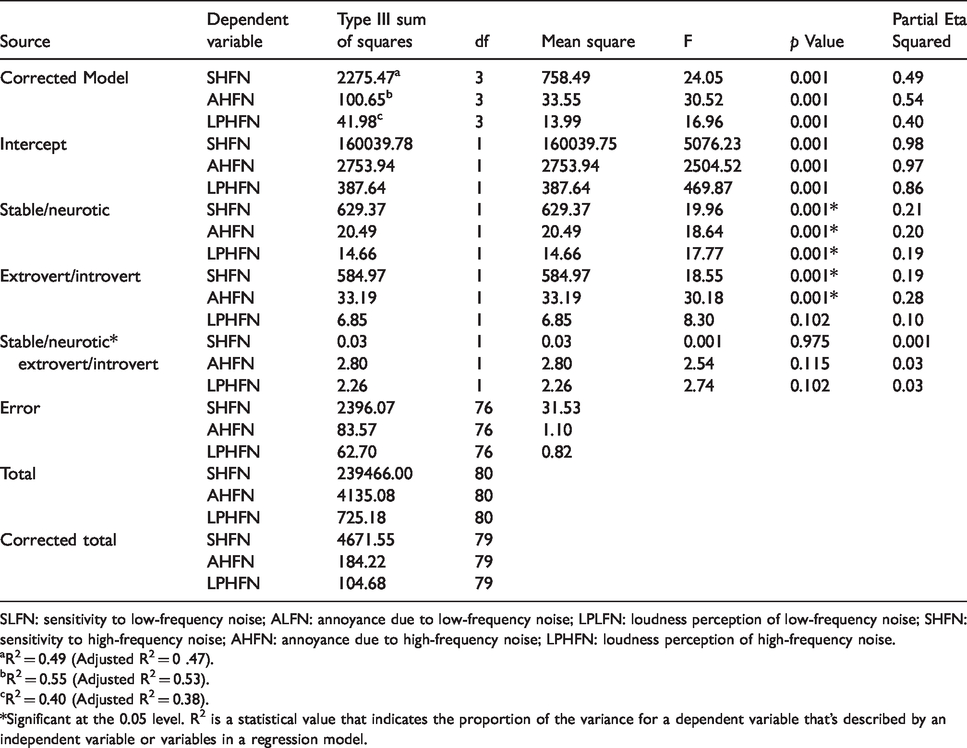
SLFN: sensitivity to low-frequency noise; ALFN: annoyance due to low-frequency noise; LPLFN: loudness perception of low-frequency noise; SHFN: sensitivity to high-frequency noise; AHFN: annoyance due to high-frequency noise; LPHFN: loudness perception of high-frequency noise.
R2 = 0.49 (Adjusted R2 = 0 .47).
R2 = 0.55 (Adjusted R2 = 0.53).
R2 = 0.40 (Adjusted R2 = 0.38).
*Significant at the 0.05 level. R2 is a statistical value that indicates the proportion of the variance for a dependent variable that's described by an independent variable or variables in a regression model.
The obtained results related to the investigation of the simultaneous effect of personality traits on SHFN, AHFN and LPHFN were the same as obtained for exposure to low-frequency noise.
Comparison of results in Tables 4 and 5 show that variations of 30%, 26% and 29% in SLFN, ALFN and LPLFN, respectively, were justified by personality traits, but the justified variations of 49%, 55% and 40% in SHFN, AHFN and LPHFN, respectively, were related to personality traits. Accordingly, it can be concluded that personality traits are more effective on SHFN, AHFN and LPHFN than on SLFN, ALFN and LPLFN. These results also are presented in Figure 3.
Based on the results of multivariate regression analysis, the increased score of introversion could decrease SHFN by the effect size of –0.216. Introversion had no significant effect on SLFN (p value = 0.439). The results showed that neuroticism has a significant effect on SLFN (0.358) and SHFN (0.621) and the effect was greater on high-frequency noise.
The regression analysis results showed that introversion had no significant effect on ALFN (p value = 0.108) and AHFN (p value = 0.269). As well as, neuroticism had a significant effect on AHFN (0.501) and ALFN (0.249). A similar result was obtained for LPLFN and LPHFN. Detailed results are presented in Table 6.
Effect of neurosis and introversion on sensitivity, annoyance and loudness perception.
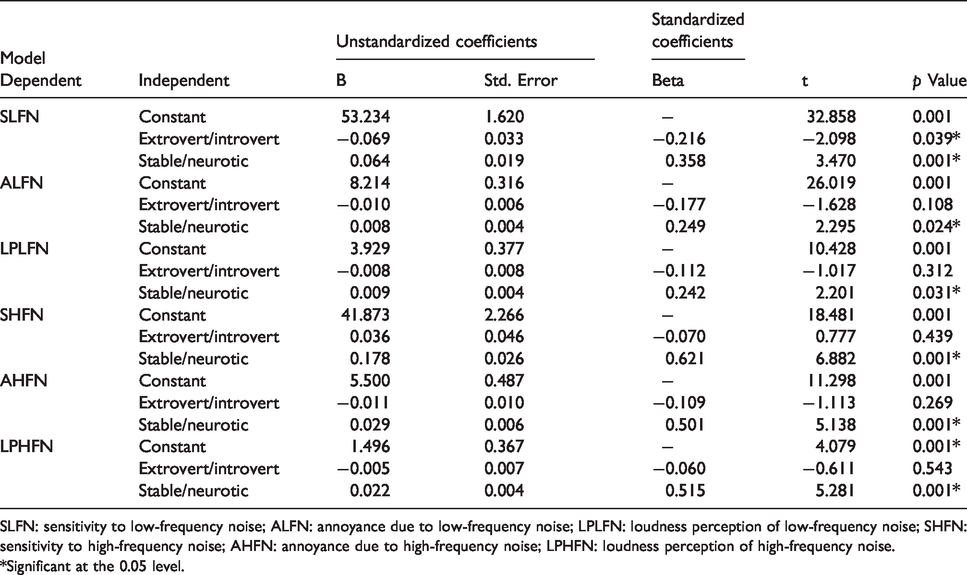
SLFN: sensitivity to low-frequency noise; ALFN: annoyance due to low-frequency noise; LPLFN: loudness perception of low-frequency noise; SHFN: sensitivity to high-frequency noise; AHFN: annoyance due to high-frequency noise; LPHFN: loudness perception of high-frequency noise.
*Significant at the 0.05 level.
Discussion
Noise sensitivity and personality traits
This study was conducted to carry out a comparative assessment of the effects of low- and high-frequency noise on humans in relation to personality traits. Based on the results of this study, mean ± SD of SLFN and SHFN was 55.48 ± 4.81 and 54.17 ± 7.68, respectively. This shows that sensitivity is not influenced by type of noise or noise exposure. Noise sensitivity in exposure to low-frequency noise is slightly more than that in exposure to high-frequency noise but the difference is not significant. This is in line with the study reported by Miedema and Vos 24 and others in the literature. Although Miedema and Vos 24 found a very weak positive relationship, other studies have shown that noise sensitivity has no association with noise exposure. 25 Although in the study of Miedema and Vos 24 noise sensitivity has shown a weak correlation with noise exposure, it does not appear to be an accurate result as Heinonen et al. 26 has reported that noise sensitivity has a strong genetic constituent and Belojevic and Jakovljevic 25 has claimed that noise sensitivity is a personality variable independent of exposure to noise. Therefore, it can be assumed that the positive relationship between sensitivity and noise exposure in the study reported by Miedema and Vos 24 may be due to differences in personal factors such as personality traits, health status and hearing problems in some frequency spectra. This is confirmed by the results presented in Table 2, where it was found that sensitivity to noise was different between neurotics and stables and also between introverts and extroverts. These results thus show that personality traits have significant effect on the changes in sensitivity to noise. Belojevic and Jakovljevic 25 have reported that noise sensitivity has significant positive correlation with neuroticism. It has further been confirmed by various research works that people with neurotic symptom are more sensitive to noise and show more adverse health effects of exposure to noise compared to further stable traits.8,25,27 The results of the current study are consistent with those reported previously as it is shown (Tables 1 and 2) that sensitivity in neurotics (57.18 ± 3.96) was noticeably greater compared to stable participants (52.66 ± 4.83). These results are justified by the fact that neuroticism is followed by several symptoms, including anxiety, instability and aggressiveness, and it is reported that these personality behaviours can avert effective coping ability with risk factors. 28 Therefore, neurotic people may be vulnerable and sensitive to noise as a risk factor. This result can be explained by arousal theoretical concept that a neurotic individual is prone to display a greater basic arousal level compared to further stable person because the central nervous system of neurotics people is usually excited to some extent. 29 On the other hand, it has reported that neurotic people tend to maintain their privacy and are not comfortable in social situations, and for this reason it makes them more sensitive to noise and they show a more negative reaction to stressors such as noise. 30 In general, it can be concluded that noise exposure has no effect on noise sensitivity by itself, however, personality traits have a significant effect on the sensitivity to noise. Thus, the results of this study and other studies7,31 have shown that noise sensitivity is higher in neurotic people and this personality trait is one of the predictors of audio sensitivity.
The results presented in Table 2 show that sensitivities to low-frequency noise were different in extroverts (53.67 ± 4.22) and introverts (59.26 ± 7.02). Moreover, the mean ± SD of sensitivities to high-frequency noise were significantly different in extroverts (50.41 ± 5.7) and introverts (57.97 ± 4.50). Based on these results, it is clear that sensitivity to noise of introverts was greater compared to that of extroverts in both high- and low-frequency noise. This result is congruent with the previous findings.7,31,32 It has suggested that the level of arousal is different between introverts and extroverts. 33 Individuals identified as introverts have a lower arousal threshold, therefore, they do not need more stimulus to be stimulated. In contrast extroverts have a higher arousal threshold and for this reason they are looking for stronger stimuli to be provoked. 33 Similarly, it is indicated that introvert students, due to high sensitivity to noise, tended to study in a quiet place while extrovert students tended to study in a place with higher level of noise compared to introvert ones. 34 Other researchers have reported that introverts have more sensitive hearing threshold 32 and extroverts prefer higher levels of noise. 35 Thus, the results of the present study and those mentioned above show that introverts are more sensitive to noise and it may be due to personality features such as lower hearing threshold, decreased coping ability and desire to be alone and isolated.
Annoyance and loudness perception and personality traits
The paired-samples T test was used for comparison of the annoyance and LPLFN exposure with the variables of high-frequency noise. The results indicated that there was a significant difference between annoyance and perception of low-frequency noise with annoyance and perception of high-frequency noise, but no significant difference was seen between sensitivities in low- and high-frequency noise. These results show that not only sensitivity to noise can mediate the noise effects on annoyance and loudness perception but also noise frequency is another affecting factor. These results are in line with the results of Prashanth and Sridhar, 36 who have shown that noise frequency components also constitute one of the main factors contributing to causing harmful health effects. It is known that various organs of the human body have associated resonance frequencies, and severity of resonance is higher at low and infrasound frequencies. 36 The high annoyance and perception of low-frequency noise is probably due to the unique characteristics of low-frequency noise such as tonal, pulse and intermittent. It is confirmed that these characteristics produce further annoyance compared to steady noise of equal intensity. 37 On the other hand, the probability of temporary threshold shift increases with the increase in noise frequency in the octave band. In other words, the probability of hearing loss is higher at higher frequencies.38,39 Thus, it can be concluded that students suffered from more temporary threshold shift after a 1-hour exposure to high-frequency noise, and therefore their loudness perception decreased and subsequently they reported lower noise annoyance. As previously mentioned, SLFN (55.48 ± 4.81) was somewhat higher than SHFN (54.17 ± 7.68). Thus, it can be stated that higher annoyance due to exposure to low-frequency noise may be due to higher auditory sensitivity of students to low-frequency noise exposure compared to high-frequency noise exposure, as reported by Monazzam et al. 6 that noise sensitivity acts as a mediator for causing noise annoyance. The inappropriateness of the dB(A) weighting as a weak predictor of annoyance induced by low-frequency noise can be another reason for justifying differences of AHFN and ALFN. 40
Based on the results presented in Tables 1 and 2, annoyance and perception of introverts and neurotics were significantly higher than annoyance and perception of extroverts and stable in both of the two exposure settings. In confirmation of the results of this study, Guski et al. 41 have expressed that in addition to acoustic features, personal and social factors act as mediators for annoyance. In this study, the effect of personality traits was assessed and the results showed that in equal energy severity and duration of exposure, personality trait and frequency contents have significant effect on annoyance. In the same way, researchers 3 have concluded that personality variable of neuroticism have significant positive relationship with noise annoyance. Earlier studies have confirmed that neurotics usually experience effects that are more negative and assess their situation more negatively.42,43 Therefore, it can be stated that neurotic students perceive noise louder and it is expected that they react to the noise more strongly and experience more annoyance. This issue is confirmed in previous research works where it has been shown that neurotic people perceive similar stimulus to be further stressful and show more intense reaction.44–46 Moreover, with regard to increased stress level in neurotic people, 47 it is reasonable to expect more annoyance due to exposure to noise. In general, it is understandable that students with neurotic traits perceive the noise louder compared to stable students in personality and, therefore, they react to the noise more intensively and experience more annoyance. Another explanation for increased loudness perception and annoyance due to exposure to low-frequency noise is individual attitude toward noise. Taylor et al. 48 have reported that attitude to noise has a substantial influence on noise perception. They also found that perception of noise significantly affects annoyance and other negative symptoms. 48
Simultaneous effects of personality
To investigate simultaneous effects of personality traits on annoyance, perception and sensitivity to both high- and low-frequency noise exposure, the MANCOVA test was used. Based on Partial Eta squared, it can be stated that neurotic personality trait has slightly greater effect on sensitivity compared to annoyance and perception in both noise exposure settings. Moreover, introversion personality trait affected noise annoyance slightly more than sensitivity and perception. It is noteworthy that introversion personality traits justified dependent variables more than neurotic personality trait in the low-frequency noise exposure. This result is in line with other studies,7,31 which have shown that introversion traits are better predictors of annoyance and sensitivity. Thus, the mean value of dependent variables was greater in introvert and neurotic students compared to the extrovert and stable ones. It was expected that introvert and neurotic personality traits have a synergistic effect on dependent variables, but MANCOVA test results showed that there is no interaction effect of personality traits (extrovert/introvert and neurotic/stable) on annoyance, sensitivity and loudness.
Based on the results of Table 6, it can be stated that SHFN compared to SLFN is more dependent on personality traits. In other words, it can be asserted SLFN is increased while the individual's introversion trait is increased. Considering this result, it has suggested that the level of arousal is different between introverts and extroverts. 33 Individuals identified as introverts have a lower arousal threshold, therefore, they do not need more stimulus to be stimulated. In contrast, extroverts have a higher arousal threshold and for this reason they are looking for stronger stimuli to be provoked. 33 Based on the results, neuroticism had greater effect on SHFN compared to that of SLFN. It has been confirmed by various research works that people with neurotic symptom are more sensitive to noise and show more adverse health effects of exposure to noise compared to further stable traits.8,25,27 This result can be explained by Broadbent's arousal theoretical concept that a neurotic individual is prone to display a greater basic arousal level compared to further stable person because the central nervous system of neurotics people is usually excited to some extent. 29
As well as, neuroticism had a significant effect on AHFN (0.501) and ALFN (0.249). A similar result is obtained for LPHFN and LPLFN. Earlier studies have confirmed that neurotics commonly experience more negative effects.42,43 It can be stated that neurotics perceive the noise louder compared to stable individuals and in turn they respond to the noise more seriously and suffer more annoyance. Taylor et al. 8 indicated that neuroticism can positively affect noise annoyance. As well as, Schneider concluded that neuroticism has significant effect on psychological and physiological stress responses. 46
Conclusion
Compared to previous studies, a prominent feature of this study is that the confounders have been eliminated and the study has been conducted in a controlled laboratory environment. Moreover, it is worth mentioning that low- and high-frequency noises were compared in a constant and stable condition, therefore the results are more reliable. Thus, the results of this study add to the current knowledge on the interaction of intrinsic characteristics, personality and acoustic characteristics. Conclusively, the results of the present study have shown that, although noise level has a meaningful effect on annoyance and loudness perception, these variables are affected by personality traits and frequency components. Based on the results obtained it can be concluded that high-frequency noise exposure has greater effect on dependent variables compared to exposure to low-frequency noise. In case of personality traits, response variables are affected by neuroticism and introversion more than stable and extroversion.
Supplemental Material
sj-pdf-1-lfn-10.1177_1461348420945818 - Supplemental material for Effect of personality traits on sensitivity, annoyance and loudness perception of low- and high-frequency noise
Supplemental material, sj-pdf-1-lfn-10.1177_1461348420945818 for Effect of personality traits on sensitivity, annoyance and loudness perception of low- and high-frequency noise by Milad Abbasi, Mohammad Osman Tokhi, Mohsen Falahati, Saeid Yazdanirad, Maryam Ghaljahi, Siavash Etemadinezhad and Roghayeh Jaffari Talaar Poshti in Journal of Low Frequency Noise, Vibration and Active Control
Footnotes
Declaration of conflicting interests
The author(s) declared no potential conflicts of interest with respect to the research, authorship, and/or publication of this article.
Funding
The author(s) disclosed receipt of the following financial support for the research, authorship, and/or publication of this article: This article is extracted from Master’s Thesis No.2741. The authors would like to acknowledge the financial support of Mazandaran University of medical sciences for this research (Ethical approval ID:IR.MAZUMS.REC.1397.2741).
References
Supplementary Material
Please find the following supplemental material available below.
For Open Access articles published under a Creative Commons License, all supplemental material carries the same license as the article it is associated with.
For non-Open Access articles published, all supplemental material carries a non-exclusive license, and permission requests for re-use of supplemental material or any part of supplemental material shall be sent directly to the copyright owner as specified in the copyright notice associated with the article.