
Abstract
During the production process of the components of precision machines, a stable quality is the key consideration of the vendors. During the production process of metal parts, a thermal expansion error of the spindle will occur due to long time operations, which causes machining errors during the production process. The chatter phenomenon that occurs during the production of components causes knife marks on the processing surface. Thus, chatter is also a major factor that affects the stability of quality. The occurrence of chatter phenomenon not only affects the quality of metal components, it also causes severe wear of the blade surface and shortens the life of the knife tool, and makes the cutting quality more difficult to control. Therefore, this paper uses the lathe machine to simulate the production process in the factory, to collect signals of the thermal expansion error of the spindle phenomenon and the coexistence of chatter, for timely compensation of the thermal expansion error and the development of the chatter suppression system, while spending extra efforts to implement real-time dynamic detection with the Lorenz chaotic system and applying spindle speed selection to control the chatter phenomenon, thus enhancing the processing quality and lengthening the longevity of the knife tool. As for the compensation of temperature, the system applies multi-regression analysis to detect the front and rear bearings of the spindle and room temperature and to compensate the error of the spindle in real time. The system takes real-time control of the chatter phenomenon and compensation of long-time thermal expansion error as its core architecture, while the secondary architecture combines the Internet of Things with Skymars to enable the machine to stabilize communication and to combine with heterogeneous machines such as robotic arm, milling machine, and grinding machine. It is a framework with horizontal development and establishes a database to record the critical value of the occurrence of chatter and implement two-time quality detection, achieving management of the production line, improvement of quality, and cloud information storage.
Keywords
Introduction
Machine tool is an essential equipment for the production of metal components, while lathe and milling machines are the major ones. Therefore, the stability of the quality of the mechanical parts affects the stability of the follow-up product application. The common problems of lathe and milling machines during processing are chatter phenomenon and thermal expansion error of the spindle. Since the market becomes more and more demanding on the stability of a machine tool, in order to enhance productivity and competitiveness, people now pay more attention on the issue of spindle thermal error. Especially for the extra precision processing products, thermal error1,2 is the key factor for deviation. Hence this paper explores how to enhance the processing quality while the product is manufacturing at the front end. The spindle will have thermal expansion error phenomenon since the beginning of its operation, while the rotation speed of the spindle, feed speed, depth of cutting, types of blades, etc. are all the factors that affect the level of thermal error. Thermal error phenomenon will reduce the accuracy of processing and lead to poor quality. The main reason for the occurrence of thermal error phenomenon is because of friction between the bearings3–5 which generates heat.6,7 Deflection occurred when the bearings are heated, which accounts for 30–50% 8 of the total deflection. In order to enhance the quality and precision of processing, this study introduces temperature sensing device on the front and rear bearings of the spindle and carried out long-term data collection under 1000, 2000, 3000, and 4000 r/min operating conditions. Afterward, the study uses multiple regression analysis to establish the thermal error model of the spindle.9,10 When the predicted value reaches the maximum tolerance of the deviation of the processing size, implement prediction of thermal error of the spindle when thermal error of the spindle occurs, 11 then compensate the thermal deformation amount and adjust the processing parameters, and then compensate the predicted deformation displacement value to enhance the precision and quality.
In order to enhance production capacity, high rotation speed and feed are usually used in processing to enhance output. During the production process, uncertain factors will cause chatter phenomenon.12–14 These factors include the materials of the workpiece, the architecture of the machine, and the processing parameters, and the torque declines when the spindle rotation speed increases. The chatter phenomenon occurred when the blade surface is dealing with the workpiece, and the depth of cutting 15 is not identical and resulted in a fluctuation of the cutting force and generates periodical variations. Thus, it generates ripples on the surface of the workpiece, and fluctuations of the cutting force make the loading of the motor fluctuated and shorten the service life of the motor. Moreover, when the workpiece is processing under fluctuated cutting force, the processing quality of the workpiece will be unstable. In order to enhance the stability of quality, the chatter suppression system is developed. However, when the occurrence of chatter is under different choices of blade and processing material, the data of the cutting test will have different results, hence the uncertainty factors of the occurrence of chatter are very complicated. In order to reduce the uncertainty, the chaotic theory is used for signal analysis and followed by the development of the chatter critical suppression system. As for the core algorithm, in order to judge the chatter phenomenon immediately, it applies the Lorenz chaotic system to analyze and predict the signals. When the system detects the threshold of chatter, many researchers propose to adjust the parameter of rotation speed of the spindle6–19 to implement chatter suppression. Most of the people use spindle speed selection (SSS) and spindle speed variation (SSV) to change the rotation speed of the spindle. The SSS applies spindle-rated rotation speed adjustment to suppress the chatter threshold. This study will explain this suppression rule in detail and compare the advantages and disadvantages of this suppression rule with the SSV suppression method.
In coping with the convenience that generated from technologies and the needs of industry, the Skymars system is the system that has the most choice for heterogeneous machine connection. Therefore, the communication architecture of this system uses the Skymars system as the communication bridge, which enables the system to implement chatter suppression and compensate the thermal expansion error on heterogeneous machines. In addition, the system combines the applications of Internet of Things technology and database, which enables the system to be developed horizontally and upgrade the machine-networking equipment, hence the system can monitor and control the heterogeneous machine production line. The establishment of the database enables the information of the machines to become cloud-based.
Method
Experimental architecture and environment settings
When the digital controller is started, the Skymars system is used as the communication architecture of the digital controller to monitor the parameters of the controller. When the spindle is running, the acceleration sensor is integrated with the temperature sensor (DS18B20) and (Arduino Uno) the control panel to capture all kinds of model signals of the spindle. The spindle vibration signal is analyzed by the Lorenz chaotic system. When the chatter threshold is generated, start the SSS to compensate the processing parameters immediately. At the same time, implement the temperature multiple regression analysis, monitor the thermal changing amount, and predict the compensation of thermal error amount. When the thermal expansion error of the spindle occurs, it compensates the processing parameters. When chatter and error amount occur, the database will capture the data for review and analysis, as shown in Structure Chart Figure 1.
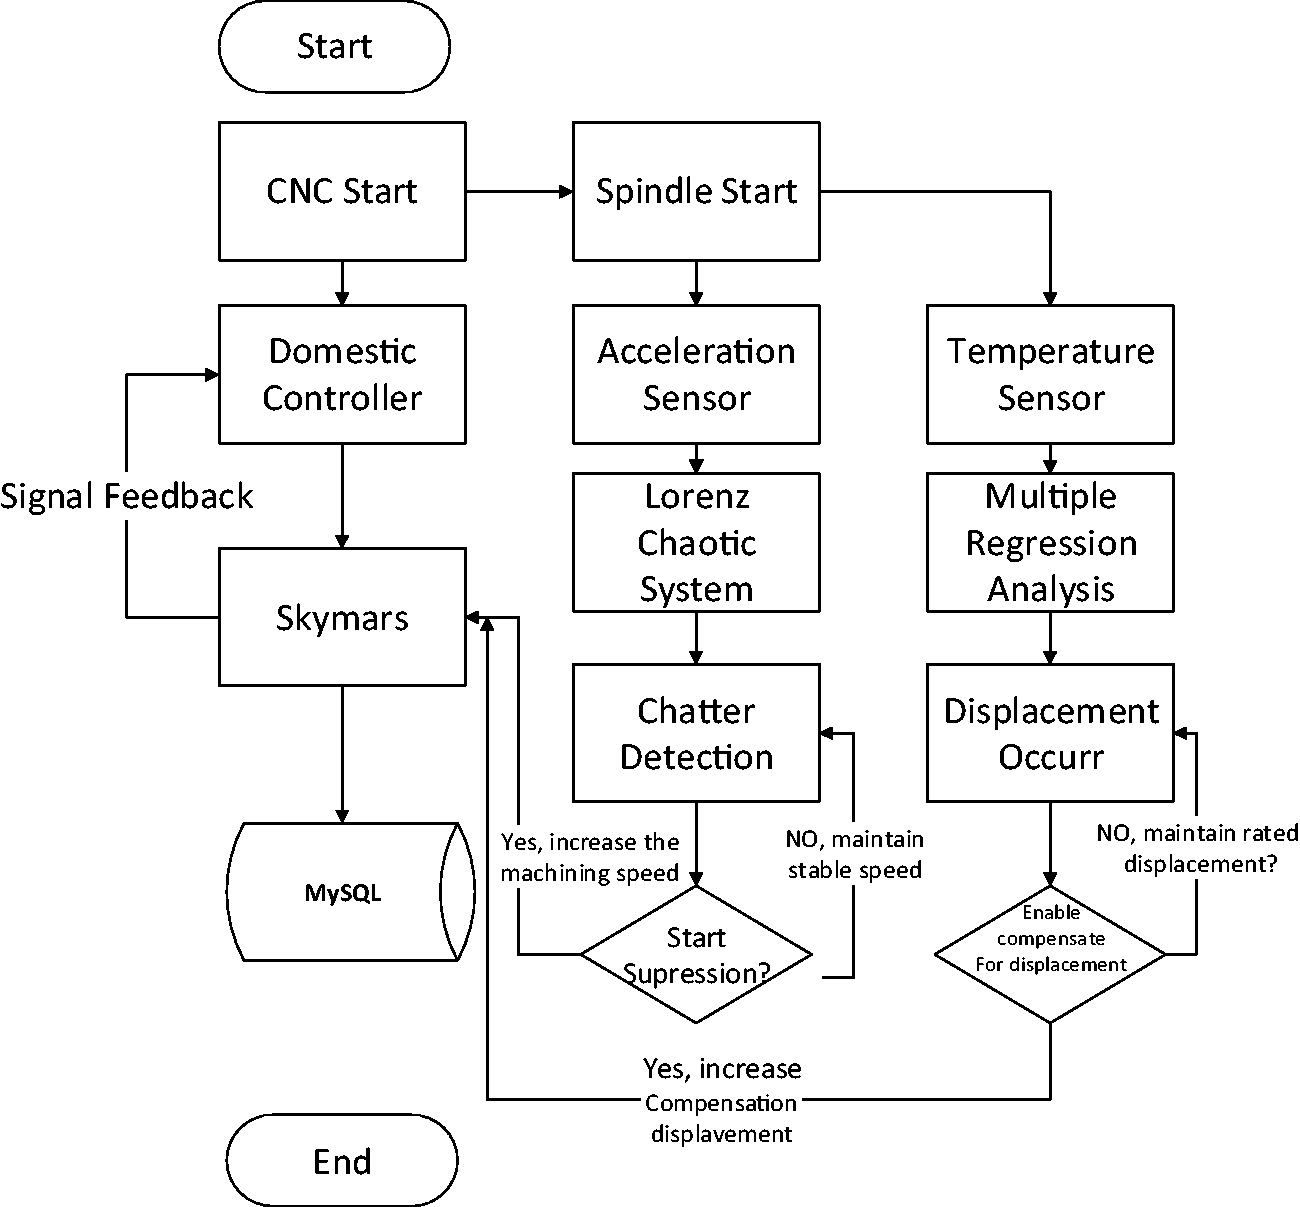
Structure chart.
The hardware and sensors that are used in this study are shown in Figure 2: (a) Arduino Uno Rev3; (b) temperature sensor; (c) lathe digital control machine; (d) vibration signal capture card; (e) accelerometer; (f) three-dimensional measuring instrument; and (g) surface roughness meter. The major part of the lathe tool machine is model MC4200 and reaches maximum torque when the spindle is at the speed of 1500 r/min and the torque is 35.8 Nm. In addition, the maximum rotation speed of the machine tool is 6000 r/min, and the temperature sensors apply 2DS18B20 and are embedded in the front main bearing, the rear bearing, the lateral side of the spindle motor, and the top of the lateral side of the lathe machine. Data are collected via Arduino Uno, while the spindle vibration signal is measured by the accelerometer (KS943B100). The range of vibration signal capturing is between 5 and 22,000 Hz, and the vibration signal is sampling via the capture card (NI 9234 + NI USB 9162). The maximum sampling rate is 51.2 kS/s. The data of the surface roughness of the processing workpiece that used in the experiment is collected by the surface roughness meter (SJ-420), with a resolution between 360 µm/0.02 µm and 25 µm/0.002 µm. The machining dimensions of the workpieces are measured by a three-dimensional measuring instrument (ZEISS Contura G2) for precision processing, and the deviation can be measured up to 1.5 + L/350 µm.
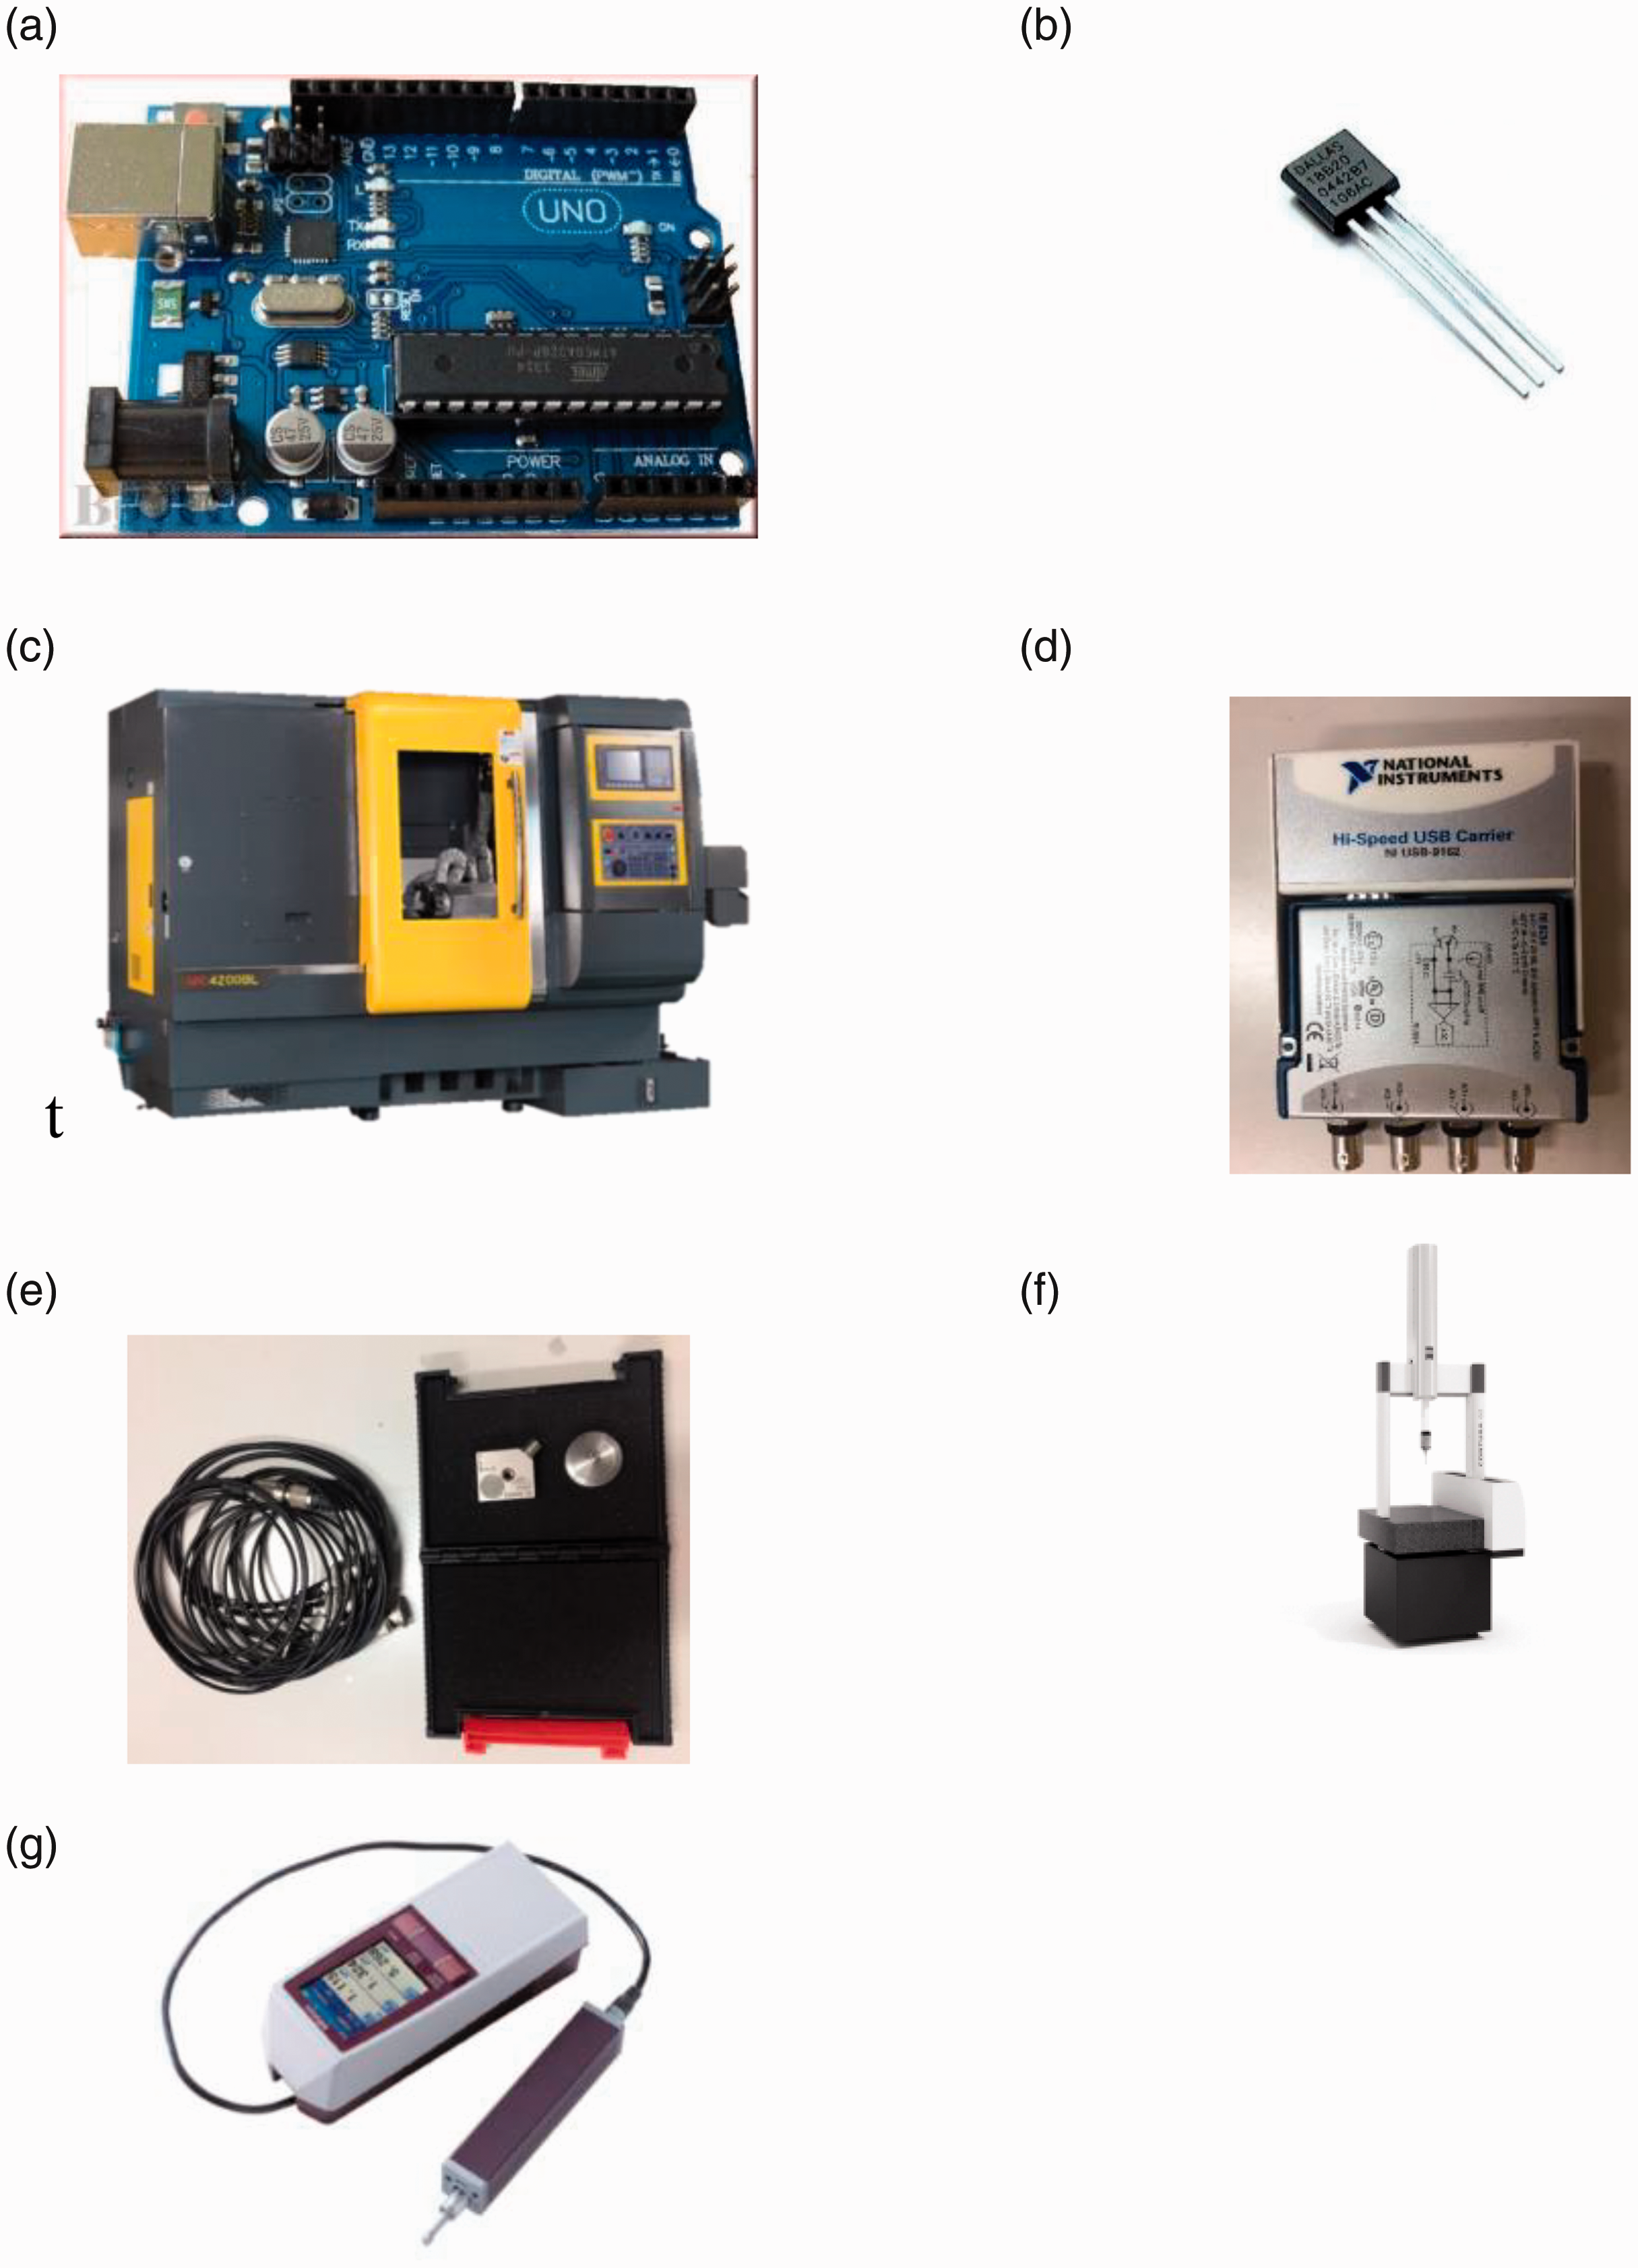
Diagram of actual hardware and sensor devices. (a) Arduino Uno Rev 3; (b) temperature sensor (2DS18B20); (c) lathe digital control machine; (d) vibration signal capture card; (e) accelerometer; (f) three-dimensional measuring instrument; (g) surface roughness meter.
Vibration suppression and displacement compensation
Vibration signal analysis
During the machining process of mechanical components, the chatter phenomenon occurs occasionally due to uncertain factors such as materials, machine architecture, processing parameters, etc. Therefore, the Lorenz chaotic system (Lorenz) is used for real-time signal analysis. Any kind of chaotic system will generate chaotic attractors, and the signal generates orderly but non-periodic motion tracks via chaotic attractors. When the signal changes, it generates great changes to the output of its model, for cutting signal the abnormal cutting vibration as high frequency jitter, while the normal cutting vibration as low frequency jitter which can significantly highlight the difference between high and low frequency in chaos system, then compares the data image discrimination with the deviation value of machining precision, to estimate the threshold of vibration. Figure 3 shows Map of Vibration Signal Distribution.
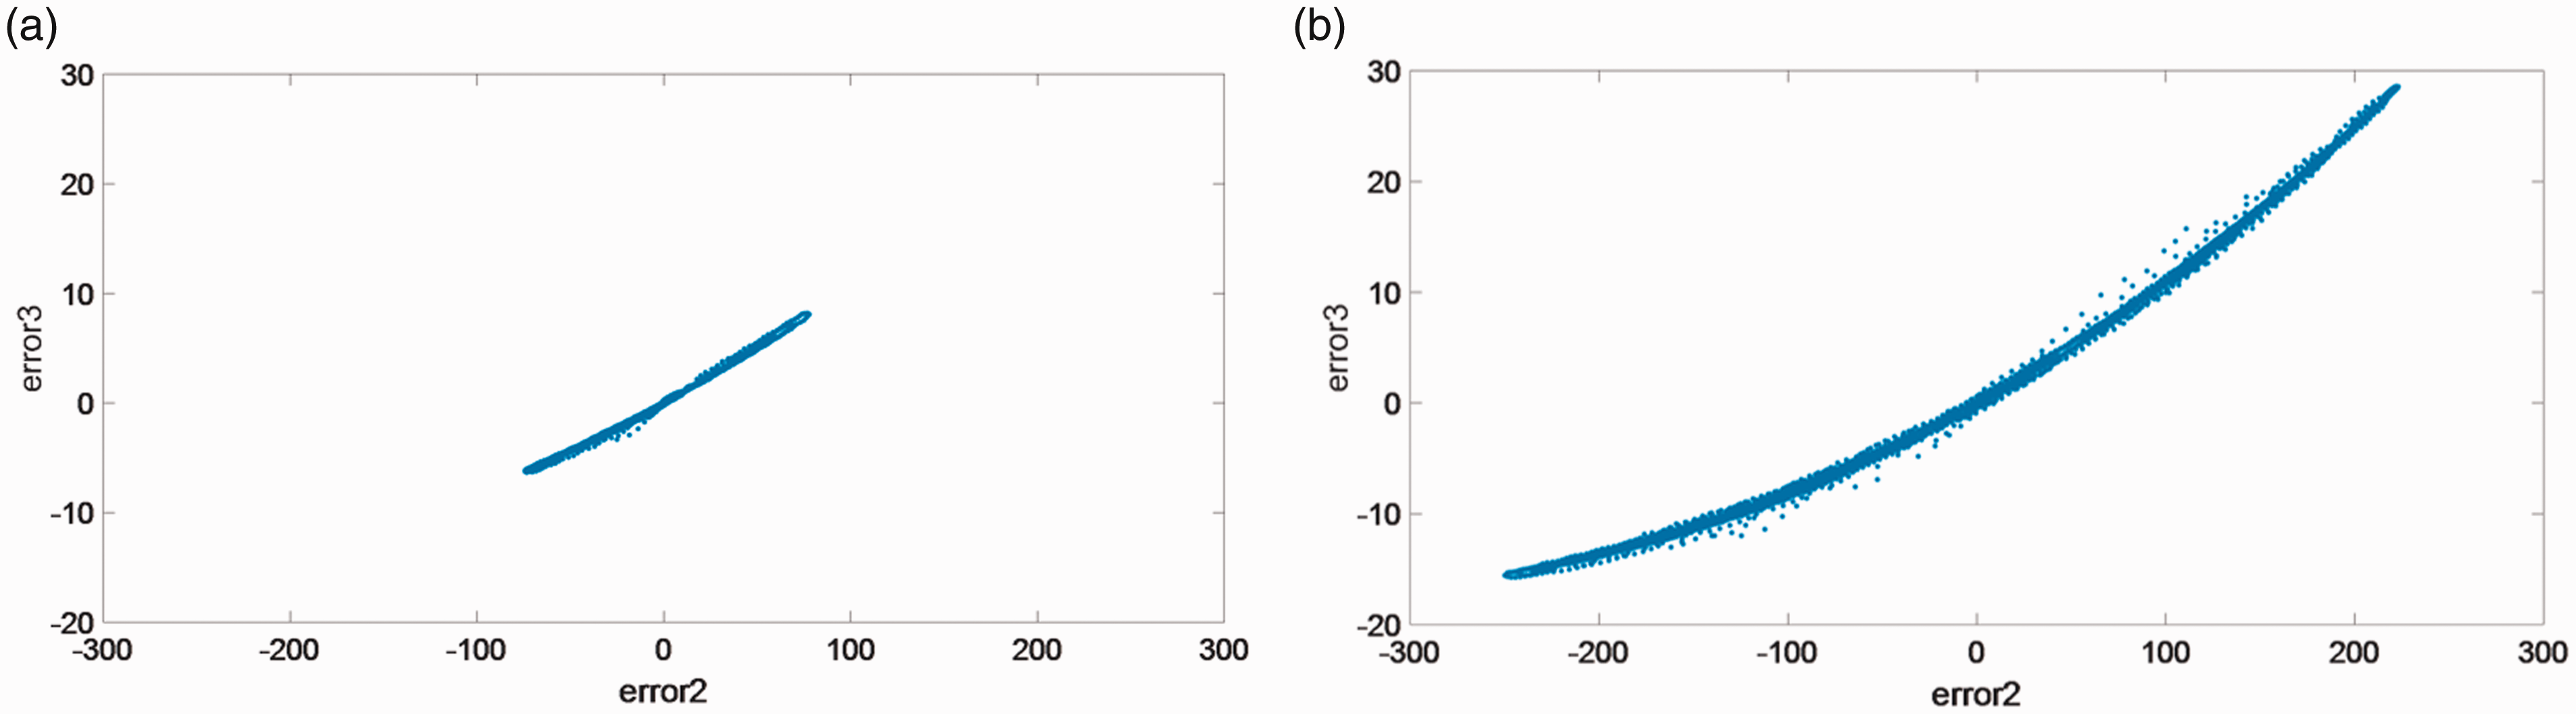
Spindle state for Lorenzchaotic systems of different fractional orders. (a) cutting state; (b) chattering state..
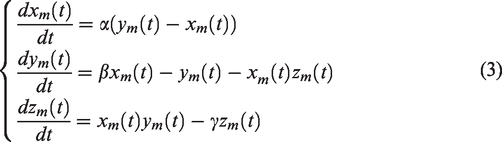
The chaotic synchronization system can be divided into a main system and a simple system, which are, respectively, shown in equations (1) and (2)


According to the method proposed by Yau et al.,
22
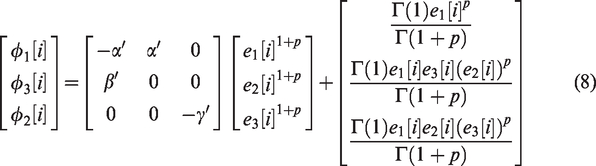
take the dynamic error that obtained via the Lorenz chaotic system as the feature to judge, the dynamic error state of the chaotic system is rewritten into the matrix format and can be presented as equation (4)
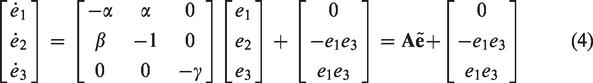
Lorenz system parameters in equation (4) which according to
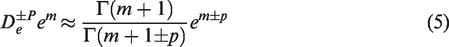
In equation (5), when
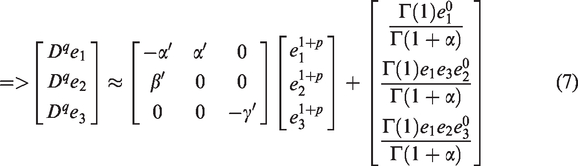
In the formula (7), q = (1 – p),
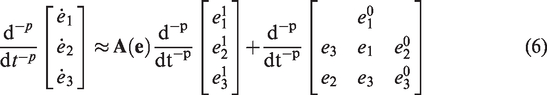
In order to realize the dynamic error with the digital system, the dynamic error can be
SSS and SSV
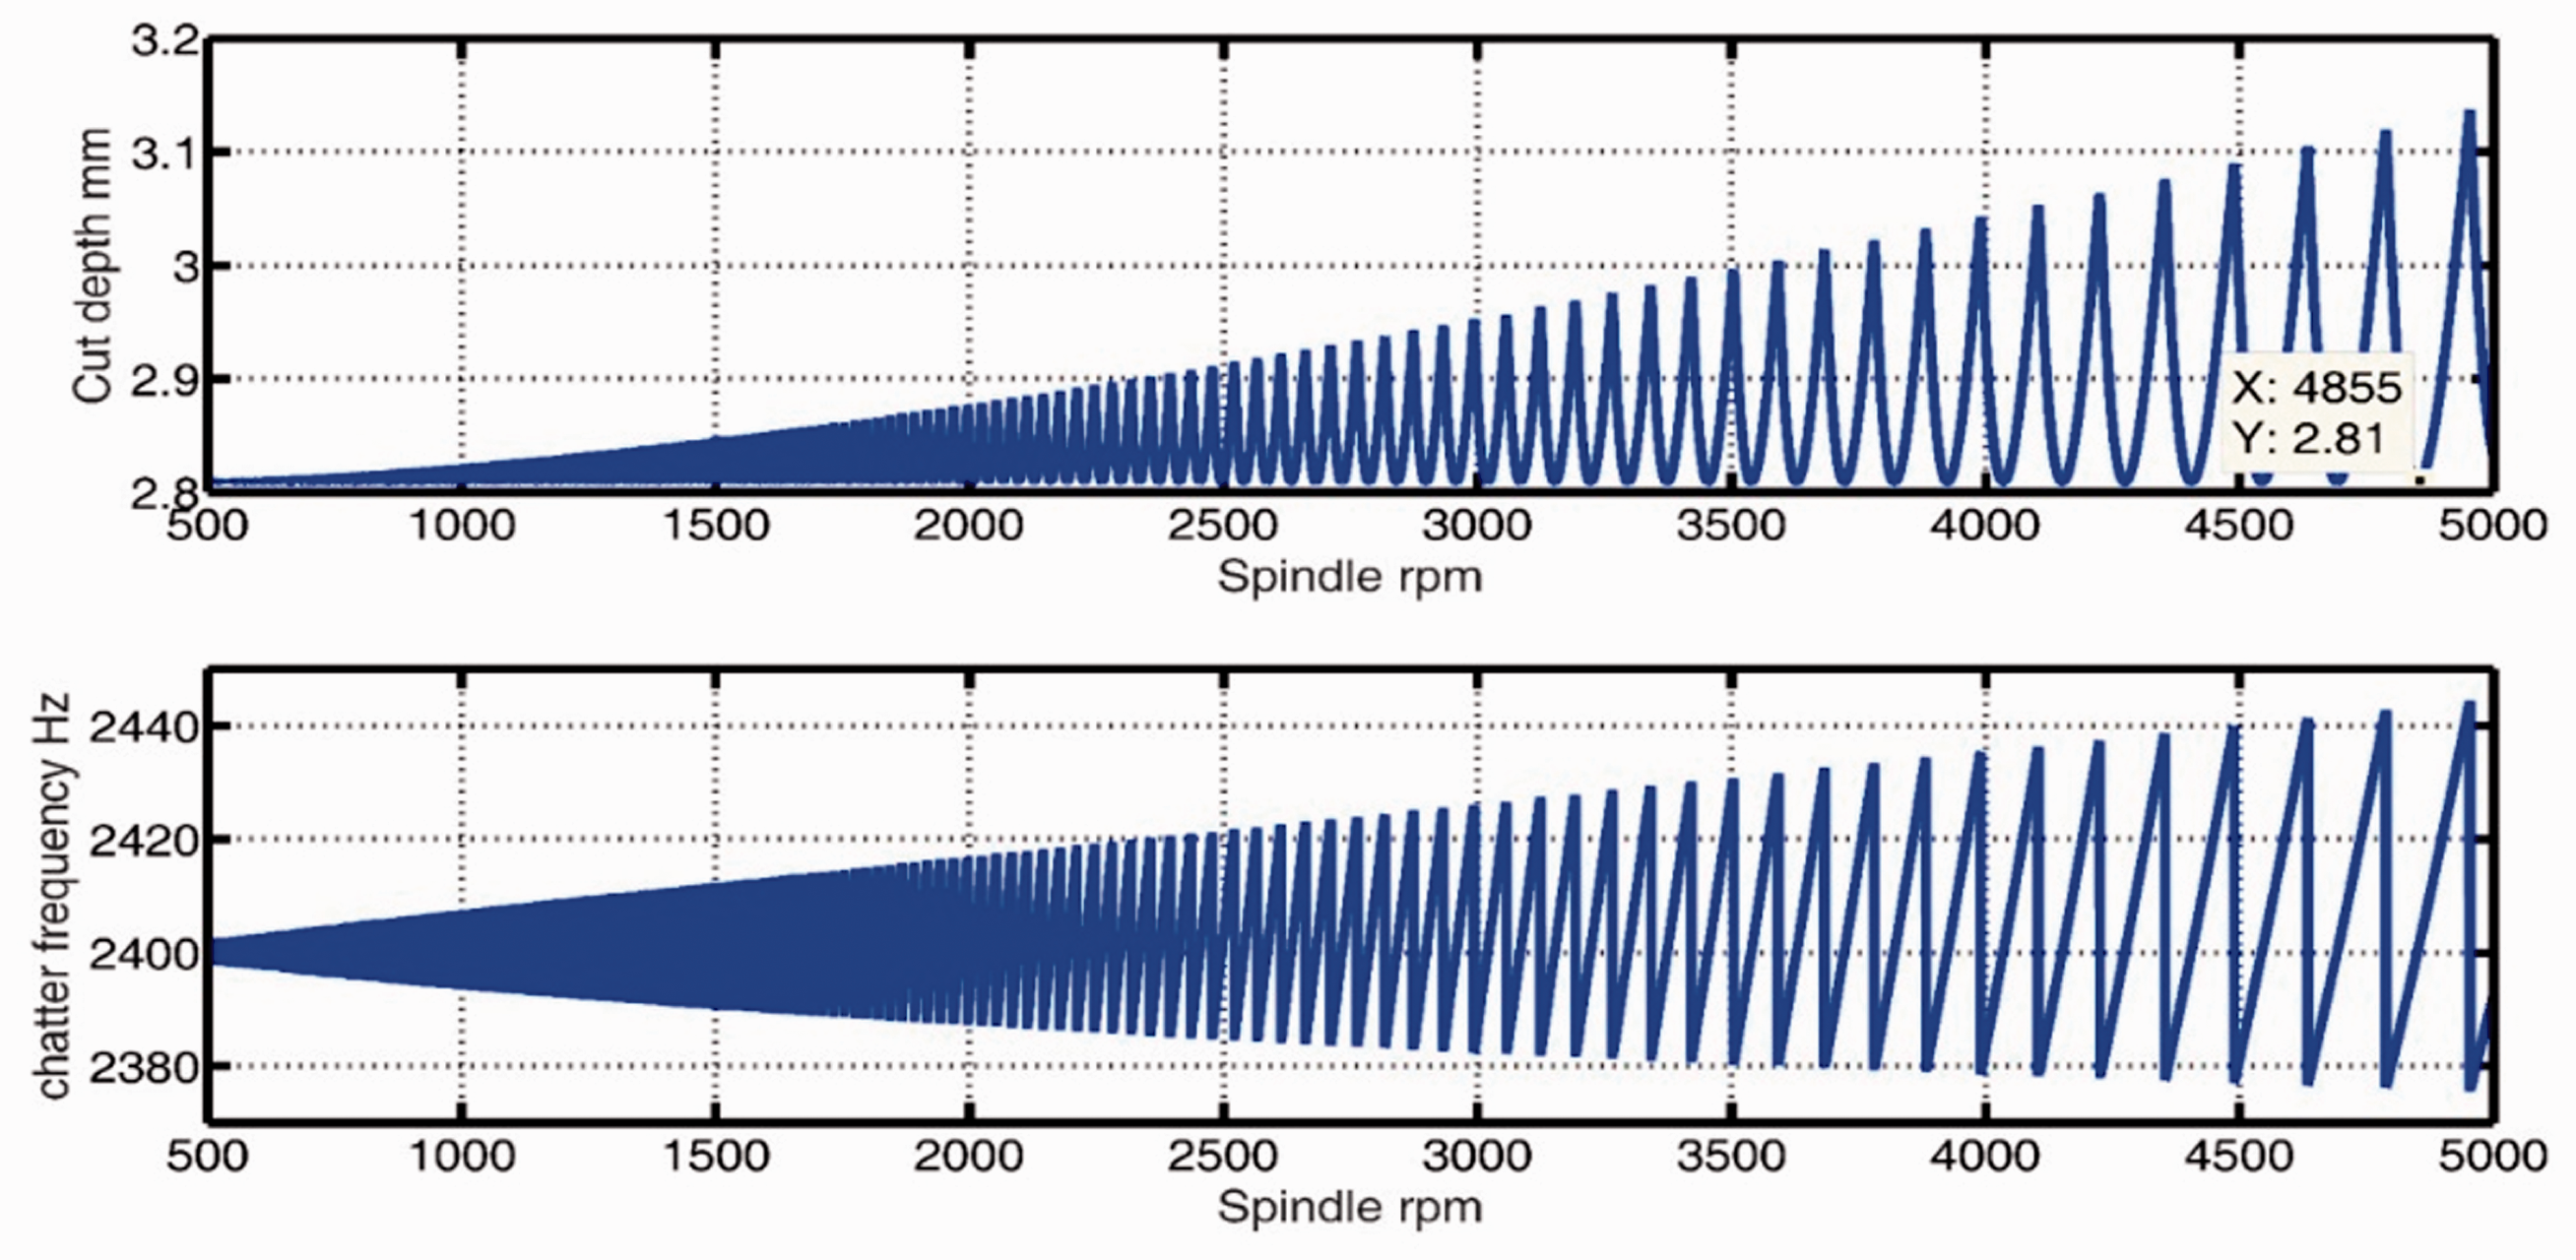
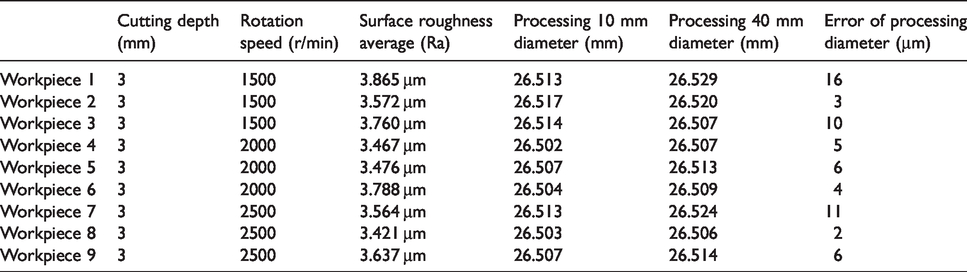
In the past, when chatter was generated in metal processing, Tlusty and Ismail 15 proposed that the blade and the gap on the surface of the workpiece generated a periodical change, thus affecting the cutting force and believed that when the chatter occurred, the blade surface will hop. At that time, the cutting force is zero and generates ripples on the machined surface. Most of the people in the industry try to solve the chatter problem with the trial-and-error method, which has no scientific foundation. Therefore, this paper uses the cutting stability (Figure 4) that was developed by Merritt 23 to judge the chatter between intervals and the basis for processing parameters adjustment. Many researchers have proposed that chatter occurred during processing and adjusted the rotation speed of the spindle to suppress the chatter.16–19 This paper adopts the SSS and SSV to compare the methods of changing the spindle rotation speed. The SSV is processed at a rated speed. When chatter occurs, the rated period is given to adjust the amplitude of the speed and adopts symmetrical waveforms such as sine wave, triangle wave, and square wave to suppress the chatter. The SSS is processed at a rated speed, when there is chatter, and the rated speed is reduced to suppress the chatter. The machining program is processed with S = 2500 r/min, F = 0.25 mm/red, and a cutting depth of 3 mm. When there is chatter, suppress immediately and compare the data as shown in Table 1.
Stability lobes diagram.
Comparison of workpiece parameters.
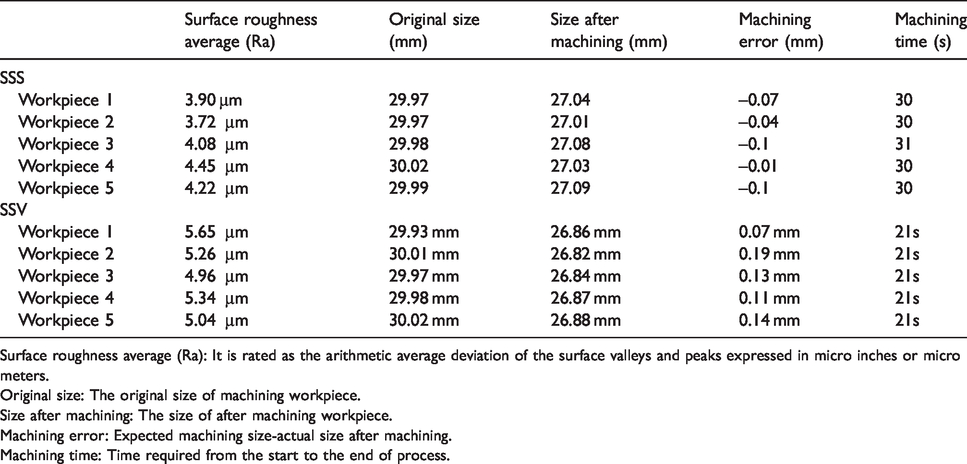
Surface roughness average (Ra): It is rated as the arithmetic average deviation of the surface valleys and peaks expressed in micro inches or micro meters.
Original size: The original size of machining workpiece.
Size after machining: The size of after machining workpiece.
Machining error: Expected machining size-actual size after machining.
Machining time: Time required from the start to the end of process.
The experimental data shows that the utilization rate of SSV is obviously better than SSS, but due to the limitation of hardware equipment, when SSV is suppressing the chatter, the amplitude of rotation speed cannot follow the modulation range in time, and the chatter suppression cannot be effectively performed. On the other hand, chatter is obviously suppressed when SSS is processing chatter suppression; as for machining deviation, SSS is better than SSV. Hence this study adopts SSS as the chatter suppression method.
Multiple regression analysis
The regression model is applied to a model of the relationship between the variance number 
In equation (9), X is from a single variance 
In equation (10), 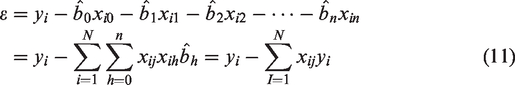

Therefore, using the least squares method to solves the regression coefficients and minimizing the sum of the squared deviations, the expression 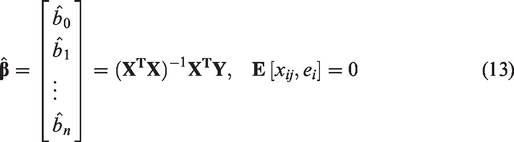
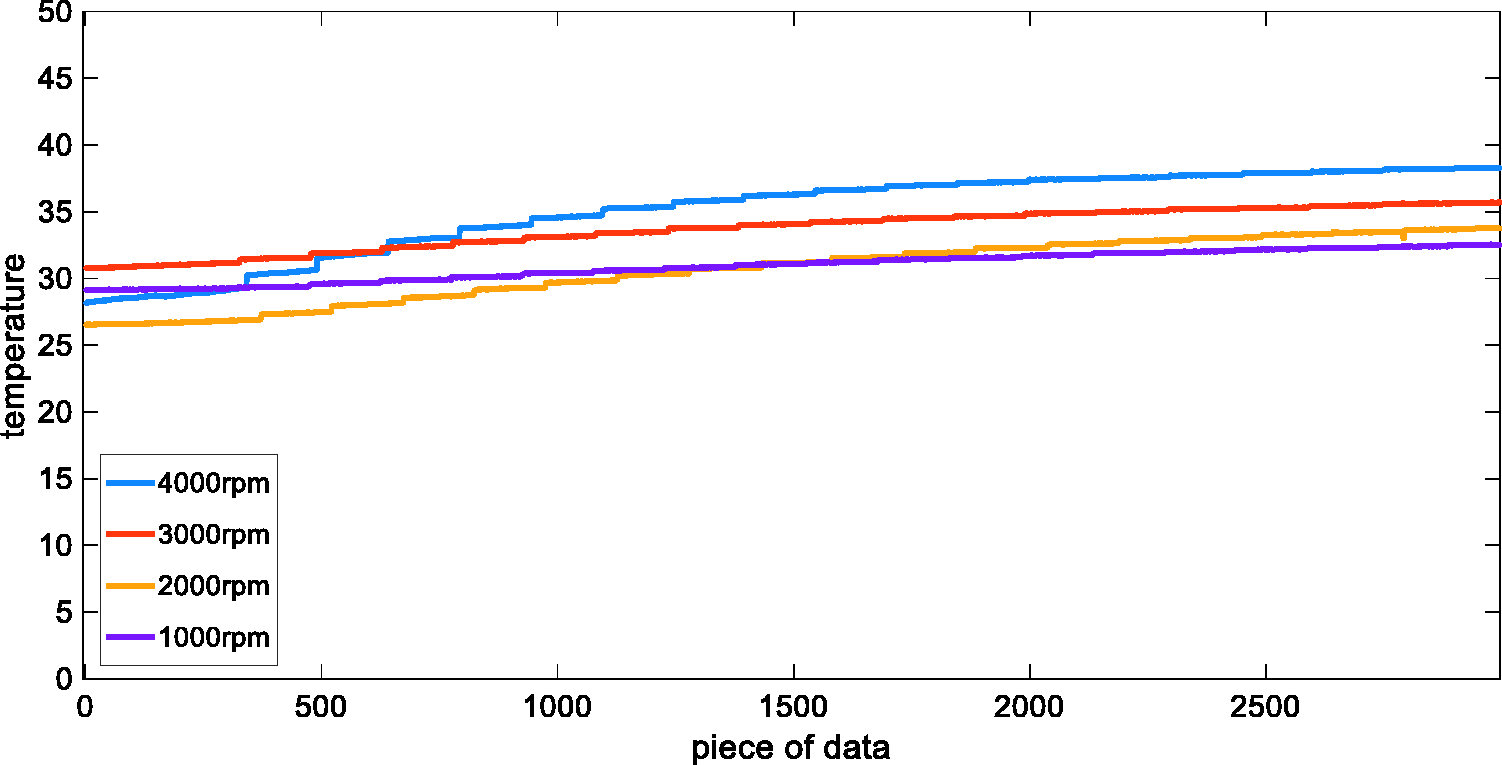
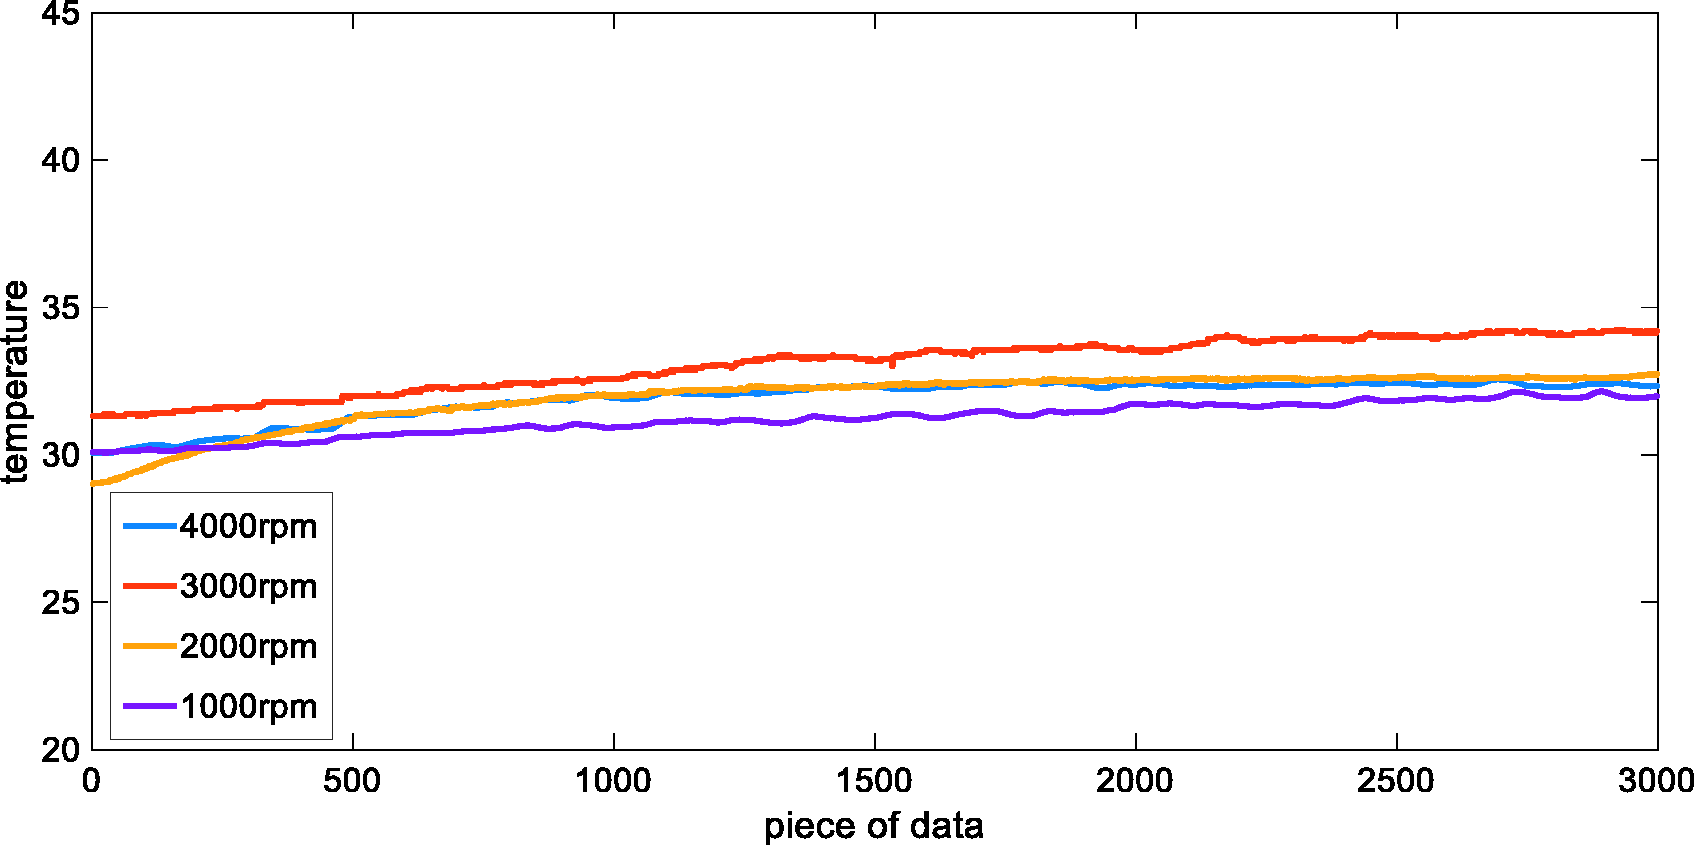
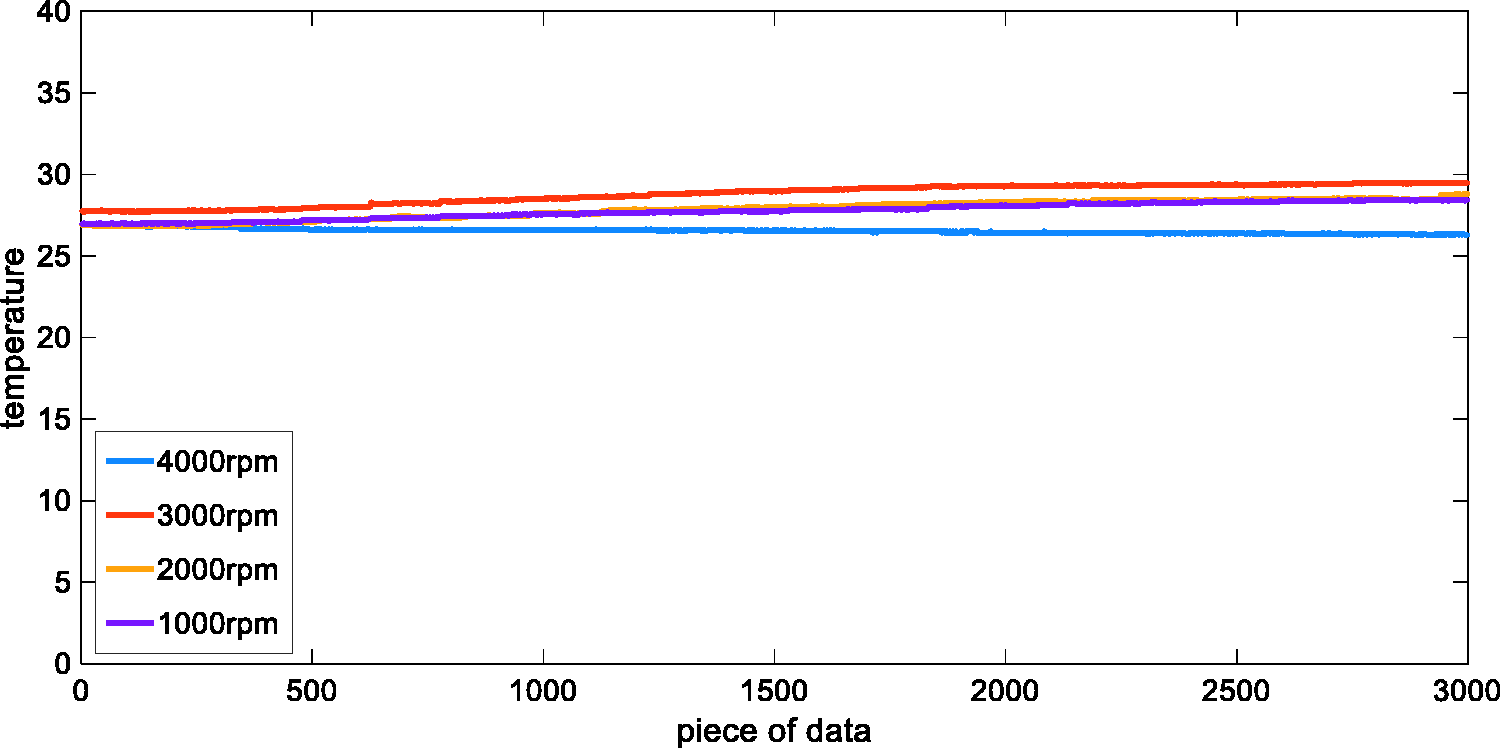
This experiment uses the sensor to monitor the volume of temperature change of the front and rear ends of the spindle, the lateral side of the motor, and the room temperature. Using this information to establish multiple regressions, there are four input variation vectors: one output response variation vector and uses the data to establish the model of compensation volume for thermal expansion error, data collection of thermal expansion (4000, 3000, 2000, and 1000 r/min) and other rotation speed. Three thousand pieces of data were collected throughout 5 h of data collection process that captured data every 6 s. The results are shown in Figures 6 to 10. The multiple regression equation that is established by adopting the above conditions is shown in equation (14), while 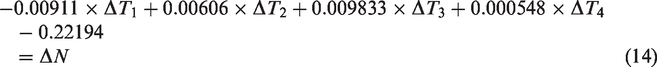
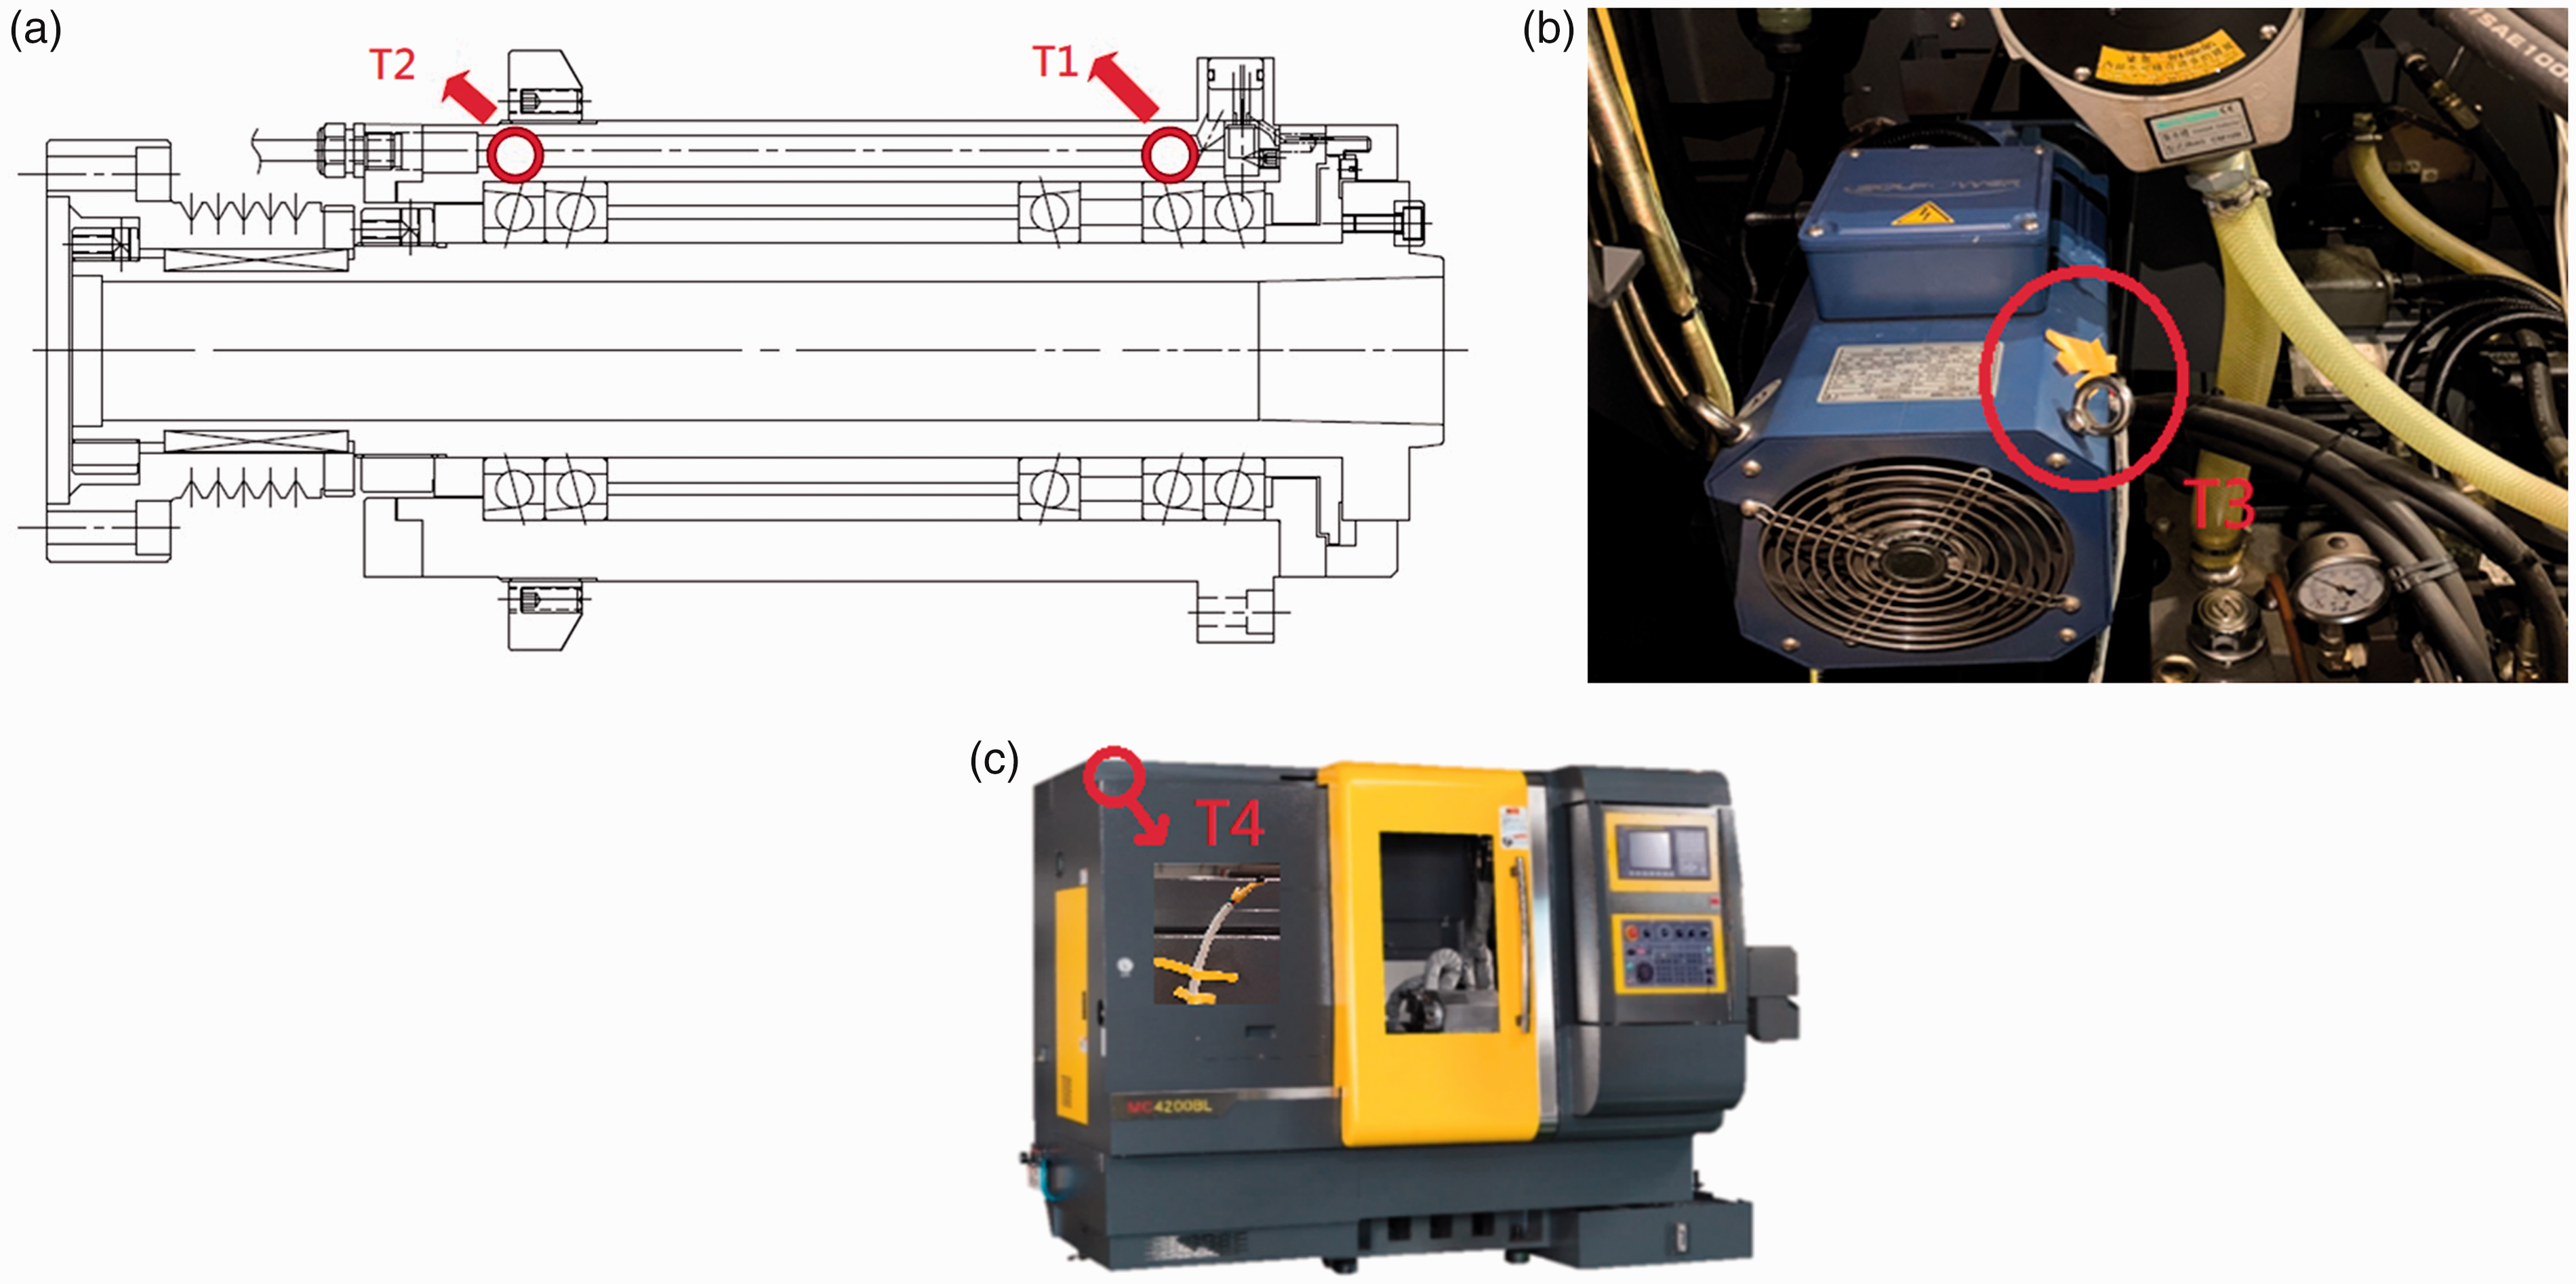
Temperature sensor position. T1: front bearing temperature sensor; T2: rear bearing temperature sensor: (a) bearing sensor: T3: motor temperature sensor; (b) motor sensor; T4: room temperature sensor; (c) room temperature.
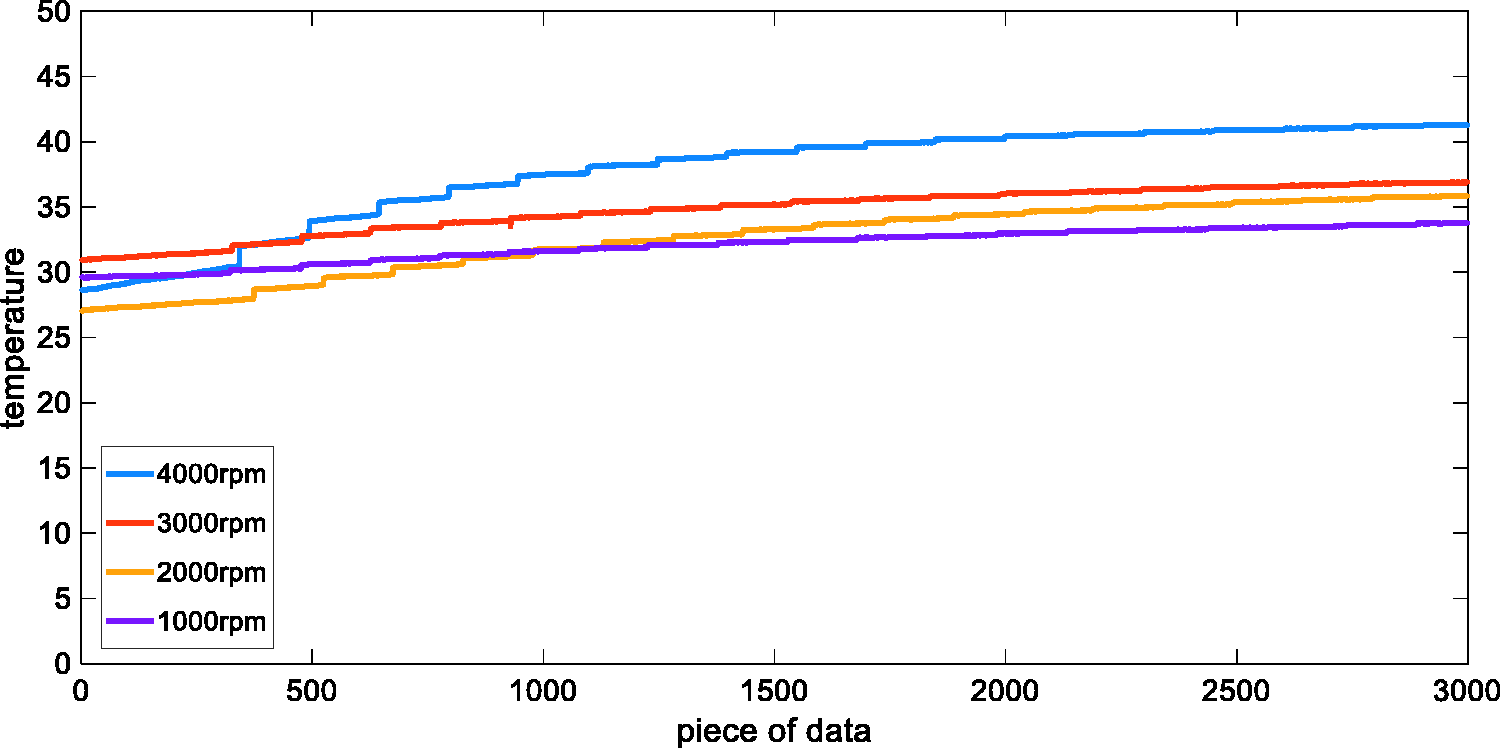
Line graph of the temperature of the rear bearing at each rotation speed.
Line graph of the temperature of the front bearing at each rotation speed.
Line graph of the temperature of the motor at each rotation speed.
Line graph of the room temperature at each rotation speed.
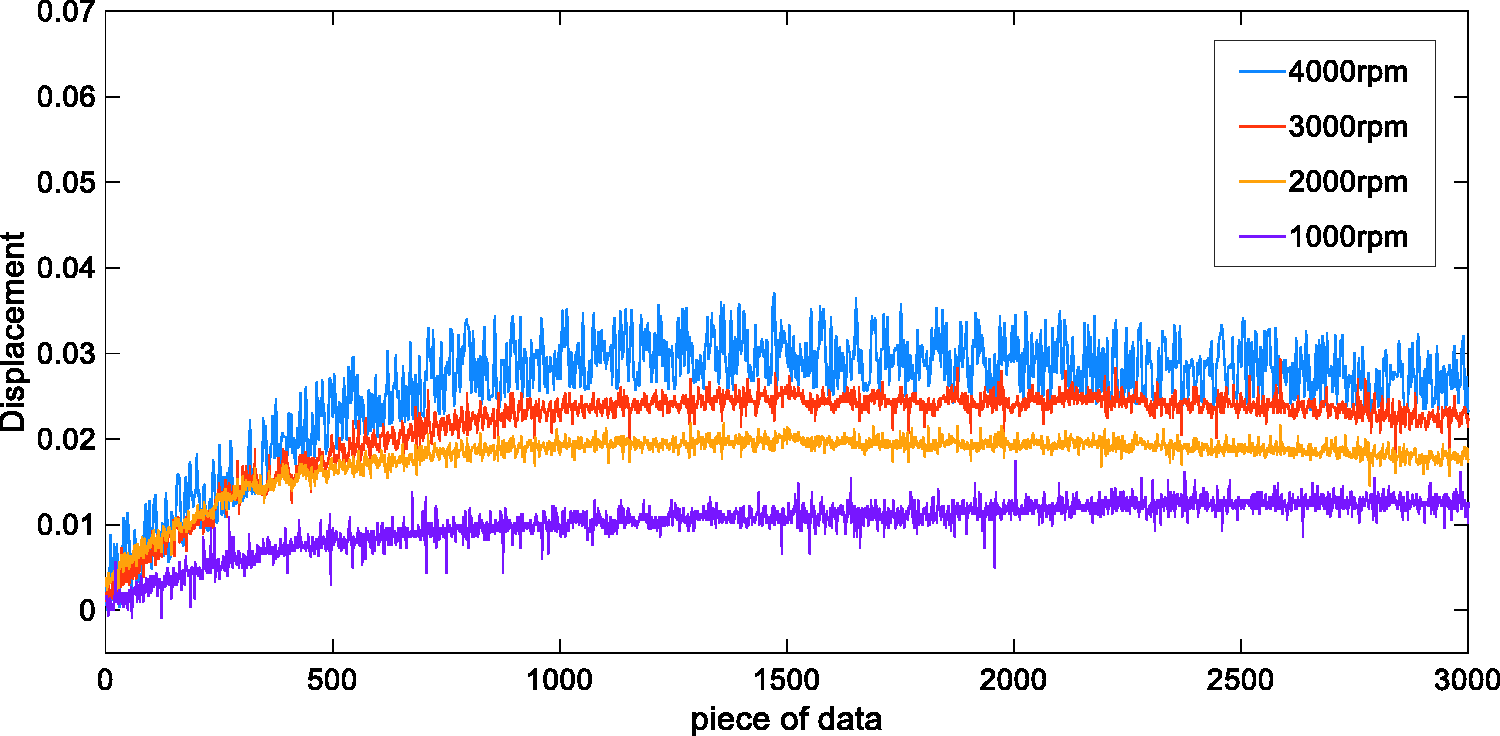
Line graph of the volume of speed displacement at each rotation speed.
Experiment results
Differences between with and without suppression of the cutting chatter
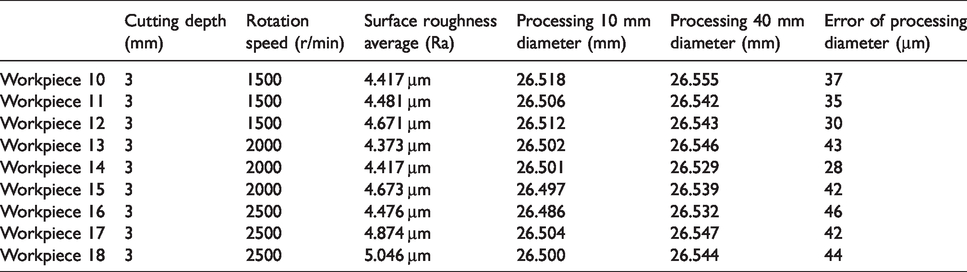
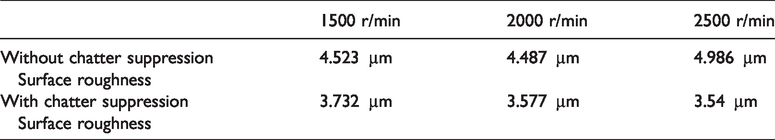
The processing material is made of medium carbon steel, and the size is 180 (length) and 30 mm (diameter). The cutter positioning depth is 0.3 mm, cutting depth of fixed parameter is 3 mm, feed rate is 0.3 mm/red, length of processing overhang is 80 mm, length of processing is 50 mm, rotation speeds are 1500, 2000, and 2500 r/min to implement transformation of parameters. Implement suppression when the rotation speed that generated chatter is adjusted to 750 r/min. The surface roughness of the processing material and error of processing diameter are quality checked by the surface roughness meter and the three-dimensional measurement setting machine. From the data of the processing diameter error of Tables 2 and 3, it is found that the processing quality is enhanced if suppression is implemented when chatter occurred. During suppression, the diameter falls within the range of 3.2698–16.1363 µm, and the diameter error falls within the range from 28.1628 to 46.4199 µm without suppression. We can tell from Table 3 that when chatter occurred, the faster the rotation speed, the greater the error of the processing diameter tends to be. Table 4 shows that the average surface roughness is 4.487–4.986 µm when chatter occurred at 1500, 2000, and 2500 r/min. After suppression, the average roughness is 3.54–3.577 µm, which shows a significant improvement in quality. The data of Tables 2 and 3 indicate that to implement chatter suppression when chatters occurred at 1500, 2000, and 2500 r/min, which improve the overall processing quality.
Chatter suppression.
Without chatter suppression.
Average value of surface roughness.
Differences between with and without compensation of thermal expansion error
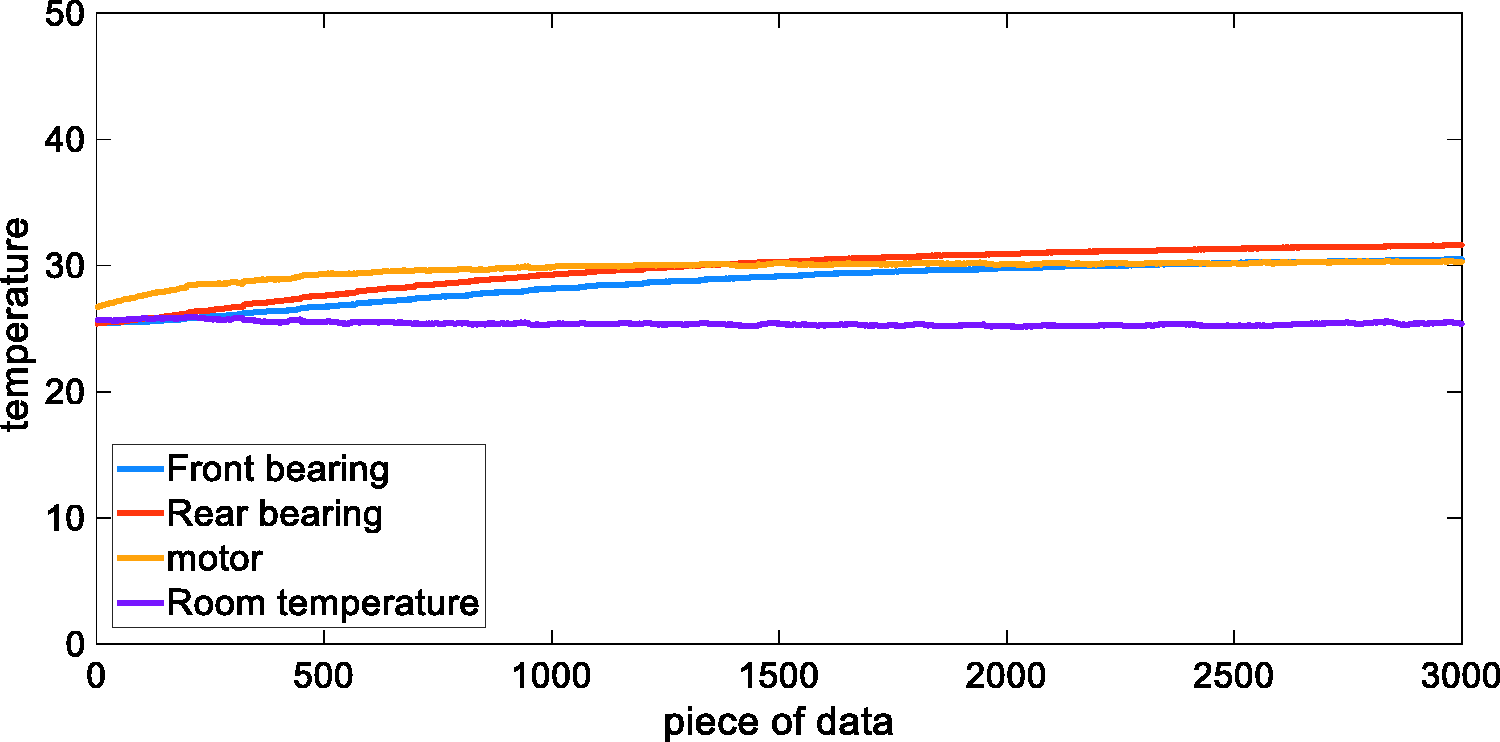
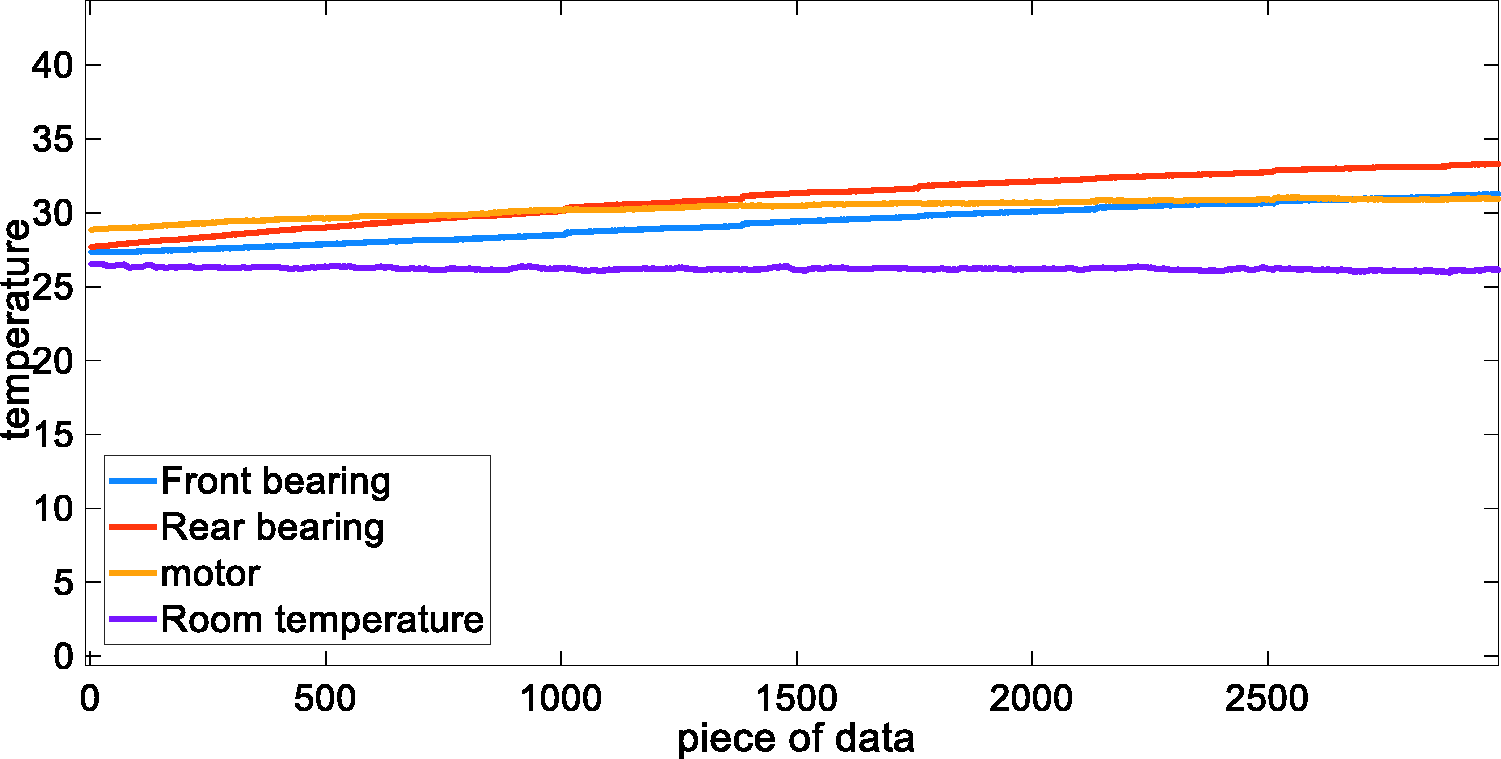
In order to prove the accuracy of the modeling model, this study compares the actual results with the results as predicted by the model, and the results are shown in Figures 11 and 12. The results show that the temperature will rise rapidly when the motor is rotating at low speed, which will have a significant impact on the prediction of regression value. Especially, when the x-axis is at 0–500, the variation of 1000 r/min rotation speed is particularly obvious, as shown in Figure 13. It is obvious that it makes the regression prediction value to increase rapidly when the piece of data is between 0 and 300. As temperature changes when the piece of data falls between 1500 and 3000, the curves of the front and rear bearings are almost overlapping, as shown in Figure 11. This result indicates that within this range of variation, when the front and rear bearings tend to be the same, the prediction of regression and the actual measured value will have a great difference. The results in Figure 13 show that when the piece of data is between 0 and 1000 at 2500 r/min rotation speed, the temperature rise of the motor is not obvious; thus, there is a greater difference between the results of the regression prediction of temperature change and the actual value. When the piece of data is between 1000 and 3000, the amount of change at 2500 r/min is particularly noticeable, as shown in Figure 12. It is found that there is a significant temperature difference between the curves of the front and rear bearings; thus, the regression prediction is close to the actual value. When the piece of data of the AC induction motor is between 0 and 500, its speed increases rapidly at 1000 r/min rotation speed; the possible reason is that this rotation speed is closest to 1500 r/min, and the torque of the spindle reaches maximum at 1500 r/min, which is 35.8 Nm. Therefore, it is speculated that when comparing with 1000 r/min rotation, the induction motor demands a much higher electricity current when it is at 2500 r/min, and it makes the temperature of the motor rise rapidly. It is shown in Figures 13 and 14 that the regression prediction value can effectively compensate the thermal expansion error phenomenon of the spindle and reduce the machining error value to 0.1–5 µm. Hence, when the machine tool is actually processing, it can be closer to the actual demand size.
Line graph of front and rear bearings, motor, and room temperature at 1000 r/min.
Line graph of front and rear bearings, motor, and room temperature at 2500 r/min.
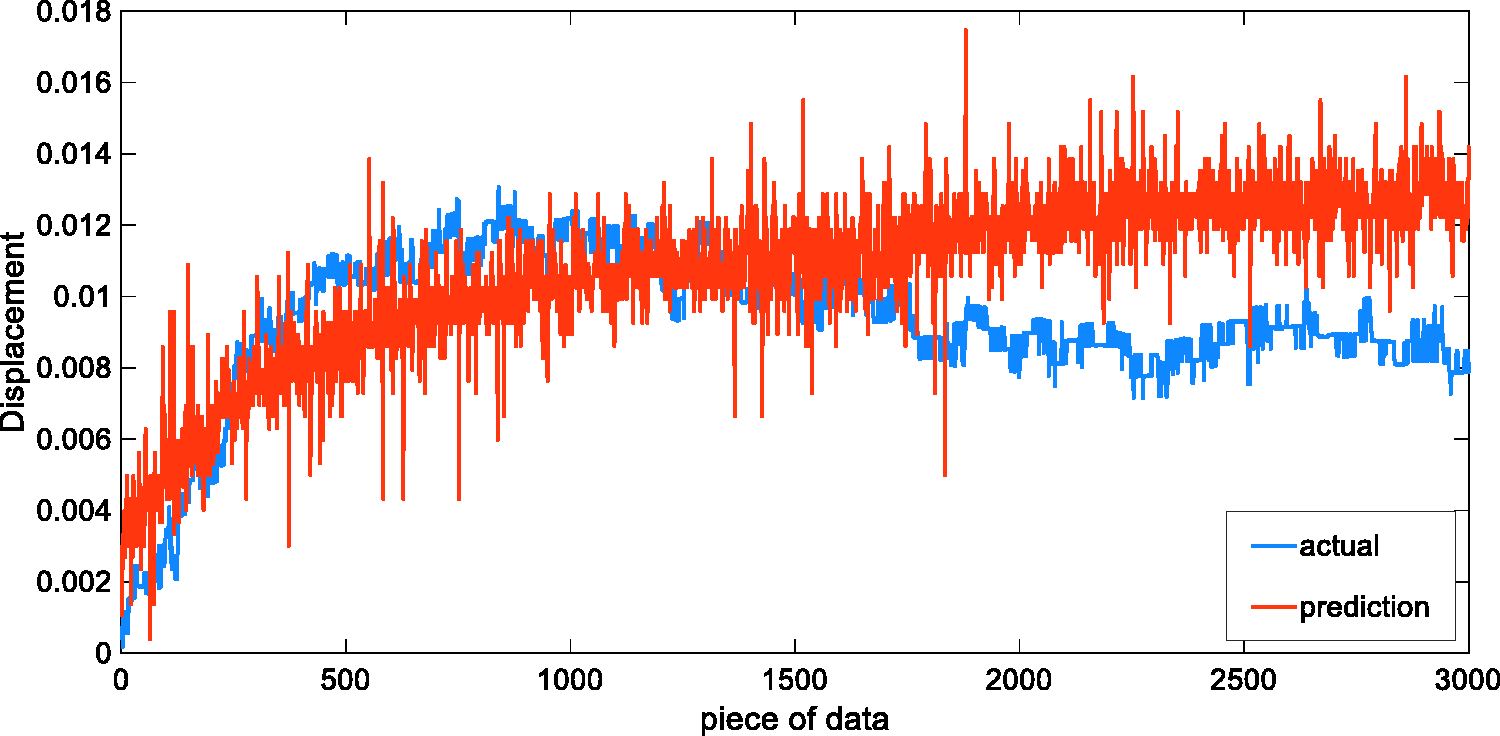
Line graph of predicted displacement and actual displacement at 1000 r/min.
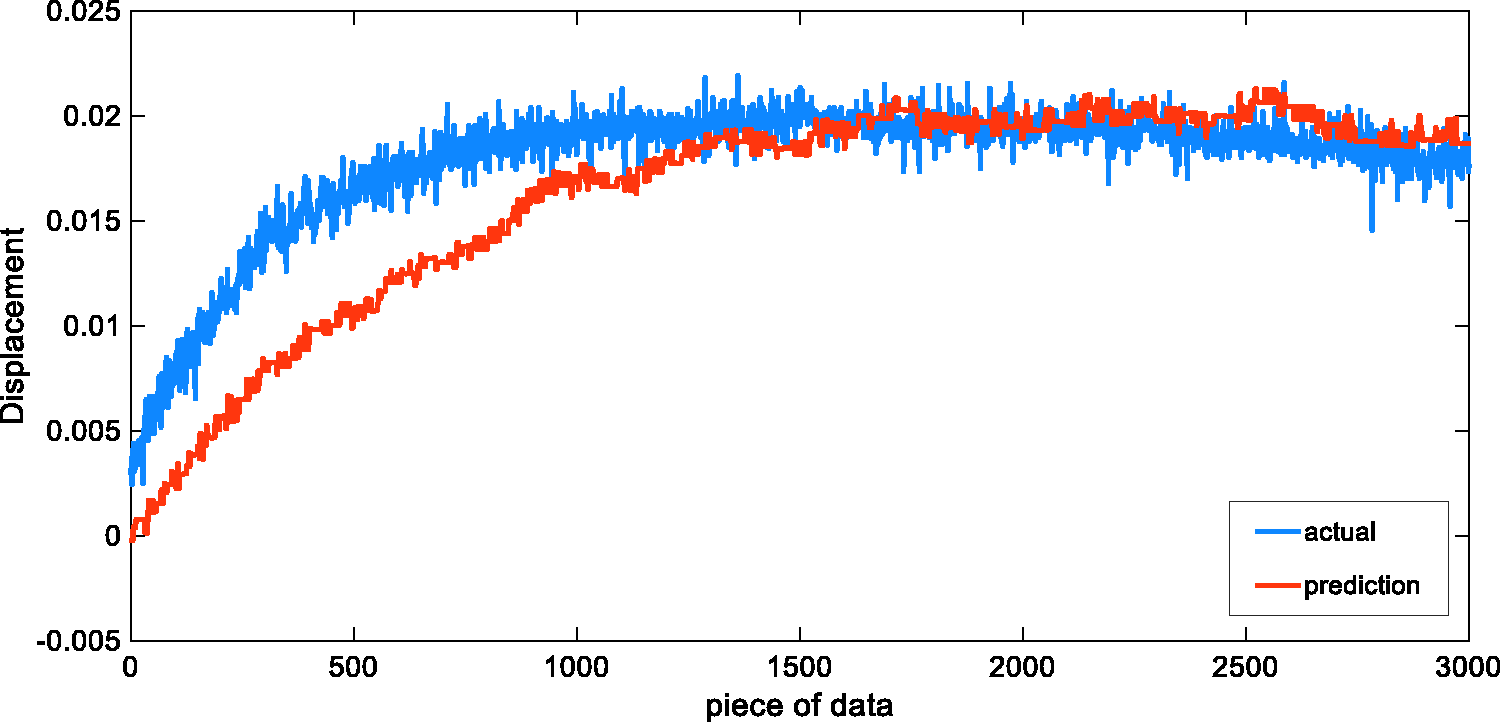
Line graph of predicted displacement and actual displacement at 2500 r/min.
Integration platform – human–machine interface
The system adopts the C# programming language for interface design to complete information integration and establish the real-time data monitoring (Figure 15). The interface results are shown in Figure 14(a) to (f), including six monitoring items: (a) machine monitoring, (b) selection of processing parameter, (c) robotic arm, (d) vibration signals, (e) temperature monitoring, and (f) data preservation. The data monitoring result of the machine shows the real-time status of the machine and the contents of the execution programs. The contents include the mechanical coordinates of the axes of the machines X, Y, and B, how many workpieces are processed, and the processing time of the workpiece, as shown in Figure 15(a). In addition, the interface also integrates the recommendation table of the cutting quality parameters, recommending the cutting quality parameters for various kinds of blades and materials by the Taguchi method. First of all, when the user presses the types of knife tool holder, the turret will automatically rotate to the corresponding knife tool; then the type of material is pressed, it will present processing quality parameters recommendation. The recommendation items include the best precision, the best surface condition, and the best processing efficiency, as shown in Figure 15(b). The interface also provides data monitoring of the robotic arm. The monitoring screen shows the current axis angles of the six-axis and coordinates of the arm. The user can check through the camera lens to see whether or not the arm has gripped the workpiece for loading and unloading the materials, as shown in Figure 15(c). In addition, the interface also includes a chatter suppression system to monitor whether or not there is abnormal vibration signal when the spindle is operating and displays the vibration signal in a chaotic distribution graph. The chatter suppression can be divided into automatic suppression and manual suppression. When the automatic suppression is on, the chatter suppression system will analyze the vibration signals that occurred during processing and perform chatter suppression when approaching the chatter threshold. As for manual suppression, it implements suppression manually when vibration signals occurred during processing, as shown in Figure 15(d). The interface also displays the compensation information of the thermal expansion of the spindle, including monitoring the temperature change of the front and rear bearings, and the room temperature, and performs regression prediction. The user can judge whether or not the compensation for thermal expansion error is needed to enhance the stability of quality, as shown in Figure 15(e). Finally, the interface integrates the abnormal records of the machine and the machined workpiece, enables the user to check those products that have abnormal vibration signals during the production process in the past, and implements sampling inspection. The design of this system enables the user to perform processing operations and enhance the processing quality in a simple and clear way, as shown in Figure 15(f).
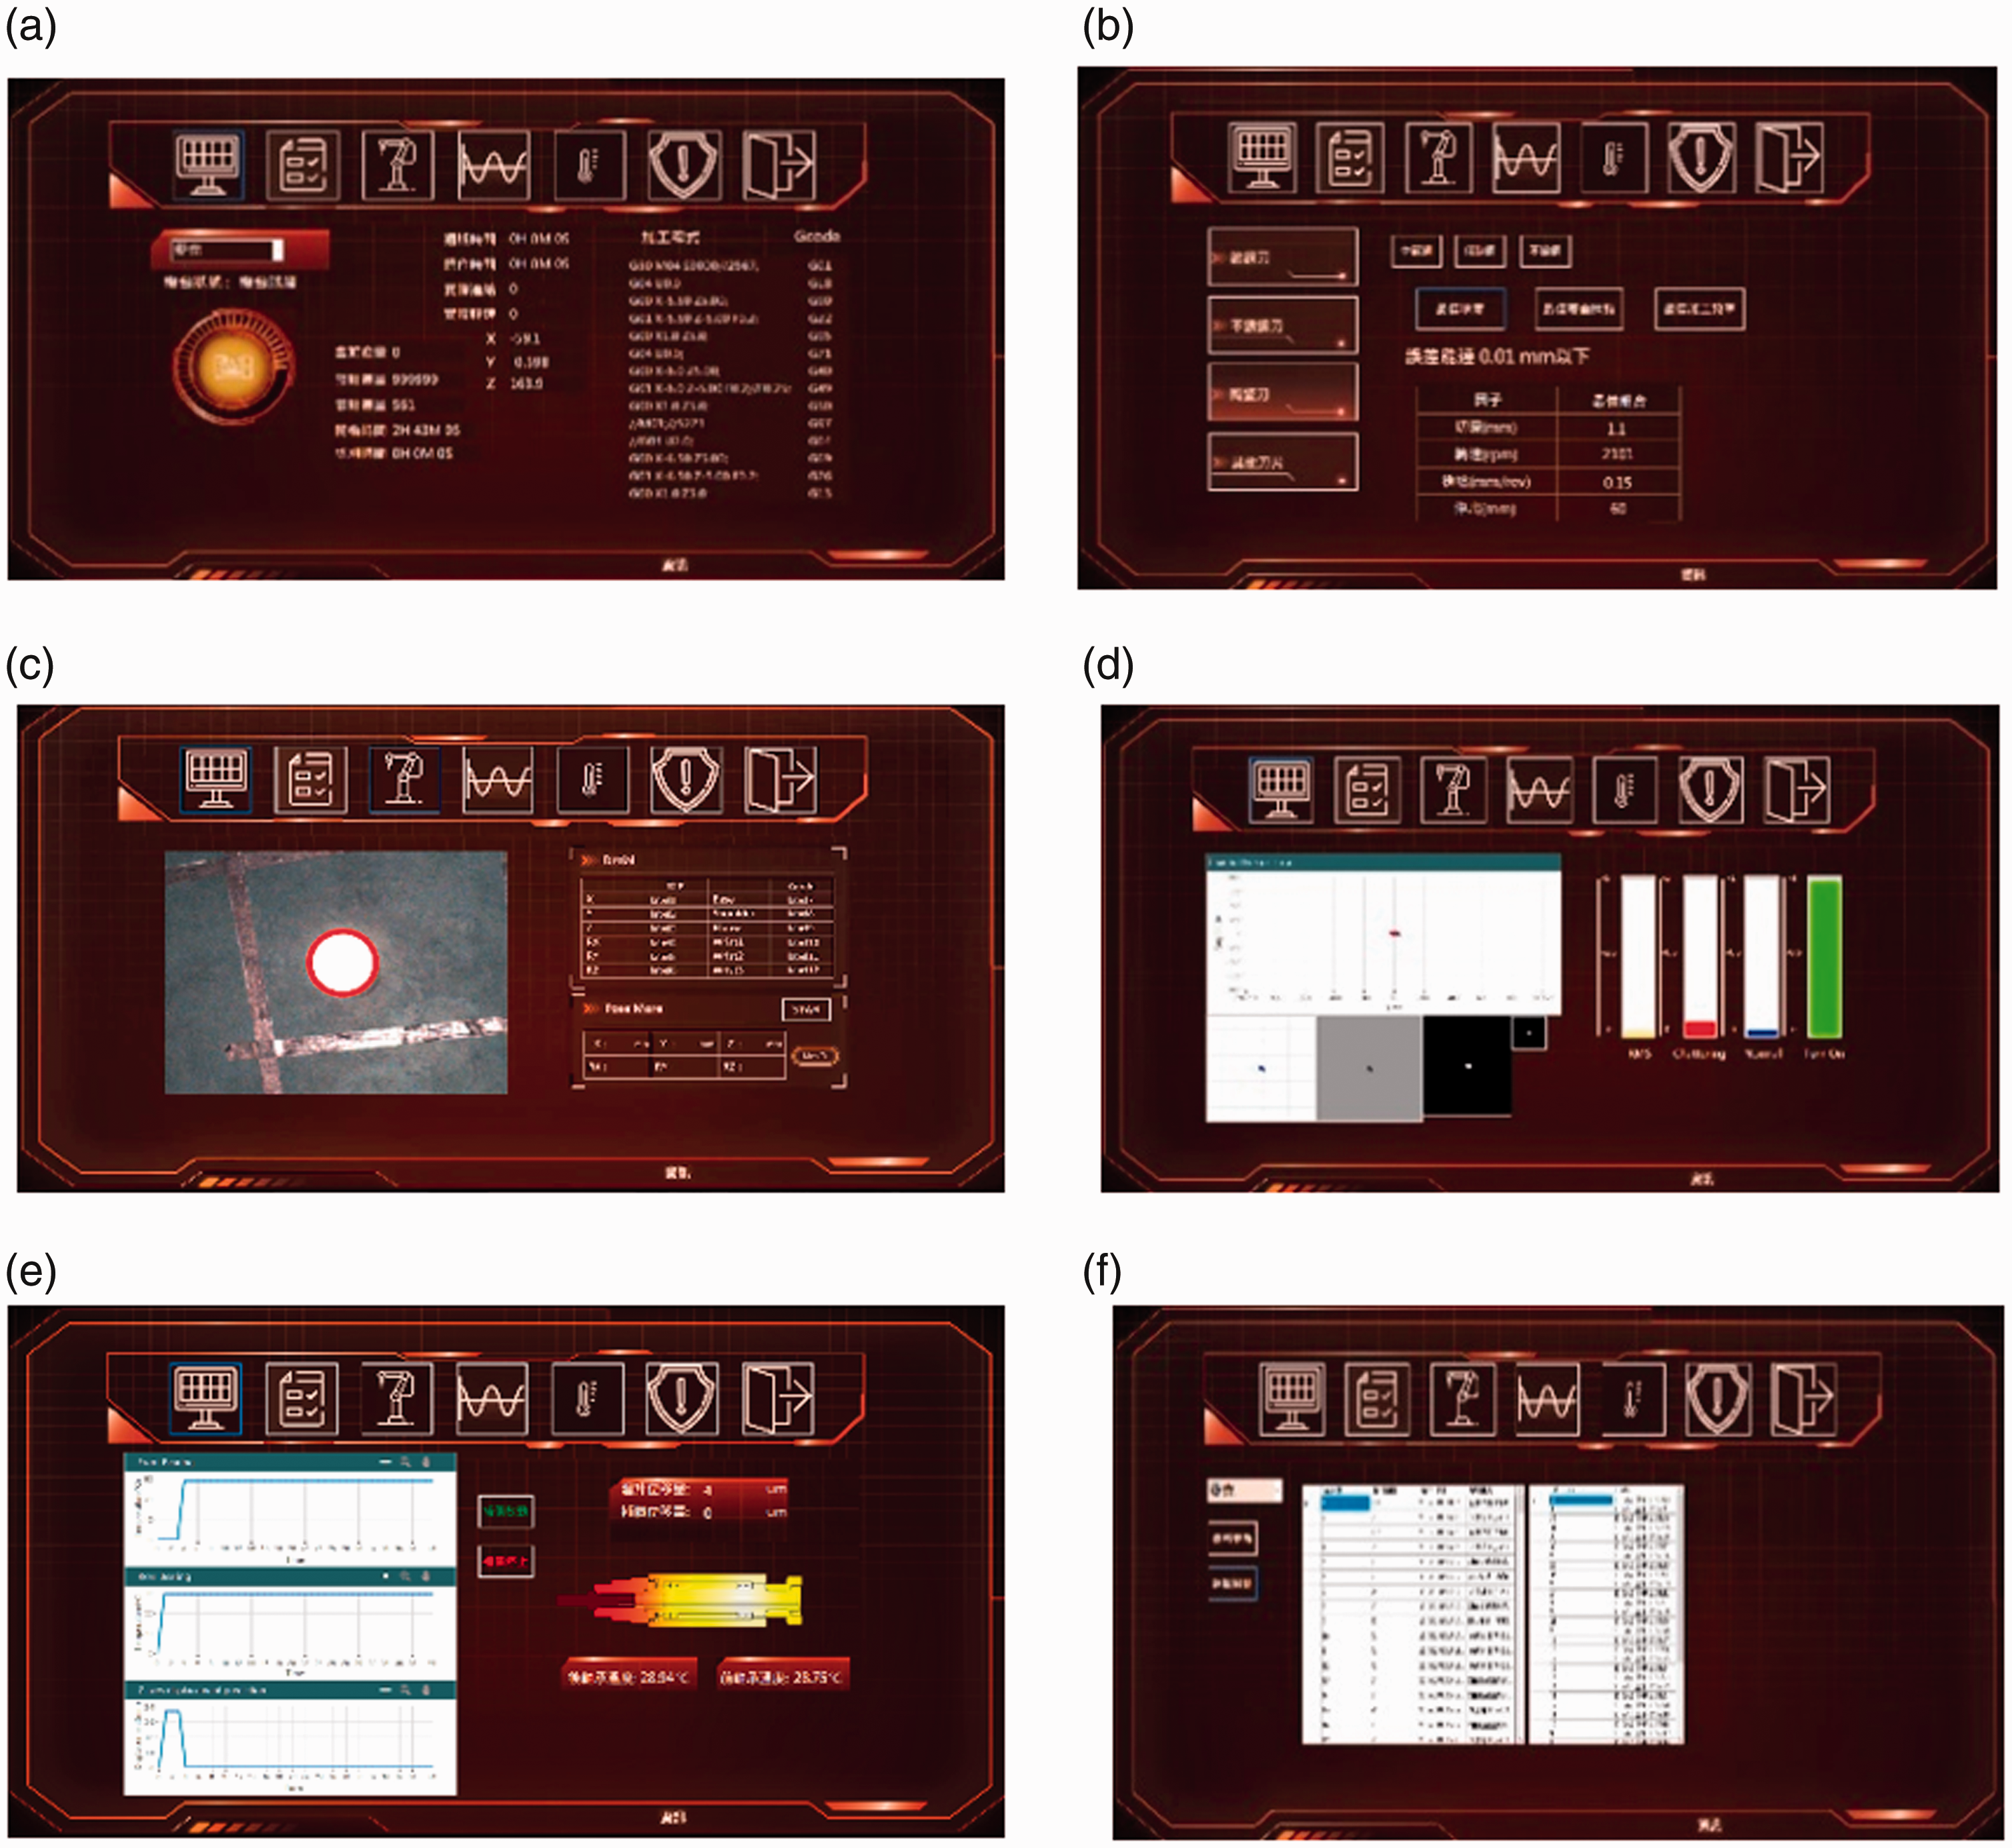
Real-time data monitoring. (a) machine monitoring; (b) selection of processing parameter; (c) robotic arm; (d) vibration signals; (e) temperature monitoring; (f) data preservation.
Conclusion
The experimental results show that chatter suppression and temperature compensation can effectively enhance the processing quality. This study uses actual machines to implement processing activity for verification, makes mathematical model parameters closer to the needs of the industry processing format, and meets the expectations of the industry. The chatter suppression system can effectively resolve the surface roughness problem generated by the chatter. With no suppression, the cutting depth of the workpiece will be uneven due to chatter phenomenon and result in a large error value of the overall size of the workpiece. The chatter suppression system enables the cutting depth of the workpiece to be even, hence the error value of the overall size of the workpiece is smaller, which meets the needs of the industry. The regression prediction is implemented when the spindle is running. The verification data show that the regression prediction compensation can reduce the machining error value from 0.1 to 5 µm if we implement the compensation for thermal expansion error of the spindle when the regression prediction value is greater than the rated error value. This study has implemented the integration of the chatter suppression system, regression prediction compensation, and human–machine interface, hence the user can easily enhance the quality of the products during the processing operations and improve the overall added value of the machine through the integrated system interfaces that are proposed in this study.
Supplemental Material
LFN889502 Supplemental Material - Supplemental material for Intelligent integrated monitoring system for lathe equipment
Supplemental material, LFN889502 Supplemental Material for Intelligent integrated monitoring system for lathe equipment by Bo-Lin Jian, Chin-Tsung Hsieh and Yu-Syong Guo in Journal of Low Frequency Noise, Vibration and Active Control
Footnotes
Declaration of conflicting interests
The author(s) declared no potential conflicts of interest with respect to the research, authorship, and/or publication of this article.
Funding
The author(s) disclosed receipt of the following financial support for the research, authorship, and/or publication of this article: This research is supported by the Ministry of Science and Technology’s ‘Development of Intelligent Functional Technologies of the Spindle Surroundings of Domestic Lathe Machine Tool (Project Number: MOST107-2218-E-167–001-)’.
References
Supplementary Material
Please find the following supplemental material available below.
For Open Access articles published under a Creative Commons License, all supplemental material carries the same license as the article it is associated with.
For non-Open Access articles published, all supplemental material carries a non-exclusive license, and permission requests for re-use of supplemental material or any part of supplemental material shall be sent directly to the copyright owner as specified in the copyright notice associated with the article.